Embed Size (px)
Citation preview

COEN 281 : Pattern Recognition & Data Mining
Predicting Currency
Exchange Rate
Vishaka Balasubramanian Sekar, Mose Yoloye, Nithin Vasudevan, Sri Mourya Dommeti

Preface The report has been made in fulfillment of the requirement for the subject: Pattern Recognitionand Data Mining in June 2017 under the supervision of Prof Dr. Ming-Hwa Wang. For making this project we have studied various concepts related to the foreign exchange marketand the factors that affect them . We also studied about various data mining algorithms and tools that can be used to solve the problem easily. The project aims at applying data mining & machine learning models ; EMD-RNN and ARIMA and prediction technique to analyze how these algorithms perform at predicting the foreign exchange rate.
1

Acknowledgement Apart from the efforts of ourselves, the success of any project depends largely on the encouragement and guidance of others. We take this as an opportunity to express our gratitude to the people who have been instrumental in the successful completion of this project, especially Dr. Ming-Hwa Wang, for his guidance throughout the term.
2

Table of Contents
1 Introduction 7
1.1 Objective 7
1.2 Technical Objective 7
1.3 Experimental Objective 7
1.4 Problem 7
1.5 How this project relates to this class 8
1.6 Why other approaches are not good 8
1.7 Why Our Approach is Better 8
1.8 Statement of the Problem 8
1.9 Scope of Investigation 9
2 Theoretical Bases and Literature Review 9
2.1 Problem Definition 9
2.2 Theoretical Background 9
2.3 Related research 9
2.4 Advantages and disadvantages of the research 9
2.5 Our solution 9
2.6 How our solution is different 10
2.7 Why our solution is better 10
3 Hypothesis 10
3.1 Multiple Hypothesis 10
3.2 Positive and negative hypothesis 10
4 Methodology 10
3

4.1 Collecting input data 10
4.2 How to solve the problem 10
4.2.1 Algorithm design 10
4.2.2 Language used 11
4.2.3 Tools used 11
4.3 Generating output 11
4.4 Testing against the hypothesis 11
5 Implementation 11
5.1 Code 11
5.2 Design Document and Flowchart 14
6 Data Analysis and Discussion 18
6.1 Output generation 18
6.2 Output Analysis 19
6.3 Comparison with hypothesis 20
6.4 Abnormal case explanation 20
6.5 Statistic Regression 20
6.6 Discussion 20
7 Conclusions & Recommendation 21
7.1 Summary and Conclusion 21
7.2 Future Work 21
8 Bibliography 21
9 Appendices 22
9.1 Graph for 1 Day Window 22
9.2 Graph for 100 Days Window 22
9.3 IMF and Residue Graph 24
4

Table of Table
1 Performance Comparison for the trained models 20
5

Abstract The forex market is the backbone of international trade and global investing, predicting the forex rate gives the investor an extra edge in making their investment in a better way. Forecasting the forex rate in an accurate way is really important so that we do not provide a false information to the investors. To provide an accurate prediction we are using two models: EMD-RNN and ARIMA, and compare their output with the same data set to prove which is better. We have planned to implement the methodologies in R language. The above mentioned methods are applied on historical dataset gathered from foreign exchange sites in the form of Excel Sheets.
6

1. Introduction
1.1. Objective The core objective of this project is to develop an accurate model which would help in forecasting the currency exchange rate. In order to achieve the objective, we use an hybrid model using EMD-RNN against ARIMA for comparison. 1.2. Technical Objective The technical objectives will be implemented in R. The system must be able to forecast the selected currency exchange price based on the historical data input into the system using our developed models. 1.3. Experimental Objective The project will implement two prediction approaches: EMD-RNN (Hybrid) and ARIMA, and compare the correctness of both the approaches by feeding same dataset to both the models. Based on the results obtained, we either approve or disapprove the comparison made.
1.4. The Problem Forecasting the future values of currency is an important problem. Modeling the data as a Time Series is the fundamental approach to solve the problem. “The desire of many investors is to lay hold of any forecasting method that could guarantee easy profiting and minimize investment risk from the forex market. This remains a motivating factor for researchers to evolve and develop new predictive models”.[1] In the past few years, several models have been proposed for Time Series Forecasting. The most popular ones are RNNs, Fuzzy Logic , ARMA , ARIMA , SVM , CNN . In this project, we will analyze the following models by exploiting the advantages of each of the modelling techniques:
● EMD (Empirical Mode Decomposition) ● RNN (Recurrent Neural Network) ● ARIMA (Autoregressive Integrated Moving Average)
The problem is that it is not known which model is accurate for the currency rate data set. In this paper we use the data collected from the Internet as the input data set to perform the modeling, and compare the performance of the models in terms of the output accuracy.
7

1.5. How our Project Relates to the Class Our project involves use of various machine learning models such as ARIMA and Neural Networks. Implementation of these data mining and forecasting approaches mentioned above, to predict the currency trade markets is correlated to our class. 1.6. Why other approaches aren’t good Other approaches use fuzzy logic, which will not provide high accurate results at all times. Also, the fuzzy logic model can work effectively on simple problems only. 1.7. Why Our Approach is Better Since we use hybrid models like EMD-RNN and ARIMA, we can bring out a better prediction algorithm with lower error when compared to the other approaches like fuzzy logic. The other reasons why our approach is better are as follows:
● RNN ○ Relatively easy to use ○ Can approximate any function, regardless of its linearity ○ Great for complex/abstract problems ○ Mimics the brain
● ARIMA ○ This model better fits a time series pattern ○ ARIMA models are known to be robust and efficient in financial time
series forecasting especially short-term prediction [2][3][4]. 1.8. Statement of the Problem A time series data is a dynamic continuous stream of data, where, observations were made regularly and continuously over a specific period of time. Thus, a time series data is a sequence of data observations over a single/multiple variable(s) through a period of time [5]. One of the main objectives of performing time series analysis on the statistical data on foreign exchange currency and predict the future values with a certain degree of accuracy.
8

1.9. Area or Scope of Investigation Our data is in the form of historical forex rate data which need to be trained , on which we need to fit data mining models like RNN, EMD and ARIMA.
2. Theoretical Bases & Literature Review
2.1. Problem Definition Stock market prediction is one of best examples of a time series problem, and people have implemented various data mining approaches to solve and has proven that methods like RNN, ARIMA are effective. The forex market problem is also a similar time series problem having numerous conventional method in forecasting. These conventional methods of forecasting exchange rates, likely because none of them have been shown to be superior to any other. This speaks to the difficulty of generating a quality forecast. 2.2. Theoretical Background The foreign exchange market is volatile and depends on many factors. In order to build an effective prediction model all these factors need to be addressed, along with looking at the historical data rates. Having a good model will be useful to investors. 2.3. Related Research There is a lot of research carried out in developing the prediction models using data mining and machine learning in various fields like stock market prediction, weather forecast etc. However, the amount these models used in the area of Forex rate prediction was very limited, which fascinated us to choose this topic and see if the same could be applied.
2.4. Advantages and Disadvantages of those Research The research papers we went through were able to produce an accurate prediction for short-term and also had other advantages like reduced running time,suitable for large datasets. The disadvantage of the those researches is that, the prediction of forex rate was not done using any of the hybrid models.They have not used any comprehensive pre processing step. And the models have not been used for the currency rate data set.
2.5. Our Solution Our approach is to use an hybrid model against an available model and show which one helps in forecasting in a better way than the available models in the market.
9

2.6. How Our Solution is Different Until now, not enough research was done specifically in the arena of forex rate prediction, which makes our idea different from others. 2.7. Why Our Solution is Better The research papers we looked into, used two of the available models for forecasting the currency exchange rate without venturing into hybrid models. We plan to see how accurate the hybrid model EMD-RNN is as compared to raw ARIMA model.
3. Hypothesis
3.1. Multiple Hypothesis Our initial hypothesis is that the RNN model with the EMD should be more accurate in forecasting than the ARIMA model. In other words, we expect that the RNN model should have a lower error rate as compared to the ARIMA model. 3.2. Positive/Negative Hypothesis It is a positive hypothesis that we expect to be established from the outcome of the study.
4. Methodology
4.1. Collecting Input Data Our data will be collected from a website called Quandl, which provides the historical rates for different currencies.
4.2. How to solve the problem No model has been known to work for all data sets. We compare two models and arrive at the final selection of which model is best suited for the currency exchange rate data set. 4.2.1. Algorithm Design Input the data set to the to EMD filter to pre process data. Then fit the output of the EMD function to the RNN model. We also fit ARIMA() function to the data. Plot the results in both cases against the actual value.We measure the error rate for each of the model.
10
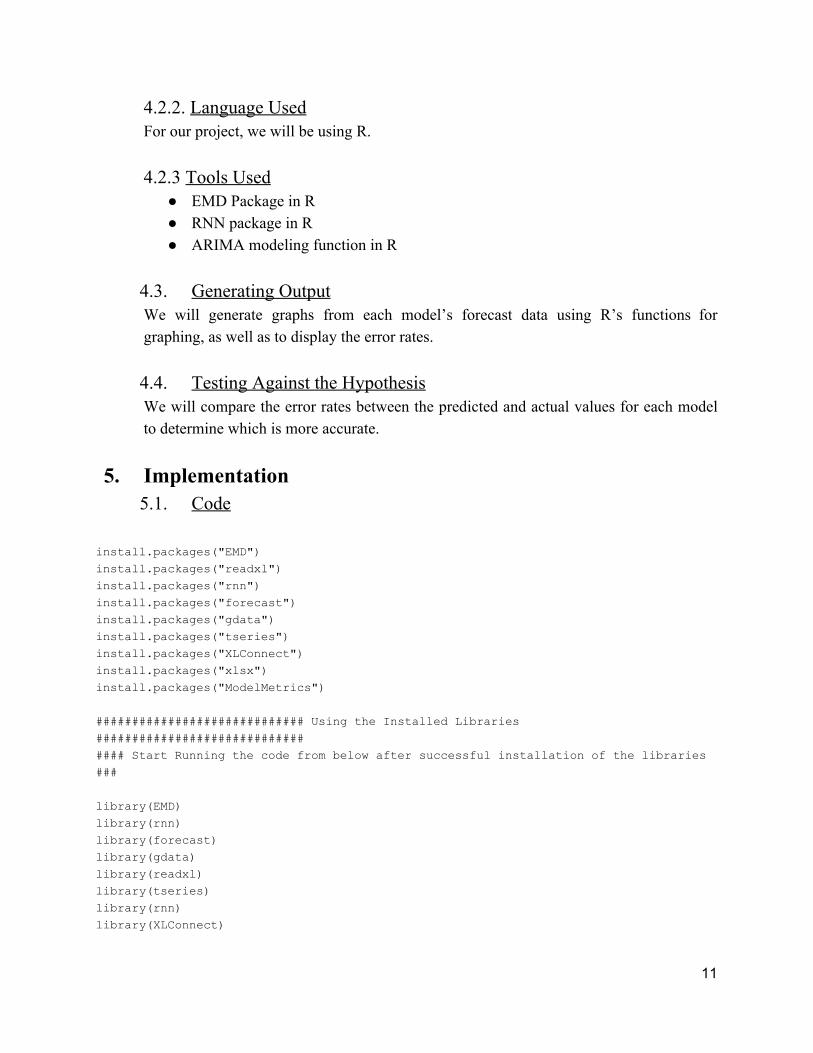
4.2.2. Language Used For our project, we will be using R. 4.2.3 Tools Used
● EMD Package in R ● RNN package in R ● ARIMA modeling function in R
4.3. Generating Output We will generate graphs from each model’s forecast data using R’s functions for graphing, as well as to display the error rates. 4.4. Testing Against the Hypothesis We will compare the error rates between the predicted and actual values for each model to determine which is more accurate.
5. Implementation 5.1. Code
install.packages("EMD") install.packages("readxl") install.packages("rnn") install.packages("forecast") install.packages("gdata") install.packages("tseries") install.packages("XLConnect") install.packages("xlsx") install.packages("ModelMetrics") ############################# Using the Installed Libraries ############################# #### Start Running the code from below after successful installation of the libraries ### library(EMD) library(rnn) library(forecast) library(gdata) library(readxl) library(tseries) library(rnn) library(XLConnect)
11

# dataset of 1500 values # min training data size from excel to the model should be 1500 NumOfDays=100 # No of days to be predicted trainingDataSize=1500 startNumForOutPut=1+NumOfDays endNumForOutPut= trainingDataSize+ NumOfDays #test data set size is set as 2000 predictionTestDataSize=1500 endForPrediction=predictionTestDataSize+NumOfDays ################################# Inputting the File #################################### sampleFileTrain = read_xlsx("C:/Users/nithi/Desktop/Course Study/Spring 2017 Classes/Pattern Recognition and Data Mining/USDINR.xlsx") sampleFileInput <- sampleFileTrain$`USD/INR` ################################# Applying EMD on RNN ################################### try <- emd(sampleFileInput, sampleFileTrain$Number) ################################## Residue prediction ################################### normalizeResidue= (try$residue-min(try$residue))/(max(try$residue)-min(try$residue)) trainInputValues <- 1:trainingDataSize trainOutputValues <- startNumForOutPut:endNumForOutPut input=normalizeResidue[trainInputValues] input<-matrix(input, ncol=trainingDataSize) output=normalizeResidue[trainOutputValues] output<-matrix(output, ncol=trainingDataSize) rnnValueforUSDINR <-trainr (Y=output, X=input, learningrate = 0.01, hidden_dim = 10,numepochs = 350) inputForRnnPredictr=normalizeResidue[1:predictionTestDataSize] inputForRnnPredictrMatrix=matrix(inputForRnnPredictr, ncol=predictionTestDataSize) predictedUSDINR <-predictr(rnnValueforUSDINR,inputForRnnPredictrMatrix) outputResidueFromRnn <- predictedUSDINR[1,] denormalizedResidue = (outputResidueFromRnn)*(max(try$residue)-min(try$residue))+min(try$residue) predictionOutput <- denormalizedResidue #################################### IMF prediction #####################################
12

for(i in 1:try$nimf) { normalizeIMF= (try$imf[,i]-min(try$imf[,i]))/(max(try$imf[,i])-min(try$imf[,i])) trainInputValues <- 1:trainingDataSize trainOutputValues <- startNumForOutPut:endNumForOutPut input=normalizeIMF[trainInputValues] input<-matrix(input, ncol=trainingDataSize) output=normalizeIMF[trainOutputValues] output<-matrix(output, ncol=trainingDataSize) rnnValueforUSDINR <-trainr (Y=output, X=input, learningrate = 0.01, hidden_dim = 10,numepochs = 350) inputForRnnPredictr=normalizeIMF[1:predictionTestDataSize] inputForRnnPredictrMatrix=matrix(inputForRnnPredictr, ncol=predictionTestDataSize) predictedUSDINR <-predictr(rnnValueforUSDINR,inputForRnnPredictrMatrix) outputFromRnn <- predictedUSDINR[1,] denormalizedIMF = (outputFromRnn)*(max(try$imf[,i])-min(try$imf[,i]))+min(try$imf[,i]) predictionOutput <- cbind(predictionOutput,denormalizedIMF) } finalPrediction<- rowSums(predictionOutput) par(mar = c(5,2,2,2)) sampleFileInputForGraph<-sampleFileInput[startNumForOutPut:endForPrediction] length(sampleFileInputForGraph) length(finalPrediction) #################################### Calculating RMSE ################################### RMSE<-sqrt(mean((sampleFileInputForGraph-finalPrediction)^2)) ############################## Plotting RNN with EMD Graph ############################## plot(sampleFileInputForGraph,type="l",col="blue",ylab = "USD INR" ,xlab = "Days ->") lines(finalPrediction,type="l",col="red", ylab = "USD INR" ,xlab = "Days ->") title("Currency Prediction Values(USD/INR) Using EMD+RNN") legend("bottomright", legend=c("Predicted", "Actuals"), col=c("red", "blue"), lty=1:1, cex=0.8) ####################### Final Prediction and RMSE for RNN + EMD ######################### print(finalPrediction) print(RMSE) ######################################## Raw RNN ########################################
13

normalizedForSimpleRNN = (sampleFileInput - min(sampleFileInput)) / (max(sampleFileInput) - min(sampleFileInput)) normalizedForSimpleRNN trainInputValuesSimpleRNN <- 1:trainingDataSize trainOutputValuesSimpleRNN <- startNumForOutPut:endNumForOutPut inputforSimpleRNN=normalizedForSimpleRNN[trainInputValuesSimpleRNN] inputforSimpleRNN<-matrix(inputforSimpleRNN, ncol=trainingDataSize) outputforSimpleRNN=normalizedForSimpleRNN[trainOutputValuesSimpleRNN] outputforSimpleRNN<-matrix(outputforSimpleRNN, ncol=trainingDataSize) rnnValueforUSDINRSimple <-trainr (Y=outputforSimpleRNN, X=inputforSimpleRNN, learningrate = 0.01, hidden_dim = 10,numepochs = 100) inputForRnnPredictrSimple=normalizedForSimpleRNN[1:predictionTestDataSize] inputForRnnPredictrMatrixSimple=matrix(inputForRnnPredictrSimple, ncol=predictionTestDataSize) predictedUSDINRNNSimple<-predictr(rnnValueforUSDINRSimple,inputForRnnPredictrMatrixSimple) outputFromRnnSimple <- predictedUSDINRNNSimple[1,] denormalizedFromRnnSimple = (outputFromRnnSimple)*(max(sampleFileInput)-min(sampleFileInput))+min(sampleFileInput) denormalizedFromRnnSimple sampleFileInputForGraphSimpleRnn<-sampleFileInput[startNumForOutPut:endForPrediction] length(sampleFileInputForGraphSimpleRnn) length(sampleFileInputForGraphSimpleRnn) plot(sampleFileInputForGraphSimpleRnn,type="l",col="blue",ylab = "USD INR" ,xlab = "Days ->") lines(denormalizedFromRnnSimple,type="l",col="red", ylab = "USD INR" ,xlab = "Days ->") RMSEforSimple<-sqrt(mean((sampleFileInputForGraphSimpleRnn-denormalizedFromRnnSimple)^2)) title("Currency Prediction Values(USD/INR) Using RNN") legend("bottomright", legend=c("Predicted", "Actuals"), col=c("red", "blue"), lty=1:1, cex=0.8) ############################# Predicted and RMSE Value for RNN ########################## print(denormalizedFromRnnSimple) print(RMSEforSimple) ######################################### ARIMA ######################################### sampleFileInputforarima <- sampleFileTrain$`USD/INR` trainData <- sampleFileInput[2:17] testData <- sampleFileInput[18:33] arima.final<- arima(trainData,c(2,2,2)) predicted <-predict (arima.final,n.ahead =15) par(mar = c(5,5,3,2))
14

plot(c(predicted$pred),type="l",col="red", xlab = "Days", ylab = "Rate",ylim=c(40,60), xlim = c(0,25)) lines(c(testData), col="black",type="l",ylim=c(40,60), xlim = c(0,25)) # add a title and subtitle title("Currency Prediction Values(USD/INR)Using ARIMA") #add legend legend("topright",legend=c("Predicted", "Actuals"),col=c("red", "black"), lty = 1:1 , cex = 0.5)
5.2. Design Document & Flowcharts There are two R scripts, one to run the ARIMA model, and another to run the EMD-RNN model. In each, incoming data is preprocessed and formatted correctly for each model, from an Excel file. Each model is then trained on its respective data. Once trained, the models can be used to predict the values for the next x amount of days. Outputs are graphs of comparisons between the predicted and actual values, as well as the values of the RMSE.
ARIMA Flowchart
15

RNN Flowchart
16

EMD + RNN Flowchart
17
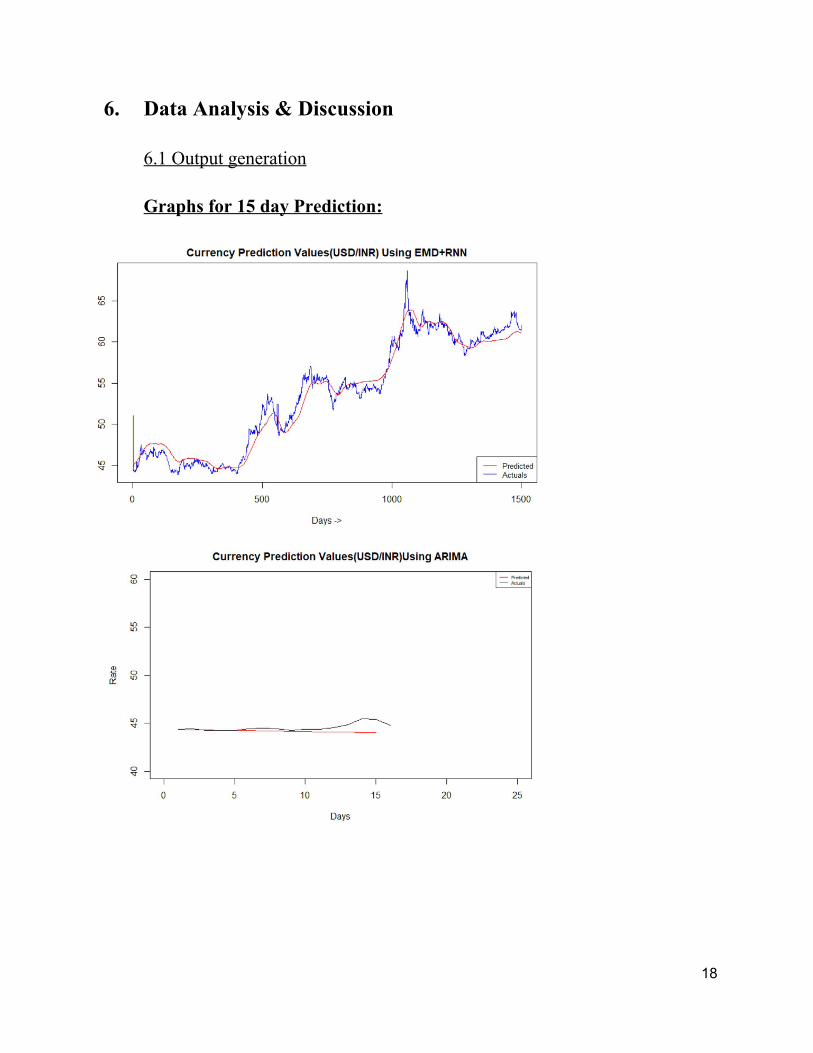
6. Data Analysis & Discussion 6.1 Output generation
Graphs for 15 day Prediction:
18

For Further Graphs please refer the appendix chapter 6.2 Output Analysis From the analysis we carried out as a part of the experimental work we arrived at below results for different combinations of dataset and prediction on the number of days in advance. We also extended the initial scope from short term prediction to long term prediction
19

(1 day window to 100 day window ). Our observations were in line with our hypothesis that RNN +EMD is better than RNN and ARIMA
Performance : RNN + EMD > RNN > ARIMA 6.3 Comparison With Hypothesis Our observations were in line with our hypothesis that RNN +EMD is better than RNN and ARIMA 6.4 Abnormal Case Explanation Based on our observation we were able to study that the ARIMA model cannot handle larger dataset giving RMSE error of 1.47 regardless of however we train the data. Whereas when the data set size(~ 50 Historical Currency Rates) was small ARIMA model performed better for short term. 6.5 Statistic Regression Data’s are the only independent variables used and dependant variables used are EMD,IMF,Training & Prediction Model. 6.6 Discussion We chose the Exchange Rate Dataset from Quandl.com and analysed daily data from April-2010 to March -2017 to prepare to prediction model. Many Indicators functions and their permutations were tested while training and testing the system.Of all the indicator functions tested,the ones which gave the best prediction result were selected. The System performs very well for the prediction of the selected exchange forex rate dataset.
20
7. Conclusions & Recommendations
7.1 Summary and Conclusion
Our experiment was in line with the hypothesis we proposed and was able to prove that EMD + RNN model was the best among the other chosen models which are Raw RNN and ARIMA for long term prediction. 7.2 Future Work The possible future extension that can be made is to train the RNN model for a short term prediction and short data set. Avoiding normalization. Applying Ensemble EMD with RNN and check for RMSE in short and long term. Also the work on ARIMA model can be extended on a large dataset.
8. Bibliography [1] G.S. Atsalakis, E.M Dimitrakakis and C.D. Zopounidis, “Elliot Wave Theory and neuro-fuzzy systems, stock market prediction: The WASP system”, Expert Systems with Applications, vol. 38, pp. 9196-9206, 2011
[2] L.C. Kyungjoo, Y. Sehwan and J. John, “Neural Network Model vs. SARIMA Model In Forecasting Korean Stock Price Index (KOSPI)”, Issues in Information System, vol. 8 no. 2, pp. 372-378, 2007.
[3] N. Merh, V.P. Saxena, and K.R. Pardasani, "A Comparison Between Hybrid Approaches of ANN and ARIMA For Indian Stock Trend Forecasting", Journal of Business Intelligence, vol. 3, no. 2, pp. 23-43, 2010.
[4] J. Sterba and Hilovska, "The Implementation of Hybrid ARIMA Neural Network Prediction Model for Aggregate Water Consumption Prediction", Aplimat-Journal of Applied Mathematics, vol. 3, no. 3, pp. 123-131, 2010
[5] Geetha, A., and G. M. Nasira. “Time series modeling and forecasting: Tropical cyclone prediction using ARIMA model”, 2016 3rd International Conference on Computing for Sustainable Global Development (INDIACom), IEEE, 2016.
21

9. Appendices
9.1 Graph for 1 day window:
9.2 Graph for 100 day window:
22

23
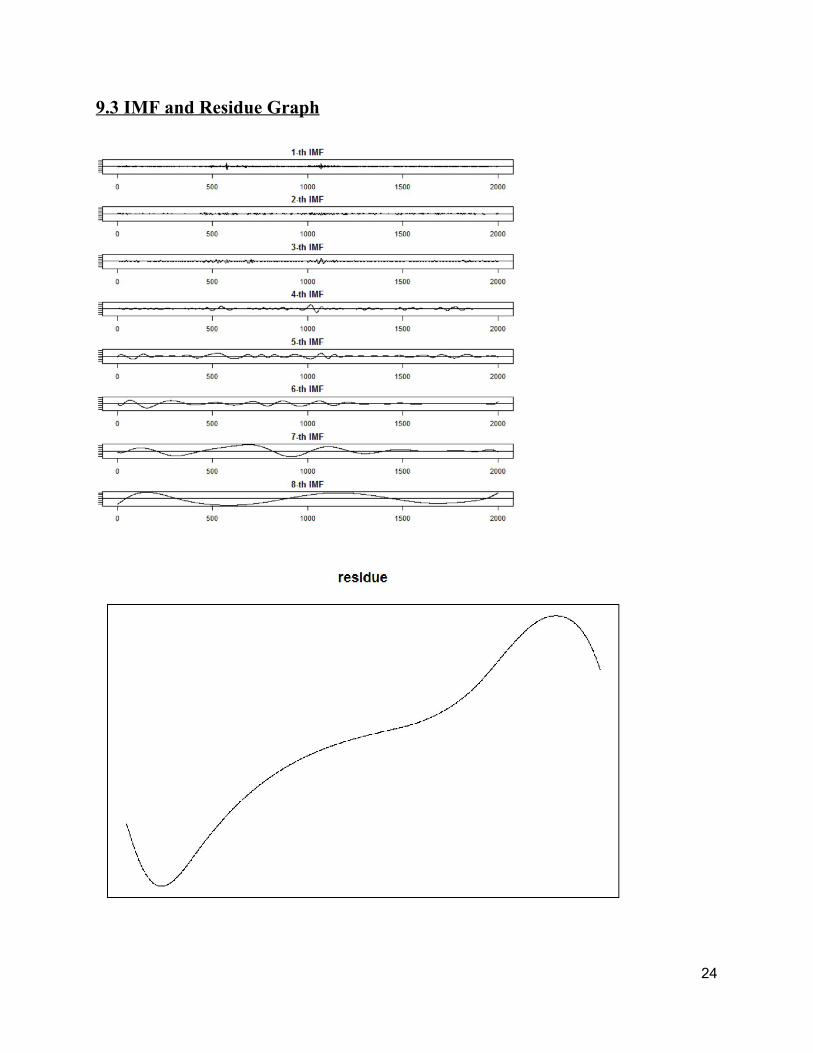
9.3 IMF and Residue Graph
24