Embed Size (px)
Citation preview
I COEFFICIENTS FOR DESIGNING THE CONCRETE-LINED CHANNELI (U) COMMITTEE ON CHANNEL STABILIZATION (ARMY) SEP 85
UNCLASSIFIED TR-14 F/G 12/2 NU.
11111 1 ~~.0 1815I ki.. IJL .
L 3.6 112.
1.8
111111.25 111. . 116
NA'NLARAJO tNAD 6MICROCOPY RESOLUTION TEST CHART
IAWNLRRAiOFSADRS16
TECHNICAL REPORT NO. 14
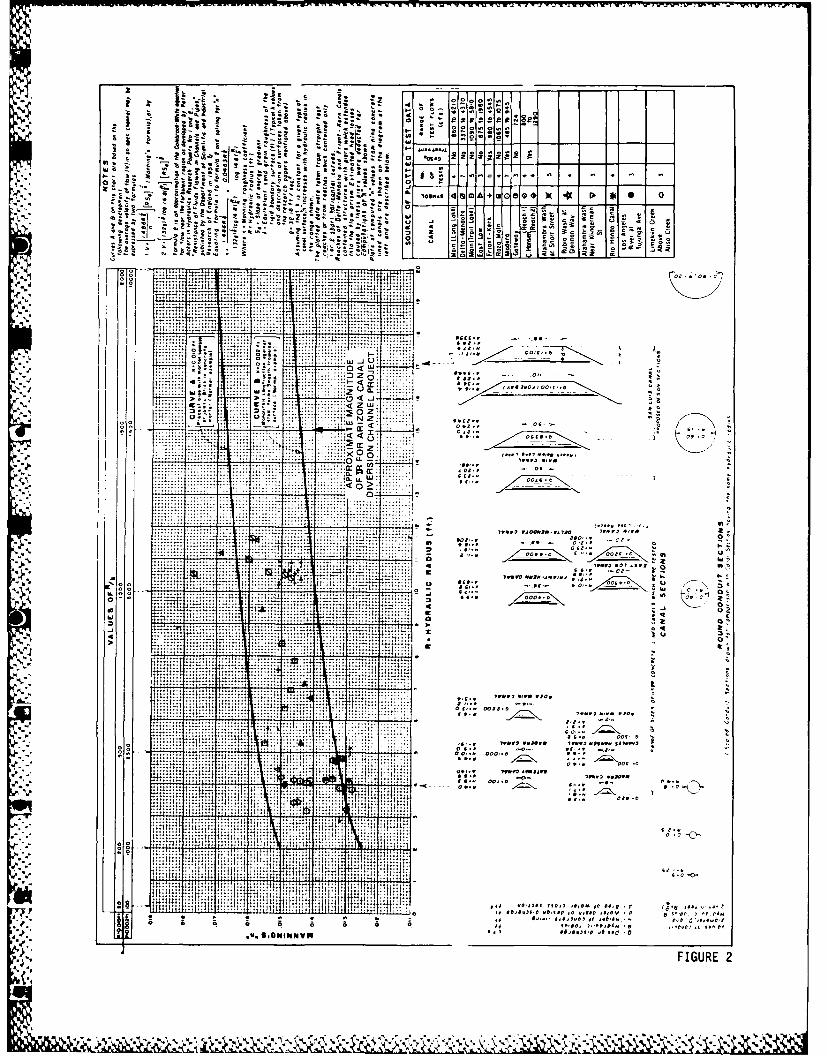
ARIZONA CANAL DIVERSION CHANNELSELECTION OF ROUGHNESS COEFFICIENTS FOR
DESIGNING THE CONCRETE-LINED CHANNEL
I
September 1985
DTICEL ECTEMAR 4 1986j
Committee on Channel Stabilization
-" CORPS OF ENGINEERS, US ARMY
APPROVED FOR PUBLIC RELEASE; DISTRIBUTION UNLIMITED
3a J
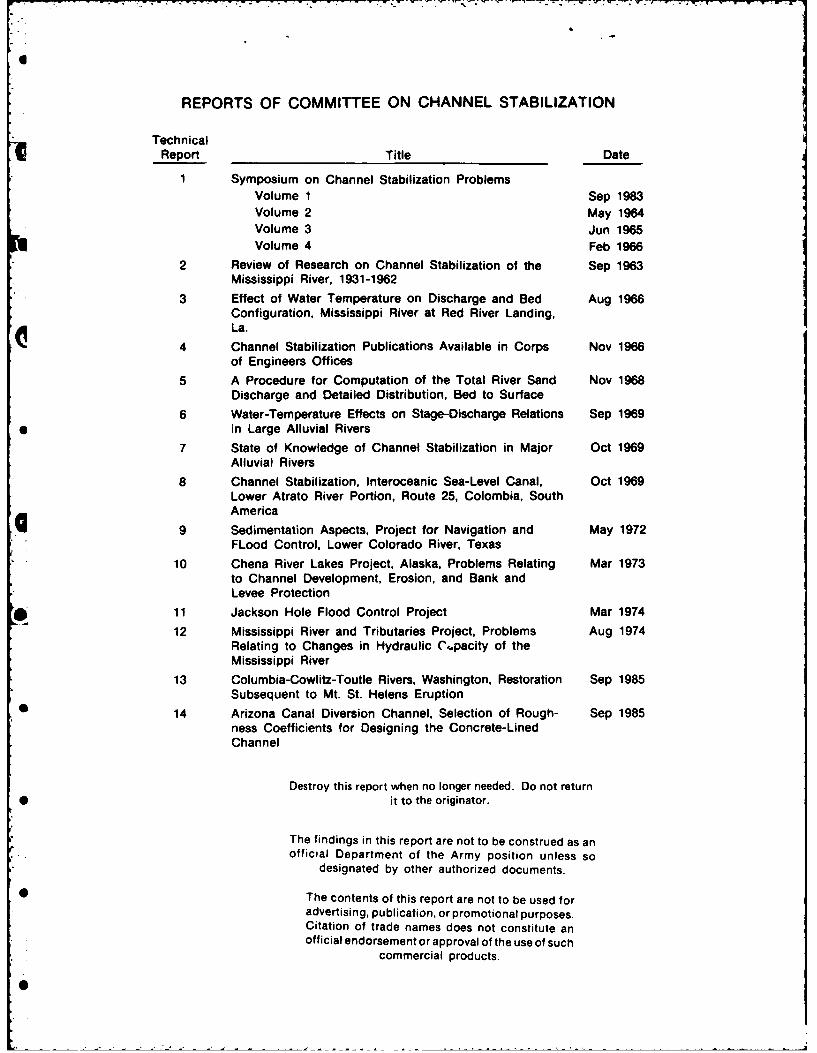
REPORTS OF COMMITTEE ON CHANNEL STABILIZATION
Technical
Report Title Date
1 Symposium on Channel Stabilization ProblemsVolume 1 Sep 1983Volume 2 May 1964Volume 3 Jun 1965Volume 4 Feb 1966
2 Review of Research on Channel Stabilization of the Sep 1963Mississippi River, 1931-1962
3 Effect of Water Temperature on Discharge and Bed Aug 1966Configuration, Mississippi River at Red River Landing,La.
4 Channel Stabilization Publications Available in Corps Nov 1966of Engineers Offices
5 A Procedure for Computation of the Total River Sand Nov 1968Discharge and Detailed Distribution, Bed to Surface
6 Water-Temperature Effects on Stage-Discharge Relations Sep 1969* in Large Alluvial Rivers
7 State of Knowledge of Channel Stabilization in Major Oct 1969Alluvial Rivers
8 Channel Stabilization, Interoceanic Sea-Level Canal, Oct 1969Lower Atrato River Portion, Route 25, Colombia, SouthAmerica
9 Sedimentation Aspects, Project for Navigation and May 1972FLood Control, Lower Colorado River, Texas
10 Chena River Lakes Project, Alaska, Problems Relating Mar 1973to Channel Development, Erosion, and Bank andLevee Protection
11 Jackson Hole Flood Control Project Mar 1974
12 Mississippi River and Tributaries Project, Problems Aug 1974Relating to Changes in Hydraulic Cu.pacity of theMississippi River
13 Columbia-Cowlitz-Toutle Rivers, Washington, Restoration Sep 1985Subsequent to Mt. St. Helens Eruption
14 Arizona Canal Diversion Channel, Selection of Rough- Sep 1985ness Coefficients for Designing the Concrete-LinedChannel
Destroy this report when no longer needed. Do not return* it to the originator.
The findings in this report are not to be construed as anofficial Department of the Army position unless so
designated by other authorized documents.
* The contents of this report are not to be used foradvertising, publication, or promotional purposes.Citation of trade names does not constitute anofficial endorsement or approval of the use of such
commercial products.
6J
TECHNICAL REPORT NO. 14
ARIZONA CANAL DIVERSION CHANNELSELECTION OF ROUGHNESS COEFFICIENTS FOR
DESIGNING THE CONCRETE-LINED CHANNEL
September 1985
DTICEft l..ECTE
MAR 4 1986 : ,
Ba L_
Committee on Channel Stabilization
CORPS OF ENGINEERS, US ARMY
APPROVED FOR PUBLIC RELEASE; DISTRIBUTION UNLIMITED,::::
-. .. . "I
PRESENT MEMBERSHIP OFCOMMITTEE ON CHANNEL STABILIZATION
Samuel B. Powell Chairman Office, Chief of Engineers
Howard M. Whittington Executive Secretary Mobile District
Larry E. Banks Vicksburg District
Francis Coppinger North Atlantic Division
J. Edwin Glover Waterways Experiment Station
Alfred S. Harrison Missouri River Division
Richard P. Regan Seattle District
Tasso Schmidgall Southwest Division
William A. Thomas Waterways Experiment Station
* b
%".4
%2"
-.. 4 -*~
Preface
Establishment of the Committee on Channel Stabilization in April 1962
was confirmed by Engineer Regulation 15-2-1, dated 1 November 1962, and re-
authorized by ER 15-2-1, dated 25 June 1971 and 30 April 1980. As stated in
ER 15-2-1, the objectives of the Committee, with respect to channel stabili-
zation, are:
a. To review and evaluate pertinent information and disseminatethe results thereof.
b. To determine the need for and recommend a program of research;and to accomplish advisory technical review of research whenrequested.
c. To determine basic principles and design guidance.
d. To provide, at the request of field offices, advice on designand operational problems.
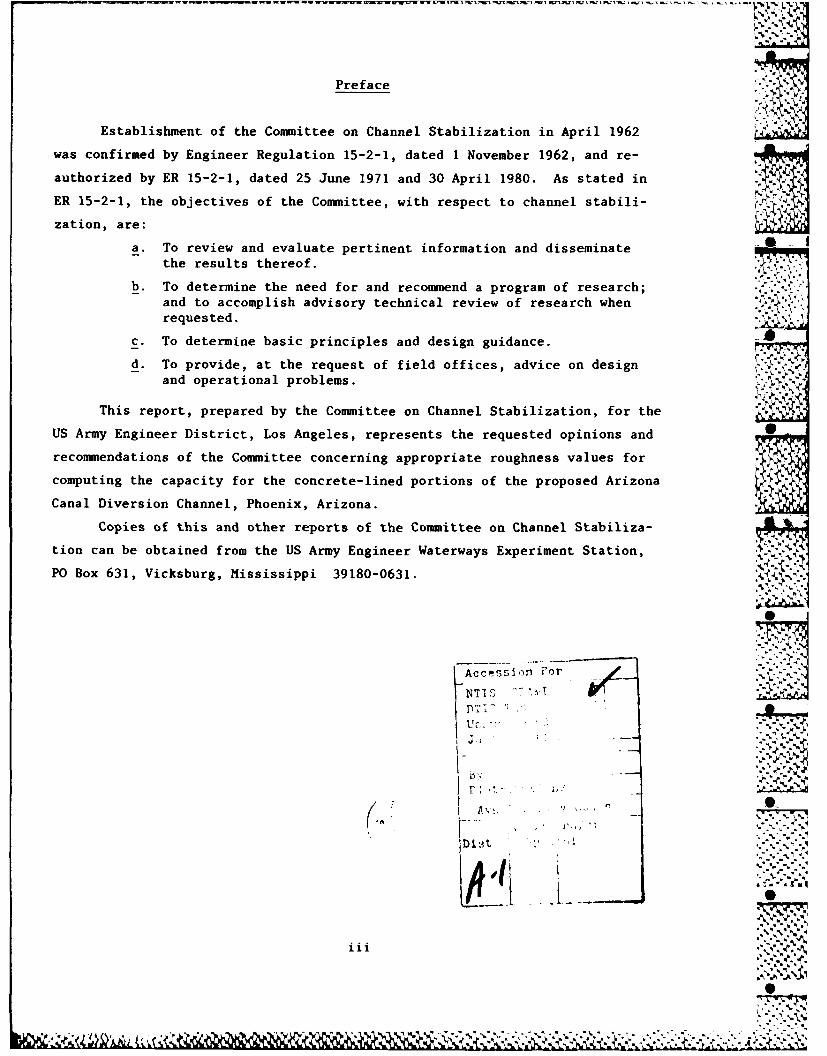
This report, prepared by the Committee on Channel Stabilization, for the
US Army Engineer District, Los Angeles, represents the requested opinions and
recommendations of the Committee concerning appropriate roughness values for
computing the capacity for the concrete-lined portions of the proposed Arizona
Canal Diversion Channel, Phoenix, Arizona.
Copies of this and other reports of the Committee on Channel Stabiliza-
tion can be obtained from the US Army Engineer Waterways Experiment Station,
PO Box 631, Vicksburg, Mississippi 39180-0631.
SAcceSsIofl For -
.- -v .
,0
Diiii '"
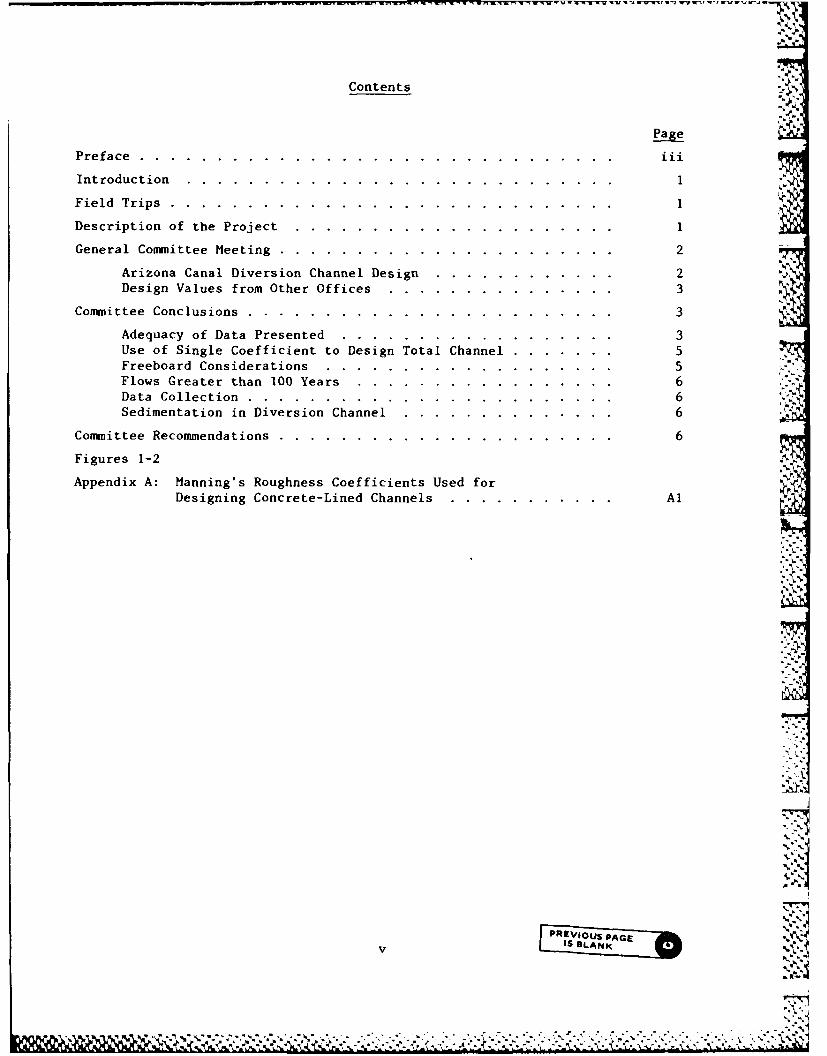
Contents
Page
Preface .. ..............................
Introduction..................................
Field Trips .................................. 1
Description of the Project. ......................... 1
General Committee Meeting .. ......................... 2
Arizona Canal Diversion Channel Design ................. 2Design Values from Other Offices .................... 3
Committee Conclusions ............................. 3
Adequacy of Data Presented ....................... 3Use of Single Coefficient to Design Total Channel. .. ......... 5Freeboard Considerations ........................ 5Flows Greater than 100 Years ...................... 6Data Collection .. ........................... 6Sedimentation in Diversion Channel ................... 6
Committee Recommendations .. ......................... 6
Figures 1-2
Appendix A: Manning's Roughness Coefficients Used for
Designing Concrete-Lined Channels. .............. Al
OUS'~
ARIZONA CANAL DIVERSION CHANNEL
SELECTION OF ROUGHNESS COEFFICIENTS FOR
DESIGNING THE CONCRETE-LINED CHANNEL
Introduction
1. During the week of 8-12 February 1982, the US Army Engineer Divi-
sion, South Pacific, and the US Army Engineer District, Los Angeles, invited
the Committee on Channel Stabilization to meet with them in an effort to de-
termine the most appropriate roughness value to use in computing the capacity
, for the concrete-lined portions of the proposed Arizona Canal Diversion Chan-
' nel in Phoenix, Arizona. Prior to the meeting, the Los Angeles District pre-
pared a report titled Manning's Roughness Coefficients Used for Designing
Concrete-Lined Channels .-and furnished copies to each Committee member kApp-en
-- dix-A). The report reviewed their experience in designing concrete-lined
channels, listed and described field measurements, and discussed Manning's n
values computed from field measurements. The report also discussed data and
Manning's n values from Bureau of Reclamation irrigation projects. This re-
port formed the basis for much of the meeting's discussions.
.N Field Trips
2. The early part of the week included a field trip in the Phoenix area
to several project areas including the proposed alignment for the Arizona
Canal Diversion Channel. A subsequent field trip was made in the Los Angeles
area that included the recently completed Cucamonga Creek flood-control chan-
nel and several sites on other projects where field measurements were made for
Manning's n value determinations.
Description of the Project
3. The Arizona Canal Diversion Channel is one feature of the New River
and Phoenix City streams flood-control project.
4. The New River and Phoenix City streams flood-control project, as
described in House Document 216, 89th Congress, Ist Session, was authorized by
the Flood Control Act of 1965. The proposed recommended plan for controlling
.1'Z
flood flows consists of four dams: Dreamy Draw (completed in 1973), Cave
Buttes, Adobe, and New River Dams; 20 miles of channelization - Arizona Canal
Diversion Channel and portions of Cave and Skunk Creeks; and 19 miles of flow-
age easements with some floodproofing, levees, and channelization - Skunk
Creek and the New and Agua Fria Rivers.
5. This report will discuss only the proposed concrete-lined portion of
Arizona Canal Diversion Channel. The proposed diversion channel will have
both rectangular and trapezoidal shapes and vary in size from 36 to 100 ft
bottom width. The channel, as proposed, will be designed for a 100-year flood
with 2 ft of channel freeboard. The channel traverses a heavily populated
area and receives runoff from a drainage area that has experienced significant
urbanization over the past 30 years.
General Committee Meeting
Arizona Canal Diversion Channel Design
6. Los Angeles representatives briefed the Committee on the Arizona
project with particular emphasis given to design of the diversion channel and
the value of the Manning n . Preliminary design of the diversion channel for
costing purposes has been completed. The Los Angeles District used a Manning's
n value of 0.014 to size the concrete-lined portions of the channel, a designSvalue that they believe is conservative and have used for a number of years in
j designing concrete-lined channels for other projects. As a result of OCE com-
ments, the District evaluated the effect on channel size of increasing the n
value to 0.016. Computations indicate that channel depths would increase from
1.3 to 2.9 ft, assuming the 2-ft freeboard requirement would be retained as
part of the design criteria. This increase represents a significant increase
in estimated first cost for the proposed project. Because of the adverse im-
pact on estimated project costs caused by increasing the value of Manning's.' ,
n , the District collected and analyzed available prototype data from concrete-
lined channels in the Los Angeles area and initiated a review of available
USBR data on concrete-lined channels to determine, to the extent possible,
Manning's n values from prototype channels. The report referenced in the
introduction contains pertinent data and the District's analysis. A copy of
the report is attached as Incl 1. A summary of the District's position is
taken from that report and is as follows:
2
%* r
... prototype data that were gathered to determine n
values in concrete-lined flood control channels show that,
if anything, an n value of 0.014 is conservative. Thereason for these relatively low n values is the quality
of concrete finishes in these channels and the mild cli-mate. It is true that the Bureau of Reclamation has ex-
perienced n values higher than 0.014 in some of theirirrigation canals; however, aquatic growth was the primary
cause of this. Aquatic growth does not occur to nearlythis extent in our concrete flood control channels. Forthese reasons, we feel that our practice of using an nof 0.014 for design of concrete-lined channels is
appropriate.
Design Values from Other Offices
7. Following presentations from the Los Angeles representatives, mem-
bers of the Committee were requested to comment on design practices in other
Corps Districts and Divisions. Response from Committee members indicated that
generally an n value of 0.014 to 0.015 has been used by other Corps offices.
Committee Conclusions
8. Following the general meeting, the Committee met separately to delib-
erate on the Los Angeles presentations and other discussions. Based on dis-
cussions, the Stabilization Committee has the following concerns regarding the
design of the Arizona Canal Diversion Channel: (a) adequacy of Los Angeles
and/or USBR data to fully support selection of 0.014 as a channel design
value, (b) use of a single roughness coefficient to design the diversion
channel, (c) flows greater than the 100-year flow should be analyzed, (d) con-
sideration of program of data collection, and (e) sedimentation in the diver-
sion channel.
Adequacy of Data Presented
9. Prototype data for the Los Angeles area represent low flows primar-
ily. Similar data over a wide range of flows would lend much greater weight
particularly in regard to use of the data to determine or aid in the selection
of a design roughness coefficient. It is also noted that flows in the pro-
posed Arizona Canal Diversion Channel will be subcritical rather than super-
critical, creating the possibility of unexpected sediment and debris deposits
that could affect flow efficiency. The USBR data more closely correlates with
the proposed diversion channel, particularly in regard to hydraulic radius;
3
<,
however, as pointed out by the District the USBR n values generally greater
than 0.014 were believed to be affected by aquatic growth and vegetation in
the canals tested. Since the USBR data represent conditions more closely re-
lated to the diversion channel, these data should be analyzed in greater de-
4. tail and reliable data points identified and correlated with the Los Angeles
data to define, to the extent possible, a curve of Manning's n versus hy-
draulic radius.
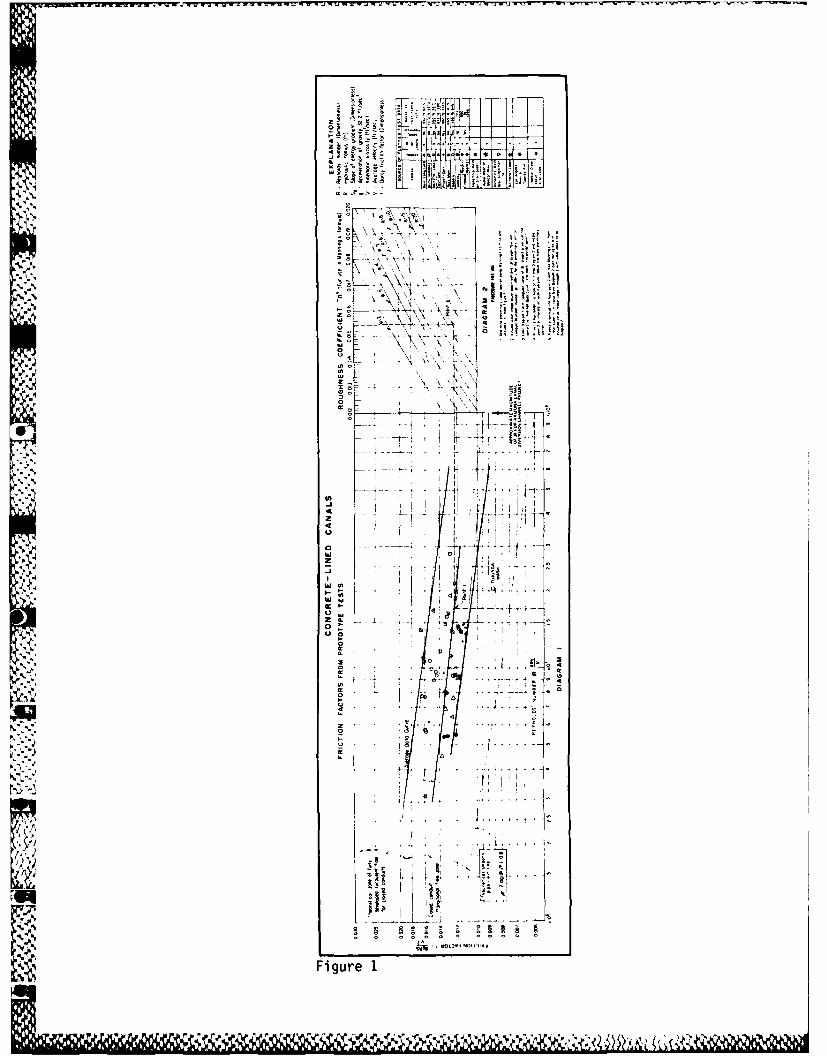
. I0. Most of the USBR data are for deep flow depths and low velocities,
while the Corps data are for shallow flow depths and high velocities. The two
sets of data seem more consistent when they are plotted. Figure 1 plots
Darcy's f against Reynold's number as in the familiar Moody diagram. In
Figure 1, both the Corps and the Bureau data scatter considerably; but they
seem to form a consistent data set when the variations of hydraulic resistance
,.44 with Reynold's number are taken into account.
11. Figure 2 plots Manning's n against hydraulic radius for both the
StUSBR and he Corps data. Again, the two data sets seem fairly consistent with
the Corps data representing the lower end of the range of R (hydraulic ra-
dius). With respect to n values, data seem to scatter around the lower en-
". ~*.velope of the USBR data. The vertical arrow at about 15 ft hydraulic radius
denotes the approximate value for the Arizona Canal Diversion Channel. Fig-
ure 2 confirms that for the concrete surface at the site of the field measure-
-.-. ments Manning's n tends to increase with hydraulic radius. This is in con-sonance with theory and laboratory measurements in which the Moody diagram is
based. It means that where Manning's n is determined by measurement in achannel at a low flow depth, we should expect the n value to be greater at a
-K. deeper flow depth. Study of Figure 2 reveals that for the hydraulic radius R
of around 15 ft a design n value of 0.014 might be acceptable; but it would
be conservatively low.
12. In summary, the data supporting a design value of 0.014 are weakII from several aspects; however, the data are equally weak in supporting another
alternate value. It is the opinion of the Committee that an n value of
0.014 is adequate to design the Arizona Canal Diversion Channel for costing
purposes. However, a varying value of n should be determined and used for
detailed design of individual reaches of the channel.
4
- * *'4 ~ ~ ~ . a ~ ~ L%
Use of Single Coefficient
to Design Total Channel
13. Open-channel flow involves a number of factors that usually are
combined into a single roughness coefficient or factor (Manning n , Chezy C
Darcy k , etc.) Application of Manning's n is widely used, and the Los
Angeles District prefers this application for design of the diversion channel.
However, it is the opinion of the Stabilization Committee that the method of
roughness application should be through the use of the Moody type approach.
The logarithmic relation (Moody approach) that relates resistance factors to
the Reynolds number and relative smoothness (R/k ) is the best availables
approach for determining friction losses in concrete-lined channels. All the
technical literature and scientific experiments since Prandtl and Von Karman
support this. The mechanics are available to use the logarithmic relations
to obtain proper n values for a particular application, and this should be
done as backup and support data for the final design. Support for a variable
n value rather than a constant value is demonstrated by the n versus R
(Figure 2) relation exhibited at the meeting which was developed from field
data and showed that n varied with depth of flow or hydraulic radius. For
small roughness such as a concrete surface, the logarithmic relation also
shows that n values increase with depth or hydraulic radius.
14. The sensitivity of the design profile to alternate determinations
(use of constant n and varying n) should be made and recorded. It appears
that the accuracy of depth of flow for channel wall height can be within a
foot. The need for the Moody approach determination is to best determine
locations of initial overtopping as design information for the control of
these locations.
Freeboard Considerations
15. The Moody type approach should be used to determine the n value
to be used for the final depth of flow and a higher n value (0.016, for
example) to determine the possible upper bound for the depth of flow with the
same design flow. The difference would be freeboard. The freeboard would,
therefore, be a variable height throughout the project depending on channel
conditions and the n value used for a specific reach. Low points in the
height of protection should be provided as necessary to have controlled over-
flow sections to reduce the potential damages for flows greater than the
design flow.
.
.. .%
.V W.
Flows Greater than 100 Years
16. The consequences of flows exceeding the design flows for the Ari-
zona Canal Diversion Channel is particularly important due to its length and
the transfer of discharge from one drainage area to another. The project
should allow for a reasonable increase in discharge to be confined. Areas
where overtopping would result in more serious damage than preproject condi-tions should have increased freeboard. Flooding resulting from the standard
project flood postproject should be determined and the results presented to
the communitv for their consideration. Resulting residual damages should be
included in the project economics.
17. The project should be analyzed to determine those locations where
flooding would result in the least damage and the project designed to the ex-
tent feasible to limit possible overtopping to those locations.
Data Collection
18. The questions that have arisen in regard to the design of the di-
* version channel spotlight the need for prototype data from similar projects.
Problems associated with data collection (funding, manpower, cost, etc.) are
noted; however, the Los Angeles District is in a position to benefit the state-
of-knowledge in roughness coefficients for high-velocity concrete-lined chan-
nels. This District, as well as others, should make an effort to obtain as
much data as possible. Projects could have built-in, self-recording devices
procured with project funds and maintained by locals as part of the local
;" " cooperation.
Sedimentation in Diversion Channel
19. Members of the Committee are concerned that a potential for excess
sediments entering the diversion channel will exist at particular locations.
These sediments could have significant impact on the design flowline if suffi
cent energy is not available to transport these sediments through the channel.
The General Design Memorandum should address this concern.
Committee Recommendations
20. As a result of the Committee meeting following the general presen-
tations, the following actions for Los Angeles District are recommended:
6%%. % r e a'.
a. The Los Angeles District should retain the constant n value
of 0.014 and a freeboard of 2-ft design of the diversion channel for costing
purposes primarily.
b. The District should employ a method of roughness application
through the use of the Moody type approach to design a water-surface profile
and to test the sensitivity of the freeboard design with the results of the
sensitivity analysis included in the Design Memorandum as backup and support
data.
c. Using the recommended Moody approach, the District should ana-
lyze the diversion channel to identify locations of initial overtopping for
flows exceeding design flows and use this information as design data to estab-
lish least-damaging initial overtopping locations.
d. The District should seriously investigate ways and means of
obtaining, within given constraints, a greater data base from operation of
numerous high-velocity concrete-lined channels in the Los Angeles area and
in the future from low-velocity channels in the Phoenix area.
7
- I,,''
9 --
I . 0
4 ~ I i~1Li ~V.'..
00
~ \\~
- ~i ~ -*
'.9
-9 A
~ ~t9~1 ;* t. 9.9
\ ~ \ IB!~
I.'. ~
4-J ~2 -, I
U F.z~1
~ -~ I ij I: . 0
I -- 9,--.+ -
z o ~**j~
I9
...............................i..V I
d
* b
-V.-
~. ~. . .
Iii ~0 0 0 0 0 0 0 0IN SOS .'0'1S95
I.. a
loop's 00 0*4*" 0.I.4 00*0
- ~ ~~~~~ 1 C.Ca ~~
-- 0o:c
..* ........< _j ..4 ........ c
06 0. .. ....40 Z
.06-.
Oa 0.
.......... ..... . .. ....... .......
11.12. 100*9-.0 N.
.... ......... -0
.... ... ,. .. .. * 0 2. 0
7*010 ~ ~ .0 Is.,0,, 5. .
of,oil . . . . . . . . . . . . . . .k
... ....
CC. H.V."EHICVW00.0
0 A'::: 1*1 0.4.4. . 10 ' -,-.. ,:;.... .....: ... *
.~ 91.. 000.C 0a.
0-0-
0~~ 0.0 0.
544 00448 O~flaO0040 l- 0 jf~iVVG
it*~,4, 8504 400fV .0 ~ '~0 a~~~
a a a * 80~*~ ** 440.0 08000~t OVt...4
1:: p:80 till,~ - ill40 -I I4
(441
hill~ 6--0
Appendix A: Manning's Roughness Coefficients Usedfor Designing Concrete-Lined Channels
1. General. In a recent conference with representatives of the Hydrology andHydraulics Branch from the South Pacific Division, the Los Angeles Districtwas informed that the Division Office has recently received comments from OCEfor a project in another District in the Division regarding Manning's nvalues used for the design of concrete-lined channels. These comments sug-gested use of n values in the range of 0.016 to 0.017. The basis for theuse of n values of this magnitude appears to be from a Bureau of ReclamationTechnical Memorandum 661 titled "Analysis and Description of Capacity Test inLarge Concrete-Lined Channels."
2. This information, if true, is causing much concern in the Los Angeles Dis-trict. The Los Angeles District has successfully used n values of 0.014 forthe past 45 years in designing concrete-lined channels. Use of higher nvalues would be a change in our criteria. This would affect several studiesthat are currently under way in the District. Because of the potential impacton the current design studies of increasing the n values, it is importantthat we clarify as soon as possible the Corps latest philosophy regarding nvalues to be used in the design of concrete-lined channels. If there is achange in criteria being anticipated, the Los Angeles District requests thatthe information being presented in this paper be considered before the finali-zation of any criteria change.
3. Existing Criteria. In EM 1110-2-1601, Hydraulic Design of Flood ControlChannels, paragraph 8b(1) states that three equations, (1) Chezy, (2) Manning,and (3) Darcy are in general use for determination of losses due to friction.The EM does not recommend one equation over the others, although it does giveconsiderable emphasis to the Chezy equation. All three equations are empiri-cal, with some degree of model and prototype verification. The use of any one
of the three equations by a District requires that the District develop an ex-pertise on selection of roughness values for the particular equation. In theLos Angeles Distict, we have developed experience designing channels using theManning formula.
N.. 4. On pages 8 and 9 of EM 1110-2-1601, there is a discussion of friction
coefficients. In this discussion, it is recommended that in solving for the
Chezy C , a k value of 0.007 foot be used as the equivalent roughness fac-tor for concrete-lined channels in determining discharge capacity and a kvalue of 0.002 foot be used to determine the maximum velocity. As we willdiscuss in coming paragraphs, we feel that an equivalent roughness of0.007 foot may be too high for our concrete-lined channels.
5. As already stated, the Los Angeles District has considerable experience indesigning high-velocity and low-velocity channels using the Manning formula.For concrete-lined channels we use an n value of 0.014 for determining dis-
charge capacity and 0.012 for maximum velocity. We feel that an n of 0.014represents a conservative value consistent with the quality of concrete fin-ishes in our channels and allows for the effects of weathering and concreteerosion. Most of our concrete-lined channels have been constructed witheither metal trowel or wood float finish. Rectangular channel wall forms arenormally plywood, which also provides a relatively smooth surface. Weathering
Al
does not pose a problem for our channels. Unlike many parts of the country,the southwest, especially the southern California coastal area and the Phoenixarea, has a mild climate and is not subject to freezing-and-thawing action.
6. Prototype Data. The best way to check the adequacy of the n values usedin the design of concrete-lined channels is to gather data from these channelsduring flood events. Since there are many miles of concrete-lined channelsconstructed by the Corps of Engineers and local flood control districts insouthern California, one would expect a large volume of prototype data avail-able for examination. However, due to the short-duration flood events thatare characteristic of the southern California coastal streams, not as muchdata as was first expected are available. The data that are available comefrom four sources: (1) data collected from the March 1938 flood, (2) datacollected from a test made on Tujunga Wash in 1966; (3) data obtained from theLos Angeles County Flood Control District; and (4) observations made duringthe floods of January and February 1969. From these data, n values andequivalent roughness coefficients, k , are computed. The following para-graphs will discuss these data.
a. Flood of March 1938. During the March 1938 flood, data were collectedat five locations on four concrete-lined channels in southern California forthe purpose of determining the Manning roughness coefficient. Following is asummary of these data.
(1) Alhambra Wash at Short Street. The channel in this location isrectangular in cross section with a width of 40 feet. The invert grade is0.005611. Five current meter measurements were made by the Los Angeles CountyFlood Control District. At the time of each measurement, a considerableamount of silt was observed on the channel invert. The silt was presentbecause the channel upstream of this was not completed at the time of the 1938flood. The discharges ranged from 17 to 715 cfs with depths ranging from 0.19to 1.5 feet and n values ranging from 0.0127 to 0.0187. The following tablesummarizes the data:
Measurement 1 2 3 4 5Discharge Q 142 138 715 104 17Area A 23.3 28.9 63.4 21.8 7.4Mean Velocity V 6.1 4.8 11.3 4.8 2.3Hydraulic Radius R 0.6 0.7 1.5 0.5 0.2Slope S 0.005611 0.005611 0.005611 0.005611 0.005611Roughness n 0.0127 0.0187 0.0129 0.0150 0.0157
CoefficientEquivalent k 0.0037 0.043 0.0030 0.012 0.015Roughness
(2) Rubio Wash at Glendon Way. The channel cross section at thislocation is rectangular with a width of 48 feet. No silt was observed on theinvert and the quality of concrete was noted as exceptionally good. Fourcurrent meter measurements were made by the Los Angeles County Flood ControlDistrict. The discharge ranged from 189 to 895 cfs with depths ranging from0.4 to 1.2 feet and n values from 0.009 to 0.0109. The following table sum-marizes the data:
A2
Z..
Measurement 1 2 3 4Discharge Q 895 720 315 189Area A 58.4 51.6 27.0 19.9Mean Velocity V 15.3 14.0 11.7 9.5Hydraulic Radius R 1.1 1.2 0.6 0.4Slope S 0.0097 0.0097 0.0097 0.0097Roughness Coefficient n 0.0107 0.0109 0.009 0.0091Equivalent Roughness k 0.0006 0.0008 0.00016 0.00025
(3) Verdugo Wash near Oakmont Country Club. The channel cross sec-tion in this reach of Verdugo Wash was trapezoidal with 1.50-horizontal to1.0-vertical side slopes and a bottom width of 43 feet. The concrete wasnoted to be of poor quality with a rough finish. The invert grade was 0.02608.Two methods were used to determine the roughness coefficient. The first wasto measure the discharge using a pitot tube. Using the area and mean velocityfrom this measurement, an n of 0.0116 was computed. The second method con-sisted of measuring the depth of flow at the crest of a debris basin spillwaylocated a short distance upstream of the study reach at the same time depthreadings were made from staff gages located at three sections on the channel.The spillway was operating as an ogee during the test. Discharges over thespillway were computed using the weir equation Q = CLH15 where a c of3.58 was assumed. Three tests were made with discharges of 1,580 cfs,1,930 cfs, and 2,432 cfs with corresponding n values of 0.0126, 0.0148, and0.0151, respectively.
(4) Ballona Creek near Thurman Avenue. The Ballona Creek Channel atthis location has a rectangular cross section with a 60-foot width and an in-vert slope of 0.00124. No comments as to the condition of the concrete at thetime of the test were given. Staff gages were located at seven sections oneach side of the channel. Five complete sets of readings of the staff gageswere made. The discharge remained practically constant during this period,and the mean of all the readings was computed to give the depth at each crosssection which was then plotted to form a water-surface profile. Dischargemeasurements were made from a pitot tube. From this information, an n valueof 0.013 was estimated for a discharge of 5,400 cfs.
(5) Ballona Creek below Hauser Boulevard. The Ballona Creek Channelbelow Hauser Boulevard has a rectangular cross section with a width of38.7 feet and an invert slope of 0.00357. No comments as to the condition ofthe concrete at the time of the test are given. Six staff gages were placedat six channel sections. The uniformity of the staff gage readings indicatedthat a true normal depth had been reached. The discharge was determined bycorrelating the staff gage readings with the discharge measurements at ThurmanAvenue. For a discharge of 5,620 cfs and a depth of 7.36 feet, an n valueof 0.0137 was computed.
b. Tujunga Wash Test. In December 1966, water was released from HansenDam into the Tujunga Wash Channel for the specific purposes of determining theManning's roughness coefficient n . The reach of Tujunga Wash used for thistest is rectangular in cross section with widths varying from 60 to 70 feetand wall heights varying from 10 to 15 feet. The invert slope is 0.0094 andthe design discharge is 22,000 cfs. The walls were formed by using 3.25-inchtongue-and-groove lumber and the invert was finished with wooden floats. Atthe time of the test, the condition of the concrete was very good. A constant
A3
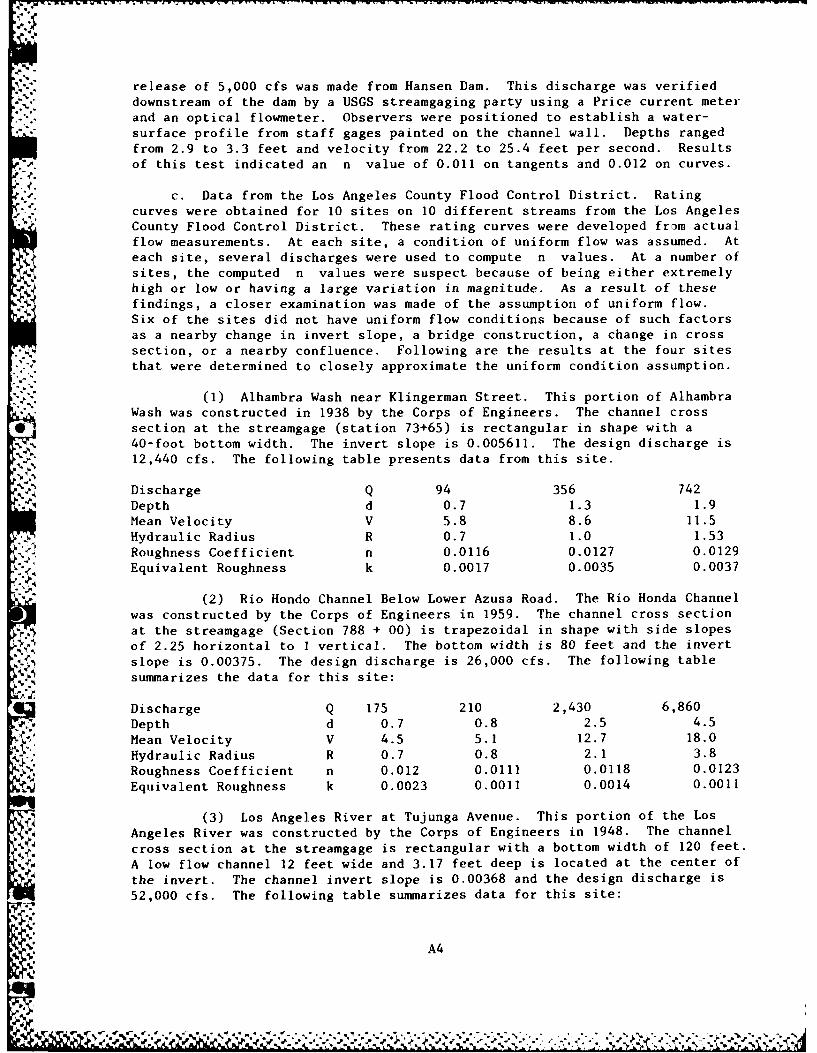
release of 5,000 cfs was made from Hansen Dam. This discharge was verifieddownstream of the dam by a USGS streamgaging party using a Price current meter
- . and an optical flowmeter. Observers were positioned to establish a water-
-surface profile from staff gages painted on the channel wall. Depths rangedfrom 2.9 to 3.3 feet and velocity from 22.2 to 25.4 feet per second. Resultsof this test indicated an n value of 0.011 on tangents and 0.012 on curves.
c. Data from the Los Angeles County Flood Control District. Ratingcurves were obtained for 10 sites on 10 different streams from the Los AngelesCounty Flood Control District. These rating curves were developed from actual
flow measurements. At each site, a condition of uniform flow was assumed. Ateach site, several discharges were used to compute n values. At a number of
sites, the computed n values were suspect because of being either extremelyhigh or low or having a large variation in magnitude. As a result of these
findings, a closer examination was made of the assumption of uniform flow.Six of the sites did not have uniform flow conditions because of such factorsas a nearby change in invert slope, a bridge construction, a change in crosssection, or a nearby confluence. Following are the results at the four sites
that were determined to closely approximate the uniform condition assumption.
Wash (1) Alhambra Wash near Klingerman Street. This portion of AlhambraWash was constructed in 1938 by the Corps of Engineers. The channel cross
0 section at the streamgage (station 73+65) is rectangular in shape with a
40-foot bottom width. The invert slope is 0.005611. The design discharge is12,440 cfs. The following table presents data from this site.
Discharge Q 94 356 742
Depth d 0.7 1.3 1.9Mean Velocity V 5.8 8.6 11.5
Hydraulic Radius R 0.7 1.0 1.53
Roughness Coefficient n 0.0116 0.0127 0.0129
Equivalent Roughness k 0.0017 0.0035 0.0037
(2) Rio Hondo Channel Below Lower Azusa Road. The Rio Honda Channelwas constructed by the Corps of Engineers in 1959. The channel cross section
at the streamgage (Section 788 + 00) is trapezoidal in shape with side slopesof 2.25 horizontal to 1 vertical. The bottom width is 80 feet and the invert
slope is 0.00375. The design discharge is 26,000 cfs. The following table
summarizes the data for this site:
Discharge Q 175 210 2,430 6,860
Depth d 0.7 0.8 2.5 4.5
Mean Velocity V 4.5 5.1 12.7 18.0
Hydraulic Radius R 0.7 0.8 2.1 3.8
Roughness Coefficient n 0.012 0.0111 0.0118 0.0123
Equivalent Roughness k 0.0023 0.0011 0.0014 0.0011
(3) Los Angeles River at Tujunga Avenue. This portion of the Los
Angeles River was constructed by the Corps of Engineers in 1948. The channel
cross section at the streamgage is rectangular with a bottom width of 120 feet.
A low flow channel 12 feet wide and 3.17 feet deep is located at the center of
the invert. The channel invert slope is 0.00368 and the design discharge is
52,000 cfs. The following table summarizes data for this site:
A4
-- m-
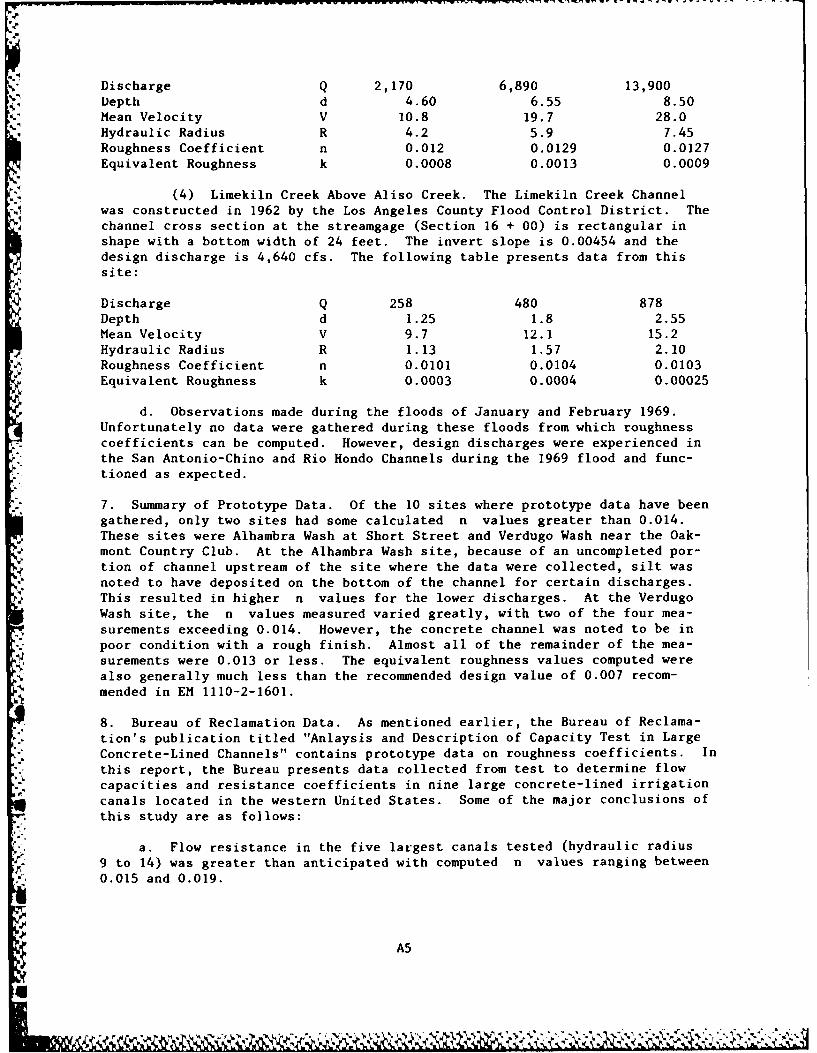
Discharge Q 2,170 6,890 13,900Depth d 4.60 6.55 8.50Mean Velocity V 10.8 19.7 28.0Hydraulic Radius R 4.2 5.9 7.45Roughness Coefficient n 0.012 0.0129 0.0127Equivalent Roughness k 0.0008 0.0013 0.0009
(4) Limekiln Creek Above Aliso Creek. The Limekiln Creek Channelwas constructed in 1962 by the Los Angeles County Flood Control District. Thechannel cross section at the streamgage (Section 16 + 00) is rectangular inshape with a bottom width of 24 feet. The invert slope is 0.00454 and thedesign discharge is 4,640 cfs. The following table presents data from thissite:
Discharge Q 258 480 878Depth d 1.25 1.8 2.55Mean Velocity V 9.7 12.1 15.2Hydraulic Radius R 1.13 1.57 2.10Roughness Coefficient n 0.0101 0.0104 0.0103Equivalent Roughness k 0.0003 0.0004 0.00025
d. Observations made during the floods of January and February 1969.Unfortunately no data were gathered during these floods from which roughnesscoefficients can be computed. However, design discharges were experienced inthe San Antonio-Chino and Rio Hondo Channels during the 1969 flood and func-
*- tioned as expected.
7. Summary of Prototype Data. Of the 10 sites where prototype data have beengathered, only two sites had some calculated n values greater than 0.014.These sites were Alhambra Wash at Short Street and Verdugo Wash near the Oak-mont Country Club. At the Alhambra Wash site, because of an uncompleted por-tion of channel upstream of the site where the data were collected, silt wasnoted to have deposited on the bottom of the channel for certain discharges.This resulted in higher n values for the lower discharges. At the VerdugoWash site, the n values measured varied greatly, with two of the four mea-surements exceeding 0.014. However, the concrete channel was noted to be in
- poor condition with a rough finish. Almost all of the remainder of the mea-surements were 0.013 or less. The equivalent roughness values computed werealso generally much less than the recommended design value of 0.007 recom-mended in EM 1110-2-1601.
8. Bureau of Reclamation Data. As mentioned earlier, the Bureau of Reclama-tion's publication titled "Anlaysis and Description of Capacity Test in LargeConcrete-Lined Channels" contains prototype data on roughness coefficients. Inthis report, the Bureau presents data collected from test to determine flowcapacities and resistance coefficients in nine large concrete-lined irrigationcanals located in the western United States. Some of the major conclusions ofthis study are as follows:
a. Flow resistance in the five largest canals tested (hydraulic radius9 to 14) was greater than anticipated with computed n values ranging between0.015 and 0.019.
A
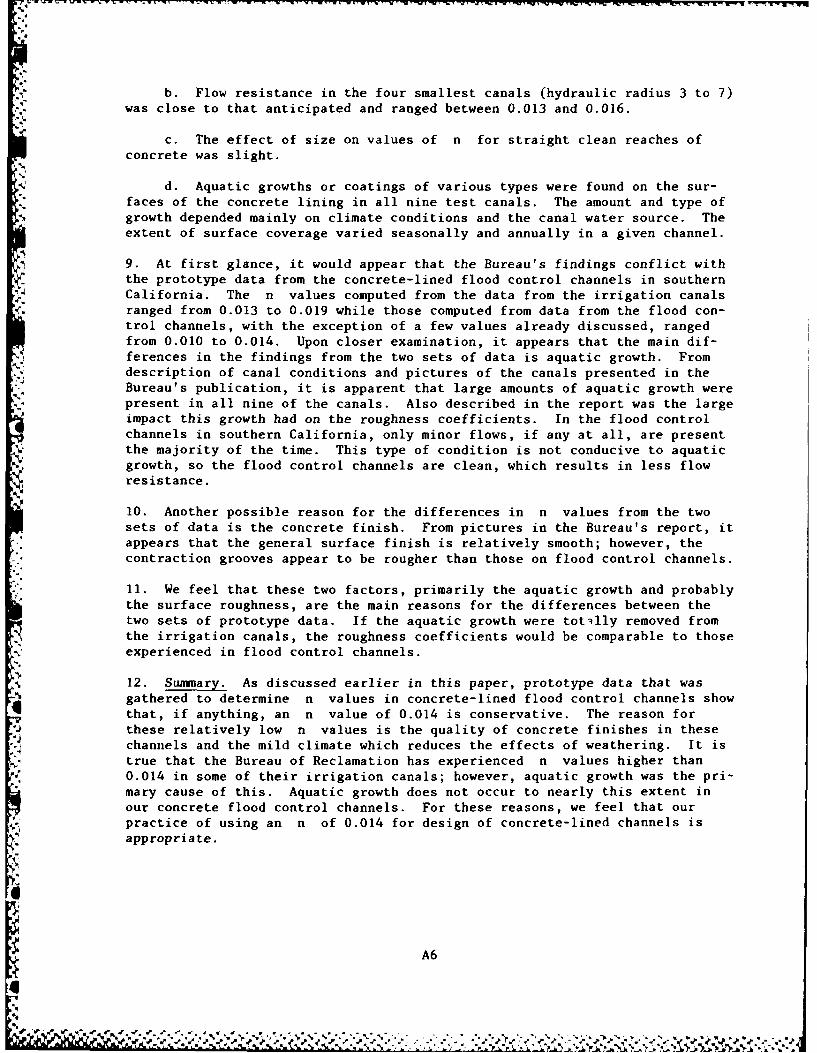
b. Flow resistance in the four smallest canals (hydraulic radius 3 to 7)was close to that anticipated and ranged between 0.013 and 0.016.
c. The effect of size on values of n for straight clean reaches ofconcrete was slight.
d. Aquatic growths or coatings of various types were found on the sur-faces of the concrete lining in all nine test canals. The amount and type ofgrowth depended mainly on climate conditions and the canal water source. Theextent of surface coverage varied seasonally and annually in a given channel.
9. At first glance, it would appear that the Bureau's findings conflict withthe prototype data from the concrete-lined flood control channels in southernCalifornia. The n values computed from the data from the irrigation canalsranged from 0.013 to 0.019 while those computed from data from the flood con-trol channels, with the exception of a few values already discussed, rangedfrom 0.010 to 0.014. Upon closer examination, it appears that the main dif-ferences in the findings from the two sets of data is aquatic growth. Fromdescription of canal conditions and pictures of the canals presented in theBureau's publication, it is apparent that large amounts of aquatic growth werepresent in all nine of the canals. Also described in the report was the largeimpact this growth had on the roughness coefficients. In the flood controlchannels in southern California, only minor flows, if any at all, are presentthe majority of the time. This type of condition is not conducive to aquaticgrowth, so the flood control channels are clean, which results in less flowresistance.
10. Another possible reason for the differences in n values from the twosets of data is the concrete finish. From pictures in the Bureau's report, itappears that the general surface finish is relatively smooth; however, thecontraction grooves appear to be rougher than those on flood control channels.
11. We feel that these two factors, primarily the aquatic growth and probablythe surface roughness, are the main reasons for the differences between thetwo sets of prototype data. If the aquatic growth were totally removed fromthe irrigation canals, the roughness coefficients would be comparable to thoseexperienced in flood control channels.
12. Summary. As discussed earlier in this paper, prototype data that wasgathered to determine n values in concrete-lined flood control channels showthat, if anything, an n value of 0.014 is conservative. The reason forthese relatively low n values is the quality of concrete finishes in thesechannels and the mild climate which reduces the effects of weathering. It istrue that the Bureau of Reclamation has experienced n values higher than0.014 in some of their irrigation canals; however, aquatic growth was the pri-mary cause of this. Aquatic growth does not occur to nearly this extent inour concrete flood control channels. For these reasons, we feel that ourpractice of using an n of 0.014 for design of concrete-lined channels isappropriate.
A6
tA6
S31 W rZSnS r.a.~nwr.anrt.~. K S fl ~n a,! C pr a -' w, Sr ~fl XJ W7i~
I
-1
0~
IA,
)
a.
V.V.
a...
44.
~ %A%'~ V *~%~ % ~%.p-. ~