Embed Size (px)
Citation preview
© 2017 The Authors. Open Access chapter published by World Scientific Publishing Company and distributed under the terms of the Creative Commons Attribution Non-Commercial (CC BY-NC) 4.0 License.
Codon bias among synonymous rare variants is associated with Alzheimer’s disease imaging biomarker
Jason E. Miller1, Manu K. Shivakumar1, Shannon L. Risacher2, Andrew J. Saykin2, Seunggeun Lee3, Kwangsik Nho2*, Dokyoon Kim1, 4*, for the Alzheimer’s Disease Neuroimaging Initiative (ADNI)**
1Biomedical and Translational Informatics Institute, Geisinger Health System, Danville, PA, USA
2Department of Radiology and Imaging Sciences, Indiana University School of Medicine, Indianapolis, IN, USA
3Department of Biostatistics, University of Michigan, Ann Arbor, MI, USA
4Huck Institute of the Life Sciences, Pennsylvania State University, University Park, PA, USA
*Corresponding Author
Alzheimer’s disease (AD) is a neurodegenerative disorder with few biomarkers even though it impacts a relatively large portion of the population and is predicted to affect significantly more individuals in the future. Neuroimaging has been used in concert with genetic information to improve our understanding in relation to how AD arises and how it can be potentially diagnosed. Additionally, evidence suggests synonymous variants can have a functional impact on gene regulatory mechanisms, including those related to AD. Some synonymous codons are preferred over others leading to a codon bias. The bias can arise with respect to codons that are more or less frequently used in the genome. A bias can also result from optimal and non-optimal codons, which have stronger and weaker codon anti-codon interactions, respectively. Although association tests have been utilized before to identify genes associated with AD, it remains unclear how codon bias plays a role and if it can improve rare variant analysis. In this work, rare variants from whole-genome sequencing from the Alzheimer’s Disease Neuroimaging Initiative (ADNI) cohort were binned into genes using BioBin. An association analysis of the genes with AD-related neuroimaging biomarker was performed using SKAT-O. While using all synonymous variants we did not identify any genome-wide significant associations, using only synonymous variants that affected codon frequency we identified several genes as significantly associated with the imaging phenotype. Additionally, significant associations were found using only rare variants that contains an optimal codon in among minor alleles and a non-optimal codon in the major allele. These results suggest that codon bias may play a role in AD and that it can be used to improve detection power in rare variant association analysis.
Keywords: Alzheimer’s disease; neuroimaging; codon bias; synonymous variant; BioBin; SKAT-O; rare variant analysis.
Pacific Symposium on Biocomputing 2018
365
1. Introduction
Rare and low-frequency variants have a significant influence on the heritability of disease. Rare variants are often spurious; thus, it can be difficult to run an association test on an individual locus because it will be underpowered [1]. In order to overcome this issue, rare variants can be grouped or “binned” together based on prior biological knowledge related to the genetic etiology of the disease [2-4]. For instance, rare variants can be binned into genes, pathways, intergenic, conserved regions, or any other defined region of the genome [3, 5]. This strategy has several strengths: first it increases the detection power by aggregating association signals in the variants in the bin; secondly, it reduces the multiple testing burden by not testing every variant, thus increasing the power to detect a significant association. In addition to binning by a specific region, filtering for a specific type of variant, such as non-synonymous changes, have important benefits in addition to reducing the testing burden by focusing the association on variants that are more likely to influence the phenotype and provide easier interpretation of the results [6].
Synonymous mutations represent a change in the coding sequencing at the nucleotide level without changing the amino acid sequence. Since multiple codons code for the same amino acid, the genetic code is called “degenerate”. It is likely that these characteristics of the genome is partially responsible for leading investigators to the assumption that synonymous mutations and variants have little to no impact on the protein, and are thus often dubbed “silent” without further investigation. However, it has been shown that different organisms prefer some codons over others and codon usage can also vary between genes in the same organism, suggesting there has been evolutionary pressure to optimize synonymous codons [7, 8]. Further investigation has demonstrated the many gene regulatory mechanisms by which codon bias can impart its affects such as splicing, RNA secondary structure, and translation [9, 10]. Moreover, synonymous variants have been implicated in a number of diseases including neurological, immune, cancer, blood-related, heart, and others [9]. The synonymous variants associated with these diseases are attributed to multiple mechanisms, therefore it will be important to study multiple forms of codon bias.
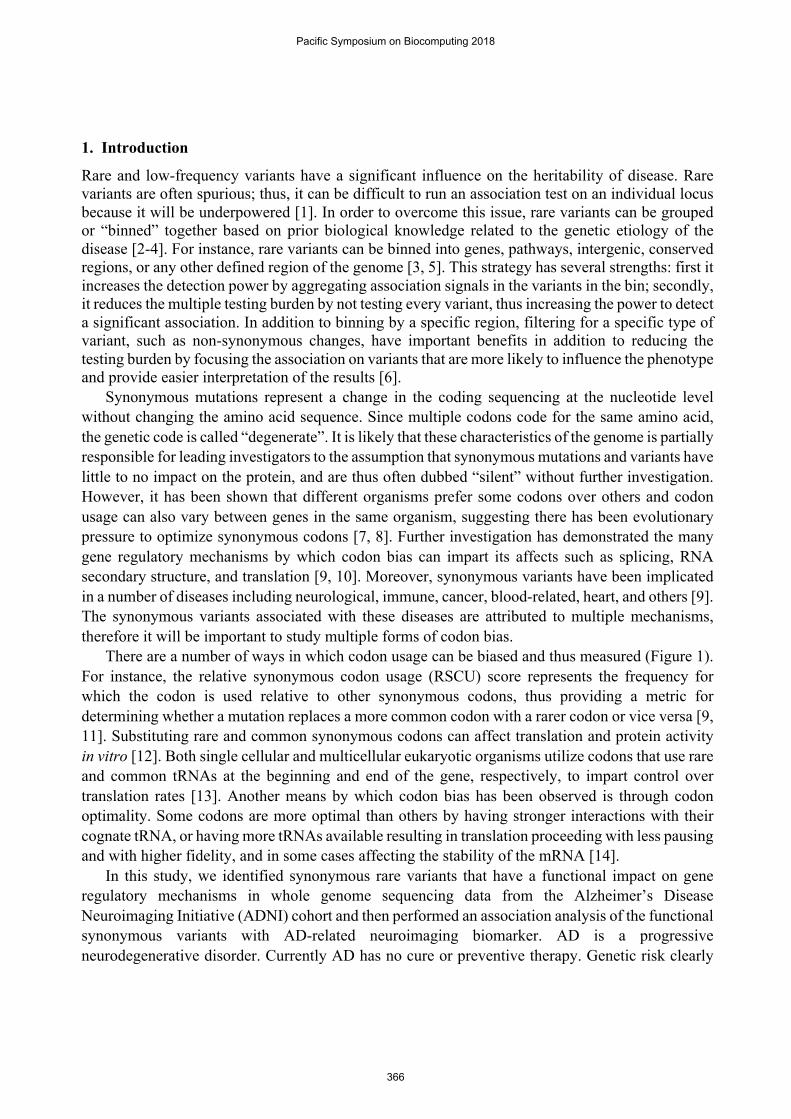
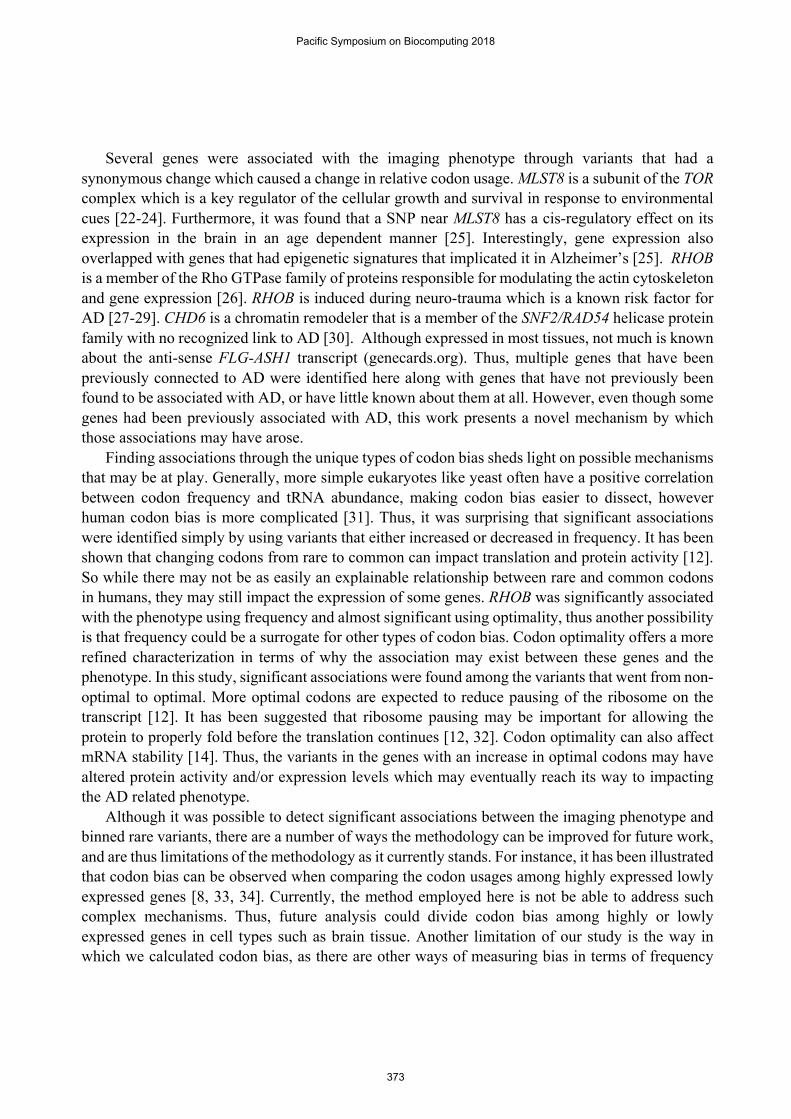
There are a number of ways in which codon usage can be biased and thus measured (Figure 1). For instance, the relative synonymous codon usage (RSCU) score represents the frequency for which the codon is used relative to other synonymous codons, thus providing a metric for determining whether a mutation replaces a more common codon with a rarer codon or vice versa [9, 11]. Substituting rare and common synonymous codons can affect translation and protein activity in vitro [12]. Both single cellular and multicellular eukaryotic organisms utilize codons that use rare and common tRNAs at the beginning and end of the gene, respectively, to impart control over translation rates [13]. Another means by which codon bias has been observed is through codon optimality. Some codons are more optimal than others by having stronger interactions with their cognate tRNA, or having more tRNAs available resulting in translation proceeding with less pausing and with higher fidelity, and in some cases affecting the stability of the mRNA [14].
In this study, we identified synonymous rare variants that have a functional impact on gene regulatory mechanisms in whole genome sequencing data from the Alzheimer’s Disease Neuroimaging Initiative (ADNI) cohort and then performed an association analysis of the functional synonymous variants with AD-related neuroimaging biomarker. AD is a progressive neurodegenerative disorder. Currently AD has no cure or preventive therapy. Genetic risk clearly
Pacific Symposium on Biocomputing 2018
366
plays an important role in AD and neuroimaging has been used in concert with genetic information to improve our understanding in relation to how AD arises and how it can be potentially diagnosed.
Fig. 1. Codon bias effects translation of mRNA. When the ribosome translates the mRNA, it will come into contact with both common, rare, optimal (O), and/or non-optimal codons (NO). After the ribosome starts translating (top), it may come into contact with a common or optimal codon. These codons are likely to lead to the ribosome continuing on the mRNA. Rare codons or non-optimal codons (bottom figure) may lead to the ribosome pausing or slowing down, possibly to allow for the protein to fold correctly.
2. Methods
2.1. Study sample
Data (whole genome sequencing and MRI imaging) used in this study were obtained from the ADNI database (http://adni.loni.usc.edu/). Samples were collected as described previously [6]. There was a total of 750 non-Hispanic Caucasian participants (425 were male and 325 female). The average age and years of education was 73.1 +/- 7.0 and 16.1 +/- 2.8 years, respectively.
2.2. Neuroimaging analysis
Pre-processed baseline 1.5T and 3T MRI scans were downloaded from the ADNI and T1-weighted brain MRI scans were processed using previously described automated MRI analysis technique, FreeSurfer software, which was used to extract mean bilateral entorhinal cortical thickness and total intracranial volume (ICV) [15]. Mean entorhinal cortical thickness, AD-related neuroimaging biomarker, was used as endophenotype for the association analysis.
2.3. Variant annotation
750 ADNI non-Hispanic Caucasian participants with baseline MRI scans and whole-genome sequencing (WGS) were used in this study. The VCFs containing the genomic information for
Pacific Symposium on Biocomputing 2018
367
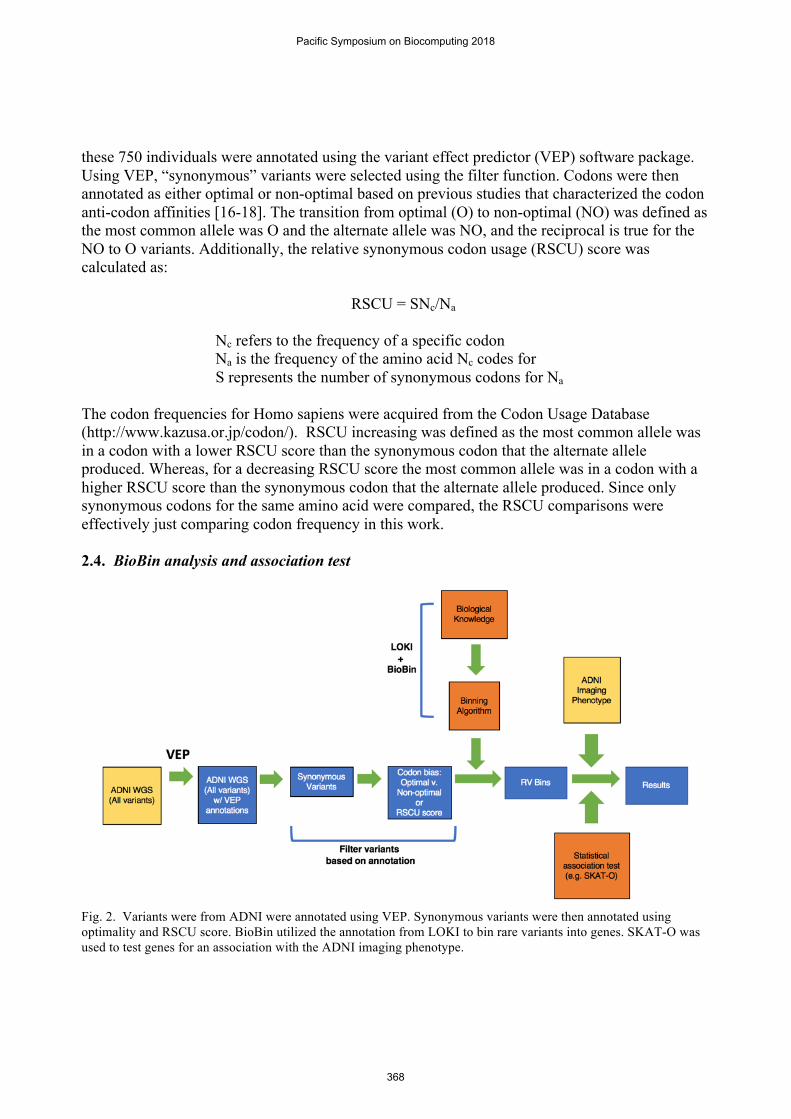
these 750 individuals were annotated using the variant effect predictor (VEP) software package. Using VEP, “synonymous” variants were selected using the filter function. Codons were then annotated as either optimal or non-optimal based on previous studies that characterized the codon anti-codon affinities [16-18]. The transition from optimal (O) to non-optimal (NO) was defined as the most common allele was O and the alternate allele was NO, and the reciprocal is true for the NO to O variants. Additionally, the relative synonymous codon usage (RSCU) score was calculated as:
RSCU = SNc/Na Nc refers to the frequency of a specific codon Na is the frequency of the amino acid Nc codes for S represents the number of synonymous codons for Na
The codon frequencies for Homo sapiens were acquired from the Codon Usage Database (http://www.kazusa.or.jp/codon/). RSCU increasing was defined as the most common allele was in a codon with a lower RSCU score than the synonymous codon that the alternate allele produced. Whereas, for a decreasing RSCU score the most common allele was in a codon with a higher RSCU score than the synonymous codon that the alternate allele produced. Since only synonymous codons for the same amino acid were compared, the RSCU comparisons were effectively just comparing codon frequency in this work.
2.4. BioBin analysis and association test
Fig. 2. Variants were from ADNI were annotated using VEP. Synonymous variants were then annotated using optimality and RSCU score. BioBin utilized the annotation from LOKI to bin rare variants into genes. SKAT-O was used to test genes for an association with the ADNI imaging phenotype.
Pacific Symposium on Biocomputing 2018
368
BioBin was employed to group variants together by genic region [2-5]. BioBin uses gene annotations from LOKI (the library of knowledge integration), which contains information from several databases including but not limited to NCBI Entrez, UCSC Genome Browser, and Kyoto Encyclopedia of Genes and Genomes (KEGG). Only rare variants with minor allele frequency (MAF) less than 0.01 were binned and Madsen & Browning weighting was applied as previously described [5]. Association tests were performed using SKAT-O [19], adjusting for age, gender, years of education, intracranial volume (ICV) and MRI field strength as covariates. Although neuroimaging MRI scans from all ADNI participants included in the analysis were obtained from multiple sites, all sites followed the same ADNI MRI protocol and each raw scan was processed using a FreeSurfer pipeline at the Indiana University. Thus, the site was not included as a covariate since there is likely to be little site effects if any. The advantage of using SKAT-O is that it can utilize both dispersion or burden tests in order to detect a significant association [19]. P-values were adjusted for multiple tests using the p.adjust function in R, using the “FDR” method [20].
3. Results
Variants that represent a synonymous alteration were identified using VEP. The rare (MAF < 0.01) synonymous variants were then binned based on the genes they were located in, using BioBin (Figure 2). Each gene was required to have at least five variants across the cohort to be included in the analysis. Setting a minimum bin size establishes a more stringent threshold for finding an association. Additionally, by having fewer bins, there will be fewer tests performed, thus increasing the power to detect a significant association. previous studies have utilized a threshold when attempting to identify significant associations between genes and phenotypes of interest [21]. An association test was then performed between the genes and the imaging phenotype (entorhinal cortical thickness) using SKAT-O and corrected for multiple testing. When using all synonymous variants, there were no genes that reached genome-wide significance (FDR < 5%) nor were there any suggestive of being significant (FDR < 10%) (Table. 1).
Table 1: Top 5 associations for all synonymous variants (11,236 genes total)
Gene # of Loci p-value Corrected p-value
RHOB 4 1.14E-05 0.121
TMEM201 9 2.15E-05 0.121
MLST8 8 6.02E-05 0.212
MOB3B 4 7.56E-05 0.212
DTL 13 1.24E-04 0.278 However, using only synonymous variants with decreasing RSCU scores or increasing RSCU
scores, we identified two (MLST8 and RHOB) and six genes (FLG2, CHD6, CD244, FLG-AS1, SERPINB5, and GTF3C1) as significantly associated with entorhinal cortical thickness after multiple testing adjustment, respectively (Table 2 and Table 3). There are also two genes that were suggestive of being significant (Table 3). In addition, we performed a detailed unbiased whole-
Pacific Symposium on Biocomputing 2018
369
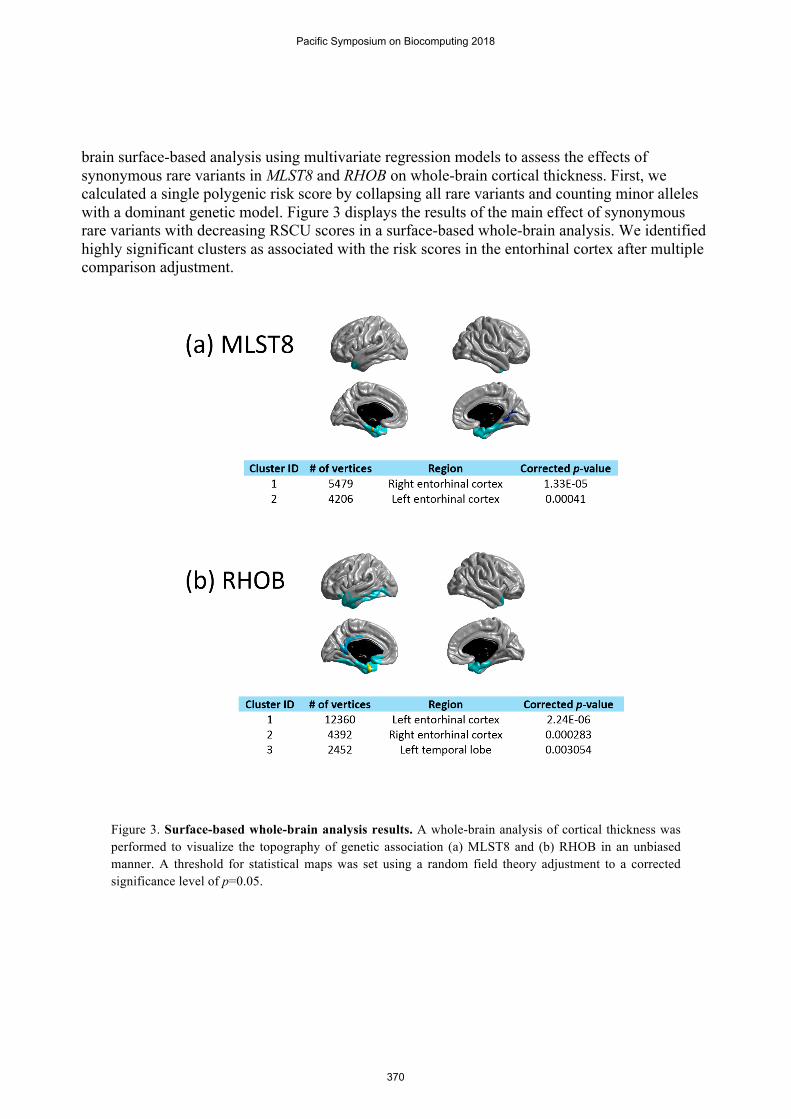
brain surface-based analysis using multivariate regression models to assess the effects of synonymous rare variants in MLST8 and RHOB on whole-brain cortical thickness. First, we calculated a single polygenic risk score by collapsing all rare variants and counting minor alleles with a dominant genetic model. Figure 3 displays the results of the main effect of synonymous rare variants with decreasing RSCU scores in a surface-based whole-brain analysis. We identified highly significant clusters as associated with the risk scores in the entorhinal cortex after multiple comparison adjustment.
Figure 3. Surface-based whole-brain analysis results. A whole-brain analysis of cortical thickness was performed to visualize the topography of genetic association (a) MLST8 and (b) RHOB in an unbiased manner. A threshold for statistical maps was set using a random field theory adjustment to a corrected significance level of p=0.05.
Pacific Symposium on Biocomputing 2018
370
In addition, synonymous variants were separated into variants that introduce a non-optimal
codon (O to NO) and those which introduce an optimal codon (NO to O). The results from each association analysis are represented in tables 4 and 5. Although no genes met genome-wide significance using the O to NO variants, the NO to O rare variants in five genes (DTL, FLG2, SERPINB5, FLG-AS1, and ZNF599) were significantly associated with entorhinal cortical thickness after multiple comparison adjustment (FDR < 5%).
Table 2: Top 5 associations for synonymous variants with decreasing RSCU scores (8,066 genes total)
Gene # of Loci p-value Corrected p-value
MLST8 6 4.10E-06 0.033
RHOB 4 1.14E-05 0.046
TRMT44 3 5.12E-05 0.122
RCC2 4 6.79E-05 0.122
MOB3B 4 7.56E-05 0.122
Table 3: Top associations for synonymous variants with increasing RSCU scores (4774 genes total)
Gene # of Loci p-value Corrected p-value
FLG2 9 2.52E-05 0.039
CHD6 6 2.63E-05 0.039
CD244 2 3.48E-05 0.039
FLG-AS1 10 3.95E-05 0.039
SERPINB5 3 4.10E-05 0.039
GTF3C1 3 5.60E-05 0.045
GABRG1 2 1.07E-04 0.073
SRP72 4 1.39E-04 0.083
Pacific Symposium on Biocomputing 2018
371
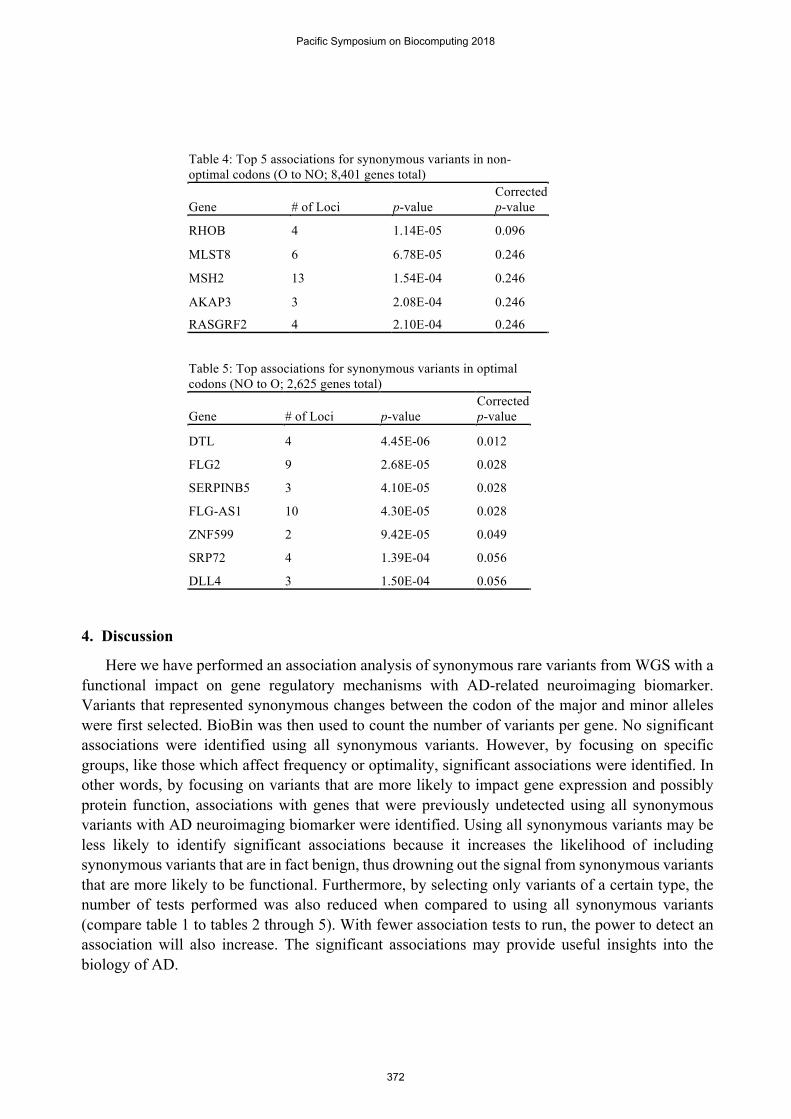
Table 4: Top 5 associations for synonymous variants in non-optimal codons (O to NO; 8,401 genes total)
Gene # of Loci p-value Corrected p-value
RHOB 4 1.14E-05 0.096
MLST8 6 6.78E-05 0.246
MSH2 13 1.54E-04 0.246
AKAP3 3 2.08E-04 0.246
RASGRF2 4 2.10E-04 0.246
Table 5: Top associations for synonymous variants in optimal codons (NO to O; 2,625 genes total)
Gene # of Loci p-value Corrected p-value
DTL 4 4.45E-06 0.012
FLG2 9 2.68E-05 0.028
SERPINB5 3 4.10E-05 0.028
FLG-AS1 10 4.30E-05 0.028
ZNF599 2 9.42E-05 0.049
SRP72 4 1.39E-04 0.056
DLL4 3 1.50E-04 0.056
4. Discussion
Here we have performed an association analysis of synonymous rare variants from WGS with a functional impact on gene regulatory mechanisms with AD-related neuroimaging biomarker. Variants that represented synonymous changes between the codon of the major and minor alleles were first selected. BioBin was then used to count the number of variants per gene. No significant associations were identified using all synonymous variants. However, by focusing on specific groups, like those which affect frequency or optimality, significant associations were identified. In other words, by focusing on variants that are more likely to impact gene expression and possibly protein function, associations with genes that were previously undetected using all synonymous variants with AD neuroimaging biomarker were identified. Using all synonymous variants may be less likely to identify significant associations because it increases the likelihood of including synonymous variants that are in fact benign, thus drowning out the signal from synonymous variants that are more likely to be functional. Furthermore, by selecting only variants of a certain type, the number of tests performed was also reduced when compared to using all synonymous variants (compare table 1 to tables 2 through 5). With fewer association tests to run, the power to detect an association will also increase. The significant associations may provide useful insights into the biology of AD.
Pacific Symposium on Biocomputing 2018
372
Several genes were associated with the imaging phenotype through variants that had a synonymous change which caused a change in relative codon usage. MLST8 is a subunit of the TOR complex which is a key regulator of the cellular growth and survival in response to environmental cues [22-24]. Furthermore, it was found that a SNP near MLST8 has a cis-regulatory effect on its expression in the brain in an age dependent manner [25]. Interestingly, gene expression also overlapped with genes that had epigenetic signatures that implicated it in Alzheimer’s [25]. RHOB is a member of the Rho GTPase family of proteins responsible for modulating the actin cytoskeleton and gene expression [26]. RHOB is induced during neuro-trauma which is a known risk factor for AD [27-29]. CHD6 is a chromatin remodeler that is a member of the SNF2/RAD54 helicase protein family with no recognized link to AD [30]. Although expressed in most tissues, not much is known about the anti-sense FLG-ASH1 transcript (genecards.org). Thus, multiple genes that have been previously connected to AD were identified here along with genes that have not previously been found to be associated with AD, or have little known about them at all. However, even though some genes had been previously associated with AD, this work presents a novel mechanism by which those associations may have arose.
Finding associations through the unique types of codon bias sheds light on possible mechanisms that may be at play. Generally, more simple eukaryotes like yeast often have a positive correlation between codon frequency and tRNA abundance, making codon bias easier to dissect, however human codon bias is more complicated [31]. Thus, it was surprising that significant associations were identified simply by using variants that either increased or decreased in frequency. It has been shown that changing codons from rare to common can impact translation and protein activity [12]. So while there may not be as easily an explainable relationship between rare and common codons in humans, they may still impact the expression of some genes. RHOB was significantly associated with the phenotype using frequency and almost significant using optimality, thus another possibility is that frequency could be a surrogate for other types of codon bias. Codon optimality offers a more refined characterization in terms of why the association may exist between these genes and the phenotype. In this study, significant associations were found among the variants that went from non-optimal to optimal. More optimal codons are expected to reduce pausing of the ribosome on the transcript [12]. It has been suggested that ribosome pausing may be important for allowing the protein to properly fold before the translation continues [12, 32]. Codon optimality can also affect mRNA stability [14]. Thus, the variants in the genes with an increase in optimal codons may have altered protein activity and/or expression levels which may eventually reach its way to impacting the AD related phenotype.
Although it was possible to detect significant associations between the imaging phenotype and binned rare variants, there are a number of ways the methodology can be improved for future work, and are thus limitations of the methodology as it currently stands. For instance, it has been illustrated that codon bias can be observed when comparing the codon usages among highly expressed lowly expressed genes [8, 33, 34]. Currently, the method employed here is not be able to address such complex mechanisms. Thus, future analysis could divide codon bias among highly or lowly expressed genes in cell types such as brain tissue. Another limitation of our study is the way in which we calculated codon bias, as there are other ways of measuring bias in terms of frequency
Pacific Symposium on Biocomputing 2018
373
and optimality [31, 35], so these calculations should also be tested for their ability to improve signal strength in a rare variant association test for future work. It will be important for follow-up association tests to replicate these findings to illustrate that the results and conclusions are robust. Of course, another limitation is that without experimental follow up studies it cannot be suggested that these variants are causal. Thus, functional validation would be incredibly valuable to measure empirically how codon bias mediates the relationship between these genes and the imaging phenotype, AD, and/or neurological diseases in general. Codon bias has also been investigated with respect to cancer, where non-optimal codons mutations were enriched among multiple types of cancers [16]. Furthermore, synonymous variants have been associated with a variety of disease including, but not limited to, blood-related, bone, immune and other neurological disorders [9], suggesting the methods utilized in this work could contribute to our understand of a wide range of diseases. In summary, this work has illustrated variants that contribute to codon bias can be used to increase detection power. Moreover, codon bias is associated with an AD-related neuroimaging biomarker, suggesting synonymous variants can be used to explain the etiology of AD.
Acknowledgments
**Data used in preparation of this article were obtained from the Alzheimer’s Disease Neuroimaging Initiative (ADNI) database (adni.loni.usc.edu). As such, the investigators within the ADNI contributed to the design and implementation of ADNI and/or provided data but did not participate in analysis or writing of this report. A complete listing of ADNI investigators can be found at: http://adni.loni.usc.edu/wp-content/uploads/how_to_apply/ADNI_Acknowledgement_List.pdf
Data collection and sharing for this project was funded by the Alzheimer's Disease Neuroimaging Initiative (ADNI) (National Institutes of Health Grant U01 AG024904) and DOD ADNI (Department of Defense award number W81XWH-12-2-0012). ADNI is funded by the National Institute on Aging, the National Institute of Biomedical Imaging and Bioengineering, and through generous contributions from the following: Alzheimer’s Association; Alzheimer’s Drug Discovery Foundation; BioClinica, Inc.; Biogen Idec Inc.; Bristol-Myers Squibb Company; Eisai Inc.; Elan Pharmaceuticals, Inc.; Eli Lilly and Company; F. Hoffmann-La Roche Ltd and its affiliated company Genentech, Inc.; GE Healthcare; Innogenetics, N.V.; IXICO Ltd.; Janssen Alzheimer Immunotherapy Research & Development, LLC.; Johnson & Johnson Pharmaceutical Research & Development LLC.; Medpace, Inc.; Merck & Co., Inc.; Meso Scale Diagnostics, LLC.; NeuroRx Research; Novartis Pharmaceuticals Corporation; Pfizer Inc.; Piramal Imaging; Servier; Synarc Inc.; and Takeda Pharmaceutical Company. The Canadian Institutes of Health Research is providing funds to support ADNI clinical sites in Canada. Private sector contributions are facilitated by the Foundation for the National Institutes of Health (www.fnih.org). The grantee organization is the Northern California Institute for Research and Education, and the study is coordinated by the Alzheimer's Disease Cooperative Study at the University of California, San Diego. ADNI data are disseminated by the Laboratory for Neuro Imaging at the University of Southern California. Samples from the National Cell Repository for AD (NCRAD), which receives government support under a cooperative agreement grant (U24 AG21886) awarded by the National Institute on Aging (AIG), were used in this study. Funding for the WGS was provided by the Alzheimer’s Association and the Brin Wojcicki Foundation.
Additional support for data analysis was provided by NLM R01 LM012535, NIA R03 AG054936, NIA R01 AG19771, NIA P30 AG10133, NLM R01 LM011360, NSF IIS-1117335, DOD W81XWH-14-2-0151,
Pacific Symposium on Biocomputing 2018
374
NCAA 14132004, NIGMS P50GM115318, NCATS UL1 TR001108, NIA K01 AG049050, the Alzheimer’s Association, the Indiana Clinical and Translational Science Institute, and the IU Health-IU School of Medicine Strategic Neuroscience Research Initiative. This project was also funded, in part, under a grant with the Pennsylvania Department of Health (#SAP 4100070267). The Department specifically disclaims responsibility for any analyses, interpretations or conclusions.
References
1. Lee, S., et al., Rare-variant association analysis: study designs and statistical tests. Am J Hum Genet, 2014. 95(1): p. 5-23.
2. Moore, C.B., et al., BioBin: a bioinformatics tool for automating the binning of rare variants using publicly available biological knowledge. BMC Med Genomics, 2013. 6 Suppl 2: p. S6.
3. Moore, C.B., et al., Using BioBin to explore rare variant population stratification. Pac Symp Biocomput, 2013: p. 332-43.
4. Basile, A.O., et al., Knowledge Driven Binning and Phewas Analysis in Marshfield Personalized Medicine Research Project Using Biobin. Pac Symp Biocomput, 2016. 21: p. 249-60.
5. Moore, C.C., et al., A biologically informed method for detecting rare variant associations. BioData Min, 2016. 9(1): p. 27.
6. Kim, D., et al., Knowledge-driven binning approach for rare variant association analysis: application to neuroimaging biomarkers in Alzheimer's disease. BMC Med Inform Decis Mak, 2017. 17(Suppl 1): p. 61.
7. Grantham, R., et al., Codon catalog usage and the genome hypothesis. Nucleic Acids Res, 1980. 8(1): p. r49-r62.
8. Ikemura, T., Codon usage and tRNA content in unicellular and multicellular organisms. Mol Biol Evol, 1985. 2(1): p. 13-34.
9. Sauna, Z.E. and C. Kimchi-Sarfaty, Understanding the contribution of synonymous mutations to human disease. Nat Rev Genet, 2011. 12(10): p. 683-91.
10. Hunt, R.C., et al., Exposing synonymous mutations. Trends Genet, 2014. 30(7): p. 308-21. 11. Sharp, P.M., T.M. Tuohy, and K.R. Mosurski, Codon usage in yeast: cluster analysis clearly
differentiates highly and lowly expressed genes. Nucleic Acids Res, 1986. 14(13): p. 5125-43.
12. Komar, A.A., T. Lesnik, and C. Reiss, Synonymous codon substitutions affect ribosome traffic and protein folding during in vitro translation. FEBS Lett, 1999. 462(3): p. 387-91.
13. Tuller, T., et al., An evolutionarily conserved mechanism for controlling the efficiency of protein translation. Cell, 2010. 141(2): p. 344-54.
14. Presnyak, V., et al., Codon optimality is a major determinant of mRNA stability. Cell, 2015. 160(6): p. 1111-24.
15. Saykin, A.J., et al., Genetic studies of quantitative MCI and AD phenotypes in ADNI: Progress, opportunities, and plans. Alzheimers Dement, 2015. 11(7): p. 792-814.
16. Wu, X. and G. Li, Prevalent Accumulation of Non-Optimal Codons through Somatic Mutations in Human Cancers. PLoS One, 2016. 11(8): p. e0160463.
17. Watkins, N.E., Jr. and J. SantaLucia, Jr., Nearest-neighbor thermodynamics of deoxyinosine pairs in DNA duplexes. Nucleic Acids Res, 2005. 33(19): p. 6258-67.
Pacific Symposium on Biocomputing 2018
375
18. Frenkel-Morgenstern, M., et al., Genes adopt non-optimal codon usage to generate cell cycle-dependent oscillations in protein levels. Mol Syst Biol, 2012. 8: p. 572.
19. Lee, S., et al., Optimal unified approach for rare-variant association testing with application to small-sample case-control whole-exome sequencing studies. Am J Hum Genet, 2012. 91(2): p. 224-37.
20. Benjamini, Y. and Y. Hochberg, Controlling the False Discovery Rate - a Practical and Powerful Approach to Multiple Testing. Journal of the Royal Statistical Society Series B-Methodological, 1995. 57(1): p. 289-300.
21. Christophersen, I.E., et al., Large-scale analyses of common and rare variants identify 12 new loci associated with atrial fibrillation. Nat Genet, 2017. 49(6): p. 946-952.
22. Loewith, R., et al., Two TOR complexes, only one of which is rapamycin sensitive, have distinct roles in cell growth control. Mol Cell, 2002. 10(3): p. 457-68.
23. Hara, K., et al., Raptor, a binding partner of target of rapamycin (TOR), mediates TOR action. Cell, 2002. 110(2): p. 177-89.
24. Sarbassov, D.D., S.M. Ali, and D.M. Sabatini, Growing roles for the mTOR pathway. Curr Opin Cell Biol, 2005. 17(6): p. 596-603.
25. Lu, A.T., et al., Genetic variants near MLST8 and DHX57 affect the epigenetic age of the cerebellum. Nat Commun, 2016. 7: p. 10561.
26. Hall, A., Rho GTPases and the actin cytoskeleton. Science, 1998. 279(5350): p. 509-14. 27. Brabeck, C., et al., Lesional expression of RhoA and RhoB following traumatic brain injury
in humans. J Neurotrauma, 2004. 21(6): p. 697-706. 28. Conrad, S., et al., Prolonged lesional expression of RhoA and RhoB following spinal cord
injury. J Comp Neurol, 2005. 487(2): p. 166-75. 29. Magnoni, S. and D.L. Brody, New perspectives on amyloid-beta dynamics after acute brain
injury: moving between experimental approaches and studies in the human brain. Arch Neurol, 2010. 67(9): p. 1068-73.
30. Hall, J.A. and P.T. Georgel, CHD proteins: a diverse family with strong ties. Biochem Cell Biol, 2007. 85(4): p. 463-76.
31. Quax, T.E., et al., Codon Bias as a Means to Fine-Tune Gene Expression. Mol Cell, 2015. 59(2): p. 149-61.
32. Bali, V. and Z. Bebok, Decoding mechanisms by which silent codon changes influence protein biogenesis and function. Int J Biochem Cell Biol, 2015. 64: p. 58-74.
33. Ikemura, T., Correlation between the abundance of Escherichia coli transfer RNAs and the occurrence of the respective codons in its protein genes: a proposal for a synonymous codon choice that is optimal for the E. coli translational system. J Mol Biol, 1981. 151(3): p. 389-409.
34. Ikemura, T. and H. Ozeki, Codon usage and transfer RNA contents: organism-specific codon-choice patterns in reference to the isoacceptor contents. Cold Spring Harb Symp Quant Biol, 1983. 47 Pt 2: p. 1087-97.
35. Sharp, P.M. and W.H. Li, The codon Adaptation Index--a measure of directional synonymous codon usage bias, and its potential applications. Nucleic Acids Res, 1987. 15(3): p. 1281-95.
Pacific Symposium on Biocomputing 2018
376