Embed Size (px)
Citation preview
PAPERS
0 INTRODUCTION
Audio reproduction starts and ends with a vibration inair and we perceive it through a hearing mechanism thatwe experience as analog although it is not exclusively ana-log in operation. There has been debate over why an ana-log signal should be stored or transmitted digitally.Arguments in favor include that a digital representationmay be transmitted without loss or interference and can bestored and manipulated in ways that avoid the distortionsintroduced by equivalent analog processes. Analog storageor transmission always introduces distortion and noise thatcannot be removed, and may also threaten the time struc-ture of the sounds through wow or flutter effects. Analogrecordings also tend to degrade with the passage of time.
While badly designed digital coding or poorly executeddigital processing can introduce quite distinctive prob-lems, nowadays the prospect exists for transparent codingand processing—a topic tackled in this paper.
Every generation aims to capture great performancesand to make them available to a wide audience. So thedesigner of a recording system should also consider thenature and quality of the archive. During the recording andplayback stages, the audio properties of the capture andrendering processing are crucial. When it comes to dis-tributing the recording, it is the audio properties of thechannels in the distribution carrier that normally limit thedelivered sound quality.
The Compact Disc (CD) was the first widely availabledigital audio carrier, and over a 20-year period it proved
the effectiveness of an optical disc. A long-term audio-phile criticism of the CD has been that it lacks the resolu-tion to reproduce all the detail in a musical performance.The limitations of the CD’s 44.1-kHz, 16-bit, linear-PCMcoding are understood and covered in this paper.
As digital audio has evolved, the capabilities of thechannels at both ends of the reproducing chain have cometo be superior to those of the CD. High-quality audio prac-tice now recognizes the CD channel as a “bottleneck,” andrecordings are routinely made and sometimes played backusing equipment whose performance potential is consider-ably higher than that of the carrier. These concepts areillustrated in Figs. 1 and 2.
Techniques for maximizing the human auditory poten-tial of the CD channel have also evolved, including psy-choacoustic optimizations [1], subtractive dither [2], in-band noise shaping [3]–[7], buried-data techniques [8], [9]and dither [3], [10]. Some of these will be discussed in thispaper.
Higher resolution audio promises better sound than theCD, and the potential for this has already been demon-strated in carriers that permit a wider frequency response,more channels, and greater dynamic range, such as DVD-Audio or SACD. The development of high-density for-mats based on DVD and its successors force the audiocommunity to make choices on the best way to deliverimproved sound, and open up the intriguing prospect ofdistribution channels that may be transparent to the humanlistener. During the development of any new distributionformat the most important considerations are archive,integrity, resolution, dimensionality, and carrier channelcoding.
J. Audio Eng. Soc., Vol. 52, No. 3, 2004 March 117
Coding for High-Resolution Audio Systems*
J. ROBERT STUART, AES Fellow
Meridian Audio Ltd., Huntingdon, PE29 6EX, UK
What do we mean by high resolution? The recording and replay chain is reviewed from theviewpoints of digital audio engineering and human psychoacoustics. An attempt is made todefine high resolution and to identify the characteristics of a transparent digital audiochannel. The theory and practice of selecting high sample rates such as 96 kHz and wordlengths of up to 24 bit are examined. The relative importance of sampling rate and word sizeat various points in the recording, mastering, transmission, and replay chain is discussed.Encoding methods that can achieve high resolution are examined and compared, and theadvantages of schemes such as lossless coding, noise shaping, oversampling, and matchedpreemphasis with noise shaping are described.
*Manuscript received 2004 January 29.
STUART PAPERS
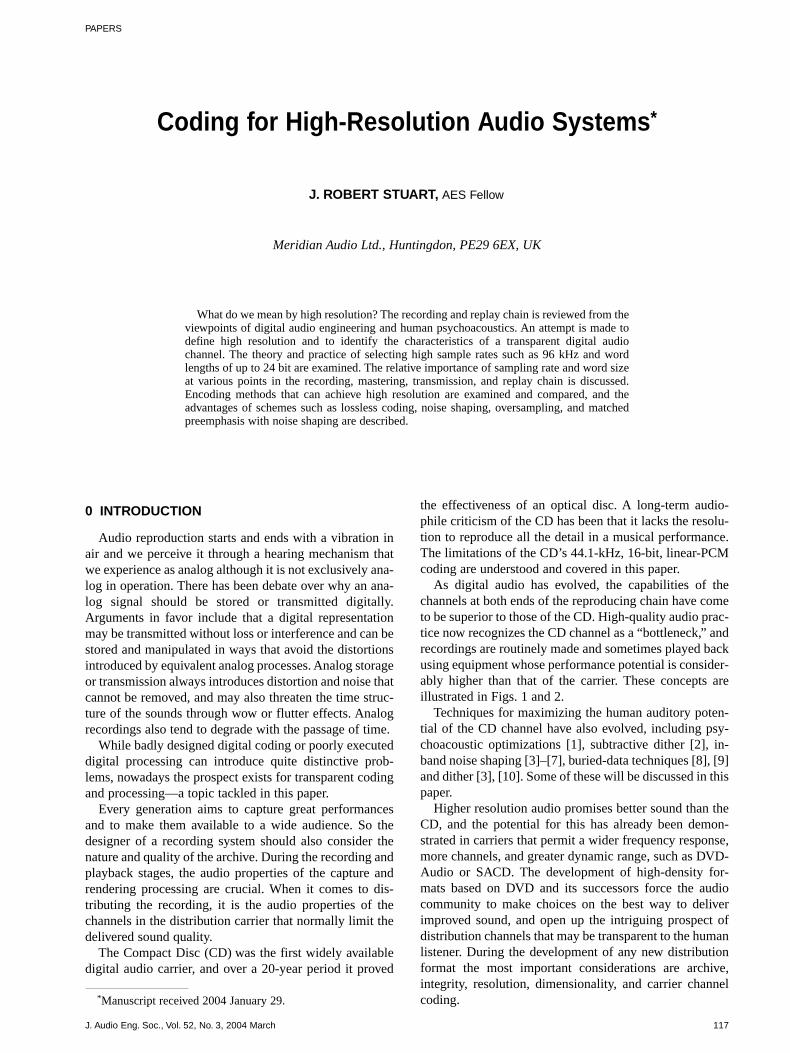
In developing a recording chain we need to consider thecost–benefit at each step in the processes illustrated in Fig. 1.There is one, possibly unique, performance we wish tocapture, and so the penalty for degrading the archive ishigh. The equipment and techniques used in the mixingand mastering stages have a weighting that reflects thenumber of successive processes that may be required toprepare the recording for release. Ideally all processing atthis stage will both be transparent and have a sensiblesafety margin. The trickiest cost–benefit decision appliesto the selection of coding on the release format itself. Hereoverspecification leads to amplified costs in playbackequipment and/or loss of playing time. The replay sectionis the simplest because the user has choices about how toenjoy the recording. In this chain there may be one studio,(hundreds of) millions of players and discs, but only one,unique archive for each performance. These factorsexplain why higher resolution is now routinely used in stu-dios and why audio coding may change throughout thechain, as illustrated in Fig. 2.
1 INFORMED CHOICES
1.1 Bit BudgetsIn the Carrier block of Fig. 1 the signal is in the distri-
bution format. The per-layer capacity of optical discs hassteadily risen from 650 Mbyte on CD to 4.7 Gbyte onDVD, and upward of 30 Gbyte on blue-laser carriers.Despite the increasing capacity of modern optical discs,the choices still need to be made concerning the number ofchannels, the coding to use, or how it should be optimized.
Every distribution channel has a bit budget. In moderncarriers such as DVD there is a tradeoff between datacapacity given to audio, picture elements, video, ROMcontents, and, of course, playing time. For the audio,therefore, the channel designer should avoid oversatisfyingone of the requirements in an unbalanced way. Such as byproviding excessive bandwidth at the expense of precision,playing time, or a reduction in the number of channelsavailable for three-dimensional representation. For exam-ple, the ARA [11] suggested that it was necessary to deliveran audio bandwidth of 26 kHz, with a dynamic rangeequivalent to that of well implemented 20-bit linear PCMchannels. Beyond that point it was felt that further benefitswould not accrue until the sound delivered had, by what-ever means, been rendered fully three-dimensional.
Informed decisions rely on some form of cost–benefitanalysis, but how do we calculate the cost part of the equa-tion if it involves a change in sound quality?
1.2 Models of Human ListeningThe quality of an audio channel can only be finally
judged in its intended use: “conveying meaningful programmaterial to human listeners.” Psychoacoustics can providea bridge between the listener’s impression and the engi-neer’s objective physical understanding. Psychoacousticscan help us to understand the potential consequence to thelistener of imperfect “conveying,” applying a measure toany error arising in the channel.
These channel errors need not be transmission failures,but can take the form of noise, distortion, jitter, wow, flut-ter, and so on. Essentially any change introduced by an
118 J. Audio Eng. Soc., Vol. 52, No. 3, 2004 March
(b)
Fig. 2. Example CD chains. (a) Resolution (word size) is limited by carrier. (b) Higher sampling rates and precision are used in prepa-ration while upsampling and/or resolution enhancement is employed on playback.
Recording(96 kHz24 bit)
Edit(96 kHz32 bit)
Carrier(44.1 kHz
16 bit)
Playback(88.2 kHz
24 bit)
Recording(24 bit)
Edit(24 bit)
Carrier(16 bit)
Playback(20-24 bit)
Fig. 1. Simplified block diagram of a reproducing chain.
ADC Archivechannel
Mix &masteringchannel
Carrier
Replaychannel
DAC
(a)

PAPERS CODING FOR HIGH-RESOLUTION AUDIO SYSTEMS
audio device can be viewed as an added error which maybe isolated in measurement and examined by psychoa-coustic modeling to estimate its impact. A special case isto try to estimate when channel errors are inaudible—inaudible errors imply transparency, and with some high-resolution coding schemes inaudible errors may be anattainable goal.
Psychoacoustic modeling to estimate the significance oferrors can be extremely valuable, but every model or anal-ogy has areas of validity, and the results cannot always beextrapolated. For example, we need to distinguishbetween perception and cognition. Perception refers to the“low-level” behavior of the human auditory system, wherewe are concerned with straightforwardly testable parame-ters such as whether or not a simple stimulus is audible, ordetectable in the presence of another (masker) sound, ordistinguishable from a similar stimulus. The psychoa-coustic literature is full of auditory experiments whichexplore the limits of the human hearing system as areceiver and which, in general, attempt to minimize theimpact of cognition. The study of auditory perception thenis an inquiry to answer the question: “to what extent is theauditory system capable of detecting a stimulus, stimuluschange, or error?”
Sometimes we also need to consider the higher levelprocess of cognition—where sounds take on meaning. Inthe cognitive process we are looking for ways in which thehigher-level process modifies the listener’s ability to dis-criminate more or less than that indicated by the percep-tual model. In the cognitive process we hear “objects”rather than “stimuli,” and mechanisms such as streamingand grouping modify the significance of basic percepts.
Fundamental characteristics of the hearing system arecomplexity and nonlinearity. To the listener, sounds havepitch and loudness rather than frequency and intensity, andthe relationships between these measures are nonlinear.
The existence of a threshold is an extreme example ofnonlinearity, but so is the fact that the detectability orloudness of a stimulus includes elements that are nearby infrequency while components slightly further away cansometimes mask other sounds, making them seem quieteror inaudible.
A direct consequence of such nonlinearities is that toestimate the audible significance of any stimulus, we haveto know its acoustic parameters, including sound intensity.Devices we are characterizing may precede the loud-speaker or volume control, and so we need to know theeffective acoustic gain of the system, and this is defined asthe SPL that could result from a full-scale sine wave sig-nal, that is 0 dBFS.
The author uses auditory modeling to illuminate the dis-cussion in this paper, the background for which is fullyexplained in [7] and [12].
2 ARCHIVE
It is important to maximize the archive potential ofrecordings. In previous generations of recording systemsthe archive pretty much took care of itself, in that it wasnot really possible to consider maintaining an archive con-taining data of significantly higher quality than the releaseformat.
In the early days of the CD the performance potential ofthe originating equipment did not differ much from the CDstandard. In fact it was a while before analog-to-digitalconverters that genuinely matched the channel potential ofthe carrier became widely available. Over the ensuing 20years it has become customary to record and master athigher resolution, dropping to 44.1 kHz 16 bit for therelease format, as illustrated in Fig. 2.
However, as time goes on, the cost of storing digitalaudio data for previously unthinkable periods has fallenrapidly and the format for archiving deserves seriousconsideration.
The Advanced Digital Audio (ADA) conference [13]encouraged identifying the archive “artifact” at an earlystage and developing strategies to retain this for futuregenerations, independent of the release-format recording.While maintaining an archive in more than one form isdifficult and potentially prohibitively expensive, weshould at least bear the possibility in mind. For this reasonthe block “Archive channel” has been isolated in Fig. 1.
As an example, Fig. 3 shows the internal architecture ofthe widely used delta–sigma analog-to-digital converter.
J. Audio Eng. Soc., Vol. 52, No. 3, 2004 March 119
Fig. 3. Block diagram of delta–sigma analog-to-digital converter. A small word-size modulator (between 1 and 8 bit) operates at sig-nificant oversampling, maybe between 128 and 8 times base rate of 44.1 or 48 kHz. Wide (24-bit) linear PCM is developed in adithered decimator, a 1-bit stream is developed in a high-order noise-shaped quantizer (assuming modulator uses more than 1 bit) andmodulator output is labeled Archive.
Sample/hold
Modulator1-8 bits
Decimator
Noise-shaped
quantizer
Analog in PCM out
Archive
1 bit

STUART PAPERS
The earliest analog-to-digital converters tended to bemultibit and to operate at the base sample rate fs.Oversampling delta–sigma structures permit simplifiedantialias filtering and have the potential for higher linearitythrough using a modest word size in the quantizer. In itsmost extreme form the modulator is 1 bit and the convertercan sample at 64 or more times fs. Although popular 10years ago, the single-bit variant has substantial problems ofjitter, “birdies,” noise modulation, and instability that arisebecause the modulator cannot be dithered. Because ofthese problems with 1-bit coding, modern converters havetended to use narrow PCM (4–8 bit) in the modulator [14].Although there is an engineering challenge to attainingperfect differential linearity in a hardware modulator, thefact that it can be dithered correctly means that overall lin-earity is improved and, importantly, errors tend not to becorrelated with the signal. These concepts are explainedwell in Lipshitz and Vanderkooy’s tutorial [15].
It could be argued that even though it has significantproblems as a release or distribution code, the output ofthe modulator is a more appropriate “archive” than eitherthe decimated multibit PCM output or the noise-shapedand quantized single-bit stream.
Of course it simply may not be possible to capture thissignal, either because it is not made available or becausethere is no suitable recording apparatus on hand. In that casewe should capture the processed output which has the mini-mum impact on transparency, for both this process and thosethat follow. This paper will argue that for these reasons thePCM output will be the most dependable alternative.
Although presented in the context of an analog-to-digitalconverter, this argument is valid in every circumstance inwhich, through processing, noise or errors are added to thedigital data. In Fig. 3 the block labeled Decimator is a dig-ital filter that may typically convert a highly oversampled4–8-bit code into a 24-bit PCM stream at 96 or 192 kHz.While it has been thoroughly understood for some timethat dither with a triangular probability distribution func-tion (TPDF) and 2 least-significant bits (LSBs) amplitudecan be used to eliminate all nonlinear distortion from DSPprocesses of this sort [15], it has not always been deployedin single-chip converters or even in some converters soldfor professional use. As a result some PCM systems havebeen exposed to unnecessary criticism. When dither isused to maintain perfect linearity, the archive argumentstill applies because the multibit PCM signal has been fil-tered (removing any high-frequency information abovehalf the output sample rate) and has a slightly degradedsignal-to-noise ratio due to the dithered quantization.However, in contrast, the noise-shaped quantizationprocess that produces the single-bit coding raises the high-frequency noise floor, introduces uncorrectable correlatederrors, and the resulting format is less computationallyconvenient for either archive or processing for mixing,mastering, or playback.
3 DIGITAL AUDIO PROCESSING
Uniform linear multibit PCM is a very powerful methodof encoding analog audio. Provided that both the correct
level of TPDF dither is used in the quantizer, and the signalhas no content above the Nyquist frequency (half the sam-pling rate), then the system has infinite resolution of bothtime and amplitude (see the worked examples in [15]).
The resolution offered in multibit linear PCM is arbi-trarily extendable by selecting higher sampling ratesand/or quantizer word size. Very quiet sounds may bemasked either by nearby noise in the signal or by the sig-nal-independent and (optionally) white-spectrum noiseintroduced by the dithered quantizer. This uncorrelatedadditive noise is benign and is perceived separately by thehuman listener. The noise separates at the cognitive levelas a separate object. If dither is not used, then the errorsare correlated and may be grouped to the signal “object”and modify its sound.
Distortions can be introduced at analog–digital–analoggateways, or in analog peripherals. However, once the sig-nal is captured in a uniformly sampled, uniformly quan-tized digital channel, the bits maintain a precise 2:1 mag-nitude, and the potential for introducing distortion arisesonly in nontrivial signal processing, which increases thenumber of bits representing the data. Within an accumula-tor, or subsequently, this expanded representation of thesignal will become too long and eventually the datarequire truncation. This truncation or requantizationprocess can be made effectively linear by using an appro-priate dither at the input to the quantization step, asdescribed in [15].
When we consider high-resolution workflow (such asillustrated in Figs. 1 and 2), we would hope that extremecare be taken in the design and execution of each nontriv-ial step. In an ideal world, signal processing would be per-formed in an environment that guarantees adequate wordlength for all intermediate steps. This implies a higherinternal precision both to permit correct use of dither ateach stage of processing and to withstand amplified com-putational noise (for example, in recursive structures),with no audible impact on the noise floor inherent in therecording itself.
3.1 Lossless, Lossy, and TransparentProcessing
In the preceding sections the rather difficult term “trans-parent” has been introduced in the context of processing(that is, modifying the signal) and loosely defined as aspecial case of high resolution. Transparency implies thatwhatever the processes, any errors introduced are suchthat the human listener cannot distinguish the input fromthe output. Transparency can be evaluated in listeningtests. Such tests are complex, expensive, and notoriouslydifficult, but for the final analysis there may be no substi-tute. The approach taken here is to assume that errorsthreaten transparency, a methodology introduced in [12],16]–[18]. We try to quantify errors to the degree theyimpact upon dynamic range (the addition of noise or lim-itation of headroom), linearity (the introduction of corre-lated distortions), changes in bandwidth (and thereforetransient response), or temporal inaccuracies such as theintroduction of wow, flutter, or jitter.
It is simpler to start by trying to define transparency in
120 J. Audio Eng. Soc., Vol. 52, No. 3, 2004 March

PAPERS CODING FOR HIGH-RESOLUTION AUDIO SYSTEMS
a digital audio process such as the mixing or carrier blocksin Fig. 1. For the time being we sidestep the question ofhow we would determine transparency at analog-to-digitaland digital-to-analog gateways, although, in fact, the prin-ciples are identical.
A lossless (bit-for-bit accurate) process, such as thatshown in Fig. 4, will obviously be transparent so long astemporal inaccuracies are avoided. As soon as a nontrivialprocess is used, or if the audio coding is changed, as illus-trated in Fig. 2, then the process is lossy and we need away to understand its impact and ultimately to estimatewhether it might be transparent.
Even trickier is to consider processes that clearly modifythe signal in an intended way, such as illustrated in Fig. 5,but where we still want to maintain the concept of trans-parency when applied to the errors in the process itself. Inother words, we would like to know, for example, that afilter we wanted to apply introduced no errors of its own—in effect sounding like a perfect analog filter.
One way to ensure that processing is inherently trans-parent is to carry it out in an environment that has a larger“coding space” than the original signal, that is in whichthe combination of bandwidth and dynamic range offeredby the sample rate and/or word size exceeds that requiredto fully represent the signal.
On the other hand, common forms of lossy coding aimto (significantly) reduce the quantity of data to represent asignal. The less data on the output side, the more aggres-
sive the techniques must be. Lossy bit-rate reductionschemes tend to introduce one or more of these character-istics to the output:
• The noise-floor is not constant (modulation noise ormasked threshold),
• The noise-floor is psychoacoustically shaped (followingeither threshold or masking),
• Errors introduced are correlated with the signal.
4 PRECISION AND DYNAMIC RANGE
4.1 Dynamic Range in Uniform PCM ChannelsFig. 6 shows measurements of the level-dependent dis-
tortion produced in an undithered quantizer. The originalsignal (a 1-kHz sine wave) is attenuated in steps to showthe effect of a fade when an undithered 16-bit quantizer ismeasured using an FFT. The graphs illustrate that at highlevels the quantization error is noiselike, whereas at lowlevels it is highly structured. This distortion is more objec-tionable on lower level signals.1
At the gateway and for nontrivial processes we shouldaim to use appropriate dither at every step. Dithered quan-tization introduces uncorrelated noise, and although this
J. Audio Eng. Soc., Vol. 52, No. 3, 2004 March 121
1To improve the understanding of this quantization effect,some audio examples are available for download at www.meridian-audio.com/w_paper/audio_coding.htm.
Fig. 6. FFT analyses of undithered 16-bit quantizations of 1-kHz tone at �20, �40, �60, �80, and �90 dBFS (top to bottom). Curvesoffset by 25 dB for clarity.
0Hz 5kHz 10kHz 15kHz 20kHz 25kHz
20dB
div
isio
ns
Fig. 5. More invasive “mastering” process.
Re-quantize20EQ 32-
64
Fig. 4. Lossless process.
24
STUART PAPERS
noise builds up with successive processing, it is essentiallybenign.
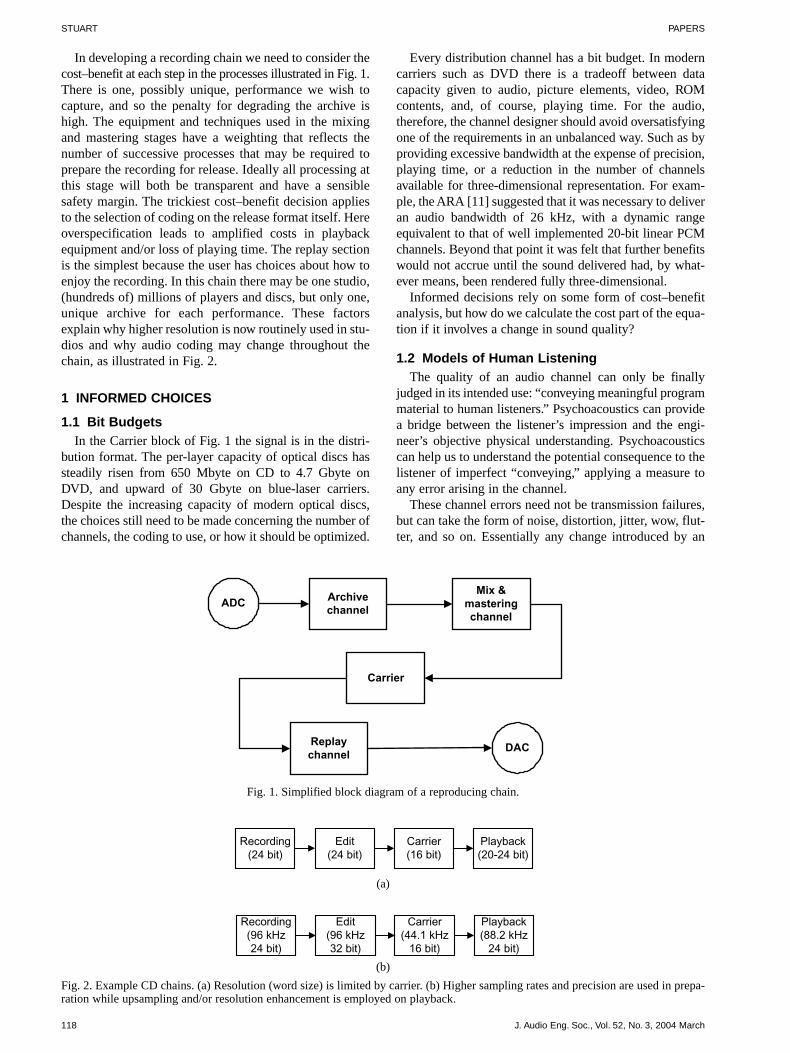
Fig. 7 shows the FFT measurements of a �90-dBFS 1-kHz signal subjected to 16-bit quantization with and with-out dither. In each case the 1 kHz signal appears at aboutthe same level. With dithered quantization a smooth noisespectrum represents the benign sounding “error” in theoperation. Without dither the resulting signal is rich inunwanted odd-harmonic components totaling 27%.Broadly speaking, truncated, rounded, or dithered quanti-zations introduce “errors” of similar power but of very dif-ferent audible consequence.
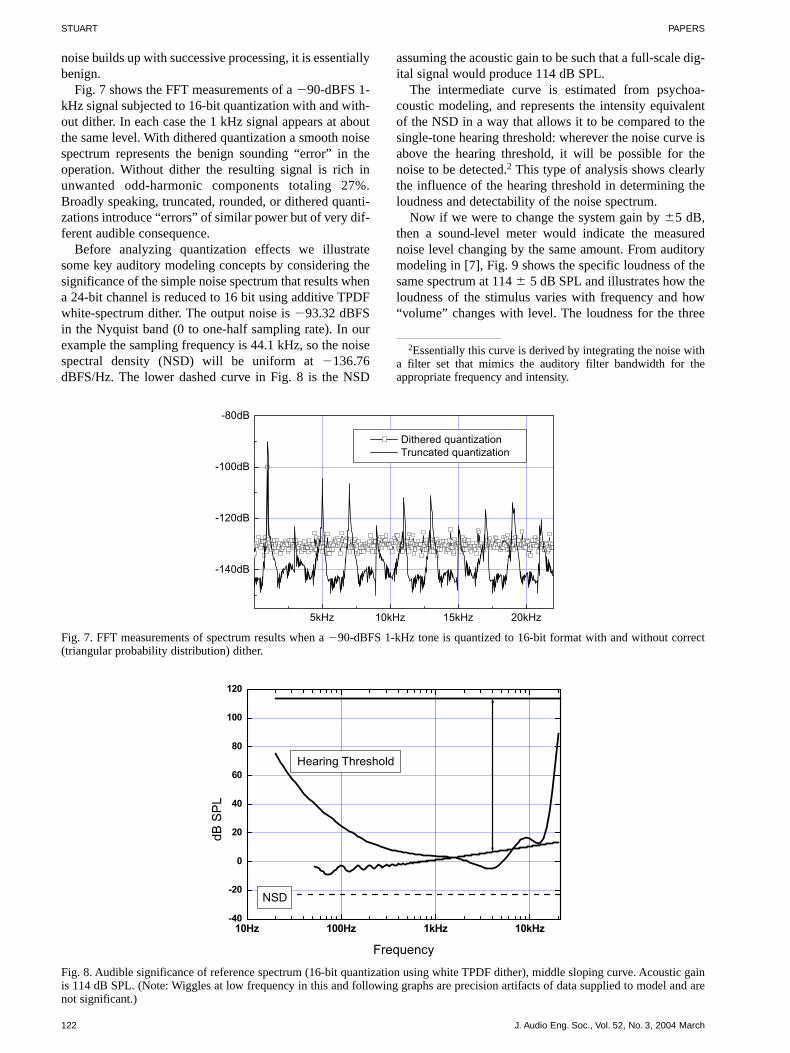
Before analyzing quantization effects we illustratesome key auditory modeling concepts by considering thesignificance of the simple noise spectrum that results whena 24-bit channel is reduced to 16 bit using additive TPDFwhite-spectrum dither. The output noise is �93.32 dBFSin the Nyquist band (0 to one-half sampling rate). In ourexample the sampling frequency is 44.1 kHz, so the noisespectral density (NSD) will be uniform at �136.76dBFS/Hz. The lower dashed curve in Fig. 8 is the NSD
assuming the acoustic gain to be such that a full-scale dig-ital signal would produce 114 dB SPL.
The intermediate curve is estimated from psychoa-coustic modeling, and represents the intensity equivalentof the NSD in a way that allows it to be compared to thesingle-tone hearing threshold: wherever the noise curve isabove the hearing threshold, it will be possible for thenoise to be detected.2 This type of analysis shows clearlythe influence of the hearing threshold in determining theloudness and detectability of the noise spectrum.
Now if we were to change the system gain by �5 dB,then a sound-level meter would indicate the measurednoise level changing by the same amount. From auditorymodeling in [7], Fig. 9 shows the specific loudness of thesame spectrum at 114 � 5 dB SPL and illustrates how theloudness of the stimulus varies with frequency and how“volume” changes with level. The loudness for the three
122 J. Audio Eng. Soc., Vol. 52, No. 3, 2004 March
2Essentially this curve is derived by integrating the noise witha filter set that mimics the auditory filter bandwidth for theappropriate frequency and intensity.
Fig. 8. Audible significance of reference spectrum (16-bit quantization using white TPDF dither), middle sloping curve. Acoustic gainis 114 dB SPL. (Note: Wiggles at low frequency in this and following graphs are precision artifacts of data supplied to model and arenot significant.)
10Hz 100Hz 1kHz 10kHz-40
-20
0
20
40
60
80
100
120
dB S
PL
Frequency
NSD
Hearing Threshold
Fig. 7. FFT measurements of spectrum results when a �90-dBFS 1-kHz tone is quantized to 16-bit format with and without correct(triangular probability distribution) dither.
5kHz 10kHz 15kHz 20kHz
-140dB
-120dB
-100dB
-80dB
Dithered quantization Truncated quantization
PAPERS CODING FOR HIGH-RESOLUTION AUDIO SYSTEMS
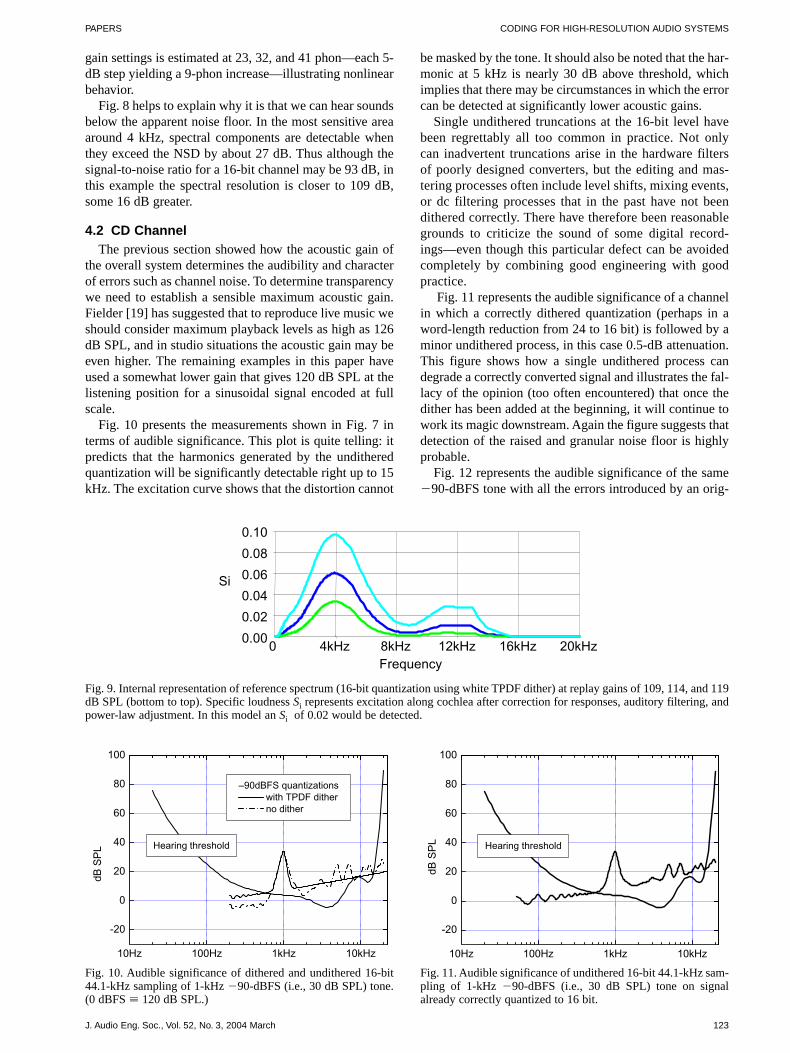
gain settings is estimated at 23, 32, and 41 phon—each 5-dB step yielding a 9-phon increase—illustrating nonlinearbehavior.
Fig. 8 helps to explain why it is that we can hear soundsbelow the apparent noise floor. In the most sensitive areaaround 4 kHz, spectral components are detectable whenthey exceed the NSD by about 27 dB. Thus although thesignal-to-noise ratio for a 16-bit channel may be 93 dB, inthis example the spectral resolution is closer to 109 dB,some 16 dB greater.
4.2 CD Channel The previous section showed how the acoustic gain of
the overall system determines the audibility and characterof errors such as channel noise. To determine transparencywe need to establish a sensible maximum acoustic gain.Fielder [19] has suggested that to reproduce live music weshould consider maximum playback levels as high as 126dB SPL, and in studio situations the acoustic gain may beeven higher. The remaining examples in this paper haveused a somewhat lower gain that gives 120 dB SPL at thelistening position for a sinusoidal signal encoded at fullscale.
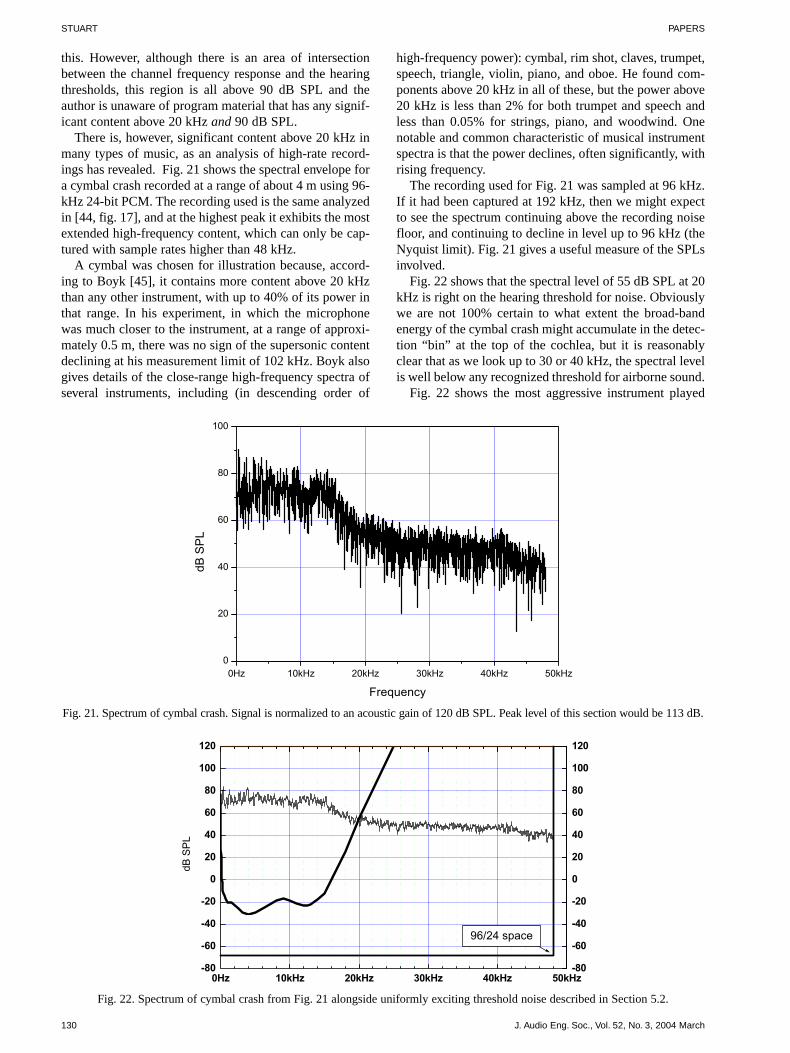
Fig. 10 presents the measurements shown in Fig. 7 interms of audible significance. This plot is quite telling: itpredicts that the harmonics generated by the unditheredquantization will be significantly detectable right up to 15kHz. The excitation curve shows that the distortion cannot
be masked by the tone. It should also be noted that the har-monic at 5 kHz is nearly 30 dB above threshold, whichimplies that there may be circumstances in which the errorcan be detected at significantly lower acoustic gains.
Single undithered truncations at the 16-bit level havebeen regrettably all too common in practice. Not onlycan inadvertent truncations arise in the hardware filtersof poorly designed converters, but the editing and mas-tering processes often include level shifts, mixing events,or dc filtering processes that in the past have not beendithered correctly. There have therefore been reasonablegrounds to criticize the sound of some digital record-ings—even though this particular defect can be avoidedcompletely by combining good engineering with goodpractice.
Fig. 11 represents the audible significance of a channelin which a correctly dithered quantization (perhaps in aword-length reduction from 24 to 16 bit) is followed by aminor undithered process, in this case 0.5-dB attenuation.This figure shows how a single undithered process candegrade a correctly converted signal and illustrates the fal-lacy of the opinion (too often encountered) that once thedither has been added at the beginning, it will continue towork its magic downstream. Again the figure suggests thatdetection of the raised and granular noise floor is highlyprobable.
Fig. 12 represents the audible significance of the same�90-dBFS tone with all the errors introduced by an orig-
J. Audio Eng. Soc., Vol. 52, No. 3, 2004 March 123
Fig. 10. Audible significance of dithered and undithered 16-bit44.1-kHz sampling of 1-kHz �90-dBFS (i.e., 30 dB SPL) tone.(0 dBFS � 120 dB SPL.)
10Hz 100Hz 1kHz 10kHz
-20
0
20
40
60
80
100
dB S
PL
–90dBFS quantizations with TPDF dither no dither
Hearing threshold
Fig. 11. Audible significance of undithered 16-bit 44.1-kHz sam-pling of 1-kHz �90-dBFS (i.e., 30 dB SPL) tone on signalalready correctly quantized to 16 bit.
10Hz 100Hz 1kHz 10kHz
-20
0
20
40
60
80
100
dB S
PL Hearing threshold
Fig. 9. Internal representation of reference spectrum (16-bit quantization using white TPDF dither) at replay gains of 109, 114, and 119dB SPL (bottom to top). Specific loudness Si represents excitation along cochlea after correction for responses, auditory filtering, andpower-law adjustment. In this model an Si of 0.02 would be detected.
Frequency
Si
0.00
0.02
0.04
0.06
0.08
0.10
0 4kHz 8kHz 12kHz 16kHz 20kHz

STUART PAPERS
inal “correct” 16-bit quantization followed by fourundithered signal-processing operations. Four operationsmay be taken as a baseline of bad practice in CD record-ing/replay where flawed mixing and poorly designed con-verters are used. This significance is also put in historicalcontext. The figure includes the audible significance of theplayback noise in a silent LP groove.
This analysis of the dynamic-range capability of the 16-bit 44.1-kHz channel makes it very clear that it cannot beconsidered transparent. Even in the absence of quantiza-tion distortion introduced by defective processing, thebenign noise introduced by quantization and dither isaudible from modest acoustic gains (around 100 dB SPL).Furthermore, undithered quantizations produce distortionsthat are extremely likely to be detectable and are likely tobe unpleasant since they include high- and odd-order har-monics on low-level signals.
4.3 Beyond CDFig. 13 shows the human audible significance of the
noise introduced by a single dithered quantization processin 44.1-kHz 16-, 18-, 20-, 22-, and 24-bit channels along-
side the average hearing threshold. Wherever the noisecurve is above this threshold it will be possible for thechannel noise to be detected. The degree and frequencyrange of the suprathreshold spectrum indicate how it willsound. In the 16-bit example the component of noisebetween 700 Hz and 13 kHz should be audible, whereasaudibility is predicted between 2 and 6 kHz for the 18-bitchannel.
Fig. 13 suggests that the 20-bit channel noise would beinaudible, and indeed it may be sufficient so long as 20-bitrepresentation is used only on a distribution format (as abottleneck). Fig. 14 investigates the suitability of a 20-bitmastering chain. The channel’s basic noise is showntogether with the minimum steady increase in the noisefloor that would take place with two or five dithered oper-ations on the signal. Four stages of subsequent processingreduce the dynamic range by 1 bit; sixteen by 2 bit. Theoperations imagined are minor gain changes or simple fil-tering. However, within mastering or mixing, more inva-sive processes are sometimes used that will require someinternal arithmetic shifts to prevent overload. Provided theprocessor has a wider word size than the incoming signal,
124 J. Audio Eng. Soc., Vol. 52, No. 3, 2004 March
Fig. 13. Audible significance of noise created by single white-spectrum TPDF-dithered quantization in channels using 16, 18, 20, 22,and 24 bit at 44.1 kHz. Audibility has been plotted against average human hearing threshold assuming that a full-scale signal can attain120 dB SPL at the listening position.
10Hz 100Hz 1kHz 10kHz-60
-40
-20
0
20
40
60
80
100
Hearing threshold
24
20
16dB S
PL
Frequency
Fig. 12. Audible significance of four successive undithered 16-bit 44.1-kHz resamplings of 1-kHz, �90-dBFS (i.e., 30 dB SPL) toneon signal already correctly quantized to 16 bit, contrasted with audible significance of noise floor measured on silent LP groove.
-20
0
20
40
60
80
100
dB S
PL
10Hz 100Hz 1kHz 10kHz
LP groove noise
Undithered CD channel Hearing threshold

PAPERS CODING FOR HIGH-RESOLUTION AUDIO SYSTEMS
this need not impact on the noise floor, but it should berecognized that some signal processing may increase thenoise floor more than indicated by these examples.
Fig. 15 shows the effect of one undithered quantizationon a �90-dBFS tone in 16-, 20-, and 24-bit channels. Asthe channel precision is raised, the error becomes lessstructured and the power of the error decreases. We saw inFig. 6 that at higher signal levels, that is, when more LSBsare available to represent the data, the quantization error ismore noiselike.3
There is no excuse for undithered quantizations. Thedesigner of a high-resolution system should have a zero-tolerance policy for this error. Despite the fact that byusing more bits we can show the error to probably beinaudible, nevertheless the errors are correlated with thecontent, the noise floor will vary with the audio, and theseeffects propagate downstream.
Figs. 14 and 15 do, however indicate the wisdom ofusing sample words as large as 24 bit for the capture, mix-ing, and mastering stages shown in Fig. 1. The 24-bit cod-ing gives sensible working headroom for DSP processesand to “forgive” any inadvertent quantization that mayhappen through the workflow. This analysis also suggeststhat if there is a bit-budget decision to be made for the car-rier, then 24 bit is probably excessive to ensure trans-parency—a topic explored in a later section.
4.4 Thresholds and Room NoiseThe analysis so far has considered dynamic range in
the context of the standard hearing threshold describedin [20]–[22]. However, individuals can exhibit some-what different thresholds. The minimum audible fieldhas a standard deviation of approximately 10 dB, asshown in Fig. 16. Individuals can be found whosethresholds are as low as �20 dB SPL at 4 kHz, andalthough the high-frequency-response cutoff rate isalways rapid, some can detect 24 kHz at high intensity.
J. Audio Eng. Soc., Vol. 52, No. 3, 2004 March 125
Fig. 15. Audible significance of one undithered quantization when resampling 1-kHz �90-dBFS (i.e., 30 dB SPL) tone in 24-, 20-, and16-bit channels.
10Hz 100Hz 1kHz 10kHz
-40
-20
0
20
40
60
80
100
Hearing threshold
dB S
PL
Frequency
24 bit
20 bit
16 bit
Fig. 14. Audible significance of noise created by 1, 2, and 5 (bottom to top) successive TPDF-dithered quantizations in 20-bit channel.
10Hz 100Hz 1kHz 10kHz
-20
0
20
40
60
80
100
Hearing threshold
dB S
PL
Frequency
5 processes
3A �90-dBFS signal in a 24-bit channel behaves rather like a�42-dBFS signal quantized to 16 bit.

STUART PAPERS
If low-level sounds turn out to be swamped by noise inthe playback or recording environments, then we mightrisk overspecifying the coding required for transparency.While there may be many noisy recording or replay envi-ronments, there is no shortage of recording environmentswhere the room noise is lower than the hearing threshold.[19], [23], [24].
Home listening rooms vary more in noise level thanrecording venues, but the quietest have noise curves belowthe hearing threshold. In an interesting survey, Fielder[19] found average room noise to be 10–15 dB above thethreshold over the range of 50 Hz to 6 kHz (see Fig. 16).The directional properties of our hearing mean that we canin fact discriminate sounds up to 15 dB below the diffuseroom noise. In listening tests Fielder determined that noiseat a level corresponding to the absolute threshold can bedetected in such rooms [19].
The inevitable conclusion is that we cannot reduce thedynamic-range requirement for transparency on accountof room noise. On the contrary, certain individuals in quiet
rooms may be able to detect the noise floor of a 20-bitchannel.
4.5 Recording NoiseIt is all too easy to consider that dynamic range may be
increased arbitrarily. However, there are some fundamen-tal physical limitations that show up in analog electronics(such as thermal and shot noise) and in the air itself. Thehuman hearing system, in common with that of manymammals, is extremely sensitive. It is thought that onefundamental limit of sensitivity derives from Brownianmotion of molecules within the cochlear fluid around thehair-cell receptors [25]. Such is the efficiency of the outerear that the midrange limit for hearing is also close to thatwhich would reveal the noise of Brownian motion in theair itself.
Fellgett derived the fundamental limit for microphones,based on the detection of thermal noise [26], and thisresult is plotted in Fig. 17 for an omnidirectional micro-phone at 300 K.
126 J. Audio Eng. Soc., Vol. 52, No. 3, 2004 March
Fig. 17. Survey of inherent noise in 96-kHz 24-bit recordings. Once again assuming that a full-scale signal can attain 120 dB SPL atthe listening position, noise spectra are plotted for worst (max), best (min) and average recordings. Thermal-noise limit for an idealomindirectional microphone is included. Also shown are uniformly exciting threshold noise (described in Section 5.2) and codingspaces for both CD and a properly dithered 96-kHz 24-bit channel.
0Hz 10kHz 20kHz 30kHz 40kHz 50kHz-80
-60
-40
-20
0
20
40
60
80
100
120
dB S
PL
-80
-60
-40
-20
0
20
40
60
80
100
120
Average
Thermal limit 96/24
Max
Min16 bit
CD space
Fig. 16. Standard deviation of hearing thresholds (dotted curves), significance of noise from one 20-bit dithered quantization, and spec-tra of average and quiet rooms. (Data from [19].)
10Hz 100Hz 1kHz 10kHz
-40
-20
0
20
40
60
80
100
120
Hearing thresholds
20 bit
dB S
PL
Frequency
Average room Quiet room

PAPERS CODING FOR HIGH-RESOLUTION AUDIO SYSTEMS
In [23] and [19] Cohen and Fielder included useful sur-veys of the self-noise for several microphones. Inherentnoise is less important if the microphone is quite close tothe instrument and multitrack mixing techniques are used,but for recordings made from a normal listening positionit turns out that the microphone is the major limiting fac-tor on the dynamic range—more so if several micro-phones are mixed. Their data showed one microphonewith a noise floor below the human hearing threshold, butother commonly used microphones show midband noise10 dB higher in level than just detectable noise.
Fig. 17 also shows results taken from an analysis of thebackground noise in a selection of twelve high-resolution96-kHz 24-bit recordings. The recordings were chosen torange from reissues mixed from 40-year-old unprocessedanalog tape through to modern digital recordings. Thehighest, lowest, and average noise spectra are shown on adecibels versus linear frequency plot. Also shown are theuniformly exciting noise at threshold (see Section 5.2) andthe coding spaces for both CD and 96-kHz 24-bit chan-nels. Obviously these analyses embody not only themicrophone and room noise of the original venue, but inthe average and higher cases, also analog tape-recordernoise. Even the best analog tape recorder has a noise floorabove that of an ideal 16-bit channel. The curve labeledMin is of a recording made in a Dolby screening roomusing a B&K 4006 microphone. Data for both the roomand the microphone are given in [23], and the analysis ofthe recording is in good agreement. The rise in noise atlower frequencies is due to the room.
In almost all cases the noise has a “pink” characteristic,that is, it declines with increasing frequency, althoughthere are some examples in which the noise floor riseswith frequency. The quietest recording still has an inher-ent noise floor that would be detectable at high listeninggains.
It is worth noticing that the coding space provided by96-kHz 24-bit PCM is not only more than adequate tocontain these recordings, but has arguably excessive pre-cision above 5 kHz when thermal noise is taken intoaccount.
5 FREQUENCY RANGE
Nowadays high-resolution recordings are made withsample rates 1, 2, 4, or even 64 times the “base rates” of44.1 or 48 kHz. Recording and mastering engineers andlisteners tend to much prefer the sound when higher ratessuch as 96 kHz are used. Why? Is it because we really aresensitive to sounds beyond the single-tone threshold? Or isit that by running our systems at higher rates we end upwith fewer problems in the lower frequency ranges?
5.1 Psychoacoustic Data to Support HigherSampling Rates
The frequency response of the outer and middle ear hasa fast cutoff rate due to combined rolloff in the acousticsof the meatus and in mechanical transmission. Thecochlea provides frequency selectivity through a dispersalmechanism or auditory filtering. This filter action has
been extensively studied through air-conducted tests [27]. The cochlea operates top down, and so the first auditory
filter, formed by receptors at the basal end (closest to theeardrum), responds to the highest frequencies. Modelingwith air-conducted stimuli suggests that this highest filter iscentered on approximately 15 kHz, and extrapolation fromknown data suggests that it should have a noise bandwidthof approximately 2 kHz [28], [29]. It is possible that insome ears a stimulus of moderate intensity but of widebandwidth may modify perception or detection in this band,so that the effective noise bandwidth could be wider than 2kHz.4 Middle-ear transmission loss seems to prevent thecochlea from being excited efficiently above 20 kHz, it isalso thought that this region of the cochlea could respond tohigher frequencies; in fact response in the range 28–100kHz has been suggested [30].
There is some merit in the hypothesis that the hair-cellreceptors at the basal end may respond to ultrasonic stim-ulus if it can be made to arrive. Bone-conduction testsusing ultrasonics have shown that supersonic excitationends up in this first “bin.” All information above 15 kHzthat manages to find its way to the cochlea ends up excit-ing this region and will accumulate toward detection.Bone-conducted ultrasound is often perceived with thesame pitch as the highest audible air-conducted frequency(that is it sounds like a tone in the 15–24-kHz region) andthe perceived pitch can be different for each ear.5 There issome speculation that ultrasound may not (only) be trans-duced in the cochlea but by direct action on the brainitself.6
There is a large body of literature relating to the audi-bility of bone-conducted ultrasonic sound. In fact it can beused both to provide speech understanding for the pro-foundly deaf [31] and to mask tinnitus [32]. While bone-conducted ultrasonics can be detected, it should beemphasized that the intensities used or necessary forthreshold detection are often quite high, and in fact, sincethe threshold for perception meets the threshold for pain atthese extreme frequencies, there is risk of permanent dam-age to the cochlea if it is exposed to intense ultrasonicstimulus [33], [34]. There is, however, no evidence that thehuman can perceive these ultrasonic stimuli as soundwhen they arrive on air [35]. In the wider psychoacousticliterature there is little evidence to suggest that it might beimportant to reproduce sounds above 25 kHz.
One set of experiments by Oohashi and coworkers has,however, indicated some measurable brain response (but
J. Audio Eng. Soc., Vol. 52, No. 3, 2004 March 127
4In this context the late Michael Gerzon surmised that any in-air content above 20–25 kHz may derive its significance fromnonlinearity in the hearing transmission, and that combinationsof otherwise inaudible components could be detected throughany resulting in-band intermodulation products. However, musicspectra that have content above 20 kHz tend to exhibit that con-tent at quite low SPL. It is therefore less likely that the (pre-sumed) lower SPL difference distortion products would bedetectable and not masked by the main content.
5Ultrasonic dental equipment can sometimes be heard by thepatient as a loud high-frequency whistle.
6Alternative transduction sites might be distinguished by com-paring the effect of high-frequency filtering on sound which iseither airborne or delivered with headphones.

STUART PAPERS
not auditory response) to program material when the sys-tem frequency response is extended beyond 26 kHz [36],[37].7 In contradiction to Oohashi, Yoshikawa et al. [38]suggest that the superposition of supersonic content(inaudible when played alone) modifies the percept ofsome music.
In Section 1.2 it was pointed out that the human hear-ing system exhibits a number of nonlinearities at boththe perceptual and the cognitive levels. One implicationof a nonlinear system is that linear relationships, suchas the interchangeability of time and frequency, neednot hold; the ear does not perform a perfect Fouriertransform.
It has been suggested that perhaps higher sampling ratesare preferred because, somehow, the human hearing sys-tem will resolve small time differences which might implya wider bandwidth in a linear system. In considering thisit is important to distinguish between perceiving separateevents which are very close together in time (implyingwide bandwidth and fine monaural temporal resolution)and those events which help build the auditory scene, forwhich the relative arrival times are either binaural or wellseparated [39]. In the first case, wider bandwidth isrequired to discriminate acoustic events that are closertogether in time. This seems to be an alternative statementof the problem to determine the maximum bandwidth nec-essary for audible transparency.
For binaural time differences the errors to avoid are dif-ferential dispersion, delay, or time-quantization betweenchannels. If this can be ensured, then the binaural cueswill not be disturbed.
For well separated monaural events it is obviouslyimportant that the time scale be not itself quantized.However, the limit to such resolution is not so much fre-quency response as signal-to-noise ratio. For a perfect
detector the ultimate ability to measure a time interval isnoise, and therefore noise must be minimized in a systemseeking to present fine temporal resolution. The lowestlimit for temporal resolution in human hearing for bothmonaural and binaural events seems to be around 10 µs.[40–43] Obviously 10 µs is less than half the samplinginterval at 44.1 kHz, and at first sight that may give rise toconcern.
In a digital audio system either the sampling rate has tobe sufficiently high to capture the content accurately, or itis necessary to limit the bandwidth of the signal to half thesampling frequency (or less). As pointed out in Section 3and illustrated in [15], provided this bandwidth require-ment is met, and provided TPDF dither is applied at thecorrect level, then the system resolution of both amplitudeand time are limited only by the benign noise floor intro-duced by the dithered quantizer. Events in time can be dis-criminated to within very fine limits, and with a resolutionvery substantially smaller than the sampling period. Thispoint is crucial because provided we treat all channelsidentically to ensure no skew of directional information,there is no direct relationship between the attainable tem-poral resolution and the sampling interval.
No matter which sample rate is selected, there must bea low-pass filter before the quantizer, and all questionscome down to the same point: the bandwidth limitation iseither audible or not.
5.2 What Should the Sampling Rate Be?Up to now we have used an auditory-modeling tech-
nique that transforms noise spectra so they can be graphi-cally compared with tonal errors and the hearing thresholdfor single tones. In [12] the author described an alternativetransform which is more useful when comparing noisespectra directly and when considering coding spaces. Inthis technique the threshold is modeled as a maskingthreshold caused by internal noise.
Fig. 18 shows the auditory threshold transformed intothis uniformly exciting noise at threshold, as described in[12]. The meaning of this curve is that a noise exhibitingthis spectral density will become either undetectable orequally detectable at all frequencies as its level is lowered
128 J. Audio Eng. Soc., Vol. 52, No. 3, 2004 March
7Unfortunately Oohashi’s setup used 1-bit recording, whichmay have introduced high-frequency noise (see Section 7.8). It isunclear whether in his experiments it was necessary for thesupra-26-kHz content to be correlated with the audio-bandinformation to attain a response. Obviously there exists the pos-sibility that some unrelated supersonic stimulus may modify ourcognition.
Fig. 18. Derivation of uniformly exciting noise at threshold (lower curve) and minimum audible field tonal threshold.
10Hz 100Hz 1kHz 10kHz-40
-20
0
20
40
60
80
100
120
140
Uniformly exciting noise at threshold Minimum audible field
dB S
PL

PAPERS CODING FOR HIGH-RESOLUTION AUDIO SYSTEMS
and raised. The threshold NSD curve is an analogy to theinternal noise of the hearing system.
What should the sampling frequency be for transparentsystems? To gain perspective on this question, refer to Fig.19, which replots the auditory threshold on a decibel ver-sus linear frequency Shannon plot. The area bounded bynoise floor, maximum level (headroom), and maximumfrequency in such a plot is a measure of the information ordata capacity of the channel. When the noise floor andheadroom are flat, we call it a “rectangular channel.”
According to Shannon’s theory and to the Gerzon–Cravencriterion for noise shaping [4], it is possible to noise-shapea channel of 11 bit at a sampling rate of 52 kHz to obtaina noise spectrum equal to the uniformly exciting noise atthreshold shown in Fig. 18. This straightforward analy-sis, of course, overlooks the fact that if only 11 bit isused, there will be no opportunity for any processingwhatsoever and no guard band to allow for differencesin system frequency response or between human listen-ers. In a sense the 52-kHz 11-bit combination describesthe minimum PCM channel, using noise shaping, capa-ble of replicating the information used by the ear. This
simple analysis implies that 52 kHz is the minimumdesirable sampling frequency. For comparison, Fig. 19shows the coding space offered by both CD and 96-kHz24-bit coding.
From the information-theory viewpoint the minimumrectangular channel necessary to ensure transparency uses19-bit linear PCM and has a sample rate higher than 52kHz. The dynamic range should be increased according tothe total number of processes taking place before and aftera carrier, and the number of channels feeding into theroom. Since higher sampling rates are advocated andenjoyed, we need to look further to find guidance on theoptimum sample rate.
5.3 High-Frequency Content of MusicFig. 20 illustrates the high-frequency region of a CD
channel. Superficially the average listener would find lit-tle to criticize in the in-band amplitude response. To acutelisteners, a 44.1-kHz sample rate (even with the extremelynarrow transition band shown) means a potential loss ofextreme high frequency (between 20 and 22 kHz), andraising the sampling rate to 48 kHz does a lot to remedy
J. Audio Eng. Soc., Vol. 52, No. 3, 2004 March 129
Fig. 20. Useful upper frequency region of low-rate 16-bit channels. Frequency response at 44.1 and 48 kHz is shown against audiblesignificance of noise floor. Average and acute (lower curve) hearing thresholds are also plotted.
10kHz
-20
0
20
40
60
80
100
120
140
dB S
PL
Hearing thresholds
ADC at 44.1 and 48 kHz
16-bit noise floor
Fig. 19. Shannon space for human hearing and for three channels: CD (44.1 kHz 16 bit), 96 kHz 24 bit, and 52 kHz 11 bit. · · · · noise-spectral density of 18.2-bit channel sampled at 96 kHz.
0Hz 10kHz 20kHz 30kHz 40kHz 50kHz-80
-60
-40
-20
0
20
40
60
80
100
120
52/11 space
96/24 space
CD space
dB S
PL
-80
-60
-40
-20
0
20
40
60
80
100
120
STUART PAPERS
this. However, although there is an area of intersectionbetween the channel frequency response and the hearingthresholds, this region is all above 90 dB SPL and theauthor is unaware of program material that has any signif-icant content above 20 kHz and 90 dB SPL.
There is, however, significant content above 20 kHz inmany types of music, as an analysis of high-rate record-ings has revealed. Fig. 21 shows the spectral envelope fora cymbal crash recorded at a range of about 4 m using 96-kHz 24-bit PCM. The recording used is the same analyzedin [44, fig. 17], and at the highest peak it exhibits the mostextended high-frequency content, which can only be cap-tured with sample rates higher than 48 kHz.
A cymbal was chosen for illustration because, accord-ing to Boyk [45], it contains more content above 20 kHzthan any other instrument, with up to 40% of its power inthat range. In his experiment, in which the microphonewas much closer to the instrument, at a range of approxi-mately 0.5 m, there was no sign of the supersonic contentdeclining at his measurement limit of 102 kHz. Boyk alsogives details of the close-range high-frequency spectra ofseveral instruments, including (in descending order of
high-frequency power): cymbal, rim shot, claves, trumpet,speech, triangle, violin, piano, and oboe. He found com-ponents above 20 kHz in all of these, but the power above20 kHz is less than 2% for both trumpet and speech andless than 0.05% for strings, piano, and woodwind. Onenotable and common characteristic of musical instrumentspectra is that the power declines, often significantly, withrising frequency.
The recording used for Fig. 21 was sampled at 96 kHz.If it had been captured at 192 kHz, then we might expectto see the spectrum continuing above the recording noisefloor, and continuing to decline in level up to 96 kHz (theNyquist limit). Fig. 21 gives a useful measure of the SPLsinvolved.
Fig. 22 shows that the spectral level of 55 dB SPL at 20kHz is right on the hearing threshold for noise. Obviouslywe are not 100% certain to what extent the broad-bandenergy of the cymbal crash might accumulate in the detec-tion “bin” at the top of the cochlea, but it is reasonablyclear that as we look up to 30 or 40 kHz, the spectral levelis well below any recognized threshold for airborne sound.
Fig. 22 shows the most aggressive instrument played
130 J. Audio Eng. Soc., Vol. 52, No. 3, 2004 March
Fig. 22. Spectrum of cymbal crash from Fig. 21 alongside uniformly exciting threshold noise described in Section 5.2.
0Hz 10kHz 20kHz 30kHz 40kHz 50kHz-80
-60
-40
-20
0
20
40
60
80
100
120
96/24 space
dB S
PL
-80
-60
-40
-20
0
20
40
60
80
100
120
Fig. 21. Spectrum of cymbal crash. Signal is normalized to an acoustic gain of 120 dB SPL. Peak level of this section would be 113 dB.
0Hz 10kHz 20kHz 30kHz 40kHz 50kHz0
20
40
60
80
100
dB S
PL
Frequency

PAPERS CODING FOR HIGH-RESOLUTION AUDIO SYSTEMS
back at a high level. If the gain were reduced or if we wereto analyze other instruments, we would see this supersoniccontent well below where we understand the threshold tobe. We will return to this point in Section 7.
Even though some musical instruments produce soundsabove 20 kHz, it does not necessarily follow that a trans-parent system needs to reproduce them. What matters iswhether or not the means used to reduce the bandwidthcan be detected by the human listener.
5.4 Time-Response ConsiderationsEven though we cannot strongly argue on the basis of
standard psychoacoustics that a system needs to reproducesounds above 20 kHz, experience shows, and anecdotalevidence suggests that higher sample rates “sound better.”Typical observations are that with higher sampling rates thesound is clearer, smoother, has improved low-frequencydefinition, and is more “natural.” In the author’s experiencehigher sample rates can lead to better foreground/back-ground discrimination. “Objects” are better separated fromthe acoustic and therefore sound clearer and more “com-plete.” This is an indicator that complex percept changespermit clearer grouping at the cognitive level.
Significantly, many of the listening experiences inwhich a preference has been shown for higher samplingrates have involved somewhat band-limited material,loudspeakers without significant supersonic response, andeven listeners with a self-declared lack of acuity at veryhigh frequencies. It therefore seems probable that weshould concentrate our attention on the methods used tolimit the bandwidth, rather than spending too much timeconsidering the rapidly diminishing potential for programcontent above 20 kHz.
A distinct feature of established PCM practice is thetype of antialias and anti-image filters used for analog-to-digital, digital-to-analog and sample-rate conversion.Particularly at low sample rates, the guard band between
20 kHz and the Nyquist limit (fs/2 � 22.05 kHz in the caseof the CD) is narrow. To avoid audible aliasing products itis crucial that above fs/2 the response be extremely low.Chasing “blameless” specifications has tended to encour-age designs with tight in-band flatness limits (such as lessthan 0.01-dB ripple) and to be no more than 0.1 dB downat 20 kHz. The commonly used filter that meets this spec-ification is the linear-phase brick-wall filter, which has asymmetrical impulse response such as those shown in Fig.23. For efficient implementation in silicon a half-band fil-ter is often used, although it can be less effective at avoid-ing aliasing or image components.
Although such filters have excellent measured response,they are nevertheless a relatively new item for audio andhave no equivalent in the analog world. Analog filters donot have preresponse, and human hearing produces muchless premasking (backward masking) than postmasking(forward masking). There is legitimate concern that the pre-ringing of such filters may not be masked and that indeedthis artifact may be unexpectedly easy to detect.
There are other concerns with these digital filters,including the subtle effects of ripple in the in-bandresponse and, quite important, the fact that so many ofthese filters (in chip converters, for example) have notbeen correctly dithered.
We must discriminate between the result of the filtering(genuine listener response to audio content above, forexample, 20 kHz in air), aliasing, or imaging effectscaused by a combination of high-frequency content andless than adequate stopband attenuation, and any sideeffects that the filtering method itself may introduce, suchas preresponses, ripple, or even nonlinearity.
Fig. 20 indicates a typical frequency response for ananalog-to-digital converter. While the stopband attenua-tion of 80–100 dB seems impressive, if we invert thiscurve, we can see that a detectable in-band alias productmay be generated by signals in the transition region
J. Audio Eng. Soc., Vol. 52, No. 3, 2004 March 131
Fig. 23. Impulse response for typical brick-wall linear-phase filter. Responses are shown for 44.1 and 96 kHz. Note that scale is linear,and in fact response extends much longer backward and forward in time. Note also that at higher sample rate the energy is containedwithin a shorter period.
-150µs -100µs -50µs 0µs 50µs 100µs 150µs
0
1
44.1 kHz (upper)96 kHz (lower)
Imp
uls
e re
spo
nse
Time

STUART PAPERS
between 23 and 28 kHz, which are 20 dB below full scale.If, however, the sampling rate is 96 kHz, then componentsthat alias need to be above 48 kHz and are much less likelyto arise because sufficient stopband attenuation is simplerto achieve with an octave separation.
It is possible that higher sample rates are preferredbecause the impulse response of the filters is narrower andthe margin between 20 kHz and the Nyquist frequency isso much larger that aliasing can be avoided.
The trend to higher sampling rates seems to haveinvolved apparatus and integrated circuits that operate athigher rates but otherwise identically to established prac-tice at 44.1 or 48 kHz. Higher sample rates do open up theopportunity for a complete review of the best way todesign antialias and anti-image filters. At higher samplerates we could roll off the response more gently some-where above 20 kHz and, possibly substantially, improvethe sound of the channel. For this reason an investigationinto more appropriate filters was undertaken and isdescribed by Craven elsewhere in this issue [46]. A classof apodized filters has been developed that exhibits mini-mal preresponse and which have the fascinating propertyof removing the negative effects of more conventional lin-ear-phase filters elsewhere in the chain.8
Fig. 24 compares the impulse response of an apodizedfilter designed for use at 192 kHz with a fifth-order 40-kHz analog Butterworth filter. The Butterworth filtershows a better transient performance than we expectfrom analog tape recorders, but is typical of the filtersrequired to limit the ultrasonic noise arising in eitheroversampling digital-to-analog converters or oversam-pled channel-coding systems using between 1 and 8 bit(see Sections 7.4 and 7.7). The apodized filter also hasan excellent transient response, and since the onlyremaining concern about PCM systems relates to tran-sient performance, it seems very likely that a high-reso-lution chain including one of these filters will be free ofthis problem and can perform better than an analog sys-tem in every respect. It is very clear that if preresponsesare significant, then the apodized filter is radically better
than the almost universally used brick-wall filter illus-trated in Fig. 23.
6 REPLAY CHANNEL
The section marked Replay in Fig. 1 is sometimesignored, yet decisions made about coding in earlier stagescan have a marked effect on both the performance and theimplementation complexity of this phase. All too often itis imagined that data from a disc (carrier) are passed to adigital-to-analog converter and that is assumed to be theend of it. In fact, today’s replay systems can be verysophisticated and need to cope with a number of differentinputs (not just one particular playback channel). There isincreasing interest in surround material, and if the userdoes not possess full-range surround loudspeakers thensome form of bass management will be required. Bassmanagement typically collects low frequencies from inputchannels, combines them with any specific low-frequencyenergy input from the source, and, after suitable protectionor limiting, distributes the low-frequency energy amongthose loudspeakers capable of reproducing it. A genericschematic for bass management is shown in Fig. 25.
Bass management involves filtering, gain changes,additions, and even protection processing. Each of thesesteps results in an increase in the word size representingthe data. Periodically within the processing or at the end,the data need to be quantized to a workable size and, justas in the mastering stages, correct dither must be applied.Such processing is inherently multibit, which is why play-ers designed to play back 1-bit code (such as SACD) rou-tinely convert to PCM before undertaking this process.
Bass management is not the only process used to opti-mize replay. Modern high-performance systems may alsooffer room-acoustic correction, loudspeaker equalization,loudspeaker mapping algorithms (to better match theincoming signals to the loudspeaker array), user tone con-trols, time-alignment, and so on.
In order for these processes to retain high resolution ortransparency (as defined in Section 3.1) they need to becarried out in a coding space that exceeds the original sig-nal. This requirement is most readily satisfied by a PCMrepresentation of the waveform having a sufficient number
132 J. Audio Eng. Soc., Vol. 52, No. 3, 2004 March
8Recently such filters have been deployed in mastering DVD-Audio titles, and initial reactions are very positive.
Fig. 24. Impulse response for fifth-order 40-kHz Butterworth filter (– – –) compared with apodized design intended for use at 192 kHz.
0µs 100µs
-0.4
-0.2
0.0
0.2
0.4
0.6
0.8
Am
plit
ud
e (li
nea
r sc
ale)
Time
Butterworth 5th order –3dB@40 kHz Apodized filter for use at 192 kHz

PAPERS CODING FOR HIGH-RESOLUTION AUDIO SYSTEMS
of bits, say 22–24, and these processes should take placein a rectangular channel (that is, not one that uses noiseshaping). In the author’s opinion the requirements forhigh-performance replay can be no less stringent thanthose for processing during mixing or mastering.
Since it is obviously a higher performance option tokeep the signal in the digital domain until the last possiblemoment, the ideal replay channel should accept the digitalsignal from the carrier and postpone conversion to analoguntil the very last stage. For this reason it is a matter ofgreat practical importance that the channel coding used ona carrier be compatible with all other sources that the userwill access. Since CD, digital radio broadcast, DVD, satel-lite, download, lossy coding algorithms, and so on arebased on multibit PCM, it is highly desirable that this cod-ing be used in any new carriers aiming to offer high-reso-lution playback in the modern context.
7 CHANNEL CODING FOR CARRIERS
The previous sections have concentrated on signal pro-cessing used in the development and playback of record-ings and on the overall properties of the chain shown inFig. 1. For high-resolution recordings, ideally, the tech-
niques selected lead to overall transparency even thoughidentical signal representation is not used at every stage.One important section for consideration is the carrieritself. Here there are definite bit-budget tradeoffs betweenthe amount of data and the playing time or room for addi-tional contents. This section explores methods that can beused to reduce the data and data rate on a carrier withoutlosing transparency in the system taken as a whole.
7.1 Lossless CompressionLossless compression or packing of PCM is the preem-
inent method to reduce data size and rate on a carrier.Because the decoded data are identical to the input there isno impact on audio quality; it is perfect by definition. Fig.26 shows the opportunity for carriers that support 24-bitchannels to deliver “master quality.”
Lossless compression can employ predictive algorithms toencode a PCM data stream efficiently while offering bittransparency across the encoder and decoder. Any streamrepresenting coded audio information is in principle com-pressible because audio that conveys meaning to human lis-teners does not continuously occupy the full capacity of acoding channel and has structure that can in part be predicted.
The MLP lossless compression system, which is used
J. Audio Eng. Soc., Vol. 52, No. 3, 2004 March 133
Fig. 26. Direct work flow for carriers support 24-bit coding.
ADC Archive96 kHz 24 bit
Mix channel96 kHz 24 bit
Carrier
Replay96 kHz 24 bit
DAC
24 bit 24 bit
24 bit
24 bit
24 bit
Fig. 25. Typical processing block diagram for bass management in surround system.
low-pass
bass levelprotection
low-pass
Algorithm
left inright incenter inleft surround inright surround in
LFE in
left feed
right side feed
right back feedleft back feed
left side feed
right feedcenter feed
subwoofer feed

STUART PAPERS
for DVD-Audio and DVD-Audio Recordable, is opti-mized for carrier channels to provide reduction in bothdata rate and quantity. The background to MLP isdescribed in detail elsewhere in this issue [44].
On multichannel material a lossless compressor such asMLP can save on average up to 12 bit per sample perchannel. This means that for a certain content a 16-bitchannel could be compressed up to 4:1 whereas a 24-bitchannel could be halved in size. However, lossless com-pression cannot reduce the coded information below therate needed to convey inherent noise in the source, sorecordings with noiselike spectra or that contain high lev-els of background noise (such as those worse than theaverage case in Fig. 17) will compress less.
With high-resolution audio, for good practical reasons,the sample rates have been increased by factors of 2 toinclude 88.2, 96, 176.4, and 192 kHz. Doubling or quad-rupling the data rate to convey less than twice the infor-mation is very inefficient. Lossless compression elegantlycircumvents this problem since unused coding space isreclaimed and the process of packing PCM becomes moreefficient as the sampling rate is increased. MLP automati-cally discovers the word size of the incoming audio, andthe prediction filters adapt to wide-ranging inherent noise.
A mastering engineer may wish to further reduce thedata used on a disc to increase playing time or to includedifferent content. In such cases the audio can first beadjusted using the techniques for word-length reductionthat are described in Sections 7.2 to 7.4 before feeding itto the lossless encoder. Provided the resulting PCM ismultibit (preferably more than 8 bit) then it can be repre-sented with any precision up to 24 bit. The mastering engi-neer can adjust in 1-bit increments and differently acrosschannels (for example, giving higher precision to left, cen-ter, and right compared with a subwoofer or surrounds).Since MLP always delivers a 24-bit word from thedecoder there is no requirement to flag any preprocess.Fig. 27 shows examples of how the playing time on a disccan vary as precision is adjusted.
7.2 Word-Size Reduction The obvious way to reduce the data rate on a carrier is to
reduce either the sample rate or the precision (word size).For transparent transmission of a high-resolution recordingdownsampling is not a serious option. However, properlydithered requantization to reduce the word size is a legiti-mate technique. In Section 4 we saw that while 24-bit repre-sentation is extremely sensible for capture, mixing, master-ing (and playback), such channels can convey substantiallymore precision than is present in the final recording. More tothe point, we saw in Fig. 17 that above 5 kHz, 24-bit chan-nels have more dynamic range capability than the differencebetween the loudest tolerable sound and Brownian motionof the air, that is, absolute fundamental limits.
Consider the examples shown in Fig. 17. The worstexample, shown as Max, has a noise floor that could bereplicated by a properly dithered and appropriately shaped11-bit carrier channel. It is therefore wasteful to representthis with 24 bit if the data space can be put to another use.Even the minimum spectrum in Fig. 17 remains above the
inherent noise of a 16-bit channel—although we wouldnot advocate reducing this recording to 16 bit if the resultis to be transparent.
How far below the noise floor do we have to place aquantization for the result to be inaudible? Auditory mod-eling suggests that adding an uncorrelated noise that ismore than 10 dB below the inherent recording noise willbe inaudible. A useful rule of thumb would be that highresolution could be maintained so long as the channel pro-vided 2 bit more resolution than that implied by the self-noise of the recording within the audible range. To take theexamples shown in Fig. 17, space could be conserved byusing channels between 14 and 18 bit.
7.3 In-Band Noise-Shaping It is possible to exploit the frequency-dependent hear-
ing threshold by shaping the quantization and dither sothat the resulting noise floor is less audible. This subjecthas been covered extensively in [3]–[7] and [10].
Fig. 28 shows how an in-band (44.1-kHz sampling rate)noise shaper can allow a 16-bit transmission channel to havea subjective noise floor more equivalent to a 20-bit “simple”channel. If such a channel is to be useful, the resolution ofthe links in the chain before and after the noise-shaped chan-nel must exceed the maximum resolution targeted. (In thisexample at least 20-bit resolution would be required.)
The error-shaping technique, when combined withTPDF dither, ensures linearity and gives the potential tonot impact on the input noise floor. In fact, the noise spec-trum from the dithered quantization process can be shapedusing psychoacoustic criteria and can reduce the addednoise in the sensitive midband sufficiently to give audiblebenefits of as much as 18 dB with 44.1-kHz sampling.
One problem with all shaped noises, and particularlythose similar to that shown in Fig. 29, is that while thenoise floor is definitely less audible, if the gain is increasedsufficiently, then the noise that is exposed is quite coloredand unnatural sounding. Signal processing at playbackmay expose the rapidly rising noise at high frequencies. In-band noise shaping at 44.1- or 48-kHz sampling rates hasbeen used extensively to issue better sounding CDs, but hasnot been widely used in higher resolution work.
However, this technique is extremely powerful for
134 J. Audio Eng. Soc., Vol. 52, No. 3, 2004 March
Fig. 27. Playing time obtainable on one layer of a DVD discusing MLP to compress a 6-channel orchestral recording.Incoming precision is varied between 16 and 24 bit at both 48-and 96-kHz sample rates.
0
50
100
150
200
250
300
350
96 kHz 48 kHz
Min
ute
s
24 bit22 bit20 bit18 bit16 bit

PAPERS CODING FOR HIGH-RESOLUTION AUDIO SYSTEMS
improving the subjective dynamic range of channels sam-pled higher than 48 kHz. Since the higher sampling rateallows the bandwidth of the channel to exceed the high-frequency cutoff of human hearing comfortably, there aredifferent options for noise shapers. In [47] Stuart andWilson give examples that can provide perceptual gains ofup to 6 bit in a 96-kHz channel, one of which is illustratedin Fig. 29. If we can provide a perceptual gain of even 4bit then, in principle, a 24-bit recording can be conveyedtransparently using a 20-bit carrier channel.
The unique advantage of using noise shaping as a cod-ing method to minimize the data rate, or for maximizingthe perceptual performance of a channel, is that it requiresneither equipment changes for replay nor a decoder.
7.4 Oversampling with Noise Shaping One strategy to gain the advantage of a higher sampling
rate, while limiting the increase in the rate and quantity ofdata on a carrier, is to oversample and to reduce the wordsize, with noise shaping. Significant oversampling, forexample at four times the CD rate, creates a large amountof coding space above 20 kHz into which quantization anddither noise can be shaped, thereby increasing thedynamic range available at audio frequencies.
Provided the word size used is large enough to supportTPDF dither for any quantization steps, then oversampled
noise-shaped schemes can provide very high efficiencywith no modulation noise or correlated errors, that is, havethe potential for transparency. One scheme that hasattracted interest uses bytewide (8-bit) coding at quadrates. 8-bit coding has a number of attractive featureswhen it comes to designing effective hardware and signalprocessing and was highly recommended by ADA [13].
Fig. 30 shows an example of an 8-bit shaper designedfor use at 192 kHz. Again setting the acoustic gain to be120 dB SPL, the noise spectral density for TPDF 8-bitPCM is shown at 25 dB SPL per hertz. The shaped noiseis reduced below 35 kHz and has a 6-dB margin from theuniformly exciting threshold curve. This design was opti-mized to be inaudible at acoustic gains up to 126 dB andto minimize the total power of the shaped noise. Shapinghas not changed the coding space of the 8-bit channel,however, the dynamic range above 35 kHz has been tradedfor a much more useful range below 20 kHz.
The equal-area property of the shaper (to meet theGerzon–Craven criterion [4]) is more evident in the uppercurve of Fig. 31, which also shows the resulting noisespectra for playback systems using low-pass filtering. Theexamples illustrated are a third-order Butterworth 50-kHzfilter and the apodized filter whose impulse response isshown in Fig. 24.
This shaper design provides inaudible noise at the tar-
J. Audio Eng. Soc., Vol. 52, No. 3, 2004 March 135
Fig. 29. Noise shaper from [47] for use at 96-kHz sampling.
0Hz 10kHz 20kHz 30kHz 40kHz 50kHz
-40dB
-20dB
0dB
20dB
40dB
60dB
Fig. 28. Audible significance of simple 16-bit channel, with example from [6] of audible significance of noise shaping in 16-bit channel.
10Hz 100Hz 1kHz 10kHz
-20
0
20
40
60
80
100
dB S
PL
N1,9D
Hearing threshold

STUART PAPERS
get acoustic gain. Overall noise gain is 21.8 dB in theraw state, falling to –0.8 dB with the apodized filter.Since the inherent noise of an 8-bit channel is at �45dBFS, this implies that even in the apodized case thewide-band signal-to-noise ratio of the system will notreach 50 dB even though it exceeds 120 dB below 20 kHz.This may or may not be significant.
What is certain is that ultrasonic noise of this magnitudepresents a design and management issue for all down-stream stages, and filtering is absolutely necessary. Forexample, if the replay system needed 200 W to attain 120dB SPL, then without filtering the tweeter would have todissipate almost 1 W continuously, whereas with theapodized filter this load drops to below 6 mW.
What is fascinating about this system is that it attains avery high dynamic range in the audio band, has an excel-lent transient response if an apodized filter is used, iswide-band, and yet the data rate is low at 1.536 Mbit/sam-
ple (the same as 96 kHz 16 bit and almost half that of the1-bit example covered in Section 7.7).
It should be pointed out that this coding is considered fora carrier only. While it is possible to cascade processing inthe 8-bit domain—and to do so linearly—a replay systemthat processes the signal from this carrier should operatewith a minimum of 20- and preferably 24-bit precision.
Although less suitable for a carrier, oversampled noise-shaped multibit systems may have some merit for storageor mastering systems if the sample rate is increased. Forexample doubling the sampling rate to 384 kHz wouldallow a shaper, that had more dynamic range below 20kHz with lower noise gain in the shaper and, of course, thereplay filter can remove proportionally more of the noise.However, as we see in Section 7.8, this class of noise-shaped channels may be unsuitable for the highest qualitywork because supersonic components in the signal can beobscured in noise.
136 J. Audio Eng. Soc., Vol. 52, No. 3, 2004 March
Fig. 31. Noise spectrum for example fifth-order 192-kHz 8-bit shaper raw (top) and when filtered at playback using third-orderButterworth (center) and apodized filter (bottom).
0Hz 20kHz 40kHz 60kHz 80kHz 100kHz-80dB
-60dB
-40dB
-20dB
0dB
20dB
40dB
60dB
80dB
Frequency
Raw shaper (top)Filtered (3rd-order Butterworth)Filtered (apodizing, bottom)
Fig. 30. Noise floor of coding system using a fifth-order noise shaper on a 192-kHz 8-bit channel. Acoustic gain is set to 120 dB SPL.Also shown are noise spectrum for unshaped channel (arrow identifies where they cross at 35 kHz) and coding spaces for CD and 96-kHz 24-bit PCM.
0Hz 10kHz 20kHz 30kHz 40kHz 50kHz-80
-60
-40
-20
0
20
40
60
80
100
120
192/8
96/24
dB S
PL
-80
-60
-40
-20
0
20
40
60
80
100
120

PAPERS CODING FOR HIGH-RESOLUTION AUDIO SYSTEMS
7.5 Preemphasis and Noise ShapingThe use of pre- and complementary deemphasis as a
signal-processing method to optimize the subjectivedynamic range of analog channels is quite familiar toaudio engineers. The method has been used with particu-lar success in cases where the analog noise level increaseswith frequency, as with magnetic tape, shellac, vinylgrooves, or FM broadcast. In each case a well-documentedproperty of music and speech is exploited: when materialof acoustic origin is microphoned at normal listening posi-tions, the average and peak spectrum levels decline withfrequency above a few kilohertz. It is therefore efficient topreemphasize high-frequency signals to make it morelikely that they will occupy the channel’s capacity.Deemphasis is applied on replay or reception and has thedual benefit of reducing both noise and distortion from thepreceding chain.
So far all linear PCM standards for digital audio havepermitted the use of 50/15-µs pre- and deemphasis(included in Fig. 32). However, this preemphasis has notbeen overwhelmingly popular with the recording industry,principally because it uses too much in-band high-fre-quency headroom and presents a mastering managementissue because its use has to be flagged.
Designers of future carriers should bear in mind thevery interesting possibilities that exist for preemphasis ofmaterial recorded at 88.2 kHz or higher. One schemebased on original work by the late Michael Gerzon(described in [48]) combines preemphasis specified in thedigital domain with a matched noise shaper in the preem-phasis filter, as shown in Fig. 32.
When preemphasis is applied to a channel with a flatnoise floor, it is normal for the deemphasis used on replayto result in a final noise spectrum that falls at high fre-quencies. Gerzon proposed that the encoder should inaddition incorporate noise shaping in order that the finalnoise spectrum should be flat. The lower curve in Fig. 32
shows the noise-shaping curve which in fact is parallel tothe preemphasis curve. Fig. 33 shows the headroom andthe final replay noise spectrum, which is flat. Note that inexchange for a small amount of headroom at the top of theaudio band (3 dB at 20 kHz) this system delivers a per-ceptual gain of 2.1 bit.9
Compared with 50/15-µs preemphasis this schemeoffers much improved high-audio-frequency headroom.(It is reduced by only 2 dB at 15 kHz, compared to 9 dBin the current standard.) The preemphasis method involvesa noise shaper that gives a 2.1-bit increase in overall audiodynamic range when used as a word-length-reductiondevice and, because the noise shaper has the same shapeas the preemphasis curve, the output (deemphasized)noise spectrum is “white.”
This scheme can be combined usefully, at the user’s dis-cretion, with an appropriately chosen high-advantagenoise shaper such as that shown in Fig. 34. Fig. 35 clari-fies the way in which this noise shaper combines with thesuggested preemphasis to provide increased dynamicrange. The headroom curves at the top show the deem-phasized response normalized for 16-, 20-, and 24-bitchannels. The lower curve represents the noise spectrumof the shaper used (Fig. 34), after correction to allow forthe gain achieved by the preemphasis scheme. The cod-ing space (area between headroom and noise floor)remains equal to that of a 16-bit channel, but it has beenredistributed to be more useful. This figure shows how a16-bit channel at 96 kHz can have an effective dynamicrange of 23 bit in the critical 4-kHz region while stilloffering 19-bit performance at 20 kHz. A key feature ofpre- and deemphasis is that coding space can be redis-tributed, trading unneeded headroom in one region forlower noise.
J. Audio Eng. Soc., Vol. 52, No. 3, 2004 March 137
9Analyzing this in terms of coding space, we see that an areahas been removed from region A and used to lower the noisefloor below 0 dB uniformly.
Fig. 32. Gerzon preemphasis scheme compared with 50/15-µs standard for CD, and noise spectrum resulting from preemphasis-matched noise shaper.
0Hz 10kHz 20kHz 30kHz 40kHz 50kHz-18
-12
-6
0
6
12
18
24
30
36
42
48
Proposed 96 kHz preemphasis 50+15µs preemphasis 96 kHz preemphasis noise-shaper
dB
Frequency

STUART PAPERS
138 J. Audio Eng. Soc., Vol. 52, No. 3, 2004 March
Fig. 35. Output noise spectrum and headroom for channel after the example sixth-order noise shaper has been combined with the pro-posed pre- and deemphasis. Example illustrates a capacity of almost 23 bit at 4 kHz for a 16-bit channel, i.e., a perceptual gain of 7bit. Also shown are headroom curves for 20- and 24-bit channels.
0Hz 10kHz 20kHz 30kHz 40kHz 50kHz-8
-4
0
4
8
12
16
20
24
28
18.8 bit
22.9 bit
Bits
Frequency
Fig. 34. Example of sixth-order noise shaper that can be combined with preemphasis scheme.
0Hz 10kHz 20kHz 30kHz 40kHz 50kHz-36
-30
-24
-18
-12
-6
0
6
12
18
24
30
36
42
dB
Frequency
Fig. 33. Output noise spectrum and headroom for channel after application of proposed pre- and deemphasis. Example illustrates acapacity of 18.1 bit at 4 kHz for a 16-bit channel, i.e., a perceptual gain of 2.1 bit.
0Hz 10kHz 20kHz 30kHz 40kHz 50kHz-4
-2
0
2
4
6
8
10
12
14
16
18
A
18.1 bit Headroom Noise spectrum
Bits
Frequency

PAPERS CODING FOR HIGH-RESOLUTION AUDIO SYSTEMS
7.6 Lossy Encoded PCMIn general, lossy compression schemes operate on the
assumption that some input data can be ignored as irrele-vant to human listeners, either because they fall below thehearing threshold, or because they will be safely maskedby louder, closely cotemporal content.
Such coding does not set out to convey the exact data,or even the waveform, through the channel. Instead itattempts to convey its “sound.” These schemes are to someextent successful, and the author freely admits that atsome point in the future a lossy psychoacoustically basedcodec may prove to be audibly transparent. At themoment, however, the use of significant lossy compres-sion in high-resolution systems cannot be advocated.
7.7 One-bit CodingOne-bit coding is a unique case of PCM and belongs to
the family of oversampled noise-shaped coders describedin Section 7.4. It is discussed in detail elsewhere in thisissue by Lipshitz and Vanderkooy [15] and Reefman [49].
The concept of using the output of a highly noise-shaped single-bit quantizer for distribution on a carrier hasits origins in the digital audio technology of the early1990s. It was thought that the output of the then-standardsingle-bit modulator (operating at 64 times 44.1 kHz) inan analog-to-digital converter might be an appropriateway to avoid the ills of antialias and anti-image filters(discussed in Section 5.4).
As mentioned in Section 2, events rather overtook thisidea since high-performance converters evolved to usemultibit quantizers in order to avoid the severe problems oflack of linearity, modulation noise, spurious tones, and thehigh levels of supersonic noise that are unavoidable fea-tures of these undithered single-bit quantizers (see [15]).
One attraction of 1-bit 64 times coding is that it has awide bandwidth and the potential for good transient per-formance, albeit with very low signal-to-noise ratio athigher frequencies. However, for the same reasons thatwere shown in the example of the oversampled 8-bit sys-tem (see Section 7.4), it is absolutely necessary to use
postfiltering on replay to reduce the high-frequency noisefrom the shaper to an acceptable degree. In consequencethe ultrawide bandwidth does not accrue. In fact playbacksystems tend to require a steep 50-kHz filter so as to notoverload downstream equipment, and such a filter is spec-ified for SACD. Real-world implementations of single-bitconverters also may not exhibit the ideal transient per-formance that is expected [50].
There is no standard noise shaper for 1-bit delta–sigmacoding. Fig. 36 includes two examples running at 64 times44.1 kHz taken from [51]. The lower curve (LIP7ZP) isalso the example used in Lipshitz and Vanderkooy [15].The figure shows that the noise floor of either shapershould be inaudible for acoustic gains up to 120 dB SPL.The 1-bit code has a per-channel data rate of 2.822Mbit/sample and in the region up to 48 kHz, LIP7ZP pro-vides a coding space of approximately 64% of that pro-vided by the 96-kHz 24-bit PCM channel—which uses thelower data rate of 2.304 Mbit/sample. Fig. 37 comparesthe noise spectrum of LIP7ZP with the 192-kHz 8-bitexample from Section 7.4 which runs at 54% of the datarate. Of course the 1-bit system codes audio to above 1MHz, but with further diminishing dynamic range.Overall this is not the most efficient way of providing theaudio coding space we require.
In the dithered multibit case the signal and ditheredquantization noise are uncorrelated. However, in thesinge-bit case, the noise floor must change with the signalbecause the total power of the signal plus noise is alwaysconstant, that is, modulation noise is unavoidable.
Because the quantizer only offers two levels, TPDFdither cannot be applied. Without dither, the 1-bit systemmust introduce correlated errors, in the form of birdies andmodulation noise. This is an important defect because itsets a limit on the perfectibility of the channel. [51]
Single-bit coding also presents a particular problem ifany processing is to be performed on the signal. Typicallycascaded processing will include low-pass filteringbetween stages to reduce the prospect of overloading themodulator, and each stage involves a new quantizationstep that builds up both correlated errors and supersonic
J. Audio Eng. Soc., Vol. 52, No. 3, 2004 March 139
Fig. 36. Noise spectra of two single-bit noise shapers from [51] presented at acoustic gain of 120 dB SPL. Also shown are effectivehearing threshold and coding spaces for CD and 96-kHz 24-bit PCM. The common reference that aligns the 96-kHz 24-bit noise floorand the 1-bit noise shaper undithered noise spectrum is the maximum sine-wave power, taken to be 120 dB SPL.
0Hz 10kHz 20kHz 30kHz 40kHz 50kHz-80
-60
-40
-20
0
20
40
60
80
100
120
CD
96 kHz 24 bit
PAS7ZP
LIP7ZP
dB S
PL
-80
-60
-40
-20
0
20
40
60
80
100
120
-80
-60
-40
-20
0
20
40
60
80
100
120

STUART PAPERS
noise. Successive processing risks raising the high-fre-quency noise of the channel to the point of detectability.For this reason postprocessing (such as bass management)should be carried out in the multibit domain, with suffi-cient coding space to both contain the signal and preventfurther deterioration, as illustrated in Fig. 38.
7.8 Some Comparisons of Channel CodingCurrently studies of high-resolution coding for music
delivery tend to be focused on either high-rate multibitPCM or highly oversampled and noise-shaped 1-bit cod-ing. In the multibit case we have illustrated that for sam-pling rates above 88.2 kHz, the traditional brick-wallantialias and/or anti-image filters are probably a poorchoice. Instead we advocate designing the high-frequencyrolloff in such a way as to provide a better overall transientperformance for the channel.
So far as providing bandwidth is concerned, there isvery little difference between the deliverable high-fre-quency responses of 96-kHz sampled multibit PCM and2.8224-MHz 1-bit coding; both require to be filtered closeto 50 kHz.
In Section 5.3 we see evidence that musical instru-ments can emit sounds up to 100 kHz and beyond. Theonly carrier in widespread use that can replicate thesesounds is the 192-kHz PCM coding available on DVD-
Audio. It is by no means clear that we need to conveyaudio, on air to the listener, up to 100 kHz to maintaintransparency, an assertion also explored in Section 5.3.The author suspects that we are not quite ready to answerthe question about whether, when it is well engineered,PCM sampled at 96 kHz offers less transparency than thatsampled at 192 kHz. We hope that some useful experi-ments can be carried out now that apodized filters arebecoming available.
Fig. 39 gives an opportunity to compare the noise floorof the recordings described in Section 4.5 with the chan-nel capability of the 1-bit shaper described in the previoussection and with 96-kHz 24-bit PCM.
The multibit channel has a dynamic range that exceedsthat of the recording by more than 50 dB at all frequen-cies up to 48 kHz. In Section 4.5 we point out that thisprecision may be excessive for a carrier since the channelnoise is well below the thermal limits for air itself. Bycontrast, the 1-bit system has a rapidly rising noise floorthat, in the case of the highest resolution example,exceeds the background noise of the recording itselfabove 24 kHz.
Fig. 40 extends the frequency range to 100 kHz andincludes data on a closely recorded high piano note from[45]—in this case an envelope of the piano spectrum andthe background noise of the recording. Also included in
140 J. Audio Eng. Soc., Vol. 52, No. 3, 2004 March
Fig. 38. Recommended work flow for content to be issued in 1-bit form.
ADC MixingPCM 24 bit
MasteringPCM 24 bit or
analog
Carrier
Player DAC
24 bit 24 bit
1 bit
1 bitUpconversionto 24 bit and
bassmanagement
PCM
1 bitDown-
convert24 bit to 1 bit
24 bit oranalog
Fig. 37. Comparing two noise shapers: single-bit LIP7ZP and 192-kHz 8-bit example from Section 7.4. Also shown are coding spacesfor 96- and 192-kHz 24-bit PCM and uniformly exciting threshold noise.
0Hz 20kHz 40kHz 60kHz 80kHz 100kHz-80
-60
-40
-20
0
20
40
60
80
100
120
192/24
192/8
96/24
LIP7ZP
dB S
PL
-80
-60
-40
-20
0
20
40
60
80
100
120
-80
-60
-40
-20
0
20
40
60
80
100
120
-80
-60
-40
-20
0
20
40
60
80
100
120

PAPERS CODING FOR HIGH-RESOLUTION AUDIO SYSTEMS
the figure is the coding space for 192-kHz PCM.10, 11 Onceagain, PCM is more than adequate to contain and replicatethe information, regardless of which components may notbe audible. However, the noise floor of the single-bit sys-tem swamps both the high-frequency components of thesignal above 38 kHz and the background of the recordingabove 28 kHz.
This comparison raises a very important question. Ifsupersonic content is significant to high-resolution audio,why would we cover it up with noise? The guidelinesevolved in this paper for high-resolution audio, and fortransparency, suggest that the carrier should use codingthat provides a space that is larger at all frequencies thanthe source recording. By this criterion neither of the over-sampled systems illustrated in Fig. 37 can be regarded assuitable for the highest resolution work.
Perhaps the clearest way to consider this question, evi-
dent from Fig. 40, is that 1-bit coding would be a totallyunsuitable choice for a series of recordings that set out toidentify the high-frequency content of musical instru-ments, despite claims for its apparent wide bandwidth. Ifit is unsuitable for recording analysis then we should alsobe wary of using it for the highest quality work.
8 CONCLUSIONS
This issue gives a unique opportunity to highlight andcompare many aspects of the current technology for high-resolution digital audio. This paper has not focused ontechniques but instead takes an overview investigatingbroader questions such as what is high resolution?; can wepredict transparency?; how should we choose samplingrates and bit depths?; as well as seeking guidelines for sig-nal processing at different points in the recording andplayback chain.
The paper makes an attempt to set the properties of var-ious channel-coding techniques in the context of the prop-erties of human hearing, of musical instruments, and ofroom and recording noise. Auditory modeling techniqueshave been employed to enable some useful insights and
J. Audio Eng. Soc., Vol. 52, No. 3, 2004 March 141
Fig. 40. Envelope of spectrum for a closely recorded high piano note (G-sharp 72) and recording background noise are compared tohearing threshold and noise floors of four different channels: 1 bit 2.4224 MHz, 8 bit 192 kHz (described in Section 7.4), 24 bit 96kHz, and 24 bit 192 kHz, using data from [45]. Acoustic gain is set to 120 dB SPL and retains level of the recording.
0Hz 20kHz 40kHz 60kHz 80kHz 100kHz-80
-60
-40
-20
0
20
40
60
80
100
120
Noise floor
Piano
192/24
192/8
96/24
LIP7ZP
dB S
PL
-80
-60
-40
-20
0
20
40
60
80
100
120
-80
-60
-40
-20
0
20
40
60
80
100
120
-80
-60
-40
-20
0
20
40
60
80
100
120
-80
-60
-40
-20
0
20
40
60
80
100
120
Fig. 39. Noise floor of single-bit coding channel compared to examples of recording noise spectra discussed in Section 4.5.
0Hz 10kHz 20kHz 30kHz 40kHz 50kHz-80
-60
-40
-20
0
20
40
60
80
100
120
dB S
PL
-80
-60
-40
-20
0
20
40
60
80
100
120
Avge
96/24
Max
Min
LIP7ZP
-80
-60
-40
-20
0
20
40
60
80
100
120
10Note that at 192 kHz the quantization noise power is distrib-uted over twice the bandwidth compared with 96 kHz; hence theNSD is 3 dB lower.
11In this figure the typical 50-kHz replay filter has not beenshown in the 1-bit case. Obviously this playback filter wouldattenuate both the recording and the channel noise.

STUART PAPERS
guidelines; these techniques have been used to illuminatethe concept of “coding space.”
In considering the mastering, mixing, and playbackphases it is concluded that these operations should be per-formed within a coding space that is larger at all audio fre-quencies (preferably up to at least 48 kHz) than the origi-nal signal. To remain below the noise floor of therecording and to ensure that no correlated errors are intro-duced, this essentially implies a rectangular channel (thatis, without noise shaping) using coding such as 96- or192-kHz sampling with 24 bit.
When recordings are issued on carriers for distribution itis not always necessary or efficient to use the massive cod-ing space afforded by 24-bit PCM. Lossless compression isthe best method for reducing space occupied. Other meth-ods such as word-size reduction, various noise-shapingtechniques, and also pre- and deemphasis are examined.
For the highest resolution work it is recommended thatthe noise floor of the coding method used on the carrier beup to 2 bit below the self-noise spectrum of the recordingat all frequencies. In fact tools can be designed to auto-mate the process of analyzing the recording and recom-mending appropriate word size case by case. The require-ment that the channel noise be below the self-noise of thesignal effectively rules out oversampled low-bit systemsfor the highest quality work.
For future standards the author commends the study ofnew possibilities for pre- and deemphasis since this tech-nique can result in a lower, yet flat noise spectrum, tradingunused supersonic headroom for in-band dynamic range.
The paper also examines the questions of frequencyresponse and transient performance and suggests that forhigh-resolution work an apodized filter should beemployed in the chain. Since the recording chain mayinvolve sample-rate conversions or addition of material inmixing, it is preferable to use apodized anti-image filtersin digital-to-analog converters. For the time being, untilsuch filters become available, it is recommended that theybe tried at the mastering stage and flagged in the bitstream. (MLP has this capability.) When such chains arewidely available we may be able to reach a firmer conclu-sion on whether sampling at 192 kHz offers any sonicadvantages over 96 kHz.
9 ACKNOWLEDGMENT
The author would like to thank Malcolm Law for pro-viding Figs. 2, 4, and 5; Rhonda Wilson for optimizing thenoise shaper used to illustrate Section 7.4, for generatingthe data for Fig. 34, and for providing Fig. 25; Peter Cravenfor providing Fig. 24; and Stanley Lipshitz for the data onshapers used in Section 7.7. He would also like to thankPeter Craven for useful comments on earlier drafts andStanley Lipshitz, John Vanderkooy, and Brian Moore forfriendly support over many years of inquiry on this topic.
10 REFERENCES
[1] M. Akune, R. Heddle, and K. Akagiri, “Super BitMapping: Psychoacoustically Optimized Digital
Recording,” presented at the 93rd Convention of theAudio Engineering Society, J. Audio Eng. Soc.(Abstracts), vol. 40, p. 1044 (1992 Dec.), preprint 3371.
[2] P. G. Craven and M. A. Gerzon, “CompatibleImprovement of 16-Bit Systems Using SubtractiveDither,” presented at the 93rd Convention of the AudioEngineering Society, J. Audio Eng. Soc. (Abstracts), vol.40, p. 1039 (1992 Dec.), preprint 3356.
[3] J. Vanderkooy and S. P. Lipshitz, “Digital Dither:Signal Processing with Resolution Far below the LeastSignificant Bit,” in Proc. AES 7th Int. Conf. on Audio inDigital Times (Toronto, Ont., Canada, 1989), pp. 87–96.
[4] M. A. Gerzon and P. G. Craven, “Optimal NoiseShaping and Dither of Digital Signals,” presented at the87th Convention of the Audio Engineering Society, J.Audio Eng. Soc. (Abstracts), vol. 37, p. 1072 (1989 Dec.),preprint 2822.
[5] M. A. Gerzon, P. G. Craven, J. R. Stuart, and R. J.Wilson, “Psychoacoustic Noise-Shaped Improvements toCD and Other Linear Digital Media,” presented at the 94thConvention of the Audio Engineering Society, J. AudioEng. Soc. (Abstracts), vol. 41, p. 394 (1993 May), preprint3501.
[6] J. R. Stuart and R. J. Wilson, “Dynamic RangeEnhancement Using Noise-Shaped Dither Applied toSignals with and without Preemphasis,” presented at the96th Convention of the Audio Engineering Society, J.Audio Eng. Soc. (Abstracts), vol. 42, p. 400 (1994 May),preprint 3871.
[7] J. R. Stuart, “Auditory Modeling Related to the BitBudget,” Proc. of AES UK Conf. on Managing the BitBudget (1994), pp. 167–178.
[8] A. W. J. Oomen, M. E. Groenwegen, R. G. van derWaal, and R. N. J. Veldhuis, “A Variable-Bit-Rate Buried-Data Channel for Compact Disc,” J. Audio Eng. Soc., vol.43, pp. 23–28 (1995 Jan./Feb.).
[9] M. A. Gerzon and P. G. Craven, “A High-RateBuried Data Channel for Audio CD,” presented at the 94thConvention of the Audio Engineering Society, J. AudioEng. Soc. (Abstracts), vol. 41, p. 402 (1993 May), preprint3551.
[10] J. R. Stuart and R. J. Wilson, “A Search forEfficient Dither for DSP Applications,” presented at the94th Convention of the Audio Engineering Society, J.Audio Eng. Soc. (Abstracts), vol. 40, p. 431 (1992 May),preprint 3334.
[11] Acoustic Renaissance for Audio, “A Proposal forHigh-Quality Application of High-Density CD Carriers,”private publication (1995 April) www.meridian-audio.com/ara; reprinted in Stereophile (1995 Aug.); inJapanese in J. Japan Audio Soc., vol. 35 (1995 Oct.).
[12] J. R. Stuart, “Noise: Methods for EstimatingDetectability and Threshold,” J. Audio Eng. Soc., vol. 42,pp. 124–140 (1994 Mar.).
[13] Advanced Digital Audio, “Proposal of DesirableRequirements for the Next Generation’s Digital Audio,”presented at the Advanced Digital Audio Conf., JapanAudio Society (1996 Apr.).
[14] M. Story, “Audio Analog-to-Digital Converters,”J. Audio Eng. Soc., this issue, pp. 145–158.
142 J. Audio Eng. Soc., Vol. 52, No. 3, 2004 March

PAPERS CODING FOR HIGH-RESOLUTION AUDIO SYSTEMS
[15] S. P. Lipshitz and J. Vanderkooy, “Pulse-CodeModulation—An Overview,” J. Audio Eng. Soc., thisissue, pp. 200–215.
[16] J. R. Stuart, “Predicting the Audibility, Detect-ability and Loudness of Errors in Audio Systems,” pre-sented at the 91st Convention of the Audio EngineeringSociety, J. Audio Eng. Soc. (Abstracts), vol. 39, p. 1010(1991 Dec.), preprint 3209.
[17] J. R. Stuart, “Estimating the Significance ofErrors in Audio Systems,” presented at the 91stConvention of the Audio Engineering Society, J. AudioEng. Soc. (Abstracts), vol. 39, p. 1011 (1991 Dec.),preprint 3208.
[18] J. R. Stuart, “Psychoacoustic Models forEvaluating Errors in Audio Systems,” Proc. Inst. Acous.,vol. 13, pt. 7, pp. 11–33 (1991).
[19] L. Fielder, “Dynamic Range Issues in the ModernDigital Audio Environment,” in Proc. of AES UK Conf.Managing the Bit Budget (1994) pp. 3–19.
[20] D. W. Robinson and R. S. Dadson, “Acoustics—Expression of Physical and Subjective Magnitudes ofSound or Noise in Air,” ISO131-1959.
[21] D. W. Robinson and R. S. Dadson, “A Redeter-mination of the Equal-Loudness Relations for PureTones,” Brit. J. Appl. Phys., vol. 7, pp. 166–181 (1956May).
[22] R. S. Dadson, and J. H. King, “A Determination ofthe Normal Threshold of Hearing and Its Relation to theStandardization of Audiometers,” J. Laryngol. Otol., vol.66, pp. 366–378 (1952).
[23] E. A. Cohen and L. D. Fielder, “DeterminingNoise Criteria for Recording Environments,” J. AudioEng. Soc., vol. 40, pp. 384–402 (1992 May).
[24] D. J. Meares and K. F. L. Lansdowne, “RevisedBackground Noise Criteria for Broadcast Studios,” BBCResearch Rep. RD1980/8 (1980).
[25] G. G. Harris, “Brownian Motion in the CochlearPartition,” J. Acoust. Soc. Am., vol. 44, pp. 176–186(1968).
[26] P. B. Fellgett, “Thermal Noise Limits ofMicrophones,” J. IERE, vol. 57, pp. 161–166 (1987).
[27] B. J. C. Moore, Ed., Frequency Selectivity inHearing (Academic Press, New York, 1986).
[28] S. Buus, et al. “Tuning Curves at HighFrequencies and Their Relation to the Absolute ThresholdCurve,” in B. J. C. Moore and R. D. Patterson, Eds.,Auditory Frequency Selectivity (Plenum Press, NewYork, 1986).
[29] M. J. Shailer, B. J. C. Moore, B. R. Glasberg, N.Watson, and S. Harris, “Auditory Filter Shapes at 8 and 10kHz,” J. Acoust. Soc. Am., vol. 88, pp. 141–148 (1990).
[30] M. L. Lenhardt, “Human Ultrasonic Hearing,”Hearing Rev., vol. 5, no. 3, pp. 50–52 (1998).
[31] M. L. Lenhardt, R. Skellett, P. Wang, and A. M.Clarke, “Human Ultrasonic Speech Perception,” Science,vol. 253, pp. 82–85 (1991).
[32] M. L. Lenhardt, “Ultrasonic Hearing in Humans:Applications for Tinnitus Treatment,” Int. Tinnitus J., vol.9, no. 2 (2003).
[33] F. J. Corso, “Bone Conduction Thresholds for
Sonic and Ultrasonic Frequencies,” J. Acoust. Soc. Am.,vol. 35, pp. 1738–1743 (1963).
[34] B. H. Deatherage, L. A. Jeffress, and H. C.Blodgett, “A Note on the Audibility of IntenseUltrasound,” J. Acoust. Soc. Am., vol. 26, p. 282 (1954).
[35] R. J. Pumphrey, “Upper Limit of Frequency forHuman Hearing,” Nature, vol. 166, p. 571 (1950).
[36] T. Oohashi, E. Nishina, N. Kawai, Y. Fuwamoto,and H. Imai., “High-Frequency Sound above the AudibleRange Affects Brain Electric Activity and SoundPerception,” presented at the 91st Convention of the AudioEngineering Society, J. Audio Eng. Soc. (Abstracts), vol.39, p. 1010 (1991 Oct.), preprint 3207.
[37] T. Oohashi, E. Nishina, Y. Fuwamoto, and N.Kawai, “On the Mechanism of Hypersonic Effect,” inProc. Int. Computer Music Conf. (Tokyo, Japan, 1993).
[38] S. Yoshikawa, S. Noge, M. Ohsu, S. Toyama, H.Yanagawa, T. Yamamoto, “Sound-Quality Evaluation of96-kHz Sampling Digital Audio,” presented at the 99thConvention of the Audio Engineering Society, J. AudioEng. Soc. (Abstracts), vol. 43, p. 1095 (1995 Dec.),preprint 4112.
[39] A. S. Bregman, Auditory Scene Analysis: ThePerceptual Organization of Sound (MIT Press,Cambridge, MA, 1990).
[40] J. O. Nordmark, “Binaural Time Discrimination,”J. Acoust. Soc. Am., vol. 35, pp. 870–880 (1976).
[41] B. G. Henning, “Detectability of Interaural Delayin High-Frequency Complex Waveforms,” J. Acoust. Soc.Am., vol. 55, pp. 84–90 (1974).
[42] R. G. Klump and H. R. Eady, “Some Measure-ments of Interaural Time Difference Thresholds,” J.Acoust. Soc. Am., vol. 28, pp. 859–860 (1956).
[43] K. Krumbholz and R. D. Patterson, “MicrosecondTemporal Resolution in Monaural Hearing withoutSpectal Cues?,” J. Acoust. Soc. Am., vol. 113, pp.2790–2800 (2003).
[44] M. A. Gerzon, P. G. Craven, J. R. Stuart, M. J.Law, R. J. Wilson, “The MLP Lossless CompressionSystem for PCM Audio,” J. Audio Eng. Soc., this issue,pp. 243–260.
[45] J. Boyk, “There’s Life above 20 kilohertz! ASurvey of Musical Instrument Spectra to 102.4 kHz,” pri-vate publication www.cco.caltech.edu/~boyk/spectra/spectra.htm (2000).
[46] P. G. Craven, “Antialias Filters and SystemTransient Response at High Sample Rates,” J. Audio Eng.Soc., this issue, pp. 216–242.
[47] J. R. Stuart and R. J. Wilson, “Dynamic RangeEnhancement Using Noise-Shaped Dither at 44.1, 48, and96 kHz,” presented at the 100th Convention of the AudioEngineering Society, J. Audio Eng. Soc. (Abstracts), vol.44, p. 646 (1996 July/Aug.), preprint 4236.
[48] Acoustic Renaissance for Audio, “DVD: Pre-emphasis for Use at 96 kHz or 88.2 kHz,” private publica-tion www.meridian-audio.com/ara (1996 Nov.).
[49] D. Reefman and E. Janssen, “One-Bit Audio:An Overview,” J. Audio Eng. Soc., this issue, pp.166–189.
[50] C. Anderson, “Poking a Round Hole in a Square
J. Audio Eng. Soc., Vol. 52, No. 3, 2004 March 143

STUART PAPERS
Wave,” /www.smr-home-theatre.org/surround2002/tech-nology/page_07.shtml.
[51] S. P. Lipshitz, J. Vanderkooy, “Why 1-Bit Sigma-Delta Conversion is Unsuitable for High-Quality
Applications,” presented at the 110th Convention of theAudio Engineering Society, J. Audio Eng. Soc.(Abstracts), vol. 49, p. 544 (2001 June), convention paper5395.
144 J. Audio Eng. Soc., Vol. 52, No. 3, 2004 March
THE AUTHOR
J. Robert Stuart was born in Belfast, Northern Irelandin 1948. He studied electronic engineering at theUniversity of Birmingham, UK, where he was awardedFirst Class Honours. While at Birmingham he studiedpsychoacoustics under Professor Jack Allinson, whichbegan a lifelong fascination with the subject.
After a year working for the Marconi InstrumentCompany, he received an M.Sc. degree in operationsresearch from the Imperial College, London, in 1971.Following three years as a consultant in the audio indus-try, he co-founded Boothroyd Stuart Limited, whichbegan manufacture of the Meridian brand of audio com-ponents. He is now chairman and technical director of theMeridian Group, which includes Meridian Audio Limited,Meridian America Incorporated, and MLP Limited.
Mr Stuart’s professional interests are the furthering ofanalog and digital audio and developing understanding ofthe human auditory perception mechanisms that are rele-vant to live and recorded music. His specialities includethe design of analog and digital electronics, loudspeakers,and optical disc players.
As an active member of the DVD Forum, Mr. Stuart hascontributed to the DVD-Audio and DVD-AudioRecordable standards. He has also served on the technicalcommittee of the National Sound Archive. He has a deepinterest in music and spends a good deal of time listeningto live and recorded material. He is a fellow of AES, amember of the ASA and IEEE, a visiting fellow at theEssex University, and the chairman of the AcousticRenaissance for Audio.


![AUDIO CODING STANDARDS - mp3-tech.org · The advances of audio coding techniques and the ... 1992], and the Dolby AC-3 [Todd, 1994] algorithm. “Audio Coding Standards,” A chapter](https://img.pdfslide.us/doc/110x75/5aefb0d47f8b9ac2468d26b7/audio-coding-standards-mp3-tech-advances-of-audio-coding-techniques-and-the-.jpg)