Embed Size (px)
Citation preview

Berlin, Germany
2012
© Copyright 2012 by the KompetenzZentrum Wasser Berlin gGmbH. All rights including translation into other languages, reserved under the Universal Copyright Convention, the Berne Convention or the Protection of Literacy and Artistic Works, and the International and Pan American Copyright Conventions.
Cicerostr. 24 D-10709 Berlin Germany Tel +49 (0)30 536 53 800 Fax +49 (0)30 536 53 888 www.kompetenz-wasser.de
REPORT Final draf t , Date: 17.04.2012
Project CoDiGreen
Work package 2:
LCA study of sludge treatment line in
WWTP Berlin-Waßmannsdorf
by Christian Remy
Kompetenzzentrum Wasser Berlin gGmbH
Cicerostr. 24, 10709 Berlin
Preparation of this report was financed through funds provided by
Berliner Wasserbetriebe and Veolia Water

ii
Important Legal Notice Disclaimer: The information in this publication was considered technically sound by the consensus of persons engaged in the development and approval of the document at the time it was developed. KWB disclaims liability to the full extent for any personal injury, property, or other damages of any nature whatsoever, whether special, indirect, consequential, or compensatory, directly or indirectly resulting from the publication, use of application, or reliance on this document. KWB disclaims and makes no guaranty or warranty, expressed or implied, as to the accuracy or completeness of any information published herein. It is expressly pointed out that the information and results given in this publication may be out of date due to subsequent modifications. In addition, KWB disclaims and makes no warranty that the information in this document will fulfill any of your particular purposes or needs. The disclaimer on hand neither seeks to restrict nor to exclude KWB’s liability against all relevant national statutory provisions. Wichtiger rechtlicher Hinweis Haftungsausschluss: Die in dieser Publikation bereitgestellte Information wurde zum Zeitpunkt der Erstellung im Konsens mit den bei Entwicklung und Anfertigung des Dokumentes beteiligten Personen als technisch einwandfrei befunden. KWB schließt vollumfänglich die Haftung für jegliche Personen-, Sach- oder sonstige Schäden aus, ungeachtet ob diese speziell, indirekt, nachfolgend oder kompensatorisch, mittelbar oder unmittelbar sind oder direkt oder indirekt von dieser Publikation, einer Anwendung oder dem Vertrauen in dieses Dokument herrühren. KWB übernimmt keine Garantie und macht keine Zusicherungen ausdrücklicher oder stillschweigender Art bezüglich der Richtigkeit oder Vollständigkeit jeglicher Information hierin. Es wird ausdrücklich darauf hingewiesen, dass die in der Publikation gegebenen Informationen und Ergebnisse aufgrund nachfolgender Änderungen nicht mehr aktuell sein können. Weiterhin lehnt KWB die Haftung ab und übernimmt keine Garantie, dass die in diesem Dokument enthaltenen Informationen der Erfüllung Ihrer besonderen Zwecke oder Ansprüche dienlich sind. Mit der vorliegenden Haftungsausschlussklausel wird weder bezweckt, die Haftung der KWB entgegen den einschlägigen nationalen Rechtsvorschriften einzuschränken noch sie in Fällen auszuschließen, in denen ein Ausschluss nach diesen Rechtsvorschriften nicht möglich ist.

iii
Colofon
Title Project CoDiGreen, Work package 2: LCA study of sludge treatment line in WWTP Berlin-Waßmannsdorf
Project Acronym: CoDiGreen
Authors Christian Remy, Kompetenzzentrum Wasser Berlin gGmbH
Quality Assurance Boris Lesjean, Kompetenzzentrum Wasser Berlin Jan Waschnewski, Berliner Wasserbetriebe
Publication / Dissemination approved by technical committee members: Regina Gnirss, Berliner Wasserbetriebe Christine Mesek, Stadtentwässerung Braunschweig Bernhard Teiser, Abwasserverband Braunschweig Andreas Hartmann, Kompetenzzentrum Wasser Berlin Norbert Dichtl, ISWW der TU Braunschweig Christophe Sardet, Veolia Wasser Emmanuelle Trouvé, Veolia Eau
Deliverable number D 2.2
Final version Date: 17.04.2012

iv
Abstract (English)
The goal of this study is to demonstrate the application of Life Cycle Assessment as a tool for systems analysis in wastewater treatment. Therefore, the process for sludge treatment and disposal at the WWTP Berlin-Waßmannsdorf has been analysed with the methodology of Life Cycle Assessment (LCA) to determine the total cumulative energy demand and the carbon footprint of the system as exemplary indicators. In addition to the characterization of the status quo in 2009, several measures for an energetic optimization of the system have been evaluated in their effects on the energy balance and greenhouse gas emissions. The process model of the system encompasses all relevant processes of sludge treatment and disposal, including the supply of electricity and chemicals, transport and incineration of the sludge, and treatment of sludge liquor which is recycled back to the WWTP inlet. Products recovered during sludge treatment (biogas from anaerobic digestion and MAP fertilizer) and disposal in incineration (electricity or substitution of fossil fuels) are accounted by credits for the respective substituted products.
Overall, sludge treatment and disposal in Berlin-Waßmannsdorf is an energy-positive process, recovering a net amount of primary energy of 162 MJ (45 kWh) per population equivalent and year (PECOD*a). This is mainly due to the biogas generated in anaerobic digestion and the substitution of fossil fuels in co-incineration. Similarly, the carbon footprint of the process reveals an amount of 11.6 kg CO2-eq/(PECOD*a) as avoided emissions, thus indicating the environmental benefits of energy recovery from sewage sludge. However, process emissions of the powerful greenhouse gases CH4 and N2O are estimated based on generic emission factors from literature, and can have a distinct influence on the overall carbon footprint. This underlines the necessity to support the results of this LCA with primary data from monitoring of emissions on-site.
The evaluation of optimization measures shows the benefits of a system-wide analysis: an enhanced recovery of energy is partially offset by increased energy demand, and the carbon footprint does not always correlate with the energy balance. The different routes for sludge disposal differ heavily in their environmental profile and show potentials for optimisation, especially in mono-incineration of sewage sludge. Some measures are beneficial for both energy and carbon footprint (addition of co-substrates into the digestor, utilization of excess heat with an Organic Rankine Cycle process), while others can decrease energy demand but may potentially increase the carbon footprint (treatment of sludge liquor by deammonification, thermal hydrolysis of excess sludge).
Overall, the method of Life Cycle Assessment proved to be well suited for a systematic analysis of the environmental footprint of the activities of Berliner Wasserbetriebe. In the future, the existing process model can be extended to include the entire wastewater treatment plant for a comprehensive evaluation of its environmental profile, e.g. for providing information on the environmental consequences of prospective concepts for site development.

v
Abstract (German)
Das Ziel dieser Studie ist die Anwendung der Ökobilanz-Methodik als Werkzeug zur Systemanalyse in der Abwasserreinigung. Dazu wird der Prozeß der Schlamm-behandlung und –entsorgung im Klärwerk Berlin-Waßmannsdorf mit der Methodik der Ökobilanz analysiert, um den gesamten kumulierten Verbrauch an Primärenergie und den CO2-Fußabdruck des Systems als exemplarische Umweltindikatoren zu ermitteln. Neben der Erfassung des Status quo im Jahr 2009 werden verschiedene Maßnahmen zur energetischen Optimierung des Systems in ihren Auswirkungen auf die Energiebilanz und die Emission von Treibhausgasen bewertet. Das Stoffstrommodell des Systems umfasst alle relevanten Prozesse der Schlammbehandlung und –entsorgung einschließlich der Bereitstellung von Strom und Chemikalien, dem Transport und der Verbrennung des Schlamms und der Behandlung der rückgeführten Schlammwässer im Hauptstrom des Klärwerks. Gewonnene Produkte aus der Schlammbehandlung (Biogas aus der Schlammfaulung und MAP-Dünger) und Verbrennung (Strom und Ersatz fossiler Brennstoffe) werden über Kredite für die substituierten Produkte angerechnet.
Insgesamt hat die Schlammbehandlung und –entsorgung in Berlin-Waßmannsdorf eine positive Energiebilanz, so dass ein Nettoüberschuss von 162 MJ oder 45 kWh Primärenergie pro Einwohnerwert und Jahr (EWCSB*a) erzielt werden kann. Dies liegt vor allem an der Klärgasverwertung aus der Schlammfaulung und an dem Ersatz fossiler Brennstoffe in der Mitverbrennung. Analog dazu zeigt der CO2-Fußabdruck eine Einsparung von 11.6 kg CO2-eq/(EWCSB*a) als vermiedene Emissionen, was den Umweltvorteil der Energierückgewinnung aus Klärschlamm aufzeigt. Allerdings beruhen die ermittelten Prozessemissionen der starken Treibhausgase CH4 und N2O nur auf generischen Faktoren aus der Literatur, können aber einen entscheidenden Einfluss auf den gesamten CO2-Fußabdruck haben. Notwendig wäre hier die genaue Erfassung der Emissionen auf der Anlage durch Messungen, um die Ergebnisse dieser Ökobilanz abzusichern.
Die Bewertung der Optimierungsmaßnahmen zeigt die Vorteile einer umfassenden Systemanalyse: eine Erhöhung der zurückgewonnenen Energie wird teilweise oder komplett durch erhöhten Energieverbrauch ausgeglichen, und der CO2-Fußabdruck korreliert nicht immer mit der energetischen Bilanz. Die verschiedenen Wege der Schlammverbrennung unterscheiden sich erheblich in ihren Umweltauswirkungen und zeigen Potentiale zur Verbesserung auf, besonders in der Monoverbrennung des Klärschlamms. Einige Maßnahmen verbessern sowohl die Energiebilanz als auch den CO2-Fußabdruck (Dosierung von Co-Substraten in die Faulung, Nutzung der Überschusswärme über einen Organic Rankine Cycle-Prozess), während andere den Energieverbrauch senken, aber den CO2-Fußabdruck möglicherweise erhöhen (Schlammwasserbehandlung mit Deammonifikation, thermische Hydrolyse des Überschussschlamms).
Insgesamt zeigt sich, dass die Methodik der Ökobilanz für eine systematische Analyse der Umweltwirkungen der Aktivitäten der Berliner Wasserbetriebe sehr gut geeignet ist. Zukünftig kann das aufgebaute Prozessmodell auf das gesamte Klärwerk erweitert werden, um eine umfassende Bewertung der Umweltauswirkungen dieses Prozesses zu ermöglichen, z.B. um Informationen über die Umweltauswirkungen von geplanten Maßnahmen im Rahmen eines Standortentwicklungskonzeptes bereitzustellen.

vi
Abstract (French)
L’objet de cette étude est de démontrer l’applicabilité de la méthode d’analyse du cycle de vie (ACV) comme outil d’analyse systémique de filières d’assainissement. A cet effet, la filière de traitement et de destruction des boues de la station d´assainissement Waßmannsdorf de Berlin a été analysée par la méthode de l´analyse du cycle de vie (ACV). Cette analyse consistait à déterminer la demande cumulée en énergie totale et l´empreinte carbone du système. En plus de la caractérisation du status quo en 2009, plusieurs mesures d´optimisation énergétique du système ont été évaluées ainsi que leurs effets sur la balance énergétique et les émissions de gaz à effet de serre. Le modèle du système inclut tous les procédés pertinents du traitement des boues et de leurs éliminations, comprenant l´alimentation en électricité et en produits chimiques, le transport et l´élimination de la boue ainsi que le traitement de la liqueur de boue qui est recyclée en entrée de la station d´épuration. Les produits récupérés durant le traitement des boues (biogaz pour la digestion anaérobique et engrais MAP) et leurs éliminations par incinération (électricité ou substitution des combustibles fossiles) sont comptés comme crédits pour les produits substitués respectifs.
Globalement, le traitement des boues et leurs éliminations à Berlin-Waßmannsdorf est un procédé énergétiquement positif, récupérant une quantité d´énergie nette de 162 MJ (45 kWh) par équivalent-habitant et année (EHDCO*a). Ceci est principalement dû au biogaz généré dans la digestion anaérobique et la substitution des combustibles fossiles dans la co-incinération. De manière similaire, l´empreinte carbone du procédé révèle une quantité de 11,6 kg CO2-eq/(EHDCO*a) d´émissions évitées, indiquant ainsi un bénéfice environnemental de la récupération d´énergie provenant des boues d´épuration. Cependant les émissions de puissants gaz à effet de serre CH4 et N2O du procédé sont estimés en se basant sur des facteurs génériques d´émission provenant de la littérature, et peuvent avoir une influence importante sur l´empreinte carbone globale. Ceci souligne la nécessité d´appuyer les résultats de cette ACV avec des données fondamentales provenant de la surveillance des émissions sur site.
L´évaluation des mesures d´optimisation montre les bénéfices d´une analyse à l´échelle du système : une récupération améliorée de l´énergie est partiellement compensée par l´augmentation de la demande énergétique, et l´empreinte carbone n´est pas toujours corrélée avec la balance énergétique. Les différents moyens d´éliminer la boue, et particulièrement la mono-incinération des boues d´épuration, diffèrent beaucoup dans leur profil environnemental et révèlent un potentiel d´optimisation. Certaines mesures sont bénéfiques à la fois pour l´empreinte énergétique et carbonique (addition de co-substrats dans le digesteur, utilisation de l’excès de chaleur dans le procédé par cycle organique de Rankine), pendant que d´autres peuvent diminuer la demande énergétique mais augmenter potentiellement l´empreinte carbone (traitement des boues d´épuration par déammonification, hydrolyse thermale des boues en excès).
Globalement, la méthode de l´analyse du cycle de vie se révèle être bien adaptée pour une analyse systématique de l´empreinte environnementale pour les activités de Berliner Wasserbetriebe. Dans le futur, le modèle existant peut être étendu pour inclure l´installation globale de traitement des eaux usées pour une évaluation claire de son profil environnemental, en fournissant des informations sur les conséquences environnementales de futurs concepts pour le développement du site.
vii
Acknowledgements
This study was financed by Berliner Wasserbetriebe. The supervision of this study was performed by Jan Waschnewski (BWB) and Boris Lesjean (KWB), who are thanked for their valuable input. An explicit thanks to Jan Waschnewski for continuous support with data collection and process understanding!
The substance flow model of the process is based on a variety of data collected from the full-scale plant in Berlin-Waßmannsdorf. In detail, the following persons of Berliner Wasserbetriebe are thanked for their support and willingness to cooperate for this study and for interesting discussions: Regina Gnirss, Matthias Schäfer, York Winkelmann, Andreas Lengemann, Martin Garz, Ingo Klawonn, Christine Jacksteit, Gerald Schlegel, and Raimund-Edward Kurz.

viii
Table of Contents
Chapter 1 Introduction and layout of the study ................................................................ 1
Chapter 2 Definition of goal and scope ........................................................................... 2
2.1 Goal and target group ............................................................................................ 2
2.2 Function and functional unit ................................................................................... 2
2.3 Reference input flows ............................................................................................ 2
2.4 System expansion ................................................................................................. 3
2.5 Description of the investigated scenarios ............................................................... 4
2.5.1 Baseline scenario ............................................................................................ 5
2.5.2 Disposal routes ............................................................................................... 7
2.5.3 Sludge liquor treatment ................................................................................... 7
2.5.4 Utilization of excess heat................................................................................. 7
2.5.5 Addition of co-substrates ................................................................................. 8
2.5.6 Sludge pretreatment by thermal hydrolysis ..................................................... 8
2.6 System boundaries ................................................................................................ 9
2.7 Data quality ......................................................................................................... 10
2.8 Indicators of Life Cycle Impact Assessment ......................................................... 11
2.9 Interpretation and sensitivity analysis .................................................................. 12
Chapter 3 Life Cycle Inventory ...................................................................................... 13
3.1 Operation of sludge treatment in Berlin-Waßmannsdorf ...................................... 13
3.1.1 Sludge thickening and digestion .................................................................... 13
3.1.2 Sludge dewatering and drying ....................................................................... 14
3.1.3 Purification and combustion of digestor gas in CHP plant ............................. 14
3.1.4 Transport and incineration of sludge ............................................................. 15
3.1.5 Treatment of recycled sludge liquor in WWTP ............................................... 17
3.2 Measures for optimisation .................................................................................... 18
3.2.1 Deammonification ......................................................................................... 18
3.2.2 Addition of cu-substrates ............................................................................... 19
3.2.3 Organic Rankine Cycle ................................................................................. 19
3.2.4 Thermal hydrolysis ........................................................................................ 20
3.3 Background processes ........................................................................................ 20
3.3.1 Electricity supply ........................................................................................... 20
3.3.2 Transport by truck ......................................................................................... 20
3.3.3 Supply of fuels and chemicals ....................................................................... 21
3.3.4 Production of industrial nitrogen and phosphorus fertilizer ............................ 21

ix
Chapter 4 Life Cycle Impact Assessment ...................................................................... 22
4.1 Environmental impacts of sludge treatment and disposal ..................................... 22
4.2 Environmental impacts of optimization measures ................................................ 25
4.2.1 Disposal routes.............................................................................................. 25
4.2.2 Sludge liquor treatment ................................................................................. 26
4.2.3 Utilization of excess heat ............................................................................... 28
4.2.4 Addition of co-substrates ............................................................................... 28
4.2.5 Sludge pre-treatment by thermal hydrolysis ................................................... 30
4.3 Summary of results for optimization measures ..................................................... 32
Chapter 5 Conclusions .................................................................................................. 35
Appendix A .................................................................................................................... 38
Bibliography .................................................................................................................. 39

x
List of Figures
Figure 1: Scope of LCA study of sludge handling and disposal in Waßmannsdorf 2009 . 6
Figure 2: Cumulative energy demand of sludge treatment and disposal in Waßmannsdorf
2009 .............................................................................................................................. 22
Figure 3: Cumulative energy demand of sludge treatment and disposal in 2009, including
credits for products ....................................................................................................... 23
Figure 4: Carbon footprint of sludge treatment and disposal in Waßmannsdorf 2009 .... 24
Figure 5: Carbon footprint of sludge treatment and disposal 2009, including credits for
products ........................................................................................................................ 24
Figure 6: Cumulative energy demand of different routes for sludge disposal ................. 25
Figure 7: Carbon footprint of different routes for sludge disposal .................................. 26
Figure 8: Cumulative energy demand of sludge liquor treatment with Anammox process
..................................................................................................................................... 27
Figure 9: Carbon footprint of sludge liquor treatment with Anammox process ............... 27
Figure 10: Additional electricity production and economic benefits of utilization of excess
heat via ORC process ................................................................................................... 28
Figure 11: Cumulative energy demand with addition of co-substrates ........................... 29
Figure 12: Carbon footprint with addition of co-substrates ............................................. 30
Figure 13: Cumulative energy demand of thermal hydrolysis ........................................ 31
Figure 14: Carbon footprint of thermal hydrolysis .......................................................... 31
Figure 15: Cumulative energy demand of baseline and optimization scenarios ............. 32
Figure 16: Carbon footprint of baseline and optimization scenarios ............................... 33
Figure 17: Relative effect of optimization measures on cumulative energy demand and
carbon footprint ............................................................................................................. 34
Figure 18: Cumulative energy demand and carbon footprint of sludge treatment and
disposal in Waßmannsdorf 2009 ................................................................................... 35
Figure 19: Screenshot of UMBERTO process model .................................................... 38

xi
List of Tables
Table 1: Reference input flows: quantity and quality of primary and excess sludge in
WWTP Waß 2009 ........................................................................................................... 3
Table 2: Secondary products of sludge handling in Waßmannsdorf and their respective
substituted products ........................................................................................................ 4
Table 3: List of scenarios for LCA of sludge handling and disposal in Berlin-
Waßmannsdorf ................................................................................................................ 5
Table 4: Gas yields, CH4 content and degradation in digestors ..................................... 14
Table 5: Total amount of biogas and generated electricity and heat in 2009 ................. 15
Table 6: Disposal routes for sludge from WWTP Waßmannsdorf in 2009 ..................... 16
Table 7: Return load with sludge liquor and estimated energy demand and emissions for
its treatment in WWTP Waßmannsdorf in 2009 ............................................................. 18
Table 8: Characteristics of co-substrates ....................................................................... 19
Table 9: Life cycle data for chemicals production .......................................................... 21

xii
Acronyms
CED - Cumulative energy demand
CHP - Combined heat and power plant
COD - Chemical oxygen demand
DM - Dry matter
GJ - Gigajoule
GHG - Greenhouse gas
GWP - Global warming potential
IPCC - Intergovernmental Panel on Climate Change
ISO - International Organisation for Standardisation
LCA - Life Cycle Assessment
MAP - Magnesium-Ammonium-Phosphate
MJ - Megajoule
oDM - organic dry matter
ORC - Organic Rankine Cycle
PE - Population equivalent
TS - Total solids
WWTP - Wastewater treatment plant

1
Chapter 1
Introduction and layout of the study
Sewage treatment plants are known to be the main energy user of urban water management infrastructure. Additionally, they represent the greatest consumer of energy within the community services of municipalities, before schools, hospitals and other municipal facilities (Haberkern et al. 2008). In light of these facts, increased efforts have been made in recent years to improve the energy efficiency of the wastewater treatment process. This includes optimization measures to increase energetic efficiency of processes, modifications in process design, and increased recovery of energy via sludge digestion. The final vision of the sewage treatment plant of the near future would be an energy self-sufficient or even energy-positive process which complies with rising standards in effluent quality and environmental impact.
However, most optimization measures only target the decrease in direct electrical energy demand, i.e. the reduction of the amount of electricity consumed. Indirect effects of the optimization on other processes or environmental impacts can thus be overlooked and may negatively influence the overall energy balance and environmental footprint. For an overall evaluation of optimization measures, a comprehensive evaluation of all direct and indirect effects should be targeted to provide decision support for choosing the most preferable option.
An adequate tool for this task is the methodology of Life Cycle Assessment (LCA). Originally developed for the assessment of products, LCA has already been applied for the evaluation of water and wastewater treatment processes (e.g. IFEU 2002 ; Lundie et al. 2004; Wenzel et al. 2008). Through a step-by-step procedure, LCA can systematically evaluate different scenarios by stating goal and scope of the study, setting up an inventory with process data, and evaluate this system with a set of environmental indicators.
Berliner Wasserbetriebe has acknowledged the need for tools to assess the environmental impacts of their operation and wants to test LCA in its suitability for this purpose. Embedded in the research project CoDiGreen (2010-2012) managed by the Berlin Centre of Competence for Water (KWB), the present work will show the applicability of LCA for evaluating different options for process optimisation in wastewater treatment. According to the targets of Berliner Wasserbetriebe, the focus of this LCA is on system analysis and optimization of the process for sludge treatment and disposal in the wastewater treatment plant in Berlin-Waßmannsdorf. Regarding the environmental impacts, this study is per definition limited to assessing the impacts on total energy demand and the emission of greenhouse gases (“carbon footprint”).
The methodology of this study closely follows the guidelines defined in the standards of ISO 14040 and 14044 (ISO 14040 2006; ISO 14044 2006). The report contains a chapter on system definitions (“goal and scope”), a chapter on the process data (“life cycle inventory”), a chapter on the results (“life cycle impact assessment”), and a final summary with discussion and conclusions (“interpretation”). A critical review by an external expert as required in ISO 14040 for studies that are disclosed to the public is not formally implemented due to the limited timeframe and budget and the internal usage of the study within Berliner Wasserbetriebe.

2
Chapter 2
Definition of goal and scope
2.1 Goal and target group
The goal of this Life Cycle Assessment is to test the methodology of LCA with an exemplary process of BWB and show its capabilities for system analysis. Per definition of BWB, the scope of the study encompasses the handling of sewage sludge in a large-scale wastewater treatment plant in Berlin-Waßmannsdorf. Regarding environmental impacts, the study has a distinct focus on energetic aspects and greenhouse gas emissions as defined in the project proposal. The reference year for system data is 2009. The target group of this study is composed of decision-makers and related staff within BWB, together with selected persons of KWB and other research institutions.
2.2 Function and functional unit
The function of the system under review is the handling of sewage sludge generated
during the wastewater treatment process at Waßmannsdorf (WWTP Waß). Sewage sludge is generated at different points during the treatment process, i.e. primary sludge from sedimentation stage (= particulate organic matter from raw wastewater) and secondary or excess sludge from the activated sludge process (= microbial “activated” sludge purifying wastewater in a biological process via uptake or metabolism of organics and nutrients). Both sludges are mixed, stabilised by anaerobic digestion and dewatered or dried for volume reduction prior to transport to final disposal via incineration.
The functional unit of this LCA relates the function of the system to the total annual organic load of the WWTP, representing the amount of pollution (= organics) that arrives at the WWTP. A common unit in wastewater treatment is the organic load per “population equivalent”, which is defined as the amount of 120 g chemical oxygen demand (COD) per person and day (120 g COD/(pe*d), ATV 2000). Consequently, the functional unit of this study is defined as follows:
Functional unit: Treatment of sewage sludge originating from the treatment of wastewater of one population equivalent (PECOD) per year � Unit: (PECOD*a)-1
On average, the WWTP Waß receives an organic wastewater load of 1.5 Mio PECOD per year (Zech 2008). Hence, the total annual environmental impacts are divided by the factor of 1500000 to end up with the annual environmental impacts per population equivalent.
2.3 Reference input flows
The reference input flows are defined as the two different types of sludge which enter the system of sludge handling, i.e. primary and excess sludge. The composition of these
3
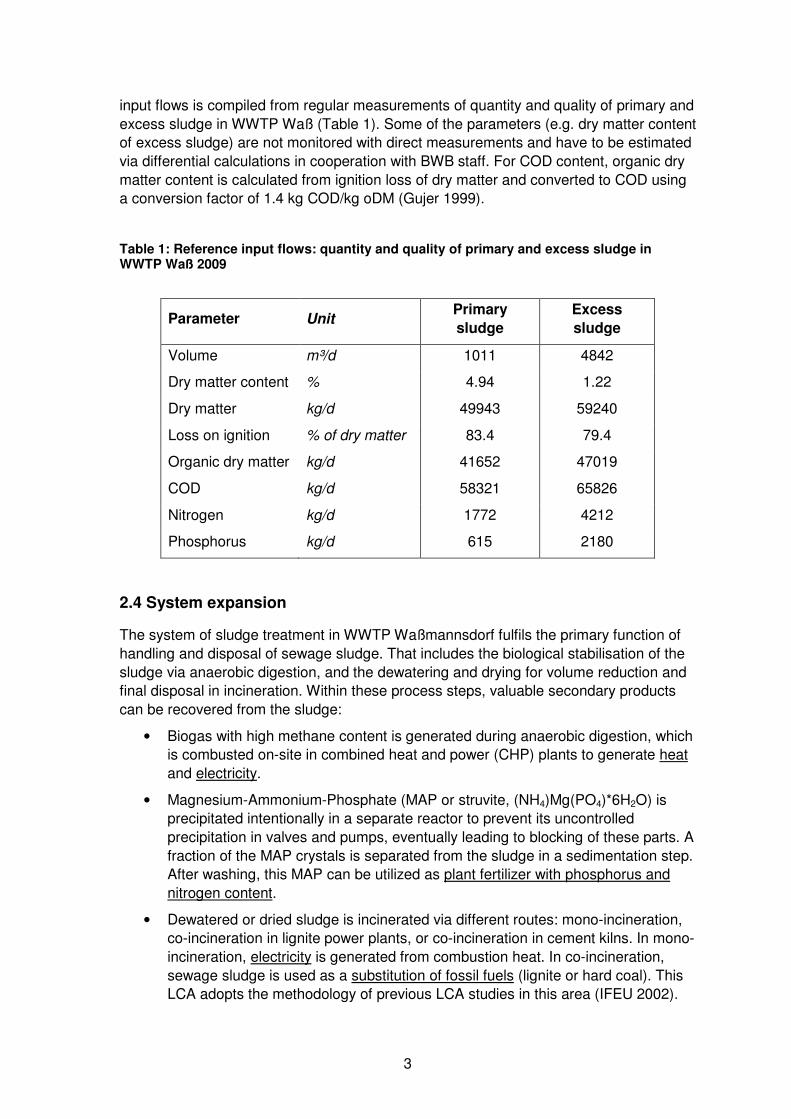
input flows is compiled from regular measurements of quantity and quality of primary and excess sludge in WWTP Waß (Table 1). Some of the parameters (e.g. dry matter content of excess sludge) are not monitored with direct measurements and have to be estimated via differential calculations in cooperation with BWB staff. For COD content, organic dry matter content is calculated from ignition loss of dry matter and converted to COD using a conversion factor of 1.4 kg COD/kg oDM (Gujer 1999).
Table 1: Reference input flows: quantity and quality of primary and excess sludge in WWTP Waß 2009
Parameter Unit Primary
sludge
Excess
sludge
Volume m³/d 1011 4842
Dry matter content % 4.94 1.22
Dry matter kg/d 49943 59240
Loss on ignition % of dry matter 83.4 79.4
Organic dry matter kg/d 41652 47019
COD kg/d 58321 65826
Nitrogen kg/d 1772 4212
Phosphorus kg/d 615 2180
2.4 System expansion
The system of sludge treatment in WWTP Waßmannsdorf fulfils the primary function of handling and disposal of sewage sludge. That includes the biological stabilisation of the sludge via anaerobic digestion, and the dewatering and drying for volume reduction and final disposal in incineration. Within these process steps, valuable secondary products can be recovered from the sludge:
• Biogas with high methane content is generated during anaerobic digestion, which is combusted on-site in combined heat and power (CHP) plants to generate heat and electricity.
• Magnesium-Ammonium-Phosphate (MAP or struvite, (NH4)Mg(PO4)*6H2O) is precipitated intentionally in a separate reactor to prevent its uncontrolled precipitation in valves and pumps, eventually leading to blocking of these parts. A fraction of the MAP crystals is separated from the sludge in a sedimentation step. After washing, this MAP can be utilized as plant fertilizer with phosphorus and nitrogen content.
• Dewatered or dried sludge is incinerated via different routes: mono-incineration, co-incineration in lignite power plants, or co-incineration in cement kilns. In mono-incineration, electricity is generated from combustion heat. In co-incineration, sewage sludge is used as a substitution of fossil fuels (lignite or hard coal). This LCA adopts the methodology of previous LCA studies in this area (IFEU 2002).

4
In this LCA, the secondary products of sludge handling are accounted for by subtracting the environmental impacts of substituted products (electricity, phosphorus and nitrogen mineral fertilizer, or fossil fuels) (Table 2). This approach is called “avoided burden” and can be used to account for secondary functions of processes (Curran 2007).
Table 2: Secondary products of sludge handling in Waßmannsdorf and their respective substituted products
Secondary products of sludge handling Equivalent products accounted as
credits (“avoided burden”)
Electricity from biogas combustion Grid electricity
Heat from biogas combustion Utilized heat: use on-site
Excess heat: not accounted
Nitrogen and phosphorus in MAP (100% plant-available)
Mineral nitrogen and phosphorus fertilizer
Electricity generated during mono-incineration
Grid electricity
Organic matter of dewatered and dried sludge as fuel in co-incineration
Provision of fossil fuels (power plant: lignite, cement kiln: hard coal)
For electricity, the substituted amount of grid electricity is directly calculated as the amount of electricity generated during biogas combustion or mono-incineration. Heat generated in CHP plant is either utilized on-site for digester heating and other purposes or is emitted to the environment as excess heat. Hence, heat is not accounted for in the system expansion. Nutrients in separated MAP are accounted as mineral fertilizer, assuming 100% plant-availability. For the substitution of fossil fuels in co-incineration, the amount of substituted lignite or hard coal is calculated using the lower heating value of sewage sludge and the respective fossil fuels (cf 3.1.4).
2.5 Description of the investigated scenarios
The baseline scenario of this LCA represents the status quo of sludge handling in Berlin-Waßmannsdorf in the year 2009. As optimization scenarios for the existing process, several options are defined in consultation with BWB as listed in Table 3. The scenarios include different routes for disposal, the introduction of new processes (liquor treatment, ORC, thermal hydrolysis) and the addition of different co-substrates into the digestion process. All scenarios are briefly described in the following chapters, whereas the process data can be found in Chapter 3.

5
Table 3: List of scenarios for LCA of sludge handling and disposal in Berlin-Waßmannsdorf
Scenario name Scenario type Definition
Waß2009 Baseline Existing process of sludge handling and disposal in the year 2009
Mono-incineration Disposal route 1 Total amount of sludge to mono-incineration
Power plant Disposal route 2 Total amount of dewatered sludge to lignite power plant (no drying)
Drying + power plant
Disposal route 3 Total amount of sludge to drying and lignite power plant
Drying + cement kiln
Disposal route 4 Total amount of sludge to drying and cement kiln
Anammox Sludge liquor treatment
Treatment of sludge liquor with deammonification process (target: nitrogen)
ORC Utilization of excess heat
Utilization of excess heat with organic rankine cycle process
CoSub Fats Co-substrates 1 Addition of fats + food scraps at full capacity (8500 m³ fats + 28500 m³ food scraps)
CoSub Fats dewat Co-substrates 2 Addition of fats + food scraps at full capacity plus negative effect on dewaterability
CoSub Grass4 Co-substrates 3 Addition of grass silage as co-substrate (+4% TS = 6400 t/a)
CoSub Grass8 Co-substrates 4 Addition of grass silage as cosubstrate (+8% TS = 12800 t/a)
Hydrolysis Pretreatment of excess sludge
Thermal hydrolysis of excess sludge, treatment of liquor for refractory COD and N
2.5.1 Baseline scenario
The baseline scenario represents the status quo of sludge handling and disposal in the WWTP Berlin-Waßmannsdorf in 2009. It consists of sludge digestion, dewatering and drying, biogas utilization, and sludge disposal (Figure 1). Additionally, the treatment of sludge liquors recycling back to the inlet of the treatment plant is included in this LCA by estimating the energy required for this process in the WWTP.

6
Thicken
Preheat MAP
DryingCHP plant
Washing
Biological gas
purification
Hot gas
generator
Excess
sludge
Primary
sludge
BIOGAS
Flare
HEAT
Electricity
MAP
Digested
sludge
Hot gas
Air
Polymer
Polymer
Effluent
Fertilizer
Transport
Transport
Co-
substrate
Natural
gas
Transport Conditioning
MgCl2
Digestor
1-stage
Strain
press
Elementary
sulphur
Transport
Treatment
of return
flow in
WWTP
CONDENSATE
Incinerator
Ruhleben
Coal
power plant
Cement
plant
BIOGAS
Grit
Heat
Fibres
+ grit
H2SO4
Digestor
1. stage
LIQUOR Dewater
Digested
sludgeDigestor
2. stage
Figure 1: Scope of LCA study of sludge handling and disposal in Waßmannsdorf 2009
Sludge digestion, dewatering and drying
Excess sludge is thickened in decanters with addition of polymers prior to mixing with primary sludge. Mixed raw sludge is filtered in a strain press to prevent the input of coarse material into the digestors. Raw sludge is preheated and distributed to digestion towers. The main part of the sludge is digested in a two-step process with a high-loaded first stage and a low-loaded second stage. A minor part of the sludge is digested in a single-step digestion process. Co-substrates such as fats and food scraps are conditioned (removing of coarse materials) and added into the second stage of the two-step process. Digested sludge is pumped to the MAP reactor (“Airlift”), where MgCl2 is added and CO2 is stripped by aeration, thus elevating the pH and enabling the precipitation of MAP. A part of the MAP is separated via sedimentation and can be used as plant fertilizer after washing. After the MAP reactor, the digested sludge is dewatered in decanters with the addition of polymers. A part of the dewatered sludge is transported directly to disposal, while the remaining part is dried in drum driers. Hot gas for the drying process is generated by the combustion of natural gas and a minor fraction of biogas. Condensate from the drying process is recycled to the WWTP inlet.
Sludge disposal
A part of the dewatered sludge (16% of DM) is transported to the mono-incineration plant in Berlin-Ruhleben, while the rest (50% of DM) is transported to different lignite power plants for co-incineration. Dried sludge can also be disposed of in lignite power plants (6% of DM), but the major part is transported to cement kilns (28% of DM).

7
Biogas utilization
Biogas from all digestors is collected and purified in a biological desulphurization unit, where the high content of H2S (~ 2000 ppm) in the biogas is eliminated by a microbial process. The purification process produces elementary sulphur (disposal as waste) or H2SO4. Purified biogas (< 70 ppm H2S) is dried, stored and combusted in CHP plants to generate electricity and heat. A minor part of the biogas is used for the hot gas generator of the sludge drying process. Each biogas process has an emergency flare, which is tested with a small amount of biogas regularly. The electricity of the CHP plants is sold externally, while the heat is used on-site for digestor heating and other purposes (hot water, buildings, etc.). Excess heat is emitted into the environment.
Treatment of return liquor in WWTP
Sludge liquor from thickening and dewatering and condensate from sludge drying is collected and pumped to the inlet of the WWTP. In this LCA, the energy demand and emissions of this treatment of the return flow is estimated with a simplified process model of the WWTP, calculating the amount of electricity and emissions as a function of volume, organic (COD) and nutrient (N + P) load in the liquor.
2.5.2 Disposal routes
The scenarios representing the different disposal routes are calculated with the process data of the baseline scenario. For each disposal route scenario, it is simply assumed that 100% of the sludge is disposed using the respective disposal route. Transport distances to the disposal facilities are defined for each route separately.
2.5.3 Sludge liquor treatment
This scenario represents the setup of a deammonification process for the sludge liquor from dewatering. Sludge liquor from dewatering and condensate from sludge drying is heavily loaded with nitrogen and organic matter (COD), resulting in a considerable additional nitrogen load to the WWTP. This nitrogen return load can be decreased by a deammonification process for the sludge liquor, using a low-energy biological process called “Anammox” (Beier et al. 2008). Sludge water from thickening of excess sludge is not treated in the deammonification process, but is still recycled directly to the inlet of the plant together with the effluent from the Anammox process. The handling of the sludge generated in the Anammox process is neglected in the LCA model due to the low amounts of sludge (< 10 m³/d).
2.5.4 Utilization of excess heat
Excess heat from the CHP plants can be utilized in an energy conversion process based on the organic rankine cycle (ORC). In this process, heat is converted into electricity by evaporating an organic fluid with low vaporization temperature. This fluid is then fed to a turbine for electricity generation, before it is re-condensed to enter the cycle again. The ORC process has a relatively low efficiency (net conversion of 14-18% of heat to

8
electricity), but allows the utilization of low-grade heat. The process has no emissions and thus is environmentally beneficial, especially for the conversion of waste heat to electricity which would normally be emitted to the environment without usage.
2.5.5 Addition of co-substrates
If the capacity of the digestors exceeds the required capacity for the digestion of sewage sludge in reasonable retention times, additional biogenic substrates can be dosed into the digestor to increase the production of biogas (MUNLV 2001). The list of possible co-substrates includes substrates from different origins such food waste (fats, food scraps, sludges from food production, etc.) and agricultural substrates (grass or other energy crops). It is assumed that all co-substrates are dosed in the second stage of the two-step digestion process (high-load digestion), as is the case in 2009. For the future, it is planned to dose co-substrates in the single-step digestion process.
Fats and food scraps
In Berlin-Waßmannsdorf, the dosing of fats and food scraps as co-substrates has been started in 2009 with small amounts (~ 4300 m³, mostly grease trap waste) to check the influence on the digestion process. Hence, the first scenario will represent the dosing of fats and food scraps at full capacity (8500 m³ fats and 28500 m³ food scraps per year). The second scenario adds the same amount of co-substrates, but will also reflect a negative effect on the performance of sludge dewatering (i.e. lower final TS content of dewatered sludge, higher demand for polymers) that has been monitored in Waßmannsdorf, but could not directly be causally related to co-substrate addition. Thus, the second scenario is a “worst-case” scenario for the system performance if fats and food scraps really lead to a negative effect in dewaterability.
Grass silage
The dosing of grass silage as a co-substrate is investigated in pilot and full-scale trials at the WWTP Braunschweig (work package 3 of CoDiGreen). Therefore, grass grown on infiltration fields in Braunschweig is harvested and stabilized by silage in airtight tubes. After the silage process is finished, grass silage is dosed to the digestor tanks where its organic matter content is partially converted to biogas. The two scenarios for grass silage represent two different amounts of dosing: a minor dosage adding 4% of dry matter as grass silage (= 6400 t/a) and a maximum dosage of 8% (= 12800 t/a). Both scenarios are calculated with biogas yields and degradation ratios from the pilot scale experiments in Braunschweig (for details see separate report for project CoDiGreen). Further effects of grass silage on the sludge dewatering process are neglected here.
2.5.6 Sludge pretreatment by thermal hydrolysis
Typically, the degradability of organic matter in excess sludge is limited in anaerobic digestion. This sludge contains large fractions of microbial cells or microbial compounds that are not readily biodegradable, mainly because the organic matter is not hydrolyzed (= dissolved in the water phase). Different processes based on thermal, chemical or

9
biological processes are available to increase the hydrolysis of organic compounds and improve the degradability of the organic matter (Müller et al. 2005).
A promising approach is the thermal hydrolysis of excess sludge by steam injection: excess sludge is preheated before steam is added to the sludge, reaching a temperature of 160°C and a pressure of 5 bar for 30 minutes. After hydrolysis, sludge is depressurized and excess heat is recovered for sludge preheating. This process has been investigated in pilot trials in Braunschweig (work package 3 of CoDiGreen), and this scenario is based on the results of these pilot trials in terms of additional gas yields.
Another effect of thermal hydrolysis is the increase of dissolved fractions of nitrogen and refractory COD in the sludge liquor, leading to a substantial increase of N and CODref which is recycled back to the inlet of the WWTP. However, the WWTP in Berlin-Waßmannsdorf operates at full capacity for these parameters, so that the implementation of a thermal hydrolysis would require additional treatment steps for the sludge liquor from sludge dewatering. Hence, the scenario of thermal hydrolysis includes a two-step process for sludge liquor treatment: first a coagulation stage for the removal of refractory COD (addition of ferric chloride), and then a deammonification stage for the removal of nitrogen (Anammox process, cf. chapter 2.5.3). For both processes, the disposal of sludge in small amounts is neglected in this LCA. Ferric sludge from coagulation contains refractory COD and may pose difficulties in disposal.
2.6 System boundaries
This LCA includes all processes that are required for the handling and disposal of sewage sludge (Figure 1), starting from the raw sludge (primary and excess sludge) until the incineration of digested and dewatered or dried sludge.
The following definitions specify the system boundaries of this LCA:
• For all processes, this LCA is restricted to the impacts caused by process operation. All infrastructure or capital equipment is excluded from the assessment. It has been shown that the impact of WWTP infrastructure is likely to be negligible (<5%) compared to the impacts from its operation (Remy 2010).
• The production and transport of electricity, natural gas and chemicals required for the process is included.
• The treatment of sludge liquors recycled to the WWTP inlet is included with a simplified model of the energy demand and major emissions of the WWTP process (cf. 3.1.5).
• For the incineration processes, transport and major emissions during incineration are included, as is the transport of the ashes from incineration to landfill. However, emissions from landfills are excluded from this LCA due to lack of data.
• For co-substrates fats and food scraps, it is assumed that they are waste from other processes. Thus, environmental impacts associated with their production, processing, collection etc. is allocated to the primary function (e.g. in the food industry). This allocation can be supported by the economic value, because food producers are charged a fee for the disposal of their waste in the WWTP.

10
However, transport of co-substrates from the point of collection to the WWTP is included in this LCA.
• For grass silage as co-substrate, environmental impacts of production, harvesting and silage process is not included in this LCA due to lack of data. However, it is estimated that the environmental impacts of these processes are negligible compared to the total environmental impacts of sludge handling and disposal.
Considered elementary flows
For the process model of sludge handling and treatment, the following material flows are included in this LCA:
• Volume (or weight for co-substrates)
• Dry matter
• COD
• Nitrogen
• Phosphorus
For the environmental impacts assessed in this study, the following emissions are relevant:
• Cumulative energy demand of fossil and nuclear origin
• Global warming potential: CO2 from fossil sources, CH4, and N2O
Other emissions of environmental concern (inorganic and organic pollutants such as heavy metals, polycyclic aromatic hydrocarbons, dioxins, …) are explicitly excluded for the impact assessment of this LCA. However, it would be possible to assess other environmental impacts with LCA (e.g. human toxicity, ecotoxicity) if primary data for these emissions are available. Necessary primary data would include pollutant content of sewage sludge and information on the fate of pollutants in drying and incineration processes.
The geographical and temporal scope of this LCA is limited to the specific boundary conditions of the WWTP of Berlin-Waßmannsdorf for the reference year 2009. As each WWTP has specific conditions of sludge quality and process layout, the results are not directly transferable to other WWTPs.
2.7 Data quality
The primary data for the process model has been collected in cooperation with the process engineers of the WWTP Berlin-Waßmannsdorf.
• Substance flow data is based on regular monitoring of quality and quantity of sludge and liquor, following the different process steps up to final dewatering or

11
drying. Data was extracted from the internal data management system of BWB (ISA). However, a WWTP is a dynamic biological process, and sludge quality and quantity may vary with weather conditions, process operations or simply in the sequence of seasons. Hence, it is difficult to obtain a closed balance and thus a conclusive picture of the “average” annual operation of such a facility, even if monitoring data is readily available. Finally, all input data for this LCA has been validated and all inconsistencies have been solved in cooperation with the operating staff of the WWTP.
• Data for the demand of electricity, heat, natural gas, and chemicals of each process is provided by BWB operating staff. For electricity, monitoring data is only available in four larger sub-parts of the system (“Bilanzkreise”), so that allocation of the electricity demand to specific processes has been estimated according to generic energy data (MUNLV 1999). The total sum of electricity demand in each sub-part of the process model equals the measured electricity demand.
• The distribution of dewatered sludge to the different disposal routes is defined by the effective disposal routes in 2009. For transport distances, a mean weight-based transport distance for each route is calculated based on estimated distances to each incineration facility.
• Data for the incineration facilities is estimated from simplified process models or using generic emission factors.
Background data for transport processes and the production of electricity, natural gas or chemicals is extracted from the international database ecoinvent 2007 (Ecoinvent 2007), representing average German or European conditions.
2.8 Indicators of Life Cycle Impact Assessment
Per definition, this LCA focuses on the assessment of energy demand and global warming potential. Consequently, the impact assessment is limited to the following indicators:
1. Cumulative energy demand (CED) of non-renewable resources, summarizing the demand of primary energy from fossil and nuclear sources (VDI 1997). The CED is expressed in megajoule (MJ).
2. Global warming potential (GWP) for a time horizon of 100a, using the emission factors published by the IPCC (IPCC 2007). The GWP is expressed in kg CO2-equivalents (GWPCO2, fossil = 1 kg CO2-eq, GWPCH4 = 23 kg CO2-eq, GWPN2O = 298 kg CO2-eq). CO2 emissions from biogenic sources (“short-cycle CO2”) are not accounted for global warming, e.g. CO2 contained in biogas or emitted from CHP plant while combusting biogas or CO2 from incineration of sewage sludge. The global warming potential is also indicated as “carbon footprint” in this study.
All other environmental impacts are explicitly excluded from the scope of this LCA. However, the framework of LCA allows including other indicators of environmental concern (e.g. impacts on human toxicity or ecotoxicity, acidification, eutrophication, resource depletion) in future studies to complement the results of this LCA in order to get

12
a comprehensive picture of environmental impacts associated with the sludge treatment line in Waßmannsdorf.
2.9 Interpretation and sensitivity analysis
Interpretation of the results of this LCA is based on the results of the status quo for 2009 (baseline scenario). For the baseline scenario, allocation of the impacts on the different process steps is shown to reveal the contribution of the specific processes to the overall environmental impact. For the optimization scenarios, the relative change in impacts compared to the baseline scenario is reported to visualize the potential effects of the specific measure on the overall process. Sensitivity analysis is skipped in this LCA due to the limited timeframe of the study, but existing uncertainties for decisive parameters of the assessment will be addressed in the discussion.

13
Chapter 3
Life Cycle Inventory
3.1 Operation of sludge treatment in Berlin-Waßmannsdorf
The existing process of sludge handling and disposal at WWTP Berlin-Waßmanndorf includes stabilisation by anaerobic digestion, dewatering and drying, and incineration of stabilised sludge (Figure 1). This chapter summarizes all relevant data used for the process model of this LCA (“Life Cycle Inventory”). The process model is set up using the LCA software UMBERTO® (IFU and IFEU 2005).
3.1.1 Sludge thickening and digestion
Thickening and strain press
Excess sludge from activated sludge tank (1.22% TS) is thickened in decanters with dosing of polymeric flocculants (0.73 g polymer/g TS). Energy demand for the decanters is estimated to 1.5 kWh/m³ of sludge for thickening and 0.6 kWh/m³ of sludge for the pumping of excess sludge and liquor. Final TS of the thickened sludge is 6.95% TS. Remaining liquor (4030 m³/d) is recycled to the WWTP ([TS]=970 mg/L, [COD]=1136 mg/L, [N]=130 mg/L, [P]=38 mg/L). Thickened excess sludge is mixed with primary sludge and screened in a strain press (0.3 kWh/m³ of sludge) prior to pumping to the digestors.
Mesophilic digestion
Mixed sludge is preheated using 20 kWh/m³ of thermal energy before it is fed to the digestors. From monthly sludge balances, it is estimated that 2/3 of sludge is fed to two-step digestion, whereas the remaining 1/3 is fed to single-stage digestion. The digestion process requires 4.1 kWh/m³ for mixing and pumping of sludge. In the digestors, the organic matter is converted to biogas with degradation ratios of 49% for the two-step and 44% for the single-step digestion. Gas yields for the digestion cannot be measured precisely for each digestor, but for the sum of all digestor tanks (13.42 Mio m³/a with 60.5% CH4). Hence, gas yield is allocated to the digestors (Table 4). For the co-substrates, gas yields and degradation ratios are reported by internal results of BWB (Waschnewski 2010).
MAP reactor
Digested sludge is pumped to the MAP reactor (“Airlift”), where 4.8 kg MgCl2 (30%) is added per m³ of digested sludge and the sludge is aerated to strip CO2. Thus, pH value is increased and MAP crystals are formed. A part of the MAP crystals is separated via sedimentation (~ 2 t MAP/d, containing 267 kg P and 120 kg N) and can be sold as fertilizer after washing. Blowers for aeration are estimated to require 0.5 kWh/m³ of digested sludge.
In the Airlift reactor, CH4 which is still dissolved in digested sludge is emitted to the atmosphere. Assuming a 100% saturation of digested sludge at 30°C with CH4, the emitted CH4 is estimated with 18 g/m³ of digested sludge.

14
Table 4: Gas yields, CH4 content and degradation in digestors
Single-step
digestion of
sludge
Two-step
digestion of
sludge
Co-
substrates
Gas yield L/kg oDMin 366 451 592
Methane content % CH4 61 60 62
Degradation % of oDMin 44 49 90
Allocated values based on total sum of biogas, data of co-substrates depend on
quality
3.1.2 Sludge dewatering and drying
Dewatering
Digested sludge (1620 m³/d, 3.4% TS) is dewatered in high performance decanters with the addition of polymers as flocculants (up to 12.4 g/kg TS). Decanters are estimated to require 3.8 kWh/m³ of digested sludge, including pumping of liquors to the WWTP inlet. Sludge is dewatered to 26.73% TS, producing sludge liquor of 1450 m³/d ([TS]=920 mg/L, [COD]=1939 mg/L, [N]=1254 mg/L, [P]=44 mg/L).
Drying
In 2009, 34.4% of total TS in dewatered sludge is dried in drum driers at 800 °C to a final TS of 93%. The demand of electricity and heat for drying of sludge is estimated to 53 kWh/m³ and 528 kWh/m³, respectively. Heat is provided by a hot gas generator (90% efficiency, gas slippage of 0.75%) which is fed with natural gas (1430000 m³/a with lower heating value of 11.1 kWh/m³) or biogas from digestion (402600 m³/a). Exhaust gas from the hot gas generator contains 1.6*10-6 kg N2O/MJinput and 2.5*10-6 kg CH4/MJinput.
Condensate of the drying process (“Brüden”) amounts to 65 m³/d ([TS]=5210 mg/L, [COD]=5411 mg/L, [N]=1879 mg/L, [P]=1086 mg/L) and is recycled to the inlet of the WWTP.
3.1.3 Gas purification and combustion of digestor gas in CHP plant
Gas purification
Biogas from digestion is purified in a biological process where its H2S content is decreased from 1460 to below 18 ppmV, generating elementary sulphur or H2SO4. In this process, air is introduced into the system. Electricity demand for purification is estimated to 0.04 kWh/m³ biogas, and heat demand is estimated to 0.02 kWh/m³ biogas.
Combustion of digestor gas in CHP plant
97% of the annual amount of biogas is combusted in CHP plants (ηelectr = 36%, ηtherm = 44%), producing a total amount of 28590 MWh of electricity and 34940 MWh of heat per year (Table 5). 0.01% of biogas is used for testing the emergency flare, while the

15
remaining 3% of biogas are combusted in the hot gas generator for sludge drying. In the CHP plants, 0.75% of biogas is estimated to be lost due to leakages and incomplete combustion (“methane slippage”). Exhaust gas from the CHP plants contains 1.6*10-6 kg N2O/MJinput and 2.5*10-6 kg CH4/MJinput. For the operation of the CHP plants (gas compressors, drying, control), an electricity demand of 0.096 kWh/m³ biogas is estimated.
Table 5: Total amount of biogas and generated electricity and heat in 2009
Waßmannsdorf 2009
Biogas production (total) Mio m³/a 13.42
Methane content % CH4 60.5
Biogas to CHP plant Mio m³/a 13.02
Electricity MWh/a 28590
Heat* MWh/a 34940
Heat (utilized) MWh/a 17820
* thermal efficiency estimated to 44%
3.1.4 Transport and incineration of sludge
The dewatered sludge is either transported directly to incineration or dried on-site and then transported to incineration. The distribution to the different disposal pathways are defined from the actual disposal routes in 2009, and the transport distance for each disposal route is calculated as a weight-proportional mean (Table 6). The lower heating value of dry matter in dewatered and dried sludge is 14.8 MJ/kg TS, with an organic content of 66% (ISA BWB). The effective lower heating value (considering the water content in the sludge) which can be recovered in thermal valorisation is estimated to 2.2 MJ/kg for dewatered sludge (27% TS) and 13.1 MJ/kg for dried sludge (93% TS). For accounting of substitution potentials for fossil fuels in co-incineration, this LCA adopts the methodology of previous studies of sewage sludge disposal (IFEU 2002).
Mono-incineration in Ruhleben
The mono-incineration process in Berlin-Ruhleben requires the addition of fuel oil due to the low heating value of dewatered sludge (2.2 MJ/kg). A self-sustained incineration can usually be maintained with 4 MJ/kg sludge. In total, the facility requires 6000 m³ of fuel oil per year for the incineration of 44000 t TR of sludge, equalling a relative demand of 136 L fuel oil per ton TR (Waschnewski 2010). The incineration of fuel oil generates an emission of 3.15 kg CO2, fossil per kg of fuel oil (Ecoinvent 2007). The incinerator

16
generates a net energy surplus of 620 kWh/t TR (Waschnewski 2010) by using a waste heat boiler and condensing turbines.
A decisive emission for the GWP of mono-incineration is the emission factor for N2O. It is well known that mono-incineration facilities emit relatively high amounts of N2O in case of low incineration temperatures (< 900°C). Measurements of N2O at different mono-incineration facilities in Germany revealed emission factors in the range of 100-200 mg N2O/m³ exhaust gas (ATV 1996, Sänger et al. 2001). Assuming an exhaust gas volume of 8000 m³/t TS results in specific emission factors of 800-1600 g N2O/t TS. For this study, an emission factor of 990 g N2O/t TS is adopted according to the practice of IPCC for mono-incineration of sewage sludge (IPCC 2006). Primary data from measurements of the exhaust gas in Ruhleben is not available.
Ashes from mono-incineration (0.2 kg/kg TS) are transported to landfills (100km).
Table 6: Disposal routes for sludge from WWTP Waßmannsdorf in 2009
Amount Amount of
dry matter
Share of
total dry
matter
Distance
(mean)
Substitution
of primary
fuels*
t/a t TR/a % km t/a
Dewatered sludge to mono-incineration
11665 3118 15.6 35
Dewatered sludge to lignite power plants
37508 10026 50 190 9180 (lignite)
Dried sludge to lignite power plants
1205 1121 5.6 386 1820 (lignite)
Dried sludge to cement kiln
6203 5769 28.8 90 2930 (hard
coal)
Total 56561 20034 100
* Hu (dewatered sludge) = 2.2 MJ/kg, Hu (dried sludge) = 13.1 MJ/kg, Hu (lignite) = 8.65 MJ/kg, Hu (hard coal) =27.6 MJ/kg
Co-incineration in lignite power plants
The co-incineration of dewatered or dried sludge in lignite power plants substitutes the corresponding amount of lignite in these processes. The substitution potential of sludge is calculated according to the lower heating value of lignite (8.65 MJ/kg) and dewatered or dried sludge (2.2 or 13.1 MJ/kg). Thus, 1 kg of dewatered or dried sludge can substitute 0.25 and 1.71 kg lignite, respectively. The dewatered sludge is pre-dried with low-grade waste heat in the power plants prior to incineration, and thus its effective lower heating value can be fully accounted for substitution of primary fuels. Substitution of lignite prevents emissions from lignite production, transport and combustion, in particular fossil CO2 (953 g CO2/kg lignite) (Ecoinvent 2007).
17
For N2O emissions in co-incineration, it is estimated that high combustion temperatures in power plants (> 950°C) lead to minor emissions of N2O compared to mono-incineration (Svoboda et al. 2006). An emission factor of 100 g N2O/t TS (10% of mono-incineration) is used as best estimate for co-incineration in power plants.
Ashes from co-incineration in power plants (0.3 t/t TS) are transported to nearby landfills (30km).
Co-incineration in cement kilns
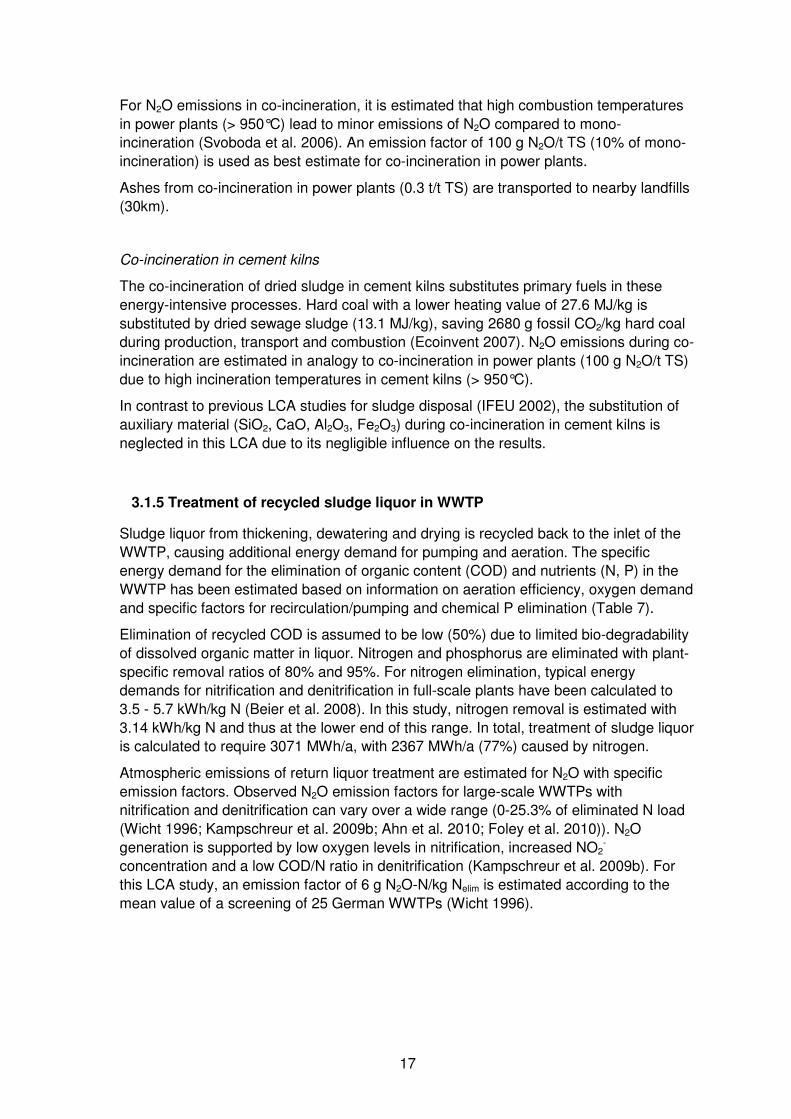
The co-incineration of dried sludge in cement kilns substitutes primary fuels in these energy-intensive processes. Hard coal with a lower heating value of 27.6 MJ/kg is substituted by dried sewage sludge (13.1 MJ/kg), saving 2680 g fossil CO2/kg hard coal during production, transport and combustion (Ecoinvent 2007). N2O emissions during co-incineration are estimated in analogy to co-incineration in power plants (100 g N2O/t TS) due to high incineration temperatures in cement kilns (> 950°C).
In contrast to previous LCA studies for sludge disposal (IFEU 2002), the substitution of auxiliary material (SiO2, CaO, Al2O3, Fe2O3) during co-incineration in cement kilns is neglected in this LCA due to its negligible influence on the results.
3.1.5 Treatment of recycled sludge liquor in WWTP
Sludge liquor from thickening, dewatering and drying is recycled back to the inlet of the WWTP, causing additional energy demand for pumping and aeration. The specific energy demand for the elimination of organic content (COD) and nutrients (N, P) in the WWTP has been estimated based on information on aeration efficiency, oxygen demand and specific factors for recirculation/pumping and chemical P elimination (Table 7).
Elimination of recycled COD is assumed to be low (50%) due to limited bio-degradability of dissolved organic matter in liquor. Nitrogen and phosphorus are eliminated with plant-specific removal ratios of 80% and 95%. For nitrogen elimination, typical energy demands for nitrification and denitrification in full-scale plants have been calculated to 3.5 - 5.7 kWh/kg N (Beier et al. 2008). In this study, nitrogen removal is estimated with 3.14 kWh/kg N and thus at the lower end of this range. In total, treatment of sludge liquor is calculated to require 3071 MWh/a, with 2367 MWh/a (77%) caused by nitrogen.
Atmospheric emissions of return liquor treatment are estimated for N2O with specific emission factors. Observed N2O emission factors for large-scale WWTPs with nitrification and denitrification can vary over a wide range (0-25.3% of eliminated N load (Wicht 1996; Kampschreur et al. 2009b; Ahn et al. 2010; Foley et al. 2010)). N2O generation is supported by low oxygen levels in nitrification, increased NO2
- concentration and a low COD/N ratio in denitrification (Kampschreur et al. 2009b). For this LCA study, an emission factor of 6 g N2O-N/kg Nelim is estimated according to the mean value of a screening of 25 German WWTPs (Wicht 1996).

18
Table 7: Return load with sludge liquor and estimated energy demand and emissions for its treatment in WWTP Waßmannsdorf in 2009
Volume COD N P
Mio m³/a t/a t/a t/a
Liquor from thickening 1.47 1671 192 56
Liquor from dewatering 0.53 1513 704 41
Condensate from drying 0.02 128 45 26
Total 2.02 3312 941 123
Elimination in WWTP % 50 80 95**
Energy demand* kWh/kgelim 0.42 3.14 0.07
* Figures estimated from following assumptions: energy demand for aeration: 0.42 kWh/kg O2,eff (BWB, Peter-
Fröhlich), oxygen demand for nitrification: 4.3 kg O2/kg Nnitrified (ATV 2000), additional energy demand for
denitrification: 1 kWh/m³ liquor for recirculation (MUNLV 1999), energy demand for chemical P elimination: 0.37
kWh/kg P (MUNLV 1999)
** 80% elimination with Bio-P
3.2 Measures for optimisation
3.2.1 Chemical oxygen demand in sludge liquor
Measures for the reduction of COD return load with sludge liquor have not been assessed in this LCA. Suitable measures for the reduction of bio-refractory COD in sludge liquor include e.g. oxidation by ozone or precipitation with ferric salts. However, measures for COD reduction are not targeting the optimisation of energy demand or carbon footprint of the WWTP, and thus are outside the defined scope of this LCA.
3.2.2 Deammonification of nitrogen in sludge liquor
In this scenario, sludge liquor from dewatering and condensate from drying is treated by a two-stage “Anammox” process to eliminate nitrogen. The process data for the deammonification stage is adopted from the literature (Beier et al. 2008). The efficiency of the deammonification stage is assumed to 86% N removal. 11% of the input N load to deammonification is emitted as NO3-N and is recycled back to the WWTP, consequently causing no additional oxygen demand in the WWTP. Deammonification requires 1.3 kWh/kg Nelim and produces a low amount of biological sludge (0.16 g T/kg Nelim). N2O emissions from a two-stage deammonification process can be higher than N2O emissions from full-stream nitrification and denitrification. For this study, an emission factor of 23 g N2O-N/kg Ninput is assumed as average, with a minimum of 12 g N2O-N/kg Ninput in case of low emissions (Kampschreur et al. 2008). It has to be noted that other studies revealed comparable N2O emission of single-stage anammox processes and full-scale nitrification/denitrification plants (Kampschreur et al. 2009a). This issue is currently

19
a subject for intensive research (e.g. Joss et al. 2009; Gustavsson and La Cour Jansen 2011; Desloover et al. 2011).
3.2.3 Addition of co-substrates
These scenarios evaluate the addition of different co-substrates into the digestion process: fats and food scraps or grass silage. The respective amount of co-substrates added in each scenario is listed in Table 8. Content of dry matter, organic dry matter and biogas yield is estimated from literature (Sievers 2010) and results of pilot experiments in CoDiGreen. However, the effective gas yield of co-substrate addition will depend on specific conditions of the digestion process in Waßmannsdorf. Hence, biogas yields of co-substrates calculated in this study should be seen as potential increases in gas yields.
Table 8: Characteristics of co-substrates
Waß
2009 Fats + food scraps
Grass
silage
Grass
silage
Fats Food scraps +4% TS +8% TS
Weight t/a 4269 8500 28500 6400 12800
Dry matter % 12.6 8 12 25 25
Organic dry matter t/a 508 666 3078 1440 2880
Specific gas yield* L/kg oDMin 592 1000 700 568 568
Total gas yield Mio m³/a 0.3 0.67 2.15 0.82 1.64
* sources: Waß 2009 (Waschnewski 2010), fats and food scraps (Sievers 2010), grass silage (CoDiGreen pilot experiments)
For the addition of fats and food scraps in full capacity, a negative effect on dewatering of sewage sludge is also calculated in one scenario. In this case, it is assumed that the final TS after dewatering decreases from 26.73 to 25% and polymer demand increases from 12.4 to 15 g/kg TS.
3.2.4 Organic Rankine Cycle
In the ORC scenario, excess heat is converted to electricity. For the ORC, a net electrical efficiency of 18% is assumed, resulting in an additional electricity production of 3650 MWh/a from 20300 MWh/a of excess heat. It has to be noted that this is a calculated maximum potential of excess heat. Heat demand is highly variable during the seasons, so that the excess heat that is effectively available for an ORC process can be significantly lower. A dynamic heat balance for the WWTP will be required to determine the effective potential for an ORC process.

20
3.2.5 Thermal hydrolysis
Excess sludge is pre-treated by thermal hydrolysis to improve its degradability in anaerobic digestion and increase the gas yield. For this process, it is assumed that thickening of excess sludge can be improved with additional polymer (1.5 g/kg TS) to end up with a final TS of 8%. Thickened excess sludge is pre-heated prior to addition of steam (0.15 t/m³ with 2.7 MJ/kg steam). By definition, 80% of steam production is provided by exhaust heat from CHP plant, which is converted into steam with 80% efficiency (= 400 MJ/m³). The remaining 20% of steam are generated by a steam generator fuelled by natural gas (85% thermal efficiency). After thermal hydrolysis, heat from sludge is recycled for pre-heating of excess sludge. Hydrolysed sludge is mixed with primary sludge and pumped to the digestors, still delivering sufficient heat for maintaining mesophilic conditions in the digestors without external heating. Electricity demand for thermal hydrolysis is assumed to 1.8 kWh/m³ (DWA 2009).
Biogas yields for mixed sludge are increased by 8% through hydrolysis of excess sludge (results of pilot experiments in CoDiGreen), producing 395 L/kg oDMin in single-step digestion and 487 L/kg oDMin in two-step digestion. Methane content of the biogas is assumed to be comparable to status quo. Improved degradability of excess sludge leads to a higher reduction of dry matter content in the digestion process.
Thermal hydrolysis is assumed to have a positive effect on dewatering of digested sludge (DWA 2009). In this study, it is assumed that hydrolysis leads to a higher final TS (30%) and less polymer demand in dewatering (9 g/kg TS). However, liquor from dewatering is loaded with higher concentrations of COD (+50%, [COD]=2910 mg/L) and N (+25%, [N]=1570 mg/L). Additionally, 43% of COD is assumed to be refractory (results of Zahn-Wellens test (48h) in project CoDiGreen). To minimize negative effects of thermal hydrolysis on the WWTP process, sludge liquors from dewatering and drying are treated by chemical coagulation (0.25 kg FeCl3/kg COD, 0.1 kWh/m³) for removal of COD (80%) and deammonification (for details see 3.2.1).
3.3 Background processes
3.3.1 Electricity supply
Electricity supply is based on the German production mix of electricity for 2009 (BMWi 2009). Technologies for electricity production are compiled from ecoinvent database (Ecoinvent 2007). A loss of 1.8% of electricity is assumed during grid transport. Finally, the supply of 1 kWh of electricity is associated with a CED of 9.92 MJ and a GWP of 615 g CO2-eq.
3.3.2 Transport by truck
Truck transport is modelled with the dataset “lorry 16-32t, EURO4” from the ecoinvent database. It includes the operation of the vehicle, the production, maintenance and disposal of the vehicle, and the construction, maintenance and disposal of roads. For 1 tkm, the dataset calculates a CED of 1.92 MJ and a GWP of 134 g CO2-eq.
21
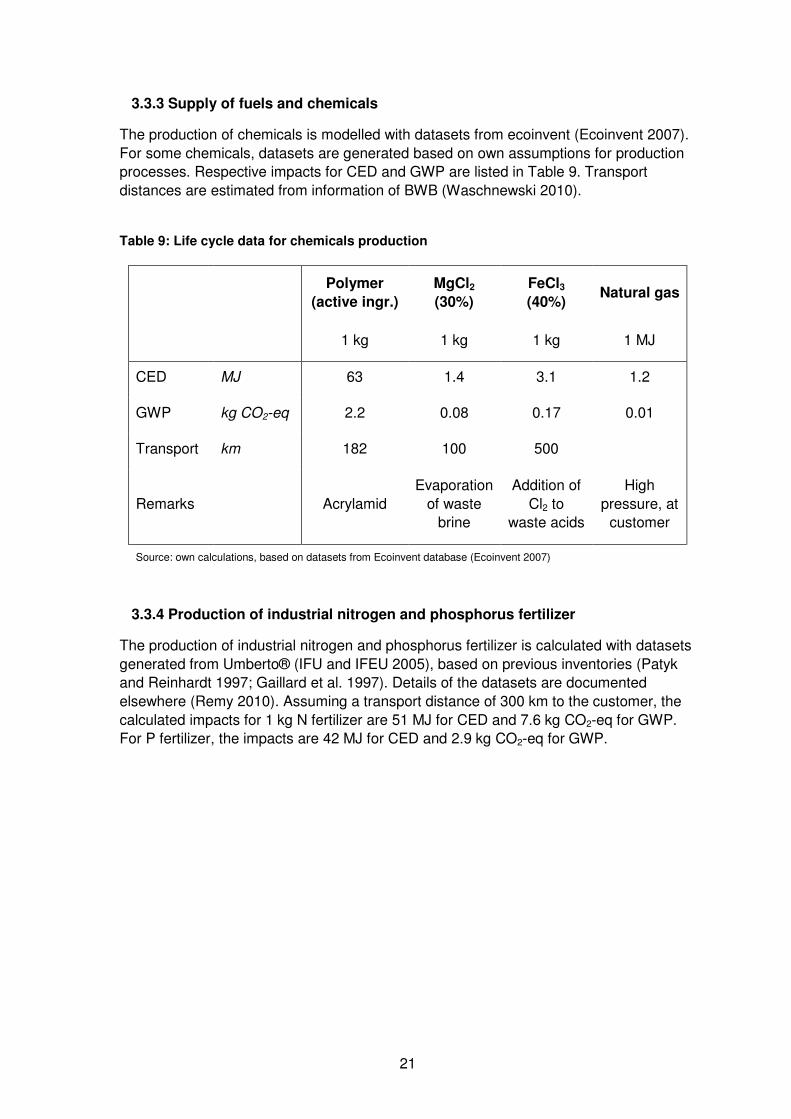
3.3.3 Supply of fuels and chemicals
The production of chemicals is modelled with datasets from ecoinvent (Ecoinvent 2007). For some chemicals, datasets are generated based on own assumptions for production processes. Respective impacts for CED and GWP are listed in Table 9. Transport distances are estimated from information of BWB (Waschnewski 2010).
Table 9: Life cycle data for chemicals production
Polymer
(active ingr.)
MgCl2
(30%)
FeCl3
(40%) Natural gas
1 kg 1 kg 1 kg 1 MJ
CED MJ 63 1.4 3.1 1.2
GWP kg CO2-eq 2.2 0.08 0.17 0.01
Transport km 182 100 500
Remarks Acrylamid Evaporation
of waste brine
Addition of Cl2 to
waste acids
High pressure, at
customer
Source: own calculations, based on datasets from Ecoinvent database (Ecoinvent 2007)
3.3.4 Production of industrial nitrogen and phosphorus fertilizer
The production of industrial nitrogen and phosphorus fertilizer is calculated with datasets generated from Umberto® (IFU and IFEU 2005), based on previous inventories (Patyk and Reinhardt 1997; Gaillard et al. 1997). Details of the datasets are documented elsewhere (Remy 2010). Assuming a transport distance of 300 km to the customer, the calculated impacts for 1 kg N fertilizer are 51 MJ for CED and 7.6 kg CO2-eq for GWP. For P fertilizer, the impacts are 42 MJ for CED and 2.9 kg CO2-eq for GWP.

22
Chapter 4
Life Cycle Impact Assessment
4.1 Environmental impacts of sludge treatment and disposal
Cumulative energy demand
The total cumulative energy demand of all processes for sludge treatment and disposal in the WWTP Berlin-Waßmannsdorf in 2009 amounts to 219 MJ/(PECOD*a) (Figure 2). Major contributors for CED are electricity demand (100 MJ/(PECOD*a)), heat demand (44 MJ/(PECOD*a), provided internally be CHP waste heat) and natural gas and fuel oil (49 MJ/(PECOD*a)) for sludge drying and the operation of the mono-incineration in Ruhleben. The supply of chemicals (polymer and MgCl2 with 14 MJ/(PECOD*a)) and the transport of sludge to disposal (11 MJ/(PECOD*a)) is less relevant for the total energy demand.
For the single processes, the operation of the digestors has the highest energy demand, originating mainly from heating of the sludge. However, the heat demand can easily be met by using internal heat available from the CHP plant. Drying of the sludge needs 46 MJ/(PECOD*a) or 21% of the total CED due to natural gas, even though only 1/3 of the total dry matter in digested sludge is effectively dried in 2009. Volume reduction in thickening and dewatering requires 51 MJ/(PECOD*a) or 23% of the total energy demand, mainly for electricity and polymer production. The treatment of the return liquor contributes 20 MJ/(PECOD*a) or 9% to the total CED. The different routes for sludge disposal are compared in detail in 4.2.1.
0
10
20
30
40
50
60
70
Thic
kenin
g
Diges
tion
MAP
separ
atio
n
Dewate
ring
Bioga
s util
izatio
n
Return
liquor (
WW
TP)
Dryin
g
Mono-in
cinera
tion
Dispo
sal i
n pow
er p
lant
Dispo
sal i
n cem
ent p
lant
Rest
Cu
mu
lati
ve
en
erg
y d
em
an
d
[M
J/(
PE
CO
D*
a)]
Gas/oil
Chemicals
Transport
Heat
Electricity
Figure 2: Cumulative energy demand of sludge treatment and disposal in Waßmannsdorf 2009
If the credits for the different products of sludge treatment and disposal (i.e. electricity and heat from CHP plant and mono-incineration, MAP fertilizer, and substitution of fossil fuels in co-incineration) are included in the assessment, the net energy demand of

23
sludge treatment and disposal amounts to -161 MJ/(PECOD*a) (Figure 3). The negative net impact is equivalent to an energetic surplus of sludge treatment and disposal, meaning that the energy demand is smaller than the energetic benefits from biogas usage and sludge incineration.
Electricity and (utilized) heat produced from digestor gas are responsible for the major part of these credits, accounting for 187 MJ/(PECOD*a) (44%) and 4410% of the total energy credit, respectively. Sludge disposal in co-incineration substitutes a significant amount of lignite and hard coal in power plants and cement kilns, contributing 17% and 13% to the total credits. Substituted fertilizer with MAP and electricity generated in mono-incineration are less relevant for the energetic balance. The energetic balance reveals a substantial potential in the excess heat from the CHP plant which is not utilized currently, even though this portion of “wasted” heat is not formally accounted in this LCA (cf. 2.4).
-350
-300
-250
-200
-150
-100
-50
0
50
100
Thickenin
g
Dige
stio
n
MAP s
eparatio
n
Dew
aterin
g
Biogas
util
izatio
n
Return
liquor (
WW
TP)
Dry
ing
Mono-in
ciner
ation
Disposa
l in p
ower p
lant
Disp
osal i
n cem
ent pla
nt
RestN
etCu
mu
lati
ve
en
erg
y d
em
an
d [
MJ/
(PE C
OD *
a)]
Gas/oil
Chemicals
Transport
Heat
Electricity
Heat not utilized
Heat utilized
Substitution of
electricitySubstitution of
fuel/fertilizerOverall balance
Figure 3: Cumulative energy demand of sludge treatment and disposal in 2009, including credits for products
Global warming potential (“Carbon footprint”)
The total global warming potential of all processes for sludge treatment and disposal in Berlin-Waßmannsdorf 2009 amounts to 16.6 kg CO2-eq/(PECOD*a) (Figure 4). Major contributors to the carbon footprint are - in analogy to the energetic profile - the supply of electricity (38%) and heat (16%), whereas the production of chemicals (5%) and sludge transport to disposal (3%) have only minor contributions. All these emissions are indirect emissions (= not taking place directly on-site at Waßmannsdorf or disposal sites). Direct emissions in sludge treatment and disposal originate from the burning of fossil fuels (fossil CO2 from natural gas in drying and fuel oil in mono-incineration) or from process emissions (CH4 from CHP plant or dissolved in digested sludge, and N2O from sludge liquor treatment or sludge incineration and CHP plant). These direct emissions contribute with 17% (CO2, fossil) and 21% (N2O + CH4) to the carbon footprint of sludge treatment and disposal. Direct emissions causing global warming can be avoided by decreasing

24
the demand of fossil fuels in drying and mono-incineration and by emission control at the CHP plant (CH4 slippage) and during mono-incineration (N2O emissions, cf. 4.2.1).
0,0
0,5
1,0
1,5
2,0
2,5
3,0
3,5
4,0
Thickenin
g
Digest
ion
MAP s
eparatio
n
Dew
aterin
g
Biogas
util
izatio
n
Return
liquor (
WW
TP)
Dry
ing
Mono-in
ciner
ation
Disposa
l in p
ower p
lant
Disp
osal i
n cem
ent pla
nt
Rest
Glo
ba
l w
arm
ing
po
ten
tia
l [k
g C
O2
-eq
/(P
E CO
D*
a)] Direct process emissions
(N2O, CH4)Direct emssions of fossil CO2
Chemicals
Transport
Heat
Electricity
Figure 4: Carbon footprint of sludge treatment and disposal in Waßmannsdorf 2009
If credits for products of sludge treatment and disposal are accounted for, the net global warming potential amounts to -11.6 kg CO2-eq/(PECOD*a) (Figure 5). In analogy to the energetic profile, the overall process has a “negative” carbon footprint, meaning that savings in GHG emissions through products of sludge treatment and disposal well exceed the GHG emissions caused by direct or indirect processes.
-20
-15
-10
-5
0
5
Thic
kenin
g
Diges
tion
MAP
separ
atio
n
Dewate
ring
Bioga
s util
izatio
n
Return
liquor (
WW
TP)
Dryin
g
Mono-in
cinera
tion
Dispo
sal i
n pow
er p
lant
Dispo
sal i
n cem
ent p
lant
RestN
et
Glo
ba
l w
arm
ing
po
ten
tia
l [k
g C
O2
-eq
/(P
E CO
D*
a)]
Direct process emissions
(N2O, CH4)
Direct emssions of fossi l
CO2Chemicals
Transport
Heat
Electricity
Heat not utilized
Heat util ized
Substitution of electricity
Substitution of
fuel/fertil izer
Overall balance
Figure 5: Carbon footprint of sludge treatment and disposal 2009, including credits for products

25
4.2 Environmental impacts of optimization measures
In general, the environmental impacts of the optimization measures are presented in comparison to the baseline scenario (= status quo in 2009), calculating the difference between the baseline and the optimization measures. In this manner, the effect of the specific measure on the overall process is immediately visible in the diagrams (= consequential results). Naturally, all processes that have a comparable energy demand or carbon footprint in baseline and optimized scenario will not be displayed in the diagrams.
4.2.1 Disposal routes
For each of the different disposal routes, the environmental impacts are compared to the baseline scenario representing a typical mix of disposal routes in 2009. For reasons of better comparability, the results presented in this chapter are related to the functional unit of “disposal of 1 ton of dry matter in dewatered sludge” (t TS-1).
The energetic profiles of the different disposal routes reveal major differences between the specific incineration pathways (Figure 6). Mono-incineration is characterized by a high energy demand as it requires the addition of fuel oil for incineration of sludge with low heating value. In contrast, the recovery of internal energy in sludge dry matter is relatively small, so that mono-incineration yields the lowest energetic benefits of all disposal routes (-0.5 GJ/t TS). The disposal of dewatered sludge in a lignite power plant results in an energetic benefit of -7.9 GJ/t TS, even though the transported volume and the distance (190 km) cause a high energy demand for transport. Drying of the sludge improves the amount of recovered energy, but on the other hand requires the input of natural gas for the drying process. Overall, drying of sludge and disposal in power plants or cement kilns generates a benefit of -4.8 and -4 GJ/t TS, respectively.
-20
-15
-10
-5
0
5
10
15
Wass 2009
(route mix)
Mono-
incineration
Power plant Drying + power
plant
Drying +
cement kiln
Cu
mu
lati
ve
en
erg
y d
em
an
d [
GJ/
(t T
S)] Fuel for incinerator
Transport
Electricity (for Drying)
Natural Gas (for Drying)
Substitution of electricity
Substitution of hard coal
Substitution of lignite
Net impact: -5.4 -0.5 -7.9 -4.8 -4.0
Figure 6: Cumulative energy demand of different routes for sludge disposal

26
For the carbon footprint, the differences are even more pronounced: whereas mono-incineration has a net carbon footprint of 300 kg CO2-eq/t TS, co-incineration of dewatered sludge yields a negative carbon footprint of – 740 kg CO2-eq/t TS (Figure 7). Drying of sludge and co-incineration in power plants or cement kilns even increase this benefit to 800 and 780 kg CO2-eq/t TS, respectively.
The poor performance of mono-incineration in this comparison can be explained by the technology of the Ruhleben incinerator (built in 1980s), which does not reflect a “state-of-the-art” process for sludge incineration. Optimisation could be achieved by pre-drying of the sludge with waste heat to increase its heating value and avoid the addition of fuel oil. Besides the specific disadvantage of requiring additional fuel oil, mono-incineration in general is also characterized by high emissions of N2O, a powerful greenhouse gas which is generated due to low incineration temperatures. Hence, the carbon footprint of co-incineration routes is distinctively better in this LCA than mono-incineration. However, it has to be mentioned that both the N2O emission factors of mono-incineration and of co-incineration processes are estimated based on information from literature (cf. 3.1.4). This preliminary assessment should be supported by actual sampling of emissions to support the results of this LCA. Finally, it has to be kept in mind that other environmental indicators (e.g. measuring pollutant emissions) may be in favour of mono-incineration.
-2.000
-1.500
-1.000
-500
0
500
1.000
Wass 2009
(route mix)
Mono-
incineration
Power plant Drying + power
plant
Drying +
cement kiln
Glo
ba
l w
arm
ing
po
ten
tia
l [k
g C
O2
eq
/(t
SS
)
Disposal of ashes
Emissions of incinerator
(CO2 fossil, N2O)Transport
Electricity (for Drying)
Natural Gas (for Drying)
Substitution of electricity
Substitution of hard coal
Substitution of lignite
Net impact: -593 +292 -740 -803 -778
Figure 7: Carbon footprint of different routes for sludge disposal
4.2.2 Sludge liquor treatment
The sludge liquor from dewatering and drying of sludge is heavily loaded with organics and nitrogen, thus causing a considerable energy demand for its treatment in the WWTP. A deammonification process with low demand for aeration (Anammox) will result in a decrease of this energy demand, assuming a range of 1.1-1.5 kWh/kg N for the Anammox process (Figure 8). Potential savings amount to -5 to -7 MJ/(PECOD*a) depending on the effective energy demand of the Anammox process.

27
-15
-10
-5
0
5
10
Anammox (1.1kWh/kg N) Anammox (1.3kWh/kg N) Anammox (1.5kWh/kg N)
Cu
mu
lati
ve
en
erg
y d
em
an
d [
MJ/
(PE
CO
D*
a)]
ELECTRICITY ANAMMOX
ELECTRICITY SAVED IN
WWTP
Net impact: -6.9 -6.0 -5.2
Figure 8: Cumulative energy demand of sludge liquor treatment with Anammox process
Unfortunately, the carbon footprint for the Anammox process reveals a considerable risk of high GHG emissions, originating from N2O emissions during deammonification. Calculations in this LCA result in an increase of 1.5 - 4 kg CO2-eq/(PECOD*a) for the Anammox process depending on estimated N2O emission factors (Figure 9). However, N2O emission factors for both full-stream treatment (nitrification/denitrification: 0.6% of Ndenitrified) and deammonification (1.2-2.3% of N load) are estimates based on few studies from literature. Intensive research is currently been undertaken to better understand the conditions in which N2O emissions occur and to improve the estimation of N2O emission factors (cf. 3.2.1). In fact, full-scale sampling should be applied to prove the results of this scenario calculation. Nevertheless, the results of this LCA show that energy savings and related benefits in carbon footprint of an Anammox process can easily be offset by increased emissions of N2O.
-3
-2
-1
0
1
2
3
4
5
6
7
Anammox
(1.1kWh/kg N)
Anammox
(1.3kWh/kg N)
Anammox
(1.5kWh/kg N)
Anammox (low
N2O-Emissions)
Glo
ba
l w
arm
ing
po
ten
tia
l [k
g C
O2
-eq
/(P
EC
OD*
a)]
ANAMMOX (N2O)
ELECTRICITY ANAMMOX
WWTP (AVOIDED N2O)
ELECTRICITY SAVED IN
WWTP
Net impact: +4.0 +4.0 +4.1 +1.5
Figure 9: Carbon footprint of sludge liquor treatment with Anammox process

28
4.2.3 Utilization of excess heat
The conversion of excess heat to electricity via an ORC process is per se a decrease in the environmental impact of sludge treatment in this LCA, because the ORC process has no emissions and impacts of infrastructure are excluded in this assessment. The more decisive question of whether to implement an ORC is the effective amount of heat that can be used for this process, and the economic return of the process. Consequently, this study calculates the potential electricity production and economic return of an ORC process depending on the amount of available heat and its net electrical efficiency (Figure 10) to show the potential for the implementation of such a process. Assuming an available excess heat of 20 GWh per year and a net electrical efficiency of 18%, an ORC could generate an additional 3650 MWh of electricity at Waßmannsdorf. This process would lower the total energy demand by -25 MJ/(PECOD*a) and the carbon footprint by -1.6 kg CO2-eq/(PECOD*a), generating a total revenue of more than 400000 Euro/a (12 €-cents/kWh).
0
1.000
2.000
3.000
4.000
5.000
6.000
7.000
0 5000 10000 15000 20000 25000 30000 35000
Excess heat of CHP-Plant [MWh/a]
Ele
ctri
city
be
ne
fits
[M
Wh
/a]
0
100.000
200.000
300.000
400.000
500.000
600.000
700.000
800.000
Eu
ro/a
(1
2 €
-ce
nts
/kW
h)
η=20%
η=18%
η=16%
η=14%
η=12%
20278 MWh Heat with
η=18%: 3650MWh
net-efficiency
Figure 10: Additional electricity production and economic benefits of utilization of excess heat via ORC process
4.2.4 Addition of co-substrates
The usage of unused digestor capacity for the co-digestion of organic substrates generates additional biogas and thus improves the energy balance of the sludge treatment process. However, additional co-substrates result in a higher input of dry matter to the digestion step, causing an increase in energy demand for digestion, dewatering, and sludge disposal. Hence, different types of co-substrates may result in different effects on the overall energetic balance of the process depending on their characteristics (biogas yield, organic matter content, effect on dewatering). Biogas yields are estimated to 1000, 700, and 568 L/kg oDMin for fats, food scraps, and grass silage in

29
this study (cf. 3.2.3). In 2009, the effective biogas yield of co-substrate addition was calculated to 592 L/kg oDMin.
This LCA study estimates the potential of different co-substrates and compares it to the situation in Waßmannsdorf in 2009 (Figure 11). In 2009, a limited amount of fats and food scraps has been dosed into the digestion process to test process stability and observe potential effects on the overall process performance, resulting in a minor energetic benefit of -4 MJ/(PECOD*a). If the full capacity of dosage for fats and food craps is reached and usual gas yields are realized, the energetic benefits are calculated to -38 MJ/(PECOD*a). Even if these co-substrates should have a negative impact on sludge dewatering (= higher TS in dewatered sludge (25%) and higher polymer demand, more energy required for drying and transport, less credits in disposal), a substantial benefit will remain in this scenario (-29 MJ/(PECOD*a)).
As an alternative, grass silage can be dosed as a co-substrate in ratios between 4 and 8% of additional dry matter, resulting in an energetic benefit of -7 to -14 MJ/(PECOD*a). These co-substrates do not yield the high amount of biogas as fats and food scraps, but may have a positive impact on sludge dewatering (preliminary results of research in CoDiGreen) which is not yet accounted in this LCA.
-60
-50
-40
-30
-20
-10
0
10
20
30
Waß 2009 Fats (full
capacity)
Fats (full
capacity) + effect
on dewatering
Grass (+4% TS) Grass (+8% TS)
Cu
mu
lati
ve
en
erg
y d
em
an
d [
MJ/
(PE C
OD*
a)]
NATURAL GAS
TRANSPORT
CHEMICALS
ELECTRICITY DEMAND
DISPOSAL
ELECTRICITY PRODUCTION
Net impact: -4.2 -37.6 -29.3 -6.8 -13.5
Figure 11: Cumulative energy demand with addition of co-substrates
The carbon footprint of co-substrates reflects the results of the energy balance: the dosing of co-substrates can effectively reduce the carbon footprint. Compared to a GHG emission reduction of -0.3 kg CO2-eq/(PECOD*a) in 2009, the addition of fats and food scraps at full capacity will reduce the carbon footprint by -2.2 kg CO2-eq/(PECOD*a) or -1.7 kg CO2-eq/(PECOD*a) with negative effects on dewatering, respectively.
The addition of grass silage can reduce the carbon footprint by -0.4 to -0.8 kg CO2-eq/(PECOD*a).
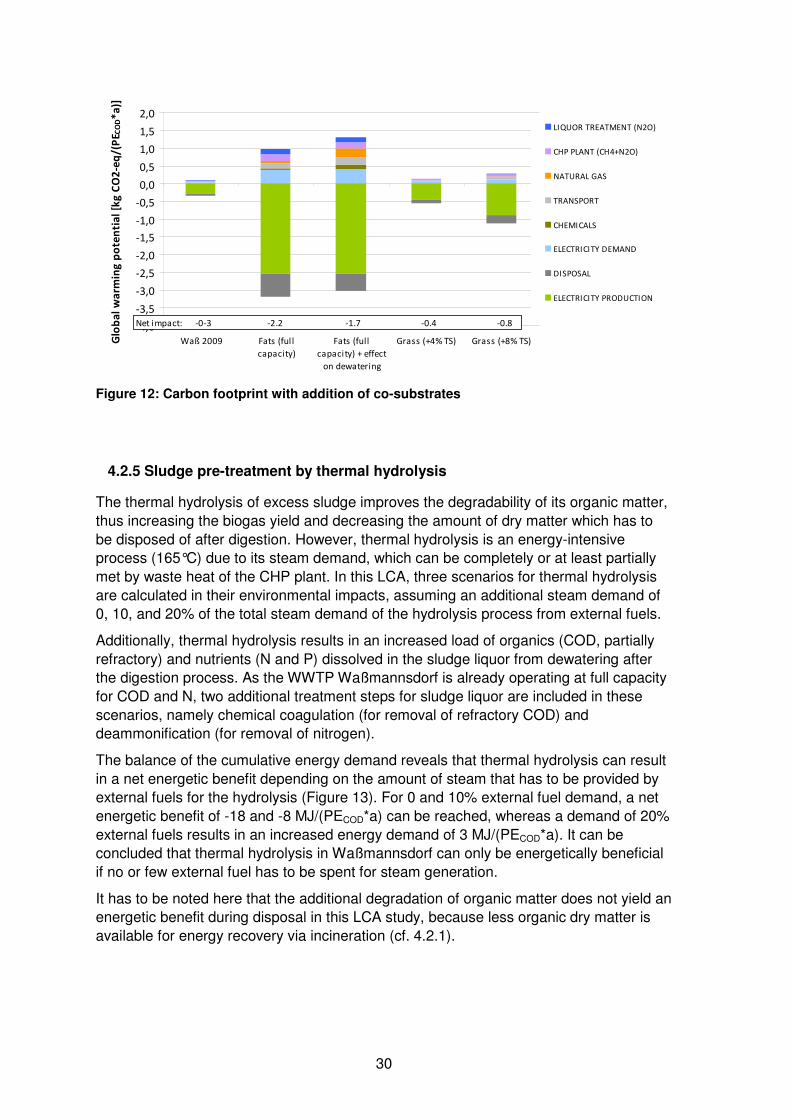
30
-4,0
-3,5
-3,0
-2,5
-2,0
-1,5
-1,0
-0,5
0,0
0,5
1,0
1,5
2,0
Waß 2009 Fats (ful l
capacity)
Fats (full
capacity) + effect
on dewatering
Grass (+4% TS) Grass (+8% TS)Glo
ba
l w
arm
ing
po
ten
tia
l [k
g C
O2
-eq
/(P
E CO
D*
a)]
LIQUOR TREATMENT (N2O)
CHP PLANT (CH4+N2O)
NATURAL GAS
TRANSPORT
CHEMICALS
ELECTRICITY DEMAND
DISPOSAL
ELECTRICITY PRODUCTION
Net impact: -0-3 -2.2 -1.7 -0.4 -0.8
Figure 12: Carbon footprint with addition of co-substrates
4.2.5 Sludge pre-treatment by thermal hydrolysis
The thermal hydrolysis of excess sludge improves the degradability of its organic matter, thus increasing the biogas yield and decreasing the amount of dry matter which has to be disposed of after digestion. However, thermal hydrolysis is an energy-intensive process (165°C) due to its steam demand, which can be completely or at least partially met by waste heat of the CHP plant. In this LCA, three scenarios for thermal hydrolysis are calculated in their environmental impacts, assuming an additional steam demand of 0, 10, and 20% of the total steam demand of the hydrolysis process from external fuels.
Additionally, thermal hydrolysis results in an increased load of organics (COD, partially refractory) and nutrients (N and P) dissolved in the sludge liquor from dewatering after the digestion process. As the WWTP Waßmannsdorf is already operating at full capacity for COD and N, two additional treatment steps for sludge liquor are included in these scenarios, namely chemical coagulation (for removal of refractory COD) and deammonification (for removal of nitrogen).
The balance of the cumulative energy demand reveals that thermal hydrolysis can result in a net energetic benefit depending on the amount of steam that has to be provided by external fuels for the hydrolysis (Figure 13). For 0 and 10% external fuel demand, a net energetic benefit of -18 and -8 MJ/(PECOD*a) can be reached, whereas a demand of 20% external fuels results in an increased energy demand of 3 MJ/(PECOD*a). It can be concluded that thermal hydrolysis in Waßmannsdorf can only be energetically beneficial if no or few external fuel has to be spent for steam generation.
It has to be noted here that the additional degradation of organic matter does not yield an energetic benefit during disposal in this LCA study, because less organic dry matter is available for energy recovery via incineration (cf. 4.2.1).

31
-40
-30
-20
-10
0
10
20
30
40
Thermal hydrolysis
(+0% external fuel)
Thermal hydrolysis
(+10% external
fuel)
Thermal hydrolysis
(+20% external
fuel)
Cu
mu
lati
ve
En
erg
y D
em
an
d [
MJ/
(PE C
OD*
a)] LESS CREDIT FOR SLUDGE DISPOSAL
COAGULANT FOR LIQUOR
STEAM
POLYMER SAVED
NATURAL GAS SAVED
LESS SLUDGE TRANSPORT
ELECTRICITY PRODUCTION
ELECTRICITY SAVINGS
Net impact: -18.5 -7.8 +3.0
Figure 13: Cumulative energy demand of thermal hydrolysis
For the carbon footprint of thermal hydrolysis, the results show an increase in GHG emissions between 1.9 and 3.3 kg CO2-eq/(PECOD*a) (Figure 14). The reason for this drawback of thermal hydrolysis is the deammonification process required for the high return loads of nitrogen. This process can emit substantial amounts of N2O, which is a powerful greenhouse gas (cf. 4.2.2). If these emissions could be reduced, thermal hydrolysis could decrease the carbon footprint substantially depending on the amount of steam generation from external fuels. However, this result proves again the need to include all affected processes in the assessment of thermal hydrolysis to ensure an overall improvement of the environmental impact of sludge treatment.
-4,0
-3,0
-2,0
-1,0
0,0
1,0
2,0
3,0
4,0
5,0
6,0
7,0
Thermal
hydrolysis (+0%
external fuel)
Thermal
hydrolysis (+10%
external fuel)
Thermal
hydrolysis (+20%
external fuel)
Glo
ba
l w
arm
ing
po
ten
tia
l [k
g C
O2
eq
/(P
EC
OD
*a
)] ANAMMOX (N2O)
CHP PLANT (CH4+N2O)
LESS CREDIT FOR SLUDGE DISPOSAL
COAGULANT FOR LIQUOR
STEAM
WWTP (LESS N2O)
LESS SLUDGE TRANSPORT
NATURAL GAS SAVED
ELECTRICITY SAVINGS
ELECTRICITY PRODUCTION
POLYMER SAVED
Net impact: +1.9 +2.6 +3.3
Figure 14: Carbon footprint of thermal hydrolysis
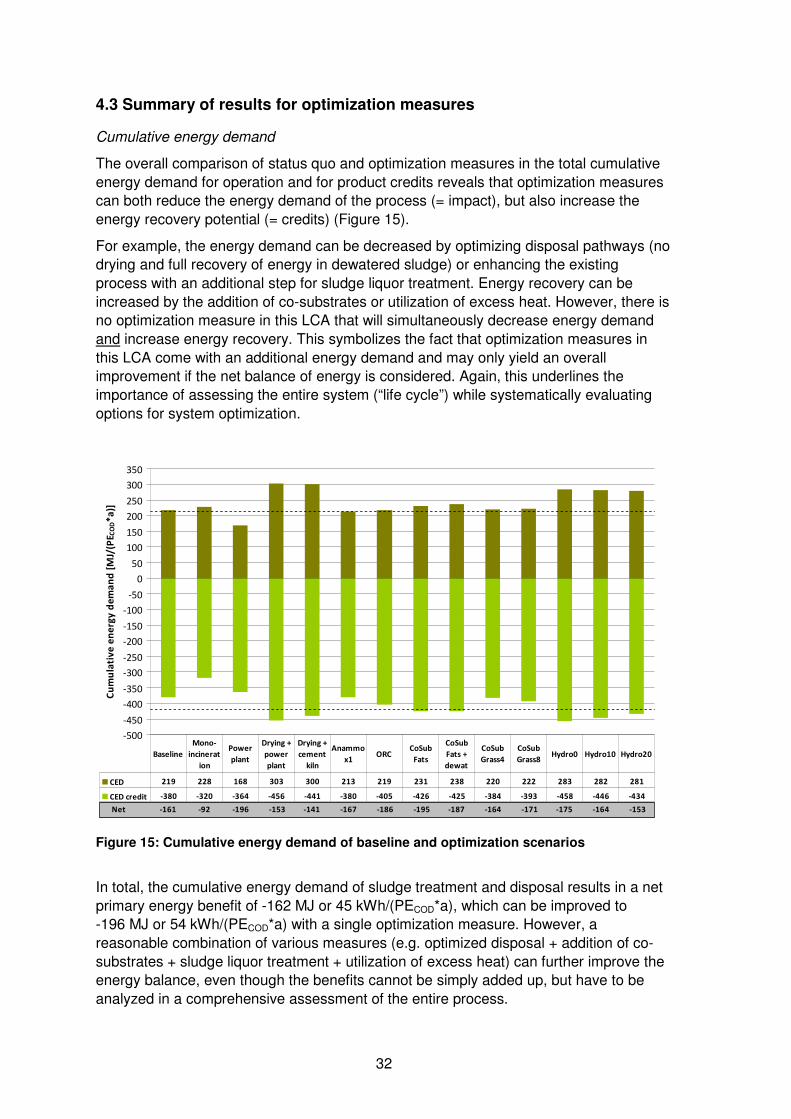
32
4.3 Summary of results for optimization measures
Cumulative energy demand
The overall comparison of status quo and optimization measures in the total cumulative energy demand for operation and for product credits reveals that optimization measures can both reduce the energy demand of the process (= impact), but also increase the energy recovery potential (= credits) (Figure 15).
For example, the energy demand can be decreased by optimizing disposal pathways (no drying and full recovery of energy in dewatered sludge) or enhancing the existing process with an additional step for sludge liquor treatment. Energy recovery can be increased by the addition of co-substrates or utilization of excess heat. However, there is no optimization measure in this LCA that will simultaneously decrease energy demand and increase energy recovery. This symbolizes the fact that optimization measures in this LCA come with an additional energy demand and may only yield an overall improvement if the net balance of energy is considered. Again, this underlines the importance of assessing the entire system (“life cycle”) while systematically evaluating options for system optimization.
-500
-450
-400
-350
-300
-250
-200
-150
-100
-50
0
50
100
150
200
250
300
350
Cu
mu
lati
ve
en
erg
y d
em
an
d [
MJ/
(PE C
OD*
a)]
CED 219 228 168 303 300 213 219 231 238 220 222 283 282 281
CED credit -380 -320 -364 -456 -441 -380 -405 -426 -425 -384 -393 -458 -446 -434
Baseline
Mono-
incinerat
ion
Power
plant
Drying +
power
plant
Drying +
cement
kiln
Anammo
x1ORC
CoSub
Fats
CoSub
Fats +
dewat
CoSub
Grass4
CoSub
Grass8Hydro0 Hydro10 Hydro20
Net -161 -92 -196 -153 -141 -167 -186 -195 -187 -164 -171 -175 -164 -153
Figure 15: Cumulative energy demand of baseline and optimization scenarios
In total, the cumulative energy demand of sludge treatment and disposal results in a net primary energy benefit of -162 MJ or 45 kWh/(PECOD*a), which can be improved to -196 MJ or 54 kWh/(PECOD*a) with a single optimization measure. However, a reasonable combination of various measures (e.g. optimized disposal + addition of co-substrates + sludge liquor treatment + utilization of excess heat) can further improve the energy balance, even though the benefits cannot be simply added up, but have to be analyzed in a comprehensive assessment of the entire process.
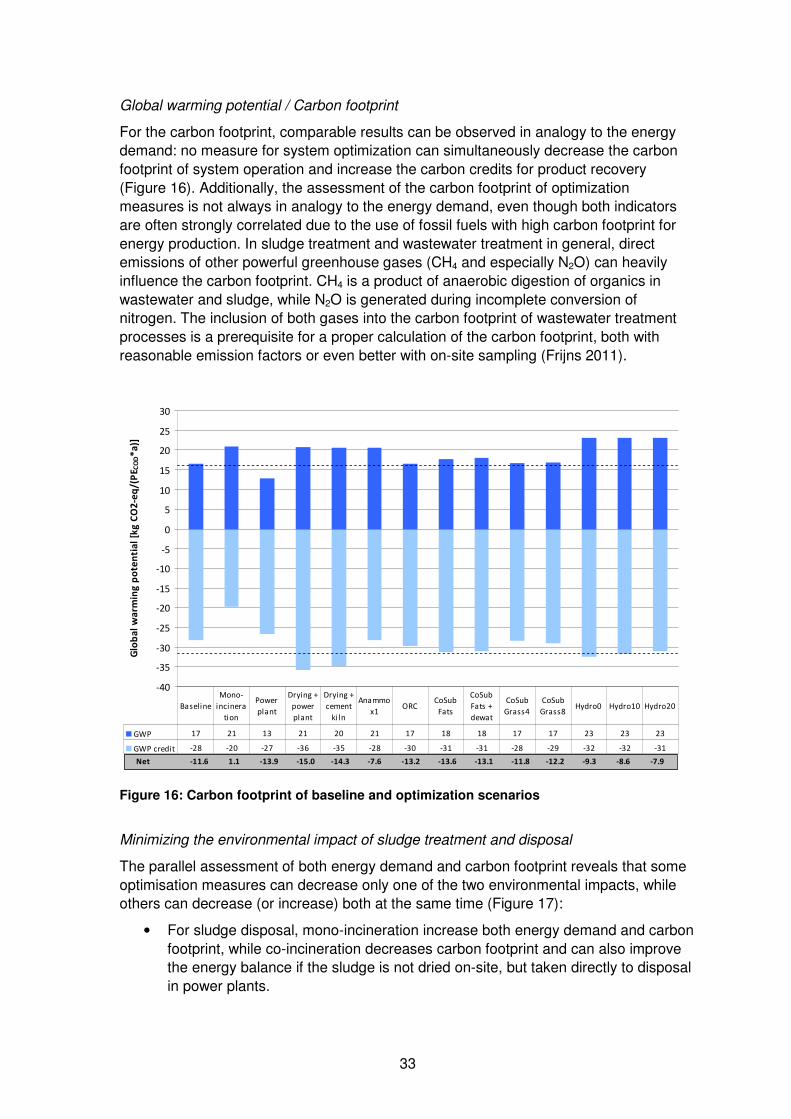
33
Global warming potential / Carbon footprint
For the carbon footprint, comparable results can be observed in analogy to the energy demand: no measure for system optimization can simultaneously decrease the carbon footprint of system operation and increase the carbon credits for product recovery (Figure 16). Additionally, the assessment of the carbon footprint of optimization measures is not always in analogy to the energy demand, even though both indicators are often strongly correlated due to the use of fossil fuels with high carbon footprint for energy production. In sludge treatment and wastewater treatment in general, direct emissions of other powerful greenhouse gases (CH4 and especially N2O) can heavily influence the carbon footprint. CH4 is a product of anaerobic digestion of organics in wastewater and sludge, while N2O is generated during incomplete conversion of nitrogen. The inclusion of both gases into the carbon footprint of wastewater treatment processes is a prerequisite for a proper calculation of the carbon footprint, both with reasonable emission factors or even better with on-site sampling (Frijns 2011).
-40
-35
-30
-25
-20
-15
-10
-5
0
5
10
15
20
25
30
Glo
ba
l w
arm
ing
po
ten
tia
l [k
g C
O2
-eq
/(P
E CO
D*
a)]
GWP 17 21 13 21 20 21 17 18 18 17 17 23 23 23
GWP credit -28 -20 -27 -36 -35 -28 -30 -31 -31 -28 -29 -32 -32 -31
Baseline
Mono-
incinera
tion
Power
plant
Drying +
power
plant
Drying +
cement
ki ln
Anammo
x1ORC
CoSub
Fats
CoSub
Fats +
dewat
CoSub
Grass4
CoSub
Grass8Hydro0 Hydro10 Hydro20
Net -11.6 1.1 -13.9 -15.0 -14.3 -7.6 -13.2 -13.6 -13.1 -11.8 -12.2 -9.3 -8.6 -7.9
Figure 16: Carbon footprint of baseline and optimization scenarios
Minimizing the environmental impact of sludge treatment and disposal
The parallel assessment of both energy demand and carbon footprint reveals that some optimisation measures can decrease only one of the two environmental impacts, while others can decrease (or increase) both at the same time (Figure 17):
• For sludge disposal, mono-incineration increase both energy demand and carbon footprint, while co-incineration decreases carbon footprint and can also improve the energy balance if the sludge is not dried on-site, but taken directly to disposal in power plants.

34
• Liquor treatment with an Anammox process improves the energy balance, but may potentially increase the carbon footprint.
• Utilization of excess heat with an ORC process improves both energy recovery and carbon footprint.
• The addition of co-substrates has a beneficial effect on both environmental impacts, even if other parameters of the process (sludge dewatering) are negatively influenced.
• The pre-treatment of excess sludge with thermal hydrolysis may lead to a small benefit in energy, but leads to high carbon footprint in this LCA due to the necessity of a process for nitrogen removal (Anammox) in sludge liquor.
Again, it has to be stressed that a reasonable optimization of the sludge treatment and disposal at the WWTP Berlin-Waßmannsdorf can encompass a combination of the listed measures. However, a careful evaluation of the entire system is required to end up with a combination that effectively reduces the environmental impacts caused by these processes. This LCA is limited to the assessment of the energy demand and carbon footprint and does not take into account the emission of pollutants which may be harmful for humans or the environment.
-50
-45
-40
-35
-30
-25
-20
-15
-10
-5
0
5
10
15
20
25
30
35
40
45
50
Re
lati
ve
eff
ect
on
en
vir
on
me
nta
l im
pa
ct [
%]
Cumulative energy demand
Global warming potential
Cumulative energy demand 43 -21 5 13 -4 -15 -21 -16 -2 -6 -8 -2 5
Global warming potential 110 -19 -29 -23 35 -13 -17 -13 -1 -5 20 26 32
Mono-
incineratio
n
Power
plant
Drying +
power
plant
Drying +
cement
kiln
Anammox ORCCoSub
Fats
CoSub
Fats +
dewat
CoSub
Grass4
CoSub
Grass8
Hydrolyse
0
Hydrolyse
10
Hydrolyse
20
+110%
Figure 17: Relative effect of optimization measures on cumulative energy demand and carbon footprint

35
Chapter 5
Conclusions
In this study, the process for sludge treatment and disposal at the WWTP Berlin-Waßmannsdorf has been analysed with LCA to determine the total energy demand and the carbon footprint of the system. In addition to the illustration of the status quo in 2009, several measures for an energetic optimization of the system have been evaluated in their effects on the energy balance and greenhouse gas emissions.
Status quo
The existing process in Berlin-Waßmannsdorf already includes two options for energy recovery from organic matter in the sludge: a) anaerobic sludge digestion and biogas production and b) thermal disposal of sludge in mono- and co-incineration. Additionally, a small amount of plant nutrients can be recovered via MAP precipitation. The existing energy recovery options can completely offset the total energy demand of sludge treatment and disposal (219 MJ/(PECOD*a)) which is dominated by the demand for electricity, heat and fossil fuels for drying and mono-incineration. Biogas combustion in CHP plant recovers 187 MJ/(PECOD*a) in electricity and 44 MJ/(PECOD*a) in heat, whereas sludge disposal via incineration yields 12 MJ/(PECOD*a) as electricity in mono-incineration and 133 MJ/(PECOD*a) via substitution of fossil fuels in co-incineration (Figure 18). The substitution of mineral fertilizer has only a minor contribution with 4 MJ/(PECOD*a). Overall, the sludge treatment and disposal is an energy-positive process, yielding a total energy surplus of 161 MJ/(PECOD*a).
-500
-400
-300
-200
-100
0
100
200
300
Cumulative energy demand
Cu
mu
lati
ve
en
erg
y d
em
an
d [
MJ/
(PE
CO
D*
a)]
-35
-30
-25
-20
-15
-10
-5
0
5
10
15
20
Global warming potential
Glo
ba
l wa
rmin
g p
ote
nti
al [
kg
CO
2-e
q/
(PE C
OD
*a
)]
Sludge disposal
Sludge treatment
Energy recovery by MAP fertilizer
Energy recovery by incineration
Energy recovery by electricity
and heat from biogas
Figure 18: Cumulative energy demand and carbon footprint of sludge treatment and disposal in Waßmannsdorf 2009
The carbon footprint basically resembles the energetic balance due to the strong correlation of emissions of fossil CO2 and energy supply. Total impacts of 16.6 kg CO2-

36
eq/(PECOD*a) are offset by credits for energy recovery of 28.2 kg CO2-eq/(PECOD*a), resulting in a “negative” carbon footprint or avoidance of 11.6 kg CO2-eq/(PECOD*a) of GHG emissions. However, large uncertainties exist in the calculation of emissions of powerful greenhouse gases CH4 and N2O which can contribute a major part of the total carbon footprint. Emissions arising in sludge processing, liquor treatment and sludge incineration are estimated by generic emission factors in this study and should be backed up by primary data from monitoring of emissions on-site.
Results for optimization measures
The measures for optimization of energy demand and carbon footprint investigated in this study encompass different routes of sludge disposal, additional processes for liquor treatment, sludge pre-treatment or utilization of excess heat, and the addition of organic-co-substrates into the digestors. Results of these scenarios are can be summarized as follows:
• Mono-incineration is not optimized for energy recovery and has a high carbon footprint (+292 kg CO2-eq/t TS) due to significant N2O emissions and the use of fuel oil for sludge incineration.
• Co-incineration without drying has the best energy balance of all disposal routes (-7.9 GJ/t TS). However, co-incineration of dried sludge offers the highest savings in carbon footprint (-803 kg CO2-eq/t TS).
• Liquor treatment with a deammonification process can decrease the energy demand (-4%), but may potentially increase the carbon footprint (up to +35%).
• Utilization of excess heat with an ORC process improves both energy recovery (-15% of primary energy demand) and carbon footprint (-13%).
• The addition of co-substrates has a beneficial effect on both environmental impacts (up to -17% in energy demand and -23% in carbon footprint), even if other parameters of the process (sludge dewatering) are adversely influenced.
• The pre-treatment of excess sludge with thermal hydrolysis may lead to a small benefit in energy, but leads to high carbon footprint due to the necessity of a deammonification process for nitrogen removal in sludge liquor.
Recommendations
Based on the results of this LCA study, the following recommendations for improving energy recovery and carbon footprint of the sludge treatment line in Berlin-Waßmannsdorf can be made:
• The mono-incineration facility in Ruhleben should be optimized in terms of energy recovery and carbon footprint, e.g. by pre-drying of dewatered sludge with waste heat from the incineration process.
• Co-incineration in power plants or cement kilns is preferable in energy and carbon footprint, but should also be evaluated with regard to potentially harmful emission of pollutants and the recovery potential of phosphorus.
• Liquor treatment with a deammonification process is seen as a positive addition to sludge treatment and may contribute to the compliance with nitrogen removal

37
standards in the WWTP. However, the Anammox process has to be carefully operated to minimize its emissions of N2O.
• The implementation of an ORC process can be fully recommended from an environmental point of view and only has to prove its economic viability.
• The addition of co-substrates leads to a significant decrease of energy demand and carbon footprint, even if other process steps (dewaterability) may be influenced adversely.
• The pre-treatment of sludge with thermal hydrolysis does not lead to significant benefits in this LCA and has to be closely evaluated together with other affected processes. Crucial issues are the availability of waste heat from CHP plant for steam production and possible effects on sludge liquor quality (additional refractory COD and N) which may require further treatment steps for this side-stream.
Outlook
Overall, the methodology of LCA with its comprehensive approach for system analysis proved well suited for the assessment of the sludge system in Berlin-Waßmannsdorf. Based on the existing process model, prospective scenarios of process optimization for the future development of the site (“Standortentwicklungskonzept”) can be implemented with moderate efforts and evaluated in their environmental impacts. The extension of the system analysis to include the entire WWTP would allow a system-wide evaluation and optimisation of the environmental footprint while taking into account the complex interdependencies between the different processes. Thus, upcoming demands of public and political actors for environmental information on the activities of Berliner Wasserbetriebe can be addressed with a well-accepted and standardized tool for process and system analysis. Naturally, future LCA studies in this field can be extended beyond the assessment of energy and carbon footprint to include the complete set of environmental impacts such as emission of pollutants, impacts on water resources (“water footprint”), land use, or biodiversity.

38
Appendix A
Figure 19: Screenshot of UMBERTO process model

39
Bibliography
Ahn, J. H., Kim, S., Park, H., Rahm, B., Pagilla, K. and Chandran, K. (2010): N2O Emissions from Activated Sludge Processes, 2008−2009: Results of a National Monitoring Survey in the United States. Environmental Science & Technology 44 (12), 4505-4511.
ATV (2000): A131 Bemessung von einstufigen Belebungsanlagen (A131: Dimensioning of single stage activated sludge plants). Abwassertechnische Vereinigung e.V., Hennef, Germany.
ATV (1996): Arbeitsbericht: NOx und N2O-Emissionen bei der Verbrennung von Klärschlamm (NOx and N2O emissions during incineration of sewage sludge). Korrespondenz Abwasser, Abfall 43 (7),
Beier, M., Sander, M., Schneider, Y. and Rosenwinkel, K. (2008): Energieeffiziente Stickstoffelimination - Verfahrensüberblick zur Nitratation/Deammonifikation und Auswirkungen auf den Energiebedarf von Kläranlagen (Energy-efficient Nitrogen Removal: An Overview of Nitratation/Deammonification Processes and their Impact on the Energy Consumption of Wastewater Treatment Plants. Korrespondenz Abwasser, Abfall 55 (6), 671-678.
BMWi (2009): Energiedaten (Energy data). Bundesministerium für Wirtschaft und Technologie, Berlin, Germany.
Curran, M. A. (2007): Co-Product and Input Allocation Approaches for Creating Life Cycle Inventory Data: A Literature Review. International Journal of Life Cycle Assessment 12 (Special Issue 1), 65-78.
Desloover, J., De Clippeleir, H., Boeckx, P., Du Laing, G., Colsen, J., Verstraete, W. and Vlaeminck, S. E. (2011): Floc-based sequential partial nitritation and anammox at full scale with contrasting N2O emissions. Water Research 45 (9), 2811-2821.
DWA (2009): Arbeitsbericht: Energiebilanz der Desintegration (Report: Energy balance of desintegration). Korrespondenz Abwasser, Abfall 56 (8), 797-801.
Ecoinvent (2007): Ecoinvent data v2.0, ecoinvent reports No. 1-25, Swiss Center for Life Cycle Inventories, www.ecoinvent.org. Dübendorf, Switzerland.
Foley, J., de Haas, D., Yuan, Z. and Lant, P. (2010): Nitrous oxide generation in full-scale biological nutrient removal wastewater treatment plants. Water Research 44 (3), 831-844.
Frijns, J. (2011): Towards a common carbon footprint assessment methodology for the water sector. Water and Environment Journal (published online on 5th May 2011),
Gaillard, G., Crettaz, P. and Hausheer, J. (1997): Umweltinventar der landwirtschaftlichen Inputs im Pflanzenbau (Life cycle inventories of agricultural inputs in crop production). Eidgen. Forschungsanstalt für Agrarwirtschaft und Landtechnik, Tänikon, Switzerland.
Gujer, W. (1999): Siedlungswasserwirtschaft (Sanitary engineering). Springer, Berlin, Germany.
Gustavsson, D. J. I. and La Cour Jansen, J. (2011): Dynamics of nitrogen oxides emission from a full-scale sludge liquor treatment plant with nitritation. Water Science and Technology 63 (12), 2838-2845.
Haberkern, B., Maier, W. and Schneider, U. (2008): Steigerung der Energieeffizienz auf kommunalen Kläranlagen (Improving energy efficiency in municipal wastewater treatment plants). Forschungsbericht 205 26 307 Umweltbundesamt, Dessau, Germany.
IFEU (2002): Ökobilanzielle Betrachtung von Entsorgungsoptionen für Klärschlamm im Land Schleswig-Holstein (Life cycle assesment of disposal options for sewage sludge in Schleswig-Holstein). Institut für Energie- und Umweltforschung Heidelberg GmbH, Heidelberg. Im Auftrag des Ministeriums für Umwelt, Natur und Forsten des Landes Schleswig-Holstein, Heidelberg, Germany.
40
IFU and IFEU (2005): Umberto - Software für das betriebliche Stoffstrommanagement, Version Umberto 5.0 (Umberto - software for operational substance flow management, version Umberto 5.0). Institut für Umweltinformatik GmbH und Institut für Energie- und Umweltforschung Heidelberg GmbH, Heidelberg/Hamburg, Germany.
IPCC (2007): Climate Change 2007: Synthesis Report. Contribution of Working Groups I, II and III to the Fourth Assessment Report of the Intergovernmental Panel on Climate Change IPCC, Geneva, Switzerland.
IPCC (2006): Guidelines for National Greenhouse Gas Inventories -Volume 5: Waste, Chapter 5: Incineration and open burning of waste. IGES, Japan.
ISO 14040 (2006): Environmental management - Life Cycle Assessment - Principles and framework. International Standardisation Organisation, Geneva, Switzerland.
ISO 14044 (2006): Environmental management - Life cycle assessment - Requirements and guidelines. International Standardisation Organisation, Geneva, Switzerland.
Joss, A., Salzgeber, D., Eugster, J., König, R., Rottermann, K., Burger, S., Fabijan, P., Leumann, S., Mohn, J. and Siegrist, H. (2009): Full-Scale Nitrogen Removal from Digester Liquid with Partial Nitritation and Anammox in One SBR. Environmental Science & Technology 43 (14), 5301-5306.
Kampschreur, M. J., Poldermans, R., Kleerebezem, R., Van Der Star, W. R. L., Haarhuis, R., Abma, W. R., Jetten, M. S. M. and Van Loosdrecht, M. C. M. (2009a): Emission of nitrous oxide and nitric oxide from a full-scale single-stage nitritation-anammox reactor. Water Science and Technology 60 (12), 3211-3217.
Kampschreur, M. J., Temmink, H., Kleerebezem, R., Jetten, M. S. M. and van Loosdrecht, M. C. M. (2009b): Nitrous oxide emission during wastewater treatment. Water Research 43 (17), 4093-4103.
Kampschreur, M. J., van der Star, W. R. L., Wielders, H. A., Mulder, J. W., Jetten, M. S. M. and van Loosdrecht, M. C. M. (2008): Dynamics of nitric oxide and nitrous oxide emission during full-scale reject water treatment. Water Research 42 (3), 812-826.
Lundie, S., Peters, G. M. and Beavis, P. C. (2004): Life Cycle Assessment for Sustainable Metropolitan Water Systems Planning. Environmental Science & Technology 38 (13), 3465-3473.
Müller, J., Tiehm, A., Böcker, K., Eder, B., Kopp, J., Kopplow, O., Neis, U., Oles, J., Schmelz, K., Seiler, K., Wendler, D. and Winter, A. (2005): Wirtschaftlicher und betrieblicher Vergleich verschiedener Verfahren zur Klärschlammdesintegration (Economic and operational comparison of different processes for sewage sludge desintegration). Korrespondenz Abwasser, Abfall 52 (2), 189-196.
MUNLV (2001): Co-Fermentation von biogenen Abfällen in Faulbehältern von Kläranlagen (Co-fermentation of biogenic wastes in digestors of wastewater treatment plants). 22 Ministerium für Umwelt und Naturschutz, Landwirtschaft und Verbraucherschutz des Landes Nordrhein-Westfalen, Düsseldorf, Germany.
MUNLV (1999): Handbuch Energie in Kläranlagen (Handbook of energy in wastewater treatment plants). Ministerium für Umwelt, Raumordnung und Landwirtschaft des Landes Nordrhein-Westfalen, Düsseldorf.
Patyk, A. and Reinhardt, G. A. (1997): Düngemittel - Energie- und Stoffstrombilanzen (Fertilizers: energy and sustance flow balances). Vieweg, Braunschweig/Wiesbaden, Germany.
Remy, C. (2010): Life Cycle Assessment of conventional and source-separation systems for urban wastewater management. Dissertation, Department of Water Quality Control (http://opus.kobv.de/tuberlin/volltexte/2010/2543/), Technical University, Berlin.
Sänger, M., Werther, J. and Ogada, T. (2001): NOx and N2O emission characteristics from fluidised bed combustion of semi-dried municipal sewage sludge. Fuel 80 167-177.

41
Sievers, M. (2010): Die energieautarke Kläranlage (The energy-neutral wastewater treatment plant). wasserwirtschaft wassertechnik (9), 16-21.
Svoboda, K., Baxter, D. and Martinec, J. (2006): Nitrous oxide emissions from waste incineration. Chemical Papers 60 (1), 78-90.
VDI (1997): VDI-Richtlinie 4600: 1997-06: Kumulierter Energieaufwand - Begriffe, Definitionen, Berechnungsmethoden (VDI guideline 4600: 1997-06: Cumulative energy demand - Terms, definitions, calculation methods). VDI Verlag, Düsseldorf, Germany.
Waschnewski, J. (2010): consulting on internal operating data of BWB and process elaboration.
Wenzel, H., Larsen, H. F., Clauson-Kaas, J., Hoibye, L. and Jacobsen, B. N. (2008): Weighing environmental advantages and disadvantages of advanced wastewater treatment of micro-pollutants using environmental life cycle assessment. Water Sci Technol 57 (1), 27-32.
Wicht, H. (1996): N2O-Emissionen durch den Betrieb biologischer Kläranlagen (N2O emissions during operation of biological wastewater treatment plants). Dissertation, Institut für Siedlungswasserwirtschaft, TU Braunschweig, Braunschweig, Germany.
Zech, M. (2008): Bewertung der Berliner Großklärwerke im Hinblick auf Einsparungen durch die Umstellung von Simultanfällung zu vermehrter, biologischer Phosphatentfernung (Assessment of the large wastewater treatment plants of Berlin regarding potential savings by switching from simultaneous P precipitation to enhanced biological P elimination). Department of Environmental Process Engineering, University of Applied Sciences, Berlin.