Embed Size (px)
DESCRIPTION
codes of social care practice
Citation preview

Compiled by Lesley Curtis
Unit Costs of Health & Social
Care 2013

Unit Costs of Health and Social Care 2013
Compiled by Lesley Curtis

©University of Kent, 2013
Published by: Personal Social Services Research Unit Cornwallis Building The University of Kent Canterbury Kent CT2 7NF Telephone: 01227 827773 Email: [email protected]
PSSRU website: http://www.pssru.ac.uk
The PSSRU also has branches at:
London School of Economics and Political Science Department of Social Policy and Administration Houghton Street London WC2A 2AE Telephone: 0207 955 6238 Email:[email protected]
The University of Manchester Faculty of Medicine, Dentistry and Nursing First Floor, Dover Street Building Oxford Road Manchester M13 9PL Telephone: 0161 275 5250 Email: [email protected]
If you would like additional copies of this report, please contact the PSSRU librarian in Canterbury (telephone: 01227 827773; email: [email protected]. Website address: http://www.pssru.ac.uk/intranet/index.php).
This is an independent report commissioned and funded by the Policy Research Programme in the Department of Health with a small amount of additional resources from the Department for Education funded Childhood Wellbeing Research Centre. The views expressed are not necessarily those of the Department.
ISSN: 1368-230X ISBN: 978-1-902671-87-1

Unit Costs of Health and Social Care 2013 i
Contents Preface......................................................................................................................... 1 Lesley Curtis
Widening the scope of unit costs to include environmental costs .............................. 10 Guest editorial: John Appleby, Chris Naylor and Imogen Tennison
Cognitive behaviour therapy: a comparison of costs .................................................. 16 Barbara Barrett and Hristina Petkova
Residential child care: costs and other information requirements ............................. 21 Jonathan Stanley and Andrew Rome
The costs of telecare and telehealth .......................................................................... 26 Catherine Henderson, Jennifer Beecham and Martin Knapp
I. SERVICES ................................................................................................................. 33 1. Services for older people ...................................................................................................................... 35
1.1 Private sector nursing homes for older people ............................................................................................ 37 1.2 Private sector residential care for older people ........................................................................................... 38 1.3 Local authority residential care for older people ......................................................................................... 39 1.4 Local authority day care for older people .................................................................................................... 40 1.5 Extra care housing for older people ............................................................................................................. 41 1.6 Community rehabilitation unit ..................................................................................................................... 42 1.7 Intermediate care based in residential homes............................................................................................. 43 1.8 Dementia memory service ........................................................................................................................... 44
2. Services for people with mental health problems ................................................................................ 45 2.1 NHS reference costs for mental health services .......................................................................................... 47 2.2 Local authority care homes for people with mental health problems ........................................................ 48 2.3 Voluntary, private and independent sector care homes for people with mental health problems ............ 49 2.4 Local authority social services day care for people with mental health problems ...................................... 50 2.5 Private sector day care for people with mental health problems ............................................................... 51 2.6 Cognitive behaviour therapy (CBT) .............................................................................................................. 52 2.7 Behavioural activation delivered by the non-specialist ............................................................................... 53 2.8 Counselling services in primary medical care .............................................................................................. 54 2.9 Individual placement and support ............................................................................................................... 55 2.10 Deprivation of liberty safeguards in England: implementation costs ........................................................ 57 2.11 Mindfulness-based cognitive therapy – group-based intervention ........................................................... 58 2.12 Interventions for mental health promotion and mental illness prevention .............................................. 59
3. Services for people who misuse drugs or alcohol................................................................................. 63 3.1 Residential rehabilitation for people who misuse drugs or alcohol ............................................................ 66 3.2 Inpatient detoxification for people who misuse drugs or alcohol ............................................................... 67 3.3 Specialist prescribing .................................................................................................................................... 68 3.4 Alcohol health worker, Accident & Emergency ............................................................................................ 69
4. Services for people with learning disabilities ....................................................................................... 71 4.1 Group homes for people with learning disabilities ...................................................................................... 73 4.2 Fully-staffed living settings ........................................................................................................................... 74 4.3 Semi-independent living settings ................................................................................................................. 75 4.4 Local authority day care for people with learning disabilities ..................................................................... 76

ii Unit Costs of Health and Social Care 2013 5. Services for adults with physical disability ............................................................................................ 77
5.1 Local authority care homes for adults with physical disability .................................................................... 79 5.2 Voluntary, private and independent sector care homes for adults with a physical disability ..................... 80 5.3 Day care for adults with a physical disability ............................................................................................... 81 5.4 Home care .................................................................................................................................................... 82
6. Services for children and their families ................................................................................................. 83 6.1 NHS reference costs for children’s health services ...................................................................................... 85 6.2 Care home for children — local authority .................................................................................................... 86 6.3 Voluntary, private and independent sector care homes for children .......................................................... 87 6.4 Local authority foster care for children ........................................................................................................ 88 6.5 Social services support for children in need ................................................................................................. 89 6.6 Key worker services for disabled children and their families ....................................................................... 91 6.7 End-of-life care at home for children ........................................................................................................... 92 6.8 Multi-systemic therapy (MST) ...................................................................................................................... 93 6.9 Adoption ....................................................................................................................................................... 94 6.10 Multidimensional treatment foster care (MTFC) ....................................................................................... 97 6.11 Decision-making panels .............................................................................................................................. 98 6.12 Short-break provision for disabled children and their families .................................................................. 99 6.13 Local safeguarding children’s boards ....................................................................................................... 100 6.14 Incredible Years parenting programme ................................................................................................... 101 6.15 Parenting programmes for the prevention of persistent conduct disorder ............................................ 102 6.16 Parent training interventions for parents of disabled children with sleep problems .............................. 104
7. Hospital and other services ................................................................................................................. 105 7.1 NHS reference costs for hospital services .................................................................................................. 107 7.2 NHS wheelchairs ......................................................................................................................................... 108 7.3 Local authority equipment and adaptations .............................................................................................. 109 7.4 Training costs of health service professionals ............................................................................................ 110 7.5 Rapid Response Service .............................................................................................................................. 111 7.6 Hospital-based rehabilitation care scheme ................................................................................................ 112 7.7 Expert Patients Programme ....................................................................................................................... 113 7.8 Re-ablement service ................................................................................................................................... 114 7.9 Public health interventions ........................................................................................................................ 115 7.10 Rehabilitation services ............................................................................................................................. 117 7.11 End-of-life care ......................................................................................................................................... 120
8. Care packages ..................................................................................................................................... 123 8.1 Community care packages for older people .............................................................................................. 125 8.2 Social care support for older people, people with learning disabilities, people with mental health
problems and people with physical disabilities ....................................................................................... 130 8.3 Health care support received by people with mental health problems, older people (over 75) and
other service users ................................................................................................................................... 135 8.4 Adults with learning disabilities – care packages ....................................................................................... 136 8.5 Support for children and adults with autism ............................................................................................. 138 8.6 Services for children in care ....................................................................................................................... 143 8.7 Services for children in need ...................................................................................................................... 148 8.8 Common Assessment Framework (CAF) .................................................................................................... 152 8.9 Services for children returning home from care ........................................................................................ 157 8.10 Support care for children ......................................................................................................................... 162 8.11 Young adults with acquired brain injury in the UK ................................................................................... 165 8.12 Palliative care for children and young people .......................................................................................... 166

Unit Costs of Health and Social Care 2013 iii
II. COMMUNITY-BASED HEALTH CARE STAFF............................................................ 171 9. Scientific and professional .................................................................................................................. 173
9.1 Community physiotherapist ....................................................................................................................... 175 9.2 NHS community occupational therapist .................................................................................................... 176 9.3 Community speech and language therapist ............................................................................................... 177 9.4 Community chiropodist/podiatrist ............................................................................................................. 178 9.5 Clinical psychologist ................................................................................................................................... 179 9.6 Community pharmacist .............................................................................................................................. 180
10. Nurses and doctors ........................................................................................................................... 181 10.1 Community nurse (includes district nursing sister, district nurse)........................................................... 183 10.2 Nurse (mental health) .............................................................................................................................. 184 10.3 Health visitor ............................................................................................................................................ 185 10.4 Nurse specialist (community) ................................................................................................................... 186 10.5 Clinical support worker nursing (community) .......................................................................................... 187 10.6 Nurse (GP practice) .................................................................................................................................. 188 10.7 Nurse advanced (includes lead specialist, clinical nurse specialist, senior specialist) ............................. 189 10.8a General practitioner — cost elements ................................................................................................... 190 10.8b General practitioner — unit costs .......................................................................................................... 191 10.8c General practitioner — commentary ..................................................................................................... 192
III. COMMUNITY-BASED SOCIAL CARE ...................................................................... 193 11. Social care staff ................................................................................................................................. 195
11.1 Social work team leader/senior practitioner/senior social worker ......................................................... 197 11.2 Social worker (adult services) ................................................................................................................... 198 11.3 Social worker (children’s services) ........................................................................................................... 199 11.4 Social work assistant ................................................................................................................................ 200 11.5 Community occupational therapist (local authority) ............................................................................... 201 11.6 Home care worker .................................................................................................................................... 202 11.7 Home care manager ................................................................................................................................. 203 11.8 Family support worker ............................................................................................................................. 204
12. Health and social care teams ............................................................................................................ 205 12.1 NHS community mental health team (CMHT) for older people with mental health problems ............... 207 12.2 Community mental health team for adults with mental health problems .............................................. 208 12.3 Crisis resolution team for adults with mental health problems .............................................................. 209 12.4 Assertive outreach team for adults with mental health problems .......................................................... 210 12.5 Early intervention team for adults with mental health problems ........................................................... 211 12.6 Generic single-disciplinary CAMHS team ................................................................................................. 212 12.7 Generic multi-disciplinary CAMHS team .................................................................................................. 213 12.8 Dedicated CAMHS team ........................................................................................................................... 214 12.9 Targeted CAMHS team ............................................................................................................................. 215 12.10 Transition services for children with complex needs when transferring to adulthood ......................... 216

iv Unit Costs of Health and Social Care 2013
IV. HOSPITAL-BASED HEALTH CARE STAFF ................................................................ 219 13. Hospital-based scientific and professional staff ............................................................................... 221
13.1 Hospital physiotherapist .......................................................................................................................... 223 13.2 Hospital occupational therapist ............................................................................................................... 224 13.3 Hospital speech and language therapist .................................................................................................. 225 13.4 Hospital dietitian ...................................................................................................................................... 226 13.5 Hospital radiographer .............................................................................................................................. 227 13.6 Hospital pharmacist .................................................................................................................................. 228 13.7 Allied health professional support worker ............................................................................................... 229
14. Hospital-based nurses ....................................................................................................................... 231 14.1 Nurse team manager (includes ward manager, sister and clinical manager) .......................................... 233 14.2 Nurse team leader (includes deputy ward/unit manager, ward team leader, senior staff nurse) .......... 234 14.3 Nurse, day ward (includes staff nurse, registered nurse, registered practitioner) .................................. 235 14.4 Nurse, 24-hour ward (includes staff nurse, registered nurse, registered practitioner) ........................... 236 14.5 Clinical support worker (hospital) ............................................................................................................ 237
15. Hospital-based doctors ..................................................................................................................... 239 15.1 Foundation house officer 1 ...................................................................................................................... 241 15.2 Foundation house officer 2 ...................................................................................................................... 242 15.3 Registrar group ......................................................................................................................................... 243 15.4 Associate specialist ................................................................................................................................... 244 15.5 Consultant: medical .................................................................................................................................. 245 15.6 Consultant: surgical .................................................................................................................................. 246 15.7 Consultant: psychiatric ............................................................................................................................. 247
V. SOURCES OF INFORMATION ................................................................................ 249 16. Inflation indices ................................................................................................................................. 251
16.1 The BCIS house rebuilding cost index and the retail price index ............................................................. 251 16.2 The hospital & community health services (HCHS) index ........................................................................ 251 16.3 Gross domestic product (GDP) deflator and the tender price index for public sector buildings ............. 252 16.4 The PSS pay & prices index ....................................................................................................................... 252
17. NHS staff earning estimates ............................................................................................................. 254 17.1 Mean annual basic pay per FTE for non-medical occupational groupings, NHS England ........................ 254 17.2 Mean annual basic pay per FTE for qualified nursing, midwifery & health visiting staff by Agenda
for Change band, NHS England ................................................................................................................ 254 17.3 Mean annual basic pay per FTE for qualified allied health professionals staff by Agenda for Change
band, NHS England ................................................................................................................................... 254 17.4 Mean annual basic pay per FTE for administration and estates .............................................................. 255 17.5 Mean annual basic pay per FTE by Agenda for Change band, NHS England ............................................ 255 17.6 Mean annual basic pay per FTE for NHS staff groups .............................................................................. 256
18. Care home fees ................................................................................................................................. 257
19. Glossary ............................................................................................................................................. 258
20. References ......................................................................................................................................... 261
21. Index of references ........................................................................................................................... 275
22. List of useful sources ......................................................................................................................... 277
23. List of items from previous volumes ................................................................................................. 279

Unit Costs of Health and Social Care 2013 1
Preface
Lesley Curtis
This has been an important year for how patient care in the English NHS is organised, with the Health and Social Care Act (2012) introducing substantial changes for the NHS. One of the consequences of these reforms for the Unit Costs of Health and Social Care has been that some information required to update estimates is now sourced from newly-created organisations, many of which became operational on 1 April 2013 (Department of Health, 2013a). Keeping abreast of these changes to reflect current practice and produce accurate costs has been an important element of this year’s work. One example, summarised below, is the new funding structure for education and training: the structural overhaul has had an important impact on the unit cost calculations (Department of Health, 2013b). With increased demand for health and social care expected (Imison et al., 2009), health and local authorities are faced with more pressure than ever to keep a tight rein on expenditure, so information on the costs of services continues to be an important contribution to accurate planning and commissioning. As in previous years, this publication includes new information, sometimes requested via our feedback form (http://www.pssru.ac.uk/project-pages/unit-costs/feedback.php) and sometimes as a result of regular literature searches carried out to ensure any recently published work is not missed. Here, as in previous years, after discussing the new funding structure for education and training, we describe distinctive aspects of this volume (guest editorial, articles and new tables), changes to routine information and work in progress.
Education and training When we estimate the cost of qualifying a professional, for pre-registration courses we need to consider the costs of tuition, the net cost or value of clinical placement, and living expenses over the duration of the course. These costs are then incorporated into the unit cost calculations using an appropriate method of annuitisation (Netten & Knight, 1999; Curtis & Netten, 2007; Curtis et al., 2012). Although the sources of information used to update living expenses remain unchanged (National Union of Students, 2013), a new structure has been put in place to fund tuition and clinical placements. Under the new system the strategic education funding responsibility will be retained by the Department of Health, but responsibility for the allocation and operational management of educational funding has passed to Health Education England (HEE) (http://hee.nhs.uk/), a new organisation which became fully operational in April 2013.
Pre-registration courses – tuition costs In May 2010, the government’s coalition agreement stated its aim to create a more sustainable way of funding higher education, and from September 2012 universities in England could raise tuition fees to up to £9,000 per year (Department for Business, Innovation & Skills, 2012). The average tuition fee for all courses in 2013 for England was £8,354, and students are entitled to receive loans from Student Finance England for maintenance and tuition fees, depending on their circumstances (National Union of Students, 2013). As well as changes for the students, a new system has been implemented to allocate funding to universities and placement providers, and this is summarised below both for medical and non-medical students. Medical students As in previous years, the Higher Education Funding Council for England (HEFCE) provides funding for the tuition fees for undergraduate doctors (years one to five). HEFCE allocates subjects to price groups using an activity-costing system called TRAC (T) – Transparent Approach to Costing for Teaching (HEFCE), 2012). Interim arrangements have been put in place for students starting courses between 2012 and 2014. For students undertaking the five-/six-year undergraduate medical degree, HEE funds the costs of tuition through the NHS Bursary Scheme of up to £9,000 per medical student for years five and six of study. For graduate students studying the four-year accelerated or ‘fast-track’ medical degree (9% of all pre-registration medical students: Higher Education Statistics Agency, 2013), HEE provides funding to the Department for Business, Innovation and

2 Unit Costs of Health and Social Care 2013 Skills (BIS) to fund a tuition fee loan of up to £5,535 for medical students in the first year of the course. Students have to self-fund £3,465 of the tuition fee costs in this first year. From the second year onwards, HEE funds the first £3,465 of the tuition fee cost through the NHS Bursary Scheme and provides funding to BIS for a tuition fee loan of up to £5,535 per medical student. The arrangements for students starting courses in 2015 have not yet been confirmed. Non-medical students HEE also funds the tuition costs of students accessing non-medical healthcare training courses. For the majority of professions, a benchmark price (BMP) tariff is used to set the funding for courses, whilst the funding for a small number of courses is negotiated locally. These tariffs ranged from £8,152 to £10,313 per student in 2012/2013, with increments for students attending universities in outer and inner London.
Pre-registration courses – clinical placement costs Currently the NHS is working to provide a better understanding of how much it costs to train professionals as there are few organisations with a full understanding of their own costs. Better costing will lead to more accurate tariffs that more closely match the costs of training delivery. Healthcare Finance (July/August 2013) provides more details of this work (http://www.google.co.uk/url?sa=t&rct=j&q=&esrc=s&frm=1&source=web&cd=1&ved=0CC8QFjAA&url=http%3A%2F%2Fwww.hfma.org.uk%2Fdownload.ashx%3Ftype%3Dinfoservice%26id%3D630&ei=9j1VUpPcBPHa0QXRpoGwDg&usg=AFQjCNH3WxTfhZMddNaavQv9cbPiqgNa-A&sig2=NaSbnHLDHfyRH8KlVelC4A/). Medical students HEE now funds the clinical placements of undergraduate medical students. In the majority of cases, these are undertaken in the third, fourth and fifth year of a student’s undergraduate course in hospitals and other healthcare settings around England. Funding is provided through a tariff system which is adjusted by the Market Forces Factor (MFF) for geographical cost factors (Department of Health, 2013c). In 2013, this tariff was fixed at £34,623 per year of placement time. Clinical placements for the fast-track degree are also funded through this system, but normally in years two, three and four of the course. Non-medical students From 1 April 2013, HEE has provided funding for the clinical placements of non-medical healthcare students. Again, funding for these placements is provided on a tariff basis (adjusted by the MFF), which ensures transparency and equity of funding by providing a single funding level for all providers. The national tariff rate from 1 April 2013 is £3,175 (Department of Health, 2013c).
Postgraduate medical education From April 2013, HEE is responsible for funding providers to support postgraduate medical trainee placements. The funding is based on the Review Body on Doctors’ and Dentists’ Remuneration (DDRB) rates (http://www.ome.uk.com/DDRB_Reports.aspx). From 1 April 2014, this funding will be replaced by a tariff covering 50 per cent of the basic salary costs of the trainee plus a placement fee which will be adjusted for geographical cost factors by using the MFF. HEE is currently finalising the transition plans for the new tariff.
What’s new in the publication this year?
Guest editorial Following the Department of Health’s commitment to sustainable practices in the delivery of services (HM Government, 2008), this year John Appleby, Chris Naylor and Imogen Tennison have provided a guest editorial, Widening the scope of unit costs to include environmental costs, which discusses ways of measuring unit carbon costs. In future years we hope to be able to include these costs in the unit costs calculations.

Unit Costs of Health and Social Care 2013 3 Articles The first article, by Barbara Barrett and Hristina Petkova, both from King’s College London, reviews cost studies focusing on cognitive behavioural therapy interventions. The article shows the cost per hour for each intervention, the patient group and therapists involved in providing the treatment, and it also identifies factors that influence the variation in costs.
Jonathan Stanley from the National Centre for Excellence in Residential Child Care and Andrew Rome of Revolution Consulting have provided our second article. This discusses the results of a survey distributed to local authorities to establish the average price per week paid for a residential placement to private and voluntary providers. In local authorities which operate their own children’s homes, the weekly cost of these ‘in-house’ homes was also requested. This article also discusses the complexity of the residential care market for children, and what steps need to be taken to understand the costs better and ultimately provide better outcomes for children. The third article, by Cate Henderson and colleagues (PSSRU, London School of Economics), provides the costs associated with supporting telehealth and telecare. These costs were calculated as part of the Whole Systems Demonstrator pilot and evaluation, which was set up by the Department of Health (2011a) to show the capabilities of telehealth and telecare.
New unit costs
Adult End-of-life care End-of-life care is an important national priority in England (Department of Health, 2008). Following on from the inclusion of costs relating to end-of-life care at home for children (page 92 in last year’s volume), this year we have included a summary of research carried out by the Nuffield Trust (table 7.11) (Georghiou et al., 2012) on behalf of the National End of Life Care Intelligence Network (http://www.endoflifecare-intelligence.org.uk/home/). This provides the costs of care services in the last twelve months of life, as well as the average cost per decedent and per user for each type of service.
Dementia memory service In response to government priorities (Department of Health, 2011b), we have included the cost of a dementia memory service (table 1.8) provided by the South London and Maudsley NHS Foundation Trust. In addition to using data from a national audit, we have provided the average total annual cost per clinic, the average cost per patient attendance, and the average minimum and maximum costs per patient attendance (http://www.rcpsych.ac.uk/workinpsychiatry/qualityimprovement/nationalclinicalaudits/memoryservicesaudit.aspx).
Care homes This year the Laing & Buisson (2013) data on care home fees are split into their component parts – care costs, accommodation costs, ancillary costs – and the survey also provides information on the operator’s profit. We have drawn on this information to improve the estimates for private sector nursing found in tables 1.1 and 1.2.
In chapter 18 of this report is a list drawn from Laing & Buisson care homes data (2011), showing the average minimum and average maximum fees for residential and nursing homes in the UK for different client groups.
Learning disabilities models As part of the process of improving information about support for people with learning disabilities (LD), and to support local authorities, Laing & Buisson (2012) was commissioned by the Department of Health to undertake a short piece of work to compile and describe a range of illustrative cost models. These models, depicting the unit costs of different approaches based on input from providers form the basis of tables 8.4.1-8.4.2. Parenting programmes In table 6.15 we have drawn on a study by Bonin and colleagues (2011) to provide the cost of delivering group-based parenting programmes.
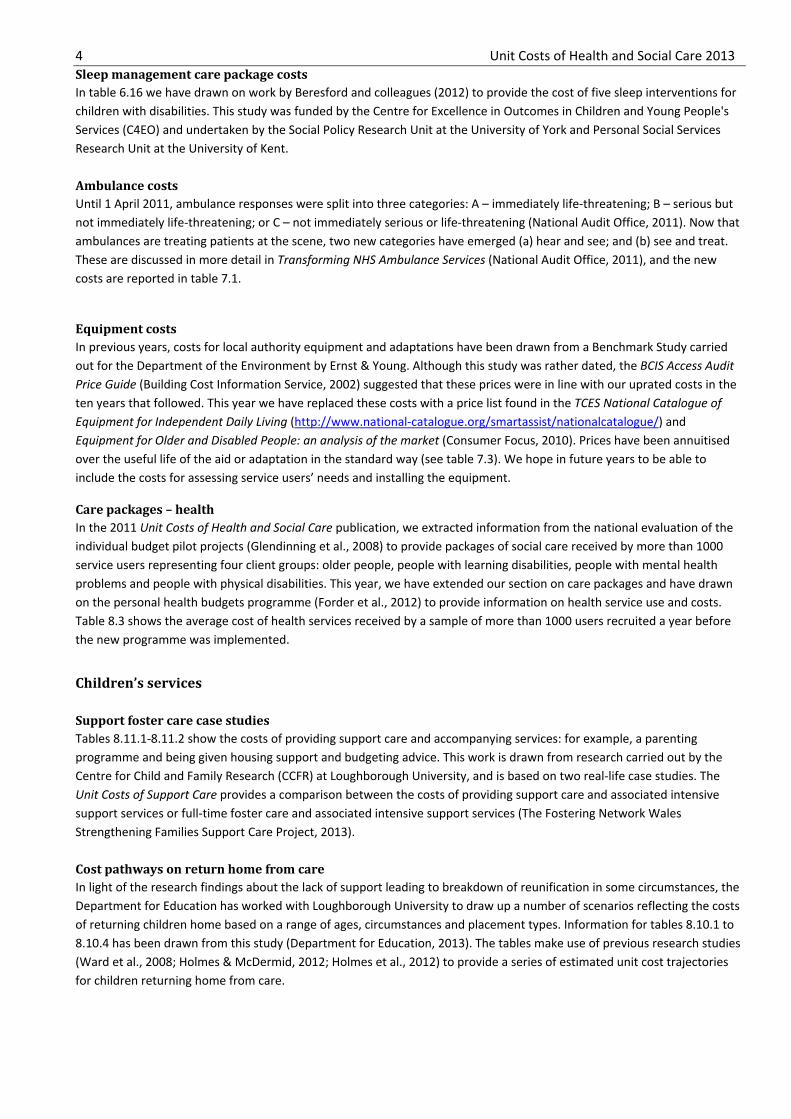
4 Unit Costs of Health and Social Care 2013 Sleep management care package costs In table 6.16 we have drawn on work by Beresford and colleagues (2012) to provide the cost of five sleep interventions for children with disabilities. This study was funded by the Centre for Excellence in Outcomes in Children and Young People's Services (C4EO) and undertaken by the Social Policy Research Unit at the University of York and Personal Social Services Research Unit at the University of Kent. Ambulance costs Until 1 April 2011, ambulance responses were split into three categories: A – immediately life-threatening; B – serious but not immediately life-threatening; or C – not immediately serious or life-threatening (National Audit Office, 2011). Now that ambulances are treating patients at the scene, two new categories have emerged (a) hear and see; and (b) see and treat. These are discussed in more detail in Transforming NHS Ambulance Services (National Audit Office, 2011), and the new costs are reported in table 7.1.
Equipment costs In previous years, costs for local authority equipment and adaptations have been drawn from a Benchmark Study carried out for the Department of the Environment by Ernst & Young. Although this study was rather dated, the BCIS Access Audit Price Guide (Building Cost Information Service, 2002) suggested that these prices were in line with our uprated costs in the ten years that followed. This year we have replaced these costs with a price list found in the TCES National Catalogue of Equipment for Independent Daily Living (http://www.national-catalogue.org/smartassist/nationalcatalogue/) and Equipment for Older and Disabled People: an analysis of the market (Consumer Focus, 2010). Prices have been annuitised over the useful life of the aid or adaptation in the standard way (see table 7.3). We hope in future years to be able to include the costs for assessing service users’ needs and installing the equipment.
Care packages – health In the 2011 Unit Costs of Health and Social Care publication, we extracted information from the national evaluation of the individual budget pilot projects (Glendinning et al., 2008) to provide packages of social care received by more than 1000 service users representing four client groups: older people, people with learning disabilities, people with mental health problems and people with physical disabilities. This year, we have extended our section on care packages and have drawn on the personal health budgets programme (Forder et al., 2012) to provide information on health service use and costs. Table 8.3 shows the average cost of health services received by a sample of more than 1000 users recruited a year before the new programme was implemented.
Children’s services Support foster care case studies Tables 8.11.1-8.11.2 show the costs of providing support care and accompanying services: for example, a parenting programme and being given housing support and budgeting advice. This work is drawn from research carried out by the Centre for Child and Family Research (CCFR) at Loughborough University, and is based on two real-life case studies. The Unit Costs of Support Care provides a comparison between the costs of providing support care and associated intensive support services or full-time foster care and associated intensive support services (The Fostering Network Wales Strengthening Families Support Care Project, 2013). Cost pathways on return home from care In light of the research findings about the lack of support leading to breakdown of reunification in some circumstances, the Department for Education has worked with Loughborough University to draw up a number of scenarios reflecting the costs of returning children home based on a range of ages, circumstances and placement types. Information for tables 8.10.1 to 8.10.4 has been drawn from this study (Department for Education, 2013). The tables make use of previous research studies (Ward et al., 2008; Holmes & McDermid, 2012; Holmes et al., 2012) to provide a series of estimated unit cost trajectories for children returning home from care.
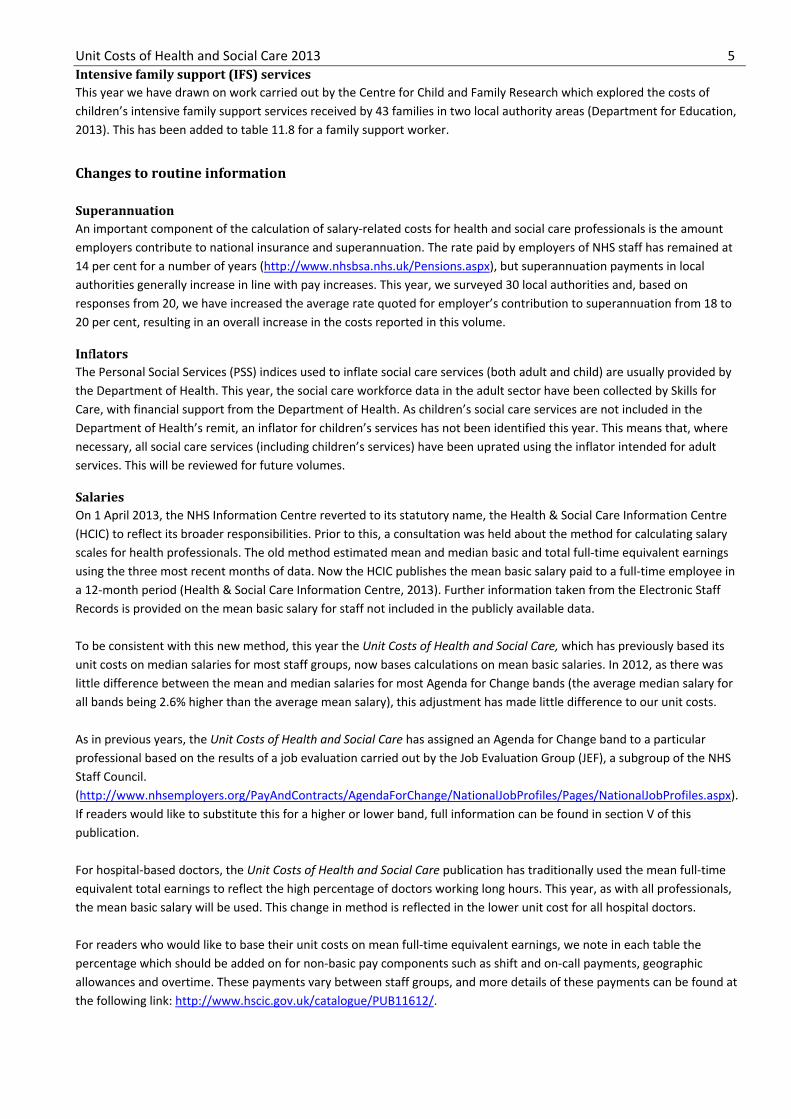
Unit Costs of Health and Social Care 2013 5 Intensive family support (IFS) services This year we have drawn on work carried out by the Centre for Child and Family Research which explored the costs of children’s intensive family support services received by 43 families in two local authority areas (Department for Education, 2013). This has been added to table 11.8 for a family support worker.
Changes to routine information Superannuation An important component of the calculation of salary-related costs for health and social care professionals is the amount employers contribute to national insurance and superannuation. The rate paid by employers of NHS staff has remained at 14 per cent for a number of years (http://www.nhsbsa.nhs.uk/Pensions.aspx), but superannuation payments in local authorities generally increase in line with pay increases. This year, we surveyed 30 local authorities and, based on responses from 20, we have increased the average rate quoted for employer’s contribution to superannuation from 18 to 20 per cent, resulting in an overall increase in the costs reported in this volume.
Inflators The Personal Social Services (PSS) indices used to inflate social care services (both adult and child) are usually provided by the Department of Health. This year, the social care workforce data in the adult sector have been collected by Skills for Care, with financial support from the Department of Health. As children’s social care services are not included in the Department of Health’s remit, an inflator for children’s services has not been identified this year. This means that, where necessary, all social care services (including children’s services) have been uprated using the inflator intended for adult services. This will be reviewed for future volumes.
Salaries On 1 April 2013, the NHS Information Centre reverted to its statutory name, the Health & Social Care Information Centre (HCIC) to reflect its broader responsibilities. Prior to this, a consultation was held about the method for calculating salary scales for health professionals. The old method estimated mean and median basic and total full-time equivalent earnings using the three most recent months of data. Now the HCIC publishes the mean basic salary paid to a full-time employee in a 12-month period (Health & Social Care Information Centre, 2013). Further information taken from the Electronic Staff Records is provided on the mean basic salary for staff not included in the publicly available data. To be consistent with this new method, this year the Unit Costs of Health and Social Care, which has previously based its unit costs on median salaries for most staff groups, now bases calculations on mean basic salaries. In 2012, as there was little difference between the mean and median salaries for most Agenda for Change bands (the average median salary for all bands being 2.6% higher than the average mean salary), this adjustment has made little difference to our unit costs. As in previous years, the Unit Costs of Health and Social Care has assigned an Agenda for Change band to a particular professional based on the results of a job evaluation carried out by the Job Evaluation Group (JEF), a subgroup of the NHS Staff Council. (http://www.nhsemployers.org/PayAndContracts/AgendaForChange/NationalJobProfiles/Pages/NationalJobProfiles.aspx). If readers would like to substitute this for a higher or lower band, full information can be found in section V of this publication. For hospital-based doctors, the Unit Costs of Health and Social Care publication has traditionally used the mean full-time equivalent total earnings to reflect the high percentage of doctors working long hours. This year, as with all professionals, the mean basic salary will be used. This change in method is reflected in the lower unit cost for all hospital doctors. For readers who would like to base their unit costs on mean full-time equivalent earnings, we note in each table the percentage which should be added on for non-basic pay components such as shift and on-call payments, geographic allowances and overtime. These payments vary between staff groups, and more details of these payments can be found at the following link: http://www.hscic.gov.uk/catalogue/PUB11612/.

6 Unit Costs of Health and Social Care 2013 Ongoing work Time use In last year’s volume, we discussed the importance of ensuring that all staff time is appropriately allocated and the difficulty of obtaining studies which provide this information. We also took the opportunity to provide a short article describing the time diaries which were used in the Unit Costs in Criminal Justice (UCCJ) research. This year, so that we can provide a cost per patient-related hour for all professionals contained in the Unit Costs of Health and Social Care publication, we have prepared a survey (https://www.surveymonkey.com/s/SZMF5YL) which will be distributed via social media and, where possible, advertised on the websites of professional groups such as the Royal College of Nursing and the British Dietetic Association. The link to this survey also appears on the appropriate tables in this report for each professional, and we would like to encourage as many health and social care professionals as possible to complete it. Capital The method we use to incorporate the capital element of a service (building and land) has been discussed in previous editions of this publication (see 2010 and 2003). Where actual building costs for services are not available, the convention has always been to use ‘new-build’ replacement costs, which are available quarterly from the Building Cost Information Service (BCIS). Although the BCIS provides a great deal of valuable information, it does not include other costs to the building’s purchaser, such as fees, furniture and fittings. Work is currently underway to update these ‘additional’ costs, as it is now more than ten years since the original research. The results will be reported in next year’s Unit Costs of Health and Social Care publication, together with results from commissioned work to provide up-to-date estimates of land costs.
Call for information Services for adults with a physical disability In 2002, the Christian-based charity John Grooms provided us with information on the costs of services for people with physical and sensory impairments (see chapter 5 of last year’s publication). Each table included information about the types and severity of conditions among the people supported, the facility’s purpose, and the type of service provided. Given our rule of excluding information which is more than ten years old, this year we have only included estimates from national sources of data (PSS EX1). We hope in the future to be able to draw on new studies and would appreciate any information on this topic.
Other information Criminal justice services Following on from the article by Nadia Brookes and Ann Netten on Using time diaries to contribute to economic evaluation of criminal justice interventions we included in last year’s Unit Costs of Health and Social Care publication, the full report on Unit Costs in Criminal Justice is now publicly available: http://www.pssru.ac.uk/archive/pdf/dp2855.pdf. Also published in November 2012 was the Social Research Unit’s technical report on Investing in Children http://dartington.org.uk/investing-in-children-overview/. This includes unit costs for youth justice, education, early years and child protection, and social care interventions. It also contains information on criminal justice sector and victim costs.
The value of volunteering This year the Department for Work and Pensions (DWP) and the Cabinet Office have published a report Wellbeing and Civil Society, which estimates the value of volunteering using subjective wellbeing data https://www.gov.uk/government/uploads/system/uploads/attachment_data/file/221227/WP112.pdf. Using data on life satisfaction and volunteering status in the British Household Panel Survey (BHPS), the value of volunteering to the volunteer was identified for people aged over 16 years. The equivalent of the wellbeing benefit derived from volunteering was estimated to be about £13,500 per year at 2011 prices. Acknowledgements As in previous years, we would like to encourage readers to continue commenting on how the unit costs estimates are useful to them by e-mailing [email protected] or by filling in the feedback form, which is a tool used to guide our research. This can be found on the PSSRU website on http://www.pssru.ac.uk/project-pages/unit-costs/feedback.php. Also,

Unit Costs of Health and Social Care 2013 7 if you are able to assist our research on how professionals spend their time by forwarding the Survey Monkey questionnaire to health and social care professionals you are working with, we would be very grateful. The link to this survey is https://www.surveymonkey.com/s/SZMF5YL.
This report relies on a wide range of individuals providing direct input in the form of data for table, permission for the reproduction of material, background information and advice, and alerting us to the existence of reports and studies. Grateful thanks are extended particularly to Jennifer Beecham, whose input into this volume is invaluable. Thanks also go to Amanda Burns, Jane Dennett and Ed Ludlow for administrative and technical support, as well as our Working Group members (included below). We would also like to say a special thank you to Raphael Wittenberg, who has supported this work since its inception in 1993 and who has only this year resigned from the Working Group.
Others who have assisted this year are: John Appleby, Barbara Barrett, Bryony Beresford, Eva Bonin, Scott Binyon, James Booth, Sarah Byford, Ross Campbell, Adriana Castelli, Anna Child, Agu Chinyere, Isabella Craig, Robert Dent, Jennifer Francis, Theo Georghiou, Christine Godfrey, Cate Henderson, Lisa Holmes, Bernard Horan, Karen Jones, Alistair Kent, John Kipling, Armin Kirthi-Singha, Matthew Langdon, Russell Lawrence, Samantha McDermid, Metin Mustafa, Chris Naylor, Mike Newton, David Norman, Laura Powell, Mark Purvis, Andrew Rome, Eldon Spackman, Jonathan Stanley, Madeleine Stevens, Charles Tallack, Imogen Tennison, Jonathan White and Panos Zerdevas.
References Audit Commission (2012) Reducing the costs of assessments and reviews, http://archive.audit-
commission.gov.uk/auditcommission/sitecollectiondocuments/Downloads/20120823assessmentsandreview.pdf [accessed 13 July 2013].
Building Cost Information Service (2002) BCIS access audit price guide, http://www.rics.org/uk/shop/BCIS-Access-Audit-Price-Guide-6233.aspx [accessed 13 July 2013].
Beresford, B., Stuttard, L., Clarke, S., Maddison, J. & Beecham, J. (2012) Managing behaviour and sleep problems in disabled children: An investigation into the effectiveness and costs of parent-training interventions, Research Report DFE-RR204a, Department for Education, London.
Bonin, E., Stevens, M., Beecham, J., Byford, S. & Parsonage, M. (2011) Costs and longer-term savings of parenting programmes for the prevention of persistent conduct disorder: a modelling study, BMC Public Health 2011, 11, 803, doi:10.1186/1471-2458-11-803.
Consumer Focus (2010) Equipment for older and disabled people: an analysis of the market, http://www.consumerfocus.org.uk/files/2010/11/Equipment-for-older-and-disabled-people-an-analysis-of-the-market.pdf [accessed 13 July 2013].
Curtis, L. & Netten, A. (2007) The costs of training a nurse practitioner in primary care: the importance of allowing for the cost of education and training when making decisions about changing the professional mix, Journal of Nursing Management, 15, 4, 449-457.
Curtis, L., Moriarty, J. & Netten, A. (2012) The costs of qualifying a social worker, British Journal of Social Work, 42, 4, 706-724.
Department for Business, Innovation & Skills (2012) Making the higher education system more efficient and diverse, https://www.gov.uk/government/policies/making-the-higher-education-system-more-efficient-and-diverse/ [accessed 11 July 2013].
Department for Education (2013) Data pack: improving permanence for looked after children, http://www.education.gov.uk/a00227754/looked-after-children-data-pack/ [accessed 1 October 2013].
Department of Health (2008) End of life care strategy:promoting high quality care for adults at the end of their life, https://www.gov.uk/government/publications/end-of-life-care-strategy-promoting-high-quality-care-for-adults-at-the-end-of-their-life/ [accessed 11 July, 2013].
Department of Health (2011a) Whole Systems Demonstrator programme, https://www.gov.uk/government/uploads/system/uploads/attachment_data/file/215264/dh_131689.pdf [accessed 16 July 2013].
Department of Health (2011b) Commissioning services for people with dementia, http://webarchive.nationalarchives.gov.uk/+/www.dh.gov.uk/en/Publicationsandstatistics/Publications/PublicationsPolicyAndGuidance/Browsable/DH_127381/ [accessed 15 July 2013].
Department of Health (2013a) Guide to the healthcare system in England, including the statement of NHS accountability, https://www.gov.uk/government/publications/guide-to-the-healthcare-system-in-england/ [accessed 11 July 2013].

8 Unit Costs of Health and Social Care 2013 Department of Health (2013b) Department of Health 2013-14 Corporate Plan,
https://www.gov.uk/government/publications/department-of-health-corporate-plan-2013-14/ [accessed 11 July 2013]. Department of Health (2013c) Personal correspondence with the Department of Health. Forder, J., Jones, K., Glendinning, C., Caiels, J., Welch, E., Baxter, K., Davidson, J., Windle, K., Irvine, A., King, D. & Dolan, P.
(2012) Evaluation of the personal health budget pilot programme, PSSRU, University of Kent. Fostering Network Wales Strengthening Families Support Care Project (2013) Unit costs of support care,
http://www.fostering.net/sites/www.fostering.net/files/resources/wales/unit_costs_of_support_care_.pdf [accessed 17 October 2013].
Georghiou, T., Davies, S., Davies, A. & Bardsley, M. (2012) Understanding patterns of health and social care at the end of life, Nuffield Trust, London, http://www.nuffieldtrust.org.uk/publications/health-social-care-end-life/ [accessed 15 July 2013].
Glendinning, C., Challis, D., Fernandez, J., Jacobs, S., Jones, K., Knapp, M., Manthorpe, J., Moran, N., Netten, A., Stevens, M. & Wilberforce, M. (2008) Evaluation of the individual budgets pilot programme: Final Report, Social Policy Research Unit, University of York, York.
Healthcare Finance (2013) Costing lessons, http://www.google.co.uk/url?sa=t&rct=j&q=&esrc=s&frm=1&source=web&cd=1&ved=0CC8QFjAA&url=http%3A%2F%2Fwww.hfma.org.uk%2Fdownload.ashx%3Ftype%3Dinfoservice%26id%3D630&ei=9j1VUpPcBPHa0QXRpoGwDg&usg=AFQjCNH3WxTfhZMddNaavQv9cbPiqgNa-A&sig2=NaSbnHLDHfyRH8KlVelC4A/ [accessed 9 October 2013].
Health & Social Care Information Centre (2013) NHS staff earnings estimates – October-December 2012, http://www.hscic.gov.uk/article/2021/Website-Search?productid=11289&q=staff+earnings&sort=Relevance&size=10&page=1&area=both#top/ [accessed 5 October 2013].
Higher Education Statistics Agency (HESA) Personal correspondence with HESA, 2013. Health and Social Care Act (2012) Health and Social Care Act 2012,
http://www.legislation.gov.uk/ukpga/2012/7/contents/enacted/ [accessed 11 July 2013]. Health & Social Care Information Centre (2013) NHS staff earnings estimates to March 2013,
https://catalogue.ic.nhs.uk/publications/workforce/earnings/nhs-staff-earn-mar-2013/nhs-staf-earn-est-to-Mar-2013.pdf [accessed 11 July 2013].
Higher Education Funding Council for England (HEFCE) (2012) Review of clinical subject weightings, http://www.hefce.ac.uk/pubs/rereports/year/2012/clinsubjwghtgs/ [accessed 15 July 2013].
Higher Education Funding Council for England (HEFCE) (2013) Funding for universities and colleges for 2012-13 and 2013-14: Board decisions, http://www.hefce.ac.uk/pubs/year/2013/cl042013/ [accessed 15 July 2013].
Holmes, L., McDermid, S., Padley, M. & Soper, J. (2012) Exploration of the costs and impact of the Common Assessment Framework, Department of Health, London.
Holmes, L. & McDermid, S. (2012) Understanding costs and outcomes in child welfare services, Jessica Kingsley, London. HM Government (2008) Climate Change Act 2008, http://www.legislation.gov.uk/ukpga/2008/27/contents/ [accessed 15
July 2013]. Imison, C., Buchan, J. & Xavier, S. (2009) NHS workforce planning, limitations and possibilities, King’s Fund, London,
http://www.kingsfund.org.uk/sites/files/kf/NHS-Workforce-Planning-Candace-Imison-James-Buchan-Su-Xavier-Kings-Fund-November-2009.pdf [accessed 16 July 2013].
Laing & Buisson (2011) 2010 care homes complete data, London. Laing & Buisson (2011) Illustrative cost models in learning disabilities social care provision, Department of Health, London,
http://www.laingbuisson.co.uk/portals/1/media_packs/Fact_Sheets/Illustrative_Costs_PLD.pdf [accessed 11 July 2013]. Laing & Buisson (2013) Councils rely on a 'hidden tax' on older care home residents,
http://www.laingbuisson.co.uk/MediaCentre/PressReleases/CareofElderly201213PressRelease.aspx [accessed 15 July 2013].
McDermid, S. & Holmes, L. (2013) The cost effectiveness of action for children’s intensive family support services, Final Report, Centre for Child and Family Research, Loughborough University. http://socialwelfare.bl.uk/subject-areas/services-client-groups/families/actionforchildren/153741intensive-family-support-cost-effectiveness_full-report.pdf [accessed 3 October 2013].
National Audit Office (2011) Transforming NHS ambulance services, http://www.nao.org.uk/wp-content/uploads/2011/06/n10121086.pdf [accessed 11 July, 2013].

Unit Costs of Health and Social Care 2013 9 National Union of Students (2013) What are the costs of study and living? http://www.nus.org.uk/en/advice/money-and-
funding/info-and-advice/average-costs-of-living-and-study/ [accessed 15 July 2013]. Netten, A. & Knight, J. (1999) Annuitizing the human capital investment costs of health service professionals, Health
Economics, 8, 245-255. Ward, H., Holmes, L. & Soper, J. (2008) Costs and consequences of placing children in care, Jessica Kingsley, London.

10 Unit Costs of Health and Social Care 2013
Widening the scope of unit costs to include environmental costs
Guest editorial John Appleby, Chris Naylor and Imogen Tennison
Introduction It has been five years since the publication of the Climate Change Act which committed the UK to cut carbon emissions by at least 80 per cent by 2050, and with a reduction of 34 per cent by 2020. As the largest public sector contributor to climate change via its direct and indirect generation of greenhouse gases, the implications of these commitments for the health and social care sector are significant. The response by the NHS in England was to set up the Sustainable Development Unit (SDU) to ‘develop organisations, people, tools, policy and research which will enable organisations to promote sustainable development, to mitigate and to adapt to climate change’. In 2009 the SDU published the NHS Carbon Reduction Strategy for England (Sustainable Development Unit, 2009). Meeting the Climate Change Act’s emission cuts in stages to 2050 (see figure 1) was central to the strategy. Figure 1. English NHS carbon footprint with Climate Change Act targets (source: SDU 2012a)
As the figure shows, the reduction goals are hugely ambitious and will require transformative action on the part of the NHS, including radical new ways of delivering health care. Increasingly, decisions about what care to provide and the ways in which services are provided will need to weigh up not just the direct financial costs to the NHS anwd health benefits to patients, but the costs (and benefits) to the environment. As Walker et al. (2012) have noted, expanding the scope of decision-making in the NHS to include more general impacts in society – including, in this case, environmental impacts – raises not just fundamental questions about the role of economic evaluations in social choice, but technical issues too. The former includes problems in valuing the gains in health on the one hand versus the losses incurred elsewhere in the economy (i.e. not just the financial costs incurred by the NHS in
0
5
10
15
20
25
1990
1993
1996
1999
2002
2005
2008
2011
2014
2017
2020
2023
2026
2029
2032
2035
2038
2041
2044
2047
2050
Mill
ion
Tonn
es C
O2e
English NHS GHG emissions
English NHS forecast GHG emissions
Carbon Reduction Strategy Target
Carbon Budget Target
10% reduction on 2007 baseline
34% target on 1990 baseline
64% target on 1990 baseline
80% target on 1990 baseline

Unit Costs of Health and Social Care 2013 11 generating the health benefit). The NICE-type question ‘Is it worth it?’ starts to become much trickier to answer. Technical issues include the question of what financial value to place on a unit of carbon. Carbon trading prices, for example, have varied considerably over recent years. While there is already an acceptance – for example, in terms of the impact assessments carried out by the government on major public policy change – that environmental impacts need to be included on the costs side of the policy equation, such assessments usually leave a lot to be desired in terms of their detail and sophistication. In part this is due to some of the ‘value’ problems noted by Walker et al. (2012), but there is also an empirical difficulty (also noted in general by Walker et al., 2012) concerning the identification and measurement of the environmental costs of NHS activities. Such problems are not new, of course. As the Unit Costs of Health and Social Care has developed over the last two decades, it has had to grapple with decisions about, among other things, what counts as a ‘cost’, how shared costs or overheads are best allocated to particular activities or jobs, and what values – market or otherwise – are most appropriate. In other areas of NHS decision-making, boundaries regarding what is counted as a cost are drawn fairly strictly. For example, in its assessments of value for money, NICE only counts costs falling on the NHS and specifically excludes other costs, such as those borne by carers or the wider economy, including the environment. However, as we go on to elaborate, there is an argument for widening the scope of economic evaluation (where appropriate) to account for environmental costs, such as carbon and other greenhouse gas emissions.
The rationale for including carbon costs In considering the case for including carbon alongside other costs, it is important to understand the scale of the contribution that the health and social care sector makes to the national environmental footprint. The NHS in England is responsible for around 20 million tonnes of carbon dioxide and other greenhouse gas emissions each year, exceeding total emissions from all flights departing from Heathrow airport (Naylor & Appleby, 2012). This accounts for 25 per cent of all public sector carbon emissions, and does not include social care and non-NHS provision. As a result, the system is under increasing pressure to reduce its environmental impact. Progress on this to date is mixed. Although the NHS has become more efficient in its use of carbon (per £ spent), spending has increased at a faster rate and so the overall use of carbon has also increased (Sustainable Development Unit, 2012a). A projected fall in total greenhouse gas emissions from 2009 to 2014 broadly reflects the slowdown in NHS funding over this period. Projections to 2020 suggest emissions will start to increase, diverging from the reduction path set out by the SDU. Over time it is to be expected that pressure will grow for the health and social care sector to reduce its environmental impact. There are also more immediate reasons to engage with the issue. Health and social care providers face direct costs created by rising energy prices. The NHS energy bill is already in excess of £500 million each year. Environmental policy tools such as the CRC (Carbon Reduction Commitment) Energy Efficiency Scheme create a further financial incentive to reduce carbon emissions. Marginal abatement cost (MAC) curves are often used to show graphically where carbon and financial savings are aligned. By plotting cost-effectiveness data against carbon savings, these provide a useful tool to support decision-making, and a straightforward way of evaluating carbon and financial costs or benefits at the same time. A modelling exercise using this approach assessed the benefits of measures such as reduced drug wastage or improved uptake of telecommunication technologies. If implemented across the NHS in England, the 29 measures could save an estimated £180 million and over 800,000 tonnes of CO2 a year (Hazeldine et al., 2010). Reviewing just three high-impact innovations suggests a carbon saving of over 25,000 tonnes of CO2 a year (Sustainable Development Unit, 2010). Health professionals have also highlighted the opportunities to improve public health while reducing environmental impacts, for example by promoting active travel (walking and cycling) instead of driving, reducing meat consumption, improving insulation in housing, and improving access to green spaces (Haines et al., 2009). The most environmentally sustainable approach to health is likely to be one that prioritises prevention, minimising avoidable use of resources by

12 Unit Costs of Health and Social Care 2013 promoting good health in the population and preventing those who become unwell from going on to need highly resource-intensive care. Generating better information on the unit carbon costs of care will be an important step in allowing progress in reducing the carbon footprint of health and social care. Inclusion of carbon costs in cost-benefit analyses will not be possible until researchers are able to easily access data on the carbon costs of standardised units of care. Similarly, service commissioners will be more able to take environmental costs and benefits into account when these costs are internalised into the decision-making process (with carbon costs acting as a proxy for environmental costs more generally).
Measuring unit carbon costs Carbon footprinting methodologies are still evolving as standards emerge. There are significant trade-offs between existing methodologies, with no single method offering a perfect approach for all purposes. An important distinction is between bottom-up and top-down methodologies. Life Cycle Analysis is an example of a bottom-up method based on monitoring individual items used in an organisation or process, and could be used to create unit costs. As with reference costs calculations, the boundaries can make a significant difference to the outputs. Top-down methods use international datasets and extend existing economic input-output models to include carbon emissions alongside financial values. This allows the carbon intensity per unit spend to be calculated for each economic sector, and brings two benefits: the boundaries are comparable for calculations across different goods and services; and it is possible to capture the whole carbon footprint. The input-output approach does not, however, distinguish between products in a given economic sector, making comparison between similar products or services less straightforward. Top-down approaches work well in identifying hotspots where more detailed investigation is needed. Tools and methods are emerging which allow a combination of bottom-up and top-down datasets using the strengths of both methods. Some examples already exist of both top-down and bottom-up methods used to calculate unit carbon costs in health care. Tennison (2010) calculated the average of four different methods for determining carbon per unit of activity. Using a combination of costs across the health service and levels of some types of activity, the approach created an estimate of average carbon footprint. As with reference costs, the level of granularity used makes a large difference to the outcome. The Goods and Services Carbon Hotspots report (Sustainable Development Unit, 2012b) used more detailed procurement spend information for activity in different settings: acute, mental health and community services. Results from both of these methods are presented in table 1. Table 1 Indicative1
(kgCO2e) Acute2
(kgCO2e) Mental health2
(kgCO2e) Ambulance2
(kgCO2e) Primary care2
(kgCO2e) Inpatient admission 380 446 476 - -Bed day (additional) 80 91 97 - -Outpatient appointment 50 56 59 - -Ambulance journey - - - 68 -GP appointment - - - - 663
Prescription item - - - - 71 Tennison, 2010 2 SDU, 2012b 3 GP appointments are an over-estimate as community services and prescription items have both been included in this figure These calculations could easily be improved by aligning more closely with financial accounting and using more detailed activity and cost information, combined with more detailed carbon datasets.

Unit Costs of Health and Social Care 2013 13 Carbon footprints for care pathways and service lines A number of studies have been published examining the carbon footprint of particular care pathways, often based on a combination of bottom-up and top-down approaches. Nephrology has been a particular target for research. One study compared different treatment regimes for haemodialysis and allows the carbon footprint of alternative service delivery options to be considered (Connor et al., 2011a). An analysis of a renal service in the UK used a combined approach to produce a per patient carbon footprint, as shown in table 2 (Connor et al., 2010). Table 2 Indicative emissions1
(kgCO2e) Renal service emissions2
(kgCO2e) Inpatient admission 380 Bed day (additional) 80 161 Outpatient appointment 50 22 1 Tennison, 2010 2 Connor et al., 2010 The findings from this work illustrate the scale of the environmental impact associated with some forms of care. Receiving dialysis treatment nearly doubles the annual carbon footprint for an individual, compared to the average footprint of a UK citizen. A further study found that environmental impacts associated with after-care for renal transplant recipients could be reduced using telephone follow-up, which also delivered benefits for patients and the financial cost (Connor et al., 2011b). Service delivery options were also examined using a bottom-up approach in Cornwall, where centralised and local provision of services were compared using a model of the carbon footprint from building energy use, waste, water and travel (Pollard et al., 2012). Although the boundaries were set to exclude goods and services purchased, it does allow like-for-like comparison across different service delivery options using the same medical supplies. Service-line footprinting of carbon emissions in a mental health trust in Nottingham (Starr, 2012) included the buildings, travel and procurement carbon footprint broken down by service line. As with the data flows for reference costing, the more detail collected in the information, the more accurate the carbon footprint. In another study, delivery options for smoking cessation services were considered using a bottom-up approach combining Life Cycle Analysis information where available with top-down estimates where datasets did not exist (Smith et al., 2013). The research calculated carbon emissions per quitter for a number of delivery options (see table 3): Table 3 Carbon emissions per 1000
quitters (kgCO2e) Carbon emissions per lifetime quitter
(kgCO2e) Text message support 8143 636 Telephone counselling 8619 1051 Group counselling 16114 1143 Individual counselling 16372 2823 All these approaches to calculating carbon to use alongside costs have their advantages. The calculations all show that there are variations in the carbon per unit activity which depend on the services being provided. Limitations of the datasets available have been overcome through the use of hybrid methods combining detailed information where available and maintaining the overall scope of emissions included.
Conclusion Carbon emissions are the most widely-used proxy for wider environmental impacts. Including carbon costs in unit cost data could be a key step in allowing the health and social care system to respond to the pressure it is under to improve the environmental sustainability of its activities. Decision-makers will need this information if they are to identify opportunities to reduce environmental impacts in a way that also delivers financial benefits and improvements in quality.

14 Unit Costs of Health and Social Care 2013 There are a variety of methods already available for including carbon in unit cost calculations. While none of these is perfect, by using a pragmatic combination of different methods it is possible to find an acceptable balance between rigour and feasibility with existing techniques. In a similar way to the evolution of reference costing, over time methods will become more sophisticated, calculations more accurate, and the ease with which unit carbon costs can be included as a standard part of the process can be expected to improve. There are several directions that could be explored for including carbon costs in future volumes of the Unit Costs of Health and Social Care. First, with the information already available it would be possible to produce indicative figures for different types of activity. Once initial figures were produced in this way they could be tested and refined using comparisons with life-cycle footprinting work at the local level. A second approach would be to improve data flows from providers, extending existing data collection mechanisms to allow for the submission of carbon data alongside costing information. Making standard submissions available would allow carbon calculations to be improved in future. Choices must be made regarding how carbon costs are presented. These could be included as a component of the unit cost (like labour or building costs) or presented separately alongside the usual financial costs. The latter option may be preferable initially, while methodologies are still under development. Whatever approach is taken, researchers and decision-makers both stand to benefit from having access to the information that would be generated.
References Connor, A., Lillywhite, R. & Cooke, M. (2011a) The carbon footprints of home and in-centre maintenance hemodialysis in
the United Kingdom, Hemodialysis International, 15, 1, 39-51. Connor, A., Mortimer, R. & Higgins, R. (2011b) The follow-up of renal transplant recipients by telephone consultation: three
years experience from a single UK renal unit, Clinical Medical Journal, 11, 3, 242-246. Connor, A., Lillywhite, R. & Cooke, M. (2010) The carbon footprint of a renal service in the United Kingdom, QJM, 103, 12,
965-975. Haines, A., Wilkinson, P., Tonne C. & Roberts, I. (2009) Aligning climate change and public health policies, The Lancet, 374,
9707, 2035-2038. Hazeldine, T., Clark, W., Deller, L. & Vasileios, P. (2010) MAC curves NHS England: marginal abatement cost curve,
Cambridge: SDU, http://www.sduhealth.org.uk/documents/publications/1268054230_JynW_the_marginal_abatement_cost_curve_(mac_curve)_-_in.pdf [accessed 15 July 2013].
HM Government (2008) Climate Change Act 2008, http://www.legislation.gov.uk/ukpga/2008/27/contents/ [accessed 15 July 2013].
Naylor, A. & Appleby, J. (2012) Sustainable health and social care: connecting environmental and financial performance. King’s Fund, London, http://www.kingsfund.org.uk/publications/sustainable-health-and-social-care/ [accessed 15 July 2013].
Pollard, A., Taylor, T., Fleming, L., Stahl-Timmins, W., Depledge, M. & Osborne N. (2012) Mainstreaming carbon management in healthcare systems: A bottom-up modeling approach, Environmental Science & Technology, 47, 2, 678-686.
Smith, A., Tennison, I., Roberts, I., Cairns, J. & Free, C. (2013). The carbon footprint of behavioural support services for smoking cessation, Tobacco Control, http://tobaccocontrol.bmj.com/content/early/2013/03/11/tobaccocontrol-2012-050672.abstract/ [accessed 15 July 2013].
Starr, M. (2012) Nottingham case study: the carbon impact of mental health services, http://sustainablehealthcare.org.uk/knowledge/ [accessed 15 July 2013].
Sustainable Development Unit (2009) Saving carbon, improving health. SDU, Cambridge, http://www.sdu.nhs.uk/documents/publications/1237308334_qylG_saving_carbon,_improving_health_nhs_carbon_reducti.pdf [accessed 16 July 2013].
Sustainable Development Unit (2010) Saving money by saving carbon, SDU, Cambridge, http://www.sdu.nhs.uk/documents/publications/Savemoney1.1.pdf [accessed 16 July 2013].
Sustainable Development Unit (2012a) NHS England carbon footprint update, SDU, Cambridge, http://www.sdu.nhs.uk/documents/resources/Carbon_Footprint_Published_2012.pdf [accessed 16 July 2013].

Unit Costs of Health and Social Care 2013 15 Sustainable Development Unit (2012b) Goods and services carbon hotspots – Full report, SDU, Cambridge,
http://www.sdu.nhs.uk/documents/resources/Hotspot_full.pdf [accessed 16 July 2013]. Tennison, I. (2010) Indicative carbon emissions per unit healthcare activity. Eastern Region Public Health Observatory, 2010,
http://www.erpho.org.uk/viewResource.aspx?id=20967/ [accessed 16 July 2013]. Walker, S., Griffin, S., Claxton, K., Palmer, S. & Sculpher, M. (2012) Appropriate perspectives for health care decisions, in L.
Curtis (ed.) Unit Costs of Health and Social Care 2012, PSSRU, University of Kent, http://www.pssru.ac.uk/project-pages/unit-costs/2012/ [accessed 16 July 2013].

16 Unit Costs of Health and Social Care 2013
Cognitive behaviour therapy: a comparison of costs
Barbara Barrett and Hristina Petkova
What is CBT? Cognitive behavioural therapy (CBT) was developed in the 1960s by Aaron T Beck as a short-term, targeted and structured treatment for depression (Beck, 1964). CBT is now very widely used in the UK as an effective treatment option for many mental health problems beyond depression, including obsessive compulsive disorder (OCD), post-traumatic stress disorder (PTSD), anxiety and others. The therapy aims to reduce distress or unwanted behaviour by undoing previous learning or by providing new learning experiences through brief, highly-structured, problem-orientated and prescriptive tasks, with individuals as active collaborators. The method of delivering CBT varies depending on the individual’s needs. For example, it may be delivered by trained therapists, such as clinical psychologists, mental health nurse specialists and psychiatrists, or via an interactive computer interface – computerised CBT (CCBT). The optimal length of therapy varies among individuals and conditions from ‘low’ to ‘high’ intensity (NICE, 2008). The Department of Health reports that CBT’s evidence base, short-term nature and economical use of resources make it attractive to patients/clients, practitioners and service purchasers, and more money is allocated to it than to all other psychological therapies (Department of Health, 2012).
Economic evaluations of CBT Economic evaluations of CBT interventions are in demand, for two reasons. Since its introduction 50 years ago, CBT has been adapted for the treatment of a wide range of disorders and problems (Beck, 2011). As well as depression and anxiety, CBT is now used in the treatment of low back pain (Lamb et al., 2010), irritable bowel syndrome (Kennedy et al., 2005), chronic fatigue syndrome (White et al., 2005), psychosis (Kuipers et al., 1998), diabetes (Ismail et al., 2010) and eating disorders (Schmidt et al., 2007), among others. As CBT for different disorders is adopted into health systems, treatments are evaluated for their effectiveness and their cost-effectiveness. Alongside an expansion of use in disorders, CBT has received substantial financial investment in the UK through the Increasing Access to Psychological Therapies (IAPT) programme, delivering CBT in primary care to people with depression and anxiety (Department of Health, 2012). The political support for the IAPT programme was based on a claim that CBT can ‘pay for itself’ as those treated successfully reduce their use of health services and return to work (Layard, 2006); therefore economic evaluation is central to the appraisal of the programme. Economic evaluations require unit costs, and readers of this volume will appreciate the importance of the accuracy of these costs. Whilst an estimate of the cost of a CBT session for children and adolescents has been included in recent Unit Costs of Health and Social Care volumes, this is not necessarily applicable to novel applications of CBT or to the IAPT programme. In this paper, we compare and contrast the reported costs of CBT in the UK in order to report the range of costs, to identify good practice, to consider what factors influence costs and to identify any barriers to accurate costing.
The range of costs reported Following a brief literature search we identified 21 papers that reported the results of cost-effectiveness analyses of CBT for depression in the UK, which are listed in full in table 1. In four papers the unit cost of the CBT was not reported, but for all others the cost was converted to an hourly cost and up-rated to 2011/12 prices using the Hospital and Community Health Services Index (Curtis, 2012). The cost per hour for individual therapy ranged from £31 to £133 (2012 prices).
Cost components of CBT Typically, CBT interventions are costed on the basis of the salary of the professional involved, including relevant oncosts (employer’s national insurance and superannuation contributions) and overheads (administrative, managerial and capital; Curtis, 2012). Byford (2007) included indirect time using information provided by the trial therapists on the ratio of direct face-to-face contact to all other activities. Supervisor costs, however, were excluded due to difficulties in accurately separating supervision for the two trial groups but were explored in sensitivity analysis. The study also excluded the cost of the initial clinical assessment and that of a brief pre-randomisation intervention. Other studies either did not account for non-direct time, or used existing estimates from previous research reported in table 2.6 in this volume.
Unit Costs of Health and Social Care 2013 17 Using a different approach, van der Gaag et al. (2011) included both the training and supervision of psychologists and nurses in the cost of CBT for persistent and recurrent psychosis in people with schizophrenia-spectrum disorder. In addition to therapist wages and the cost of the therapy office, the study incorporated time costs (related to the CBT intervention) based on the number of attended training and therapy sessions, combined with information on the net income of participants (using shadow prices for participants who did not have paid work). Informal care (valued as the time invested by relatives or acquaintances in helping or assisting the participant during treatment); out-of-pocket costs; productivity losses; and costs related to changes in the amount of participants’ voluntary (unpaid) work were also taken into account (van der Gaag et al., 2011).
Identifying factors that influence variation in cost The unit costs in most of the papers were based on tables from this volume, which were either taken directly or with some modification in the assumptions. These costs use a bottom-up estimation approach where the different elements of a health service contact are described, a cost for each element identified and then the total cost aggregated. The variation in the unit costs presented is mainly due to the profession and qualification of the treating clinician. Where the therapy is delivered by a doctor or clinical psychologist, costs tend to be higher (McCrone et al., 2012; Seivewright et al., 2008) while where the therapy was delivered by a therapist or nurse, costs were generally lower (Lamb et al., 2010; McCrone et al., 2008). One exception to the bottom-up approach to costing was the cost of the CBT delivered as part of the IAPT programme (Hammond et al., 2012). In this evaluation, the authors estimated costs using a top-down approach, taking the total budget and dividing it by the number of hours of therapy delivered. Using this method, the cost per hour with a therapist was higher than all the other unit costs reported. This discrepancy in costs is particularly pertinent since in the IAPT programme therapists are not doctors or psychologists, and the practitioners’ salary costs are lower and more closely aligned with nurses’ salaries. A scoping search of the evidence on factors influencing the costs of CBT revealed a shortage of relevant literature. Therapists' time was reported as the most significant cost driver in CBT for panic disorder, and sensitivity analysis indicated that cost-effectiveness improved when the number of therapist hours was reduced (NICE, 2008; Smit et al., 2009). Based on the extensive variation of recommended CBT among conditions (NICE, 2008), we hypothesise that type and severity of disease, level of disability and patient needs may be key factors influencing the cost of therapy, and these need further investigation.
Good practice in costing In common with previous commentaries on costs, we start with a plea for transparency (Graves et al., 2002). Many of the papers we reviewed did not contain adequate information on the method used to estimate unit costs, and therefore it is difficult to make firm judgements on the appropriateness or otherwise of the approach used. In economic evaluations comparing a CBT intervention with a control, the cost of the CBT is likely to be a key cost difference; therefore the costing method should be clearly stated and referenced. We identified an inconsistency between the unit costs of CBT that were estimated using a bottom-up approach, as applied in this volume, and a top-down approach. Further research should focus on identifying possible reasons for this discrepancy and these should feed into better practice in costing.

18 Unit Costs of Health and Social Care 2013 Author Intervention Patient group Therapist Cost per hourBarton et al. (2009) CBT Psychosis Case
managers/therapists £70.91
Byford et al. (2003) CBT Self-harm Therapists Byford et al. (2007) CBT Depression
(adolescents) Psychiatrists £76.25
Chisholm et al. (2001) CBT Chronic fatigue syndrome
Therapists £65.87
Hammond et al. (2012) CBT/IAPT Depression and anxiety
Graduate therapists £141.47
Hollinghurst et al. (2010) CBT (online) Depression Therapists £71.48 Johnson et al. (2007) CBT (group) Low back pain Physiotherapists Kuipers et al. (1998) CBT Psychosis Therapists £105.62 Kuyken et al. (2008) MBCT (group) Depression Therapists £32.50 Lam et al. (2005) Cognitive
therapy Bipolar disorder Clinical psychologists £92.45
Lamb et al.(2010) CBT (group) Low back pain Range of HCPs £3.12 McCrone et al. (2004a) Computerised
CBT Anxiety, depression Computer
programme £21.98
McCrone et al. (2004b) CBT Chronic fatigue syndrome
Therapists £58.16
McCrone et al. (2008) CBT IBS Practice nurses £46.99 McCrone et al. (2012) CBT Chronic fatigue
syndrome Clinical psychologists £117.00
Palmer et al. (2006) CBT Borderline personality disorder
Therapists £111.84
Patel et al. (2011) CBT Type I diabetes Trained nurses £115.28 Romeo et al. (2011) CBT Prevention of
depression in older people
Therapists
Schmidt et al. (2007) CBT guided self-care
Bulimia nervosa Therapists
Seivewright et al. (2008) CBT Health anxiety Clinician £121.76 Startup et al. (2005) CBT Schizophrenia Clinical psychologists £86.66

Unit Costs of Health and Social Care 2013 19 References Barton, G., Hodgekins, J., Mugford, M., Jones, P., Croudace, T. & Fowler, D. (2009) Cognitive behaviour therapy for
improving social recovery in psychosis: cost-effectiveness analysis, Schizophrenia Research, 112, 1-3, 158-163. Beck, A. (1964) Thinking and depression: theory and therapy, Archives of General Psychiatry, 10, 6, 561-571. Beck, J. (2011) Cognitive Behavior Therapy, 2nd edition, Guildford Press, New York. Byford, S., Barrett, B., Roberts, C., Wilkinson, P., Dubicka, B., Kelvin, R.G., White, L., Ford, C., Breen, S. & Goodyer, I. (2007)
Cost-effectiveness of selective serotonin reuptake inhibitors and routine specialist care with and without cognitive behavioural therapy in adolescents with major depression, British Journal of Psychiatry, 191, 6, 521-527.
Byford, S., Knapp, M., Greenshields, J., Ukoummune, O., Jones, V., Thompson, S.G., Tyrer, P., Schmidt, U. & Davidson, K. (2003) Cost-effectiveness of brief cognitive behaviour therapy versus treatment as usual in recurrent deliberate self-harm: A decision-making approach, Psychological Medicine, 33, 6.
Chisholm, D., Godfrey, E., Ridsdale, L., Chalder, T., King, M., Seed, P., Wallace, P., Wessely, S. & Fatigue Trialists' Group (2001) Chronic fatigue in general practice: economic evaluation of counselling versus cognitive behaviour therapy, British Journal of General Practice, 51, 462, 15-18.
Curtis, L. (2012) Unit Costs of Health and Social Care 2012, PSSRU, Canterbury. Department of Health (2012) IAPT three-year report: the first million patients, Department of Health, London. Graves, N., Walker, D., Raine, R., Hutchings, A. & Roberts, J.A. (2002) Cost data for individual patients included in clinical
studies: no amount of statistical analysis can compensate for inadequate costing methods, Health Economics, 11, 735-739.
Hammond, G., Croudace, T., Radhakrishnan, M., Lafortune, L., Watson, A., McMillan-Shields, F. & Jones, P. (2012) Comparative effectiveness of cognitive therapies delivered face-to-face or over the telephone: an observational study using propensity methods. PLoS ONE [Electronic Resource], 7, 9, e42916.
Hollinghurst, S., Peters, T., Kaur, S., Wiles, N., Lewis, G. & Kessler, D. (2010) Cost-effectiveness of therapist-delivered online cognitive-behavioural therapy for depression: randomised controlled trial, British Journal of Psychiatry, 197, 4 297-304.
Ismail, K., Thomas, S., Maissi, E., Chalder, T., Schmidt, U., Bartlett, J., Patel, A., Dickens, C., Creed, F. & Treasure, J. (2010) A randomised controlled trial of cognitive behaviour therapy and motivational interviewing for people with Type 1 diabetes mellitus with persisitent sub-optimal glycaemic control, Health Technology Assessment, 14, 22.
Johnson, R., Jones, G., Wiles, N., Chaddock, C., Potter, R., Roberts, C., Symmons, D., Watson, P., Torgerson, D. & Macfarlane, G. (2007) Active exercise, education, and cognitive behavioral therapy for persistent disabling low back pain: a randomized controlled trial, Spine, 32, 15, 1578-1585.
Kennedy, T., Jones, R., Darnley, S., Seed, P., Wessley, S. & Chalder, T. (2005) Cognitive behaviour therapy in addition to antispasmodic threatment for irritable bowel syndrome in primary care: randomised controlled trial, British Medical Journal, 331, 435.
Kuipers, E., Fowler, D., Garety, P., Chisholm, D., Freeman, D., Dunn, G., Bebbington, P. & Hadley, C. (1998) London-East Anglia randomised controlled trial of cognitive-behavioural therapy for psychosis. III: Follow-up and economic evaluation at 18 months, British Journal of Psychiatry, 173, 61-68.
Kuyken, W., Byford, S., Taylor, R., Watkins, E., Holden, E., White, K., Barrett, B., Byng, R., Evans, A., Mullan, E. & Teasdale, J. (2008) Mindfulness-based cognitive therapy to prevent relapse in recurrent depression, Journal of Consulting and Clinical Psychology, 76, 966-978.
Lam, D., McCrone, P., Wright, K. & Kerr, N. (2005) Cost-effectiveness of relapse-prevention cognitive therapy for bipolar disorder: 30-month study, British Journal of Psychiatry, 186, 500-506.
Lamb, S., Hansen, Z., Lall, R., Castelnuovo, E., Withers, E., Nichols, V., Potter, R., Underwood, M. & Back Skills Training Trial investigators (2010) Group cognitive behavioural treatment for low-back pain in primary care: a randomised controlled trial and cost-effectiveness analysis, The Lancet, 375, 9718, 916-923.
Layard, R. (2006) The case for psychological treatment centres, British Medical Journal, 332, 7548, 1030-1032. McCrone, P., Knapp, M., Kennedy, T., Seed, P., Jones, R., Darnley, S. & Chalder, T. (2008) Cost-effectiveness of cognitive
behavioural therapy in addition to mebeverine for irritable bowel syndrome, European Journal of Gastroenterology and Hepatology, 20, 4, 255-263.
McCrone, P., Knapp, M., Proudfoot, J., Ryden, C., Cavanagh, K., Shapiro, D., Ilson, S., Gray, J., Goldberg, D., Mann, A., Marks, I., Everitt, B. & Tylee, A. (2004a) Cost-effectiveness of computerised cognitive-behavioural therapy for anxiety and depression in primary care: randomised controlled trial, British Journal of Psychiatry, 185, 55-62.
McCrone, P., Ridsdale, L., Darbishire, L. & Seed, P. (2004b) Cost-effectiveness of cognitive behavioural therapy, graded exercise and usual care for patients with chronic fatigue in primary care, Psychological Medicine, 34, 991-999.

20 Unit Costs of Health and Social Care 2013 McCrone, P., Sharpe, M., Chalder, T., Knapp, M., Johnson, A., Goldsmith, K. & White, P. (2012) Adaptive pacing, cognitive
behaviour therapy, graded exercise, and specialist medical care for chronic fatigue syndrome: a cost-effectiveness analysis, PLoS ONE [Electronic Resource], 7, 8, e40808.
National Institute for Health and Clinical Excellence (NICE) (2008) Cognitive behavioural therapy for the management of common mental health problems: commissioning guide, NICE, London.
Palmer, S., Davidson, K., Tyrer, P., Gumley, A., Tata, P., Norrie, J., Murray, H. & Seivewright, H. (2006) The cost-effectiveness of cognitive behavior therapy for borderline personality disorder: results from the BOSCOT trial, Journal of Personality Disorders, 20, 5, 466-481.
Patel, A., Maissi, E., Chang, H., Rodrigues, I., Smith, M., Thomas, S., Chalder, T., Schmidt, U., Treasure, J. & Ismail, K. (2011) Motivational enhancement therapy with and without cognitive behaviour therapy for Type 1 diabetes: economic evaluation from a randomized controlled trial, Diabetic Medicine, 28, 4, 470-479.
Romeo, R., Knapp, M., Banerjee, S., Morris, J., Baldwin, R., Tarrier, N., Pendleton, N., Horan, M. & Burns, A. (2011) Treatment and prevention of depression after surgery for hip fracture in older people: cost-effectiveness analysis, Journal of Affective Disorders, 128, 3, 211-219.
Schmidt, U., Lee, S., Beecham, J., Perkins, S., Treasure, J., Yi, I., Winn, S., Robinson, P., Murphy, R., Keville, S., Johnson-Sabine, E., Jenkins, M., Frost, S., Dodge, L., Berelowitz, M. & Eisler, I. (2007) A randomized controlled trial of family therapy and cognitive behavior therapy guided self-care for adolescents with bulimia nervosa and related disorders, American Journal of Psychiatry, 164, 4, 591-598.
Seivewright, H., Green, J., Salkovskis, P., Barrett, B., Nur, U. & Tyrer, P. (2008) Cognitive-behavioural therapy for health anxiety in a genitourinary medicine clinic: randomised controlled trial, British Journal of Psychiatry, 193, 332-337.
Smit, F., Willemse, P., Meulenbeek, M., Koopmanschap, A., van Balkom, P., Spinhoven, P. & Cuijpers (2009) Preventing panic disorder: cost-effectiveness analysis alongside a pragmatic randomised trial, Cost Effectiveness Resource Allocation, 7, 8.
Startup, M., Jackson, M., Evans, K. & Bendix, S. (2005) North Wales randomized controlled trial of cognitive behaviour therapy for acute schizophrenia spectrum disorders: two-year follow-up and economic evaluation, Psychological Medicine, 35, 9, 1307-1316.
van der Gaag, M., Stant, A., Wolters, K., Buskens, E. & Wiersma, D. (2011) Cognitive-behavioural therapy for persistent and recurrent psychosis in people with schizophrenia-spectrum disorder: cost-effectiveness analysis, British Journal of Psychiatry, 198, 1, 59-65, sup 51.
White, P., Goldsmith, K., Johnson, A., Potts, L., Walwyn, R., DeCesare, J., Baber, H., Burgess, M., Clark, L., Cox, D., Bavinton, J., Angus, B., Murphy, G., Murphy, M., O'Dowd, H., Wilks, D., McCrone, P., Chalder, T. & Sharpe, M. (2005) Comparison of adaptive pacing therapy, cognitive behaviour therapy, graded exercise therapy, and specialist medical care for chronic fatigue syndrome (PACE): a randomised trial, The Lancet, 377, 9768, 823-836.

Unit Costs of Health and Social Care 2013 21
Residential child care: costs and other information requirements
Jonathan Stanley1 and Andrew Rome2
Introduction The residential child care sector looks after some of the most vulnerable children who have complex and challenging needs. The children often have serious psychological needs that stem from abuse, trauma and neglect, which make them a qualitatively different cohort than those placed in other segments of the care system, such as fostering or residential special needs schools. Children often arrive at children’s homes quite late: on average at 14.6 years of age. Twenty nine per cent have had six or more placements, and some have tens of previous community and family-based placements (Department for Education, 2013). Outcomes from residential child care are often seen as poor, but this may be a correlation – to do with the high level of needs the children have developed over a relatively long period of time prior to entry to residential child care – rather than a cause. Notably, although it is the negative outcomes of regulatory inspections that receive the largest headlines, these are reported for only 4 per cent of all inspections. Twenty-four per cent are adequate and 72 per cent of all homes are good or better, with 16 per cent rated as outstanding (Ofsted, 2013). These ratings are important, as increasingly local authorities will only place in such homes. If the ‘most appropriate placement’ principle of the Children Act is to be upheld, placement in a residential child care setting should be approached with a robust social work assessment that identifies the necessity of the placement, alongside the needs that must be met. In turn, these needs should be closely matched with a particular placement or setting. While the child’s needs should form the greater part of placement choice, the issue of cost cannot be completely ignored, not least because local authorities must operate within a limited budget. But the ‘market’ for residential child care is highly complex, dealing with a wide spectrum of needs across many providers. It is a sector now dominated by non-public providers: 1,347 of non-public homes (78% of all homes) provide 5,414 places, whereas 371 local authority homes (22% of all homes) provide 2,135 places (Department for Education, 2012). Some of these organisations are small, perhaps just providing a single setting; others are larger organisations managing several different settings. Some provider organisations specialise in a particular type of setting or for a group of children with particular needs; others are more generic. In this short article, the aim is to shed more light on the costs of residential child care – more detail than can be found in publicly available information – but also highlight that there are other information short-falls that perhaps lead to commissioning decisions being dominated more by cost than appropriateness or quality.
1 For further information, contact Jonathan Stanley at National Centre for Excellence in Residential Child Care: [email protected] 2 Revolution Consulting. www.Revolution-Consulting.org

22 Unit Costs of Health and Social Care 2013 The survey Box 1 shows the Freedom of Information (FOI) request sent to all local authorities on 24 May 2013. By September 2013, 110 local authorities had provided the information requested in the FOI. Box 1 Freedom of information request 1. For each placement made to a private or voluntary provider's children's home in the year beginning 1st April 2012, the actual price per week paid for the placement to the provider by your authority. Please note 1a. If the price per week changed during the year please provide the weekly price that applied to most weeks of the year for the placement, or the average weekly price if amounts charged varied across the period. 1b. It is the weekly price and not the total cost that is requested. 1c. The name of the child and the name of the provider are NOT required. 1d. If the provider has charged any element of VAT please exclude the VAT from the weekly price provided. 1e. Please do not include short breaks For ease of analysis it would be helpful if it were supplied in Excel spreadsheet format but this is not essential 2. If your authority operates its own children's homes please provide the actual weekly cost of a place in your own home for the same year (2012/13). All the responding authorities had used private and voluntary sector (P&V) placements, and they provided data on 4,752 weekly prices that were paid for these placements. There was a wide range: from £119 to £9,310 per week. Of the 110 responding local authorities, 73 reported the weekly cost for homes they operated ‘in-house’. These authorities provided 117 data points, with narrower range of costs than that found for the P&V sector prices: between £798 and £5,176 per week. Mean costs from this FOI Survey are lower than those estimated for this year’s Unit Costs of Health and Social Care volume which are calculated from the aggregate DfE Section 251 returns. For the FOI Survey, the average price paid for independent sector children’s homes was £2,841 compared to £3,282 from the aggregate data shown in table 6.3 of this volume. For homes run by the local authority, this FOI survey found a mean reported cost of £2,490 whereas, after adjusting for outliers, this year’s Unit Costs volume reports an average price of £2,964 (table 6.2). The level of detail about the prices/costs of residential child care available from the Freedom of Information request is rarely seen outside each local authority. Figures 1 and 2 show each reported weekly price or cost plotted on a graph. Within the range identified above, 27 per cent of weekly prices paid for independent (P&V) sector placements fall between £2,500 and £3,000. For local authorities, nearly half (45%) of the reported weekly costs are between £2,000 and £3,500. If we widen the view, the graphs show that 77 per cent of the weekly prices paid for P&V placements lie between £1,750 and £3,500 per week; and 85 per cent of local authority costs are within the same range.

Unit Costs of Health and Social Care 2013 23 Figure 1 Figure 2
A direct comparison of the sectors is not really the point of the article, not least because data from only two-thirds of local authorities have been captured so the prices and costs for the remaining third are unknown. Neither do we know whether the reported prices and costs all include the same items of expenditure. However, what is important is that the overlap between the sectors is quite large – and perhaps larger than previously realised – for the price/cost range for more than three-quarters of the placement weeks in 2012-2013. These findings challenge a commonly held view of ‘in-house first’ use of homes for cost reasons. Although this is a far more detailed picture than previously available, are these data sufficient? As the conceptual framework in Figure 3, shows there are many overlapping sub-segments within the residential child care market and a wide spectrum of prices for children’s home placements is to be anticipated. It is not unreasonable, for example, to suggest that specialist services – where higher levels of staff cover and skills may be needed to meet the children’s even higher level of difficulties and needs – are likely to be made available at a higher price than those services that deal with the larger cohorts of children in more mainstream children’s homes. When thinking about individual placements, each young person will represent a different point within this framework, as identified during the social work assessment. However, we know little about where any given residential child care setting lies in this framework, or about the relationship between the prices/costs of settings and the different levels of child difficulties, or the frequency with which particular conditions occur. The framework suggests that the information available about the market needs to be developed at a detailed sub-segment level. What settings cater for what difficulties and which conditions? How do they respond to their (potential) residents’ needs? This leads to a further suggestion. With limited resources at play, it would perhaps be most efficient to start by creating an agreed description that is consistently applied for specific specialist sub-segments. From this we would gain insights as to the practicality of collecting, presenting and understanding the data, including the prices/costs, for the other parts of the residential child care service as well as other parts of the care system.
0100200300400500600700800
0-25
050
0-75
010
00-1
250
1500
-175
020
00-2
250
2500
-275
030
00-3
250
3500
-375
040
00-4
250
4500
-475
050
00-5
250
5500
-575
060
00-6
250
Independent children's homes price per week
0
5
10
15
20
25
30
0-25
0
500-
750
1000
-125
0
1500
-175
0
2000
-225
0
2500
-275
0
3000
-325
0
3500
-375
0
4000
-425
0
4500
-475
0
5000
-525
0
5500
-575
0
6000
-625
0
Local authority children's homes cost per week

24 Unit Costs of Health and Social Care 2013 Figure 3
Hypothesis - Provision
DIF
FIC
ULT
Y
FREQUENCY
HIGH
MED
MEDIUM
LOW
LOW
HIGH
Autistic Spectrum Disorders, Aspergers, ASPD, Tourettes, ABI, Physical Disability
Anti Social Behaviour, Violence, Aggression, SEBD, Absconding, Self Harm, Substance Use, Sexually Inappropriate Behaviour
Kinship
Adoption
Secure PsychiatricSecure Units
Youth Offending
Medical & Nursing Care
Mainstream Children’s Homes Specialised
Children’s Homes
Given the complexity of both the supply and demand parts of the market, and with a view to strategic development of the residential child care service as a whole, more detailed information about settings that is consistently recorded is key. Tenders can be applied to segments where aggregate demand is relatively substantial, but such processes should be only part of a wider commissioning approach that ensures visibility of all the other specialist segments. These other specialist segments can be viewed strategically as common pool resources: scarce but benefiting from co-production rather than regulation or market pressures. The role of commissioning then becomes one of properly mapping the sub-segments of demand and supply, identifying where there are supply shortages, developing outcomes measures, monitoring performance and ensuring information flow around all parts of the market.
Conclusion From the three Es of the 1980s – economy, efficiency and effectiveness – through the ‘challenge, comparison, consultation and competition’ of the Best Value initiatives in the early 2000s and the Gershon (2004) review, commissioners have been charged with ensuring that the best value for money is obtained in terms of both quality and price. However, too often tasks and outcomes of commissioning are seen in terms of finance and administration, so the planning of placements can inadvertently become separated from the task of looking after children. Current commissioning guidance documents focus on enhancing the quality of life of service users and their carers by:
having the vision and commitment to improve services connecting with the needs and aspirations of users and carers making the best use of all available resources understanding demand and supply linking financial planning and service planning
Unfortunately, there is still insufficient definition in the data currently collected which leaves providers and commissioners acting from an uninformed position. For the future development of children’s homes – and other services and settings for vulnerable young people – the generation of accurate data should be a priority. As the data from the FoI Survey show,

Unit Costs of Health and Social Care 2013 25 there is massive variation in the prices paid for independent (P&V) sector residential child care and in the costs of settings run by the local authorities, yet we know little about the construction of these costs and prices. We also need a far greater level of sophistication in the information systems so that a collated set of data on what can be bought for these prices/costs is easily available to commissioners. This collated data set should include:
Standardised definitions attached to these prices/costs to describe the size, staffing levels, staff skill-set etc. for the settings
Standardised information attached to these prices/costs about to whom – or what type and level of difficulties and conditions – the placement is best suited
Standardised information attached to these prices/costs about the quality of care provided. Young people using children’s homes require high-quality care and structured targeted work by skilled professionals. Residential care could benefit from longer-term investment and sustained operating excellence. Developing knowledge and innovation should be encouraged; improved information will help develop the strategy that will deliver the right placement at the right time for the right child in the right place (Association of Directors of Children’s Services Ltd, 2012).
References Association of Directors of Children’s Services Ltd (2012) ADCS’s position statement, what is care for?
http://www.adcs.org.uk/download/position-statements/2012/ADCS%20Position%20Statement%20What%20is%20care%20for.pdf [accessed 15 July 2013].
Department for Education (2012) Children’s homes in England data pack, http://media.education.gov.uk/assets/files/pdf/c/childrens%20homes%20data%20pack%20march%202012.pdf [accessed 15 July 2013].
Department for Education (2013) Children’s homes datapack, http://www.education.gov.uk/childrenandyoungpeople/families/childrenincare/childrenshomes/a00192000/childrens-homes-data-pack/ [accessed 15 September 2013].
Gershon, P. (2004) Releasing resources for the frontline: independent review of public sector efficiency, HM Treasury, London.
Ofsted (2013) Official statistics: children's social care inspections and outcomes, http://www.ofsted.gov.uk/resources/official-statistics-childrens-social-care-inspections-and-outcomes/ [accessed 15 July 2013].

26 Unit Costs of Health and Social Care 2013
The costs of telecare and telehealth
Catherine Henderson, Jennifer Beecham and Martin Knapp
Introduction Due to the pace of demographic change, we can expect health and social care expenditure to rise over the coming years (Appleby et al., 2009; Wittenberg et al., 2011). Pressure to contain expenditure, on the one hand, and to improve quality, on the other, has generated the interest of government, health and social care organisations and private industry in a group of ‘advanced assistive technologies’, including telehealth (TH) and telecare (TC). The Department of Health has suggested that telehealth and telecare have the potential to help manage these cost and quality pressures (Department of Health, 2005, 2010); the Whole Systems Demonstrators (WSD) pilots were funded to enhance the evidence base for both technologies. Box 1 describes the accompanying evaluation. Box 1 The Whole Systems Demonstrator (WSD) evaluation was designed to investigate the costs and outcomes associated with two forms of telemonitoring technology – telehealth and telecare – in the context of ‘whole-systems’ care and support (Bower et al., 2011). The WSD telecare and telehealth trials took place within three local authority areas (‘sites’) in England, these areas being covered by four Primary Care Trusts (PCTs). The evaluation employed two pragmatic, cluster-randomised trials: of telehealth in a population with long-term conditions, and of telecare in a population with social care needs. The unit of randomisation was the general practice. Within each practice, eligible patients in one of the study populations (social care needs or long-term conditions) were allocated to the relevant technology (telecare or telehealth, respectively); each practice acted as a control for the other technology and eligible patient population. The WSD evaluation comprised both quantitative and qualitative research. The WSD telehealth and telecare trials drew on routine data to examine the effectiveness of these technologies on use and costs of health and social care. Administrative datasets covered the use of hospital and primary care physician services, as well as social care services such as residential and nursing home care and domiciliary care, and mortality (Steventon et al., 2012, 2013). About half of the trial participants also consented to be part of nested (WSD telecare and telehealth questionnaire) sub-studies, collecting participant-reported data on a range of outcome measures and on the use of health and social care services (Cartwright et al., 2013; Henderson et al., 2013b; Bower et al., 2011). Qualitative analyses conducted as part of the evaluation covered the experiences of service users and carers (Sanders et al., 2012) and of professionals involved in the implementation of the technologies. Another strand of the evaluation drew on longitudinal ethnographic data to examine organisational challenges to mainstreaming telehealth and telecare (Hendy et al., 2012).
Definitions Telecare (TC) was defined within the WSD trial as the ‘remote and automatic (passive) monitoring of changes in an individual’s condition or lifestyle, including emergencies, in order to manage the risks of independent living using equipment such as movement sensors, bed/chair occupancy sensors’ (Bower et al., 2011). This form of remote monitoring could be classified as 'second generation telecare' (Kubitschke & Cullen, 2010), involving the extensive deployment of networked sensors and alarms, going beyond traditional 'first-generation' community or personal alarms (such as pendant or pull-cord alarms for summoning help) in remotely collecting and automatically transmitting data to monitoring centres.
Telehealth (TH) is a broad term that encompasses both ‘telemonitoring’ and ‘telephone support’: the former involves the monitoring of vital signs data by health professionals, either by being stored after submission by the patient to be reviewed later (‘store and forward’) or in ‘real-time’ (e.g. by video conferencing). Telephone support, sometimes known as telephone coaching, involves health care providers delivering support to patients or carers over the telephone system. The WSD trial defined telehealth quite broadly, as the ‘remote exchange of data between a patient and health care professional(s) to assist in the diagnosis and management of a health care condition(s): e.g. blood pressure, blood glucose monitoring and medication reminders’ (Bower et al., 2011).

Unit Costs of Health and Social Care 2013 27 Aims of research Within the Whole Systems Demonstrator pilots, we sought to explore the costs and benefits of introducing telecare and telehealth in England. This short paper reports our approach to calculating the costs.
Methods
Costing method The costing was carried out in four stages (cf. Allen & Beecham, 1993; Beecham, 2000): (i) describing the interventions in terms of their typical resource inputs and associated routine activities; (ii) calculating relevant service units; (iii) collecting cost data; and (iv) calculating a unit cost for the intervention. To develop an understanding of production inputs and processes, we collected information using a ‘bottom-up’ approach, involving 19 interviews (by telephone or face-to-face) with key informants and drew on correspondence with on-site WSD project teams in the three sites. We took a more ‘top-down’ approach to collect cost and activity data on the delivery of the intervention, using a spreadsheet-based pro forma to guide collection from project teams. These data were used to establish a unit cost, the direct cost of the telecare or telehealth package, per person per year. Unit costs were calculated based on the services as configured in 2009/10, when the majority of trial participants were recruited, in order to approximate running costs at the capacity planned by sites, rather than in the start-up phase in 2008/09. All costs are expressed at 2009/10 prices. We aimed to establish the average costs of the interventions across the three sites. Nonetheless, the ways in which telecare or telehealth services were delivered were determined locally and not prescribed by the trial evaluation team. A detailed picture of the services in each site was therefore the first step to understanding the inputs and processes involved in producing the interventions, examining important features of the delivery systems put in place, in terms of equipment supply, systems and infrastructure enabling the appropriate equipment to operate (assessment, installation, servers, maintenance), and monitoring and response services interacting with participants through the technology (Henderson et al., 2013a, 2013b). As a condition of the trials, participants were not to be charged for telehealth or telecare equipment or support services. They were expected to have telephone lines and power supplies for telecare: in the case of telehealth, participants in one site were expected to have a television set. Data transmission by participants was also provided free of charge to them.
Telecare and telehealth equipment Data on participants’ telecare/telehealth equipment was provided for the evaluation by the sites’ project teams, as were the prices that had been paid for the equipment. This enabled us to estimate the equipment costs for each participant. While most of the equipment was purchased for the trial, telehealth base units and most peripherals were rented in one site. In either case, we annuitised purchased base units over five years (Department of Health, 2001), while costs of purchased ‘peripherals’ (alarms, sensors or items attached to the base unit: e.g. blood pressure monitors) were annuitised over the same period or over the peripheral’s lifetime if this information was available from sites or manufacturers' specifications. Rental charge information was provided by one site.
Telecare Telecare users received equipment consisting of a telecare ‘base unit’ (Tunstall Lifeline Connect or Connect+), a pendant alarm and at least one other sensor or device. Up to 27 types of device were available for use by trial participants: for instance, ‘key safes’, bed sensors, temperature extremes sensors, and fall detectors. Among those participating in the WSD questionnaire study, participants received between one and eleven items. Telehealth
Telehealth users received a base unit, that could be either free-standing or a set-top box for a television, and ‘peripherals’ appropriate to their long-term condition. The latter consisted of cabled or bluetoothed pulse oximeters, blood-pressure cuffs, glucometers and weighing scales, which transmitted the observations data to the base unit. A detailed description of clinical processes and behavioural regimens associated with the telehealth intervention, and breakdown by long-term condition of the peripherals provided in the trial, can be found in Cartwright et al. (2013).

28 Unit Costs of Health and Social Care 2013 Costs of supporting the delivery of the interventions
Methods for calculating support costs were similar across both interventions. Support personnel were assumed to comprise individuals working to monitor and respond to alarms/sensor alerts and to triggers flagged by algorithms in the telehealth software programmes; supervisors of these workers; and on-site WSD team managers, trainers and back-office staff. The cost calculations excluded posts/parts of posts that involved trial evaluation or recruitment. Oncosts, administrative, premises and capital overheads of directly-provided workers were calculated based on the WSD teams’ information. Where sites could not provide details for calculation of administrative overheads, these were assumed to be 16 per cent of salary costs (Curtis, 2010). Other relevant costs were: server maintenance, software licences, providing free-phone numbers and data transmission from base units to servers. Installation and maintenance costs were partly variable and partly fixed. One site had maintained a detailed breakdown of spending on these activities in 2009/10: these proportions of expenditure were applied to costs in the other sites where less detailed information was available. Fixed costs were spread over five years, the assumed lifetime of the base units, while the variable costs were taken to be incurred within 2009/10. Costs of installers, their associated overheads and of storage and transport of equipment were all taken into account. For telecare, the split between fixed and variable costs was 65 per cent and 35 per cent respectively, and for telehealth 90 per cent and 10 per cent respectively. Telecare monitoring services and dedicated response services were provided under contract and we assumed such contracts covered the providers’ costs. To obtain a yearly per-participant average cost, we divided costs of contracts in 2009/10 by the number of trial participants. Telehealth monitoring services were calculated either top down or bottom up, depending on the components of the service. All sites had centralised monitoring call-centre teams: the costs of these directly provided or contracted central teams were calculated in terms of annual expenditure on their staff in 2009/10 (included associated overheads). However, two sites provided some monitoring services through local nursing teams (community matrons or specialist nurses): their costs were estimated from the bottom up, counting their time spent in telehealth training and in monitoring the telehealth screen. We calculated the annual total monitoring costs by applying the relevant unit costs (based on WSD project team information on NHS pay bands and local nursing team staffing complements, and including oncosts and capital, indirect and direct overheads) to the total estimated monitoring time. This latter was based in turn on the average daily screen-monitoring time (calculated using data provided by WSD project teams) of two minutes (Henderson et al., 2013b). The costs of central and local monitoring were aggregated and divided by number of study participants monitored over the year, for an average annual per-participant cost of monitoring. We calculated the mean yearly telehealth and telecare support costs per participant (including monitoring, equipment infrastructure, installation and maintenance) and allocated those costs to participants who had received the telehealth/telecare equipment. Because the support costs were estimated mostly top down, these data did not vary between participants in the same site, although equipment cost data did vary between individual cases. We also calculated annual costs for telehealth and telecare which excluded staff posts and contracts specifically related to WSD project management. For telecare, we also calculated annual costs of support that excluded the dedicated WSD telecare response services.
Results The total costs of supporting the delivery of telecare and telehealth varied substantially between sites (table 1). Per-participant equipment costs also showed considerable inter-site variation in the case of telehealth but not telecare.

Unit Costs of Health and Social Care 2013 29 Table 1. Costs per year across three WSD pilot sites
Support costs per participant1
Equipment costs per participant
Direct annual non-equipment cost of
support
Total direct support cost
Less project management-specific posts and contracts
Less response-
related contract
costs Telecare £170,432-£456,019 £437-£1,004 £423-£870 £408-£908 £73-£93
Telehealth £840,464-£1,168,671 £1,134-£1,241 £804-£1,199 - £334-£852
1excluding equipment costs
Table 2 shows the costs per participant for the component parts for the telecare and telehealth packages; all mean costs are higher in telehealth than telecare. Moreover, equipment and support costs absorbed a greater proportion of intervention participants' total health and social care costs in the telehealth group than in the telecare group (29% vs. 9%: Henderson et al., 2013a, 2013b).
Table 2. Mean intervention costs of telecare and telehealth per participant1
Telecare2
mean (SE)
Telehealth3
mean (SE)
(n=548) (n=841)
Equipment and support package costs £792 (13.4) £1844 (10.5)
Equipment costs £81 (1.9) £682 (8.8)
Intervention costs £711 (12.6) £1162 (3.7)
- less project management posts & contracts £608 (11.2) £982 (6.4)
- less dedicated TC responder costs £640 (11.5) NA 1 All WSD questionnaire study participants receiving telecare/telehealth equipment; annual costs of participants for whom data from self-reported cost questionnaire (CSRI) was available at baseline assessment. 2 Mean annual costs for participants allocated to intervention group total sample n=1182 3 Mean annual costs for participants allocated to intervention group total sample n=1569
Conclusion These estimations were driven by the availability of data. Support costs in both trials were estimated as average costs across service users, since more granular data on the intervention-specific service use of each participant were not available (for instance, numbers of sensor alerts (TC) or triggers (TH), types of call-centre responses to specific participants, numbers of dedicated telecare responders’ visits). As data were collected in only three sites in England, the extent to which the unit costs calculated can be generalised beyond the sites should be considered when drawing on these figures. Furthermore, particularly in the case of telehealth, the costs of equipment and support associated with the trial may not well reflect future costs. New models for collecting and transmitting vital signs data using mobile phone technologies are emerging (Cottrell et al., 2012; NHS Stoke-on-Trent, 2011): one recent study reported the cost of a telemonitoring service for uncontrolled hypertension of just £71 over six months, using a combination of mobile phone and blood-pressure monitor to take and transmit readings to patients’ attending clinicians (Stoddart et al., 2013).

30 Unit Costs of Health and Social Care 2013 Relatively few previous studies have provided details on the composition of telecare packages, cost of equipment and monitoring, or range of support services available to respond to sensor activations.1 These data form an important part of the evidence base, and this clear cost estimation method driven by economic theory can help accuracy in future estimations and evaluations.
Acknowledgements We thank the participants in the study, and all the health and social care managers and professionals in the study sites and the participating case study organisations for their help. We also thank the broader WSD evaluation team: Martin Bardsley, James Barlow, Michelle Beynon, John Billings, Peter Bower, Martin Cartwright, Jennifer Dixon, Helen Doll, Ray Fitzpatrick, Jane Hendy, Shashivadan P. Hirani, Lorna Rixon, Anne Rogers, Caroline Sanders, Adam Steventon and Stanton P. Newman (Principal Investigator). This article presents independently conducted research commissioned and funded by the Policy Research Programme of the Department of Health for England. The views expressed are not necessarily those of the Department.
References Allen, C. & Beecham, J. (1993) Costing services: ideals and reality, in A. Netten & J. Beecham (eds) Costing community care:
theory and practice, Ashgate, Avebury. Appleby, J., Crawford, R. & Emmerson, C. (2009) How cold will it be? Prospects for NHS funding: 2011-17, King's Fund and
Institute for Fiscal Studies, London. Bayer, S. & Barlow, J. (2010) Analysis of data on the impact of telecare provided under telecare capital grant, Imperial
College Business School, London. Beecham, J. (2000) Unit Costs – not exactly child's play, Department of Health, Personal Social Services Research Unit and
Dartington Social Care Research Unit, London. Bower, P., Cartwright, M., Hirani, S., Barlow, J., Hendy, J., Knapp, M., Henderson, C., Rogers, A., Sanders, C., Bardsley, M.,
Steventon, A., Fitzpatrick, R., Doll, H. & Newman, S. (2011) A comprehensive evaluation of the impact of telemonitoring in patients with long-term conditions and social care needs: protocol for the Whole System Demonstrator cluster randomised trial, BMC Health Services Research, 11, 184.
Cartwright, M., Hirani, S., Rixon, L., Beynon, M., Doll, H., Bardsley, M., Steventon, A., Knapp, M., Henderson, C., Rogers, A., Bower, P., Sanders, C., Fitzpatrick, R., Barlow, J. & Newman, S. (2013) Effect of telehealth on quality of life and psychological outcomes over 12 months (Whole System Demonstrator telehealth questionnaire study): nested study of patient reported outcomes in a pragmatic, cluster randomised controlled trial, British Medical Journal, 346, f653. http://www.bmj.com/highwire/filestream/633183/field_highwire_adjunct_files/7/ and http://www.bmj.com/highwire/filestream/633183/field_highwire_adjunct_files/0/ [accessed 16 July 2013].
Cottrell, E., Chambers, R. & O'Connell, P. (2012) Using simple telehealth in primary care to reduce blood pressure: a service evaluation, BMJ Open, 2.
Curtis, L. (2010) Unit Costs of Health and Social Care 2010, Personal Social Services Research Unit, Canterbury. Department of Health (2001) Equipment. NHS Trusts – capital accounting manual 2001, Department of Health. Department of Health (2005) Building telecare in England,
http://webarchive.nationalarchives.gov.uk/20130107105354/http://www.dh.gov.uk/en/Publicationsandstatistics/Publications/PublicationsPolicyAndGuidance/DH_4115303/ [accessed 16 July 2013].
Department of Health (2010) A vision for adult social care: capable communities and active citizens, Department of Health. Henderson, C., Knapp, M., Fernández, J.-L., Beecham, J. Hirani, S., Beynon, M., Cartwright, M., Rixon, L., Doll, H. Bowyer, P.,
Steventon, A., Rogers, A., Fitzpatrick, R., Barlow, J., Bardsley, M. & Newman, S. (2013a) Cost-effectiveness of telecare for people with social care needs: the Whole Systems Demonstrator cluster randomised trial, in preparation, 2013.
Henderson, C., Knapp, M., Fernandez, J. L., Beecham, J., Hirani, S. Cartwright, C. Rixon, L. Beyon, M. Rogers, A. Bower, P. Doll, H., Fitzpatrick, R.,Steventon, A. Bardsley, A. Hendy, M. & J. Newman, S. (2013b) Cost effectiveness of telehealth for patients with long term conditions (Whole Systems Demonstrator telehealth questionnaire study): nested economic
1 Woolham’s report (Department of Health, 2005) on telecare for people with dementia gives a detailed account of the type, and amount, of telecare
equipment deployed in that study (an average of 2.15 items), much of which is described as ‘stand alone’. In our study, the average package consisting of 4.7 items of equipment was larger; about a third of telecare equipment items were 'stand alone'. Estimates of the cost of telecare support and equipment package in the UK have been reported as variously £7.00 per week (England) (estimated by the author using an annual equivalent cost for the equipment and annuitising over 5 years) and £9.00 per week (Wales) (Bayer & Barlow, 2010) The cost of a WSD telecare package was estimated at approximately £15 per week.
Unit Costs of Health and Social Care 2013 31 evaluation in a pragmatic, cluster randomised controlled trial, British Medical Journal, 346, f1035, http://www.bmj.com/content/346/bmj.f1035/ [accessed 24 September 2013].
Hendy, J., Chrysanthaki, T., Barlow, J., Knapp, M., Rogers, A., Sanders, C., Bower, P., Bowen, R., Fitzpatrick, R., Bardsley, M., & Newman, S. (2012) An organisational analysis of the implementation of telecare and telehealth: the Whole Systems Demonstrator, BMC Health Services Research, 12, 403.
Kubitschke, L. & Cullen, K. (2010) ICT & Ageing: European study on users, markets and technologies, Final Report, Commission of the European Communities, Brussels.
NHS Stoke-on-Trent (2011) “Florence” the simple telehealth service, NHS Stoke-on-Trent, http://www.networks.nhs.uk/nhs-networks/simple-telehealth/documents/STH%20DS01%20-%20Patient%20v1%20draft%2009.pdf [accessed 19 July 2013].
Sanders, C., Rogers, A., Bowen, R., Bower, P., Hirani, S. Cartwright, M., Fitzpatrick, R., Knapp, M., Barlow, J., Hendy, J., Chrysanthaki, T., Bardsley, M. & Newman, S. (2012) Exploring barriers to participation and adoption of telehealth and telecare within the Whole Systems Demonstrator trial: a qualitative study, BMC Health Services Research, 12, 220.
Steventon, A., Bardsley, M., Billings, J., Dixon, J. Doll, H., Beynon, M., Hirani, S., Cartwright, M., Rixon, L., Knapp, M., Henderson, C., Rogers, A., Hendy, J., Fitzpatrick, R. & Newman, S. (2013) Effect of telecare on use of health and social care services: findings from the Whole Systems Demonstrator cluster randomised trial, Age and Ageing, doi:10.1093/ageing/aft008.
Steventon, A., Bardsley, M., Billings, J., Dixon, J., Doll, H., Beynon, M., Hirani, S., Cartwright, M., Rixon, L., Knapp, M., Henderson, C., Rogers, A., Hendy, J., Fitzpatrick, R. & Newman, S. (2012) Effect of telehealth on use of secondary care and mortality: findings from the Whole Systems Demonstrator cluster randomised trial, British Medical Journal, 344, e3874.
Stoddart, A., Hanley, J., Wild, S., Pagliari, C., Paterson, M., Lewis, S., Sheikh, A., Krishan, A., Padfield, P. & McKinstry, B. (2013) Telemonitoring-based service redesign for the management of uncontrolled hypertension (HITS): cost and cost-effectiveness analysis of a randomised controlled trial, BMJ Open, 3.
Wittenberg, R., Hu, B., Hancock, R., Morciano, M., Comas-Herrera, A., Malley, J. & King, D. (2011) Projections of demand for and costs of social care for older people in England, 2010 to 2030, under current and alternative funding systems, PSSRU, London.

32 Unit Costs of Health and Social Care 2013

Unit Costs of Health and Social Care 2013 33
I. SERVICES


Unit Costs of Health and Social Care 2013 35
1. Services for older people
1.1 Private sector nursing homes for older people 1.2 Private sector residential care for older people 1.3 Local authority residential care for older people 1.4 Local authority day care for older people 1.5 Extra care housing for older people 1.6 Community rehabilitation unit 1.7 Intermediate care based in residential homes 1.8 Dementia memory service


Unit Costs of Health and Social Care 2013 37
1.1 Private sector nursing homes for older people Using PSS EX1 2011/121 returns uprated by the PSS pay & prices inflator, the median cost per person for supporting older people in a nursing care home was £519 per week (unchanged from last year), with an interquartile range of £452 to £584. The mean cost was £514 per week. The standard NHS nursing care contribution is £108.70 and the higher level NHS nursing care contribution is £149.60.2 When we add the standard NHS nursing care contribution to PSS expenditure, the total expected mean cost is £623 and the median cost is £628. Costs and unit estimation
2012/2013 value
Notes
A. Fees £750 per week The direct unit cost of private sector nursing homes is assumed to be the fee. Where a market is fairly competitive, such as that for private sector nursing homes, it is reasonable to assume that the fee will approximate the societal cost of the service.3 A weighted average fee for England reflecting the distribution of single and shared rooms was taken from the Laing & Buisson market survey.4 Care home fees have been split into their component parts by Laing & Buisson (2013).5 For nursing care for frail elderly people, total fees comprise care costs (45%), accommodation costs (20%), ancillary costs (27%) and operator’s profit (8%).
External services B. Community nursing C. GP services D. Other external services
No current studies indicate how external services are used by nursing home residents. See previous editions of this volume for sources of information.
E. Personal living expenses
£23.50 per week
The Department for Work and Pensions (DWP) personal allowance for people in residential care or a nursing home is £23.50.6 This has been used as a proxy for personal consumption.
Short-term care No current information is available on whether residents in short-term care are less costly than those who live full-time in a nursing home. See previous editions of this volume for sources of information.
Dependency No current information is available on the relationship of dependency with cost. See previous editions of this volume for sources of information.
Occupancy 89.8 per cent The occupancy level in England for-profit and not-for-profit homes was 89.8 per cent in 2012.4
London multiplier 1.10 x A Fees in London nursing homes were 10 per cent higher than the national average.4
Unit costs available 2012/2013 £750 establishment cost per permanent resident week (A); £774 establishment cost plus personal living expenses per permanent resident week
1 Health & Social Care Information Centre (2013) PSS EX1 2011/12, Health & Social Care Information Centre, Leeds. 2 Department of Health (2012) Advice note on nursing care bands, Department of Health, London.
http://webarchive.nationalarchives.gov.uk/20130107105354/http://www.dh.gov.uk/prod_consum_dh/groups/dh_digitalassets/@dh/@en/documents/digitalasset/dh_132886.pdf [accessed 25 September 2013].
3 Kavanagh, S., Schneider, J., Knapp, M., Beecham, J. & Netten, A. (1992) Elderly people with cognitive impairment: costing possible changes in the balance of care, PSSRU Discussion Paper 817/2, Personal Social Services Research Unit, University of Kent, Canterbury.
4 Laing & Buisson (2012) Care of elderly people: UK market survey 2012/2013, Laing & Buisson, London. 5 Laing & Buisson (2013) Councils rely on a ‘hidden tax’ on older care home residents, Laing & Buisson, London.
http://www.laingbuisson.co.uk/MediaCentre/PressReleases/CareofElderly201213PressRelease.aspx [accessed 25 September 2013]. 6 Department of Health (2012) Charging for residential care, https://www.gov.uk/government/news/charging-for-residential-care--2/ [accessed 3 October
2013].

38 Unit Costs of Health and Social Care 2013
1.2 Private sector residential care for older people Using PSS EX1 2011/121 returns uprated by the PSS pay & prices inflator, the median cost per person for supporting older people in a residential care home provided by other organisations (voluntary, private and independent) was £472 per week and the mean cost was £475 per week. Costs and unit estimation
2012/2013 value Notes
A. Fees £532 per week The direct unit cost of private care homes is assumed to be the fee. Where a market is fairly competitive, such as that for private sector residential homes, it is reasonable to assume that the fee will approximate the societal cost of the service.2 A weighted average fee for England reflecting the distribution of single and shared rooms was taken from the Laing & Buisson market survey.3 Care home fees have been split into their component parts by Laing & Buisson (2013).4 For residential care for the frail elderly, total fees comprise care costs (33%), accommodation costs (25.5%), ancillary costs (34.5%) and operator’s profit (7%).
External service B. Community nursing C. GP services D. Other external services
No current studies indicate how external services are used by residential care home residents. See previous editions of this volume for sources of information.
E. Personal living expenses
£23.50 per week The Department for Work and Pensions (DWP) personal allowance for people in residential care or a nursing home is £23.50.5 This has been used as a proxy for personal consumption.
Short-term care No current information is available on whether residents in short-term care are less costly than those who live full-time in a residential care home. See previous editions of this volume for sources of information.
Dependency No current information is available on the relationship of dependency with cost. See previous editions of this volume for sources of information.
London multiplier 1.12 x A Fees in London residential homes were 12 per cent higher than the national average.3
Occupancy 90.4 per cent The occupancy level in England for-profit and not-for-profit homes was 90.4per cent in 2012.4
Unit costs available 2012/2013 £532 establishment cost per permanent resident week (A); £556 establishment cost plus personal living expenses per permanent resident week (A and E).
1 Health & Social Care Information Centre (2013) PSS EX1 2011/12, Health & Social Care Information Centre, Leeds. 2 Kavanagh, S., Schneider, J., Knapp, M., Beecham, J. & Netten, A. (1992) Elderly people with cognitive impairment: costing possible changes in the balance
of care, PSSRU Discussion Paper 817/2, Personal Social Services Research Unit, University of Kent, Canterbury. 3 Laing & Buisson (2012) Care of elderly people: UK market survey 2011/2012, Laing & Buisson, London. 4 Laing & Buisson (2013) Councils rely on a ‘hidden tax’ on older care home residents, Laing & Buisson, London.
http://www.laingbuisson.co.uk/MediaCentre/PressReleases/CareofElderly201213PressRelease.aspx [accessed 3 October 2013]. 5 Department of Health (2012) Charging for residential care, https://www.gov.uk/government/news/charging-for-residential-care--2 [accessed 3 October
2013].

Unit Costs of Health and Social Care 2013 39
1.3 Local authority residential care for older people This table uses the Personal Social Services Expenditure return (PSS EX1)1 for local authority expenditure, which have been uprated using the PSS pay & prices inflator. Costs and unit estimation
2012/2013 value
Notes
Capital costs (A, B & C) A. Buildings and oncosts
£70 per week
Based on the new-build and land requirements for local authority residential care establishments. These allow for 57.3 square metres per person.2 Capital costs have been annuitised over 60 years at a discount rate of 3.5 per cent.
B. Land £12 per week
Based on Department for Communities and Local Government statistics.3 The cost of land has been annuitised at 3.5 per cent over 60 years.
C. Other capital costs Capital costs not relating to buildings and oncosts are included in the local authority expenditure costs so no additional cost has been added for items such as equipment and durables.
D. Total local authority expenditure (minus capital)
£920 per week
The median estimate is taken from PSS EX1 2011/12 uprated using the PSS pay & prices Index.1 Capital charges relating to buildings and oncosts have been deducted. The mean cost is £864 per week (interquartile range £770-£1,220).
E. Agency overheads Social services management and support services (SSMSS) costs are included in PSS EX1 total expenditure figures so no additional overheads have been added.
External services F. Community nursing G. GP services H. Other external services
No current studies indicate how external services are used by residential care home residents. See previous editions of this volume for sources of information.
I. Personal living expenses
£23.50 per week
The Department for Work and Pensions (DWP) personal allowance for people in residential care or a nursing home is £23.50.4 This has been used as a proxy for personal consumption.
Use of facility by client 52.18 weeks per year
Occupancy 89 per cent Based on information reported by Laing & Buisson.5 Short-term care No current information is available on whether residents in short-term care are
less costly than those who live full-time in a residential care home. See previous editions of this volume for sources of information.
Dependency No current information is available on the relationship of dependency with cost. See previous editions of this volume for sources of information.
London multiplier 1.89 x (D) Based on PSS EX1 2011/12 data.1
Unit costs available 2012/2013 £1,002 establishment cost per permanent resident week (includes A to E); £1,026 establishment cost plus personal living expenses per permanent resident week (includes A to D and I).
1 Health & Social Care Information Centre (2013) PSS EX1 2011/12, Health & Social Care Information Centre, Leeds. 2 Building Cost Information Service (2013) Surveys of tender prices, Royal Institute of Chartered Surveyors, London. 3 Personal communication with the Department for Communities and Local Government, 2011. 4 Department of Health (2012) Charging for residential care, https://www.gov.uk/government/news/charging-for-residential-care--2 [accessed 3 October
2013]. 5 Laing & Buisson (2010) Councils set to shunt social care costs to the NHS and service users as cuts take effect, Laing & Buisson,
http://www.laingbuisson.co.uk/LinkClick.aspx?fileticket=7NqbssCOgKA%3D&tabid=558&mid=1888 [accessed 9 October 2013].

40 Unit Costs of Health and Social Care 2013
1.4 Local authority day care for older people This table uses the Personal Social Services Expenditure return (PSS EX1)1 for expenditure, which has been uprated using the PSS pay & prices inflator. The median cost was £114 per client week and the mean cost was £105 per client week (including capital costs). These data do not report on the number of sessions clients attended each week. Costs and unit estimation
2012/2013 value Notes
Capital costs (A, B & C) A. Buildings and oncosts
£3.60 per session
Based on the new-build and land requirements for local authority day care facilities (which do not distinguish client group). These allow for 33.4 square metres per person.2 Capital costs have been annuitised over 60 years at a discount rate of 3.5 per cent.
B. Land £0.70 per session Based on Department for Communities and Local Government statistics.3 The cost of land has been annuitised at 3.5 per cent over 60 years.
C. Other capital costs Capital costs not relating to buildings and oncosts are included in the local authority expenditure figures so no additional cost has been added for items such as equipment and durables.
D. Total local authority expenditure (minus capital)
£34 per session The median cost is taken from PSS EX1 2011/12 uprated using the PSS pay & prices index. Assuming older people attend 3 sessions per week, the median and mean cost per session are £34 and £31 respectively. Capital charges relating to buildings have been deducted.
E. Agency overheads Social services management and support services (SSMSS) costs are included in PSS EX1 total expenditure figures so no additional overheads have been added.
Use of facility by client Assumes clients attend 3 sessions of day care per week. Occupancy Based on a study carried out by PSSRU on day care services for older
people with dementia, the occupancy rate was 87 per cent.4 London multiplier 1.43 x A
2.73 x B 1.51 x D
Relative London costs are drawn from the same source as the base data for each cost element.
Unit costs available 2012/2013 £38 per session (includes A to D).
1 Health & Social Care Information Centre (2013) PSS EX1 2011/12, Health & Social Care Information Centre, Leeds. 2 Building Cost Information Service (2013) Surveys of tender prices, Royal Institute of Chartered Surveyors, London. 3 Personal communication with the Department for Communities and Local Government, 2011. 4 Reilly, S., Venables, D., Challis, D., Hughes, J. & Abendstern, M. (2004) Day care services for older people with dementia in the north west of England,
Personal Social Services Research Unit, Manchester University, Manchester, http://www.pssru.ac.uk/pdf/MCpdfs/Daycare1.pdf [accessed 3 October 2013].

Unit Costs of Health and Social Care 2013 41
1.5 Extra care housing for older people This is based on an evaluation of extra care housing which followed the development of 19 new-build extra care housing schemes located across England.1 Extra care housing is primarily for older people, and the accommodation is (almost always) self-contained. Care can be delivered flexibly, usually by a team of staff on the premises for 24 hours a day. Domestic care and communal facilities are available. For more information, see the Bäumker & Netten article in the 2011 edition of this report. All costs have been uprated from 2008 to current prices using the appropriate inflators. The mean cost of living in extra care housing was estimated at £430.20 per resident per week, with a standard deviation of £183 and a range of £178 to £1,261. The median cost was £368 per resident per week. Costs and unit estimation 2012/2013 value NotesA. Capital costs Building and land costs
£100 per resident per week
Based on detailed valuations for the buildings and the land provided by the housing associations operating the extra care schemes. For properties constructed before 2008, capital values were obtained from the BCIS, and down-rated using the All-In Tender Price Index. Includes the cost of land, works including site development and landscaping, equipment and furniture, professional fees (architects, design and surveyors’ fees).1
B. Housing management and support costs Housing management Support costs
£54 per resident per week £10 per resident per week
Information taken from the annual income and expenditure accounts for each individual scheme after at least one full operational year. Average running costs were calculated by dividing the adjusted total running cost by the number of units in the scheme. The cost includes management staff costs (salary and oncosts including national insurance and pension contributions, and office supplies), property maintenance and repairs, grounds maintenance and landscaping, cleaning of communal areas, utilities, and appropriate central establishment costs (excluding capital financing).
C. Personal living expenses
£93 per resident per week
As significant variability existed in the approaches to meal provision in the schemes, items related to catering costs were removed from the financial accounts, and the cost of food and other consumables was estimated using the Family Expenditure Survey (2012), tables 27 and 32.2
D. Health and social service costs Health services Social services
£70 per resident per week £104 per resident week.
Estimates of health and social service costs were made combining resource use information reported by 465 residents, six months after admission, with the appropriate unit costs taken from the respective local authorities or, where appropriate, from national sources.3 Health care estimates ranged from £0-£675. Social care estimates ranged from £0-£644.
Use of facility by client 52.18 weeks per year
Unit costs available 2012/2013 £163 accommodation, housing management and support costs; £256 accommodation, housing management, support and living expenses; £430 total cost.
1 Darton, R., Bäumker, T., Callaghan, L. & Netten, A. (2011) The PSSRU evaluation of the extra care housing initiative: Technical Report, Personal Social
Services Research Unit, University of Kent, Canterbury. 2 Office for National Statistics (2012) Family spending 2012 edition, Office for National Statistics, London, available at
http://www.ons.gov.uk/ons/rel/family-spending/family-spending/family-spending-2012-edition/index.html [accessed 3 October 2013]. 3 Curtis, L. (2008) Unit Costs of Health and Social Care 2008, Personal Social Services Research Unit, University of Kent, Canterbury.
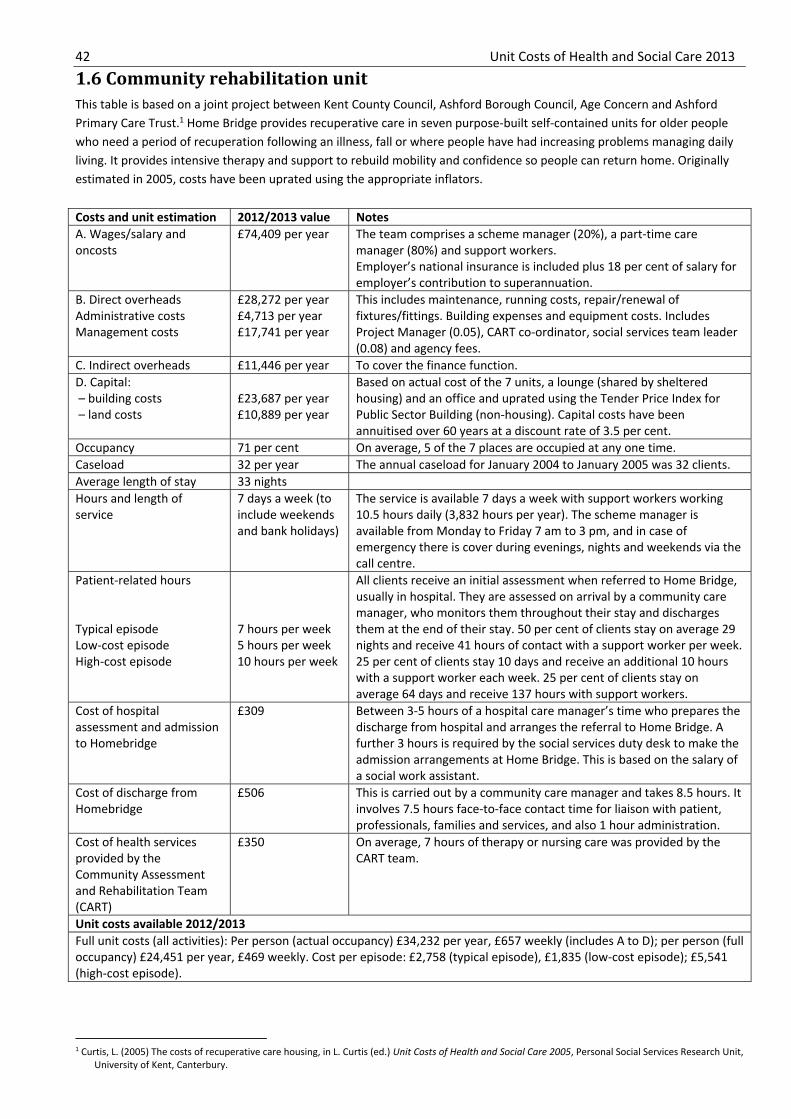
42 Unit Costs of Health and Social Care 2013
1.6 Community rehabilitation unit This table is based on a joint project between Kent County Council, Ashford Borough Council, Age Concern and Ashford Primary Care Trust.1 Home Bridge provides recuperative care in seven purpose-built self-contained units for older people who need a period of recuperation following an illness, fall or where people have had increasing problems managing daily living. It provides intensive therapy and support to rebuild mobility and confidence so people can return home. Originally estimated in 2005, costs have been uprated using the appropriate inflators. Costs and unit estimation 2012/2013 value NotesA. Wages/salary and oncosts
£74,409 per year The team comprises a scheme manager (20%), a part-time care manager (80%) and support workers.
Employer’s national insurance is included plus 18 per cent of salary for employer’s contribution to superannuation.
B. Direct overheads Administrative costs Management costs
£28,272 per year£4,713 per year £17,741 per year
This includes maintenance, running costs, repair/renewal of fixtures/fittings. Building expenses and equipment costs. Includes Project Manager (0.05), CART co-ordinator, social services team leader (0.08) and agency fees.
C. Indirect overheads £11,446 per year To cover the finance function.D. Capital: – building costs – land costs
£23,687 per year £10,889 per year
Based on actual cost of the 7 units, a lounge (shared by shelteredhousing) and an office and uprated using the Tender Price Index for Public Sector Building (non-housing). Capital costs have been annuitised over 60 years at a discount rate of 3.5 per cent.
Occupancy 71 per cent On average, 5 of the 7 places are occupied at any one time.Caseload 32 per year The annual caseload for January 2004 to January 2005 was 32 clients.Average length of stay 33 nights Hours and length of service
7 days a week (to include weekends and bank holidays)
The service is available 7 days a week with support workers working 10.5 hours daily (3,832 hours per year). The scheme manager is available from Monday to Friday 7 am to 3 pm, and in case of emergency there is cover during evenings, nights and weekends via the call centre.
Patient-related hours Typical episode Low-cost episode High-cost episode
7 hours per week 5 hours per week 10 hours per week
All clients receive an initial assessment when referred to Home Bridge, usually in hospital. They are assessed on arrival by a community care manager, who monitors them throughout their stay and discharges them at the end of their stay. 50 per cent of clients stay on average 29 nights and receive 41 hours of contact with a support worker per week. 25 per cent of clients stay 10 days and receive an additional 10 hours with a support worker each week. 25 per cent of clients stay on average 64 days and receive 137 hours with support workers.
Cost of hospital assessment and admission to Homebridge
£309 Between 3-5 hours of a hospital care manager’s time who prepares the discharge from hospital and arranges the referral to Home Bridge. A further 3 hours is required by the social services duty desk to make the admission arrangements at Home Bridge. This is based on the salary of a social work assistant.
Cost of discharge from Homebridge
£506 This is carried out by a community care manager and takes 8.5 hours. It involves 7.5 hours face-to-face contact time for liaison with patient, professionals, families and services, and also 1 hour administration.
Cost of health services provided by the Community Assessment and Rehabilitation Team (CART)
£350 On average, 7 hours of therapy or nursing care was provided by the CART team.
Unit costs available 2012/2013 Full unit costs (all activities): Per person (actual occupancy) £34,232 per year, £657 weekly (includes A to D); per person (full occupancy) £24,451 per year, £469 weekly. Cost per episode: £2,758 (typical episode), £1,835 (low-cost episode); £5,541 (high-cost episode).
1 Curtis, L. (2005) The costs of recuperative care housing, in L. Curtis (ed.) Unit Costs of Health and Social Care 2005, Personal Social Services Research Unit,
University of Kent, Canterbury.

Unit Costs of Health and Social Care 2013 43
1.7 Intermediate care based in residential homes This information is based on PSSRU research carried out with the Social Work and Social Care Section at the Institute of Psychiatry.1 It provides the costs of comparative intermediate care schemes based in residential homes. The average weekly cost per client across the four schemes is £585, and the average annual cost per client is £3,341. All costs have been uprated to present values using the appropriate PSS inflators. The National Evaluation of the Costs and Outcomes of Intermediate Care for Older People2 should also be downloaded for comparative costs.
Social care only Social and health care Scheme A
provides a therapeutic programme of recuperative care with 16 recuperative beds. Care staff include care workers, a senior night carer and rehabilitation workers.
Scheme B is provided by the local authority for people with dementia. A fee is paid by the local authority for care staff.
Scheme C is a short-stay residential home for people having difficulty managing at home, or who have been recently discharged from hospital or are considering entry to a residential care home. A fee is paid by the local authority for care staff.
Scheme D is run by the local authority in conjunction with the primary care trust and provides 6 weeks of support and rehabilitation to older people who have the potential to return to their own home after a stay in hospital. Staff include a care manager, therapists, a visiting medical officer and promoting independence assistants.
Wages/salary £214,335 £146,973 £101,322 £158,664Oncosts Employer’s national insurance plus 14 per cent of salary for employer’s contribution to superannuation
£46,082 £31,599 £21,784 £34,113
Direct overheads Includes salaries of supervisory staff, running costs and supplies
£243,263 £52,249 £48,027 £27,335
Indirect overheads Management fees (inc. premises’ costs) Capital/premises Total costs3
£157,872 £34,836
£699,388 £41,799
£272,620 £171,133 £9,019
£229,130 Caseload Average length of stay No. of beds
196 34 days
16
5154 days
10
6446 days
8
6732 days
8 Weekly costs per resident Average annual cost per client Cost of typical client episode
£835
£3,662
£4,054
£523
£5,509
£4,033
£410
£2,756
£2,667
£571
£3,525
£2,609
1 Baumann, M., Evans, S., Perkins, M., Curtis, L., Netten, A., Fernandez, J.L. & Huxley, P. (2007) Organisation and features of hospital, intermediate care
and social services in English sites with low rates of delayed discharge, Health & Social Care in the Community, 15, 4, 295-305. 2 Barton, P., Bryan, S., Glasby, J., Hewitt, G., Jagger, C., Kaambwa, B., Martin, G., Nancarrow, S., Parker, H., Parker, S., Regen, E. & Wilson, A. (2006) A
national evaluation of the costs and outcomes of intermediate care for older people. Executive Summary, Intermediate Care National Evaluation Team (ICNET), University of Birmingham and University of Leicester. http://www.birmingham.ac.uk/Documents/college-social-sciences/social-policy/HSMC/research/intermediate-care-older-people.pdf [accessed 30 October 2013].
3 Where the fee for providing the scheme was provided, 80 per cent was estimated by the service provider as the amount for care staff salaries. The remainder was allocated to overheads.
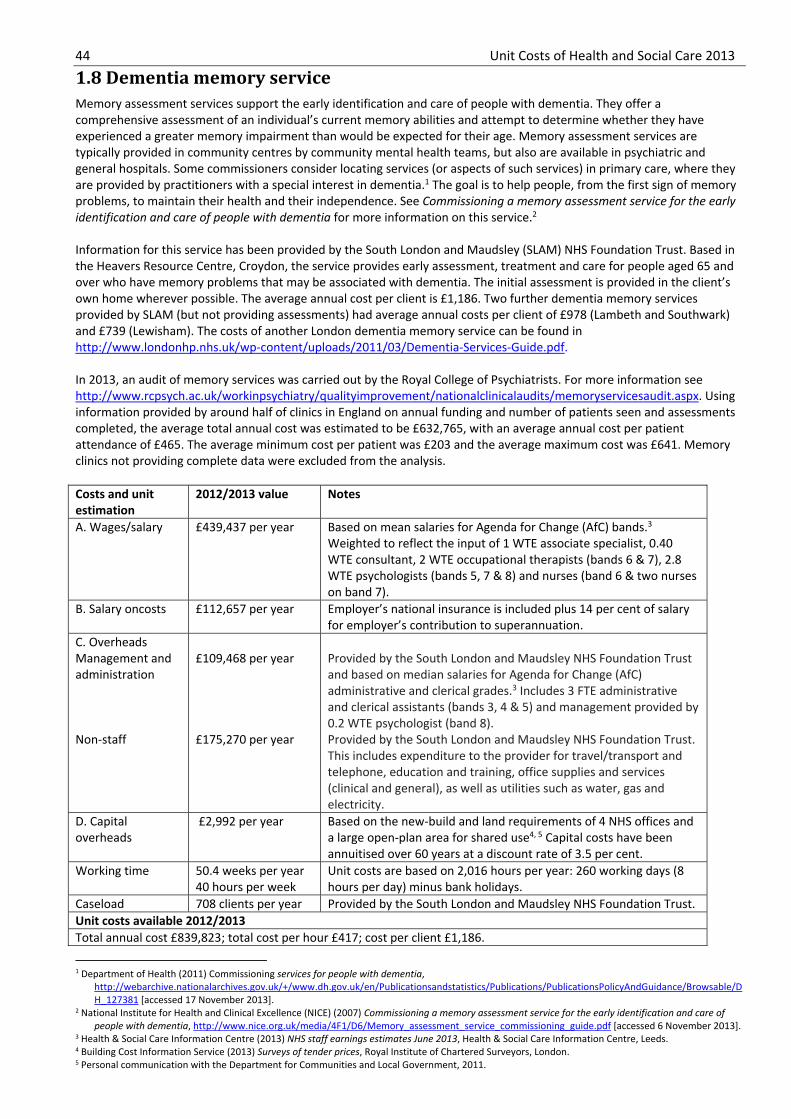
44 Unit Costs of Health and Social Care 2013
1.8 Dementia memory service Memory assessment services support the early identification and care of people with dementia. They offer a comprehensive assessment of an individual’s current memory abilities and attempt to determine whether they have experienced a greater memory impairment than would be expected for their age. Memory assessment services are typically provided in community centres by community mental health teams, but also are available in psychiatric and general hospitals. Some commissioners consider locating services (or aspects of such services) in primary care, where they are provided by practitioners with a special interest in dementia.1 The goal is to help people, from the first sign of memory problems, to maintain their health and their independence. See Commissioning a memory assessment service for the early identification and care of people with dementia for more information on this service.2 Information for this service has been provided by the South London and Maudsley (SLAM) NHS Foundation Trust. Based in the Heavers Resource Centre, Croydon, the service provides early assessment, treatment and care for people aged 65 and over who have memory problems that may be associated with dementia. The initial assessment is provided in the client’s own home wherever possible. The average annual cost per client is £1,186. Two further dementia memory services provided by SLAM (but not providing assessments) had average annual costs per client of £978 (Lambeth and Southwark) and £739 (Lewisham). The costs of another London dementia memory service can be found in http://www.londonhp.nhs.uk/wp-content/uploads/2011/03/Dementia-Services-Guide.pdf. In 2013, an audit of memory services was carried out by the Royal College of Psychiatrists. For more information see http://www.rcpsych.ac.uk/workinpsychiatry/qualityimprovement/nationalclinicalaudits/memoryservicesaudit.aspx. Using information provided by around half of clinics in England on annual funding and number of patients seen and assessments completed, the average total annual cost was estimated to be £632,765, with an average annual cost per patient attendance of £465. The average minimum cost per patient was £203 and the average maximum cost was £641. Memory clinics not providing complete data were excluded from the analysis. Costs and unit estimation
2012/2013 value Notes
A. Wages/salary £439,437 per year Based on mean salaries for Agenda for Change (AfC) bands.3 Weighted to reflect the input of 1 WTE associate specialist, 0.40 WTE consultant, 2 WTE occupational therapists (bands 6 & 7), 2.8 WTE psychologists (bands 5, 7 & 8) and nurses (band 6 & two nurses on band 7).
B. Salary oncosts £112,657 per year Employer’s national insurance is included plus 14 per cent of salary for employer’s contribution to superannuation.
C. Overheads Management and administration Non-staff
£109,468 per year £175,270 per year
Provided by the South London and Maudsley NHS Foundation Trust and based on median salaries for Agenda for Change (AfC) administrative and clerical grades.3 Includes 3 FTE administrative and clerical assistants (bands 3, 4 & 5) and management provided by 0.2 WTE psychologist (band 8). Provided by the South London and Maudsley NHS Foundation Trust. This includes expenditure to the provider for travel/transport and telephone, education and training, office supplies and services (clinical and general), as well as utilities such as water, gas and electricity.
D. Capital overheads
£2,992 per year Based on the new-build and land requirements of 4 NHS offices and a large open-plan area for shared use4, 5 Capital costs have been annuitised over 60 years at a discount rate of 3.5 per cent.
Working time 50.4 weeks per year 40 hours per week
Unit costs are based on 2,016 hours per year: 260 working days (8 hours per day) minus bank holidays.
Caseload 708 clients per year Provided by the South London and Maudsley NHS Foundation Trust.Unit costs available 2012/2013 Total annual cost £839,823; total cost per hour £417; cost per client £1,186.
1 Department of Health (2011) Commissioning services for people with dementia,
http://webarchive.nationalarchives.gov.uk/+/www.dh.gov.uk/en/Publicationsandstatistics/Publications/PublicationsPolicyAndGuidance/Browsable/DH_127381 [accessed 17 November 2013].
2 National Institute for Health and Clinical Excellence (NICE) (2007) Commissioning a memory assessment service for the early identification and care of people with dementia, http://www.nice.org.uk/media/4F1/D6/Memory_assessment_service_commissioning_guide.pdf [accessed 6 November 2013].
3 Health & Social Care Information Centre (2013) NHS staff earnings estimates June 2013, Health & Social Care Information Centre, Leeds. 4 Building Cost Information Service (2013) Surveys of tender prices, Royal Institute of Chartered Surveyors, London. 5 Personal communication with the Department for Communities and Local Government, 2011.

Unit Costs of Health and Social Care 2011 45
2. Services for people with mental health problems
2.1 NHS reference costs for mental health services 2.2 Local authority care homes for people with mental health problems 2.3 Private sector care homes for people with mental health problems 2.4 Local authority social services day care for people with mental health problems 2.5 Private sector day care for people with mental health problems 2.6 Cognitive behaviour therapy (CBT) 2.7 Behavioural activation delivered by the non-specialist 2.8 Counselling services in primary medical care 2.9 Individual placement and support 2.10 Deprivation of liberty safeguards in England: implementation costs 2.11 Mindfulness based cognitive therapy – group-based intervention 2.12 Interventions for mental health promotion and mental illness prevention

46 Unit Costs of Health and Social Care 2012

Unit Costs of Health and Social Care 2013 47
2.1 NHS reference costs for mental health services We have drawn on the NHS Trust and Primary Care Trusts combined to report from the NHS reference costs of selected mental health services.1 All costs have been uprated to 2012/13 prices using the HCHS pay & prices inflators. The costs of selected mental health care services for children can be found in table 6.1. As the first step towards the introduction of a national tariff for mental health services, the Department of Health mandated the use of the mental health care clusters as the currencies for adult mental health services for working-age adults and older people. The care clusters cover most services for working-age adults and older people, and replace previous reference cost currencies for adult and elderly mental health services. They also replace some currencies previously provided for specialist mental health services or mental health specialist teams. The mental health care cluster for working-age adults and older people, focuses on the characteristics and needs of a service user, rather than the individual interventions they receive or their diagnosis. See NHS reference costs guidance for 2011-20121 for more information on care clusters. Each reported unit cost includes: (a) direct costs – which can be easily identified with a particular activity (e.g. consultants and nurses) (b) indirect costs – which cannot be directly attributed to an activity but can usually be shared among a number of activities (e.g. laundry and lighting) (c) overheads – which relate to the overall running of the organisation (e.g. finance and human resources). For information on the method used to allocate drugs to services, see NHS reference costs guidance for 2011-2012.1
Mean £ Lower quartile £ Upper quartile £ MENTAL HEALTH SERVICES Mental health care clusters (initial assessment) Mental health care clusters (non-admitted) Mental health care clusters (admitted) Weighted average of all community contacts Weighted average of mental health specialist teams Mental health secure units Weighted average of mental health inpatients specialist services Weighted average of all adult outpatient attendances (excluding elderly people)
£257 £11
£342
£125 £136
£528
£430
£100
£184 £7
£309
£65 £91
£456
£340
£36
£325 NA
£376
£153 £169
£583
£508
£141
1 Department of Health (2013) NHS reference costs 2011-2012, https://www.gov.uk/government/news/financial-year-2011-to-2012-reference-costs-published [accessed 2 October 2013].
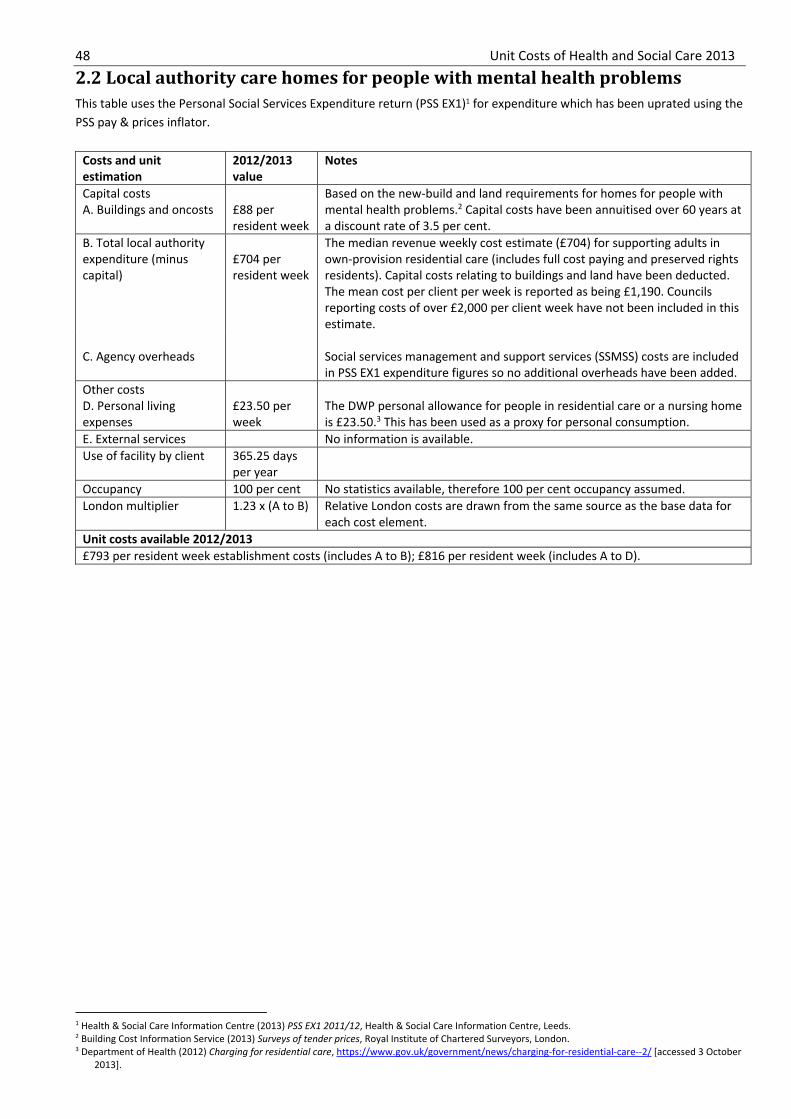
48 Unit Costs of Health and Social Care 2013
2.2 Local authority care homes for people with mental health problems This table uses the Personal Social Services Expenditure return (PSS EX1)1 for expenditure which has been uprated using the PSS pay & prices inflator.
Costs and unit estimation
2012/2013 value
Notes
Capital costs A. Buildings and oncosts £88 per
resident week
Based on the new-build and land requirements for homes for people with mental health problems.2 Capital costs have been annuitised over 60 years at a discount rate of 3.5 per cent.
B. Total local authority expenditure (minus capital)
£704 per resident week
The median revenue weekly cost estimate (£704) for supporting adults in own-provision residential care (includes full cost paying and preserved rights residents). Capital costs relating to buildings and land have been deducted. The mean cost per client per week is reported as being £1,190. Councils reporting costs of over £2,000 per client week have not been included in this estimate.
C. Agency overheads Social services management and support services (SSMSS) costs are included
in PSS EX1 expenditure figures so no additional overheads have been added. Other costs D. Personal living expenses
£23.50 per week
The DWP personal allowance for people in residential care or a nursing home is £23.50.3 This has been used as a proxy for personal consumption.
E. External services No information is available.Use of facility by client 365.25 days
per year
Occupancy 100 per cent No statistics available, therefore 100 per cent occupancy assumed.London multiplier 1.23 x (A to B) Relative London costs are drawn from the same source as the base data for
each cost element. Unit costs available 2012/2013 £793 per resident week establishment costs (includes A to B); £816 per resident week (includes A to D).
1 Health & Social Care Information Centre (2013) PSS EX1 2011/12, Health & Social Care Information Centre, Leeds. 2 Building Cost Information Service (2013) Surveys of tender prices, Royal Institute of Chartered Surveyors, London. 3 Department of Health (2012) Charging for residential care, https://www.gov.uk/government/news/charging-for-residential-care--2/ [accessed 3 October
2013].
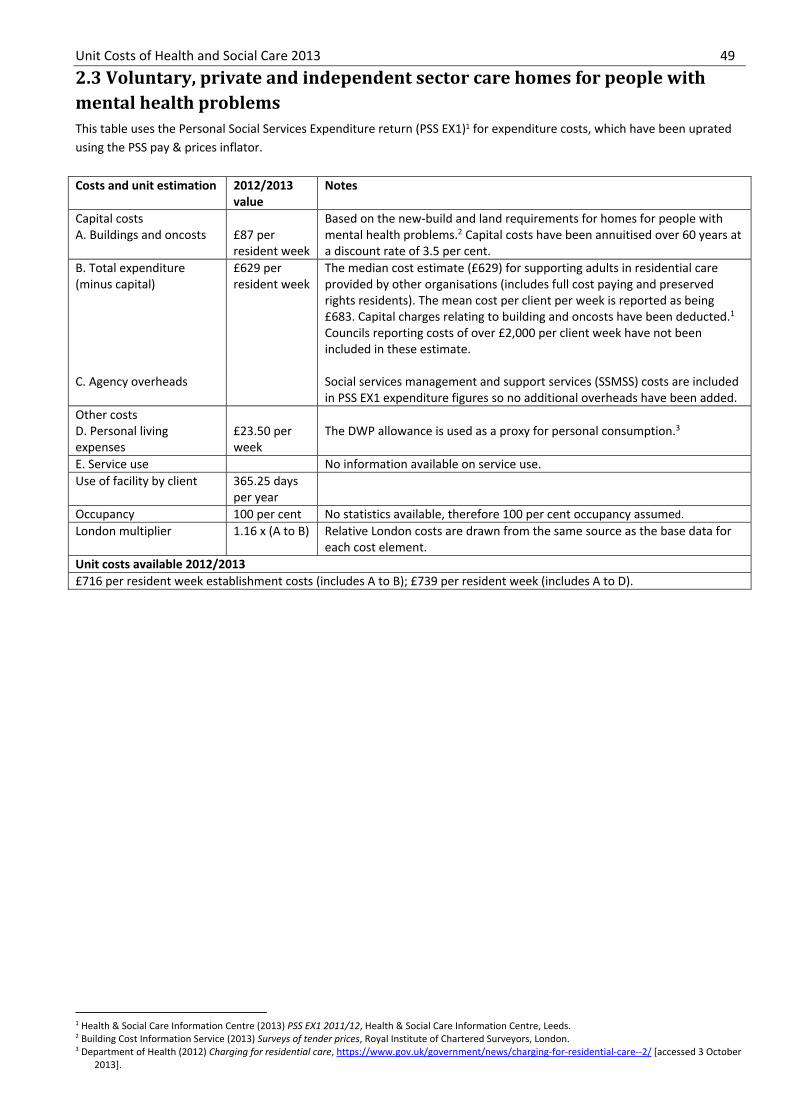
Unit Costs of Health and Social Care 2013 49
2.3 Voluntary, private and independent sector care homes for people with mental health problems This table uses the Personal Social Services Expenditure return (PSS EX1)1 for expenditure costs, which have been uprated using the PSS pay & prices inflator. Costs and unit estimation 2012/2013
value Notes
Capital costs A. Buildings and oncosts £87 per
resident week
Based on the new-build and land requirements for homes for people with mental health problems.2 Capital costs have been annuitised over 60 years at a discount rate of 3.5 per cent.
B. Total expenditure (minus capital)
£629 per resident week
The median cost estimate (£629) for supporting adults in residential careprovided by other organisations (includes full cost paying and preserved rights residents). The mean cost per client per week is reported as being £683. Capital charges relating to building and oncosts have been deducted.1 Councils reporting costs of over £2,000 per client week have not been included in these estimate.
C. Agency overheads Social services management and support services (SSMSS) costs are included
in PSS EX1 expenditure figures so no additional overheads have been added. Other costs D. Personal living expenses
£23.50 per week
The DWP allowance is used as a proxy for personal consumption.3
E. Service use No information available on service use. Use of facility by client 365.25 days
per year
Occupancy 100 per cent No statistics available, therefore 100 per cent occupancy assumed.London multiplier 1.16 x (A to B) Relative London costs are drawn from the same source as the base data for
each cost element. Unit costs available 2012/2013 £716 per resident week establishment costs (includes A to B); £739 per resident week (includes A to D).
1 Health & Social Care Information Centre (2013) PSS EX1 2011/12, Health & Social Care Information Centre, Leeds. 2 Building Cost Information Service (2013) Surveys of tender prices, Royal Institute of Chartered Surveyors, London. 3 Department of Health (2012) Charging for residential care, https://www.gov.uk/government/news/charging-for-residential-care--2/ [accessed 3 October
2013].
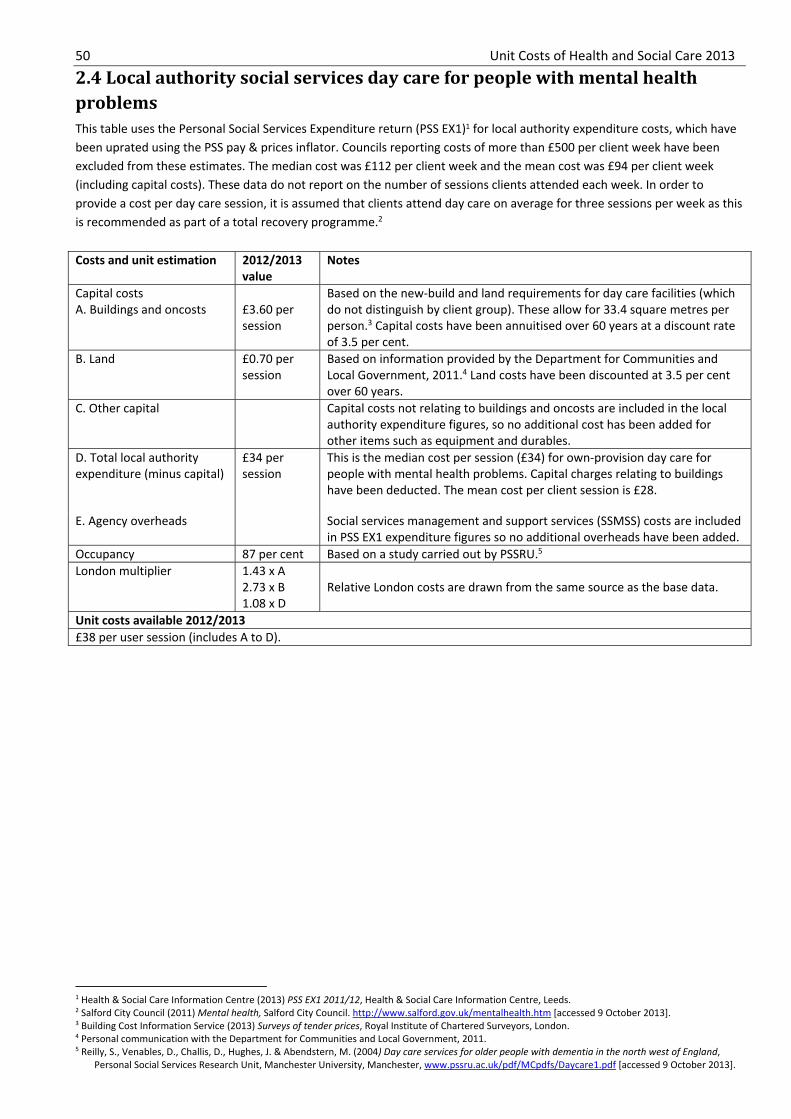
50 Unit Costs of Health and Social Care 2013
2.4 Local authority social services day care for people with mental health problems This table uses the Personal Social Services Expenditure return (PSS EX1)1 for local authority expenditure costs, which have been uprated using the PSS pay & prices inflator. Councils reporting costs of more than £500 per client week have been excluded from these estimates. The median cost was £112 per client week and the mean cost was £94 per client week (including capital costs). These data do not report on the number of sessions clients attended each week. In order to provide a cost per day care session, it is assumed that clients attend day care on average for three sessions per week as this is recommended as part of a total recovery programme.2 Costs and unit estimation 2012/2013
value Notes
Capital costs A. Buildings and oncosts £3.60 per
session
Based on the new-build and land requirements for day care facilities (which do not distinguish by client group). These allow for 33.4 square metres per person.3 Capital costs have been annuitised over 60 years at a discount rate of 3.5 per cent.
B. Land £0.70 per session
Based on information provided by the Department for Communities and Local Government, 2011.4 Land costs have been discounted at 3.5 per cent over 60 years.
C. Other capital Capital costs not relating to buildings and oncosts are included in the local authority expenditure figures, so no additional cost has been added for other items such as equipment and durables.
D. Total local authority expenditure (minus capital)
£34 per session
This is the median cost per session (£34) for own-provision day care for people with mental health problems. Capital charges relating to buildings have been deducted. The mean cost per client session is £28.
E. Agency overheads
Social services management and support services (SSMSS) costs are included in PSS EX1 expenditure figures so no additional overheads have been added.
Occupancy 87 per cent Based on a study carried out by PSSRU.5
London multiplier 1.43 x A 2.73 x B 1.08 x D
Relative London costs are drawn from the same source as the base data.
Unit costs available 2012/2013 £38 per user session (includes A to D).
1 Health & Social Care Information Centre (2013) PSS EX1 2011/12, Health & Social Care Information Centre, Leeds. 2 Salford City Council (2011) Mental health, Salford City Council. http://www.salford.gov.uk/mentalhealth.htm [accessed 9 October 2013]. 3 Building Cost Information Service (2013) Surveys of tender prices, Royal Institute of Chartered Surveyors, London. 4 Personal communication with the Department for Communities and Local Government, 2011. 5 Reilly, S., Venables, D., Challis, D., Hughes, J. & Abendstern, M. (2004) Day care services for older people with dementia in the north west of England,
Personal Social Services Research Unit, Manchester University, Manchester, www.pssru.ac.uk/pdf/MCpdfs/Daycare1.pdf [accessed 9 October 2013].

Unit Costs of Health and Social Care 2013 51
2.5 Private sector day care for people with mental health problems This table uses the Personal Social Services Expenditure return (PSS EX1)1 for expenditure costs, which have been uprated using the PSS pay & prices inflator. The median and mean cost was £92 per client week (including capital costs). In order to provide a cost per day care session, it is assumed that clients attend day care on average for three sessions per week as this is recommended as part of a total recovery programme.2 Costs and unit estimation 2012/2013
value Notes
Capital costs A. Buildings and oncosts £3.60 per
session
Based on the new-build and land requirements for day care facilities, which do not distinguish by client group. These allow for 33.4 square metres per person.3 Capital costs have been annuitised over 60 years at a discount rate of 3.5 per cent.
B. Land £0.70 per session
Based on information provided by the Department for Communities and Local Government, 2011.4 Land costs have been discounted at 3.5 per cent over 60 years.
C. Other capital Capital costs not relating to buildings are included in the local authorityexpenditure figures, so no additional cost has been added for other items such as equipment and durables.
D. Total local authority expenditure (minus capital)
£26 per session
The median and mean cost per day care session provided by other organisations is £26. Capital charges relating to buildings have been deducted.
E. Agency overheads
Social services management and support services (SSMSS) costs are included in PSS EX1 expenditure figures so no additional overheads have been added.
Occupancy 87 per cent Based on study carried out by PSSRU.5
London multiplier 1.43 x A 2.73 x B 0.82 x D
Relative London costs are drawn from the same source as the base data.
Unit costs available 2012/2013 £30 per user session (includes A to E).
1 Health & Social Care Information Centre (2013) PSS EX1 2011/12, Health & Social Care Information Centre, Leeds 2 Salford City Council (2011) Mental health, Salford City Council. www.salford.gov.uk/mentalhealth.htm [accessed 9 October 2013]. 3 Building Cost Information Service (2013) Surveys of tender prices, Royal Institute of Chartered Surveyors, London. 4 Personal communication with the Department for Communities and Local Government, 2011. 5 Reilly, S., Venables, D., Challis, D., Hughes, J., & Abendstern, M. (2004) Day care services for older people with dementia in the north west of England,
Personal Social Services Research Unit, Manchester University, Manchester, http://www.pssru.ac.uk/archive/research.php [accessed 9 October 2013].

52 Unit Costs of Health and Social Care 2013
2.6 Cognitive behaviour therapy (CBT) This table is based on costs estimated for a randomised controlled trial of interventions for adolescents with depression. The setting was two Child and Mental Health Services (CAMHS) teams in secondary care where CBT was delivered.1 Barrett and Petkova summarise CBT costs over 21 studies in a short article at the beginning of this volume.
Costs and unit estimation
2012/2013 value
Notes
A. Wages/salary £42,359 per year
Based on full-time equivalent basic salary of the July 2012-June 2013 NHS staff earnings estimates for a specialty doctor (midpoint), clinical psychologist (band 8) and mental health nurse (band 5).2 An average has been taken of these salaries.
B. Oncosts £5,577 per year
Employer’s national insurance is included plus 14 per cent of salary for employer’s contribution to superannuation.
C. Qualifications No information available.D. Overheads Management, administrative and estates staff Non-staff
£9,256 per year £20,119 per year
Taken from NHS (England) Summarised accounts.3 Management and other non-care staff costs were 19.31 per cent of direct care salary costs and included administration and estates staff. Non-staff costs were 41.97 per cent of direct care salary costs. They include costs to the provider for office, travel/transport and telephone, education and training, supplies and services (clinical and general), as well as utilities such as water, gas and electricity.
E. Ongoing training Information not available for all care staff.F. Capital overheads £3,387 per
year Based on the new-build and land requirements of an NHS office and shared facilities, capital costs have been annuitised over 60 years at a discount rate of 3.5 per cent.4,5 Based on the assumption that there is one office per team.
Working time 43.4 weeks per year, 37.5 hours per week
Unit costs are based on 1,626 hours per year: 225 working days minus sickness absence and training/study days as reported for all NHS staff groups.6
Ratio of direct to indirect time on face-to-face contact
1:1 Fifty per cent of time is spent on face-to-face contact and 50 per cent on other activities.
Length of contact 55 minutes Average duration of CBT session.Unit costs available 2012/2013 £50 per hour; £99 per hour face-to-face contact; £91 cost per CBT session.
1 Goodyer, I., Harrington, R., Breen, S., Dubicka, B., Leech, A., Rothwell, J., White, L., Ford, C., Kelvin, R., Wilkinson, P., Barrett, B., Byford, S. & Roberts, C.
(2007) A randomised controlled trial of SSRIs with and without cognitive behavioural therapy in adolescents with major depression, British Medical Journal, doi:10.1136/bmj.39224.494340.55.
2 Health & Social Care Information Centre (2013) NHS staff earnings estimates 2013 (not publicly available), Health & Social Care Information Centre, Leeds.
3 Audit Commission (2012) NHS summarised accounts 2011-2012, NHS, London. 4 Personal communication with the Department for Communities and Local Government, 2012. 5 Building Cost Information Service (2013) Surveys of tender prices, Royal Institute of Chartered Surveyors, London. 6 Contracted hours are taken from NHS Careers (2012) Pay and benefits, National Health Service, London. http://www.nhscareers.nhs.uk/ [accessed 9
October 2013]. Working days and sickness absence rates as reported in Health & Social Care Information Centre (2013) Sickness absence rates in the NHS: January-March 2012 and Annual Summary 2009-10 to 2011-12, Health & Social Care Information Centre, Leeds.

Unit Costs of Health and Social Care 2013 53
2.7 Behavioural activation delivered by the non-specialist Behavioural activation provides a simple, effective treatment for depression. It is delivered over 12 one-hour sessions by two mental health nurses on post-qualification pay bands with no previous formal therapy training. They received 5 days training in behavioural activation and 1 hour clinical supervision fortnightly from the principal investigator.1 Sessions are usually attended by 10 people. Costs are based on Agenda for Change band 7, the grade normally used for this service. However, if we base the costs on Agenda for Change band 5, the cost per session per person is £10 (£12 with qualifications) and for 12 sessions £122 (£145 with qualifications).1
Costs and unit estimation
2012/2013 value Notes
A. Wages/salary £76,114 per year Based on the median full-time equivalent basic salary for Agenda for Change band 7 (2 qualified mental health nurses) of the April-June 2012 NHS staff earnings estimates.
B. Salary oncosts £19,093 per year Employer’s national insurance is included plus 14 per cent of salary for contribution to superannuation.
C. Qualifications £20,878 per year
Qualification costs have been calculated using the method described in Netten et al. (1998).2 Current cost information has been provided by the Department of Health and Health Education England (HEE).3 See table 7.4 for more details. This is for 2 mental health nurses.
D. Training for behavioural activation
£639 per year Training costs were calculated by facilitators’ hourly rate for the duration of the training (35 hours) divided by the number of participants attending (n=10) (£195 per therapist). Supervision costs were based on 1 hour fortnightly contact for 40 weeks (£2,856 per therapist). 12 session behavioural protocol (£220 per therapist). These costs have been annuitised over the working life of the nurse.
E. Overheads Management, administration and estates staff Non-staff
£18,384 per year £39,958 per year
Taken from NHS (England) Summarised accounts.4 Management and other non-care staff costs were 19.31 per cent of direct care salary costs and included administration and estates staff. Non-staff costs were 41.97 per cent of direct care salary costs. They include costs to the provider for office, travel/transport and telephone, education and training, supplies and services (clinical and general), as well as utilities such as water, gas and electricity.
F. Capital overheads £5,932 per year Based on the new-build and land requirements of NHS facilities (2 offices) but adjusted to reflect shared use of both treatment and non-treatment space.5,6 Capital costs have been annuitised over 60 years at a discount rate of 3.5 per cent.
Working time 42 weeks per year 37.5 hours per week
Unit costs are based on 1,572 hours per year: 225 working days minus sickness absence and training/study days as reported for all NHS staff groups.7
Ratio of direct to indirect time Face-to-face contacts Patient-related work
1:0.89 1:0.33
Based on the National Child and Adolescent Mental Health Service Mapping data and returns from over 500 grade G nurses, 45 per cent of time was spent on direct clinical work, 13 per cent on consultation and liaison, 8 per cent on training and education, 4 per cent on research and evaluation, 23 per cent on admin and management, 7 per cent on other work. Seventeen per cent was spent on tier 1 work and this was assumed to be spread across all types of activity for the purpose of the analysis.
Duration of contact One-hour sessions included direct treatment time of 40-50 minutes and administration.
Unit costs available 2012/2013 (costs including qualifications given in brackets) Cost per hour £102 (£115); Cost per hour face-to-face contact £192 (£218); Cost per hour of patient-related work £135 (£153); Cost per session per person £15 (£17); Cost per 12 sessions per person £178 (£201)
1 Ekers, D., Godfrey, C., Gilbody, S., Parrott, S., Richards, D., Hammond, D. & Hayes, A. (2011) Cost utility of behavioural activation delivered by the non-
specialist, British Journal of Psychology, 199, 510-511, doi:10.1192/bjp.bp.110.090266 2 Netten, A., Knight, J., Dennett, J., Cooley, R. & Slight, A. (1998) Development of a ready reckoner for staff costs in the NHS, Vols 1 & 2, Personal Social
Services Research Unit, University of Kent, Canterbury. 3 Personal communication with the Department of Health and Health Education England (HEE), 2013. 4 Audit Commission (2012) NHS summarised accounts 2011-2012, NHS, London. 5 Building Cost Information Service (2013) Surveys of tender prices, Royal Institute of Chartered Surveyors, London. 6 Personal communication with the Department for Communities and Local Government, 2011. 7 Contracted hours are taken from NHS Careers (2012) Pay and benefits, National Health Service, London, http://www.nhscareers.nhs.uk/ [accessed 9
October 2013]. Working days and sickness absence rates as reported in Health & Social Care Information Centre (2013) Sickness absence rates in the NHS: January 2013 – March 2013, Health & Social Care Information Centre, Leeds.

54 Unit Costs of Health and Social Care 2013
2.8 Counselling services in primary medical care Counselling and psychotherapy are umbrella terms that cover a range of talking therapies. They are delivered by trained practitioners who work with people over a short or long term to help them bring about effective change or enhance their wellbeing.1
Costs and unit estimation
2012/2013 value
Notes
A. Wages/salary £38,146 per year
Based on the mean full-time equivalent basic salary for Agenda for Change band 7 of the July 2012-June 2013 NHS staff earnings estimates.2
B. Salary oncosts £9,571 per year
Employer’s national insurance is included plus 14 per cent of salary for employer’s contribution to superannuation.
C. Overheads Management and administration Office, general business and premises (including advertising and promotion)
£9,214 per year £17,667 per year
No information available on management and administrative overheads for professionals working in primary care. The same level of support has been assumed for counsellors as for other NHS staff (19.31 per cent of direct care salary costs). No information available on overheads for a counsellor working in primary care. All information on office and general business expenses is drawn from the GP earnings and expenses report.3 The same level of overheads (office & general business, premises and other expenses) has been assumed as for a practice nurse (see table 10.6).
D. Capital overheads £3,051 per year
Based on new-build and land requirements for a practice nurse non-treatment space. Capital costs have been annuitised over 60 years at a discount rate of 3.5 per cent.4,5
E. Travel No information available on average mileage covered per visit. From July 2013, NHS reimbursement will be based on a single rate for the first 3500 miles travelled (67p) and a reduced rate thereafter, irrespective of the type of car or fuel used (24p).6
Ratio of direct to indirect time on client contact
1:0.30 A study of nine practices found that the mean number of sessions was 7 (median 6).7 Seventy-seven per cent of the time was spent on face-to-face contact, and 23 per cent of the time on other work.
Consultations 55 minutes Average length of surgery consultation.8
Working time 42.7 weeks per year 37.5 hours per week
Unit costs are based on 1,602 hours per year: 225 working days minus sickness absence and training/study days as reported for all NHS staff groups.9 Each practice in the study employed counsellors for between 6 and 49 hours per week.
Unit costs available 2012/2013 £48 per hour (includes A to D); £63 per hour of client contact (A to D); £58 per consultation.
1 British Association for Counselling and Psychotherapy (2011) BACP definition of counselling, BACP. www.bacp.co.uk/ [accessed 9 October 2013]. 2 Health & Social Care Information Centre (2013) NHS staff earnings estimates 2013 (not publicly available), Health & Social Care Information Centre,
Leeds. 3 Information Centre (2012) GP earnings and expenses 2009/2010, Information Centre, Leeds. http://data.gov.uk/dataset/gp-earnings-and-expenses/
[accessed 3 October 2013]. 4 Building Cost Information Service (2013) Surveys of tender prices, Royal Institute of Chartered Surveyors, London. 5 Personal communication with the Department for Communities and Local Government, 2011. 6 NHS Employers (2013) New mileage arrangements for Agenda for Change staff,
http://www.nhsemployers.org/PayAndContracts/LatestNews/Pages/New-pay-circular-for-Agenda-for-Change-Staff.aspx [accessed 1 October 2013]. 7 Simpson, S., Corney, R., Fitzgerald, P. & Beecham, J. (2000) A randomised controlled trial to evaluate the efficacy and cost-effectiveness of counselling
with patients with chronic depression, Report to the NHS Health Technology Assessment Programme, Vol. 4, No. 36. 8 Crossroads Counselling Practice (2012) see http://www.crossroadscounsellingpractice.com.au/ [accessed 9 October 2013]. 9 Contracted hours are taken from NHS Careers (2012) Pay and benefits, National Health Service, London. http://www.nhscareers.nhs.uk/ [accessed 9
October 2013]. Working days and sickness absence rates as reported in Health & Social Care Information Centre (2013) Sickness absence rates in the NHS: January 2013 – March 2013, Health & Social Care Information Centre, Leeds.

Unit Costs of Health and Social Care 2013 55
2.9 Individual placement and support Provided by Justine Schneider and Sheila Durie Description of IPS People with severe mental health problems face particular barriers to employment, both in relation to their impairments1 and as a result of stigma and prejudice.2 To overcome these, an approach known as Individual Placement and Support (IPS) has been developed3 and has strong evidence to support it.4,5 There are 25 criteria for ‘fidelity’ of IPS to the standards of best practice. The management ratio and the caseload sizes used here are within the bounds of ‘good to exemplary’ scores; most of the other fidelity criteria have little or no direct impact on service costs. Caseload capacity is determined both by size and by turnover. There is evidence from the US that each place on a caseload serves about 1.8 clients over a year, so a caseload of 20 has a throughput of 38 individuals per year on average. Although caseload size is used here to estimate a range of unit costs for IPS, turnover has not been factored in because it is likely to vary according to the skills of the post-holder. Necessary conditions for IPS to operate Successful operation of IPS requires work-oriented mental health services, through cross-sector engagement and partnership working. The specialist skills of IPS staff and managers provide direct interventions with service users and employers to place people in work and support them as required. Responsibility for the maintenance of work-oriented mental health is shared more widely across professionals in the field. Variations in the costs presented The IPS approach requires employment specialists to be integrated into the mental health team. However, there is a wide range of levels at which the specialists are currently appointed. Therefore, in table 2.9.1, we offer costs for four grades of staff, two with professional qualifications (e.g. psychology, occupational therapy) and two with no particular qualifications. These different levels of pay, combined with a range of caseload sizes, yield a range of unit costs, as shown in table 2.9.2. To the salary costs are added the usual overheads, plus a cost for a team leader, who according to IPS wisdom should not supervise more than 10 staff and should be available to provide practical support. A small marketing budget is included here, but annual costs for training were not available. We were advised by experienced IPS services that no other costs are commonly incurred. The unit cost per year shown in table 2.9.2 ranges from £1,864 to £7,214, depending on caseload size and salary level of the worker. This does not take account of turnover in clients, who are unlikely to remain in the service for a full year. Comparative costs of day care Unit costs of IPS may be compared to the costs of private sector day care. In table 2.5 of this volume, the cost of private sector day care was £35 per session outside of London. Table 2.9.3 shows the unit cost per day for the four grades of staff, combined with the same range of caseload sizes as in table 2.9.2. The unit cost per day shown in table 2.9.2 ranges from £44 to £172 depending on caseload size and salary level of the worker. Whereas day care is often allocated in perpetuity, IPS is geared to finding a person paid work, and therefore the amount used by a given individual is likely to decrease over time. Moreover, there is some evidence that those individuals who attain work gain self-esteem6 and reduce their reliance on mental health services, though not necessarily on social security benefits.7
1 McGurk, S. & Mueser, K. (2004) Cognitive functioning, symptoms and work in supported employment; a review and heuristic model, Schizophrenia
Research, 70, 147-174. 2 Thornicroft, G. (2006) Shunned: discrimination against people with mental illness, Oxford University Press, Oxford. 3 Department of Health (2006) Vocational services for people with severe mental health problems: commissioning guidance, CSIP for Department of Work
and Pensions and Department of Health. 4 Bond, G.R., Drake, R.E. & Becker, D.R. (2008) An update on randomized controlled trials of evidence based supported employment, Psychiatric
Rehabilitation Journal, 31, 280-289. 5 Burns, T., Catty, J., Becker, T., Drake, R., Fioritti, A., Knapp, M., Lauber, C., Rossler, W., Tomov, T., van Busschbach, J., White, S. & Wiersma, D. (2007) The
effectiveness of supported employment for people with severe mental illness: a randomised controlled trial, The Lancet, 370, 1146-1152. 6 Sesami Research and Practice Partnership (2007) The SESAMI evaluation of employment support in the UK: background and baseline data, Journal of
Mental Health, 16, 3, 375-388. 7 Schneider, J., Boyce, M., Johnson, R., Secker, J., Grove, B. & Floyd, M. (2009) Impact of supported employment on service costs and income of people,
Journal of Mental Health, 18, 6, 533-542.

56 Unit Costs of Health and Social Care 2013
2.9.1 Cost components Unqualified Unqualified Qualified Qualified Band 3 Band 4 Band 5 Band 6
Salary £18,315 £21,058 £23,441 £30,712Salary oncosts £4,058 £4,821 £5,483 £7,505Overheads – staff £4,320 £4,997 £5,585 £7,380Overheads – other £9,390 £10,861 £12,140 £16,040Capital £2,180 £2,180 £2,180 £2,180Team leader £7,239 £7,239 £7,239 £7,239Marketing budget £1,089 £1,089 £1,089 £1,089Total £46,591 £52,245 £57,157 £72,144
2.9.2 Unit costs per person per year Unqualified Unqualified Qualified QualifiedCaseload size Band 3 Band 4 Band 5 Band 610 people 15 people 20 people 25 people
£4,659
£3,106
£2,330
£1,864
£5,235
£3,483
£2,612
£2,090
£5,716
£3,810
£3,607
£2,286
£7,214
£4,810
£3,607
£2,886
2.9.3 Unit costs per person per day Unqualified Unqualified Qualified QualifiedCaseload size Band 3 Band 4 Band 5 Band 610 people 15 people 20 people 25 people
£111
£74
£55
£44
£124
£83
£62
£50
£136
£91
£68
£54
£172
£115
£86
£69

Unit Costs of Health and Social Care 2013 57
2.10 Deprivation of liberty safeguards in England: implementation costs In 2009, the government provided additional funding of £10 million for local authorities and £2.2 million for the National Health Service (NHS) for the implementation of deprivation of liberty safeguards (DoLS). This amends a breach of the European Convention on Human Rights and provides for the lawful deprivation of liberty of those people who lack the capacity to consent to arrangements made for their care or treatment in either hospitals or care homes, but who need to be deprived of liberty in their own best interests, to protect them from harm. In 2009, a study was carried out to estimate the costs likely to be incurred with the implementation of the DoLS in England, and data on resource utilisation were collected from professionals conducting the six formal assessments required.1 These are: age assessment, mental health assessment, mental capacity assessment, best-interest assessment, eligibility assessment and no refusal assessment, the latter of which establishes whether authorisation of deprivation of liberty would conflict with other authorities (for example, power of attorney) for decision-making for that individual. A total of 40 interviews were planned to include professionals conducting the six DoLS assessments, the secretarial staff in DoLS offices and the independent mental capacity advocates. Each professional provided the average time taken for an individual DoLS assessment or for combined assessments, when more than one of the six DoLS assessments were conducted together. Information on average travelling time and distance was also provided. Total assessment time for each individual (including travelling time) was multiplied by the unit cost for that professional and a travelling allowance. The average cost for a single DoLS assessment across the five DoLS offices was £1,374. The standard deviation around the estimated cost of a single DoLS assessment was £411, and the 95 per cent confidence interval was £529 to £2,140. All costs have been uprated to 2012/2013 prices using the appropriate inflators. Costs for a single deprivation of liberty safeguards (DoLS) assessment
All assessments include travel time
DoLS office 1
DoLS office 2
DoLS office 3
DoLS office 4
DoLS office 5
Average of the five offices
Assessments by mental health assessor
£490 £223 £570 £283 £243 £362
Assessments by best-interest assessor
£688 £413 £289 £1,006 £561 £591
Secretarial costs £321 £180 £127 £578 £303 £302Independent mental capacity advocates assessments
£111 £85 £60 £58 £72 £77
Court protection costs £42 £42 £42 £42 £42 £42Total costs £1,651 £943 £1,089 £1,967 £1,221 £1,374
1 Shah, A., Pennington, M., Heginbotham, C. & Donaldson, C. (2011) Deprivation of liberty safeguards in England: implementation costs, British Journal of
Psychiatry, 199,232-238, doi:10.1192/bjp.bp.110.089474.

58 Unit Costs of Health and Social Care 2013
2.11 Mindfulness-based cognitive therapy – group-based intervention Mindfulness-based cognitive therapy (MBCT) is a manualised, group-based skills training programme designed to enable patients to learn skills that prevent the recurrence of depression. It is derived from mindfulness-based stress reduction, a programme with proven efficacy in ameliorating distress in people suffering chronic disease. To provide the unit costs of this service, we have drawn on information provided by Kuyken et al. (2008)1 which was based on data from three mindfulness-based cognitive therapy therapists who took part in the study. There were 12 individuals in each group. Costs and unit estimation Unit cost
2012/2013 Notes
A. Wages/salary £38,146 per year Based on the mean basic salary for Agenda for Change band 7 of the July 2012-June 2013 NHS staff earnings estimates for qualified Allied Health Professionals.2 See section V for further information onsalaries.
B. Salary oncosts
£9,571 per year
Employer’s national insurance is included plus 14 per cent of salary for employer’s contribution to superannuation.
C. Qualifications No information availableD. Overheads Management, administration and estates staff Non-staff
£9,214 per year £20,027 per year
Taken from NHS (England) Summarised accounts.3 Management and other non-care staff costs were 19.31 per cent of direct care salary costs and included administration and estates staff. Non-staff costs were 41.97 per cent of direct care salary costs. They include costs to the provider for office, travel/transport and telephone, education and training, supplies and services (clinical and general), as well as utilities such as water, gas and electricity.
E. Capital overheads £3,483 per year Based on the new-build requirements of NHS facilities, but adjusted to reflect shared use of both treatment and non-treatment space.4,5
Working time 42.7 weeks per year 37.5 hours per week
Unit costs are based on 1,602 hours per year: 225 working days minus sickness absence and training/study days as reported for all NHS staff groups.6
Face-to-face time 1:0.67 Based on data from the three MBCT therapists who took part in the study.
Length of sessions 2 hours Therapy sessions lasted two hours. Unit costs available 2012/2013 £50 per hour, £84 per direct contact hour, £168 per session, £14 per service user.
1 Kuyken, W., Byford, S., Taylor, R.S., Watkins, E., Holden, E., White, K., Barrett, B., Byng, R., Evans, A Mullan, E. & Teasdale, J.D. (2008) Mindfulness-based
cognitive therapy to prevent relapse in recurrent depression, Journal of Consulting and Clinical Psychology, 76, 966-978. 2 Health & Social Care Information Centre (2013) NHS staff earnings estimates 2013 (not publicly available), Health & Social Care Information Centre,
Leeds. 3 Audit Commission (2012) NHS summarised accounts 2011-2012, NHS, London. 4 Building Cost Information Service (2013) Surveys of tender prices, Royal Institute of Chartered Surveyors, London. 5 Personal communication with the Department for Communities and Local Government, 2011. 6 Contracted hours are taken from NHS Careers (2012) Pay and benefits, National Health Service, London. http://www.nhscareers.nhs.uk/ [accessed 9
October 2013]. Working days and sickness absence rates as reported in Health & Social Care Information Centre (2013) Sickness absence rates in the NHS: January 2013 – March 2013, Health & Social Care Information Centre, Leeds.

Unit Costs of Health and Social Care 2013 59
2.12 Interventions for mental health promotion and mental illness prevention Information has been drawn from Knapp et al. (2011)1 and provides a summary of the key findings of a study exploring the economic case for mental health promotion and prevention, based on a detailed analysis of costs and benefits for 15 different interventions. All costs have been uprated using the appropriate inflators. The full report can be downloaded at: http://www.dh.gov.uk/en/Publicationsandstatistics/Publications/PublicationsPolicyAndGuidance/DH_126085/. Health visiting and reducing post-natal depression Context: Moderate-to-severe post-natal depression affects around one in eight women in the early months following childbirth. The National Institute for Health and Clinical Excellence (NICE) recommends the screening of post-natal depression as part of routine care, and the use of psychosocial interventions and psychological therapy for women, depending on the severity of depressive symptoms. Intervention: Health visitors are well placed to identify mothers suffering from post-natal depression and to provide preventative screening and early interventions. A number of UK trials of health visitor interventions have found positive effects: women were more likely to recover fully after three months; targeted ante-natal intervention with high-risk groups was shown to reduce the average time mothers spent in a depressed state; and a combination of screening and psychologically informed sessions with health visitors was clinically effective 6 and 12 months after childbirth. Cost: The biggest direct costs of the intervention were associated with training (estimated at £1,428 per health visitor), plus the additional time spent by health visitors providing screening and counselling for mothers. Parenting interventions for the prevention of persistent conduct disorders Context: Conduct disorders are the most common childhood psychiatric disorders, with a UK prevalence of 4.9 per cent for children aged 5-10 years. The condition leads to adulthood anti-social personality disorder in about 50 per cent of cases, and is associated with a wide range of adverse long-term outcomes, particularly delinquency and criminality. The costs to society are high, with average potential savings from early intervention previously estimated at £150,000 per case. Intervention: Parenting programmes can be targeted at parents of children with, or at risk of, developing conduct disorder, and are designed to improve parenting styles and parent-child relationships. Reviews have found parent training to have positive effects on children’s behaviour, and that benefits remain one year later. Longer-term studies show sustained effects but lack control groups; cost-effectiveness data are limited, but, in one trial, health and social services costs were found to reduce over time. Cost: The median cost of an 8-12 week group-based parenting programme is estimated at £971 per family, while that of individual interventions is £2,120. Assuming 80 per cent of people receive group-based interventions and 20 per cent individual interventions, in line with NICE guidance, the average cost of the intervention can be estimated at £1,201 per family. School-based social and emotional learning programmes to prevent conduct problems in childhood. Context: Conduct problems in childhood cover a range of oppositional or anti-social forms of behaviour, such as disobedience, lying, fighting and stealing, and are associated with a range of poor outcomes, including increased risk of criminal activity, fewer school qualifications, parenthood at a young age, unemployment, divorce or separation, substance abuse and psychiatric disorders, many of which lead to increased costs across several agencies.
1 Knapp, M., McDaid, D. & Parsonage, M. (2011) Mental health promotion and mental illness prevention: the economic case, Department of Health,
London.

60 Unit Costs of Health and Social Care 2013 Intervention: School-based Social and Emotional Learning (SEL) programmes help children and young people to recognise and manage emotions, and to set and achieve positive goals. International evidence shows that SEL participants demonstrate significantly improved social and emotional skills, attitudes, behaviour and academic performance. Cost: The costs of a representative intervention, including teacher training, programme co-ordinator and materials, were estimated at £135 per child per year at current prices. School-based interventions to reduce bullying Context: Being bullied at school has adverse effects on both psychological well-being and educational attainment. There is evidence from longitudinal data that this has a negative long-term impact on employability and earnings; on average, lifetime earnings of a victim of bullying are reduced by around £50,000. According to an Ofsted survey,1 39 per cent of children reported being bullied in the previous 12 months. Intervention: Anti-bullying programmes show mixed results. One high-quality evaluation of a school-based anti-bullying intervention found a 21-22 per cent reduction in the proportion of children victimised. Cost: Information is limited on the cost of anti-bullying programmes, but one study estimates this at £16 per pupil per year at current prices. Early detection for psychosis Context: It is estimated that each year in England more than 15,000 people exhibit early symptoms before the onset of full psychosis. Progression of the disease is associated with higher costs to public services (including health, social care and criminal justice), lost employment, and greatly diminished quality of life for the individual and their family. Intervention: Early detection services aim to identify the early symptoms of psychosis, reduce the risk of transition to full psychosis, and shorten the duration of untreated psychosis for those who develop it. Such services include cognitive behavioural therapy, psychotropic medication, and contact with psychiatrists. This contrasts with treatment as usual which typically consists of GP and counsellor contacts. Cost: One year of an early detection intervention has been estimated to cost £3,007 per patient, compared with £758 for standard care (2009 prices). Early intervention for psychosis Context: Psychosis related to schizophrenia is associated with higher costs to public services (including health, social care and criminal justice), lost employment, and greatly diminished quality of life for the individual with the illness and their family. Intervention: Early intervention teams aim to reduce relapse and readmission rates for patients who have suffered a first episode of psychosis, and to improve their chances of returning to employment, education or training, and more generally their future quality of life. This intervention involves a multidisciplinary team that could include a range of professionals (psychiatrists, psychologists, occupational therapists, community support workers, social workers and vocational workers). Cost: The annual direct cost per patient of this type of service, plus other community psychiatric services and inpatient care, has been estimated at £11,491 at current prices. The first year of the early intervention team’s input is estimated to cost £2,400 per patient. Screening and brief intervention in primary care for alcohol misuse Context: It is estimated that 6.6 million adults in England currently consume alcohol at hazardous levels, and 2.3 million at harmful levels. Intervention: An inexpensive intervention in primary care combines universal screening by GPs of all patients, followed by a 5-minute advice session for those who screen positive. 1 Ofsted (2008) Children on bullying, Ofsted, http://www.ofsted.gov.uk/resources/children-bullying [accessed 9 October 2013].

Unit Costs of Health and Social Care 2013 61 Cost: The total cost of the intervention averaged over all those screened was £17.80 at current prices. Workplace screening for depression and anxiety disorders Context: Labour Force Survey data suggest that 11.4 million working days were lost in Britain in 2008/09 due to work-related stress, depression or anxiety. This equates to 27.3 days lost per affected worker. Intervention: Workplace-based enhanced depression care consists of employees completing a screening questionnaire, followed by care management for those found to be suffering from, or at risk of developing, depression and/or anxiety disorders. Those at risk of depression or anxiety disorders are offered a course of cognitive behaviour therapy (CBT) delivered in six sessions over 12 weeks. Cost: It is estimated that £32 covers the cost of facilitating the completion of the screening questionnaire, follow-up assessment to confirm depression, and care management costs. For those identified as being at risk, the cost of six sessions of face-to-face CBT is £245. Promoting well-being in the workplace Context: Deteriorating well-being in the workplace is potentially costly for businesses as it may increase absenteeism and presenteeism (lost productivity while at work), and in the longer term potentially leads to premature withdrawal from the labour market. Intervention: There are a wide range of approaches: flexible working arrangements; career progression opportunities; ergonomics and environment; stress audits; and improved recognition of risk factors for poor mental health by line managers. A multi-component health promotion intervention consists of personalised health and well-being information and advice; a health risk appraisal questionnaire; access to a tailored health improvement web portal; wellness literature, and seminars and workshops focused on identified wellness issues. Cost: The cost of a multi-component intervention is estimated at £82 per employee per year at current prices. Debt and mental health Context: Only about half of all people with debt problems seek advice, and without intervention almost two-thirds of people with unmanageable debt problems will still face such problems 12 months later. Research has demonstrated a link between debt and mental health. On average, the lost employment costs of each case of poor mental health are £12,302 per year, while the annual costs of health and social service use are £1,623. Intervention: Current evidence suggests that there is potential for debt advice interventions to alleviate financial debt, and hence reduce mental health problems resulting from debt. For the general population, contact with face-to-face advice services is associated with a 5 per cent likelihood of debt becoming manageable, while telephone services achieve 47 per cent. Cost: The costs of this type of intervention vary significantly, depending on whether it is through face-to-face, telephone or internet-based services. The Department for Business, Innovation and Skills suggests expenditure of £255 per client for face-face-debt advice; telephone and internet-based services are cheaper. Population-level suicide awareness training and intervention Context: The economic impacts of suicide are profound, although comparatively few studies have sought to quantify these costs. This is in part because a proportion of individuals who survive suicide attempts are likely to make further attempts, in some cases fatal. Intervention: There is evidence that suicide prevention education for GPs can have an impact as a population-level intervention to prevent suicide. With better identification of those at risk, individuals can receive cognitive behavioural therapy (CBT), followed by ongoing pharmaceutical and psychological support to help manage underlying depressive disorders.

62 Unit Costs of Health and Social Care 2013 Cost: A course of CBT in the first year is around £430 per person. Further ongoing pharmaceutical and psychological therapy is estimated to cost £1,272 a year. The cost of suicide prevention training for GPs, based on the Applied Suicide Intervention Skills Training (ASIST) course, is £215. Bridge safety measures for suicide prevention Context: Jumping from height accounts for around 3 per cent of completed suicides. Intervention and cost: Following the installation of a safety barrier in 1998, at a cost of £319,030 at current prices, the number of suicides reduced from an average of 8.2 per year in the five years before the barrier, to 4 per year in the five years after it was installed. Collaborative care for depression in individuals with Type II diabetes Context: Depression is commonly associated with chronic physical health problems. US data indicate that 13 per cent of all new cases of Type II diabetes will also have clinical depression. These patterns are important as evidence shows that co-morbid depression exacerbates the complications and adverse consequences of diabetes, in part because patients may more poorly manage their diabetes. This has substantial economic consequences. Intervention: ‘Collaborative care’, including GP advice and care, the use of antidepressants and cognitive behavioural therapy (CBT) for some patients, can be delivered in a primary care setting to individuals with co-morbid diabetes. Cost: It is estimated that the total cost of six months of collaborative care is £734, compared with £372 for usual care. Tackling medically unexplained symptoms Context: Somatoform conditions present physical symptoms for which there is no identifiable physical cause. These medically unexplained symptoms are thought to be triggered or exacerbated by mental and emotional factors, such as psychosocial stress, depression or anxiety. The financial costs to public services and society are considerable. Intervention: Cognitive behavioural therapy (CBT) has been found to be an effective intervention for tackling somatoform conditions and their underlying psychological causes. Cost: A course of CBT may last for 10 sessions at £91 per session. Costs associated with the need to raise the awareness of GPs to the potential role of CBT treatment for somatoform conditions, either through e-learning or face-to-face training, are also included. Befriending of older adults Context: Befriending initiatives, often delivered by volunteers, provide an ‘upstream’ intervention that is potentially of value both to the person being befriended and the befriender. Intervention: The intervention is not usually structured and nor does it have formally-defined goals. Instead, an informal, natural relationship develops between the participants, who will usually have been matched for interests and preferences. This relationship facilitates improved mental health, reduced loneliness and greater social inclusion. Cost: The contact is generally for an hour per week or fortnight. The cost to public services of 12 hours of befriending contact is estimated at £87, based on the lower end of the cost range for befriending interventions.

Unit Costs of Health and Social Care 2013
3. Services for people who misuse drugs or alcohol
3.1 Residential rehabilitation for people who misuse drugs or alcohol 3.2 Inpatient detoxification for people who misuse drugs or alcohol 3.3 Specialist prescribing 3.4 Alcohol health worker, Accident & Emergency Department

64 Unit Costs of Health and Social Care 2013

Unit Costs of Health and Social Care 2013 65 Services for people who misuse drugs or alcohol Statistics produced by the National Drug Treatment Monitoring System (NDTMS), presented in the National Treatment Agency’s (NTA) Annual Report 2008/09,1 revealed the prevalence of people who misuse drugs or alcohol. The information presented in tables 3.1 to 3.3 was provided by the National Treatment Agency2 and present the unit costs of three treatment interventions: (a) residential rehabilitation, (b) inpatient detoxification and (c) specialist prescribing. These interventions are described fully in Business Definition for Adult Drug Treatment Providers (National Treatment Agency, 2010).3 National average costs for the interventions were calculated. These excluded instances where the provider data fell in the top and bottom 5 per cent of unit costs for service users in treatment OR days in treatment, and the top and bottom 10 per cent of unit costs for service users in treatment AND days in treatment.
1 National Treatment Agency for Substance Misuse (2009) Annual report, 2008/09. http://www.nta.nhs.uk/uploads/nta_annual_report_08-09_2.pdf
[accessed 18 November 2013]. 2 Personal communication with the National Treatment Agency, 2010. 3 National Treatment Agency for Substance Misuse (2010) NDTMS dataset G, definition, business definition for adult drug treatment providers,
http://www.nta.nhs.uk/core-data-set.aspx/ [accessed 9 October 2013].

66 Unit Costs of Health and Social Care 2013
3.1 Residential rehabilitation for people who misuse drugs or alcohol Residential rehabilitation consists of a range of treatment delivery models or programmes to address drug and alcohol misuse, including abstinence orientated drug interventions within the context of residential accommodation. Other examples include inpatient treatment for the pharmacological management of substance misuse, and therapeutic residential services designed to address adolescent substance misuse. Of the 210,815 individuals receiving structured drug treatment in 2008/09,1 4,711 were in residential rehabilitation. The real figure is likely to be higher as only about two-thirds of residential providers sent data to the National Drug Treatment Monitoring System in 2008/09. Information has been drawn from a sample of 34 residential rehabilitation programmes to produce a unit cost per resident week of £669 at 2012/2013 prices. The Gross Domestic Product (GDP) index has been used to uprate from 2007/08 prices, as suggested by the NTA. It was not possible to provide details of costs for this service due to the method of data collection.
1 National Treatment Agency for Substance Misuse (2009) Annual report, 2008/09, http://www.nta.nhs.uk/uploads/nta_annual_report_08-09_2.pdf
[accessed 18 November 2013].

Unit Costs of Health and Social Care 2013 67
3.2 Inpatient detoxification for people who misuse drugs or alcohol An Inpatient Unit (IPU) provides care to service users with substance-related problems (medical, psychological or social) that are so severe that they require medical, psychiatric and psychological care. The key feature of an IPU is the provision of these services with 24-hour cover, seven days per week, from a multidisciplinary clinical team who have had specialist training in managing addictive behaviours. Treatment in an inpatient setting may involve one or more of the following interventions: (a) assessment, (b) stabilisation and (c) assisted withdrawal (detoxification). A combination of all three may be provided, or one followed by another. The three main settings for inpatient treatment are: (a) general hospital psychiatric units, (b) specialist drug misuse inpatient units in hospitals and (c) residential rehabilitation units (usually as a precursor to the rehabilitation programme). See Business Definition for Adult Drug Treatment Providers1 for more detailed information on this intervention. Based on information provided by the National Treatment Agency in 2010, the average cost for inpatient detoxification (NHS and voluntary organisations) is £152 per patient day, which is equivalent to £1,061 per patient week (unchanged from last year). Costs and unit estimation
2012/2013 value Notes
A. Direct pay £88 per patient day
Salaries plus oncosts for care staff.
B. Direct overheads £16 per patient day
Includes drugs, pharmacy and dispensing costs. Also includes other treatment materials, toxicology and drug testing, medical supplies, rent and rates, staff travel, training, service user travel costs, volunteer expenses, contingency management, office costs specifically attributed to the provision of the service, non-pay administration (for example, telephones and information technology).
C. Indirect costs and overheads
£47 per patient day
Includes capital charges, expenditure on refurbishment, property and buildings, housekeeping, catering, porterage, transport, waste disposal, security, finance, human resources, personnel, communications and corporate charges.
Unit costs available 2012/2013 £152 per patient day or £1,061 per patient week
1 National Treatment Agency for Substance Misuse (2010) NDTMS dataset G, definition, business definition for adult drug treatment providers,
http://www.nta.nhs.uk/core-data-set.aspx [accessed 9 October 2013].

68 Unit Costs of Health and Social Care 2013
3.3 Specialist prescribing Specialist prescribing is community prescribing for drug misuse in a specialist drug service setting, normally staffed by a multidisciplinary substance misuse team. Specialist prescribing interventions normally include comprehensive assessments of drug treatment need and the provision of a full range of prescribing treatments in the context of care-planned drug treatment. The specialist team should also provide, or provide access to, a range of other care-planned health-care interventions including psychosocial interventions, a wide range of harm reduction interventions, Blood Borne Virus (BBV) prevention and vaccination, and abstinence-oriented interventions. The teams include specialist doctors who are usually consultant addiction psychiatrists ‘with a Certificate of Completion of Training (CCT) in psychiatry, with endorsement in substance misuse working exclusively to provide a full range of services to substance misusers’. See Business Definition for Adult Drug Treatment Providers1 for more detailed information on this intervention. Based on information provided by the National Treatment Agency,2 the average cost for specialist prescribing is £53 per patient week. All costs have been uprated from 2007/08 using the Gross Domestic Product (GDP) index, as suggested by the NTA. Using reference costs 2011/2012,3 the mean cost per client contact in a NHS and PCT combined drugs and alcohol mental health team was £119 per face-to-face contact and £51 per non face-to-face contact. These costs have been uprated using the Hospital and Community Health Services (HCHS) inflator. Costs and unit estimation
2012/2013 value
Notes
A. Direct pay £26 per patient week
Salaries plus oncosts for care staff.
B. Direct overheads £18 per patient week
Includes drugs, pharmacy and dispensing costs. Also includes other treatment materials, toxicology and drug testing, medical supplies, rent and rates, staff travel, training, service user travel costs, volunteer expenses, contingency management, office costs specifically attributed to the provision of the service, non-pay administration (for example, telephones and information technology).
C. Indirect costs and overheads
£10 per patient week
Includes capital charges, capital on refurbishment, property and buildings,housekeeping, catering, porterage, transport, waste disposal, security, finance, human resources, personnel, communications and corporate charges.
Unit costs available 2012/2013 £54 per patient week
1 National Treatment Agency for Substance Misuse (2010) NDTMS dataset G, definition, business definition for adult drug treatment providers,
http://www.nta.nhs.uk/core-data-set.aspx [accessed 9 October 2013]. 2 Personal communication with the National Treatment Agency, 2010. 3 Department of Health (2013) NHS reference costs 2011-2012, https://www.gov.uk/government/news/financial-year-2011-to-2012-reference-costs-
published [accessed 9 October 2013].
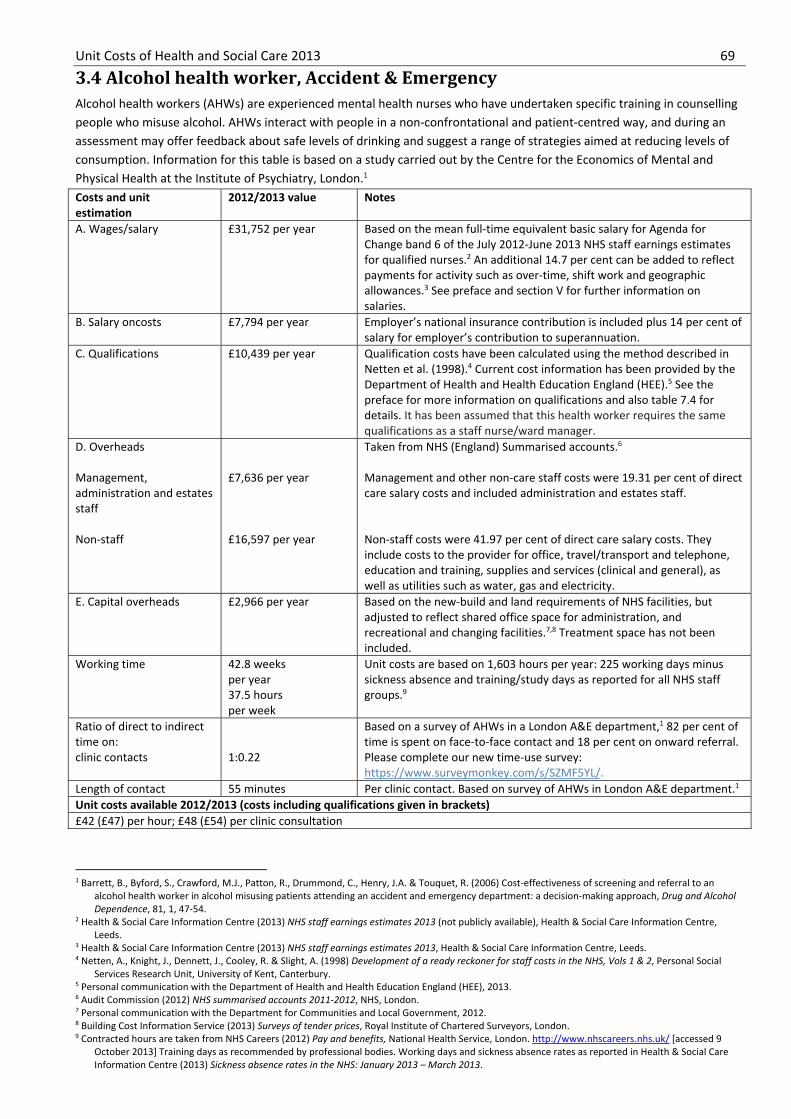
Unit Costs of Health and Social Care 2013 69
3.4 Alcohol health worker, Accident & Emergency Alcohol health workers (AHWs) are experienced mental health nurses who have undertaken specific training in counselling people who misuse alcohol. AHWs interact with people in a non-confrontational and patient-centred way, and during an assessment may offer feedback about safe levels of drinking and suggest a range of strategies aimed at reducing levels of consumption. Information for this table is based on a study carried out by the Centre for the Economics of Mental and Physical Health at the Institute of Psychiatry, London.1 Costs and unit estimation
2012/2013 value
Notes
A. Wages/salary £31,752 per year Based on the mean full-time equivalent basic salary for Agenda for Change band 6 of the July 2012-June 2013 NHS staff earnings estimates for qualified nurses.2 An additional 14.7 per cent can be added to reflect payments for activity such as over-time, shift work and geographic allowances.3 See preface and section V for further information on salaries.
B. Salary oncosts £7,794 per year Employer’s national insurance contribution is included plus 14 per cent of salary for employer’s contribution to superannuation.
C. Qualifications £10,439 per year Qualification costs have been calculated using the method described in Netten et al. (1998).4 Current cost information has been provided by the Department of Health and Health Education England (HEE).5 See the preface for more information on qualifications and also table 7.4 for details. It has been assumed that this health worker requires the same qualifications as a staff nurse/ward manager.
D. Overheads Management, administration and estates staff Non-staff
£7,636 per year £16,597 per year
Taken from NHS (England) Summarised accounts.6 Management and other non-care staff costs were 19.31 per cent of direct care salary costs and included administration and estates staff. Non-staff costs were 41.97 per cent of direct care salary costs. They include costs to the provider for office, travel/transport and telephone, education and training, supplies and services (clinical and general), as well as utilities such as water, gas and electricity.
E. Capital overheads £2,966 per year Based on the new-build and land requirements of NHS facilities, but adjusted to reflect shared office space for administration, and recreational and changing facilities.7,8 Treatment space has not been included.
Working time 42.8 weeks per year 37.5 hours per week
Unit costs are based on 1,603 hours per year: 225 working days minus sickness absence and training/study days as reported for all NHS staff groups.9
Ratio of direct to indirect time on: clinic contacts
1:0.22
Based on a survey of AHWs in a London A&E department,1 82 per cent of time is spent on face-to-face contact and 18 per cent on onward referral. Please complete our new time-use survey: https://www.surveymonkey.com/s/SZMF5YL/.
Length of contact 55 minutes Per clinic contact. Based on survey of AHWs in London A&E department.1 Unit costs available 2012/2013 (costs including qualifications given in brackets) £42 (£47) per hour; £48 (£54) per clinic consultation
1 Barrett, B., Byford, S., Crawford, M.J., Patton, R., Drummond, C., Henry, J.A. & Touquet, R. (2006) Cost-effectiveness of screening and referral to an
alcohol health worker in alcohol misusing patients attending an accident and emergency department: a decision-making approach, Drug and Alcohol Dependence, 81, 1, 47-54.
2 Health & Social Care Information Centre (2013) NHS staff earnings estimates 2013 (not publicly available), Health & Social Care Information Centre, Leeds.
3 Health & Social Care Information Centre (2013) NHS staff earnings estimates 2013, Health & Social Care Information Centre, Leeds. 4 Netten, A., Knight, J., Dennett, J., Cooley, R. & Slight, A. (1998) Development of a ready reckoner for staff costs in the NHS, Vols 1 & 2, Personal Social
Services Research Unit, University of Kent, Canterbury. 5 Personal communication with the Department of Health and Health Education England (HEE), 2013. 6 Audit Commission (2012) NHS summarised accounts 2011-2012, NHS, London. 7 Personal communication with the Department for Communities and Local Government, 2012. 8 Building Cost Information Service (2013) Surveys of tender prices, Royal Institute of Chartered Surveyors, London. 9 Contracted hours are taken from NHS Careers (2012) Pay and benefits, National Health Service, London. http://www.nhscareers.nhs.uk/ [accessed 9
October 2013] Training days as recommended by professional bodies. Working days and sickness absence rates as reported in Health & Social Care Information Centre (2013) Sickness absence rates in the NHS: January 2013 – March 2013.

70 Unit Costs of Health and Social Care 2013

4. Services for people with learning disabilities
4.1 Group homes for people with learning disabilities 4.2 Fully staffed living settings 4.3 Semi-independent living settings 4.4 Local authority day care for people with learning disabilities

72 Unit Costs of Health and Social Care 2013
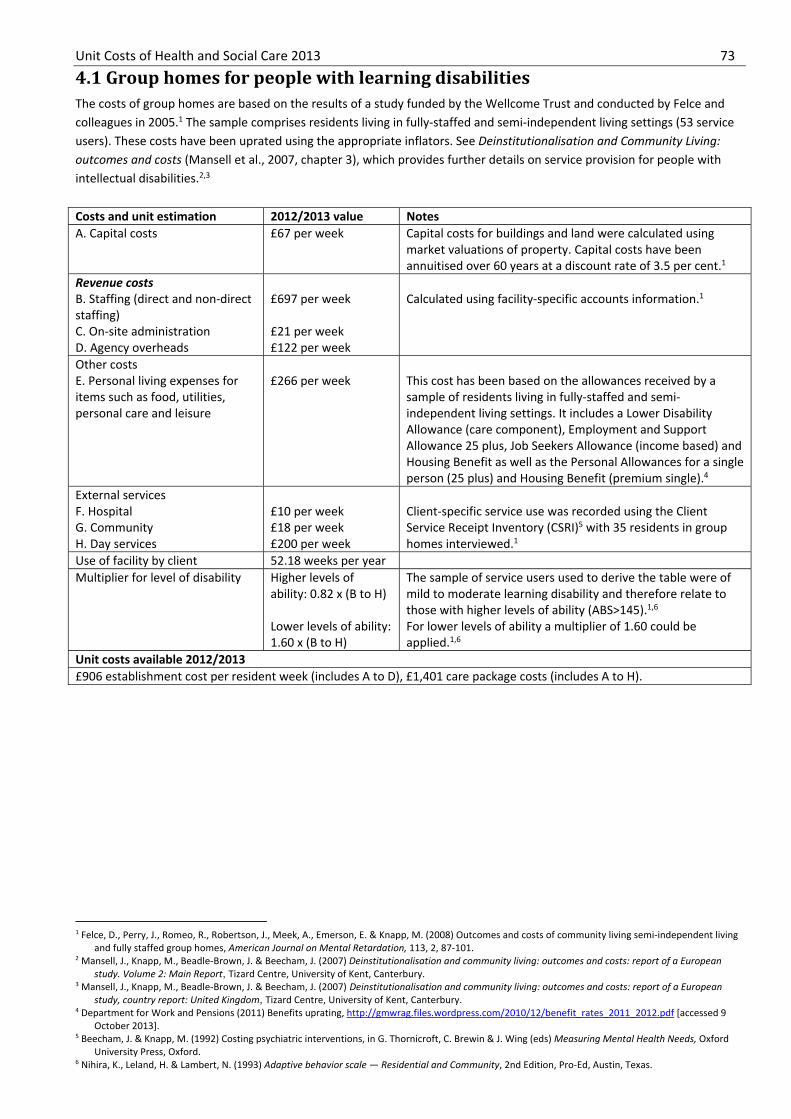
Unit Costs of Health and Social Care 2013 73
4.1 Group homes for people with learning disabilities The costs of group homes are based on the results of a study funded by the Wellcome Trust and conducted by Felce and colleagues in 2005.1 The sample comprises residents living in fully-staffed and semi-independent living settings (53 service users). These costs have been uprated using the appropriate inflators. See Deinstitutionalisation and Community Living: outcomes and costs (Mansell et al., 2007, chapter 3), which provides further details on service provision for people with intellectual disabilities.2,3
Costs and unit estimation 2012/2013 value NotesA. Capital costs £67 per week Capital costs for buildings and land were calculated using
market valuations of property. Capital costs have been annuitised over 60 years at a discount rate of 3.5 per cent.1
Revenue costs B. Staffing (direct and non-direct staffing) C. On-site administration D. Agency overheads
£697 per week £21 per week £122 per week
Calculated using facility-specific accounts information.1
Other costs E. Personal living expenses for items such as food, utilities, personal care and leisure
£266 per week This cost has been based on the allowances received by a
sample of residents living in fully-staffed and semi-independent living settings. It includes a Lower Disability Allowance (care component), Employment and Support Allowance 25 plus, Job Seekers Allowance (income based) and Housing Benefit as well as the Personal Allowances for a single person (25 plus) and Housing Benefit (premium single).4
External services F. Hospital G. Community H. Day services
£10 per week £18 per week £200 per week
Client-specific service use was recorded using the Client Service Receipt Inventory (CSRI)5 with 35 residents in group homes interviewed.1
Use of facility by client 52.18 weeks per yearMultiplier for level of disability Higher levels of
ability: 0.82 x (B to H) Lower levels of ability: 1.60 x (B to H)
The sample of service users used to derive the table were of mild to moderate learning disability and therefore relate to those with higher levels of ability (ABS>145).1,6 For lower levels of ability a multiplier of 1.60 could be applied.1,6
Unit costs available 2012/2013 £906 establishment cost per resident week (includes A to D), £1,401 care package costs (includes A to H).
1 Felce, D., Perry, J., Romeo, R., Robertson, J., Meek, A., Emerson, E. & Knapp, M. (2008) Outcomes and costs of community living semi-independent living
and fully staffed group homes, American Journal on Mental Retardation, 113, 2, 87-101. 2 Mansell, J., Knapp, M., Beadle-Brown, J. & Beecham, J. (2007) Deinstitutionalisation and community living: outcomes and costs: report of a European
study. Volume 2: Main Report, Tizard Centre, University of Kent, Canterbury. 3 Mansell, J., Knapp, M., Beadle-Brown, J. & Beecham, J. (2007) Deinstitutionalisation and community living: outcomes and costs: report of a European
study, country report: United Kingdom, Tizard Centre, University of Kent, Canterbury. 4 Department for Work and Pensions (2011) Benefits uprating, http://gmwrag.files.wordpress.com/2010/12/benefit_rates_2011_2012.pdf [accessed 9
October 2013]. 5 Beecham, J. & Knapp, M. (1992) Costing psychiatric interventions, in G. Thornicroft, C. Brewin & J. Wing (eds) Measuring Mental Health Needs, Oxford
University Press, Oxford. 6 Nihira, K., Leland, H. & Lambert, N. (1993) Adaptive behavior scale — Residential and Community, 2nd Edition, Pro-Ed, Austin, Texas.

74 Unit Costs of Health and Social Care 2013
4.2 Fully-staffed living settings The costs of fully-staffed living settings are based on the results of a study funded by the Wellcome Trust and conducted by Felce and colleagues in 2005.1 All costs have been uprated using the appropriate inflators. See Deinstitutionalisation and Community Living: outcomes and costs (Mansell et al. 2007, chapter 3), which provides further details on service provision for people with learning disabilities.2,3
Costs and unit estimation
2012/2013 value Notes
A. Capital costs £77 per week Capital costs for buildings and land were calculated using market valuations of property. Capital costs have been annuitised over 60 years at a discount rate of 3.5 per cent.
Revenue costs B. Staffing (direct and non-direct staffing) C. On-site administration D. Agency overheads
£932 per week £29 per week £147 per week
Calculated using facility-specific accounts information.1
Other costs E. Personal living expenses for items such as food, utilities, personal care and leisure
£266 per week This cost has been based on the allowances received by a sample of
residents living in fully-staffed and semi-independent living settings. It includes a Lower Disability Allowance (care component), Employment and Support Allowance 25 plus, Job Seekers Allowance (income based) and Housing Benefit as well as the Personal Allowances for a single person (25 plus) and Housing Benefit (premium single).4
External services F. Hospital G. Community H. Day services
£8 per week £17 per week £227 per week
Client-specific service use was recorded using the Client Service Receipt Inventory (CSRI),5 with 35 residents in fully-staffed living settings interviewed. Costs for day services were estimated using accounts information, where available.1 Unit costs for all other services were taken from this volume.
Use of facility by client
52.18 weeks per year
Multiplier for level of disability
Higher levels of ability: 0.82 x (B to H) Lower levels of ability: 1.60 x (B to H)
Clients were grouped according to scores on the Adaptive Behaviour Scale (ABS).6 Scores between zero and 145 were grouped as less able; scores higher than 145 were grouped as more able (145 was selected to allow relatively even distribution between groups). All participants in the study had mild to moderate learning disability.1
Unit costs available 2012/2013 £1,186 establishment costs per resident week (includes A to D); £1,703 care package costs (includes A to H).
1 Felce, D., Perry, J., Romeo, R., Robertson, J., Meek, A., Emerson, E. & Knapp, M. (2008) Outcomes and costs of community living semi-independent living
and fully staffed group homes, American Journal on Mental Retardation, 113, 2, 87-101. 2 Mansell, J., Knapp, M., Beadle-Brown, J. & Beecham, J. (2007) Deinstitutionalisation and community living: outcomes and costs: report of a European
study. Volume 2: Main Report, Tizard Centre, University of Kent, Canterbury. 3 Mansell, J., Knapp, M., Beadle-Brown, J. & Beecham, J. (2007) Deinstitutionalisation and community living: outcomes and costs: report of a European
study, country report: United Kingdom, Tizard Centre, University of Kent, Canterbury. 4 Department for Work and Pensions (2011) Benefits uprating, http://gmwrag.files.wordpress.com/2010/12/benefit_rates_2011_2012.pdf [accessed 9
October 2013]. 5 Beecham, J. & Knapp, M. (1992) Costing psychiatric interventions, in G. Thornicroft, C. Brewin & J. Wing (eds) Measuring Mental Health Needs, Oxford
University Press, Oxford. 6 Nihira, K., Leland, H. & Lambert, N. (1993) Adaptive behavior scale — Residential and Community, 2nd Edition, Pro-Ed, Austin, Texas.

Unit Costs of Health and Social Care 2013 75
4.3 Semi-independent living settings The costs of semi-independent living settings are based on the results of a study funded by the Wellcome Trust and conducted by Felce and colleagues in 2005.1 The sample comprised 35 service users who were resident in semi-independent living settings. These settings were partially staffed, having no paid support for at least 28 hours per week when service users were awake at home. These settings did not have any regular night-time support or sleep-over presence. All costs have been uprated using the appropriate inflators. See Deinstitutionalisation and Community Living: outcomes and costs (Mansell et al., 2007, chapter 3), which provides further details on service provision for people with learning disabilities.2,3 Costs and unit estimation
2012/2013 value Notes
A. Capital costs £52 per week Capital costs for buildings and land were calculated using market valuations of property. They have been annuitised over 60 years at a discount rate of 3.5 per cent.
Revenue costs B. Staffing (direct and non-direct staffing) C. On-site administration D. Agency overheads
£255 per week £10 per week £61 per week
Calculated using facility-specific accounts information.1
Other costs E. Personal living expenses for items such as food, utilities, personal care and leisure
£266 per week This cost has been based on the allowances received by a sample of
residents living in fully-staffed and semi-independent living settings. It includes a Lower Disability Allowance (care component), Employment and Support Allowance 25 plus, Job Seekers Allowance (income based) and Housing Benefit as well as the Personal Allowances for a single person (25 plus) and Housing Benefit (premium single).4
External services F. Hospital G. Community H. Day services
£10 per week £15 per week £125 per week
Client-specific service use was recorded using the Client Service Receipt Inventory (CSRI),5 with 35 residents in semi-independent living settings interviewed. Costs for day services were estimated using accounts information, where available.1 Unit costs for all other services were taken from this volume.
Use of facility by client 52.18 weeks per yearMultiplier for level of disability
Higher levels of ability: 0.82 x (B to H) Lower levels of ability: 1.60 x (B to H)
Clients were grouped according to scores on the Adaptive Behaviour Scale (ABS).6 Scores between zero and 145 were grouped as less able; scores higher than 145 were grouped as more able (145 was selected to allow relatively even distribution between groups). All participants in the study had mild to moderate intellectual disability.1
Unit costs available 2012/2013 £378 establishment costs per resident week (includes A to D); £794 care package costs (includes A to H).
1 Felce, D., Perry, J., Romeo, R., Robertson, J., Meek, A., Emerson, E. & Knapp, M. (2008) Outcomes and costs of community living semi-independent living
and fully staffed group homes, American Journal on Mental Retardation, 113, 2, 87-101. 2 Mansell, J., Knapp, M., Beadle-Brown, J. & Beecham, J. (2007) Deinstitutionalisation and community living: outcomes and costs: report of a European
study. Volume 2: Main Report, Tizard Centre, University of Kent, Canterbury. 3 Mansell, J., Knapp, M., Beadle-Brown, J. & Beecham, J. (2007) Deinstitutionalisation and community living: outcomes and costs: report of a European
study, country report: United Kingdom, Tizard Centre, University of Kent, Canterbury. 4 Department for Work and Pensions (2011) Benefits uprating, http://gmwrag.files.wordpress.com/2010/12/benefit_rates_2011_2012.pdf [accessed 9
October 2013]. 5 Beecham, J. & Knapp, M. (1992) Costing psychiatric interventions, in G. Thornicroft, C. Brewin & J. Wing (eds) Measuring Mental Health Needs, Oxford
University Press, Oxford. 6 Nihira, K., Leland, H. & Lambert, N. (1993) Adaptive behavior scale — Residential and Community, 2nd Edition, Pro-Ed, Austin, Texas.

76 Unit Costs of Health and Social Care 2013
4.4 Local authority day care for people with learning disabilities This table uses the Personal Social Services Expenditure return (PSS EX1)1 for expenditure costs, which have been uprated using the PSS pay & prices inflator. The median cost was £284 per client week and the mean cost was £293 per client week (including capital costs). These data do not report on the number of sessions clients attended each week. Costs and unit estimation
2012/2013 value
Notes
Capital costs (A, B & C) A. Buildings and oncosts
£3.10 per day
Based on the new-build and land requirements for local authority day care facilities (which do not distinguish by client group). These allow for 33.4 square metres per person.2 Capital costs have been annuitised over 60 years at a discount rate of 3.5 per cent.
B. Land £0.60 per day Based on Department for Communities and Local Government statistics.3 Land costs have been discounted at 3.5 per cent over 60 years.
C. Other capital Capital costs not relating to buildings and oncosts are included in the revenue costs so no additional cost has been added for other capital such as equipment and durables.
D. Total local authority expenditure (minus capital)
£53 per day Assuming people with learning disabilities attend day care five days a week, the median and mean costs per day were £53 and £55 respectively. Capital charges on the revenue account which relate to buildings have been deducted.
E. Agency overheads
Social services management and support services (SSMSS) costs are included in PSS EX1 expenditure figures so no additional overheads have been added.
Use of facility by client
Assumes attendance of 5 sessions a week.
Occupancy No current information is available.London multiplier 1.20 x (A to B)
1.33 x (D to E) Relative London costs are drawn from the same source as the base data for each cost element.
Unit costs available 2012/2013 £57 per day (includes A to D).
1 Health & Social Care Information Centre (2013) PSS EX1 2011/12, Health & Social Care Information Centre, Leeds. 2 Building Cost Information Service (2013) Surveys of tender prices, Royal Institute of Chartered Surveyors, London. 3 Personal communication with the Department for Communities and Local Government, 2011.

Unit Costs of Health and Social Care 2013 77
5. Services for adults with physical disability
5.1 Local authority care homes for adults with a physical disability 5.2 Voluntary, private and independent sector care homes for adults with a physical
disability 5.2 Day care for adults with a physical disability 5.3 Home care for adults with a physical disability

78 Unit Costs of Health and Social Care 2013

Unit Costs of Health and Social Care 2013 79
5.1 Local authority care homes for adults with a physical disability This table uses the Personal Social Services Expenditure return (PSS EX1)1 for expenditure which has been uprated using the PSS pay & prices inflator.
Costs and unit estimation
2012/2013 value
Notes
Capital costs A. Buildings and oncosts £106 per
resident week
Based on the new-build and land requirements for local authority residential care establishments. These allow for 57.3 square metres per person.2 Capital costs have been annuitised over 60 years at a discount rate of 3.5 per cent.
B. Land costs £10 per resident week
Based on Department for Communities and Local Government statistics.3 The cost of land has been annuitised at 3.5 per cent over 60 years.
C. Total local authority expenditure (minus capital)
£735 per resident week
The median revenue weekly cost estimate (£735) for supporting adults in own-provision residential care (includes full cost paying and preserved rights residents). Capital costs relating to buildings and land have been deducted. The mean cost per client per week is reported as being £1,087.
D. Agency overheads Social services management and support services (SSMSS) costs are included
in PSS EX1 expenditure figures so no additional overheads have been added. Other costs E. Personal living expenses
£23.50 per week
The DWP personal allowance for people in residential care or a nursing home is £23.50.4 This has been used as a proxy for personal consumption.
F. External services No information is available.Use of facility by client 365.25 days
per year
Occupancy 100 per cent No statistics available, therefore 100 per cent occupancy assumed.London multiplier No statistics available.Unit costs available 2012/2013 £851 per resident week establishment costs (includes A to C); £874 per resident week (includes A to E).
1 Health & Social Care Information Centre (2013) PSS EX1 2011/12, Health & Social Care Information Centre, Leeds. 2 Building Cost Information Service (2013) Surveys of tender prices, Royal Institute of Chartered Surveyors, London. 3 Personal communication with the Department for Communities and Local Government, 2011. 4 Department of Health (2012) Charging for residential care, https://www.gov.uk/government/news/charging-for-residential-care--2/ [accessed 3 October
2013].

80 Unit Costs of Health and Social Care 2013
5.2 Voluntary, private and independent sector care homes for adults with a physical disability
This table uses the Personal Social Services Expenditure return (PSS EX1)1 for expenditure which has been uprated using the PSS pay & prices inflator.
Costs and unit estimation
2012/2013 value
Notes
Capital costs A. Buildings and oncosts £106 per
resident week
Based on the new-build and land requirements for local authority residential care establishments. These allow for 57.3 square metres per person.2 Capital costs have been annuitised over 60 years at a discount rate of 3.5 per cent.
B. Land costs £10 per resident week
Based on Department for Communities and Local Government statistics.3 The cost of land has been annuitised at 3.5 per cent over 60 years.
C. Total expenditure (minus capital) £730 per
resident week
The median revenue weekly cost estimate (£730) for supporting adults in residential care provided by others (includes full cost paying and preserved rights residents). Capital costs relating to buildings and land have been deducted. The mean cost per client per week is reported as being £846.
D. Agency overheads Social services management and support services (SSMSS) costs are included
in PSS EX1 expenditure figures so no additional overheads have been added. Other costs E. Personal living expenses
£23.50 per week
The DWP personal allowance for people in residential care or a nursing home is £23.50.4 This has been used as a proxy for personal consumption.
F. External services No information is available.Use of facility by client 365.25 days
per year
Occupancy 100 per cent No statistics available, therefore 100 per cent occupancy assumed.London multiplier No statistics available.Unit costs available 2012/2013 £846 per resident week establishment costs (includes A to C); £869 per resident week (includes A to E).
1 Health & Social Care Information Centre (2013) PSS EX1 2011/12, Health & Social Care Information Centre, Leeds. 2 Building Cost Information Service (2013) Surveys of tender prices, Royal Institute of Chartered Surveyors, London. 3 Personal communication with the Department for Communities and Local Government, 2011. 4 Department of Health (2012) Charging for residential care, https://www.gov.uk/government/news/charging-for-residential-care--2/ [accessed 3 October
2013].

Unit Costs of Health and Social Care 2013 81
5.3 Day care for adults with a physical disability This table uses the Personal Social Services Expenditure return (PSS EX1)1 for revenue costs, which have been uprated using the PSS pay & prices inflator. The median cost was £171 per client week and the mean cost was £195 per client week (including capital costs). These data do not report on how many sessions clients attended each week. Costs and unit estimation
2012/2013 value
Notes
Capital costs (A, B & C) A. Buildings and oncosts
£11 per day
Based on the new-build and land requirements for local authority day care facilities (which do not distinguish by client group). These allow for 33.4 square metres per person.2 Capital costs have been annuitised over 60 years at a discount rate of 3.5 per cent.
B. Land £1.10 per day Based on Department for Communities and Local Government statistics.3 Land costs have been discounted at 3.5 per cent over 60 years.
C. Other capital Capital costs not relating to buildings and oncosts are included in the revenue costs so no additional cost has been added for other capital such as equipment and durables.
Revenue costs D. Salary and other revenue costs
£45 per day
Assuming people with physical disabilities attend day care three days a week, the median and mean costs per day were £45 and £53 respectively. Capital charges on the revenue account which relate to buildings have been deducted.
E. Agency overheads
Social services management and support services (SSMSS) costs are included in PSS EX1 expenditure figures so no additional overheads have been added.
Use of facility by client
Assumes clients attend 3 sessions of day care per week.
Occupancy No current information is available.London multiplier 1.20 x (A to B)
1.33 x (D to E) Relative London costs are drawn from the same source as the base data for each cost element.1,2,3
Unit costs available 2012/2013 £57 per day (includes A to D).
1 Health & Social Care Information Centre (2013) PSS EX1 2011/12, Health & Social Care Information Centre, Leeds. 2 Building Cost Information Service (2013) Surveys of tender prices, Royal Institute of Chartered Surveyors, London. 3 Personal communication with the Department for Communities and Local Government, 2011.

82 Unit Costs of Health and Social Care 2013
5.4 Home care The mean (median) gross weekly expenditure on home care per adult aged under 65 with a physical disability is £201 (£200). Assuming home care is provided 7 days a week, the mean and median weekly expenditure is £29. See table 11.6 for more information on home care.

Unit Costs of Health and Social Care 2013 83
6. Services for children and their families
6.1 NHS reference costs for children’s health services 6.2 Care home for children—local authority 6.3 Care home for children—non-statutory sector 6.4 Local authority foster care for children 6.5 Social services support for children in need 6.6 Key worker services for disabled children and their families 6.7 End-of-life care at home for children 6.8 Multi-systemic therapy (MST) 6.9 Adoption 6.10 Multidimensional treatment foster care 6.11 Decision-making panels 6.12 Short break provision for disabled children and their families 6.13 Local safeguarding children’s boards 6.14 Incredible Years parenting programme 6.15 Parenting programmes for the prevention of persistent conduct disorder 6.16 Parent training interventions for parents of disabled children with sleep problems

84 Unit Costs of Health and Social Care 2013

Unit Costs of Health and Social Care 2013 85
6.1 NHS reference costs for children’s health services We have drawn on the NHS Trust and Primary Care Trusts combined to report from the NHS reference costs of selected children’s health services.1 All costs have been uprated to 2012/2013 levels using the HCHS pay & prices inflator. Each reported unit cost includes: (a) direct costs – which can be easily identified with a particular activity (e.g. consultants and nurses) (b) indirect costs – which cannot be directly attributed to an activity but can usually be shared among a number of activities (e.g. laundry and lighting) (c) overheads – which relate to the overall running of the organisation (e.g. finance and human resources). For information on the method used to allocate drugs to services, see NHS reference costs guidance for 2011-2012.1
Lower quartile Upper quartile National averageCOMMUNITY SERVICES Therapy services Physiotherapy group (one-to-one) Occupational therapy group (one-to-one) Speech therapy services group (one-to-one)2 All community paediatrician services (excluding Treatment Function Code (TFC) and vaccination programmes) Weighted average of face-to-face contacts Weighted average of non-face-to-face contact Community nursing services for children Vaccination programmes School-based children’s health services Health visiting services: vaccination and immunisation
£73 (£53) £79 (£79) £41 (£73)
£195 £115
£55
£14 £20
£105 (£92) £165 (£141) £109 (£101)
£333 £233
£113
£36 £31
£101 (£76)
£138 (£116) £90 (£91)
£289 £181
£95
£27 £26
OUTPATIENT ATTENDANCES Weighted average for all paediatric services n/a
n/a
£172
MENTAL HEALTH Day care facilities — regular attendances Child and adolescent medium secure services Specialist inpatient services (weighted average of eating disorder, alcohol and drug services) Mental health inpatients (children and adolescents)
£131
£1141
£333
£538
£379
£1503
£630
£730
£300
£1339
£487
£647
1 Department of Health (2013) NHS reference costs 2011-2012, https://www.gov.uk/government/news/financial-year-2011-to-2012-reference-costs-published [accessed 2 October 2013]. 2 Law, J., Zeng, B., Lindsay, G. & Beecham, J. (2012) Cost-effectiveness of interventions for children with speech, language and communication needs
(SLCN): a review using the Drummond and Jefferson (1996) 'Referee's Checklist', International Journal of Language and Communication Disorders, 47, 5, 477-486.

86 Unit Costs of Health and Social Care 2013
6.2 Care home for children — local authority This table presents the costs per resident week for a local authority care home for children. Establishment costs are £2,964 per resident week. All costs have been uprated using the PSS pay & prices index. For more information on the market in children’s care homes see DfES Children’s Services: Children’s Homes and Fostering,1 and for information on secure children’s homes see Mooney et al. (2012).2 Costs and unit estimation
2012/2013 value
Notes
Capital costs (A & B) A. Buildings
£112 per resident week
Based on the new-build and land requirements for local authority children’s homes. These allow for 59.95 m2 per person.3 Capital costs are discounted at 3.5 per cent over 60 years. This remains unchanged from last year.
B. Land £13 per resident week
Based on statistics provided by the Department for Communities and Local Government.4 Land costs have been annuitised at 3.5 per cent over 60 years. This remains unchanged from last year.
C. Total local authority expenditure (minus capital)
£2,839 per resident week
Mean costs for children looked after in own-provision children’s homes are based on the underlying data of the Section 2515 of the Department for Education’s Financial Data collection for outturn 2011/126 and the Children’s homes data pack (2013).7 The cost for a child for a week in an own-provision residential care home was £2,839. This was calculated by dividing net current expenditure for local authority (LA) provision children’s care homes (£323,793,084) by the number of LA provision care days for children in residential care (763,209).5 We have excluded capital charges for buildings and uprated costs using the PSS pay & prices inflator. Local authorities reporting costs of more than £14,000 per week (£2,000 per day) have been excluded. This estimate differs from what is reported in the children’s homes data pack (2013).7 There, the mean spend on LA provision is reported as £4,135 per child per week. The difference is due to the method used to calculate the average and a different handling of outliers. LAs reporting costs of more than £14,000 per week are not excluded in that analysis and the average spend refers to the average of each individual LA’s average spend per week.
D. Agency overheads
Most of the direct social work costs and the commissioning costs for children’s services have been excluded from these estimates. Also excluded are occupational therapy services and child protection social work costs.
E. Other costs
No current information available on the costs of external services received. See previous editions of this publication for sources of information.
Use of facility by client
52.18 weeks
Occupancy No current information available. See previous editions of this volume for sources of information.
London multiplier 1.20 x A2.73 x B 1.11 x C
Relative London costs are drawn from the same source as the base data for each cost element.3,4,7
Unit costs available 2012/2013 £2,964 establishment costs per resident week (includes A to C).
1 Department for Education (2006) DfES children’s services: children’s homes and fostering, PricewaterhouseCoopers, London. 2 Mooney, A., Statham, J., Knight, A. & Holmes, L. (2012) Understanding the market for secure children’s homes, Summary Report, A rapid response study
for the Department for Education, Childhood Wellbeing Research Centre, Loughborough. 3 Building Cost Information Service (2013) Surveys of tender prices, Royal Institute of Chartered Surveyors, London. 4 Personal communication with the Department for Communities and Local Government, 2011. 5 Department for Education (2012) Underlying data of the section 251 data archive: outturn data-detailed level 2008-09 onwards, outturn summary 2011-
12, Department for Education, London. www.education.gov.uk/schools/adminandfinance/financialmanagement/schoolsrevenuefunding/section251/archive/b0068383/section-251-data-archive/outturn-data---detailed-level-2008-09-onwards [accessed 9 October 2013].
6 Department for Education (2011) Children looked after in England including adoption and care leavers, year ending 31 March 2012, SSDA903. Data provided by DfE. http://www.education.gov.uk/rsgateway/DB/SFR/s001084/index.shtml [accessed 1 October 2013].
7 Department for Education (2013) Children’s homes data pack, http://media.education.gov.uk/assets/files/pdf/c/childrens%20homes%20data%20pack%20march%202012.pdf [accessed 9 October 2013].

Unit Costs of Health and Social Care 2013 87
6.3 Voluntary, private and independent sector care homes for children This table presents the costs per resident week for a non-statutory care home for children. Establishment costs are £3,282 per resident week. See DfES Children’s Services: Children’s Homes and Fostering, for information on the market in children’s care homes.1 Costs and unit estimation
2012/2013 value
Notes
Capital costs (A &B) A. Buildings
£112 per resident week
Based on the new-build and land requirements for local authority children’s homes. These allow for 59.95 m2 per person.2 Capital costs are discounted at 3.5 per cent over 60 years. This remains unchanged from last year.
B. Land £13 per resident week
Based on Department for Communities and Local Government statistics.3 Land costs have been annuitised at 3.5 per cent over 60 years. This remains unchanged from last year.
C. Total expenditure (minus capital)
£3,157 per resident week
Mean costs for children looked after in externally provided children’s homes (e.g. non local authority (LA) own provision) are based on the underlying data of the Section 2514 of the Department for Education’s Financial Data collection for outturn 2011/125 and the Children’s homes data pack (2013).6 The cost for a child for a week in a non-statutory residential care home for children was £3,157. This was calculated by dividing net current expenditure for other provision children’s care homes (£646,305,437) by the number of care days in non-LA provision for children in residential care (1,380,095).4 We have excluded capital charges for buildings and uprated costs using the PSS pay & prices inflator. The number of local authorities reporting costs of more than £14,000 per week (£2,000 per day) have been excluded. This estimate differs from what is reported in the children’s homes data pack (2013).6 There, the mean spend on homes not run by the LA is reported as £3,860 per child per week. The difference is due to the method used to calculate the average and a different handling of outliers. Local authorities reporting costs of more than £14,000 per week are not excluded in that analysis and the average spend refers to the average of each individual LA’s average spend per week.
D. Agency overheads Most of the direct social work costs and the commissioning costs for children’s services have been excluded from these estimates. Also excluded are occupational therapy services and child protection social work costs.
E. Other costs External services
No current information available on the costs of external services received.See previous editions of this publication for sources of information.
Use of facility by client 52.18 weeks Occupancy No current information available. See previous editions of this volume for
sources of information. London multiplier 1.20 x A
2.73 x B 1.07 x C
Relative London costs are drawn from the same source as the base data for each cost element.2,3,6
Unit costs available 2012/2013 £3,282 establishment costs per resident week (includes A to C).
1 Department for Education (2006) DfES children’s services: children’s homes and fostering, PricewaterhouseCoopers, London.
https://www.education.gov.uk/publications/RSG/publicationDetail/Page1/RW74 [accessed 9 October 2013]. 2 Building Cost Information Service (2013) Surveys of tender prices, Royal Institute of Chartered Surveyors, London. 3 Personal communication with the Department for Communities and Local Government, 2011. 4 Department for Education (2012) Underlying data of the section 251 data archive:outturn data-detailed level 2008-09 onwards, outturn summary 2011-
12, Department for Education, London. www.education.gov.uk/schools/adminandfinance/financialmanagement/schoolsrevenuefunding/section251/archive/b0068383/section-251-data-archive/outturn-data---detailed-level-2008-09-onwards [accessed 9 October 2013].
5 Department for Education (2011) Children looked after in England including adoption and care leavers, year ending 31 March 2012, SSDA903. Data provided by DfE, http://www.education.gov.uk/rsgateway/DB/SFR/s001084/index.shtml [accessed 1 October 2013].
6 Department for Education (2013) Children’s homes data pack, http://media.education.gov.uk/assets/files/pdf/c/childrens%20homes%20data%20pack%20march%202012.pdf [accessed 9 October 2013].

88 Unit Costs of Health and Social Care 2013
6.4 Local authority foster care for children This table provides the cost of local authority foster care for children. For information on multidimensional treatment foster care, see table 6.10 of this volume. See Holmes & Soper (2010)1 and Department for Education (2006)2 for more information on the costs of foster care. Costs and unit estimation
2012/2013 value
Notes
A. Boarding out allowances, administration and the costs of social worker and other support staff who support foster carers
£408 per child per week
Using Section 2513 data and dividing total net expenditure for own-provision foster care of £731,928,773 by the total number of days of care (12,553,520),4 the cost per day for 2011/12 was £58 (£408 per week) and £408 when uprated to 2012/13 prices using the PSS pay & prices inflator. Using Section 251 and dividing total net expenditure for all foster care (includes own-provision, private, other public and voluntary foster care) of £1,376,869,0813 by the total number of activity days (17,968,000),4 the cost per day for all provision foster care for 2011/12 was £77 (£536 per week) and £538 when uprated using the Personal Social Services (PSS) pay & prices inflator.
B. Social services (including cost of social worker and support)
£228 per child per week
Although Section 251 data includes the costs of social workers and staff who support foster carers, it excludes social work costs related directly to the fostered children. The majority of children looked after are in foster placements and the mean cost of social services support from fieldwork teams and centres (costed staff/centre time) has been estimated from the Children in Need (CiN) census 20055 and has been uprated to current levels using the PSS pay & prices inflators. At 2012/2013 prices, this was £228 per child per week.
C. Other services, including education
No current information available on the costs of other external services received. See previous editions of this publication for sources of information.
Service use by client 52.18 weeks per year
London multiplier 1.72 x A Relative London costs are drawn from the same source as the base data.2
Unit costs available 2012/2013
£636 per child per week
1 Holmes, L. & Soper, J. (2010) Update to the cost of foster care, Loughborough University, Loughborough. 2 Department for Education (2006) DfES children’s services: children’s homes and fostering, PricewaterhouseCoopers, London.
https://www.education.gov.uk/publications/RSG/publicationDetail/Page1/RW74 [accessed 9 October 2013]. 3 Department for Education (2012) Section 251 data archive: outturn data-detailed level 2008-09 onwards, outturn summary 2011-12, Department for
Education, London. www.education.gov.uk/schools/adminandfinance/financialmanagement/schoolsrevenuefunding/section251/archive/b0068383/section-251-data-archive/outturn-data---detailed-level-2008-09-onwards [accessed 9 October 2013].
4 Department for Education (2011) Children looked after in England including adoption and care leavers, year ending 31 March 2011, SSDA903. Data provided by DfE, http://www.education.gov.uk/rsgateway/DB/SFR/s001084/index.shtml [accessed 1 October 2013].
5 Department for Education and Skills (2005) Children in need in England: results of a survey of activity and expenditure as reported by local authority social services’ children and families teams for a survey week in February 2005, Department for Education and Skills, London.

Unit Costs of Health and Social Care 2013 89
6.5 Social services support for children in need Until 2005, the Children in Need census was a biennial survey which collected information on the numbers and characteristics of children in need: that is, children receiving social services support. The unit costs of these services were also published for a survey week in February 2005 which included 234,700 children.1 Since 2008/09, the Children in Need census has been annual, but has contained slightly different information. In 2008/09, although financial information was collected, rather than being for a sample week as in previous censuses, the collection covered six months. Further differences between these two surveys are discussed in Mahon (2008).2 In this table, therefore, we present information collected in 2005 which is based on services received by each child seen during a survey week in February. These costs have been uprated to 2012/2013 costs using the PSS pay & prices inflators. At 2012/2013 prices, the average weekly cost for looked-after children was £776, while for children supported in their families or independently, the cost was £160, with an average cost per child in need of £331. For care package costs which provide examples of the support received by children in need, see tables 6.5.1-6.5.4. Three types of expenditure are captured in the tables below: 1) The costs of field and centre staff time carrying out social services activities with, or on behalf of, identified children in need and their families. 2) The costs of providing care and accommodation for children looked after (and similar regular, ongoing expenditure that can be treated in the same way). 3) One-off or ad hoc payments and purchases for children in need or their families.
6.5.1 Social services’ costs per child per week by region Location
Children supported in
families or independently
Children looked after Total
Total no. of
children
Average cost
per child
Total no.of
children
Average cost
per child
Total no. of children
Average costper child
All shire counties All unitary authorities All metropolitan districts All London authorities England
60,265 35,235 40,760 32,490
168,750
£143£143 £154 £223 £160
22,87512,115 18,685 12,230 65,900
£731£839 £696 £936 £776
83,140 47,350 59,445 44,720
234,650
£303£320 £325 £417 £331
1 For further information on this survey see http://www.education.gov.uk/rsgateway/DB/SFR/s001084/sfr20-2012md.pdf [accessed 9 October 2013]. 2 Mahon, J. (2008) Towards the new children in need census, York Consulting,
https://www.education.gov.uk/publications/standard/publicationDetail/Page1/DCSF-RW039 [accessed 9 October 2013].

90 Unit Costs of Health and Social Care 2013
6.5.2 Social services costs per child per week by need category Need category1
Children supported in
families or independently Children looked after
Total no. of children
Mean cost per child
Total no. of children Mean cost per child
Abuse/neglect Disability Parental illness or disability Family in acute stress Family dysfunction Socially unacceptable behaviour Low income Absent parenting Cases other than children in need Cases not stated
50,90021,100 8,400
20,000 23,400 12,200 3,900 5,500 8,000
15,400
£160£183 £160 £137 £148 £183 £171 £228 £148 £148
36,000 8,700 3,200 4,100 6,400 1,800 270
4,400 460 660
£742£742 £696 £970 £879
£1,370 £754 £685 £662 £537
6.5.3 Average cost (£ per week) per child receiving support: by service categories
Children supported infamilies or independently
Children looked after Total
Mean cost per child Mean cost per child Mean cost per childCosts for staff/centre time Ongoing costs One-off costs Total costs
£131£23 £6
£160
£228£542 £11
£776
£160£166
£5 £331
6.5.4 Average cost (£ per week) for identified groups of children Children supported in
families or independently Children looked after Total
Mean hours
per child Mean costper child
Mean hoursper child
Mean cost per child
Mean hours per child
Mean cost per child
Asylum-seeking children Disabled children Autistic children All children
1.5 2.5 2.6 2.3
£251£183 £188 £160
2.43.0 2.8 3.5
£685£811 £942 £777
1.8 2.7 2.7 2.7
£405£400 £480 £331
1 As specified in Department for Education and Skills (2005) Children in need in England: results of a survey of activity and expenditure as reported by local
authority social services’ children and families teams for a survey week in February 2005, Department for Education and Skills, London.

Unit Costs of Health and Social Care 2013 91
6.6 Key worker services for disabled children and their families Key workers provide a single point of contact for disabled children and their families, supporting them and facilitating access to other services. Both key workers and the families supported see the key worker role as providing information and advice, identifying and addressing needs, accessing and co-ordinating services for the family, providing emotional support, and acting as an advocate. Research has shown that key worker services generate good outcomes for families, and provision is encouraged through central government policy. In 2004/05, research was carried out in seven sites providing key worker services to explore the effectiveness of different models and also to calculate costs.1,2 In total, 205 families returned questionnaires of which there were 189 valid responses. Predominantly, key workers included in the study came from four professional backgrounds: health visiting, nursing, teaching and social work. However, parents, paediatricians, dietitians, speech therapists, occupational therapists, physiotherapists and early years workers also acted as key workers. The children supported by these seven key worker services had a range of diagnoses, of which autistic spectrum disorders, cerebral palsy and developmental delay were the most common. Most children had more than one condition. The table below shows that the average cost per working hour for the seven services was £34, ranging from £24 to £42. This has been calculated by dividing the total cost by the total number of hours for which staff members undertook key-working activities. The unit cost is, therefore, weighted for the staff-mix on each service. Over a three-month period, the mean and median costs of contact, taking into account telephone calls and the costs of visits, were £151 and £87 respectively. All costs have been uprated to reflect 2012/2013 prices. Assuming this level of contact to be constant over 12 months, annual average contact costs would be £605. Using information provided by 11 key workers reporting time use, the contact to other activity ratio is 1:1.6 (for each hour spent in contact with the family, two and a half hours are spent on activities such as travel, liaison, meetings etc.). At 2012/2013 prices, the total cost of all participating schemes was £2,254,755 and this total caseload was 1,237, giving an average annual cost per family across the schemes of £1,823. Use and costs of key worker services in three months prior to surveyService Cost per
working hour
Mean number ofvisits
(range)
Mean number oftelephone calls
(range)
Mean cost of visits and telephone calls
Median cost of visitsand telephone calls
A £26 2.9 (0-8) 6.7 (1-16) £143 £125B £42 2.7 (0-24) 5.0 (0-60) £185 £90C £36 3.6 (0-10) 5.4 (1-80) £189 £141D £38 1.9 (0-12) 2.5 (0-12) £108 £60E £38 2.8 (0-20) 4.6 (0-50) £184 £114F £32 4.4 (0-12) 2.5 (0-12) £111 £75G £24 1.4 (0-6) 2.1 (0-6) £39 £24Total/average £34 2.8 (0-24) 4.4 (0-60) £151 £87
1 Greco, V., Sloper, P., Webb, R. & Beecham, J. (2005) An exploration of different models of multi-agency partnerships in key worker services for disabled
children: effectiveness and costs, Social Policy Research Unit, University of York. 2 Beecham, J., Sloper, P., Greco, V. & Webb, R. (2007) The costs of key worker support for disabled children and their families, Child: Care, Health and
Development, 33, 5, 611-618.

92 Unit Costs of Health and Social Care 2013
6.7 End-of-life care at home for children Information for this table has been provided by Rhiannon Edwards and Jane Noyes at Bangor University and was taken from the My Choices project report1 which provided a summary of the proposed additional costs associated with providing palliative care at home (assuming care is provided for one week, 24 hours per day). Costs and unit estimation
2012/2013 value Notes
A. Wages/salary £278,292 per year Based on the mean basic salaries for 5.5 community nurses (band 6), 1 specialist palliative care nurse (band 7), 0.2 medical equipment technician (band 6), 0.5 clinical psychologist (band 7) and 15 band 7 nurses, each working 100 hours per year.
B. Salary oncosts £68,933 per year Employer’s national insurance plus 14 per cent of salary for employer’s contribution to superannuation.
C. Overheads Staff costs
£20,443 per year
Includes IT and administrative support, 0.5 WTE band 7 and 0.5 WTE band 5 respectively.
D. Travel costs £24,205 per year No travel costs available but the assumption is that they are equivalent to those reported in table 7.5.
Working time 24 hours per day, 52.18 weeks
Unit costs based on 168 hours per week and 58.18 weeks per year.
Unit costs available 2012/2013 Cost per week £7,510; cost per hour £44.70 (if working 24/7).
1 Noyes, J., Hain, R., Tudor Edwards, R., Spencer, L., Bennett, V., Hobson, L., & Thompson, A. (2010) My choices project report, Bangor University, CRC
Cymru, Cardiff University School of Medicine, N Warwickshire PCT, Royal College of Paediatrics and Child Health, Public Health Wales NHS Trust, Bath and NE Somerset PCT, http://www.bangor.ac.uk/healthcaresciences/research/My%20Choices%20Project%20Report%20-%2022-09-2011.pdf [accessed 9 October 2013].

Unit Costs of Health and Social Care 2013 93
6.8 Multi-systemic therapy (MST) Multi-systemic therapy (MST) is an intensive family- and community-based treatment programne that focuses on addressing all environmental systems that impact on chronic and violent juvenile offenders: their homes and families, schools and teachers, neighbourhoods and friends (http://mstservices.com/). This table is based on a costing which was undertaken for a randomised controlled trial of interventions for adolescents aged 11-17 years at risk of continuing criminal activity.1 Costs and unit estimation Unit cost
2012/2013 Notes
A. Salary plus oncosts £46,806 per year Based on the salary of a chartered counselling psychologist.1
Employer’s national insurance is included plus 14 per cent of salary for employer’s contribution to superannuation.
B. Overheads Management, administration and estates staff. Non-staff
£9,038 per year £19,645 per year
Taken from NHS (England) Summarised accounts.2 Management and other non-care staff costs were 19.31 per cent of direct care salary costs and included administration and estates staff. Non-staff costs were 41.97 per cent of direct care salary costs. They include costs to the provider for office, travel/transport and telephone, education and training, supplies and services (clinical and general), as well as utilities such as water, gas and electricity.
C. Capital overheads £2,966 per year Based on the new-build and land requirements of NHS facilities andadjusted to reflect shared used of both treatment and non-treatment space. Capital costs have been annuitised over 60 years at a discount rate of 3.5 per cent.
Working time 42.7 weeks per year 37.5 hours per week
Unit costs are based on 1,602 hours per year: 225 working days minus sickness absence and training/study days as reported for NHS staff groups.3
Face-to-face time
1:1.40
The direct: indirect ratio was based on a survey of the three MST therapists who took part in the trial.
Length of sessions 60 minutes Therapy sessions lasted 60 minutes. Unit costs available 2012/2013 £49 per hour; £118 per therapy session.
1 Butler, S., Baruch, G., Hickey, N. & Fonagy, P. (2011) A randomized controlled trial of multi systemic therapy and statutory therapeutic intervention for
young offenders, Journal of the American Academy of Child and Adolescent Psychiatry, 50, 12, 1220-1235.e2. 2 Audit Commission (2012) NHS summarised accounts 2011-2012, NHS, London. 3 Contracted hours are taken from NHS Careers (2012) Pay and benefits, National Health Service, London http://www.nhscareers.nhs.uk/ [accessed 9
October 2013]. Training days as recommended by professional bodies. Working days and sickness absence rates as reported in Health & Social Care Information Centre (2013) Sickness absence rates in the NHS: January 2013 – March 2013.

94 Unit Costs of Health and Social Care 2013
6.9 Adoption In 2013, an overview of the adoption research initiative was published.1 This draws on studies commissioned by the Department for Education (DfE) as part of the Adoption Research Initiative (ARI) to explore issues relating to the implementation of the Adoption and Children Act 2002 in England and Wales. This table draws mainly on information contained in this overview, providing the costs of various stages of the adoption process, from the fees to post-adoption support for families. It also includes information from a routine source: Section 251 of the Department of Education’s financial data collection. All costs have been uprated using appropriate inflators. Local authority expenditure – Section 251 In the Section 251 financial accounts, adoption services include ‘adoption allowances paid and other staff and overhead costs associated with adoption including the costs of social workers seeking new and supporting existing adoptive parents’.2 Based on the outturn accounts for 2011/123 and activity data taken from the Department of Education’s statistical release for children looked after in England,4 the average cost per day for own-provision adoption services was £233. This was calculated by dividing total expenditure (£208,253,640) for own-provision adoption services by the total number of days of care for both own-provision (PR1) and other local authority provision (PR2) (854,114). At 2012/2013 prices, the cost per day for own-provision adoption services is £237. The average cost per day across all adoption services (including the private and voluntary sector) at 2012/2013 prices is £246. This was calculated by dividing total expenditure (£239,712,969) by total number of days of care (984,000) and uprating by the PSS pay & prices index. Inter-agency fees Local authorities (LAs) and voluntary adoption agencies (VAAs) arrange adoptions in England. LAs place children for adoption with their own approved prospective adopters (an ‘internal placement’) or with approved prospective adopters provided by another local authority or by a VAA (an ‘external placement’). VAAs also place a very small number of children relinquished into their care for adoption. Where an external placement is made, an inter-agency fee is charged. This fee enables an agency that has recruited and approved the prospective adopters to recoup their costs. Current fees (2013) are shown in 6.9.1 below (http://www.baaf.org.uk/webfm_send/3161/).
6.9.1 Inter-agency fees Local authorities Costs for 2012/2013Fees for one child £27,000 Fees for two children 150% of the above feeFees for three or more children 200% of the above fee Voluntary adoption agencies Fees for one child £27,000 comprising £18,000 on placement, and £9,000 when the adoption order is
made or 12 months from start of placement, whichever is sooner Ongoing support £750 per month As part of the Adoption Research Initiative, the DfE funded a study to establish whether the inter-agency fee was a good reflection of the expenditure incurred by LAs and VAAs in placing a child or sibling group (Selwyn et al., 2009, 2011).5 Financial accounts for 2007-08 from ten LAs and 17 VAAs were analysed and the average cost per adoptive placement was estimated as £37,200 for a VAA, and £35,000 for LAs, when expenditure on inter-agency fees had been excluded. The inter-agency fee in 2009 was £24,080 for a VAA, or around three-quarters of the estimated cost per placement in a typical
1 Thomas, C. (2013) Adoption for looked after children: messages from research, British Association for Adoption & Fostering (BAAF). 2 www.education.gov.uk/childrenandyoungpeople/strategy/financeandfunding/section251/a00191786/outturn-guidance/ [accessed 9 October 2013]. 3 Department for Education (2012) Section 251 data archive: outturn data-detailed level 2008-09 onwards, outturn summary 2010-11, Department for
Education, London. www.education.gov.uk/schools/adminandfinance/financialmanagement/schoolsrevenuefunding/section251/archive/b0068383/section-251-data-archive/outturn-data---detailed-level-2008-09-onwards [accessed 9 October 2013].
4 Department for Education (2011) Children looked after in England including adoption and care leavers, year ending 31 March 2011, SSDA903. Data provided by DfE, see http://www.education.gov.uk/rsgateway/DB/SFR/s001084/sfr20-2012md.pdf [accessed 9 October 2013].
5 Selwyn, J., Sempik, J., Thurston, P. & Wijedasa, D. (2009) Adoption and the inter-agency fee, Centre for Child and Family Research, http://www.bristol.ac.uk/sps/research/projects/current/rk6582a/rk6582afinalreport.pdf [accessed 9 October 2013]. See also Selwyn, J. & Sempik, J. (2011) Recruiting adoptive families: the costs of family finding and the failure of the inter-agency fee, British Journal of Social Work, 41, 415-431.

Unit Costs of Health and Social Care 2013 95 VAA: a shortfall of around £10,000 per placement. ‘Accounts submitted to the Charity Commission 2007-08 suggest VAAs contribute about £3.5 million to adoption services from income received from donations, legacies and investments’ (Selwyn, 2011, p 427).4
Family-finding Linking and matching in adoption is the process of identifying an adoptive family which might best be able to meet the needs of a specific child who is waiting for an adoptive placement. More specifically, linking refers to the process of investigating the suitability of one or more prospective adoptive families who might meet the needs of a certain child or sibling group, based on their prospective adopter reports. Matching refers to the process whereby a local authority decides which prospective adoptive family is the most suitable to adopt a particular child. This family will be identified as a ‘match’ for the child or sibling group at the Adoption Panel, but the large variation in the way adoption panels are implemented means these costs are difficult to estimate.
Information has been drawn from a survey of adoption agencies (Dance et al., 2008),1 and 6.9.2 shows how much social worker time was spent on the relevant activities required to produce the assessment form for a prospective adoptive family. The number of hours spent on each activity was broadly in line with other research (Selwyn et al., 2006).2 Many other activities are undertaken as part of the adoption process, including completing the various legal procedures, writing reports for adoption panel meetings, and preparing and introducing children and adoptive families. Each of these activities will involve considerable amounts of social work time and input from other professions, thereby adding to the costs shown here.3 The average cost to the adoption agency of these four sub-processes amounts to £6,344. Costs for participating teams were estimated during the study and have been uprated from 2007/08 prices using the PSS pay & prices inflator.
6.9.2 Cost estimation of adoption activities Costs 2012/2013Child assessment 55 social work hours (over four months) £2,622Adopter’s assessment 64 social work hours (over six months) £2,308Preparing child’s profile 6 social work hours £154 Family-finding process – talking to children, families and professionals as part of the linking process
16 social work hours £1,259
Total 141 social work hours £6,344 Helping birth families A study undertaken by Neil & colleagues (2010)4 and commissioned by the DfE aimed to estimate the cost of providing support services to birth relatives over 12 months. Seventy-three birth relatives were interviewed, and 57 (78%) were re-interviewed approximately 15 months later. Case workers completed diaries to record time spent on each of the various services provided to birth relatives, and other agencies provided information about the number and type of services provided for each person in the interview sample over one year. For each type of support, a unit cost was taken from the 2007 volume of the Unit Costs of Health and Social Care. The unit costs were combined with each person’s use of support services to calculate the total costs of support. Costs have been uprated using the PSS pay & prices inflator. Birth relatives were reported to have used 8.35 support services (range 0 to 70) over the 12-month study period at an average cost of £560 (range £0 to £4,997). Services included a telephone line for out-of-hours support, drop-in sessions, duty sessions, following referrals by telephone, providing venues for meetings, and liaison with other service providers. All other services were excluded from the cost estimates. The research was completed before the current consultation on the review of contact arrangements http://www.education.gov.uk/childrenandyoungpeople/families/adoption/a00212027/.
1 Dance, C., Ouwejan, D., Beecham, J. & Farmer, E. (2008) Adoption agency linking and matching practice in adoption in England and Wales, Survey
Findings, Department for Education, Research Brief DCSF-RBX-16-08. https://www.education.gov.uk/publications/standard/publicationDetail/Page1/DCSF-RBX-16-08/ [accessed 9 October 2013].
2 Selwyn, J., Sturgess, W., Quinton, D. & Baxter, C. (2006) Costs and outcomes of non-infant adoptions, BAAF, London. 3 Dance, C., Ouwejan, D., Beecham, J. & Farmer, E. (2010) Linking and matching: a survey of adoption agency practice in England and Wales, BAAF,
London. 4 Neil, E., Cossar, J., Lorgelly, P. & Young, J. (2010) Helping birth families: a study of service provision, costs and outcomes.
http://www.adoptionresearchinitiative.org.uk/study5.html [accessed 9 October 2013]. See also consultation on the review of contact arrangements for children in care and adopted children and on the placement of sibling groups for adoption, http://www.education.gov.uk/childrenandyoungpeople/families/adoption/a00212027/ [accessed 9 October 2013].

96 Unit Costs of Health and Social Care 2013 Supporting direct contact after adoption A study undertaken by Neil & colleagues (2010)1 explored services provided to support post-adoption contact in ‘complex’ cases, i.e. direct contact where agencies had an ongoing role in the contact. They reported that the average adoptive family was estimated to have used contact support services 12 times over a 12-month period at a mean total cost of £1,074 (range £0-£4,356). The average birth relative used contact support services 8.9 times over a 12-month period, at a mean total cost of £814 (range £0-£2,133). Post-adoption support for adoptive parents A legal framework for the provision of adoption support is set out in the Adoption and Children Act 2002 and the Adoption Support Services Regulations 2005 (Department of Health, 2005; Bonin et al. 2013).1,2 Families have a right to an assessment of their support needs and may be entitled to (means-tested) financial support, access to support groups, support for contact with birth relatives, and therapeutic services that support the relationship between children and their adoptive parents, including training to meet the child’s needs, respite care and assistance in cases of disruption.
Bonin et al. (2013)1 provide the costs of services over a six-month period through data collected from 19 adoptive parents six months after a child (average age 23 months) had been placed with them. Table 6.9.3 shows that the total mean public sector cost for support services was £3,953 (uprated from 2007/08 prices), rising to £7,078 if financial support is included.
6.9.3 Services received by adoptive parents Service or support Mean costs (sd) Range (lower) Range (upper)Adoption support & social care £2,326 £823 £6,265Health care £505 £0 £1,948Education support £10 £0 £114 Specialist services £111 £0 £1,284Total cost of services £3,953 £1,018 £6,515Financial support £4,125 £0 £22,113Total cost (services and financial support)
£7,078 £1,372 £23,132
Financial support includes Adoption Allowances (n=6 families), settling-in grants (n=7), reimbursed expenses over the introductory period (n=8), and benefits and tax credits. In a more recent study, 61 adoptive parents caring for 94 children were interviewed; 88 per cent were reimbursed for expenses during introductions, 70 per cent had received a settling-in grant, and 26 per cent received an Adoption Allowance (Selwyn et al., 2009).2 Another study funded through the Adoption Research Initiative reported costs of £3,225 (uprated from 2006/07 prices using the PSS pay & prices inflator) for adopters of children with severe behavioural difficulties, estimated over an average of 12 months of the placement (Sharac et al., 2011).3 Social work was at the heart of adoption support, accounting for nearly half (44%) of costs. Use of education support (20% of total costs), health care (13%) and other services such as day care and home help (23%) were also recorded.
1Neil, E., Cossar, J., Jones, C., Lorgelly, P. & Young, J. (2010) Helping birth relatives and supporting contact after adoption, Adoption Research Initiative,
http://www.adoptionresearchinitiative.org.uk/summaries/ARi_summary_8.pdf [accessed 23 October 2013]. 2 Selwyn, J., Sempik, J., Thurston, P. & Wijedasa, D. (2009) Adoption and the inter-agency fee, University of Bristol, Bristol. 3 Sharac, J., McCrone, P., Rushton, A. & Monck, E. (2011) Enhancing adoptive parenting: a cost-effectiveness analysis, Child and Adolescent Mental Health,
16, 2, 110-115. See also http://www.adoptionresearchinitiative.org.uk/study6.html [accessed 9 October 2013].

Unit Costs of Health and Social Care 2013 97
6.10 Multidimensional treatment foster care (MTFC) Multidimensional treatment foster care (MTFC) is a programme of intervention designed for young people who display emotional and behavioural difficulties. It is based on social learning and attachment theories, and provides intensive support in a family setting. A multidisciplinary team of professionals works with foster carers to change behaviour through the promotion of positive role models. Placements are intensive and tailored to the child’s specific needs, with 24-hour support to carers. The specialised team of professionals is responsible for the planning and delivery of the programme, and each practitioner has a clearly-defined role. The core team consists of a programme supervisor, individual therapist, birth family therapist, skills worker, administrator, foster carer recruiter and education worker; additional staff may be appointed in some local authorities (see table 6.4 for information on local authority foster care for children). Research was carried out by the Centre for Child and Family Research, Loughborough University, to calculate the costs of multidimensional treatment foster care1,2 and to analyse how these costs compare with those of other types of provision for young people with similar needs. This research built on a previous study to explore the costs and outcomes of services provided to looked-after children, and the calculation of unit costs of eight social care processes.3 The process costs shown below align with those in the tables for children in care (8.6.1-8.6.4); in particular the high-cost children. Costs per hour have been calculated using Curtis (2007)4 and include overheads and capital costs. For each process, the salary and overhead costs have been multiplied by the time spent by the practitioners involved to calculate the unit costs. The costs tabulated below for providing and maintaining the placement account for over 90 per cent of the costs of a care episode, but exclude the set-up costs. Costs have been uprated from 2006/2007 to 2012/2013 prices using the PSS pay & prices inflators.
6.10.1 Costs of eight social care processes for MTFC Process number MTFC cost per child
(2012/2013 prices) Process one: decision to place and finding first MTFC placement £9,575 Process two: care planning £246 Process three: maintaining the placement (per month) £7,241 Process four: leaving care/accommodation £476 Process five: finding subsequent MTFC placement £8,899 Process six: review £679 Process seven: legal process £4,791 Process eight: transition to leaving care services £2,123
6.10.2 Process costs for other types of provision for young people Process number LA foster care in LA area
(2012/2013 prices) Agency/foster care in LA area
(2012/2013 prices) Agency residential in LA area (2012/2013 prices)
Process one £1,198 £1,701 £1,510Process two £246 £246 £246Process three £3,752 £5,427 £10,405Process four £476 £476 £476Process five £537 £1,071 £1,092Process six £813 £813 £813Process seven £4,791 £4,791 £4,791Process eight £2,123 £2,123 £2,123
1 Holmes, L., Westlake, D. & Ward, H. (2008) Calculating and comparing the costs of multidimensional treatment foster care, Report to the Department for
Children, Schools and Families, Loughborough Centre for Child and Family Research, Loughborough University. 2 Holmes, L., Ward, H. & McDermid, S. (2012) Calculating and comparing the costs of multidimensional treatment foster care in English local authorities,
Children and Youth Services Review, 34, 2141-2146. 3 Ward, H., Holmes, L. & Soper, J. (2008) Costs and Consequences of Placing Children in Care, Jessica Kingsley, London. 4 Curtis, L. (2007) Unit Costs of Health and Social Care 2007, Personal Social Services Research Unit, University of Kent, Canterbury.

98 Unit Costs of Health and Social Care 2013
6.11 Decision-making panels A number of studies carried out by the Centre for Child and Family Research, at Loughborough University have explored the costs of decision-making panels across Children’s Services; these include the Common Assessment Framework (CAF)1, short-break services for disabled children and their families,2 and joint commissioning for children with additional needs.3 The joint commissioning panels were held to discuss both looked-after children and children in need cases. Information was gathered from practitioners, managers and administrative staff on the time taken to complete activities prior to, during and after panel meetings. The costs of the Common Assessment Framework and short-breaks panels are based on data provided by two local authorities. The joint commissioning panel is based on information gathered in one local authority. The activity times for each personnel type involved in the three panels are shown in the table below.
Activity times for CAF, short breaks for disabled children and their families and joint commissioning for children with additional needs panels by personnel type
Panel
Activity times
Panel member Social worker Principalmanager Administrator
Lead professional
CAF panel 1 hour 10 minutes N/A N/A 5 hours
Short breaks panel 3 hours 20
minutes 1 hour 45 minutes N/A 4 hours 40 minutes N/A
Joint commissioning panel
1 hour 45 minutes 2 hours
1 hour 45 minutes 3 hours 20 minutes N/A
Unit costs are calculated by multiplying the number of hours carried out for each process by each type of personnel, by the relevant unit costs per hour. Unit costs per hour are based on average salaries for each staff type using national salary scales including salary oncosts (National insurance and superannuation). Direct, indirect and capital overheads are applied as outlined in the Unit Costs of Health and Social Care (2011).
Personnel type Unit cost per hour Panel member (senior manager) £47 Family support worker £29 Social worker £40 Team manager £47 Administration £28
The cost of the CAF panel is based on twelve panel members, discussing eight cases per meeting. The cost of the short breaks panel is based on five panel members, discussing four cases per meeting. The cost of the joint commissioning panel is based on four panel members, discussing eight cases per meeting.
Cost per case for CAF, short breaks and joint commissioning panels
Panel
Costs per case considered £ Total cost per
case Panel
member Social worker Principal manager Administrator
Lead professional
CAF panel £82.00 £137 £219.10 Short breaks panel £112.10 £62.20 £132.40 £306.60 Joint commissioning panel £41.20 £70.00 £82.50 £94.20 £287.70
1 Holmes, L., McDermid, S., Padley, M. & Soper, J. (2012) Exploration of the costs and impact of the Common Assessment Framework, Department for
Education, London. 2 Holmes, L., McDermid, S. & Sempik, J. (2010) The costs of short break provision, Department for Children, Schools and Families, London. 3 Holmes, L. & Jones, A. (forthcoming) Unit costs of decision making for looked after children and children in need, Loughborough: Centre for Child and
Family Research, Loughborough University.

Unit Costs of Health and Social Care 2013 99
6.12 Short-break provision for disabled children and their families The Centre for Child and Family Research were commissioned by the Department for Children, Schools and Families (now the Department for Education) to calculate the costs incurred by children’s services departments to provide short-break services.1 The average cost of different types of short-break services was estimated, along with the costs of the routes by which families access provision and the ongoing activity undertaken to support the child and family once in receipt of short-break services.1 The study employs a bottom-up costing methodology,2 using social care activity time data as the basis for building up unit costs. See Holmes & McDermid in Curtis (2010) for detailed information on the methods employed.3
The services Short breaks can be delivered in the form of overnight stays, day, evening and weekend activities, and can take place in the child’s own home, the home of an approved carer, or a residential or community setting.4 A range of services and their costs were identified in this study.
Service type Unit Average cost
2012/13 value Range
2012/13 value Mean cost Median cost
Residential Per child per night (24 hour period) £267 £293 £71-£412 Family-based overnight Per child per night (24 hour period) £174 £150 £143-£230 Day care Per child per session (8 hours) £133 £124 £101-£209 Home support Per family per hour £22 £22 £18-£26 Home sitting Per family per hour £19 £19 £11-£27 General groups Per session £338 £386 £99-£625 Afterschool clubs Per session £284 £276 £244-£336 Weekend clubs Per session £316 £317 £301-£329 Activity holidays Per child per break £1,304 £842 £115a-£3,762b a Short break of two days b Short break of seven days The social care processes The study also calculated the costs of social care activity associated with providing short-break services to disabled children and their families. This included the routes by which families were able to access short-break provision, and any ongoing activity undertaken to support the child and family once in receipt of short-break services. Process Out of London cost
2012/2013 value London cost
2012/13 value Referral and assessment processes Local Core Offer eligibility models5 Not available £12a Common Assessment Framework £190a Not available Initial assessment £341a £312a Core assessment £513a £722a Resource panels for short-break services6 £97a £53a Ongoing support Ongoing support £78b £101b Reviews £197a £265a a per process per child b per month per child 1 Holmes, L., McDermid, S. & Sempik, J. (2009) The costs of short break provision: report to the Department for Children, Schools and Families, Centre for
Child and Family Research, Loughborough University. 2 Beecham, J. (2000) Unit Costs – Not exactly child’s play: a guide to estimating unit costs for children’s social care, Department of Health, Dartington Social
Research Unit and the Personal Social Services Research Unit, University of Kent; Ward, H., Holmes, L. & Soper, J. (2008) Costs and consequences of placing children in care, Jessica Kingsley, London.
3 Holmes, L. & McDermid, S. (2010) The costs of short break provision, in L. Curtis (ed.) Unit Costs of Health and Social Care 2011, Personal Social Services Research Unit, University of Kent, Canterbury.
4 Department for Children, Schools and Families (2008) Aiming high for disabled children: short breaks implementation guidance, Department for Children, Schools and Families, London.
5 ‘Local core offer eligibility model’ refers to an access route whereby a local authority offers the provision of a standardised package of short- break services to a specific population of disabled children and young people, who meet an identified set of eligibility criteria.
6 Two of the three participating authorities used panels in deciding how resources may be most usefully deployed to support families. The out of London authority held panels once a fortnight and the London authority held their panel monthly.

100 Unit Costs of Health and Social Care 2013
6.13 Local safeguarding children’s boards Research carried out by the Centre for Child and Family Research examined the cost of local safeguarding children’s boards (LSCBs) as part of a wider study commissioned by the Department for Children, Schools and Families to explore the effectiveness of the boards in meeting their objectives.1 To understand the costs of the LSCB meetings, information was gathered from practitioners, managers and administrative staff on the time taken to complete activities prior to, during and after LSCB meetings. Board members were asked to complete a time use event record to indicate the time they spent on different LSCB activities in the month preceding the LSCB meeting. Activities included: travel to and from meetings, preparation for meetings and provision of feedback to their agency. Data were collected in relation to the main LSCB meetings and subgroup meetings. The activity times are outlined in the table below. Average time spent by board members on LSCB meetings
Activity Average time spent per meetinga Travel 0.89 hours Preparation for meetings 3.07 hours Feedback to own agency 1.33 hours Total 5.29 hours
a Figures do not include the time spent in the meeting. Unit costs are calculated by multiplying the number of hours carried out for each activity by each type of personnel by the relevant unit costs per hour. Unit costs per hour are based on average salaries for each staff type using national salary scales and applying oncosts and overheads as presented in this volume. Six local authority areas contributed to the study. The structure and activities of the LSCBs in these six areas varied considerably. The costs for each of the areas and the overall average cost is shown below uprated to 2012/13 using the appropriate inflators. The costs of local safeguarding children’s boards
LSCB Infrastructure (staffing,
including Chair) per year
Estimated costs of board member attendance at LSCB meetings
Cost of subgroups
Estimated cost per meeting
Estimated cost per year
Area one £131,807 £11,312 £67,875 £65,763
Area two £102,734 £7,071 £42,427 £21,559
Area three £297,038 £17,136 £205,634 £144,398
Area four £95,349* £15,783 £63,134 £78,508
Area five £111,781 £9,393 £56,357 Data not available
Area six £193,537 £16,403 £65,514 Data not availableAverage cost £155,374 £12,850 £83,507 £77,557
*Figures do not include the time spent in the meeting.
1 France, A., Munro, E. & Waring, A. (2010) The evaluation of arrangements for effective operation of the new local safeguarding children boards in
England, Final Report, Department for Education, London.

Unit Costs of Health and Social Care 2013 101
6.14 Incredible Years parenting programme The Incredible Years series includes three interlocking training programmes for parents, children and teachers.1 The parenting programmes are targeted at children up to 12 years of age, and the child and teacher programmes are for children aged 3-8 years. The table below shows costs for the Webster-Stratton Incredible Years basic parenting programme, which were collected in 2003/04 and have been uprated using the hospital and community health services inflators (HCHS). The costs have been calculated using weekly diaries completed by leaders of four groups, and the cost information supplied by the Incredible Years Welsh Office. The figures include costs of weekly attendance at supervision for group leaders. This was required because these leaders were participating in a randomised controlled trial and were relatively inexperienced and were not certified leaders. Generally, supervision for inexperienced leaders would be recommended on a termly basis, with encouragement to work for leader certification. Further details of the study are available from Edwards et al. (2007).2 Set-up costs are not itemised in the table below. These include producing the programme kits and also the training of two leaders, and their travel and supervision time. The total cost for these activities was £4,730 and the total time taken was 53 hours. Costs and unit estimation
2012/2013 value Notes
A. Capital costs premises £3,724 Capital costs were 25 per cent of total costs. B. Salaries and oncosts £7,560 Direct salary and oncosts for running the group included the
recruitment costs (£1,082), supervision costs (£4,590) and group running costs (£1,888). The activities included: - 2 group leaders to recruit parents, including travel time - 2 leaders to run the group - salary in group session preparation time for 2 leaders - supervision time for 2 leaders including travel - trainer costs to deliver supervision
C. Overheads Venue costs and refreshments
£2,263 £1,372
Telephone costs (£50), mileage costs (£805), clerical support costs (£102) and transport and crèche costs (£1,307). Venue costs and refreshments.
Working time Length of programme
379.25 hours 375.25 hours spent by 2 leaders to run the programme.
Unit costs available 2012/2013 Based on 8 parents per group: total costs per child (including set-up costs) £1,862 (£2,453); Based on 12 parents per group: total cost per child (including set-up costs) £1,241 (£1,636).
1 Webster-Stratton, C. & Hancock, L. (1998) Training for parents of young children with conduct problems: content, methods and therapeutic processes, in
C.E Schaefer & J.M. Briesmeister (eds) Handbook of parent training, Vol. 9, September, John Wiley, New York. 2 Edwards, R.T., Céilleachair, A., Bywater, T., Hughes, D.A. & Hutchings, J. (2007) Parenting programme for parents of children at risk of developing conduct
disorder: cost and effectiveness analysis, British Medical Journal, 334, 682-688.

102 Unit Costs of Health and Social Care 2013
6.15 Parenting programmes for the prevention of persistent conduct disorder The most successful parenting programmes targeted at parents of children with or at risk of developing conduct disorder are designed to improve parenting styles and parent-child relationships, in turn having positive effects on child behaviour. This table draws information from a study by Bonin & colleagues (2011)1 which identified the average costs for group-based interventions and one-to-one delivery-based interventions. While there are many different parenting programmes, administered in a variety of formats, often they are group-based lasting between 1.5 and 2.0 hours per week over 8-12 weeks. Tables 6.15.1 and 6.15.2 show the cost of delivering five parenting programmes for which there is evidence of effectiveness. Costs for group-based intervention range from £294-£1,541 with a median of £988 per participant (6.15.1), while for individual interventions (6.15.2) the costs range from £797-£5,853 with a median of £2,152. According to NICE (2007),2 about 80 per cent of parenting programmes can be delivered in a group format, and this figure is used to weight the median costs. The expected intervention cost based on 80 per cent group and 20 per cent individual provision used for the model is therefore £1,213 per participant. All costs have been uprated to 2012/2013 using the appropriate inflators.
6.15.1 Group delivery (Incredible Years, Triple P and Strengthening Families, Strengthening communities)
Median Mean Low High Total practitioner cost (includes time in session, preparation and supervision time) £6,438 £6,274 £1,207 £11,001 Venue hire £935 £885 £534 £1,136 Food and refreshment £488 £462 £279 £592 Childcare £568 £505 £195 £689 Translation services £636 £565 £218 £772 Materials £145 £138 £109 £152 Total cost per session for training, supervision and materials £9,210 £8,829 £2,542 £14,353 Total per person assuming 10 per group £921 £883 £254 £1,435 Total costs of practitioners' training time and fees £2,001 £2,306 £1,410 £3,816 Training/100 (assuming 10 participants per group +10 sessions delivered per training received) £20 £23 £14 38 Per person estimate include a component for training £941 £906 £268 £1,473 Hours of supervision needed x hourly cost of minimum recommended level of supervisor £469 £469 £256 £680 Per person supervision estimate assuming: 10 per group; cost does not depend on number of practitioners; nor the number of programmes run at once £47 £47 £26 £68 Per person estimate including a component for training and supervisor cost £988 £953 £294 £1,541
1 Bonin, E., Stevens, M., Beecham, J., Byford, S. & Parsonage, M. (2011) Costs and longer-term savings of parenting programmes for the prevention of
persistent conduct disorder: a modelling study, BMC Public Health 2011, 11:803 doi:10.1186 1471-2458-11-803. 2 National Institute for Health and Clinical Excellence (2007) Parent-training/education programmes in the management of children with conduct disorders,
National Institute for Health and Clinical Excellence, London.

Unit Costs of Health and Social Care 2013 103
6.15.2 One-to-one delivery (Incredible Years, Triple P, Strengthening Families, Strengthening communities and Helping the Noncompliant Child)
Median Mean Low High Total staff cost (includes session, preparation and supervision time) for one lead practitioner £1,904 £2,711 £758 £5,505 Total food/10 £49 £37 £0 £59 Childcare/10 £57 £40 £0 £69 Translation/10 £64 £45 £0 £78 Materials/10 £14 £12 £1 £15 Total session costs (including preparation, supervision, materials etc.) £2,087 £2,845 £759 £5,726 Training costs (lead practitioner) £682 £668 £487 £853 Training fees £637 £861 £142 £2,111 Total costs of lead practitioner's training time and fees £1,319 £1,529 £629 £2,964
Per person training component/50 (assuming 50 deliveries per training) £26 £31 £13 £59 Total including training component £2,113 £2,876 £772 £5,785 Hours of supervision needed x hourly cost of minimum recommended level of supervisor 384 hrs 452 hrs 256 hrs 680 hrs
Per person supervision estimate assuming: 10 one-to-one programmes delivered per supervisor term; cost does not depend on the number of practitioners £38 £45 £26 £68
Per person estimates include a component for training and supervisor cost £2,152 £2,921 £797 £5,853

104 Unit Costs of Health and Social Care 2013
6.16 Parent training interventions for parents of disabled children with sleep problems This table draws on work carried out by Beresford and colleagues (2012)1 and provides the costs of five different parent training interventions for parents of disabled children with sleep problems. Costs have been updated using current salaries and overhead information. The cost for each programme is an average cost.
Description of programme
Staff (Agenda for Change band/local authority band if provided) FTE unless otherwise noted
Staff sessions and hours (including preparation, delivery, debrief).
Total cost (including programme and staff)
The Ascend Programme is a group-delivered parent-training programme for parents of children with Autistic Spectrum Conditions (ASC). Up to 20 participants per programme.
Clinical psychologist (7), learning disability nurse (7), S&L therapist (5), consultant clinical psychologist (8D), consultant psychiatrist (8DD), learning disability nurse (6), CAMHS therapist (6), social worker assistant, learning disability nurse (7), clinical psychologist (6)
Delivered in 10 weekly sessions of 2-2.5 hours plus final follow up session. In total 46.5 hours were delivered by staff in 4 programmes.
Staff cost£7,626
Programme cost £171 Total
£7,797
The Cygnet programme is a group delivered parent-training programme for parents of children with Autistic Spectrum Conditions, age 7 to 18.
Cygnet co-ordinator, BADASG co-ordinator, child psychologist (8B), consultant clinical psychologist (8D), clinical psychologist (7), social worker, teacher, administrator (level 3), senior CAMHS practitioner (7), 3 STARS workers and a student nurse
Delivered in CAMHS and voluntary sector community facilities in 6- weekly 2.5 hour sessions. There is a reunion session at three months. In total staff delivered 51.5 hours in 6 programmes
Staff cost£3,848
Programme cost £181 Total
£4,029
The Confident Parenting Programme is a 6-week, group-delivered parent-training programme for parents of disabled children (aged 7 to 18 years). A maximum of 12 participants is recommended.
Consultant clinical psychologist (8C), 2 clinical psychologists (7 and 5), head teacher, assistant psychologist (6) and teacher. There are typically 3 members of staff at each session.
The programme has 6-weekly sessions of 2 hours (+1 optional follow-up). In total staff delivered 69 sessions (15 hours) in 4 programmes An additional 40 hours was required to set up the group.
Staff cost£3,978
Programme cost £240
Total cost £4,217
Riding the Rapids is a group- delivered parent-training programme for parents of children with Autistic Spectrum Conditions and other disabilities (aged 4-10).
Clinical psychologist (8b), teaching assistant (TA4), S&L therapist, clinical psychologist, senior nurse, deputy head, community nurse (7), parent facilitator, 2 clinical psychologists, assistant psychologist and a community nurse.
The programme is delivered in 10-weekly sessions of 2 hours. In total 33.5 hours were delivered in 7 programmes
Staff cost£3,133
Programme cost £270
Total cost £3,402
The Promoting Better Sleep Programme is a group-delivered intervention for parents of children with Autistic Spectrum Disorder and/or learning and/or sensory disabilities.
C & A learning disabilities team co-ordinator (7), community learning disability nurse (6), consultant clinical psychologist (8D), autistic spectrum link nurse (4). (Typically 2 members of staff at each session).
A manual-based programme in 4-weekly sessions of 3 hours over 5-6 weeks. In total 32 sessions (16.5 hours) were delivered in 4 programmes.
Staff cost£1,763
Programme cost £117
Total cost £1,880
1 Beresford, B., Stuttard, L., Clarke, S., Maddison, J. & Beecham, J. (2012) Managing behaviour and sleep problems in disabled children: an investigation
into the effectiveness and costs of parent-training interventions, Research Report DFE-RR204a, Department for Education, London.

7. Hospital and other services
7.1 NHS reference costs for hospital services 7.2 NHS wheelchairs 7.3 Local authority equipment and adaptations 7.4 Training costs of health service professionals 7.5 Rapid Response Service 7.6 Hospital-based rehabilitation care scheme 7.7 Expert Patients Programme 7.8 Re-ablement service 7.9 Public health interventions 7.10 Rehabilitation services 7.11 End-of-life care

106 Unit Costs of Health and Social Care 2013

Unit Costs of Health and Social Care 2013 107
7.1 NHS reference costs for hospital services We have drawn on the NHS Trust and Primary Care Trusts combined to report from the NHS reference costs of selected adult health services.1 All costs have been uprated to 2012/13 levels using the HCHS pay & prices inflator. Each reported unit cost includes: (a) direct costs – which can be easily identified with a particular activity (e.g. consultants and nurses) (b) indirect costs – which cannot be directly attributed to an activity but can usually be shared among a number of activities (e.g. laundry and lighting) (c) overheads – which relate to the overall running of the organisation (e.g. finance and human resources). For information on the method used to allocate drugs to services, see reference cost guidance for 2012-2013.1 National
average Lower
quartile Upper
quartile Elective/non elective Health Care Resource Group (HRG) data (average cost per episode) Elective inpatient stays Non-elective inpatient stays (long stays) Non-elective inpatient stays (short stays) Day cases HRG data Weighted average of all stays Outpatient procedures Weighted average of all outpatient procedures
£3,283
£2,581 £598
£697
£135
£2,377
£1,902 £399
£479
£91
£3,891
£3,007 £704
£846
£158 PALLIATIVE CARE Specialist inpatient palliative care (adults only) Specialist inpatient palliative care support (adults only) Outpatient medical specialist palliative care attendance (19 years and over) Outpatient non-medical specialist palliative care attendance (19 years and over)
£348 £116 £195
£95
£163 £59
Not available
Not available
£470 £123
Not available
Not available
AMBULANCE SERVICES (Weighted average of attendances) Calls Hear and treat and refer See and treat and refer
£8
£45 £177
£6 £34
£144
£10 £47
£227 See and treat and convey £235 £197 £266 NB See Transforming NHS ambulance services for further information on paramedic services unit costs.2
1 Department of Health (2013) NHS reference costs 2011-2012,
https://www.gov.uk/government/news/financial-year-2011-to-2012-reference-costs-published/ [accessed 2 October 2013]. 2 National Audit Office (2011) Transforming NHS ambulance services, http://www.nao.org.uk/wp-content/uploads/2011/06/n10121086.pdf [accessed 22
October 2013].

108 Unit Costs of Health and Social Care 2013
7.2 NHS wheelchairs Information about wheelchair costs is based on the results of a study of six sites supplying wheelchairs to adults and older people.1 The study information was supplemented with national data not available from the sites. Three main types are identified: those propelled by an attendant or self-propelled; a lighter type of chair especially designed for active users; and powered wheelchairs. (Active users are difficult to define, but generally refers to individuals who are permanently restricted to a wheelchair but are otherwise well and have high mobility needs.) The cost of modifications are included in the estimated capital value, but this is a very approximate mid-range figure so specific information should be used wherever possible. All costs have been uprated using the retail price index. Although no further studies have been carried out on wheelchairs, current price information suggests that powered wheelchairs range from £700-£3,000 and self- or attendant-propelled wheelchairs range from £100-£650. Type of chair Total value
2012/2013 Annual cost2012/2013
Notes
Capital costs Self- or attendant-propelled Active user Powered
£270 £673 £1,345
£60 £149 £298
Capital value has been annuitised over five years at a discount rate of 3.5 per cent to allow for the expected life of a new chair. In practice, 50 per cent of wheelchairs supplied have been reconditioned, not having been worn out by the time their first users ceased to need them.
Revenue costs Maintenance - non-powered - powered
£29 £114
Revenue costs exclude therapists’ time but include the staff costs of maintenance. The costs include all costs for pressure relief. The cost of reconditioning has not been included in the cost of maintenance.
Agency overheads No estimate of management overhead costs is available. They are likely to be minimal.
Unit costs available 2012/2013 £89 per self or attendant propelled chair per year; £178 per active user per chair per year; £412 per powered chair per year.
1 Personal communication with Richard Murray, National Health Service Management Executive, 1995.

Unit Costs of Health and Social Care 2013 109
7.3 Local authority equipment and adaptations Community equipment refers to any items of equipment prescribed by occupational therapists, physiotherapists and other health staff, designed to help vulnerable or older people and those with disabilities or long-term health conditions to manage everyday tasks independently at home. This table provides the prices for a selection of equipment listed in the TCES National Catalogue of equipment for independent daily living: http://www.national-catalogue.org/smartassist/nationalcatalogue and Equipment for older and disabled people: an analysis of the market (Consumer Focus, 2010).1 The table includes Simple Aids for Daily Living (SADL) and some more complex aids (CADL). SADLs refer to simple pieces of equipment which support mobility and independence at home, work and in other social environments. They require little adaptation and have a relatively low product value, usually below £100. Complex aids to daily living are products, largely provided by the state, to support care in the home setting, such as profiling beds, hoists and standing frames. Excluded from this list is equipment and systems commonly regarded as telecare or telehealth (see Henderson & colleagues article on pages 26-31). Logistics costs (e.g. assessment, storage, delivery and installation) described in Transforming Community Equipment Services (Centre for Economics and Business Research Ltd, 2009) have also been excluded. The period over which adaptations to housing should be annuitised is open to debate. Ideally it should be annuitised over the useful life of the aid or adaptation. In many cases this is linked to the length of time the person using the appliance is expected to remain at home. Where it is expected that the house would be occupied by someone else who would also make use of the equipment, a longer period would be appropriate. Clearly, this is difficult to do in practice. Many housing authorities have problems making sure that heavily adapted dwellings are occupied by people who can make use of the adaptations. Following government guidelines on the discount rate, the items in the table below have been annuitised over 10 years at 3.5 per cent.
7.3.1 Simple aids for daily living Equipment or adaptation Range of total costs Annual equipment
cost (3.5% discount) Adjustable shower stools and chairs £14-£148 £1.80-£18 Perching stool with arms and/or back £23 £2.70 Toilet frame, and seat £30 £3.60 Mobile shower chair £55 £6.60 Bath step £20 £2.50 Standard bath lift, 2 types £303-£330 £36-£40 Linked bed raisers, pair £32 £3.80 Adjustable trolley £34 £4.10 Highback chair £121 £14.50 Variety of indoor and outdoor grab rails £3.40-£91 £0.40-£11 Walking sticks, choice of 6 sizes, types £22-£54 £2.60-£6.40 Commodes £29-£85 £3.40-£10.30
7.3.2 Complex aids for daily living (CADLs) Products falling into this category are generally more complex, require installation and regular servicing and in some cases training of the user or carer. Due to their more complex nature, these items are generally more expensive than simple aids for daily living
Equipment or adaptation Range of total costs Annual equipment cost (3.5% discount)
Mobile seat hoists (powered) £2,505-£5,821 £301-£700 Variable posture beds £626-£8,541 £75-£1,027 Lifting cushions £1,019-£1,646 £123-£198 Backrests with pressure relieving features £351-£650 £42-£78
1 Consumer Focus (2010) Equipment for older and disabled people: an analysis of the market,
http://www.consumerfocus.org.uk/files/2010/11/Equipment-for-older-and-disabled-people-an-analysis-of-the-market.pdf [accessed 9 October 2013].
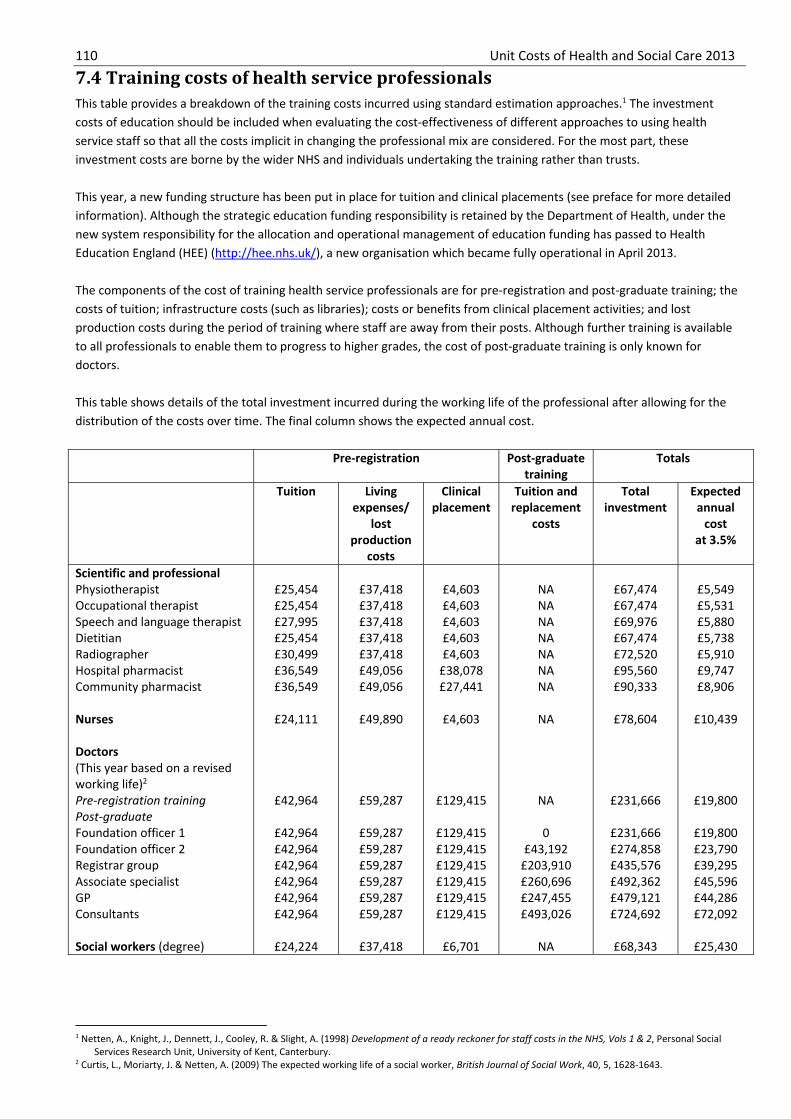
110 Unit Costs of Health and Social Care 2013
7.4 Training costs of health service professionals This table provides a breakdown of the training costs incurred using standard estimation approaches.1 The investment costs of education should be included when evaluating the cost-effectiveness of different approaches to using health service staff so that all the costs implicit in changing the professional mix are considered. For the most part, these investment costs are borne by the wider NHS and individuals undertaking the training rather than trusts. This year, a new funding structure has been put in place for tuition and clinical placements (see preface for more detailed information). Although the strategic education funding responsibility is retained by the Department of Health, under the new system responsibility for the allocation and operational management of education funding has passed to Health Education England (HEE) (http://hee.nhs.uk/), a new organisation which became fully operational in April 2013. The components of the cost of training health service professionals are for pre-registration and post-graduate training; the costs of tuition; infrastructure costs (such as libraries); costs or benefits from clinical placement activities; and lost production costs during the period of training where staff are away from their posts. Although further training is available to all professionals to enable them to progress to higher grades, the cost of post-graduate training is only known for doctors. This table shows details of the total investment incurred during the working life of the professional after allowing for the distribution of the costs over time. The final column shows the expected annual cost. Pre-registration Post-graduate
training Totals
Tuition Living
expenses/ lost
production costs
Clinicalplacement
Tuition and replacement
costs
Total investment
Expectedannual
cost at 3.5%
Scientific and professional Physiotherapist Occupational therapist Speech and language therapist Dietitian Radiographer Hospital pharmacist Community pharmacist Nurses Doctors (This year based on a revised working life)2 Pre-registration training Post-graduate Foundation officer 1 Foundation officer 2 Registrar group Associate specialist GP Consultants Social workers (degree)
£25,454 £25,454 £27,995 £25,454 £30,499 £36,549 £36,549
£24,111
£42,964
£42,964 £42,964 £42,964 £42,964 £42,964 £42,964
£24,224
£37,418 £37,418 £37,418 £37,418 £37,418 £49,056 £49,056
£49,890
£59,287
£59,287 £59,287 £59,287 £59,287 £59,287 £59,287
£37,418
£4,603 £4,603 £4,603 £4,603 £4,603
£38,078 £27,441
£4,603
£129,415
£129,415 £129,415 £129,415 £129,415 £129,415 £129,415
£6,701
NA NA NA NA NA NA NA
NA
NA
0 £43,192
£203,910 £260,696 £247,455 £493,026
NA
£67,474 £67,474 £69,976 £67,474 £72,520 £95,560 £90,333
£78,604
£231,666
£231,666 £274,858 £435,576 £492,362 £479,121 £724,692
£68,343
£5,549 £5,531 £5,880 £5,738 £5,910 £9,747 £8,906
£10,439
£19,800
£19,800 £23,790 £39,295 £45,596 £44,286 £72,092
£25,430
1 Netten, A., Knight, J., Dennett, J., Cooley, R. & Slight, A. (1998) Development of a ready reckoner for staff costs in the NHS, Vols 1 & 2, Personal Social
Services Research Unit, University of Kent, Canterbury. 2 Curtis, L., Moriarty, J. & Netten, A. (2009) The expected working life of a social worker, British Journal of Social Work, 40, 5, 1628-1643.

Unit Costs of Health and Social Care 2013 111
7.5 Rapid Response Service This table is based on a Rapid Response Service located at Folkestone Hospital which serves the Shepway Primary Care Trust Area. It is designed to provide the local community with an alternative to hospital admission or long-term care. The information is based on a description of the service in 2002/2003. Costs and unit estimation
2012/2013 value
Notes
A. Wages/salary £160,996 per year Based on mean Agenda for Change (AfC) salaries. Includes a team of two nurses (band 5), five clinical support assistants (band 2), and two nurse managers (band 7) (0.75 wte)1
B. Salary oncosts £36,748 per year Employer’s national insurance is included plus 14 per cent of salary for employer’s contribution to superannuation.
C. Qualifications Not known D. Training Not known In-house training is provided. The health care assistants often study to
NVQ level. No costs are available. E. Overheads Management, administration and estates staff. Non-staff
£38,184 per year £82,993 per year
Taken from NHS (England) Summarised accounts.2 Management and other non-care staff costs were 19.31 per cent of direct care salary costs and included administration and estates staff. Non-staff costs were 41.97 per cent of direct care salary costs. They include costs to the provider for office, travel/transport and telephone, education and training, supplies and services (clinical and general), as well as utilities such as water, gas and electricity.
F. Capital overheads £2,416 per year Based on the new-build and land requirements of NHS facilities.3,4 One office houses all the staff and ‘hot-desking’ is used. It is estimated that the office measures 25 square metres. Capital has been annuitised at 3.5 per cent.
G. Equipment costs £1,532 per year The service shares equipment with another so the total cost has been divided equally and annuitised over five years to allow for the expected life. Equipment includes facsimile machines, computers etc. Prices have been uprated from 2002/2003 using the retail price index.
H. Travel £24,205 per year Based on information provided by the Trust. Caseload 7 per week The average annual caseload is 364 patients. Hours and length of service
7 days a week (to include weekends and bank holidays) 8.00 am – 9.00 pm (24 hours if required), 365 days per year
The service would provide an intensive package of care, if necessary, over a 24-hour period to meet care needs, and support carers experiencing difficulty due to illness. It would be available for 72 hours and reviewed daily, with the possibility of an extension, up to a maximum of 5 days in exceptional circumstances.
Patient contact hours Low-cost episode High-cost episode
9,646 per year 5 contact hours 43 patient contact hours
Based on information about typical episodes delivered to patients in one year. A low-cost episode comprises, on average, a total of 5 contact hours. A high-cost episode comprises, on average, a total of 43 patient contact hours.
Unit costs available 2012/2013 £36 per delivered hour (excludes cost for enhanced payments, cost of assessments, discharge and travel costs); high-cost episode £1,547; low-cost episode £180; Average cost per case £954.
1 Health & Social Care Information Centre (2013) NHS staff earnings estimates June 2013, Health & Social Care Information Centre, Leeds. 2 Audit Commission (2012) NHS summarised accounts 2011-2012, NHS, London. 3 Building Cost Information Service (2013) Surveys of tender prices, Royal Institute of Chartered Surveyors, London. 4 Personal communication with the Department for Communities and Local Government, 2011.

112 Unit Costs of Health and Social Care 2013
7.6 Hospital-based rehabilitation care scheme This PCT-run rehabilitation unit, based in a hospital in Kent, is supervised by a nurse consultant. The information was collected in 2005/06 just after a quick redesign, but costs reflect current prices, inflated by the HCHS pay & prices index. The unit is managed by a modern matron, but has a strong multi-professional team. The unit is divided into three sections. The first is the ‘assessment area’, where patients go for between 24-72 hours on admission to have their health care needs closely observed and identified. They then go to the ‘progression area’, which is for patients who need moderate to high nursing support and where a rehabilitation programme is provided. Finally, patients move to the ‘independent area’ before returning home. In total there are 38 beds in the unit. Costs and unit estimation
2012/2013 value
Notes
A. Wages/salary £908,036 per year Based on salaries1 for a team of a modern matron (band 8), 3 nurse team managers (band 7), 7 (wte 5.34) nurse specialists (band 6), 8 (wte 6.31) nurses (band 5), 21 (wte 17.09) higher-level clinical support workers (band 4), 4 (wte 3.2) clinical support workers (band 3) and a support physiotherapist (band 3).
B. Salary oncosts £217,676 per year Employer’s national insurance is included plus 14 per cent of salary for employer’s contribution to superannuation.
C. Qualifications Not known D. Overheads Management, administration and estates staff. Non-staff
£217,375 per year £472,462 per year
Taken from NHS (England) Summarised accounts.1 Management and other non-care staff costs were 19.31 per cent of direct care salary costs and included administration and estates staff. Non-staff costs were 41.97 per cent of direct care salary costs. They include costs to the provider for office, travel/transport and telephone, education and training, supplies and services (clinical and general), as well as utilities such as water, gas and electricity.
E. Capital overheads
£91,688 per year
Includes capital overheads relating to the building and equipment which have been annuitised using the appropriate discount rate.
Hours and duration of service
7 days a week (to include weekends and bank holidays) 8.00 am – 9.00 pm, 365 days per year.
If necessary, the service provides an intensive package of care over 24hours.
Average duration of stay
14 days Patients can stay up to six weeks, but average duration is 14 days.
Caseload per worker 30 per month The total annual caseload was 358.Unit costs available 2012/2013 (costs including qualifications given in brackets)Cost per bed per week £965; Average annual cost per patient £5,327; Cost of a typical client episode £1,925.
1 Audit Commission (2012) NHS summarised accounts 2011-2012, NHS, London.
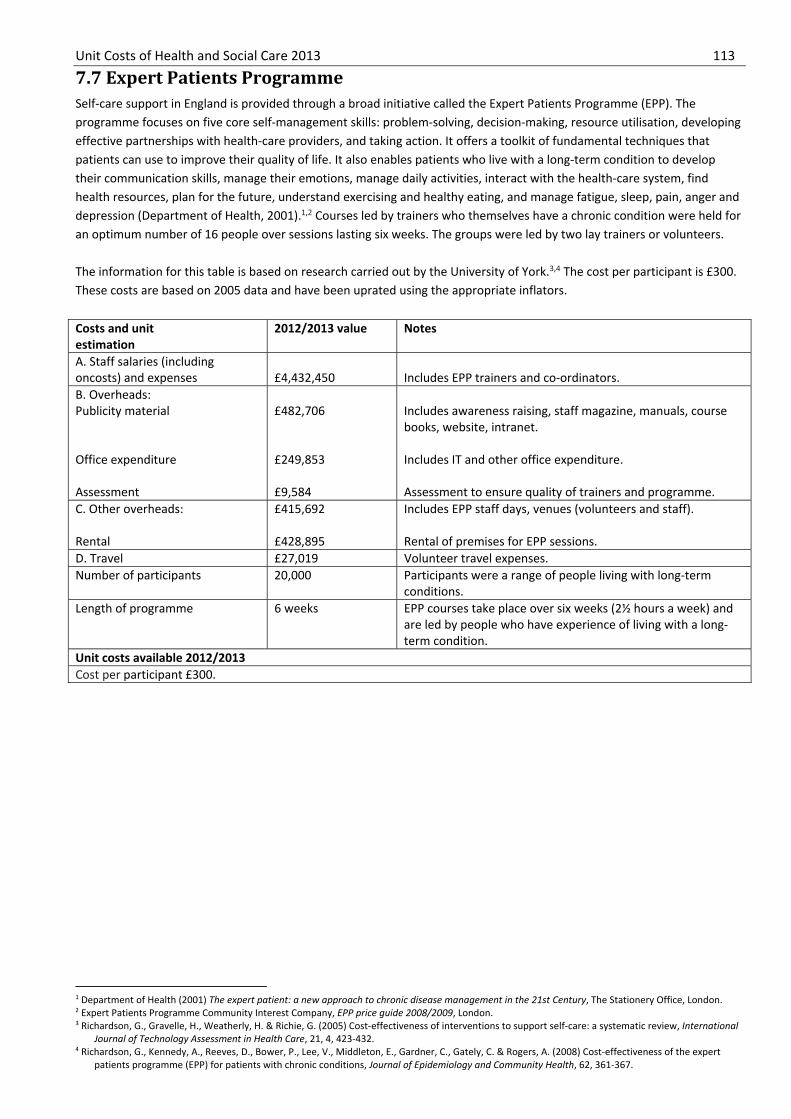
Unit Costs of Health and Social Care 2013 113
7.7 Expert Patients Programme Self-care support in England is provided through a broad initiative called the Expert Patients Programme (EPP). The programme focuses on five core self-management skills: problem-solving, decision-making, resource utilisation, developing effective partnerships with health-care providers, and taking action. It offers a toolkit of fundamental techniques that patients can use to improve their quality of life. It also enables patients who live with a long-term condition to develop their communication skills, manage their emotions, manage daily activities, interact with the health-care system, find health resources, plan for the future, understand exercising and healthy eating, and manage fatigue, sleep, pain, anger and depression (Department of Health, 2001).1,2 Courses led by trainers who themselves have a chronic condition were held for an optimum number of 16 people over sessions lasting six weeks. The groups were led by two lay trainers or volunteers. The information for this table is based on research carried out by the University of York.3,4 The cost per participant is £300. These costs are based on 2005 data and have been uprated using the appropriate inflators. Costs and unit estimation
2012/2013 value
Notes
A. Staff salaries (including oncosts) and expenses
£4,432,450 Includes EPP trainers and co-ordinators.
B. Overheads: Publicity material Office expenditure Assessment
£482,706 £249,853 £9,584
Includes awareness raising, staff magazine, manuals, course books, website, intranet. Includes IT and other office expenditure. Assessment to ensure quality of trainers and programme.
C. Other overheads: Rental
£415,692 £428,895
Includes EPP staff days, venues (volunteers and staff). Rental of premises for EPP sessions.
D. Travel £27,019 Volunteer travel expenses.Number of participants 20,000 Participants were a range of people living with long-term
conditions. Length of programme 6 weeks EPP courses take place over six weeks (2½ hours a week) and
are led by people who have experience of living with a long-term condition.
Unit costs available 2012/2013 Cost per participant £300.
1 Department of Health (2001) The expert patient: a new approach to chronic disease management in the 21st Century, The Stationery Office, London. 2 Expert Patients Programme Community Interest Company, EPP price guide 2008/2009, London. 3 Richardson, G., Gravelle, H., Weatherly, H. & Richie, G. (2005) Cost-effectiveness of interventions to support self-care: a systematic review, International
Journal of Technology Assessment in Health Care, 21, 4, 423-432. 4 Richardson, G., Kennedy, A., Reeves, D., Bower, P., Lee, V., Middleton, E., Gardner, C., Gately, C. & Rogers, A. (2008) Cost-effectiveness of the expert
patients programme (EPP) for patients with chronic conditions, Journal of Epidemiology and Community Health, 62, 361-367.

114 Unit Costs of Health and Social Care 2013
7.8 Re-ablement service Adult social care services are increasingly establishing re-ablement services as part of their range of home care provision, sometimes alone, sometimes jointly with NHS partners. Typically, home care re-ablement is a short-term intervention, often provided to the user free of charge, and aims to maximise independent living skills. Information on the costs of re-ablement have been collected as part of an evaluation at the Personal Social Services Research Unit at the University of Kent, in collaboration with the Social Policy Research Unit, University of York.1 The table below provides the average costs across four re-ablement services participating in the evaluation.2 All the services were based out of London, and one service had occupational therapists (OTs) working closely with the team. Cost data were provided for 2008/09 and have been uprated using the PSS inflators. Costs per service user for the four sites ranged from £1,623 to £2,204 at 2012/2013 prices. Costs and unit estimation
2012/2013 value
Notes
A. Salary plus oncosts £2,344,733 Based on total salary costs ranging from £582,437 to £4,772,087 for re-ablement workers. Salary cost accounted for between 61 and 62 per cent of total costs. One site included OTs as well as re-ablement workers.
B. Direct overheads Administrative and management Office and training costs
£864,668 £46,566
Administrative and management costs accounted for between 2 and 25 per cent of the total for the four sites. The costs of uniforms and training costs are included here. These accounted for one per cent of the total.
C. Indirect overheads £162,877 Indirect overheads include general management and support services such as finance and human resource departments. These were 4 per cent of total costs and ranged from 0.5 to 9 per cent.
D. Capital overheads Building and land costs Equipment costs
£6,558 £2,595
Information supplied by the local authority and annuitised over 60 years at a discount rate of 3.5 per cent. Based on information supplied by the local authority and costed following government guidelines (see tables 7.2 and 7.3).
E. Travel £431,658 Average travel costs for the four local authorities were 10 per cent of total costs and ranged from 1 to 12 per cent.
Patient contact hours 49 hours Average duration of episode for the four sites was 49 hours. Average episodes ranged from 35 to 55 hours.
Ratio of direct to indirect time on: Face-to-face contacts
1:0.94
Fifty-two per cent of time was spent in contact with service users. This was based on the average number of working hours of (179,174) and average of 92,566 contact hours.
Number of service users 1,886 The average number of service users for the four sites was 1,886 per year, ranging between 429 and 3,500 service users.
Unit costs available 2012/2013 £22 per hour; £42 per hour of contact; £2,046 average cost per service user.
1 Glendinning, C., Jones, K., Baxter, K., Rabiee, P., Curtis, L., Wilde, A., Arksey, H. & Forder, J. (2010) Home care re-ablement services: investigating the
longer-term impacts, Final Report, University of York, PSSRU Kent, Department of Health, London. 2 Although five sites participated in the evaluation, one of the sites had very different costs and did not provide complete information. The costs for this
site have therefore been omitted. The costs contained in this table are considered to be typical of a re-ablement service.

Unit Costs of Health and Social Care 2013 115
7.9 Public health interventions These costs are drawn from two reports: Prioritising investments in public health (Matrix Evidence and Bazian, 2008),1 commissioned by the Department of Health, and A review of the cost-effectiveness of individual level behaviour change interventions commissioned by the Health and Well-Being Alliance group (North West Public Health Observatory, 2011).2 Here we present the costs of interventions for which the economic evidence originated in the UK. Further information can be found on Public Health Interventions in the Cost Effectiveness Database (PHICED) http://www.yhpho.org.uk/PHICED/. All costs have been taken directly from the reports and uprated to 2012/2013 prices using the appropriate inflators. Further information on the specific research studies can be found in the reports named above. Intervention: Reducing long-term absence in the workplace The NICE public health guidance on Management of Long-term Sickness and Incapacity for Work provides cost information for three types of intervention: physical activity and education (10 sessions of physiotherapy or physical activity and 10 sessions of cognitive behaviour therapy); workplace intervention (usual care, workplace assessment and work modifications and communication between occupational physician and GP to reach a consensus on return to work); and physical activity and education along with a workplace visit (sessions as before plus half a day of line manager’s time).
Intervention Workplace intervention
Physiotherapy/physical activity
Cognitive behaviour
therapy
Workplace visit
Total
Physical activity and education
£177 £670 £846
Workplace intervention £569 £569Physical activity education and workplace visit
£177 £670 £50 £896
Alcohol intervention Intervention: Brief interventions have proven to be effective and have become increasingly valuable for the management of individuals with increasing and high-risk drinking, filling the gap between primary prevention efforts and more intensive treatment for persons with serious alcohol use disorders. The cost of delivering ten minutes’ brief advice for alcohol ranges from £7 for a practice nurse to £35 for a GP (see tables 10.6 and 10.8c of this publication).
Reducing the incidence of sexually transmitted infections (STIs) and teenage pregnancy Intervention: Individual risk counselling, defined here as one-to-one interventions, delivered by a counsellor to at-risk groups with the aim of reducing incidence of STIs or risky behaviour. Individual risk counselling can be delivered through clinics (genitourinary medicine, abortion, or drug and alcohol misuse clinics), community health services, GPs and other community and non-health-care settings. The review suggested that counselling interventions cost between £83 and £184 per person.
Reducing smoking and the harms from smoking Intervention: The review suggested that there is strong evidence that mass media campaigns for both young and adult populations cost between £0.30 and £2.00 per person. Estimates of cost are higher when the unit receiving the intervention is defined as those potentially exposed to the campaign (£26-£49). Intervention: Drug therapies for smoking cessation. This can include nicotine replacement therapy (NRT) (such as nicotine patches and gum), nicotine receptor partial antagonists (such as varenicline), opioid antagonists (such as naltrexone), clonidine, lobeline, or antidepressants (such as bupropion). There is evidence that drug therapy (bupropion, nicotine replacement therapy and varenicline) has a moderate effect on smoking cessation, particularly in people motivated to quit. There is economic evidence from the UK on the cost of NRT (£46-£160 per person), bupriopion (£88-£93 per person), and combinations of NRT and bupriopion (£175-£181 per person).
1 Matrix Evidence & Bazian (2008) Prioritising investments in public health, Department of Health, London. 2 North West Public Health Observatory (2011) A review of the cost-effectiveness of individual level behaviour change interventions, Health and Wellbeing
Alliance, Manchester. https://www.ewin.nhs.uk/news/item/2011/changes-in-the-nhs [accessed 9 October 2013].

116 Unit Costs of Health and Social Care 2013 Intervention: A ten-minute opportunistic brief advice session for smoking is £35 for a GP and £7 for a practice nurse (see tables 10.6 and 10.8c of this publication). Well man services Information has been drawn from the Liverpool Public Health Observatory Series3 and provides the costs of 18 well man pilots in Scotland funded between June 2004 and March 2006, aimed to:
Promote healthier lifestyles and attitudes among men; Provide men with an opportunity to undertake a health assessment and to obtain advice and support on health
and lifestyle issues; Effectively engage all men and, in particular, those who were hardest to reach as a consequence of social exclusion
or discrimination. They were also intended to identify what worked in promoting and sustaining health awareness and improvement in men.
Staff variation was the main factor in different session costs, and attendance rate was the main factor in cost per health assessment, particularly at drop-in services in community venues, where attendance was unpredictable. The costs did not include those incurred by patients.
Cost comparison of delivery modes – well man service pilots
Location Cost per session Cost per assessment Number Range Number RangeHealth clinics 9 £203-£900 9 £46-£306Workplaces 2 £224-£237 3 £29-£111Community venues (inc. pharmacies) 6 £109-£461 4 £68-£1,202
Health action area – community programme Within the Wirral Health action area, specialist lifestyle advisor staff are co-located with health trainers and community health development staff. These teams work with individuals and groups and provide (or commission) a community programme of lifestyle activities including mental wellbeing. They work closely with employability programmes such as the Condition Management Programme and Wirral Working 4 Health. The teams are based in a variety of community venues including a children’s centre and they also work closely with a wide network of other partner agencies, particularly where there is a common interest e.g. in accessing particular groups such as men over 50 or homeless people. This is a model of wellness which takes a network approach within a particular neighbourhood potentially involving all aspects of the wellbeing of an individual or family through joint working rather than a discrete wellness service.
An evaluation of the community programme showed that the average cost per client is £35. Further information is available from [email protected].
3 Winters, L., Armitage, M., Stansfield, J. Scott-Samuel & Farrar, A. (2010) Wellness services – evidence based review and examples of good practice, Final
Report, Liverpool Public Health Observatory.

Unit Costs of Health and Social Care 2013 117
7.10 Rehabilitation services 7.10.1 Tertiary ‘specialised’ rehabilitation services (Level 1) These are high-cost/low-volume services, which provide for patients with highly complex rehabilitation needs that are beyond the scope of their local and district specialist services. These are normally provided in co-ordinated service networks planned over a regional population of 1-3 million through collaborative (specialised) commissioning arrangements.1 The data below provide the annual cost per occupied bed and have been drawn from research carried out in eight sites by Turner-Stokes & colleagues (2012).2 Data were provided for 2009/2010 and have been uprated using the HCHS inflators. The information has been calculated from budget statements and accounting costs. These averages include costs from a range of different service models, which are separated in later versions of the Specialised Services National Definition Sets. The wide range of bed-day costs also reflects diversity in staffing/resource provision to meet differing case-load complexity which is factored into commissioning currencies using a costing model based on the Rehabilitation Complexity Scale.3 Costs and unit estimation 2012/2013
value Notes
A. Wages/salary and oncosts
£122,910 per year
Staff include (for every 20 beds): 2.5 WTE consultants accredited in rehabilitation medicine and/or neuropsychiatry, 2.5 WTE training grades doctors and 1.5 WTE trust grade doctor, 30 nurses, 6 physiotherapists and 6 occupational therapists, 3 speech and language therapists, 2.5 clinical psychologists, 2 social workers/discharge co-ordinators and 0.75 WTE dietitians, 3 technical/clerical assistants, 1 service manager.
B. Direct overheads Non-pay patient costs Ward costs Provision of equipment and facilities Rehabilitation unit office/administrative costs Office (staff) costs
£11,221 per year £16,487 per year £1,382 per year £2,721 per year £1,872 per year
Includes the cost of diagnostic & clinical services, drugs/pharmacy, medical and therapy supplies, travel/transport, interpreters, equipment hire, clinical specialist support and the cost of minor procedures. Includes the cost of cleaning, portering, catering, laundry, provisions utilities, maintenance, replacement of bedding & rates. Includes the cost of wheelchairs, mobility and exercise equipment, electronic assistive technology, hydrotherapy and other therapy. Includes the cost of office consumables, computer hardware, computer software, IT support, telephones, filing, data and records. Includes administrators and office management.
C. Indirect costs D. Overheads
£21,919 per year £19,201 per year
Includes general capital depreciation (departmental and central resources). Also includes central costs relating to HR, Trust management, payroll, Finance and Estates. Includes units contribution to Public Dividend Capital, interest charges and other costs not included above that are specific to unique factors associated with the rehabilitation service.
Number of beds per unit 26 Median number of beds per unit. Numbers ranged from 15-54.Occupancy 90 per
cent Average occupancy across the 8 units. Occupancy ranged from 70-99 per cent.
Unit costs available 2012/2013 Total annual costs per occupied bed £192,147; total daily cost per occupied bed £530 (range £430-£609).
1 Turner-Stokes, L. (2010) Specialist neuro-rehabilitation services: providing for patients with complex rehabilitation needs, British Society of Rehabilitation
Medicine, http://www.bsrm.co.uk/ClinicalGuidance/Levels_of_specialisation_in_rehabilitation_services5.pdf [accessed 9 October 2013]. 2 Turner-Stokes, L., Bill, A. & Dredge, R. (2012) A cost analysis of specialist inpatient neurorehabilitation services in the UK, Clinical Rehabilitation, 26, 3,
256-263, http://cre.sagepub.com/content/26/3/256 [accessed 25 July 2013]. 3 Turner-Stokes, L., Sutch, S. & Dredge, R. (2012) Healthcare tariffs for specialist inpatient neurorehabilitation services: rationale and development of a UK
casemix and costing methodology, Clinical Rehabilitation, 26, 3, 264-79, http://cre.sagepub.com/content/26/3/264/ [accessed 9 October 2013].

118 Unit Costs of Health and Social Care 2013
7.10.2 Local (district) specialist rehabilitation services (Level 2) These are typically planned over a district-level population of 250-500,000 and are led or supported by a consultant trained and accredited in rehabilitation medicine, working both in hospital and the community setting. The specialist multidisciplinary rehabilitation team provides advice and support for local general rehabilitation teams.1 The data below provide the annual cost per occupied bed and have been drawn from research carried out in seven sites by Turner-Stokes & colleagues (2011).2 Data were provided for 2009/2010 and have been uprated using the HCHS inflators. The information has been calculated from budget statements and accounting costs. These averages include costs from a range of different service models. The wide range of bed-day costs reflects diversity in staffing/resource provision to meet differing case-load complexity which is factored into commissioning currencies using a costing model based on the Rehabilitation Complexity Scale.3
Costs and unit estimation
2012/2013 value
Notes
A. Wages/salary and oncosts
£96,901 per year
Staff include (for every 20 beds): 1.5 WTE consultants accredited in rehabilitation medicine and/or neuropsychiatry, 2 WTE training grades doctors and 1.5 WTE trust grade doctor, 28 nurses, 4 physiotherapists and 4 occupational therapists, 2 WTE speech and language therapists, 2 WTE clinical psychologists, 1.5 social workers/discharge co-ordinators and 0.5 WTE dietitians, 2 technical/clerical assistant, 0.5 service manager.
B. Direct overheads Non-pay patient costs Ward costs Provision of equipment and facilities Rehabilitation unit office/administrative costs Office (staff) costs
£10,424 per year £14,449 per year £1,112 per year £2,372 per year £1,476 per year
Includes the cost of diagnostic & clinical services, drugs/pharmacy, medical and therapy supplies, travel/transport, interpreters, equipment hire, clinical specialist support and the cost of minor procedures. Includes the cost of cleaning, portering, catering, laundry, provisions utilities, maintenance, replacement of bedding & rates. Includes the cost of wheelchairs, mobility and exercise equipment, electronic assistive technology, hydrotherapy and other therapy. Includes the cost of office consumables, computer hardware, computer software, IT support, telephones, filing, data and records. Includes administrators and office management.
C. Indirect costs D. Overheads
£12,383 per year £12,505 per year
Includes general capital depreciation (departmental and central resources). Also includes central costs relating to HR, Trust management, payroll, Finance and Estates. Includes units contribution to Public Dividend Capital, interest charges and other costs not included above that are specific to unique costs factors associated with the rehabilitation service.
Number of beds per unit
20 Median number of beds per unit. Numbers ranged from 12-30.
Occupancy 96 per cent Average occupancy across the 7 units. Occupancy ranged from 84-100 per cent.
Unit costs available 2012/2013 Total annual cost per bed £151,621; average cost per occupied bed day £416 (range £310-£511).
1 Turner-Stokes, L. (2010) Specialist neuro-rehabilitation services: providing for patients with complex rehabilitation needs, British Society of Rehabilitation
Medicine. http://www.bsrm.co.uk/ClinicalGuidance/Levels_of_specialisation_in_rehabilitation_services5.pdf [accessed 9 October 2013]. 2 Turner-Stokes, L., Bill, A. & Dredge, R. (2011) A cost analysis of specialist inpatient neurorehabilitation services in the UK, Clinical Rehabilitation, October
5 http://cre.sagepub.com/content/26/3/256/ [accessed 9 October 2013]. 3 Turner-Stokes, L., Sutch, S. & Dredge, R. (2012) Healthcare tariffs for specialist inpatient neurorehabilitation services: rationale and development of a UK
casemix and costing methodology, Clinical Rehabilitation, 26, 3, 264-79, doi:10.1177/0269215511417467. http://cre.sagepub.com/content/26/3/264/ [accessed 9 October 2013].

Unit Costs of Health and Social Care 2013 119
7.10.3 Specialist children’s rehabilitation services These are high-cost/low-volume services, which provide for children with highly complex rehabilitation needs that are beyond the scope of their local and district specialist services.1 The data below provide the annual cost per occupied bed and have been drawn from research carried out in two sites by Turner-Stokes & colleagues (2011).2 Data were provided for 2009/2010 and have been uprated using the HCHS inflators. The information has been calculated from budget statements and accounting costs. Costs and unit estimation
2012/2013 value Notes
A. Wages/salary and oncosts
£294,560 per year Staff include (for every 20 beds): 2.5 WTE consultants accredited inrehabilitation medicine and/or neuropsychiatry, 2.5 WTE training grades doctors and 1.5 WTE trust grade doctor, 60 nurses, 6 physiotherapists and 4 occupational therapists, 2 play therapists, 3 speech and language therapists, 2.5 clinical psychologists, 2 social workers/discharge co-ordinators and 0.75 WTE dietitians, 3 technical/clerical assistants, 1 service manager.
B. Direct overheads Non-pay patient costs Ward costs Provision of equipment and facilities Rehabilitation unit office/administrative costs Office (staff) costs
£17,968 per year £16,243 per year £9,263 per year £2,925 per year £4,485 per year
Includes the cost of diagnostic & clinical services, drugs/pharmacy, medical and therapy supplies, travel/transport, interpreters, equipment hire, clinical specialist support and the cost of minor procedures. Includes the cost of cleaning, portering, catering, laundry, provisions utilities, maintenance, replacement of bedding & rates. Includes the cost of wheelchairs, mobility and exercise equipment, electronic assistive technology, hydrotherapy and other therapy. Includes the cost of office consumables, computer hardware, computer software, IT support, telephones, filing, data and records. Includes administrators and office management.
C. Indirect costs D. Overheads
£65,948 per year £2,148 per year
Includes general capital depreciation (departmental and central resources). Also includes central costs relating to HR, Trust management, payroll, Finance and Estates. Includes units contribution to Public Dividend Capital, interest charges and other costs not included above that are specific to unique factors associated with the rehabilitation service.
Number of beds per unit
9 Median number of beds per unit. Numbers ranged from 5-13.
Occupancy 76 per cent Average occupancy across the 2 units. Occupancy ranged from 73-78 per cent.
Unit costs available 2012/2013 Total annual cost per bed £413,542; average cost per occupied bed day £1,133 (range £1,051-£1,216).
1 Turner-Stokes, L. (2010) Specialist neuro-rehabilitation services: providing for patients with complex rehabilitation needs, British Society of Rehabilitation
Medicine. http://www.bsrm.co.uk/ClinicalGuidance/Levels_of_specialisation_in_rehabilitation_services5.pdf [accessed 9 October 2013]. 2 Turner-Stokes, L., Bill, A. & Dredge, R. (2011) A cost analysis of specialist inpatient neurorehabilitation services in the UK, Clinical Rehabilitation, October
5 http://cre.sagepub.com/content/26/3/256/ [accessed 9 October 2013].

120 Unit Costs of Health and Social Care 2013
7.11 End-of-life care Recent research carried out by the Nuffield Trust (Georghiou et al., 2012)1 on behalf of the National End of Life Care Intelligence Network (Department of Health, 2011) has examined the health and social care service use patterns in the last year of life of a cohort of 73,243 people who died across seven local authorities.
Table 7.11.1 provides the total cost of care services received in the last twelve months of life and also the average cost per decedent and per user of each type of service. Estimated social care costs include only the most common types of services provided by local authorities. Hospital care accounted for 66 per cent of total care costs with social care costs accounting for 34 per cent of total costs.
Emergency hospital admissions were responsible for 71 per cent of all hospital costs in the final year of life and 46 per cent of total costs. Emergency admissions rose sharply in the final year such that by the final month of death, costs had risen by a factor of 13 compared to 12 months earlier. They accounted for 85 per cent of hospital costs in the final month (£1,983 per decedent). Elective inpatient costs more than tripled in the same time (from £76 per decedent to £260 per decedent).
7.11.1 Estimated average cost of care services in the last twelve months of life
Total cost Total cost per decedent % total No of users Total cost per user
Hospital care £508 £6,942 66% 65,624 £7,747
Inpatient emergency £361 £4,933 47% 54,577 £6,620
Inpatient non-emergency £96 £1,315 12% 58,165 £1,657
Outpatient £42 £566 5% 50,155 £827
A&R £9 £127 1% 48,000 £194
Social care £255 £3,482 34% 20,330 £12,545
Residential and nursing care £204 £2,792 28% 10,896 £19,630
Home care £40 £540 5% 10,970 £3,604
Other £11 £150 1% 4,084 £2,695
Total £763 £10,424 100% NA NA
One of the key findings of the research was that there were significant differences in the use of social care between groups of individuals with certain long-term conditions: people with dementia, falls and stroke were more likely to use social care services, while people with cancer were least likely to use social care (even when adjusted for age). Table 7.11.2 provides a breakdown of these groups, including prevalence rates and costs. A person may have more than one condition so the groups are not mutually exclusive, and the sum of individual rows exceeds the total. Hospital costs were higher for those with many long-term conditions (as might be expected), and social care costs decreased with increasing number of long-term conditions.
1 Georghiou, T., Davies, S., Davies, A. & Bardsley, M. (2012) Understanding patterns of health and social care at the end of life, Nuffield Trust, London.

Unit Costs of Health and Social Care 2013 121
7.11.2 Cost of hospital and social care services by diagnostic group per decedent in the final year of life Diagnostic group Average costs, final year, £ per person Number Hospital care Social care Hospital and social careAll people 73,243 £6,942 £3,483 £10,424No diagnoses 22,118 £3,418 £4,280 £7,697Any diagnosis 51,125 £8,465 £3,138 £11,603Hypertension 21,241 £9,474 £2,879 £12,353Cancer 19,934 £9,924 £1,345 £11,268Injury 17,540 £10,223 £4,183 £14,406Atrial fibrillation 13,567 £9,572 £3,410 £12,981Ischaemic heart disease 13,213 £9,710 £2,905 £12,615 Respiratory infection 11,136 £10,625 £2,313 £12,938Falls 10,560 £9,393 £5,295 £14,688Congestive heart failure 10,474 £9,756 £3,299 £13,055 Chronic obstructive pulmonary disease 9,392 £9,531 £2,600 £12,131 Anaemia 9,210 £11,191 £3,135 £14,326Diabetes 8,697 £9,741 £3,238 £12,979Cerebrovascular disease 8,290 £9,592 £4,309 £13,901 Peripheral vascular disease 6,780 £11,052 £2,872 £13,924 Dementia 6,735 £8,000 £9,231 £17,231Renal failure 6,570 £11,154 £3,314 £14,468Angina 6,549 £10,430 £2,937 £13,367Mental disorders, not dementia 4,814 £10,461 £3,731 £14,192 Iatrogenic 4,190 £15,076 £2,616 £17,692Asthma 3,480 £10,125 £2,564 £12,689Alcoholism 2,437 £9,234 £1,198 £10,431Non-rheumatic valve disorder 2,059 £11,368 £2,261 £13,630

122 Unit Costs of Health and Social Care 2013

Unit Costs of Health and Social Care 2011 123
8. Care packages
8.1 Community care packages for older people 8.2 Social care support for older people, people with intellectual disabilities, people
with mental health problems and people with physical disabilities 8.3 Health care support received by people with mental health problems, older people
(over 75) and other service users 8.4 Adults with learning disabilities – care packages 8.5 Support for children and adults with autism 8.6 Services for children in care 8.7 Services for children in need 8.8 Common Assessment Framework 8.9 Services for children returning home from care 8.10 Support care for children 8.11 Young adults with acquired brain injury in the UK 8.12 Palliative care for children and young people

124 Unit Costs of Health and Social Care 2013
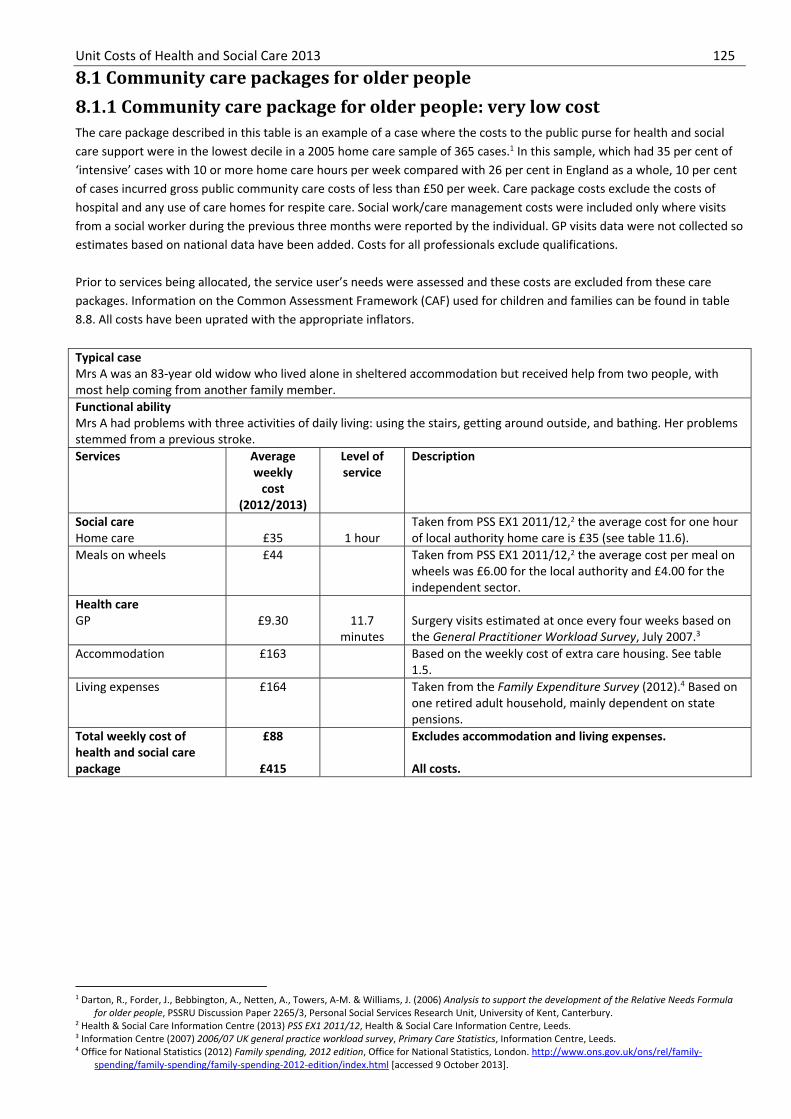
Unit Costs of Health and Social Care 2013 125
8.1 Community care packages for older people 8.1.1 Community care package for older people: very low cost The care package described in this table is an example of a case where the costs to the public purse for health and social care support were in the lowest decile in a 2005 home care sample of 365 cases.1 In this sample, which had 35 per cent of ‘intensive’ cases with 10 or more home care hours per week compared with 26 per cent in England as a whole, 10 per cent of cases incurred gross public community care costs of less than £50 per week. Care package costs exclude the costs of hospital and any use of care homes for respite care. Social work/care management costs were included only where visits from a social worker during the previous three months were reported by the individual. GP visits data were not collected so estimates based on national data have been added. Costs for all professionals exclude qualifications. Prior to services being allocated, the service user’s needs were assessed and these costs are excluded from these care packages. Information on the Common Assessment Framework (CAF) used for children and families can be found in table 8.8. All costs have been uprated with the appropriate inflators. Typical case Mrs A was an 83-year old widow who lived alone in sheltered accommodation but received help from two people, with most help coming from another family member. Functional ability Mrs A had problems with three activities of daily living: using the stairs, getting around outside, and bathing. Her problems stemmed from a previous stroke. Services Average
weekly cost
(2012/2013)
Level ofservice
Description
Social care Home care
£35 1 hour
Taken from PSS EX1 2011/12,2 the average cost for one hour of local authority home care is £35 (see table 11.6).
Meals on wheels £44 Taken from PSS EX1 2011/12,2 the average cost per meal onwheels was £6.00 for the local authority and £4.00 for the independent sector.
Health care GP
£9.30 11.7
minutes Surgery visits estimated at once every four weeks based on the General Practitioner Workload Survey, July 2007.3
Accommodation £163 Based on the weekly cost of extra care housing. See table 1.5.
Living expenses £164 Taken from the Family Expenditure Survey (2012).4 Based on one retired adult household, mainly dependent on state pensions.
Total weekly cost of health and social care package
£88
£415
Excludes accommodation and living expenses. All costs.
1 Darton, R., Forder, J., Bebbington, A., Netten, A., Towers, A-M. & Williams, J. (2006) Analysis to support the development of the Relative Needs Formula
for older people, PSSRU Discussion Paper 2265/3, Personal Social Services Research Unit, University of Kent, Canterbury. 2 Health & Social Care Information Centre (2013) PSS EX1 2011/12, Health & Social Care Information Centre, Leeds. 3 Information Centre (2007) 2006/07 UK general practice workload survey, Primary Care Statistics, Information Centre, Leeds. 4 Office for National Statistics (2012) Family spending, 2012 edition, Office for National Statistics, London. http://www.ons.gov.uk/ons/rel/family-
spending/family-spending/family-spending-2012-edition/index.html [accessed 9 October 2013].

126 Unit Costs of Health and Social Care 2013
8.1.2 Community care package for older people: low cost The care package described in this table is an example of a case where the costs to the public purse for health and social care support were in the bottom quartile in a 2005 home care sample of 365 cases.1 In this sample, which had 35 per cent of ‘intensive’ cases with 10 or more home care hours per week compared with 26 per cent in England as a whole, 25 per cent of cases incurred gross public community care costs of less than £95 per week. Care package costs exclude the costs of hospital and any use of care homes for respite care. Social work/care management costs were included only where visits from a social worker during the previous three months were reported by the individual. GP visits data were not collected so estimates based on national data have been added. Costs for all professionals exclude qualifications. Prior to services being allocated, the service user’s needs were assessed and these costs are excluded from these care packages. Information on the Common Assessment Framework (CAF) used for children and families can be found in table 8.8. All costs have been uprated using the appropriate inflators. Typical case Mrs B was a 79-year old widow who lived alone but received help from two people, most help being provided by a family member. Functional ability Mrs B had problems with three activities of daily living: using the stairs, getting around outside and bathing. Her problems stemmed from arthritic conditions and cardiovascular disease. Services Average
weekly cost
Level ofservice
Description
Social care Home care
£141 4 hours perweek
Based on 4 hours of local authority-organised home care (see table 11.6).
Private home care £44 3 hours perweek
Based on 3 hours of independently provided home care (see table 11.6).
Health care Community nurse GP
£4.20
£21
20 minutes
23.4 minutes
Community nurse visits once a month (see table 10.1). Home visits estimated at once every four weeks based on the General Practitioner Workload Survey, July 2007.2
Accommodation £86 The national average weekly gross rent for a two-bedroom house in the social housing sector.3
Living expenses £164 Taken from the Family Expenditure Survey (2013).4
Based on one retired person household, mainly dependent on state pensions.
Total weekly cost of health and social care package
£210
£460
Excludes accommodation and living expenses. All costs.
1 Darton, R., Forder, J., Bebbington, A., Netten, A., Towers, A-M. & Williams, J. (2006) Analysis to support the development of the Relative Needs Formula
for older people, PSSRU Discussion Paper 2265/3, Personal Social Services Research Unit, University of Kent, Canterbury. 2 Information Centre (2007) 2006/07 UK general practice workload survey, Primary Care Statistics, Information Centre, Leeds. 3 Department for Communities and Local Government (2013) English housing survey 2011 to 2012: headline report,
https://www.gov.uk/government/publications/english-housing-survey-2011-to-2012-headline-report/ [accessed 9 October 2013]. 4 Office for National Statistics (2012) Family spending 2012 edition, Office for National Statistics, London. http://www.ons.gov.uk/ons/rel/family-
spending/family-spending/family-spending-2012-edition/index.html [accessed 9 October 2013].
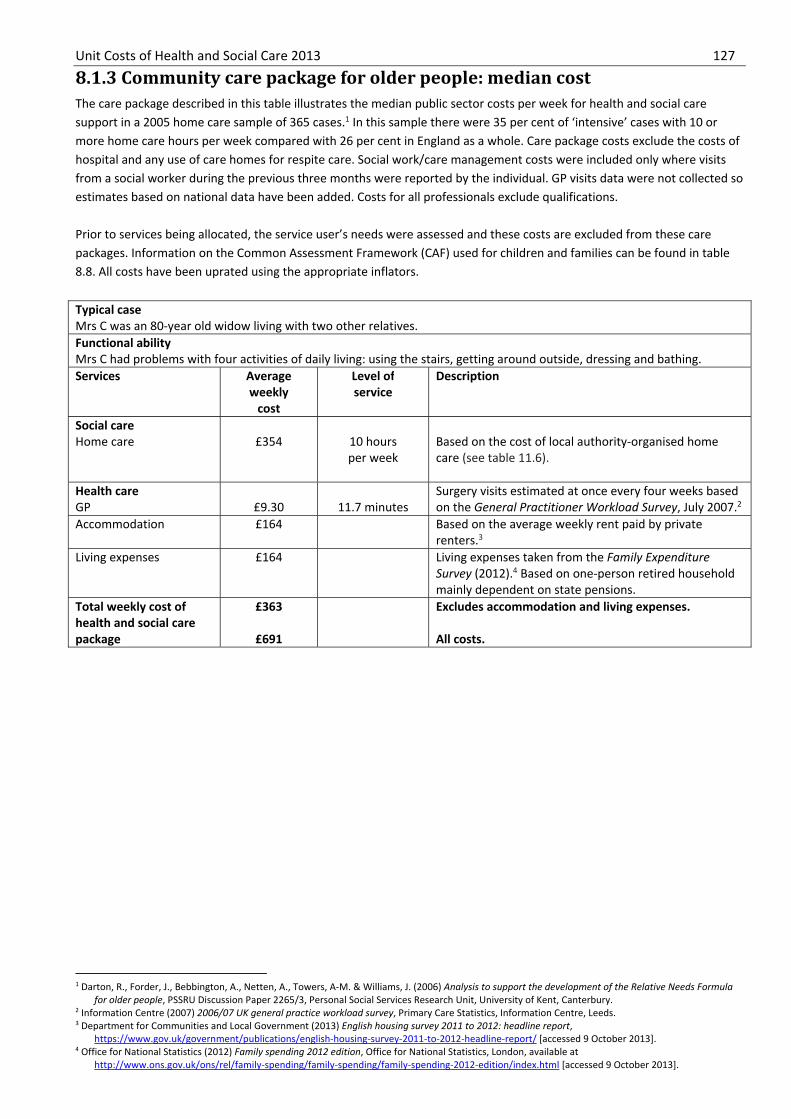
Unit Costs of Health and Social Care 2013 127
8.1.3 Community care package for older people: median cost The care package described in this table illustrates the median public sector costs per week for health and social care support in a 2005 home care sample of 365 cases.1 In this sample there were 35 per cent of ‘intensive’ cases with 10 or more home care hours per week compared with 26 per cent in England as a whole. Care package costs exclude the costs of hospital and any use of care homes for respite care. Social work/care management costs were included only where visits from a social worker during the previous three months were reported by the individual. GP visits data were not collected so estimates based on national data have been added. Costs for all professionals exclude qualifications. Prior to services being allocated, the service user’s needs were assessed and these costs are excluded from these care packages. Information on the Common Assessment Framework (CAF) used for children and families can be found in table 8.8. All costs have been uprated using the appropriate inflators. Typical case Mrs C was an 80-year old widow living with two other relatives. Functional ability Mrs C had problems with four activities of daily living: using the stairs, getting around outside, dressing and bathing. Services Average
weekly cost
Level ofservice
Description
Social care Home care
£354 10 hours
per week
Based on the cost of local authority-organised home care (see table 11.6).
Health care GP
£9.30 11.7 minutes
Surgery visits estimated at once every four weeks based on the General Practitioner Workload Survey, July 2007.2
Accommodation £164 Based on the average weekly rent paid by private renters.3
Living expenses £164 Living expenses taken from the Family Expenditure Survey (2012).4 Based on one-person retired household mainly dependent on state pensions.
Total weekly cost of health and social care package
£363
£691
Excludes accommodation and living expenses. All costs.
1 Darton, R., Forder, J., Bebbington, A., Netten, A., Towers, A-M. & Williams, J. (2006) Analysis to support the development of the Relative Needs Formula
for older people, PSSRU Discussion Paper 2265/3, Personal Social Services Research Unit, University of Kent, Canterbury. 2 Information Centre (2007) 2006/07 UK general practice workload survey, Primary Care Statistics, Information Centre, Leeds. 3 Department for Communities and Local Government (2013) English housing survey 2011 to 2012: headline report,
https://www.gov.uk/government/publications/english-housing-survey-2011-to-2012-headline-report/ [accessed 9 October 2013]. 4 Office for National Statistics (2012) Family spending 2012 edition, Office for National Statistics, London, available at
http://www.ons.gov.uk/ons/rel/family-spending/family-spending/family-spending-2012-edition/index.html [accessed 9 October 2013].

128 Unit Costs of Health and Social Care 2013
8.1.4 Community care package for older people: high cost The care package described in this table is an example of where the costs to the public purse for health and social care support were in the top quartile in a 2005 home care sample of 365 cases.1 In this sample, which had 35 per cent of ‘intensive’ cases with 10 or more home care hours per week compared with 26 per cent in England as a whole, 25 per cent of cases incurred gross public community care costs of over £283 per week. Care package costs exclude the costs of hospital and any use of care homes for respite care. Social work/care management costs were included only where visits from a social worker during the previous three months were reported by the individual. GP visits data were not collected so estimates based on national data have been added. Costs for all professionals exclude qualifications. Prior to services being allocated, the service user’s needs were assessed and these costs are excluded from these care packages. Information on the Common Assessment Framework (CAF) used for children and families can be found in table 8.8. All costs have been uprated using the appropriate inflators. Typical case Mr D was a 79 year old widower who owned his own home and lived with two other friends. One of these friends provided him with help. Functional ability Mr D had problems with seven activities of daily living: using the stairs, getting around outside and inside the house, using the toilet, transferring between chair and bed, dressing and bathing. His problems stemmed from arthritic conditions and a previous stroke. Services Average
weekly cost
Level ofservice
Description
Social care Home care Day care
£354
£39
10 hours per week
Based on local authority-organised home care (see table 11.6). Attended a day centre about once a week (see table 1.4).
Private home care £353 24 hours per week
Based on PSS EX1 2011/12 data on independently provided home care (see table 11.6).
Health care Community nurse OT GP
£17
£61
£9.30
20 minutes
11.7 minutes
Once a week visit from a community nurse (see table 10.1). Two visits were made by the OT (see table 9.2). Visits (surgery) estimated at once every four weeks based on the General Practitioner Workload Survey, July 2007.2
Accommodation £52 Based on the average weekly mortgage payment paid by owner occupiers.3
Living expenses £200 Living expenses taken from the Family Expenditure Survey (2012).4
Based on two adult retired households not mainly dependent on state pensions.
Total weekly cost of health and social care package
£833
£1,085
Excludes accommodation and living expenses and privately purchased home care. All costs
1 Darton, R., Forder, J., Bebbington, A., Netten, A., Towers, A-M. & Williams, J. (2006) Analysis to support the development of the Relative Needs Formula
for older people, PSSRU Discussion Paper 2265/3, Personal Social Services Research Unit, University of Kent, Canterbury. 2 Information Centre (2007) 2006/07 UK general practice workload survey, Primary Care Statistics, Information Centre, Leeds. 3 Department for Communities and Local Government (2013) English housing survey 2011 to 2012: headline report,
https://www.gov.uk/government/publications/english-housing-survey-2011-to-2012-headline-report/ [accessed 9 October 2013]. 4 Office for National Statistics (2012) Family spending 2012 edition, Office for National Statistics, London. http://www.ons.gov.uk/ons/rel/family-
spending/family-spending/family-spending-2012-edition/index.html [accessed 9 October 2013].

Unit Costs of Health and Social Care 2013 129
8.1.5 Community care package for older people: very high cost The care package costs described in this table are an example of a case where the costs to the public purse for health and social care support were in the top decile in a 2005 home care sample of 365 cases.1 In this sample, which had 35 per cent of ‘intensive’ cases with 10 or more home care hours per week compared with 26 per cent in England as a whole, 10 per cent of cases incurred gross public community care costs of over £390 per week. Package costs exclude the costs of hospital and any use of care homes for respite care. Social work/care management costs were included only where visits from a social worker during the previous three months were reported by the individual. GP visits data were not collected so estimates based on national data have been added. Costs for all professionals exclude qualifications. Prior to services being allocated, the service user’s needs were assessed and these costs are excluded from these care packages. Information on the Common Assessment Framework (CAF) used for children and families can be found in table 8.8. All costs have been uprated using the appropriate inflators. Typical case Mrs E was an 82 year old woman who was married and lived with her husband and another relative in her own home. Her husband provided most support. Functional ability Mrs E suffered from dementia and needed help with nine activities of daily living: stairs, getting around outside and inside the house, using the toilet, transferring between chair and bed, dressing, bathing, washing and feeding. Services Average
weekly costs
Level ofservice
Description
Social care Home care
£1,061 30 hours per
week Based on the cost of local authority-organised home care (see table 11.6).
Health care Community nurse GP
£17
£9.30
20 mins
11.7 mins
One visit a week from a community nurse (see table 10.1). Visits (surgery) estimated at once every four weeks based on the General Practitioner Workload Survey, July 2007.2
Accommodation £44 Based on the annuitised value of all houses shared between three people. Taken from the Halifax Price Index, July 2013.3
Living expenses £200 Living expenses taken from the Family Expenditure Survey (2012).4 Based on one-person retired household, not mainly dependent on state pension.
Total weekly cost of health and social care package
£1,087
£1,331
Excludes accommodation and living expenses. All costs.
1 Darton, R., Forder, J., Bebbington, A., Netten, A., Towers, A-M. & Williams, J. (2006) Analysis to support the development of the Relative Needs Formula
for older people, PSSRU Discussion Paper 2265/3, Personal Social Services Research Unit, University of Kent, Canterbury. 2 Information Centre (2007) 2006/07 UK general practice workload survey, Primary Care Statistics, Information Centre, Leeds. 3 Lloyds Banking Group (2013) Halifax house price index, http://www.lloydsbankinggroup.com/media/pdfs/halifax/2013/060913_HPI.pdf [accessed 14
October 2013]. 4 Office for National Statistics (2012) Family spending, 2012 edition, Office for National Statistics, London. http://www.ons.gov.uk/ons/rel/family-
spending/family-spending/family-spending-2012-edition/index.html [accessed 9 October 2013].

130 Unit Costs of Health and Social Care 2013
8.2 Social care support for older people, people with learning disabilities, people with mental health problems and people with physical disabilities The care packages described in the following tables (8.2.1-8.2.4) are drawn from the National Evaluation of the Individual Budgets Pilot Projects (IBSEN).1 This study collected information on the social care service use of 1001 people across four client groups: older people, people with learning disabilities, people with mental health problems, and people with physical disabilities. For the study, the service users’ needs were categorised as critical, substantial or moderate, and information was collected on a pre-specified set of services: the type of accommodation in which they usually lived, the number of hours of home care and day care received each week, and the social security benefits they received. The services were costed using information contained in this volume where possible (see details below); otherwise they have been taken from the Personal Social Services Expenditure return (PSS EX1, 2011/2012)2 and uprated using the PSS pay & prices inflator. As no information was available on whether the services had been provided by the local authority or private organisations, we have used the weighted average price. Home care: The cost per hour for a home care worker is £24 (face-to-face) (see table 11.6). As the PSS EX1 return does not distinguish between client groups for home care, the cost of home care for adults and older people has been used for all client groups. This cost is likely to be an under-estimate for certain client groups. Day care: To arrive at a cost per session of day care, assumptions have to be made about the number of times service users attend per week. It has therefore been assumed that older people, people with mental health problems and people with physical disabilities attend on average three days per week, and that people with learning disabilities attend five days per week. Based on these assumptions, the mean cost per client session for older people is £35 per week, and for people with mental health problems (local authority and independent provision) is £31.2 For people with learning disabilities the mean cost is £59 per session2 and for people with physical disabilities the mean cost of a day care session is £61.2 Benefit receipt: All benefit receipt was costed using information taken from the Department for Work and Pensions (DWP)3 and summed to provide a total for each service user. Benefits included long-term incapacity benefit (£99.15 per week), severe disability benefit (£58.20 per week), disability (mobility) benefit (£54.05 per week), disability care allowance (£51.85 per week), attendance allowance (lower/higher rate, £51.85/£77.45 per week), carer’s allowance (£58.45 per week) and housing benefit (£71 per week). Accommodation: Information was available on whether the service user lived in a registered care home, sheltered accommodation, supported living, flats, private accommodation or rented accommodation; whether the service user lived alone or in shared accommodation; and the number of bedrooms in the accommodation. No information is available on whether the service user lived in accommodation provided by the local authority or private organisations. We have taken the lower-cost assumption that the accommodation was provided by a private sector organisation. For each client group, the appropriate cost was taken from this volume or other national sources such as Rentright (http://www.rent-right.co.uk/), a website which provides the average rental costs for England for each month, or the Halifax Price Index which provides average prices for privately-owned accommodation in England. Sometimes judgements were made about the type of accommodation according to the level of need of the service user. For example, for people with physical disabilities, where a care home was specified, it was assumed that this was a high dependency care home (see table 5.1 of last year’s volume). Similarly, when a ‘flat’ was specified and the level of need was ‘critical’ or ‘substantial, the cost of special needs flats were applied (see table 5.3 of last year’s volume). When the accommodation type was ‘supported living’, when the level of need was ‘critical’, it was assumed that this also was a care home; otherwise the cost of ‘extra care housing’ was used. Costs for residential care and supported living for all client groups were taken from the relevant sections of this volume.
1 Glendinning, C., Challis, D., Fernandez, J., Jacobs, S., Jones, K., Knapp, M., Manthorpe, J., Moran, N., Netten, A., Stevens, M. & Wilberforce, M. (2008)
Evaluation of the individual budgets pilot programme: Final Report, Social Policy Research Unit, University of York, York. 2 Health & Social Care Information Centre (2013) PSS EX1 2011/12, Health & Social Care Information Centre, Leeds. 3 Department for Work and Pensions (2012) Social security benefit uprating, http://www.dwp.gov.uk/docs/benefitrates2012.pdf [accessed 9 October
2013].

Unit Costs of Health and Social Care 2013 131
8.2.1 Social care support for older people In the IBSEN study, 281 people were over 65 (28% of the whole sample): 39 had critical needs, 171 had substantial needs and 71 moderate needs. The average total cost for the whole sample was £282 per week, with 10 per cent incurring costs of less than £120 and 10 per cent more than £542. Service/need group
Average weekly costs 2012/2013
Number of users
Description
Home care Critical Substantial Moderate Average/total
£297 £154 £157
£176
18 users 74 users 26 users
118 users
Forty-two per cent of the sample of older people reported the use of home care. The average weekly cost for critical needs users was £297 compared to £157 for those with moderate needs. The average weekly cost for all 118 service users was £176 (9 hours per week).
Day care Critical Substantial Moderate Average/total
£108 £69 £56
£71
4 users 24 users 7 users
35 users
Twelve per cent of the older participants reported the use of day care. The average weekly cost for all 35 users was £71.
Benefits Critical Substantial Moderate Average/total
£123 £85 £95
£93
15 users 66 users 24 users
105 users
Thirty-seven per cent reported receiving benefits. In total, the cost of benefits received by critical service users was £123 compared to £95 for moderate service users. The total average weekly cost for all 105 users was £93.
Accommodation Critical Substantial Moderate Average/total
£172 £142 £182
£165
39 users 171 users 71 users
281 users
The cost of accommodation for those with moderate needs was 6 per cent higher than those with critical needs. The average weekly cost for accommodation was £165.
Total costs Critical Substantial Moderate Average/total
£374 £258 £283
£282
39 users 171 users 71 users
281 users
The average weekly cost for all service users was £282. Support costs for critical service users were 32 per cent higher than costs for moderate service users.

132 Unit Costs of Health and Social Care 2013
8.2.2 Social care support for people with learning disabilities In the IBSEN study, 260 people had learning disabilities (26% of the whole sample): 76 had critical needs, 159 had substantial needs and 25 moderate needs. The average cost for this sample was £319 per week, with 10 per cent incurring costs of less than £198 and 10 per cent more than £515. Service/need group
Average weekly costs 2012/2013
Number of users
Description
Home care Critical Substantial Moderate Average/total
£394 £387 £274
£387
28 users 47 users 2 users
77 users
Forty-six per cent of the sample of people with learning disabilities reported the use of home care. Of those, the average weekly cost for critical users was £394 compared to £274 for those with moderate needs. The average weekly cost for all 77 service users was £387.
Day care Critical Substantial Moderate Average/total
£334 £49 £35
£56
18 users 51 users 3 user
72 users
Twenty-eight per cent of the whole sample of people with learning disabilities reported the use of day care. The average weekly cost was £56 across the 72 users.
Benefits Critical Substantial Moderate Average/total
£140 £138 £146
£139
68 users 119 users 12 users
199 users
Seventy-seven per cent reported receiving benefits. In total, the value of benefits received by critical service users was £140 compared to £146 for moderate service users. The total average weekly cost for all 199 users was £139.
Accommodation Critical Substantial Moderate Average/total
£184 £159 £66
£158
76 users 159 users 25 users
260 users
The cost of accommodation for those with critical needs was £184 compared to the cost of those with moderate needs of £66. The average weekly cost for the whole sample of people with learning disabilities was £158.
Total costs Critical Substantial Moderate Average/total
£395 £307 £169
£319
76 users 159 users 25 users
260 users
The average weekly cost for all service users was £319. Support costs for critical users were 135 per cent higher than costs for moderate service users.
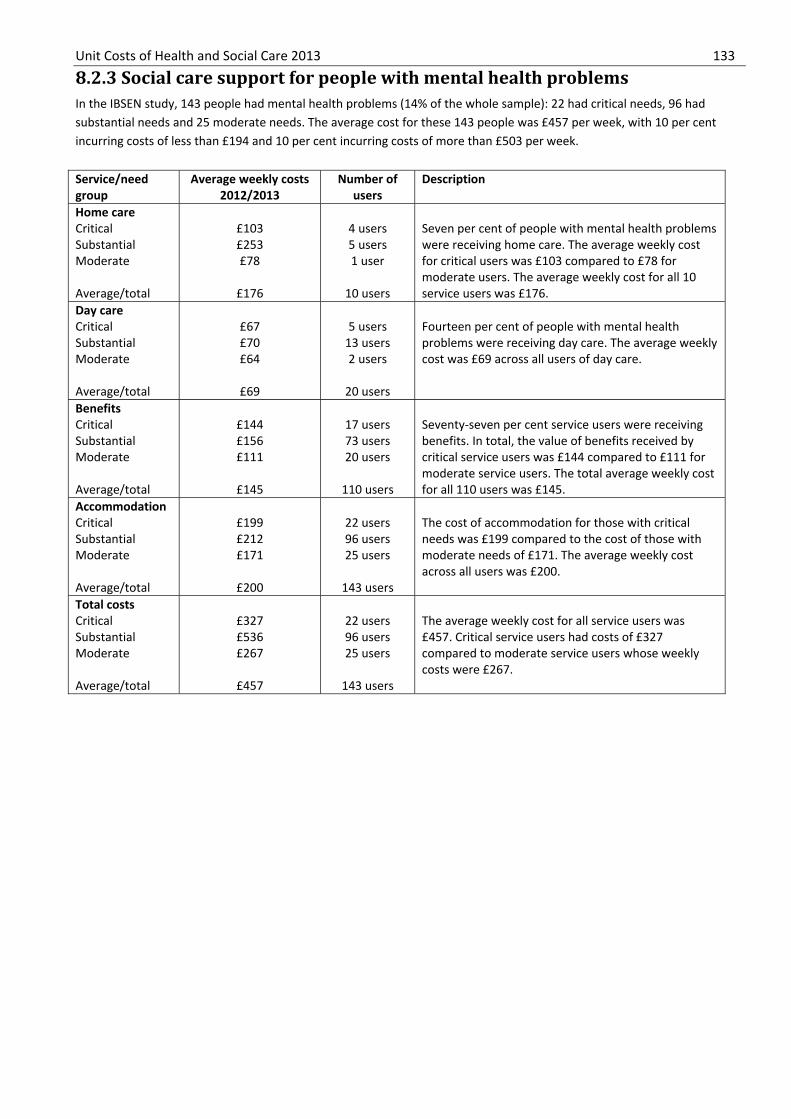
Unit Costs of Health and Social Care 2013 133
8.2.3 Social care support for people with mental health problems In the IBSEN study, 143 people had mental health problems (14% of the whole sample): 22 had critical needs, 96 had substantial needs and 25 moderate needs. The average cost for these 143 people was £457 per week, with 10 per cent incurring costs of less than £194 and 10 per cent incurring costs of more than £503 per week. Service/need group
Average weekly costs 2012/2013
Number of users
Description
Home care Critical Substantial Moderate Average/total
£103 £253 £78
£176
4 users 5 users 1 user
10 users
Seven per cent of people with mental health problems were receiving home care. The average weekly cost for critical users was £103 compared to £78 for moderate users. The average weekly cost for all 10 service users was £176.
Day care Critical Substantial Moderate Average/total
£67 £70 £64
£69
5 users 13 users 2 users
20 users
Fourteen per cent of people with mental health problems were receiving day care. The average weekly cost was £69 across all users of day care.
Benefits Critical Substantial Moderate Average/total
£144 £156 £111
£145
17 users 73 users 20 users
110 users
Seventy-seven per cent service users were receiving benefits. In total, the value of benefits received by critical service users was £144 compared to £111 for moderate service users. The total average weekly cost for all 110 users was £145.
Accommodation Critical Substantial Moderate Average/total
£199 £212 £171
£200
22 users 96 users 25 users
143 users
The cost of accommodation for those with critical needs was £199 compared to the cost of those with moderate needs of £171. The average weekly cost across all users was £200.
Total costs Critical Substantial Moderate Average/total
£327 £536 £267
£457
22 users 96 users 25 users
143 users
The average weekly cost for all service users was £457. Critical service users had costs of £327 compared to moderate service users whose weekly costs were £267.
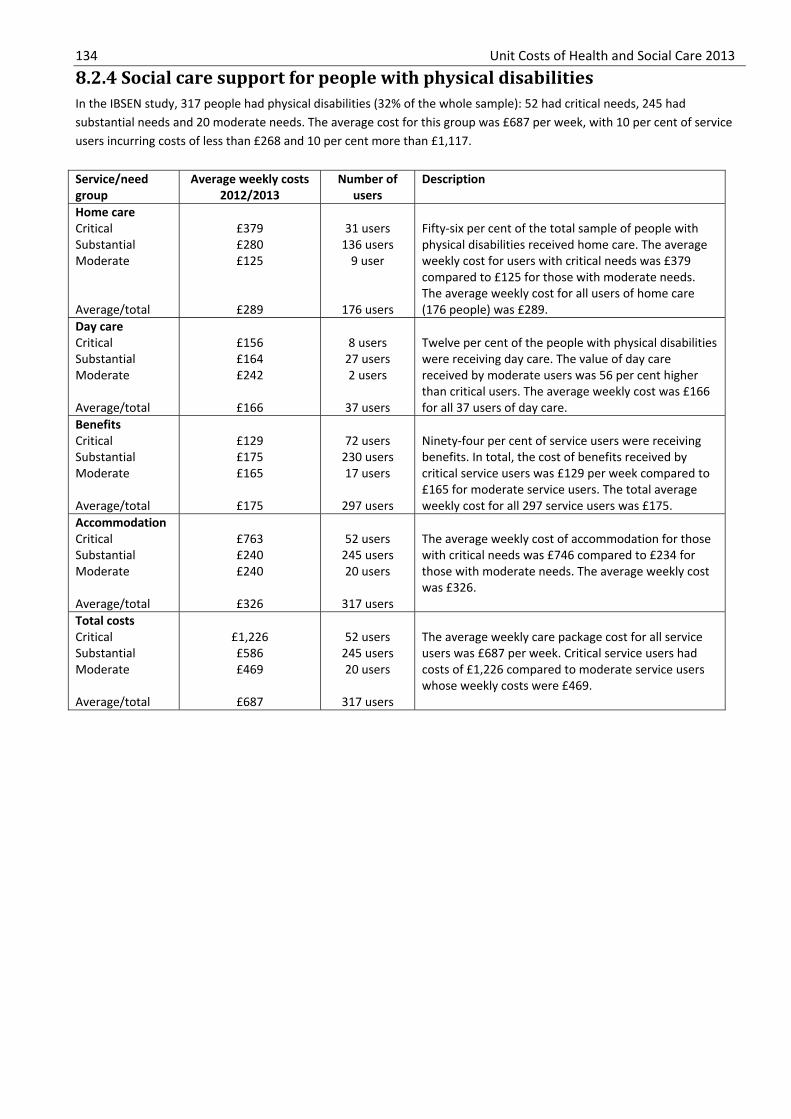
134 Unit Costs of Health and Social Care 2013
8.2.4 Social care support for people with physical disabilities In the IBSEN study, 317 people had physical disabilities (32% of the whole sample): 52 had critical needs, 245 had substantial needs and 20 moderate needs. The average cost for this group was £687 per week, with 10 per cent of service users incurring costs of less than £268 and 10 per cent more than £1,117. Service/need group
Average weekly costs 2012/2013
Number of users
Description
Home care Critical Substantial Moderate Average/total
£379 £280 £125
£289
31 users 136 users
9 user
176 users
Fifty-six per cent of the total sample of people with physical disabilities received home care. The average weekly cost for users with critical needs was £379 compared to £125 for those with moderate needs. The average weekly cost for all users of home care (176 people) was £289.
Day care Critical Substantial Moderate Average/total
£156 £164 £242
£166
8 users 27 users 2 users
37 users
Twelve per cent of the people with physical disabilities were receiving day care. The value of day care received by moderate users was 56 per cent higher than critical users. The average weekly cost was £166 for all 37 users of day care.
Benefits Critical Substantial Moderate Average/total
£129 £175 £165
£175
72 users 230 users 17 users
297 users
Ninety-four per cent of service users were receiving benefits. In total, the cost of benefits received by critical service users was £129 per week compared to £165 for moderate service users. The total average weekly cost for all 297 service users was £175.
Accommodation Critical Substantial Moderate Average/total
£763 £240 £240
£326
52 users 245 users 20 users
317 users
The average weekly cost of accommodation for those with critical needs was £746 compared to £234 for those with moderate needs. The average weekly cost was £326.
Total costs Critical Substantial Moderate Average/total
£1,226 £586 £469
£687
52 users 245 users 20 users
317 users
The average weekly care package cost for all service users was £687 per week. Critical service users had costs of £1,226 compared to moderate service users whose weekly costs were £469.

Unit Costs of Health and Social Care 2013 135
8.3 Health care support received by people with mental health problems, older people (over 75) and other service users Information for this table has been drawn from the Evaluation of the Personal Health Budget Pilot Programme1 and provides information on the health service use of participants in the year before the study started. The information provided in the table below shows the total mean annual cost of health care received by all service users, which includes people with chronic obstructive pulmonary disease, diabetes, long-term neurological conditions, mental health, stroke and patients eligible for NHS Continuing Healthcare. It also provides this information separately for people with mental health problems and people over 75 with one of the above health conditions (over 75). The information was collected in 2009 and has been uprated using the appropriate inflators. Health services received Total mean
annual cost Number of
patients Range of costs
All service users Nursing and therapy Primary care Inpatient care Outpatient and A&E
£215 £846
£4,028 £956
1278 2028 1771 1772
£0-£13,901 £0-£10,479
£0-£106,003 £0-£11,864
People with mental health problems Nursing and therapy Primary care Inpatient care Outpatient and A&E
£154 £542
£4,283 £817
180 344 358 358
£0-£3,809 £0-£2,374
£0-£106,003 £0-£6,542
People over 75 Nursing and therapy Primary care Inpatient care Outpatient and A&E
£183 £1,082 £5,892 £1,027
226 345 275 275
£0-£3,961
£0-£13,326 £0-£76067 £0-£6,835
1 Forder, J., Jones, K., Glendinning, C., Caiels, J., Welch, E., Baxter, K., Davidson, J., Windle, K., Irvine, A., King, D. & Dolan, P. (2012) Evaluation of the
personal health budget pilot programme, Department of Health, London.

136 Unit Costs of Health and Social Care 2013
8.4 Adults with learning disabilities – care packages These care packages (8.4.1 and 8.4.2) draw on research carried out by Laing & Buisson1 and commissioned by the Department of Health. They provide illustrative cost models in learning disabilities social care provision, first for residential care homes and then for supported living schemes.
8.4.1 Residential care homes The table below provides examples of high-specification care homes in the South East of England, one with 4 bedrooms and one with 8 bedrooms. Twenty four-hour support is provided in both houses; they are well equipped and include en suites with bath or shower and good communal spaces. The average fee paid for the 4-bedroom house is £1,600 per week and for the 8-bedroom house is £1,450. Costs and unit estimation
2012/2013
4-bed house
Notes 8-bedhouse
Notes
Staff costs Salaries
£208,878 Based on approximately 7.5 WTE staff providing 257 hours of support per week plus 1 waking night staff member and an additional sleep-in support staff member. There is also a full-time manager earning £28,056 per year.
£302,516 Based on approximately 12.4 WTE staff providing 427 hours of support per week plus 1 waking night staff member (2 additional WTEs to cover the full week). There is also a full-time manager earning £35,000 per year plus one additional deputy manager.
Training £6,252 £6,773 Staff overheads £7,190 £21,258Capital costs Building £21,050 The purchase price of the
building was £524,939. This has been annuitised over 60 years at 3.5%
£29,470 The purchase price of the building was £734,915. This has been annuitised over 60 years at 3.5%
Equipment £8,420 Major adaptations cost £209,976. This amount has been annuitised over 60 years at 3.5%
£16,840 Major adaptations cost £419,952. This amount has been annuitised over 60 years at 3.5%
Living expenses Personal living expenses
£24,872 Living expenses per person per week cover £46 food, £46 travel, £23 service user activities and £6 for holidays.
£45,008 Living expenses per person per week cover £46 food, £46 travel, £23 service user activities and £6 for holidays.
Utilities £7,106 £14,213 Direct overheads Maintenance/ service
£27,715
Includes the costs of boiler and other equipment maintenance, cleaning materials, maintenance staff costs and damages and breakages.
£45,955
Includes the costs of boiler and other equipment maintenance, cleaning materials, maintenance staff costs and damages and breakages.
Indirect overheads Head office costs
£18,236
Head office costs are charged at £88 per person per week, on the basis of full occupancy.
£36,473
Head office costs are charged at £88 per person per week, on the basis of full occupancy.
Total cost per year
£329,719 £518,506
Total cost per person per year
£82,430 £64,813
Total cost per person per week
£1,580 £1,242
1 Laing & Buisson (2011) Illustrative cost models in learning disabilities social care provision, Department of Health, London.

Unit Costs of Health and Social Care 2013 137
8.4.2 Supported living homes The weekly unit costs per service user for both homes in this table are similar. Both homes support service users with, on average, the same level of needs for support hours, although there are some offsetting differences; in particular, staff costs are higher at the two-bedded home but the manager costs are lower, reflecting input of only 5 hours a week for both services (i.e. 2.5 hours per service user).1 Costs and unit estimation
This example is of a two-bedded supported living home in the North West of England, using budgeted costs. On average 94 hours of support
This example is of a three-bedded supported living home in the North West of England, using budgeted costs. On average 85.7 hours of support
Income Unit fee/cost per week (including oncosts)
2 residentsTotal £ per year
Unit fee/cost per week (including oncosts)
3 residentsTotal £ per year
INCOME Fees
£915 £95,194 £915 £142,792
COSTS Direct staff costs Senior support staff
£212 £22,147 £267 £41,720
Support staff £363 £37,884 £295 £46,141Sub-total £576 £60,032 £563 £87,911Waking nights Sleep-in £110 £10,963 £70 £10,963Manager £39 £3,977 £90 £14,162Sub-total £149 £14,940 £160 £25,125Recruitment £5 £502 £5 £727Training £12 £1,302 £12 £2,002Other staff overheads
£16 £1,669 £19 £2,935
Total staff support costs
£758 £78,444 £759 £118,700
Management costs-area, division, central
£124 £12,930 £125 £19,578
1 Laing & Buisson (2011) Illustrative cost models in learning disabilities social care provision, Department of Health, London.

138 Unit Costs of Health and Social Care 2013
8.5 Support for children and adults with autism There is growing evidence on the economic burden of autism spectrum disorders (ASD). Autism has life-time consequences with a range of impacts on the health, economic well-being, social integration and quality of life of individuals with the disorder, their families and potentially the rest of society. Many of those impacts can be expressed as economic costs. Interventions and services currently used to treat or support children and adults with ASD include those provided by medical practitioners, nurses, dietitians, psychologists, speech and language therapists, teachers and various providers of complementary and alternative medicine, such as music therapy, aromatherapy, homeopathic remedies, naturopathic remedies, manipulative body therapies and spiritual healing. These treatments, services and supports impose costs to the state, the voluntary sector or to the families of people with ASD who have to pay for them from their own pockets. Here we present cost information taken from two research studies. The first focuses on pre-school children and provides the service and wider societal costs in the UK.1 It looked at the services received by 152 pre-school children with autism, reported family out-of-pocket expenses and productivity losses, and explored the relationship between family characteristics and costs. Service use data were collected using a modified version of the Child and Adolescent Service Use Schedule (CA-SUS) asking about the use of specialist accommodation such as foster and respite care, education or day care facilities attended, all medication prescribed for the individual child, all hospital contacts, and all community health, education and social care services, including non-statutory provision. School-based services were not recorded separately to avoid double-counting the costs included in the overall cost of the education facility, and because parents may not always be aware of their use. In addition, parents were asked to report details of time off work due to their child’s illness, and expenditure on any specialist equipment or other extraordinary costs, such as home adaptations, conference or training attendance, and overseas travel that were a direct result of their child’s autism. Information from this study is found in 8.5.1. The second study provides the annual costs for children and adults with low-functioning and high-functioning ASD (i.e. with and without an intellectual disability). The research carried out by Knapp et al. (2007, 2009)2,3 estimated the full costs of autism spectrum disorders (ASDs) in the United Kingdom drawing on previous research, national surveys, expert advice and supplemented with usage data on 146 children and 91 adults. In the sample of children with autism, ages ranged from 3 to 17, with a mean of 10.28 years (standard deviation 3.17) and a median age of 10. The purpose of the study was to examine the service, family and other economic consequences of autism in the UK for children and adults with ASD. See tables 8.5.2 to 8.5.4 for costs from this study.
1 Barrett, B., Byford, S., Sharac, J., Hudry, K., Leadbitter, K., Temple, K., Aldred, C., Slonims, V., Green, J. & the PACT Consortium (2012) Service and wider
societal costs of very young children with autism, Journal of Autism and Developmental Disorders, 42,5,797-804. 2 Knapp, M., Romeo, R. & Beecham, J. (2007) The economic consequences of autism in the UK, Report to the Foundation for People with Learning
Disabilities, London. 3 Knapp, M., Romeo, R. & Beecham, J. (2009) Economic cost of autism in the UK, Autism, 13, 3, May, 317-336.

Unit Costs of Health and Social Care 2013 139
8.5.1 Children with autism (pre-school) Information for this table has been taken from Barrett et al. (2012).1 All costs presented were for 2006/2007 and have therefore been uprated to 2012/2013 using the appropriate inflators. This table reports the service and wider societal costs for the six months prior to interview for pre-school children with autism. The mean total service costs were £2,834, equivalent to £472 per month and over £5,667 per year. Almost half the costs (44%) were for education and childcare, 41 per cent were for community health and social services, and 12 per cent for hospital services. Total costs varied substantially between the children in the study (range £345 to £7,299 over six months). Box 1 below presents case studies of low- and high-cost cases. On average, families spent an additional £284 as a result of their child’s illness over the six months prior to interview (range £0 to £4,189). Fifty-one per cent of families reported taking some time off work due to their child’s illness over the six months, associated with productivity losses of £300 per family. Total costs including all services, family costs and productivity losses were estimated at over £3,417 over six months, equivalent to over £570 per month. Total costs per child for the six months prior to interview (£, n=152)
Mean
SD Total service cost%
Total cost%
Accommodation £17 £212 0.58 0.49Hospital-based health services £348 £510 12.19 10.13Community health and social services £1,162 £973 41.06 34.12Medication £19 £93 0.64 0.53Voluntary sector services £33 £89 1.16 0.96Education and child care £1,255 £898 44.37 36.88Total service costs £2,834 £1,359 100.00 83.11Out-of-pocket expenses £284 £601 8.09Productivity losses £300 £655 8.80Total costs £3,417 £1,820 100.00
Box 1 Case studies of low and high cost cases High cost — £7,299 over six months Child H attends a mainstream nursery part-time and a specialist playgroup one day a week. He spent three nights in hospital following a grommet operation, and had two outpatient appointments with the ear, nose and throat specialist before and after the operation. Child H had monthly visits to his GP, regular contact with the practice nurse and his health visitor, and weekly contacts with a speech and language therapist at the local health centre. In addition, he had contact with a community paediatrician and a portage worker. Low cost — £345 over six months Child I does not attend any formal education or childcare, spending all his time at home with his mother. He had one visit to a paediatrician at the local hospital, but did not have any other hospital contacts or use any services in the community.
1 Barrett, B., Byford, S., Sharac, J., Hudry, K., Leadbitter, K., Temple, K., Aldred, C., Slonims, V., Green, J. & the PACT consortium (2012) Service and wider
societal costs of very young children with autism, Journal of Autism and Developmental Disorders, 42,5,797-804.

140 Unit Costs of Health and Social Care 2013
8.5.2 Children with low-functioning autism (ages 0-17) The research carried out by Knapp et al. (2007, 2009)1,2estimated the full costs of autism spectrum disorders (ASDs) in the United Kingdom. Costs estimated for children used a combination of routinely collected and research data and a pooled dataset of 146 children. The table below summarises the average cost per child with low-functioning ASD, whether living with their families or living in a residential or foster care placement. Costs are organised under a number of different service and support headings. Family expenses were also included and, where appropriate, costs were imputed for the lost employment of parents. The table distinguishes children in three different age groups. The annual costs for children with low-functioning ASD who live in residential or foster placements are estimated to be £18,064 (if aged 0-3), £45,290 (aged 4-11) and £69,797 (aged 12-17). For the two older age groups, the largest contributors to these totals are the care placements themselves, and special education. The authors noted that, given the availability of data, residential special school costs may have been under- estimated. Costs for children with low-functioning ASD who live with families are much lower: £4,846 (if aged 0-3), £31,105 (aged 4-11) and £45,173 (aged 12-17). For the two older age groups the largest contributors to these totals are special education, and health and social care services (including hospital and respite care). Average annual cost per child with low-functioning ASD Living in residential or foster care
placement Living in private households with family
Ages 0-3 Ages 4-11 Ages 12-17 Ages 0-3 Ages 4-11 Ages 12-17
Residential/foster care placement
£17,411 £25,072 £35,635 - - -
Hospital services - £962 £1,771 - £961 £1,769
Other health and social services
£653 £7,710 £446 £653 £7,710 £446
Respite care - - - - £3,154 £4,112
Special education - £10,203 £30,815 - £10,203 £30,815Education support - £1,321 £1,113 - £1,321 £1,113Treatments - £20 £17 - £20 £17Help from voluntary organisations
- - - - £941 £107
Benefits - - - £4,193 £4,464 £4,464Lost employment (parents)
- - - - £2,328 £2,328
Total annual cost (excluding benefits)
£18,064 £45,290 £69,797 £653 £26,640 £40,709
Total annual cost (including benefits)
£18,064 £45,290 £69,797 £4,846 £31,105 £45,173
Note: Expenditure on social security/welfare benefits could partly double-count the costs of lost employment for parents, which is why two totals are provided above.
1 Knapp, M., Romeo, R. & Beecham, J. (2007) The economic consequences of autism in the UK, Report to the Foundation for People with Learning
Disabilities, London. 2 Knapp, M., Romeo, R. & Beecham, J. (2009) Economic cost of autism in the UK, Autism, 13, 3, May, 317-336.

Unit Costs of Health and Social Care 2013 141
8.5.3 Children with high-functioning autism (ages 0-17) The research carried out by Knapp et al. (2007, 2009)1,2estimated the full costs of autism spectrum disorders (ASDs) in the United Kingdom. As in table 8.3.2, the table below distinguishes costs under a number of different service and support headings. The study assumed that all children with high-functioning ASD live with their parents. Average costs range from £1,878 to £24,062 per year. Average annual cost per child with high functioning ASD Living in private household with family
Ages 0-3 Ages 4-11 Ages 12-17Hospital services - £867 £867Other health and social services £1,355 £1,355 £1,355
Respite care - £7,266 £7,266Special education - £13,036 £13,036Education support - £608 £608Treatments - £165 £165Help from voluntary organisations - - -Benefits £523 £523 £523Lost employment (parents) - £241 £241Total annual cost (excluding benefits) £1,355 £23,539 £23,539Total annual cost (including benefits) £1,878 £24,062 £24,062Notes The costs for children aged 4-11 and aged 12-17 are the same. Expenditure on social security/welfare benefits could partly double-count the costs of lost employment for parents, which is why two totals are provided above.
1 Knapp, M., Romeo, R. & Beecham, J. (2007) The economic consequences of autism in the UK, Report to the Foundation for People with Learning
Disabilities, London. 2 Knapp, M., Romeo, R. & Beecham, J. (2009) Economic cost of autism in the UK, Autism, 13, 3, May, 317-336.
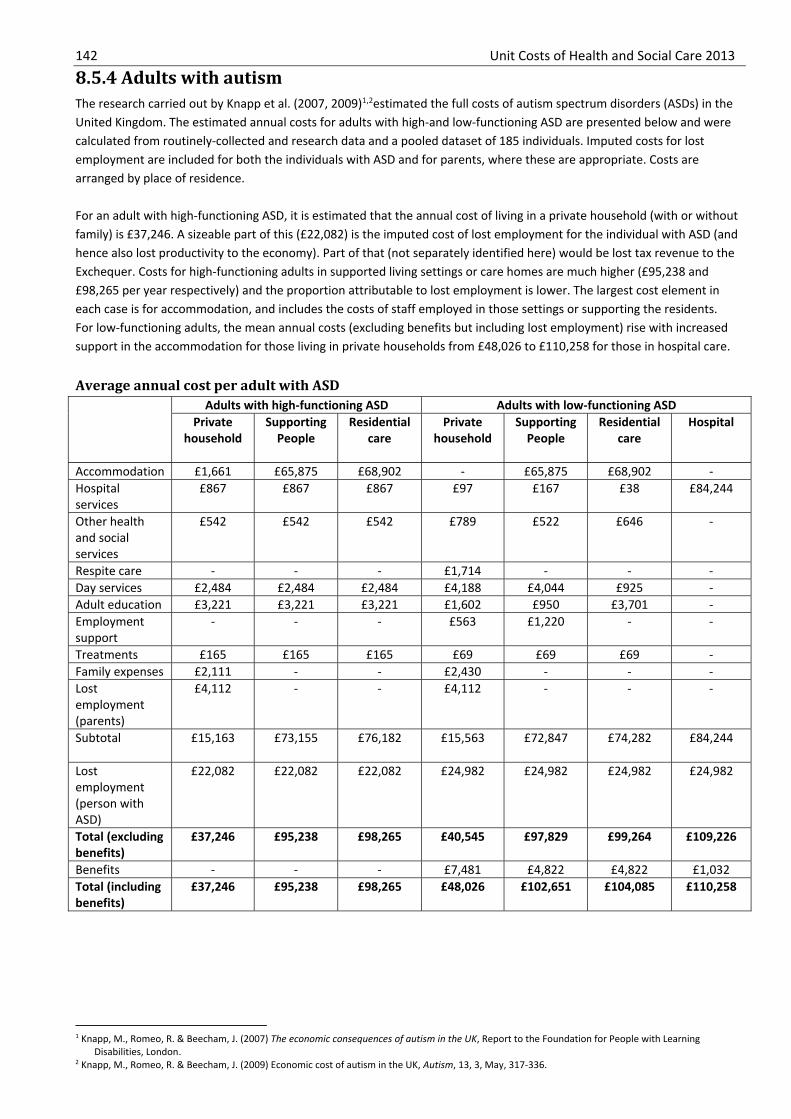
142 Unit Costs of Health and Social Care 2013
8.5.4 Adults with autism The research carried out by Knapp et al. (2007, 2009)1,2estimated the full costs of autism spectrum disorders (ASDs) in the United Kingdom. The estimated annual costs for adults with high-and low-functioning ASD are presented below and were calculated from routinely-collected and research data and a pooled dataset of 185 individuals. Imputed costs for lost employment are included for both the individuals with ASD and for parents, where these are appropriate. Costs are arranged by place of residence. For an adult with high-functioning ASD, it is estimated that the annual cost of living in a private household (with or without family) is £37,246. A sizeable part of this (£22,082) is the imputed cost of lost employment for the individual with ASD (and hence also lost productivity to the economy). Part of that (not separately identified here) would be lost tax revenue to the Exchequer. Costs for high-functioning adults in supported living settings or care homes are much higher (£95,238 and £98,265 per year respectively) and the proportion attributable to lost employment is lower. The largest cost element in each case is for accommodation, and includes the costs of staff employed in those settings or supporting the residents. For low-functioning adults, the mean annual costs (excluding benefits but including lost employment) rise with increased support in the accommodation for those living in private households from £48,026 to £110,258 for those in hospital care. Average annual cost per adult with ASD
Adults with high-functioning ASD Adults with low-functioning ASDPrivate
household
Supporting People
Residentialcare
Privatehousehold
Supporting People
Residentialcare
Hospital
Accommodation £1,661 £65,875 £68,902 - £65,875 £68,902 -Hospital services
£867 £867 £867 £97 £167 £38 £84,244
Other health and social services
£542 £542 £542 £789 £522 £646 -
Respite care - - - £1,714 - - -Day services £2,484 £2,484 £2,484 £4,188 £4,044 £925 -Adult education £3,221 £3,221 £3,221 £1,602 £950 £3,701 -Employment support
- - - £563 £1,220 - -
Treatments £165 £165 £165 £69 £69 £69 -Family expenses £2,111 - - £2,430 - - -Lost employment (parents)
£4,112 - - £4,112 - - -
Subtotal £15,163 £73,155 £76,182 £15,563 £72,847 £74,282 £84,244
Lost employment (person with ASD)
£22,082 £22,082 £22,082 £24,982 £24,982 £24,982 £24,982
Total (excluding benefits)
£37,246 £95,238 £98,265 £40,545 £97,829 £99,264 £109,226
Benefits - - - £7,481 £4,822 £4,822 £1,032Total (including benefits)
£37,246 £95,238 £98,265 £48,026 £102,651 £104,085 £110,258
1 Knapp, M., Romeo, R. & Beecham, J. (2007) The economic consequences of autism in the UK, Report to the Foundation for People with Learning
Disabilities, London. 2 Knapp, M., Romeo, R. & Beecham, J. (2009) Economic cost of autism in the UK, Autism, 13, 3, May, 317-336.

Unit Costs of Health and Social Care 2013 143
8.6 Services for children in care The following tables present illustrative costs of children in care reflecting a range of circumstances. Information from practitioners and managers, gathered in the course of developing unit costs for social work processes, indicated that some needs — or combinations of them — are likely to have an impact on the cost of placements: disabilities; emotional or behavioural difficulties; and offending behaviour.1 Unaccompanied asylum-seeking children comprise a further group whose circumstances, rather than their attributes, engender a different pattern of costs. In any population of looked-after children, there will be some children who have none of these additional support needs. Authorities with a higher proportion of children without additional needs will incur lower average costs per looked-after child. However, in reality their overall expenditure on children’s services may be greater, for such authorities may place a higher proportion of their whole population of children in need away from home than do those with better developed family support services. The study by Ward and colleagues identified different combinations of additional support needs. There were five ‘simple’ groups of children who display none or one of the attributes expected to affect costs, and six complex groups of children who display two or more additional support needs. In the sample of 478 children, 129 (27%) showed no evidence of additional support needs; 215 (45%) displayed one; 124 (26%) children displayed combinations of two; and a very small group of children (2%) displayed combinations of three or more. The care package costs for children described in tables 8.6.1-8.6.4 illustrate an example of the support received by children in some of these groups, taken from the study sample. Costs relate to time periods stated in each table.
1 Ward, H., Holmes, L. & Soper, J. (2008) Costs and consequences of placing children in care, Jessica Kingsley, London.

144 Unit Costs of Health and Social Care 2013
8.6.1 Children in care: low-cost — with no evidence of additional support needs Child A is a boy aged 14 with no evidence of additional support needs. The table shows the total cost incurred by social services and other agencies from February 2005 to October 2006, uprated using the PSS pay & prices inflator. Child A became looked after at the age of six, as the result of neglect. A care order was obtained in 2002. Since then he has been placed with the same local authority foster carers, a placement that had lasted eight years by the start of the study. In June 2006, his case was transferred to the leaving care team. Reviews were held at six-monthly intervals and his care plan was updated every six months. He attended six-monthly dental appointments and an annual looked-after child medical. During the time period shown above, this young person attended weekly, hour-long physiotherapy sessions as a result of a neck injury. He completed his statutory schooling in summer 2008 and obtained seven GCSEs. He then progressed to further education to start an A level course. Child A had a relatively inexpensive placement with local authority foster carers. He incurred some educational costs, in that he attended school, and some health care costs, but there was no exceptional expenditure. Please note that these figures have been rounded. Where appropriate, the original information has been adjusted to take account of Agenda for Change salaries. Process Cost to LA Total Cost to others TotalCare planning £242 x 3 £725 £172 x 3 £517Maintaining the placement £805 x 87 weeks
minus £9,7681 £60,269 £55 x 3 £165
Review £623 x 3 + £192 £1,889Legal £83 x 87 weeks £696 £124 x 87 weeks £1,074Transition to leaving care £1,849 £1,859Cost of services Mainstream schooling FE college Looked-after child medical Physiotherapy (home visit) Dentist
£285 per day £285 per day
£376 £76 x 87 weeks7 No current costs
£7,854£819 £37
£6,590
Total cost over 9 months £65,438 £17,057
1 Cost includes payment made for the placement and all activity to support the placement. There is a reduction in cost as a result of reduced activity once
the placement has lasted for more than one year. 2 An additional cost is incurred for the first 16+ review. 3 The cost of obtaining a care order has been divided over the total number of weeks between admission and the child’s eighteenth birthday. 4 Selwyn, J., Sturgess, W., Quinton, D. & Baxter, C. (2003) Costs and outcomes of non-infant adoptions, report to the Department of Health, Hadley Centre
for Adoption and Foster Care Studies, University of Bristol. 5 Based on the cost of a secondary school place. Calculated by dividing total secondary school expenditure by the total number of pupils on the roll, and by
the total number of days of pupil contact (190). Department for Education (2011) Section 251 data archive: Outturn data-detailed level 2008-09 onwards, outturn summary 2011-12, Department for Education, London and table 1A ‘All Schools: pupils with statements of special educational needs’.
6 Based on the unit cost of a surgery consultation with a general practitioner (see table 10.8b). 7 Department of Health (2013) NHS reference costs 2011-2012, https://www.gov.uk/government/publications/reference-costs-guidance-for-2011-12/
[accessed 9 October 2013].

Unit Costs of Health and Social Care 2013 145
8.6.2 Children in care: median cost — child with emotional or behavioural difficulties Between February 2005 and April 2006, Child B was placed with local authority foster carers (within the area of the authority). She then moved to another placement with local authority foster carers within the area of the authority. A care order was obtained for this young person when she first became looked after. During the time-frame, three review meetings were held and her care plan was also updated on three occasions. Child B attended mainstream school from December 2005 until June 2006 where she received support from a personal teaching assistant for four hours a week. This young person attended six-monthly dental appointments and also her annual looked-after child medical. Child B also received speech therapy until July 2006. Following a self-harm incident she was taken to the accident and emergency department and was referred to a clinical psychologist and began weekly sessions in April 2005. Costs to social services are relatively low, largely because she was placed with local authority foster carers within the authority area throughout the study period, and not considered difficult to place. There were relatively high costs to other agencies, designed to meet both her health and educational needs. Please note that these figures have been rounded. Where appropriate, the original information has been adjusted to take account of Agenda for Change salaries. Process Cost to LA Cost to others
Unit costs Total Unit costs TotalCare planning £242 x 3 £725 £172 x 3 £517Maintaining the placement £705 x 59 weeks minus
£5,2381 £36,357
Finding subsequent placement £313 £313 Review £623 x 3 £1,870 £55 x 3 £165Legal £102 x 59 weeks £590 £12.303 x 59 £726Cost of services Mainstream schooling Looked-after child medical Speech therapy Clinical psychologist Hospital accident and emergency visit (admitted) Personal teaching assistant Dentist
£284 per day £375
£91 x 60 weeks £134 x 52 weeks
£230
£22 (4 hours per week for 25
weeks)6 No current costs
£8,559£37
£5,460 £6,968 £230
£2,200
Total cost over 14 months £39,855 £24,862
1 Cost includes payment made for the placement and all activity to support the placement. There is a reduction in cost as a result of reduced activity once
the placement has lasted for more than one year. 2 The cost of obtaining a care order has been divided over the total number of weeks between admission and the child’s eighteenth birthday. 3 Selwyn, J., Sturgess, W., Quinton, D. & Baxter, C. (2003) Costs and outcomes of non-infant adoptions, report to the Department of Health, Hadley Centre
for Adoption and Foster Care Studies, University of Bristol. 4 Based on the cost of a secondary school place. Calculated by dividing total secondary school expenditure by the total number of pupils on the roll, and by
the total number of days of pupil contact (190). Department for Education (2012) Section 251 data archive: Outturn data-detailed level 2008-09 onwards, outturn summary 2011-12, Department for Education, London and table 1A ‘All Schools: pupils with statements of special educational needs’.
5 Based on the unit cost of a surgery consultation with a general practitioner (see table 10.8b). 6 Based on the average salary of a teaching assistant, http://www.tes.co.uk/article.aspx?storyCode=6168765/ [accessed 22 October 2013].

146 Unit Costs of Health and Social Care 2013
8.6.3 Children in care: high cost — children with emotional or behavioural difficulties and offending behaviour Child C was aged 15 at the start of the study. He first became looked after at the age of 11, when his parents needed respite. Prior to the start of the study he was placed in secure accommodation on five separate occasions. He had also been placed in various residential homes, schools and foster placements, many of which had broken down. As a consequence, he had been classified as ‘difficult to place’. During the study period (74 weeks), Child C experienced ten different placements. He also refused all statutory medical and dental appointments; furthermore, he refused any mental health support. Child C did not complete his statutory schooling, as a result of numerous exclusions and non-attendance. Prior to the start of the study he had a history of offending: this continued throughout the study, with him committing ten further offences. He ceased being looked after in summer 2007 when he refused to return to any placement provided by the local authority. The costs to social services were relatively high, both because of a number of out-of-authority, residential placements provided by independent sector agencies and due to nine changes of placement. There were substantial costs to other agencies (Youth Offending Team and the Police) as a result of his offending behaviour. No additional health care costs were incurred for this young man because of his refusal to engage in the services offered to him. Please note that these figures have been rounded. Where appropriate, the original information has been adjusted to take account of Agenda for Change salaries. Process Cost to LA Total Cost to others TotalCare planning £242 x 2 £483 £172 x 2 £345Maintaining the placement £357,840 1 £357,840 £55 x 74 weeks2 £4,066Ceased being looked after £418 £418Find subsequent placements £10,2933 £10,293Review £1,870 £1,870 £200 x 2 £400Cost of services4 YOT involvement/criminal costs £1,1105 x 74 weeks £82,140Total cost over 18.5 months £370,904 £86,951
1 This cost includes the payment made for the placement and all activity to support the placements. There is an increase in cost in the first three months
of a placement due to increased social worker activity. 2 Child C ceased being looked after in July 2011, therefore the time period being costed is 74 weeks. 3 Child C experienced nine changes of placement during the timeframe of the study. 4 There are no additional education costs because these are included in the costs of the placements in process three. 5 Liddle, M. (1998) Wasted Lives: Counting the Cost of Juvenile Offending, National Association for the Care and Resettlement of Offenders (NACRO),
London.

Unit Costs of Health and Social Care 2013 147
8.6.4 Children in care: very high cost — children with disabilities, emotional or behavioural difficulties plus offending behaviour Child D experienced nine different placements from February 2006 to October 2007. Initially he was placed in an independent sector agency residential unit with education facilities. In March 2006, he was placed with independent sector foster carers, again out of area. He then experienced three further placements, all out of the independent sector area authority and all provided by independent sector organisations: another residential unit, then another foster placement, then a third residential placement. In September 2006 he was placed overnight in a secure unit within the authority. He then had three independent sector placements: foster carers, a residential unit, and a specialised one-bedded residential unit in December 2006. This placement was also out of the area of the authority. Review meetings were held six-monthly and his care plan was also updated every six months. This young person attended the education provision in two different residential units up until summer 2006, when he was permanently excluded. He then started sessions with a home tutor in October 2006. During the given time period, he attended six-monthly dental appointments and his looked-after child medical. He also attended weekly sessions with a clinical psychologist from October 2006 onwards. In September 2006, he was accused of a criminal offence; the police were involved, but he was not convicted. These costs are markedly higher than for the majority of other children in the sample. Child D had become difficult to place; and increasing amounts of social work time had to be spent on finding the rare placements that were prepared to accept him. The costs of changing placements were calculated at over £1,000 per move. Please note that these figures have been rounded. Where appropriate, the original information has been adjusted to take account of Agenda for Change salaries. Process Cost to LA Total Cost to others TotalCare planning £146 x 3 £439 £172 x 3 £517Maintaining the placement £684,128 plus £1,7551 £685,883
Finding subsequent placements £20,272 £20,272 £94 x 8 £770Review £991 x 3 £2,972 £399 x 3 £1,197Legal £52 x 87 weeks £450 £63 x 87 weeks £539Transition to leaving care £1,859 £1,859 Cost of services Home tuition Permanent exclusion Looked-after child medical Clinical psychologist Police costs for criminal offence (police statement and interview) Dentist
No current costs No current costs4
£375 £134 per hour for 52
weeks £3246
No current costs
£37
£6,957
£324
Total cost over 20 months £711,875 £10,331
1 The cost includes the payment made for the placements and all activity to support the placements. There is an increase in cost in the first three months
of a placement due to increased social worker activity. 2 The cost of obtaining a care order has been divided over the total number of weeks between admission and the child’s eighteenth birthday. 3 Selwyn, J., Sturgess, W., Quinton, D. & Baxter, C. (2003) Costs and outcomes of non-infant adoptions, report to the Department of Health, Hadley Centre
for Adoption and Foster Care Studies, University of Bristol. 4 See Prince’s Trust (2007) The cost of exclusion, Prince’s Trust, London. http://www.princes-
trust.org.uk/PDF/Princes%20Trust%20Research%20Cost%20of%20Exclusion%20apr07.pdf [accessed 9 October 2013]. 5 Based on the unit cost of a surgery consultation with a general practitioner (see table 10.8b). 6 Bedfordshire Police (2012) 2012/13 Fees and charges handbook, http://www.bedfordshire.police.uk/PDF/bedfordshire_fees_and_charges.pdf [accessed
9 October 2013].

148 Unit Costs of Health and Social Care 2013
Child A - No additional needs
Month 1 Month 2 Month 3 Month 4 Month 5 Month 6
Social Care Process Additional Social Care Services
CiN 3 - Ongoing support Family support
CiN 6 - Planning and review
8.7 Services for children in need The care package costs for children described in the tables (8.7.1-8.7.4) illustrate examples of the support received by children in need reflecting a range of circumstances. These costs have been drawn from a study undertaken by the Centre for Child and Family Research (CCFR) at Loughborough University in which the costs of key social care processes for children in need have been calculated in four local authorities, including initial and core assessments, children in need reviews, along with ongoing social care activity to support families.1 The study used a bottom-up costing methodology,2 which uses social care activity time data as the basis for building up unit costs. The unit costs per hour are based on average salaries for each staff type using national salary scales and applying oncosts and overheads as presented in this volume. The costs provided were for 2008/09 and have been uprated using the appropriate inflators. For social services support received by children in need, see tables 6.5.1-6.5.4.
8.7.1 Child A – no additional needs Child A – No additional needs: out of London costsChild A, a boy aged 11 at the start of the study, was referred to social care in August 2007. Support was offered to his family, who had been assessed as being in need due to ‘family dysfunction’. Child A lived with his mother and had no siblings. Concerns had been raised about the relationship between Child A and his mother, in particular the ability of his mother to deal with his tantrums and use appropriate levels of discipline. In addition to the ongoing case management provided by the allocated social worker, a family support worker from the social care team had been allocated to the case to undertake some work around discipline and behaviour. A weekly visit was made by the family support worker. This work ceased in December 2008, three months into the data collection period. One Child in Need Review was carried out during the study time period.
Timeline for Child A Total costs for Child A during the six-month data collection perioda
Social care activity costs (out of London costs)Process Frequency Unit cost Sub-totalCiN 3 – ongoing support 6 months £110 £661CiN 6 – planning and review £229 £229
Cost of social care case management activity £890Additional services costs (out of London costs) Family support Once a week for 10
weeksa £35 £347
Cost of service provision £347Total cost incurred by children’s social care for Child A during the 6-month period £1,237a There was no evidence of additional support services being provided by other agencies during the study timeframe.
1 Holmes, L. & McDermid, S. (2012) Understanding costs and outcomes in child welfare services, Jessica Kingsley, London. 2 Beecham, J. (2000) Unit costs – not exactly child’s play: a guide to estimating unit costs for children’s social care, Department of Health, Dartington Social
Research Unit and the Personal Social Services Research Unit, University of Kent; Ward, H., Holmes, L. & Soper, J. (2008) Costs and consequences of placing children in care, Jessica Kingsley, London.

Unit Costs of Health and Social Care 2013 149
Child B - No additional needs, child under two
Month 1 Month 2 Month 3 Month 4 Month 5 Month 6
Social Care Process Additional Social Care Services Additional Services from Other Agencies
CiN 3 - Ongoing support Family support One to one support from mental health social worker
Children’s centre stay and play groupCiN 6 - Planning and review
8.7.2 Child B – no additional needs, aged six and under Child B – No additional needs, aged six and under: London costsChild B was referred to social care in June 2008, aged 14 months, due to concerns about her mother’s mental health. Although both parents lived at home, Child B’s mother was struggling to fulfil her caring duties because of her anxiety and depression. These difficulties were also putting a strain on the parents’ relationship. Consequently, Child B was assessed as being in need under Section 17 of the Children Act 1989. The primary need code was recorded as ‘family in acute distress’ and no additional needs were identified. During the study time period, the family were in receipt of a number of additional support services. Weekly one-to-one home visits were provided by a mental health social worker from multi-agency early intervention service. A mental health support worker was funded by the Primary Care Trust to address and support Child B’s mother. Additional one-to-one support was offered to Child B’s mother for an hour each week by the local authority family support team. The family also attended weekly group sessions at the local children’s centre. There were two Child in Need Reviews during the data collection period.
Timeline for Child B
Total costs for child B during the six-month data collection perioda
Social care activity costs (London costs) Process Frequency Unit cost Sub-totalCiN 3 – ongoing support 6 months £238 £1,428CiN 6 – planning and review 2 £268 £555
Cost of social care case management activity £1,983Additional services costs (London costs) Social care services Family support Once a week for 21 weeks1 £44 £920Cost of service care provision £920Services from other agencies Children’s centre stay and play group provided by Local authority, not social care
Once a week for 21 weeks2 £15 £324
One-to-one support from mental health social worker provided by the PCT
Once a week for 21 weeks3 £119 £2,502
Cost of service provision from other providers £2,826Total cost incurred by children’s social care for Child B during the 6-month period £2,903Total cost incurred for Child B during the 6-month period £5,729a There was no evidence of additional support services being provided by social care during the study timeframe.
1 Unit cost based on a one-hour visit and 40 minutes travel time. 2 Tidmarsh, J. & Schneider, J. (2005) Typical costs of sure start local programmes, in L. Curtis (ed.) Unit Costs of Health and Social Care 2005, Personal
Social Services Research Unit, University of Kent, Canterbury. 3 Curtis, L. (2011) Unit Costs of Health and Social Care 2011, Personal Social Services Research Unit, University of Kent, Canterbury. (Costs have been
uprated to 2013 values.)

150 Unit Costs of Health and Social Care 2013
8.7.3 Child C – emotional or behavioural difficulties Child C – Boy with emotional or behavioural difficulties: Out of London costs.Child C was aged 14 at the time of the data collection and had been receiving support as a child in need since September 2008, as his family was ‘in acute distress’. Child C’s mother had been subject to domestic abuse by her partner and, although he no longer lived in the family home, their relationship had continued to be chaotic. The family had been receiving family therapy, provided by a voluntary agency, twice a month, to help another sibling with obsessive compulsive disorder. The family’s circumstances were reviewed at a Child in Need Review in November 2008. At this review meeting Child C’s teacher noted that he had also exhibited symptoms of low self-esteem. His school attendance has been low and his teacher was concerned that this may be as a result of his anxieties around socialising with his peers. The review meeting concluded that the family’s situation had not improved and, because of the additional concerns raised by the teacher and social worker, a Core Assessment was recommended. This was carried out in December 2008. Subsequently, Child C was referred to CAMHS for weekly sessions and his mother was offered women’s aid support. Timeline for Child C
Total costs for Child C during the six-month data collection perioda
Social care activity costs (out of London costs)Process Frequency Unit cost Sub-totalCiN 3 – ongoing support 6 months £206 £1,234CiN 6 – planning and review £229 £229
CiN 5 – core assessment £605 £605
Cost of social care case management activity £2,068Additional services from other agencies (out of London costs)Family therapy provided by voluntary agency Twice a month for 6
months1 £104 £1,096
Women’s aid provided by voluntary agency Weekly for 3 months2 £65 £686CAMHS provided by Primary Care Trust Weekly for 3 months3 £69 £829Cost of service provision from other providers £2,611Total cost incurred by children’s social care for Child B during the 6-month period £2,068Total cost incurred for Child B during the 6-month period £4,679a There was no evidence of additional support services being provided by social care during the study timeframe.
1 Barlow, J., Davis, H., McIntosh, E, Jarrett, P., Mockford, C. & Stewart-Brown, S. (2006) Role of home visiting in improving parenting and health in families
at risk of abuse and neglect: results of a multicentre randomised controlled trial and economic evaluation, Archives of Disease in Childhood, 92, 3, 229-233.
2 McIntosh, E. & Barlow, J. (2006) The costs of an intensive home visiting intervention for vulnerable families, in A. Netten & L. Curtis (eds) Unit Costs of Health and Social Care 2006, PSSRU, University of Kent, Canterbury.
3 Curtis, L. (2013) Unit Costs of Health and Social Care 2013, Personal Social Services Research Unit, University of Kent, Canterbury.
Child C - Child with emotional and behavioural difficulties
Month 1 Month 2 Month 3 Month 4 Month 5 Month 6
Social Care Process Additional Services from Other Agencies
CiN 3 - Ongoing support Family therapy
CiN 6 - Planning and review Woman's aid worker
CAMHS CiN 5 - Core assessment

Unit Costs of Health and Social Care 2013 151
8.7.4 Child D – became looked after during the data collection Child D was first referred to social care in August 2007 and had been receiving support as part of a Child Protection Plan. Her parents were identified as regular drug users and this was felt to be impacting on their ability to care appropriately for her needs. In particular, her mother’s chaotic lifestyle and regular drug use meant that she frequently failed to get Child D ready for school. The home environment was felt to be unsuitable for young children. Child D was five and a half at the start of the data collection. Child D lived with her mother, and had regular contact with her father who also misused drugs. Both parents were reluctant to engage with additional services, although Child D’s father would occasionally attend a stay-and-play group at the local Sure Start children’s centre with his daughter. In early December 2008 the social worker was contacted by a child care worker at the children’s centre who reported that Child D presented with bruises, allegedly caused by her mother’s new partner. Along with concerns regarding the lack of improvements since the implementation of a Child Protection Plan, further investigation was instigated and the decision was taken for Child D to be placed in local authority foster care. A review was held 28 days after the child was placed and the Care Plan updated following that review. Child D remained on a Child Protection Plan whilst being looked after. Timeline for Child D
Total costs for Child D during the six-month data collection perioda
Social care activity costs (London costs) Process Frequency Unit cost Sub-total
Child in Need processes CiN 3 – ongoing support Two and a half months £238 £595Looked-after children processes1 LAC1 – Decide child needs to be looked after
£1,110 £1,110
LAC3 – Maintaining the placement2 Three and a half months
LAC2 – Care planning £216 £216
LAC6 – Review £676
Cost of social care case management activity £2,597Additional services from other agencies (London costs)Sure Start stay and play group provided by Local authority (not social care)3
Twice during the data collection period
£15 £29
Cost of service provision from other providers £29Total cost incurred by children’s social care for Child D during the 6-month period £2,597Total cost incurred for Child B during the 6-month period £2,626a There was no evidence of additional support services being provided by social care during the study timeframe.
1 Ward, H., Holmes, L. & Soper, J. (2008) Costs and consequences of placing children in care, Jessica Kingsley, London. 2 The costs of maintaining the placement also include the weekly fees and allowance of the child’s placement. 3 Tidmarsh, J. & Schneider, J. (2005) Typical costs of sure start local programmes in L. Curtis (ed.) Unit Costs of Health and Social Care 2005, Personal Social
Services Research Unit, University of Kent, Canterbury.
Child D - Child became looked after during the study
Month 1 Month 2 Month 3 Month 4 Month 5 Month 6
Social Care Process Additional Services from Other Agencies
CiN 3 - Ongoing support SureStart stay and play group for a child on a Child Protection Plan
LAC 1 - Decide child needs to be looked after
LAC 3 - Maintaining the placement including local authority foster placement and ongoing support from social worker
LAC 6 - Review
LAC 2 - Care planning

152 Unit Costs of Health and Social Care 2013
8.8 Common Assessment Framework (CAF) The Common Assessment Framework (CAF) is a standardised approach for assessing children and their families, to facilitate the early identification of additional needs and to promote a co-ordinated service response. CAF is underpinned by an integrated approach to support and has been designed for use by all professionals working with children and families with additional needs who do not meet the threshold for more intensive interventions such as those associated with children’s social care or safeguarding.1 Information for tables 8.8.1-8.8.3 have been provided by Lisa Holmes and Samantha McDermid from the Centre for Child and Family Research, Loughborough, and have been drawn from Holmes et al. (2012).1 The study used a bottom-up costing methodology,2 which uses social care activity time data as the basis for building up unit costs. The unit costs per hour are based on average salaries for each staff type using national salary scales and applying oncosts and overheads as presented in this publication.
8.8.1 Family A: support from a lead professional (LP) Family A live in London and consists of Jennifer, who has two sons, Ryan and Jack, aged 8 and 4 respectively. Jennifer and the boys’ father had recently separated. Jennifer contacted CAMHS after discovering that Ryan had been self-harming. CAHMS informed Jennifer that they had a six-month waiting list for assessments but referred their case onto ‘Family Help’, a voluntary organisation that supports vulnerable children and families. The service manager completed a CAF, although a pre-CAF checklist was not completed. A family support worker from Family Help was allocated to support their case and was identified as the lead professional for the child and family. Following the completion of the CAF assessment, the support worker visited the child and family on a fortnightly basis. Team Around the Child (TAC) meetings were not held, and the support worker continued to support the child and family until a CAHMS assessment was offered. The child and family were not in receipt of other additional services at this time. Jennifer reported that the support they had received from Family Help had been extremely useful and that Ryan’s self-harming behaviour had reduced. Jennifer reported that she thought that the CAF had helped her family.
Timeline for family A
Total costs for family A during a six-month period3 Social care activity costs (London costs) Process Frequency Unit cost Sub-totalProcess 2: CAF assessment completed by service manager
£334 £334
Process 4: ongoing support from the family support worker
Fortnightly visits for 6 months4 £51 £613
Total cost of CAF support for Family A during the 6-month period £947
1 Holmes, L., McDermid, S., Padley, M. & Soper, J. (2012) Exploration of the costs and impact of the Common Assessment Framework (Research Report
DFE-RR210), Department for Education, London. 2 Beecham, J. (2000) Unit costs – not exactly child’s play: a guide to estimating unit costs for children’s social care, Department of Health, Dartington Social
Research Unit and the Personal Social Services Research Unit, University of Kent; Ward, H., Holmes, L. & Soper, J. (2008) Costs and consequences of placing children in care, Jessica Kingsley, London.
3 Costs have been rounded to the nearest pound. 4 Holmes, L. & McDermid, S. (2012) Understanding costs and outcomes in child welfare services: a comprehensive costing approach to managing your
resources, Jessica Kingsley, London. (This suggests that the average time for a home visit is 1 hour 40 minutes, including travel time.)
Family A - Support provided by Lead Professional
Month 1 Month 2 Month 3 Month 4 Month 5 Month 6
Case management process
Process 2: Completion of the CAF Assessment
Process 4: Ongoing support from the Lead Professional
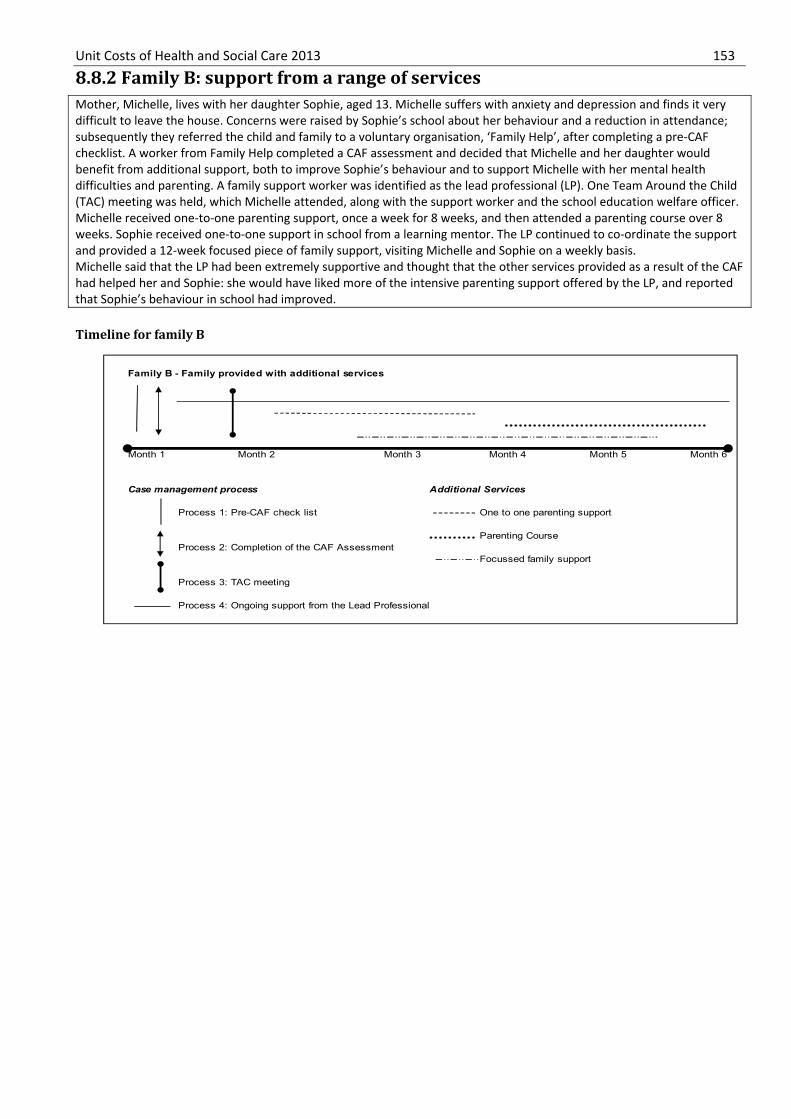
Unit Costs of Health and Social Care 2013 153
8.8.2 Family B: support from a range of services Mother, Michelle, lives with her daughter Sophie, aged 13. Michelle suffers with anxiety and depression and finds it very difficult to leave the house. Concerns were raised by Sophie’s school about her behaviour and a reduction in attendance; subsequently they referred the child and family to a voluntary organisation, ‘Family Help’, after completing a pre-CAF checklist. A worker from Family Help completed a CAF assessment and decided that Michelle and her daughter would benefit from additional support, both to improve Sophie’s behaviour and to support Michelle with her mental health difficulties and parenting. A family support worker was identified as the lead professional (LP). One Team Around the Child (TAC) meeting was held, which Michelle attended, along with the support worker and the school education welfare officer. Michelle received one-to-one parenting support, once a week for 8 weeks, and then attended a parenting course over 8 weeks. Sophie received one-to-one support in school from a learning mentor. The LP continued to co-ordinate the support and provided a 12-week focused piece of family support, visiting Michelle and Sophie on a weekly basis. Michelle said that the LP had been extremely supportive and thought that the other services provided as a result of the CAF had helped her and Sophie: she would have liked more of the intensive parenting support offered by the LP, and reported that Sophie’s behaviour in school had improved. Timeline for family B
Family B - Family provided with additional services
Month 1 Month 2 Month 3 Month 4 Month 5 Month 6
Case management process Additional Services
Process 1: Pre-CAF check list One to one parenting support
Parenting CourseProcess 2: Completion of the CAF Assessment
Focussed family support
Process 3: TAC meeting
Process 4: Ongoing support from the Lead Professional

154 Unit Costs of Health and Social Care 2013 Total costs for family B during the six-month period1 Social care activity costs (out of London costs)Process Frequency Unit cost Sub-totalProcess 1: pre-CAF checklist completed by education welfare officer
Once £17 £17
Process 2: completion of the CAF assessment by family support worker
Once £171 £171
Process 3: TAC meeting attended by family support worker
Once £224 £224
Process 3: TAC meeting attended by education welfare officer
Once £27 £27
Process 4: ongoing support of lead professional by family support worker
Over five and a half months
£161 £890
Cost of case management activity £1,329Additional services (out of London costs) Parenting course Once a week for 8
weeks2 £48 £384
One-to-one parenting support Once a week for 8 weeks
£51 £408
Focused family support Once a week for 12 weeks
£50 £600
Total cost of additional support £1,392Total cost of CAF support incurred for Family B during the 6-month period £2,721
1 Costs have been rounded to the nearest pound. 2 Tidmarsh, J. & Schneider, J. (2005) Typical costs of sure start local programmes, in L. Curtis (ed.) Unit Costs of Health and Social Care 2005, Personal
Social Services Research Unit, University of Kent, Canterbury.

Unit Costs of Health and Social Care 2013 155
8.8.3 Family C: CAF as a step up to social care Kyle, aged 13, lives with his mother, Louise, and four year old brother, Robert. A CAF was initiated in January 2011 by the school due to concerns about Kyle’s deteriorating behaviour at home and school. Kyle has long-standing mental health difficulties, anxieties about new situations and had difficulties making friends. Louise also had mental health difficulties and there were concerns about her capacity to maintain the children’s food and drink intake. There were also some concerns about Louise’s offending behaviour. The CAF was undertaken by the school learning mentor, and a Team Around the Child (TAC) meeting was convened. The TAC was attended by the learning mentor, an educational psychologist, and a family support worker from Children’s Services. Prior to the initial TAC meeting, Kyle had been permanently excluded from school after his behaviour became untenable and was placed at another school at the end of March 2011. A referral was also made to the children’s social care emergency duty team by a hospital doctor following concerns about Louise’s mental health. The social care team were aware that a CAF was in process and therefore no further action was taken. A number of services were initiated to support the child and family; ADHD support was provided to both Kyle and Louise. They saw the ADHD nurse on a monthly basis. A family support worker was also identified to address some of Kyle’s behavioural difficulties. The family support worker visited the family once a week for 8 weeks. Despite some improvements, the family suffered a number of setbacks and was referred to children’s social care in July 2011. The CAF case was closed, and a child protection plan was initiated. Timeline for family C
Family C - Step up to social care
Month 1 Month 2 Month 3 Month 4 Month 5 Month 6
Case management process for CAF Case management process for social care Additional Services
CiN process 1: Initial contact Family supportProcess 1: Pre-CAF check list and referral
ADHD Nurse
Process 2: Completion CiN process 7:Section 47 of the CAF Assessment Enquiry
Process 3: TAC meeting
Process 4: Ongoing support from the Lead Professional
Process 5 CAF closed

156 Unit Costs of Health and Social Care 2013 Total costs for family C during the six-month period1 Social care activity costs (out of London costs): CAFProcess Frequency Unit cost Sub-totalProcess 1: Pre-CAF checklist completed by learning mentor
Once £13 £13
Process 2: Completion of the CAF assessment by learning mentor
Once £160 £160
Process 3: TAC meeting attended by learning mentorOnce
£208
£273 Educational psychologist £40
Family support worker £25
Process 4: Ongoing support of lead professional by learning mentor
Five months £153 £766
Process 5: Case closure £88
Cost of case management activity for CAF £1,300Social care activity costs (out of London): social careCiN process 1: initial contact and referral with no further action
£216 £216
CiN process 1: initial contact and referral £195 £195CiN process 7: Section 47 enquiry £535 £535Total cost of care management activity for social care £946Additional services (out of London costs) ADHD nurse Once a month
for 6 months2 £46 £276
Family support worker3 Once a week for 8 weeks
£42 £333
Total cost of additional services £609Total cost of CAF support incurred for Family C during the 6-month period £2,246Total cost of support for Family C during the 6-month period £2,855
1 Costs have been rounded to the nearest pound. 2 Holmes, L. & McDermid, S. (2012) Understanding costs and outcomes in child welfare services: a comprehensive costing approach to managing your
resources, Jessica Kingsley, London. 3 Curtis, L. (2011) Unit Costs of Health and Social Care, Personal Social Services Research Unit, University of Kent, Canterbury.

Unit Costs of Health and Social Care 2013 157
8.9 Services for children returning home from care A child is recorded as returning home from an episode of care if he or she ceases to be looked after by returning to live with parents or another person who has parental responsibility. This includes a child who returns to live with their adoptive parents but does not include a child who becomes the subject of an adoption order for the first time, nor a child who becomes the subject of a residence or special guardianship order.1 In light of the research findings about the lack of support leading to breakdown of reunification in some circumstances, the Department for Education has worked with Loughborough University to draw up a number of scenarios reflecting the costs of returning children home based on a range of ages, circumstances and placement types. Information for tables 8.9.1 to 8.9.4 have been drawn from a study commissioned by the Childhood Wellbeing Research Centre and undertaken by the Centre for Child and Family Research (CCFR) at Loughborough University.1 They make use of existing unit costs that have been estimated in previous research studies carried out by the CCFR.2,3,4 The aim of this work was to provide a series of estimated unit cost trajectories for children returning home from care. The care illustrates examples of the support received by children 12 months after returning home from care. The unit cost estimations used are based on estimates for the 2012/13 financial year. Where costs have been taken from research completed in previous years, the unit costs have been inflated to 2012/13 using inflation indices. The unit costs of support foster care have been estimated for the Fostering Network, and have been included in these case studies with permission from the Fostering Network.5
1 Department for Education (2013) Data pack: improving permanence for looked after children, http://www.education.gov.uk/a00227754/looked-after-
children-data-pack/ [accessed 1 October 2013]. 2 Ward, H., Holmes, L. & Soper, J. (2008) Costs and consequences of placing children in care, Jessica Kingsley, London. 3 Holmes, L., McDermid, S., Padley, M. & Soper, J. (2012) Exploration of the costs and outcomes of the Common Assessment Framework, Department of
Health, London. 4 Holmes, L. & McDermid, S. (2012) Understanding costs and outcomes in child welfare services, Jessica Kingsley, London. 5 The Fostering Network and Holmes, L. (2013) Unit Costs of Support Care, the Fostering Network, London.

158 Unit Costs of Health and Social Care 2013
8.9.1 Child A – low level of child in need support on return home from care Child A became looked after under Section 20 arrangements at the age of five. Child A was placed with grandparents out of the area of the local authority under kinship placement arrangements. The placement lasted for three months and, on return home, formal support was not provided; however, the grandmother provided ongoing informal support to the family. In October 2012 child A became looked after again and returned to the care of the grandmother.1 Timeline for child A
Social care processes (case management) Process Frequency Unit cost Sub-totalLAC 1 – became LAC Twice £1,266 £2,532 LAC 2 – care plan Once a fortnight £239 £478 LAC 3 – ongoing Six months in total £2,903 £17,418 LAC 4 – return home Once £412 £412 LAC 6 – review Twice £614 £1,228 Total social care case management costs £22,068
1 Department for Education (2013) Data pack: improving permanence for looked after children, http://www.education.gov.uk/a00227754/looked-after-
children-data-pack/ [accessed 1 October 2013].
Jan-12 Jan-13
LAC Process 3 - ongoing placement support
LAC Process 2 - care plan
LAC Process 6 - review
LAC Process 4 - return home
LAC Process 1 - becomes looked after
Social care processes (case management)

Unit Costs of Health and Social Care 2013 159
8.9.2 Child B – high level of child in need support on return home from care Child B first became looked after as a baby and was placed with local authority foster carers when an interim care order was obtained. In February 2011, Child A returned home and a high level of (child in need) support was provided to the family throughout the time period shown on the timeline below. For the duration of the 12 months shown below, the parent was provided with drug and alcohol treatment services (Department for Education, 2013).1
Timeline for child B
Social care processes (case management) Process Frequency Unit cost Sub-totalCiN 3 – ongoing support 12 months £198 £2,376CiN 6 – planning and review 3 times £228 £684
Cost of social care case management activity £3,060Additional services costs (out of London) Drug and alcohol treatment services Once a fortnight £120 £3,120 Total social care case management costs £6,180
1 Department for Education (2013) Data pack: improving permanence for looked after children, http://www.education.gov.uk/a00227754/looked-after-
children-data-pack/ [accessed 1 October 2013].
Jan-12 Jan-13
KeyOther support or services
Process 3 - CiN ongoing support Drug and alcohol treatment services
Process 6 - CiN planning and review
Social care processes (case management)

160 Unit Costs of Health and Social Care 2013
8.9.3 Child C – high level of child in need support and support foster care provided on return home from care Child C was placed in a specialist therapeutic foster care community placement outside the area of the placing authority between September 2011 and October 2012. Prior to this placement, child C had experienced two other placements and was accommodated under Section 20 arrangements.1 Child C had emotional and behavioural problems, and was aged 11 at the start of the specialist placement included on the timeline below. On return home, child C was referred to receive support foster care. A support foster care family was identified, and respite care was provided by the carers for one overnight stay per week. The case also remained open as a CiN/support foster care case, and this support continued until March 2013.2 Timeline for child C
Social care processes (case management) Process Frequency Unit cost Sub-totalLAC 2 – carer plan Twice £238 £476LAC 3 – ongoing 10 months £11,855 £118,550
LAC 4 – return home Once £412 £412LAC 6 – review Twice £614 £1,228Support foster care – ongoing 2 months £688 £1,376Support foster care – referral Once £392 £392Total social care case management unit costs £122,434
1 Department for Education (2012) Children in care, http://www.education.gov.uk/childrenandyoungpeople/safeguardingchildren/a0068940/children-in-
care/ [accessed 10 September, 2013]. 2 Department for Education (2013) Data pack: improving permanence for looked after children, http://www.education.gov.uk/a00227754/looked-after-
children-data-pack [accessed 1 October 2013].
Jan-12 Jan-13
LAC Process 3 - ongoing placement supportSupport F/C 1 - referral
LAC Process 4 - return home
Support F/C 2 - ongoing support
LAC Process 6 - review
LAC Process 2 - care plan
Social care processes (case management)

Unit Costs of Health and Social Care 2013 161
8.9.4 Child D – ongoing support provided by an independent fostering provider on return home from care
Child D was placed with Intensive Foster Placement (IFP) foster carers in June 2010, aged 16, after a care order wasobtained. Child D had emotional and behavioural difficulties and remained in the placement until August 2011. On return home, child D continued to be supported by the IFP, and there was a good working relationship between the foster carers and birth family. The support continued until the end of March 2012. The timeline below shows the CiN support provided during the first three months of 2012.1
Timeline for child D
Social care processes (case management) Process Frequency Unit cost Sub-total CiN 3 – ongoing support 3 months £1,072 £3,216 CiN 4 – close case Once £98 £98
Total social care case management unit costs £3,314
1 Department for Education (2013) Data pack: improving permanence for looked after children, http://www.education.gov.uk/a00227754/looked-after-
children-data-pack [accessed 1 October 2013].
Jan-12 Jan-13
Key
Process 3 - CiN ongoing support
Process 4 - close CiN case
Social care processes (case management)

162 Unit Costs of Health and Social Care 2013
8.10 Support care for children Support care is short-term preventative foster care aimed at families in crisis, with a view to avoiding a child being taken into care full-time and long-term. Support carers look after the child on a part-time basis, while at the same time a package of other support services is offered to the family, giving them space, guidance and help to work through their problems. The information reproduced below has been drawn from the Unit Costs of Support Care, a report by the Fostering Network (2013) in conjunction with Lisa Holmes from the Centre for Child and Family Research (CCFR) at Loughborough University.1 The report demonstrates that support care, including the accompanying support services for families, has a far lower unit cost than the foster care it replaces. As well as helping struggling families stay together, support care also helps family and friends’ carers such as grandparents, who report that they struggle when children are first placed with them. It can also help to prevent adoption breakdown, and be a breathing space for some families whose children do not reach the criteria for short breaks for disabled children but desperately need help. Using the methodology developed by the team at CCFR and a range of pre-existing process unit costs (for example, referrals, reviews and ongoing support),2 the costs of support care, using individual case studies as illustrative examples, are presented in tables 8.10.1 and 8.10.2. Comparative costs if the local authority had been required to place them as looked-after children are also shown. Costs have been uprated to current prices using the PSS pay & prices inflator. The key for the social care processes is as follows:
The first case study (8.10.1) shows that, for Family A, the costs would have been much higher if the local authority had been required to place them as looked-after children. The cost to look after the three children in local authority foster care for one year is £128,657, which is ten times higher than the estimated social care costs of providing support care for the same duration (£10,509). The second case study (8.10.2) shows that the total estimated cost to look after child B in local authority foster care for one year is £45,777 – four times higher than the estimated social care costs of providing support care for the same duration (£10,822).
1 The Fostering Network and Holmes, L. (2013) Unit costs of support care, the Fostering Network, London. 2 Taken from: Ward, H., Holmes, L. & Soper, J. (2009) Costs and consequences of placing children in care, Jessica Kingsley, London; Holmes, L. & McDermid,
S. (2012) Understanding costs and outcomes in child welfare services: a comprehensive costing approach to managing your resources, Loughborough University; Holmes, L. McDermid, S. Padley, M. & Soper, J. (2012) Exploration of the costs and impact of the Common Assessment Framework, Department for Education, London.
KeySocial Care Processes Other services
Process 1: Referral Housing support
Budgeting adviceProcess 2
Parenting classes
Process 3: Review
Process 4: Case closure
: Ongoing support: Each of the three lines represent the ongoing support offered to the three children

Unit Costs of Health and Social Care 2013 163
8.10.1 Family A – support care for a sibling group Family A were referred to support care following social work concerns about their living arrangements and the deterioration in family relationships. The family consisted of 11 children living with their mother and step-fater in a small three-bedroom house. In addition to support care, the family were engaged with a housing support service, budgeting advice, parenting classes and ongoing social work support. Support care was initially offered to three members of the family: Jack aged 15, Samantha aged 8 and Jordan aged 7. Different support carers were identified for each of the children and they were offered one overnight stay with support carers once a fortnight. Timeline
NB see 8.10 for the key to this diagram Family A’s: support care and annual social care costs Process Process unit cost Social work cost Fostering cost1 Referral £392 £246 £1462 Ongoing support (£226 x 12) and (£108 x 12) £2,716 £1,3042 Ongoing support [(£147/7) x 26] x 3 + [(£424/7) x 26)
x 3 £6,362
3 Review £82 x 8 and £68 x 8 £661 £5504 Case closure £278 £244 £34Total £3,868 £8,396 Annual costs of other support or services provided alongside support care Support or service Frequency/duration Unit cost SubtotalParenting programme One course – group £500 £500 Housing support Once a fortnight £31 £806 Budgeting advice Once a fortnight £31 £806 Total cost of other support or services £2,112 Family A: social care costs for looked-after children The cost to look after the three children in local authority foster care for one year would be £128,657 which is nine times higher than the estimated social care costs of providing support care for the same duration (£10,509). These costs include the activity to find the first placement for the three siblings, to review the case (using statutory timeframes of 28 days, three-monthly and six-monthly intervals), update care plans and also support the children in their placements. The costs of these processes are detailed below: Process Cost 1: Decide children need to be looked after and find first placement £965 2: Care plans: Updated three times following reviews for each of the children (£238 x 9)
£2,142
3: Maintain the placements: Support and placement costs (£793 per child per week)
£123,708
6: Review: Held on three occasions during the year (3 x £614) £1,842

164 Unit Costs of Health and Social Care 2013
8.10.2 Child B – Support care for a single child Child B (aged six) was referred for support care as a result of housing and financial concerns. He was living with his father and step-mother, along with five other children, in a two-bedroom property throughout the week, and a further three children stayed at weekends. Space and overcrowding were key concerns, as were the financial pressures. Child B was offered support care for one overnight stay per week at the weekend. Child B’s father also agreed to attend support sessions for parenting and budgeting. Child B continued with weekly visits to his support carers for six months, until his family secured larger accommodation. He then continued to receive support care, on a fortnightly basis for three further months before being reduced to monthly stays. Child B and his family no longer required support care or other support services after 12 months. Timeline
NB see 8.10 for the key to this diagram Child B’s: support care and annual social care unit costs Process Process unit cost Social work cost Fostering cost1. £392 £246 £146 2. (£226 x 12) and (£108 x 12) £2,716 £1,3042. [(£147/7) x 42] and [(£424/7) x 42] £3,4263. (£82 x 8) and £68 £661 £550 4. £278 £244 £34 Total £3,868 £5,461 Annual costs of other support or services, provided alongside support care Support or service Frequency/duration Unit cost SubtotalParenting programme Once course – group £500 £500 Housing support Six sessions £31 £186 Budgeting advice Once a fortnight £31 £806 Total cost of other support or services £1,492 Child B’s: social care costs for looked-after children The costs for child B would also have been much higher if the local authority had been required to place him as a looked-after child. The costs below include the activity to find the first placement for child B, to review the case (using statutory timeframes of 28 days, three-monthly and six-monthly intervals), update his care plan and also support child B in his placement. The costs of these processes are detailed below: Process Cost 1. Decide child needs to be looked-after and find first placement £965 2. Care plans: Updated three times following reviews £1,7343. Maintain the placements: Support and placement costs (£793 per week) £41,2366. Review: Held on three occasions during the year (3 x £614) £1,842Total £45,777
Month 0 Month 6 Month 12

Unit Costs of Health and Social Care 2013 165
8.11 Young adults with acquired brain injury in the UK Acquired brain injury (ABI) is ‘a non-degenerative injury to the brain occurring since birth’, including both open and closed head injuries. ABI includes a range of diagnoses or causes, including strokes or tumours. Head injury through trauma is a common cause among young adults. ABI is not thought to affect life expectancy after the initial acute phase, so the prevalence of long-term brain damage is high at 100-150 per 100,000 population, implying a total of 60,000-90,000 people in the UK (http://www.rhn.org.uk/). A study was undertaken by the Personal Social Services Research Unit to identify the health and social care services used by young adults aged 18-25 years with acquired brain injury (ABI) and the associated costs.1 The study identified the annual incidence of ABI in this age group, and then tracked the young adults' likely progress through four support-related stages: trauma, stabilisation, rehabilitation and return to the community. By identifying the numbers using different treatment locations and services at each stage, a picture of service use and costs could be built up over a notional 12-month period following injury. All costs have been uprated to 2012/2013 prices using the HCHS pay & prices Inflator. Four broad groups of young people with ABI were identified by their location at the community care stage.
Group 1 comprises the largest proportion of those sustaining brain injuries and includes those who attend A&E with ABI or spend short periods in a hospital ward and then return home. A small proportion, perhaps just one in five, will have follow-up appointments arranged at an outpatient clinic or with their GP. This group will generally have had a mild head injury and no longer-term disability, although 20 per cent of this group may continue to have residual symptoms six months after injury. Group 1: Average cost per person = £301 per year.
People in Group 2 are also likely to have returned to their own homes within a year, but are more seriously disabled and rely on personal care support provided by spouses, parents or other informal carers. This group may include those who are discharged home from longer-term residential rehabilitation (34% of patients discharged), from acute brain injury units (25%) and from neurosurgery units (23%). It is likely that at least 40 per cent of them will require at least part-time support or supervision from informal carers. Group 2: Average costs per person = £21,482 per year.
The third group of young adults with ABI are those whose pathway towards the end of a year will see them living in supported accommodation with formal (paid) personal carers. Some will have been discharged straight from hospital and some will have stayed in a rehabilitation facility prior to their move to supported living. One in four of these young adults will need overnight supervision, and three in four will need at least part-time supervision during the day. The number of young adults may be quite high, but some will move on to more independent living. Others will need this type of support for many years to come. For cost estimates, it has been assumed this group will live in community-based housing with low staffing levels during the day and ‘sleeping-in’ staff at night. In addition to personal care, they are also likely to use outpatient clinics and community-based therapists. Personal care costs (estimated at an average of 8 hours overnight ‘sleeping-in’ and 6 hours during the day) would amount to £538 per week. Use of community-based therapy and health care services would add another £625 by the end of the notional 12-month period. Group 3: Average cost per person = £41,186 per year.
The fourth group includes young adults who are likely to be among the most severely disabled. Although some will besupported at home, it is estimated that 310 will be resident in nursing homes for young adults, specialist ABI residential units, in longer-stay hospital wards or in mental health units. They are likely to have been the most severely injured. Some of the principal independent providers contacted for this research reported current prices for residential placements of up to £3,129 per week, often jointly funded by health and social services. Nursing homes and ‘young disability units’ are likely to be less costly. However, nursing home care may not be appropriate for people with severe ABI-related disability as there tend to be few qualified staff and low input from local community-based teams or specialist doctors. Group 4: Average cost per person = £42,438 per year.
1 Beecham, J., Perkins, M., Snell, T. & Knapp, M. (2009) Treatment paths and costs for young adults with acquired brain injury in the United Kingdom, Brain
Injury, 23, 1. 30-38.

166 Unit Costs of Health and Social Care 2013
8.12 Palliative care for children and young people The government’s manifesto commitment to improve palliative care services in 20061 resulted in an independent review of children’s palliative care services commissioned by the Secretary of State for Health.2 This independent review was based on findings from a wide consultation with stakeholders, including children and young people and their families, commissioners and providers of services, along with commissioned research from Department of Health and the York Health Economics Consortium. Information for this table has been drawn from the work carried out by the York Health Economics Consortium3 which provides examples of illness trajectories and the resulting costs for children in need of palliative care. All costs have been uprated using the appropriate inflators to provide current prices. See Lowson et al. (2007) for more information on the cost benefits of using community care instead of hospital services.
8.12.1 Short illness trajectory: cancer This generic pathway was developed for a child with cancer from data provided by Sargent Cancer Care for Children and Cancer and Leukaemia in Childhood (CLIC Sargent). It was triangulated with information collected during focus groups which included two parents, both of whose children had died: one from a form of leukaemia, the second from bone cancer.
A child with cancer Cost per yearHealth costs During one year
- Three inpatient stays £7,365- One ward attendance per month £694- One day care episode per fortnight £4,063- One home visit per week, including intensive bereavement support £8,727
Sub-total £20,849It was assumed that the child died at home with intensive community support and that there was no uptake of respite care. It was also assumed that there were no costs accruing to education and social services Financial burden on the family
- One family member gives up paid employment - Significant financial cost to family
£15,004 £7,482
Sub-total £22,486Total costs (including financial burden on the family) £43,335
1 Cochrane, H., Liyanage, S. Nantambi, R. (2007) Palliative care statistics for children and young adults, Department of Health, London. 2 Craft, A. & Killen, S. (2007) Palliative care services for children and young people in England, Department of Health, London. 3 Lowson, K., Lowson, P. & Duffy, S. (2007) Independent review of palliative care services for children and young people: economic study, Final Report, York
Health Economics Consortium, Department of Health Independent Review Team, London.

Unit Costs of Health and Social Care 2013 167
8.12.2 Longer life illness trajectories: cardiac care This pathway has been developed for a typical child being treated by a community-based team. The information was provided by parents at a focus group.
A child aged 15 months with a cardiac condition Cost per yearHealth costs During one year
- Inpatient stay of 5 days in local hospital for respiratory infection £2,455- Inpatient stay of 4 weeks in paediatric cardiac unit including 1 week in PICU £49,852- Inpatient stay of 6 days in local hospital for viral infection £2,455- Inpatient stay of 6 weeks in paediatric cardiac unit including 2 weeks in PICU £77,633- One outpatient visit per month to local team £2,083- One home visit per week by community team £8,727- One telephone contact per week £361
Sub-total £143,566Social care costs
- The child attends a pre-school special needs nursery - Uses wheelchair and has home equipment
£3,727 £6,477
Sub-total £10,204Respite care costs Assumptions re. respite care (based on focus groups and published evidence)
- 15 days per year at hospice - 6 hours per week at home
£15,973 £8,583
Sub-total £24,556Financial burden on the family
- Family in receipt of carer allowance - One family member gives up paid employment - Significant financial cost to family
£0
£15,004 £7,482
Sub-total £22,486Total costs (including financial burden on the family) £200,811

168 Unit Costs of Health and Social Care 2013
8.12.3 Longer life illness trajectories: cystic fibrosis This pathway has been developed for a typical child being treated by a community-based team. The information was provided by parents at a focus group. A child aged 5 years with cystic fibrosis Cost per yearHealth costs During one year:
- Two inpatient stays in local hospital for receipt of intravenous antibiotics - One outpatient visit per month to local team comprising consultant paediatrician
and consultant respiratory paediatrician - Four visits per year to speech and language therapist - One home visit per fortnight by community team - One telephone contact per week
£8,255 £8,333 £1,769 £407
£4,364 £361
Sub-total 23,489Social care costs
- The child attends mainstream school with support - Uses wheelchair and has home equipment
£6,533£6,477
Sub-total £13,010Respite care (based on focus groups and published evidence)
- 15 days per year at hospice - 6 hours per week at home
£15,973 £8,583
Sub-total £24,556Financial burden on family
- One family member gives up paid employment - Significant financial cost to family
£15,004 £7,482
Sub-total £22,486Total costs £83,540

Unit Costs of Health and Social Care 2013 169
8.12.4 Longer life illness trajectories: child with multiple disabilities This pathway has been developed for a typical child being treated by a community-based team. The information was provided by parents at a focus group. An older child with complex and multiple needs. The child has renal problems and seizures, with visual impairment and intellectual difficulties. The child and family are in contact with five specialities: paediatric endocrinology, paediatric gastroenterology, neurosurgery, ophthalmology, child psychiatry.
Cost per year
Health costs In one year
- One inpatient stay in tertiary centre for neurosurgery £16,069- One inpatient stay for dental extraction £1,160- One outpatient visit per week for blood tests £9,028- One outpatient visit per month for specialist reviews £2,083- Two CT scans £299- Two MRI scans £778- Three EEGs £344- Four visits per year to clinical psychologist- Four visits per year to speech and language therapist
£1,769£407
- One face-to-face visit per month by community team £2,014- One home visit per fortnight by community team £4,028- One telephone contact per fortnight with community team £181
Sub-total £38,160Social care costs
- The child attends a school for children with special educational needs - Uses wheelchair and has home equipment
£3,509 £6,477
Sub-total £9,986Respite care (based on focus groups and published evidence)
- 15 days per year at hospice - 6 hours per week at home
£15,973 £8,583
Sub-total £24,556Financial burden on the family
- Family in receipt of carer allowance - One family member gives up paid employment - Significant financial cost to family
£0
£15,004 £7,482
Sub-total £22,486Total costs (including financial burden on the family) £95,188

170 Unit Costs of Health and Social Care 2013

Unit Costs of Health and Social Care 2011 171
II. COMMUNITY-BASED HEALTH CARE STAFF

172 Unit Costs of Health and Social Care 2011

Unit Costs of Health and Social Care 2011 173
9. Scientific and professional
9.1 Community physiotherapist 9.2 NHS community occupational therapist 9.3 Community speech and language therapist 9.4 Community chiropodist/podiatrist 9.5 Clinical psychologist 9.6 Community pharmacist

174 Unit Costs of Health and Social Care 2011

Unit Costs of Health and Social Care 2013 175
9.1 Community physiotherapist Using data from the NHS reference costs,1 the mean average cost for a one-to-one contact in physiotherapy services for 2012/2013 was £47, with an interquartile range of £37 to £52. Costs have been uprated using the HCHS pay & prices inflator. Costs and unit estimation
2012/2013 value Notes
A. Wages/salary £23,441 per year Based on the mean full-time equivalent basic salary for Agenda for Change band 5 (for qualified Allied Health Professionals) of the July 2012-June 2013 NHS staff earnings estimates.2 An additional 8.7 per cent can be added to reflect payments for activity such as over-time, shift work and geographic allowances.3 The Electronic Staff Records (ESR) system shows that the mean basic salary for all physiotherapists is £33,043.2 See the preface for information on changes to salaries, and section V for further information on pay scales.
B. Salary oncosts £5,483 per year Employer’s national insurance is included plus 14 per cent of salary for employer’s contribution to superannuation.
C. Qualifications £5,549 per year Qualification costs have been calculated using the method described in Netten et al. (1998).4 Current cost information has been provided by the Department of Health and Health Education England (HEE).5 See table 7.4 for more details.
D. Overheads Management, administration and estates staff Non-staff
£5,585 per year £12,139 per year
Taken from NHS (England) Summarised accounts.6 Management and other non-care staff costs were 19.31 per cent of direct care salary costs and included administration and estates staff. Non-staff costs were 41.97 per cent of direct care salary costs. They include costs to the provider for office, travel/transport and telephone, education and training, supplies and services (clinical and general), as well as utilities such as water, gas and electricity.
E. Capital overheads £2,180 per year Based on the new-build and land requirements of NHS facilities, but adjusted to reflect shared use of both treatment and non-treatment space.7,8 Capital costs have been annuitised over 60 years at a discount rate of 3.5 per cent.
F. Travel No information available on average mileage covered per visit. From July 2013, NHS reimbursement will be based on a single rate for the first 3500 miles travelled (67p) and a reduced rate thereafter, irrespective of what type of car or what fuel is used (24p).9
Working time 42.7 weeks per year 37.5 hours per week
Unit costs are based on 1,603 hours per year: 225 working days minus sickness absence and training/study days as reported for all NHS staff groups.10
Ratio of direct to indirect time
No information available on the proportion of time spent with clients. See previous editions of this volume for sources of information. Please complete our new time-use survey: https://www.surveymonkey.com/s/SZMF5YL.
Duration of contact No current information available on the length of contact. See previous editions of this volume for sources.
London multiplier 1.20 x (A to B) 1.52 x E
Allows for the higher costs associated with working in London.7,8,11
Non-London multiplier 0.97 x (A to B) Allows for the lower costs associated with working outside London.7,8,11 Unit costs available 2012/2013 (costs including qualifications given in brackets) £30 (£34) per hour.
1 Department of Health (2013) NHS reference costs 2011-2012, https://www.gov.uk/government/news/financial-year-2011-to-2012-reference-costs-published/ [accessed 2 October 2013]. 2 Health & Social Care Information Centre (2013) NHS staff earnings estimates 2013 (not publicly available), Health & Social Care Information Centre,
Leeds. 3 Health & Social Care Information Centre (2013) NHS staff earnings estimates 2013, Health & Social Care Information Centre, Leeds. 4 Netten, A., Knight, J., Dennett, J., Cooley, R. & Slight, A. (1998) Development of a ready reckoner for staff costs in the NHS, Vols 1 & 2, Personal Social
Services Research Unit, University of Kent, Canterbury. 5 Personal communication with the Department of Health and Health Education England (HEE), 2013. 6 Audit Commission (2012) NHS summarised accounts 2011-2012, NHS, London. 7 Building Cost Information Service (2013) Surveys of tender prices, Royal Institute of Chartered Surveyors, London. 8 Personal communication with the Department for Communities and Local Government, 2011. 9 NHS Employers (2013) New mileage arrangements for Agenda for Change staff,
http://www.nhsemployers.org/PayAndContracts/LatestNews/Pages/New-pay-circular-for-Agenda-for-Change-Staff.aspx [accessed 1 October 2013]. 10 Contracted hours are taken from NHS Careers (2012) Pay and benefits, National Health Service, London. http://www.nhscareers.nhs.uk/ [accessed 9
October 2013]. Training days as recommended by professional bodies. Working days and sickness absence rates as reported in Health & Social Care Information Centre (2013) Sickness absence rates in the NHS: January 2013 – March 2013.
11 Department of Health estimate (2013) based on the Market Forces Factor (MFF).

176 Unit Costs of Health and Social Care 2013
9.2 NHS community occupational therapist Using data from the NHS reference costs,1 the mean average cost for a one-to-one contact of occupational therapy services for 2012/2013 was £73, with an interquartile range of £50 to £86. Costs have been uprated using the HCHS pay & prices inflator. Costs and unit estimation
2012/2013 value Notes
A. Wages/salary £23,441 per year Based on the mean full-time equivalent basic salary for Agenda for Change band 5 (for qualified Allied Health Professionals) of the July 2012-June 2013 NHS staff earnings estimates.2 An additional 8.7 per cent can be added to reflect payments for activity such as over-time, shift work and geographic allowances.3 The Electronic Staff Records (ESR) system shows that the mean basic salary for all occupational therapists is £31,943.2 See the preface for information on changes to salaries, and section V for further information on pay scales.
B. Salary oncosts £5,483 per year Employer’s national insurance is included plus 14 per cent of salary for employer’s contribution to superannuation.
C. Qualifications £5,531 per year Qualification costs have been calculated using the method described in Netten et al. (1998).4 Current cost information has been provided by the Department of Health and Health Education England (HEE).5 See table 7.4 for more details.
D. Overheads Management, administration and estates staff Non-staff
£5,585 per year £12,139 per year
Taken from NHS (England) Summarised accounts.6 Management and other non-care staff costs were 19.31 per cent of direct care salary costs and included administration and estates staff. Non-staff costs were 41.97 per cent of direct care salary costs. They include costs to the provider for office, travel/transport and telephone, education and training, supplies and services (clinical and general), as well as utilities such as water, gas and electricity.
E. Capital overheads £2,180 per year Based on the new-build and land requirements of NHS facilities, but adjusted to reflect shared use of both treatment and non-treatment space.7,8 Capital costs have been annuitised over 60 years at a discount rate of 3.5 per cent.
F. Travel No information available on average mileage covered per visit. From July 2013, NHS reimbursement will be based on a single rate for the first 3500 miles travelled (67p) and a reduced rate thereafter, irrespective of the type of car or fuel used (24p).9
Working time 42.7 weeks per year 37.5 hours per week
Unit costs are based on 1,602 hours per year: 225 working days minus sickness absence and training/study days as reported for all NHS staff groups.10
Ratio of direct to indirect time
No information available on the proportion of time spent with clients. See previous editions of this volume for sources of information. Please complete our new time-use survey: https://www.surveymonkey.com/s/SZMF5YL.
Duration of contacts No information available on duration of contacts. See previous editions of this volume for sources of information.
London multiplier 1.20 x (A to B) 1.52 x E
Allows for the higher costs associated with working in London 7,8,11
Non-London multiplier 0.97 x (A to B) Allows for the lower costs associated with working outside London.7,8,11 Unit costs available 2012/2013 (costs including qualifications given in brackets) £30 (£34) per hour.
1 Department of Health (2013) NHS reference costs 2011-2012, https://www.gov.uk/government/news/financial-year-2011-to-2012-reference-costs-published/ [accessed 2 October 2013]. 2 Health & Social Care Information Centre (2013) NHS staff earnings estimates 2013 (not publicly available), Health & Social Care Information Centre,
Leeds. 3 Health & Social Care Information Centre (2013) NHS staff earnings estimates 2013, Health & Social Care Information Centre, Leeds. 4 Netten, A., Knight, J., Dennett, J., Cooley, R. & Slight, A. (1998) Development of a ready reckoner for staff costs in the NHS, Vols 1 & 2, Personal Social
Services Research Unit, University of Kent, Canterbury. 5 Personal communication with the Department of Health and Health Education England (HEE), 2013. 6 Audit Commission (2012) Summarised accounts 2011-2012, NHS, London. 7 Building Cost Information Service (2013) Surveys of tender prices, Royal Institute of Chartered Surveyors, London. 8 Personal communication with the Department for Communities and Local Government, 2011. 9 NHS Employers (2013) New mileage arrangements for Agenda for Change staff,
http://www.nhsemployers.org/PayAndContracts/LatestNews/Pages/New-pay-circular-for-Agenda-for-Change-Staff.aspx [accessed 1 October 2013]. 10 Contracted hours are taken from NHS Careers (2012) Pay and benefits, National Health Service, London. http://www.nhscareers.nhs.uk/ [accessed 9
October 2013]. Training days as recommended by professional bodies. Working days and sickness absence rates as reported in Health & Social Care Information Centre (2013) Sickness absence rates in the NHS: January 2013 – March 2013.
11 Department of Health estimate (2013) based on the Market Forces Factor (MFF).

Unit Costs of Health and Social Care 2013 177
9.3 Community speech and language therapist Using data from the NHS reference costs,1 the mean average cost for a one-to-one contact of speech and language therapy services for 2012/2013 was £85, with an interquartile range of £54 to £100. Costs have been uprated using the HCHS pay & prices inflator.
Costs and unit estimation 2012/2013 value Notes A. Wages/salary £23,441 per year Based on the mean full-time equivalent basic salary for Agenda for Change band
5 (for qualified Allied Health Professionals) of the July 2012-June 2013 NHS staff earnings estimates.2An additional 8.7 per cent can be added to reflect payments for activity such as over-time, shift work and geographic allowances.3 The Electronic Staff Records (ESR) system shows that the mean basic salary for all speech and language therapists is £34,045. See the preface for information on changes to salaries, and section V for further information on pay scales.
B. Salary oncosts £5,483 per year Employer’s national insurance is included plus 14 per cent of salary for employer’s contribution to superannuation.
C. Qualifications £5,880 per year Qualification costs have been calculated using the method described in Netten et al. (1998).4 Current cost information has been provided by the Department of Health and Health Education England (HEE).5 See table 7.4 for more details.
D. Overheads Management, administration and estates staff Non-staff
£5,585 per year £12,139 per year
Taken from NHS (England) Summarised accounts.6 Management and other non-care staff costs were 19.31 per cent of direct care salary costs and included administration and estates staff. Non-staff costs were 41.97 per cent of direct care salary costs. They include costs to the provider for office, travel/transport and telephone, education and training, supplies and services (clinical and general), as well as utilities such as water, gas and electricity.
E. Capital overheads £2,180 per year Based on the new-build and land requirements of NHS facilities, but adjusted to reflect shared use of both treatment and non-treatment space.7,8 Capital costs have been annuitised over 60 years at a discount rate of 3.5 per cent.
F. Travel No information available on average mileage covered per visit. From July 2013, NHS reimbursement will be based on a single rate for the first 3500 miles travelled (67p) and a reduced rate thereafter, irrespective of the type of car or fuel used (24p).9
Working time 42.8 weeks per year 37.5 hours per week
Unit costs are based on 1,602 hours per year: 225 working days minus sickness absence and training/study days as reported for all NHS staff groups.10
Ratio of direct to indirect time
No information available on the proportion of time spent with clients. See previous editions of this volume for sources of information. Please complete our new time-use survey: https://www.surveymonkey.com/s/SZMF5YL.
Duration of contacts No information available on the duration of contacts. See previous editions of this volume for sources of information.
London multiplier 1.19 x (A to B) 1.52 x E
Allows for the higher costs associated with working in London.7,8,11
Non-London multiplier 0.97 x (A to B) Allows for the higher costs associated with working in London.7,8 Unit costs available 2012/2013 (costs including qualifications given in brackets) £30 (£34) per hour.
1 Department of Health (2013) NHS reference costs 2011-2012, https://www.gov.uk/government/news/financial-year-2011-to-2012-reference-costs-published/ [accessed 2 October 2013]. 2 Health & Social Care Information Centre (2013) NHS staff earnings estimates 2013 (not publicly available), Health & Social Care Information Centre,
Leeds. 3 Health & Social Care Information Centre (2013) NHS staff earnings estimates 2013, Health & Social Care Information Centre, Leeds. 4 Netten, A., Knight, J., Dennett, J., Cooley, R. & Slight, A. (1998) Development of a ready reckoner for staff costs in the NHS, Vols 1 & 2, Personal Social
Services Research Unit, University of Kent, Canterbury. 5 Personal communication with the Department of Health and Health Education England (HEE), 2013. 6 Audit Commission (2012) Summarised accounts 2011-2012, NHS, London. 7 Building Cost Information Service (2013) Surveys of tender prices, Royal Institute of Chartered Surveyors, London. 8 Personal communication with the Department for Communities and Local Government, 2011. 9 NHS Employers (2013) New mileage arrangements for Agenda for Change staff,
http://www.nhsemployers.org/PayAndContracts/LatestNews/Pages/New-pay-circular-for-Agenda-for-Change-Staff.aspx [accessed 1 October 2013]. 10 Contracted hours are taken from NHS Careers (2012) Pay and benefits, National Health Service, London. http://www.nhscareers.nhs.uk/ [accessed 9
October 2013] Training days as recommended by professional bodies. Working days and sickness absence rates as reported in Health & Social Care Information Centre (2013) Sickness absence rates in the NHS: January 2013 – March 2013.
11 Department of Health estimate (2013) based on the Market Forces Factor (MFF).
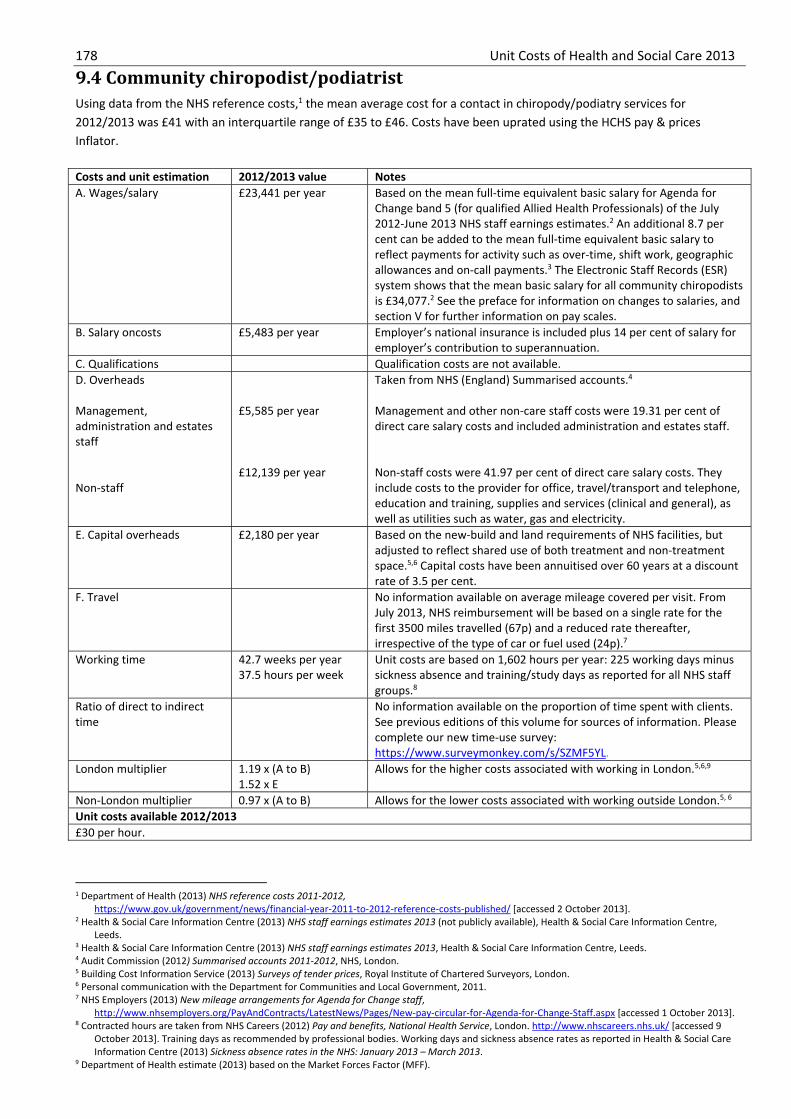
178 Unit Costs of Health and Social Care 2013
9.4 Community chiropodist/podiatrist Using data from the NHS reference costs,1 the mean average cost for a contact in chiropody/podiatry services for 2012/2013 was £41 with an interquartile range of £35 to £46. Costs have been uprated using the HCHS pay & prices Inflator. Costs and unit estimation 2012/2013 value Notes A. Wages/salary £23,441 per year Based on the mean full-time equivalent basic salary for Agenda for
Change band 5 (for qualified Allied Health Professionals) of the July 2012-June 2013 NHS staff earnings estimates.2 An additional 8.7 per cent can be added to the mean full-time equivalent basic salary to reflect payments for activity such as over-time, shift work, geographic allowances and on-call payments.3 The Electronic Staff Records (ESR) system shows that the mean basic salary for all community chiropodists is £34,077.2 See the preface for information on changes to salaries, and section V for further information on pay scales.
B. Salary oncosts £5,483 per year Employer’s national insurance is included plus 14 per cent of salary for employer’s contribution to superannuation.
C. Qualifications Qualification costs are not available. D. Overheads Management, administration and estates staff Non-staff
£5,585 per year £12,139 per year
Taken from NHS (England) Summarised accounts.4 Management and other non-care staff costs were 19.31 per cent of direct care salary costs and included administration and estates staff. Non-staff costs were 41.97 per cent of direct care salary costs. They include costs to the provider for office, travel/transport and telephone, education and training, supplies and services (clinical and general), as well as utilities such as water, gas and electricity.
E. Capital overheads £2,180 per year Based on the new-build and land requirements of NHS facilities, but adjusted to reflect shared use of both treatment and non-treatment space.5,6 Capital costs have been annuitised over 60 years at a discount rate of 3.5 per cent.
F. Travel No information available on average mileage covered per visit. From July 2013, NHS reimbursement will be based on a single rate for the first 3500 miles travelled (67p) and a reduced rate thereafter, irrespective of the type of car or fuel used (24p).7
Working time 42.7 weeks per year 37.5 hours per week
Unit costs are based on 1,602 hours per year: 225 working days minus sickness absence and training/study days as reported for all NHS staff groups.8
Ratio of direct to indirect time
No information available on the proportion of time spent with clients. See previous editions of this volume for sources of information. Please complete our new time-use survey: https://www.surveymonkey.com/s/SZMF5YL.
London multiplier 1.19 x (A to B) 1.52 x E
Allows for the higher costs associated with working in London.5,6,9
Non-London multiplier 0.97 x (A to B) Allows for the lower costs associated with working outside London.5, 6 Unit costs available 2012/2013 £30 per hour.
1 Department of Health (2013) NHS reference costs 2011-2012, https://www.gov.uk/government/news/financial-year-2011-to-2012-reference-costs-published/ [accessed 2 October 2013]. 2 Health & Social Care Information Centre (2013) NHS staff earnings estimates 2013 (not publicly available), Health & Social Care Information Centre,
Leeds. 3 Health & Social Care Information Centre (2013) NHS staff earnings estimates 2013, Health & Social Care Information Centre, Leeds. 4 Audit Commission (2012) Summarised accounts 2011-2012, NHS, London. 5 Building Cost Information Service (2013) Surveys of tender prices, Royal Institute of Chartered Surveyors, London. 6 Personal communication with the Department for Communities and Local Government, 2011. 7 NHS Employers (2013) New mileage arrangements for Agenda for Change staff,
http://www.nhsemployers.org/PayAndContracts/LatestNews/Pages/New-pay-circular-for-Agenda-for-Change-Staff.aspx [accessed 1 October 2013]. 8 Contracted hours are taken from NHS Careers (2012) Pay and benefits, National Health Service, London. http://www.nhscareers.nhs.uk/ [accessed 9
October 2013]. Training days as recommended by professional bodies. Working days and sickness absence rates as reported in Health & Social Care Information Centre (2013) Sickness absence rates in the NHS: January 2013 – March 2013.
9 Department of Health estimate (2013) based on the Market Forces Factor (MFF).

Unit Costs of Health and Social Care 2013 179
9.5 Clinical psychologist Costs and unit estimation 2012/2013 value NotesA. Wages/salary £45,593 per year Based on the mean full-time equivalent basic salary for Agenda for
Change band 8a (for qualified Allied Health Professionals) of the July 2012-June 2013 NHS staff earnings estimates.1 An additional 8.7 per cent can be added to reflect payments for activity such as over-time, shift work and geographic allowances.2 The Electronic Staff Records (ESR) system shows that the mean basic salary for all clinical psychologists is £46,280.1 See the preface for information on changes to salaries, and section V for further information on pay scales.
B. Salary oncosts £11,641 per year Employer’s national insurance is included plus 14 per cent of salary for employer’s contribution to superannuation.
C. Qualifications Qualification costs are not available. D. Overheads Management, administration and estates staff Non-staff
£11,051 per year £24,021 per year
Taken from NHS (England) Summarised accounts.3 Management and other non-care staff costs were 19.31 per cent of direct care salary costs and included administration and estates staff. Non-staff costs were 41.97 per cent of direct care salary costs. They include costs to the provider for office, travel/transport and telephone, education and training, supplies and services (clinical and general), as well as utilities such as water, gas and electricity.
E. Capital overheads £2,966 per year Based on the new-build and land requirements of NHS facilities, but adjusted to reflect shared use of both treatment and non-treatment space.4,5 Capital costs have been annuitised over 60 years at a discount rate of 3.5 per cent.
F. Travel No information available on average mileage covered per visit. From July 2013, NHS reimbursement will be based on a single rate for the first 3500 miles travelled (67p) and a reduced rate thereafter, irrespective of the type of car or fuel used (24p).6
Working time 42.7 weeks per year37.5 hours per week
Unit costs are based on 1,602 hours per year: 225 working days minus sickness absence and training/study days as reported for all NHS staff groups.7
Ratios of: face-to-face contact to all activity
1:1.25
Based on the National Child and Adolescent Mental Health Service Mapping data and returns from over 500 principal clinical psychologists, 44.5 per cent of time was spent on direct clinical work.8 Please complete our new time-use survey: https://www.surveymonkey.com/s/SZMF5YL.
London multiplier 1.19 x (A to B) 1.35 x E
Allows for the higher costs associated with working in London.4,5,9
Non-London multiplier 0.97 x (A to B) Allows for the lower costs associated with working outside London.4,5
Unit costs available 2012/2013 £59 per hour; £134 per hour of client contact (includes A to E).
1 Health & Social Care Information Centre (2013) NHS staff earnings estimates 2013 (not publicly available), Health & Social Care Information Centre,
Leeds. 2 Health & Social Care Information Centre (2013) NHS staff earnings estimates 2013, Health & Social Care Information Centre, Leeds. 3 Audit Commission (2012) Summarised accounts 2011-2012, NHS, London. 4 Building Cost Information Service (2013) Surveys of tender prices, Royal Institute of Chartered Surveyors, London. 5 Personal communication with the Department for Communities and Local Government, 2011. 6 NHS Employers (2013) New mileage arrangements for Agenda for Change staff,
http://www.nhsemployers.org/PayAndContracts/LatestNews/Pages/New-pay-circular-for-Agenda-for-Change-Staff.aspx [accessed 1 October 2013]. 7 Contracted hours are taken from NHS Careers (2012) Pay and benefits, National Health Service, London. http://www.nhscareers.nhs.uk/ [accessed 9
October 2013]. Training days as recommended by professional bodies. Working days and sickness absence rates as reported in Health & Social Care Information Centre (2013) Sickness absence rates in the NHS: January 2013 – March 2013.
8 Department of Health (2002) National child and adolescent mental health service mapping data, Department of Health, London. 9 Department of Health estimate (2013) based on the Market Forces Factor (MFF).
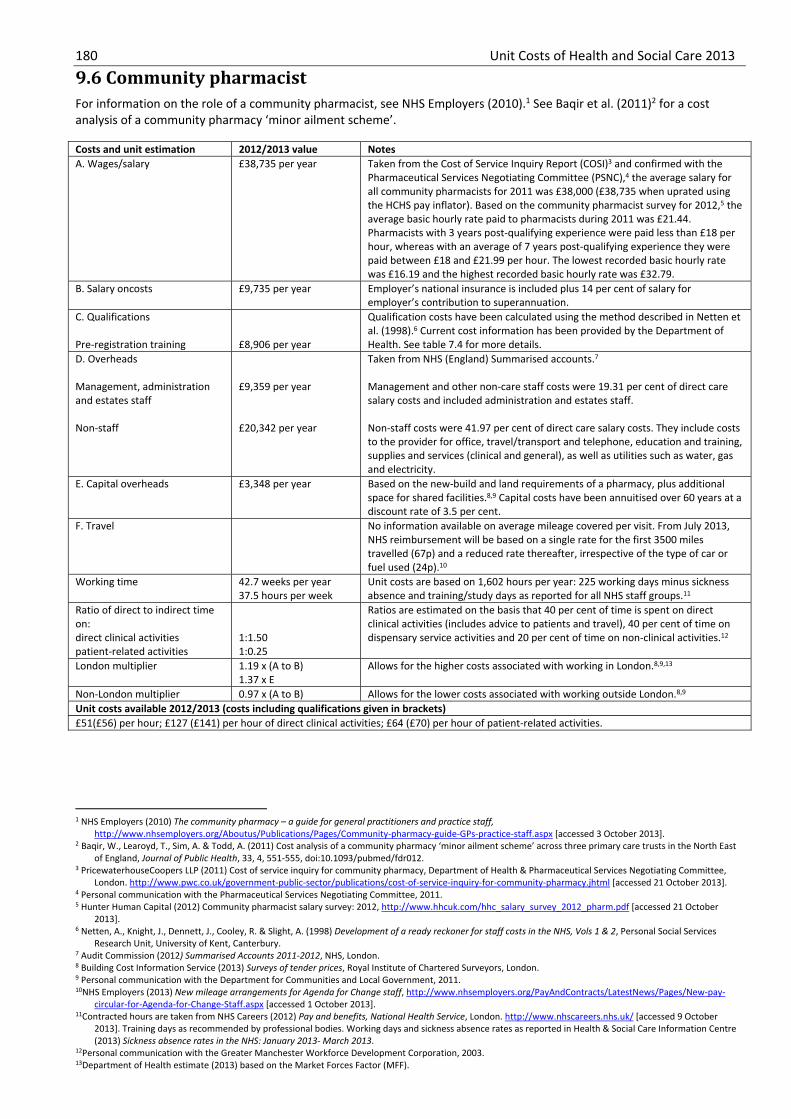
180 Unit Costs of Health and Social Care 2013
9.6 Community pharmacist For information on the role of a community pharmacist, see NHS Employers (2010).1 See Baqir et al. (2011)2 for a cost analysis of a community pharmacy ‘minor ailment scheme’. Costs and unit estimation 2012/2013 value NotesA. Wages/salary £38,735 per year Taken from the Cost of Service Inquiry Report (COSI)3 and confirmed with the
Pharmaceutical Services Negotiating Committee (PSNC),4 the average salary for all community pharmacists for 2011 was £38,000 (£38,735 when uprated using the HCHS pay inflator). Based on the community pharmacist survey for 2012,5 the average basic hourly rate paid to pharmacists during 2011 was £21.44. Pharmacists with 3 years post-qualifying experience were paid less than £18 per hour, whereas with an average of 7 years post-qualifying experience they were paid between £18 and £21.99 per hour. The lowest recorded basic hourly rate was £16.19 and the highest recorded basic hourly rate was £32.79.
B. Salary oncosts £9,735 per year Employer’s national insurance is included plus 14 per cent of salary for employer’s contribution to superannuation.
C. Qualifications Pre-registration training
£8,906 per year
Qualification costs have been calculated using the method described in Netten et al. (1998).6 Current cost information has been provided by the Department of Health. See table 7.4 for more details.
D. Overheads Management, administration and estates staff Non-staff
£9,359 per year £20,342 per year
Taken from NHS (England) Summarised accounts.7 Management and other non-care staff costs were 19.31 per cent of direct care salary costs and included administration and estates staff. Non-staff costs were 41.97 per cent of direct care salary costs. They include costs to the provider for office, travel/transport and telephone, education and training, supplies and services (clinical and general), as well as utilities such as water, gas and electricity.
E. Capital overheads £3,348 per year Based on the new-build and land requirements of a pharmacy, plus additional space for shared facilities.8,9 Capital costs have been annuitised over 60 years at a discount rate of 3.5 per cent.
F. Travel No information available on average mileage covered per visit. From July 2013, NHS reimbursement will be based on a single rate for the first 3500 miles travelled (67p) and a reduced rate thereafter, irrespective of the type of car or fuel used (24p).10
Working time 42.7 weeks per year37.5 hours per week
Unit costs are based on 1,602 hours per year: 225 working days minus sickness absence and training/study days as reported for all NHS staff groups.11
Ratio of direct to indirect time on: direct clinical activities patient-related activities
1:1.50 1:0.25
Ratios are estimated on the basis that 40 per cent of time is spent on direct clinical activities (includes advice to patients and travel), 40 per cent of time on dispensary service activities and 20 per cent of time on non-clinical activities.12
London multiplier 1.19 x (A to B) 1.37 x E
Allows for the higher costs associated with working in London.8,9,13
Non-London multiplier 0.97 x (A to B) Allows for the lower costs associated with working outside London.8,9
Unit costs available 2012/2013 (costs including qualifications given in brackets)£51(£56) per hour; £127 (£141) per hour of direct clinical activities; £64 (£70) per hour of patient-related activities.
1 NHS Employers (2010) The community pharmacy – a guide for general practitioners and practice staff,
http://www.nhsemployers.org/Aboutus/Publications/Pages/Community-pharmacy-guide-GPs-practice-staff.aspx [accessed 3 October 2013]. 2 Baqir, W., Learoyd, T., Sim, A. & Todd, A. (2011) Cost analysis of a community pharmacy ‘minor ailment scheme’ across three primary care trusts in the North East
of England, Journal of Public Health, 33, 4, 551-555, doi:10.1093/pubmed/fdr012. 3 PricewaterhouseCoopers LLP (2011) Cost of service inquiry for community pharmacy, Department of Health & Pharmaceutical Services Negotiating Committee,
London. http://www.pwc.co.uk/government-public-sector/publications/cost-of-service-inquiry-for-community-pharmacy.jhtml [accessed 21 October 2013]. 4 Personal communication with the Pharmaceutical Services Negotiating Committee, 2011. 5 Hunter Human Capital (2012) Community pharmacist salary survey: 2012, http://www.hhcuk.com/hhc_salary_survey_2012_pharm.pdf [accessed 21 October
2013]. 6 Netten, A., Knight, J., Dennett, J., Cooley, R. & Slight, A. (1998) Development of a ready reckoner for staff costs in the NHS, Vols 1 & 2, Personal Social Services
Research Unit, University of Kent, Canterbury. 7 Audit Commission (2012) Summarised Accounts 2011-2012, NHS, London. 8 Building Cost Information Service (2013) Surveys of tender prices, Royal Institute of Chartered Surveyors, London. 9 Personal communication with the Department for Communities and Local Government, 2011. 10NHS Employers (2013) New mileage arrangements for Agenda for Change staff, http://www.nhsemployers.org/PayAndContracts/LatestNews/Pages/New-pay-
circular-for-Agenda-for-Change-Staff.aspx [accessed 1 October 2013]. 11Contracted hours are taken from NHS Careers (2012) Pay and benefits, National Health Service, London. http://www.nhscareers.nhs.uk/ [accessed 9 October
2013]. Training days as recommended by professional bodies. Working days and sickness absence rates as reported in Health & Social Care Information Centre (2013) Sickness absence rates in the NHS: January 2013- March 2013.
12Personal communication with the Greater Manchester Workforce Development Corporation, 2003. 13Department of Health estimate (2013) based on the Market Forces Factor (MFF).

Unit Costs of Health and Social Care 2011 181
10. Nurses and doctors
10.1 Community nurse (includes district nursing sister, district nurse) 10.2 Nurse (mental health) 10.3 Health visitor 10.4 Nurse specialist (community) 10.5 Clinical support worker nursing (community) 10.6 Nurse (GP practice) 10.7 Nurse advanced (includes lead specialist, clinical nurse specialist, senior specialist) 10.8a General practitioner—cost elements 10.8b General practitioner—unit costs 10.8c General practitioner—commentary


Unit Costs of Health and Social Care 2013 183
10.1 Community nurse (includes district nursing sister, district nurse) Using data from the NHS reference costs,1 the mean average cost for a face-to-face contact in district nursing services for 2012/2013 was £39, with an interquartile range of £33 to £46. Costs have been uprated using the HCHS pay & prices inflator. Costs and unit estimation 2012/2013 value NotesA. Wages/salary £31,752 per year Based on the mean full-time equivalent basic salary for Agenda for Change band 6
of the July 2012-June 2013 NHS staff earnings estimates for qualified nurses.2 An additional 14.7 per cent can be added to reflect payments for activity such as over-time, shift work and geographic allowances.3 The Electronic Staff Records (ESR) system shows that the mean basic salary for all community nurses is £31,962.2 See the preface for information on changes to salaries, and section V for further information on pay scales.
B. Salary oncosts £7,794 per year Employer’s national insurance is included plus 14 per cent of salary for employer’s contribution to superannuation.
C. Qualifications £10,439 per year Qualification costs have been calculated using the method described in Netten et al. (1998).4 Current cost information has been provided by the Department of Health and Health Education England (HEE).5 See table 7.4 for more details.
D. Overheads Management, administration and estates staff Non-staff
£7,636 per year £16,597 per year
Taken from NHS (England) Summarised accounts.6 Management and other non-care staff costs were 19.31 per cent of direct care salary costs and included administration and estates staff. Non-staff costs were 41.97 per cent of direct care salary costs. They include costs to the provider for office, travel/transport and telephone, education and training, supplies and services (clinical and general), as well as utilities such as water, gas and electricity.
E. Capital overheads £2,966 per year Based on the new-build and land requirements of community health facilities, but adjusted to reflect shared use of both treatment and non-treatment space.7,8 Capital costs have been annuitised over 60 years at a discount rate of 3.5 per cent.
F. Travel No information available on average mileage covered per visit. From July 2013, NHS reimbursement will be based on a single rate for the first 3500 miles travelled (67p) and a reduced rate thereafter, irrespective of the type of car or fuel used (24p).9
Working time 42.7 weeks per year 37.5 hours per week
Unit costs are based on 1,603 hours per year: 225 working days minus sickness absence and training/study days as reported for all NHS staff groups.10
Ratio of direct to indirect time on: home visits patient-related work
1:0.45 1:0.20
A study reported that a district nurse visits (including travel) accounted for 69 per cent of total time with 83 per cent of time spent on patient-related tasks and 17 per cent on non-patient-related tasks.11 Based on the McKinsey report,12 the median number of visits per day carried out by district nurses was 5.6 in 2008. No information is available on the duration of a visit. Please complete our new time-use survey: https://www.surveymonkey.com/s/VVTDL7W.
London multiplier 1.19 x (A to B) 1.32 x E
Allows for the higher costs associated with working in London.7,8,13
Non-London multiplier 0.97 x (A to B) Allows for the lower costs associated with working outside London.7,8
Unit costs available 2012/2013 (costs including qualifications given in brackets)£42 (£48) per hour; £60 (£70) per hour of home visiting (including travel); £50 (£58) per hour of patient-related work
1 Department of Health (2013) NHS reference costs 2011-2012, https://www.gov.uk/government/news/financial-year-2011-to-2012-reference-costs-published/ [accessed 2 October 2013]. 2 Health & Social Care Information Centre (2013) NHS staff earnings estimates 2013 (not publicly available), Health & Social Care Information Centre, Leeds. 3 Health & Social Care Information Centre (2013) NHS staff earnings estimates 2013, Health & Social Care Information Centre, Leeds. 4 Netten, A., Knight, J., Dennett, J., Cooley, R. & Slight, A. (1998) Development of a ready reckoner for staff costs in the NHS, Vols 1 & 2, Personal Social Services
Research Unit, University of Kent, Canterbury. 5 Personal communication with the Department of Health and Health Education England (HEE), 2013. 6 Audit Commission (2012) Summarised accounts 2011-2012, NHS, London. 7 Building Cost Information Service (2013) Surveys of tender prices, Royal Institute of Chartered Surveyors, London. 8 Personal communication with the Department for Communities and Local Government, 2011. 9 NHS Employers (2013) New mileage arrangements for Agenda for Change staff, http://www.nhsemployers.org/PayAndContracts/LatestNews/Pages/New-pay-
circular-for-Agenda-for-Change-Staff.aspx [accessed 1 October 2013]. 10Contracted hours are taken from NHS Careers (2012) Pay and benefits, National Health Service, London. http://www.nhscareers.nhs.uk/ [accessed 9 October
2013]. Training days as recommended by professional bodies. Working days and sickness absence rates as reported in Health & Social Care Information Centre (2013) Sickness absence rates in the NHS: January 2013 – March 2013.
11County Durham and Tees Valley (2005) Workload, capacity and skill mix in Sedgefield locality teams, Final Report, Sedgefield Integrated Teams. http://www.dhcarenetworks.org.uk/_library/Resources/ICN/Workload,%20Capacity%20and%20Skill%20Mix%20Sedgefield%20integrated%20teams_Final%20Report.pdf [accessed 9 October 2013].
12Department of Health (2010) Achieving world class productivity in the NHS, 2009/10-2013/14: The McKinsey Report, Department of Health, London. 13Department of Health estimate (2013) based on the Market Forces Factor (MFF).

184 Unit Costs of Health and Social Care 2013
10.2 Nurse (mental health) Costs and unit estimation
2012/2013 value
Notes
A. Wages/salary £25,744 per year Based on the mean full-time equivalent basic salary for Agenda for Change band 5of the July 2012-June 2013 NHS staff earnings estimates for qualified nurses.1 An additional 14.7 per cent can be added to reflect payments for activity such as over-time, shift work and geographic allowances.2 See the preface for information on changes to salaries, and section V for further information on pay scales.
B. Salary oncosts £6,123 per year Employer’s national insurance is included plus 14 per cent of salary for employer’s contribution to superannuation.
C. Qualifications £10,439 per year Qualification costs have been calculated using the method described in Netten et al. (1998).3 Current cost information has been provided by the Department of Health and Health Education England (HEE).4 See table 7.4 for more details.
D. Overheads Management, administration and estates staff Non-staff
£6,153 per year £13,374 per year
Taken from NHS (England) Summarised accounts.5
Management and other non-care staff costs were 19.31 per cent of direct care salary costs and included administration and estates staff. Non-staff costs were 41.97 per cent of direct care salary costs. They include costs to the provider for office, travel/transport and telephone, education and training, supplies and services (clinical and general), as well as utilities such as water, gas and electricity.
E. Capital overheads
£2,966 per year Based on the new-build and land requirements of community health facilities, but adjusted to reflect shared use of both treatment and non-treatment space.6,7 Capital costs have been annuitised over 60 years at a discount rate of 3.5 per cent.
F. Travel No information available on average mileage covered per visit. From July 2013, NHS reimbursement will be based on a single rate for the first 3500 miles travelled (67p) and a reduced rate thereafter, irrespective of the type of car or fuel used (24p).8
Working time 41.9 weeks per year 37.5 hours per week
Unit costs are based on 1,572 hours per year: 225 working days minus sickness absence and training/study days as reported for all NHS staff groups.9
Ratio of direct to indirect time on patient- related work
No current information available. See previous editions of this volume for sources of information. Please complete our new time-use survey: https://www.surveymonkey.com/s/VVTDL7W.
London multiplier
1.19 x (A to B) 1.32 x E
Allows for the higher costs associated with working in London.6,7,10
Non-London multiplier
0.97 x (A to B) Allows for the lower costs associated with working outside London.6,7
Unit costs available 2012/2013 (costs including qualifications given in brackets)£35 (£39) per hour; £65 (£74) per hour of face-to-face contact; £46 (£52) per hour of patient-related work.
1 Health & Social Care Information Centre (2013) NHS staff earnings estimates 2013 (not publicly available), Health & Social Care Information Centre,
Leeds. 2 Health & Social Care Information Centre (2013) NHS staff earnings estimates 2013, Health & Social Care Information Centre, Leeds. 3 Netten, A., Knight, J., Dennett, J., Cooley, R. & Slight, A. (1998) Development of a ready reckoner for staff costs in the NHS, Vols 1 & 2, Personal Social
Services Research Unit, University of Kent, Canterbury. 4 Personal communication with the Department of Health and Health Education England (HEE), 2013. 5 Audit Commission (2012) Summarised accounts 2011-2012, NHS, London. 6 Building Cost Information Service (2013) Surveys of tender prices, Royal Institute of Chartered Surveyors, London. 7 Personal communication with the Department for Communities and Local Government, 2011. 8 NHS Employers (2013) New mileage arrangements for Agenda for Change staff,
http://www.nhsemployers.org/PayAndContracts/LatestNews/Pages/New-pay-circular-for-Agenda-for-Change-Staff.aspx [accessed 1 October 2013]. 9 Contracted hours are taken from NHS Careers (2012) Pay and benefits, National Health Service, London. http://www.nhscareers.nhs.uk/ [accessed 9
October 2013]. Training days as recommended by professional bodies. Working days and sickness absence rates as reported in Health & Social Care Information Centre (2013) Sickness absence rates in the NHS: January 2013 – March 2013.
10Department of Health estimate (2013) based on the Market Forces Factor (MFF).

Unit Costs of Health and Social Care 2013 185
10.3 Health visitor Using data from the NHS reference costs,1 the mean average cost for a face-to-face contact in health visiting services for 2012/2013 was £47, with an interquartile range of £33 to £53. Costs have been uprated using the HCHS pay & prices inflator.
Costs and unit estimation
2012/2013 value Notes
A. Wages/salary £31,752 per year Based on the mean full-time equivalent basic salary for Agenda for Change band 6 of the July 2012-June 2013 NHS staff earnings estimates for qualified nurses.2 An additional 14.7 per cent can be added to reflect payments for activity such as over-time, shift work and geographic allowances. The Electronic Staff Records (ESR) system shows that the mean basic salary for all health visitors is £34,284.2 See the preface for information on changes to salaries, and section V for further information on pay scales.
B. Salary oncosts £7,794 per year Employer’s national insurance is included plus 14 per cent of salary for employer’s contribution to superannuation.
C. Qualifications £10,439 per year Qualification costs have been calculated using the method described in Netten et al. (1998).3 Current cost information has been provided by the Department of Health and Health Education England (HEE).4 See table 7.4 for more details.
D. Overheads Management, administration and estates staff Non-staff
£7,636 per year £16,597 per year
Taken from NHS (England) Summarised accounts.5 Management and other non-care staff costs were 19.31 per cent of direct care salary costs and included administration and estates staff. Non-staff costs were 41.97 per cent of direct care salary costs. They include costs to the provider for office, travel/transport and telephone, education and training, supplies and services (clinical and general), as well as utilities such as water, gas and electricity.
E. Capital overheads £2,966 per year Based on the new-build and land requirements of community health facilities, but adjusted to reflect shared use of both treatment and non-treatment space.6,7 Capital costs have been annuitised over 60 years at a discount rate of 3.5 per cent.
F. Travel No information available on average mileage covered per visit. From July 2013, NHS reimbursement will be based on a single rate for the first 3500 miles travelled (67p) and a reduced rate thereafter, irrespective of the type of car or fuel used (24p).8
Working time 42 weeks per year 37.5 hours per week
Unit costs are based on 1,575 hours per year: 225 working days minus sickness absence and training/study days as reported for all NHS staff groups.9
Ratio of direct to indirect time on: Home visits Patient-related work
1:0.45 1:0.20
No time use information is currently available for health visitors. However, assuming that a health visitor carries out the same number of home visits as a district nurse, a study reported that a district nurse visits (including travel) accounted for 69 per cent of total time with 83 per cent of time spent on patient-related tasks and 17 per cent on non-patient-related tasks.10 Based on the McKinsey report,11 the median number of visits per day carried out by district nurses was 5.6 in 2008. No information is available on the duration of a visit. Please complete our new time-use survey: https://www.surveymonkey.com/s/VVTDL7W.
London multiplier 1.20 x (A to B) 1.32 x E
Allows for the higher costs associated with working in London.7,8,12
Non-London multiplier 0.97 x (A to B) Allows for the lower costs associated with working outside London.7,8 Unit costs available 2012/2013 (costs including qualifications given in brackets) £42 (£49) per hour; £61 (£71) per hour of home visiting; £51 (£59) per hour of patient-related work.
1 Department of Health (2013) NHS reference costs 2011-2012, https://www.gov.uk/government/news/financial-year-2011-to-2012-reference-costs-published/ [accessed 2 October 2013]. 2 Health & Social Care Information Centre (2013) NHS staff earnings estimates 2013 (not publicly available), Health & Social Care Information Centre, Leeds. 3 Netten, A., Knight, J., Dennett, J., Cooley, R. & Slight, A. (1998) Development of a ready reckoner for staff costs in the NHS, Vols 1 & 2, Personal Social Services
Research Unit, University of Kent, Canterbury. 4 Personal communication with the Department of Health and Health Education England (HEE), 2013. 5 Audit Commission (2012) Summarised accounts 2011-2012, NHS, London. 6 Building Cost Information Service (2013) Surveys of tender prices, Royal Institute of Chartered Surveyors, London. 7 Personal communication with the Department for Communities and Local Government, 2011. 8 NHS Employers (2013) New mileage arrangements for Agenda for Change staff, http://www.nhsemployers.org/PayAndContracts/LatestNews/Pages/New-pay-
circular-for-Agenda-for-Change-Staff.aspx [accessed 1 October 2013]. 9 Contracted hours are taken from NHS Careers (2012) Pay and benefits, National Health Service, London. http://www.nhscareers.nhs.uk/ [accessed 9 October 2013]
Training days as recommended by professional bodies. Working days and sickness absence rates as reported in Health & Social Care Information Centre (2013) Sickness absence rates in the NHS: January 2013 – March 2013 , Health & Social Care Information Centre, Leeds.
10 County Durham and Tees Valley (2005) Workload, capacity and skill mix in Sedgefield locality teams, Final Report, Sedgefield Integrated Teams. http://www.dhcarenetworks.org.uk/_library/Resources/ICN/Workload,%20Capacity%20and%20Skill%20Mix%20Sedgefield%20integrated%20teams_Final%20Report.pdf [accessed 9 October 2013].
11 Department of Health (2010) Achieving world class productivity in the NHS, 2009/10-2013/14: the McKinsey report, Department of Health, London. 12 Department of Health estimate (2013) based on the Market Forces Factor (MFF).

186 Unit Costs of Health and Social Care 2013
10.4 Nurse specialist (community) Costs and unit estimation
2012/2013 value Notes
A. Wages/salary £31,752 per year Based on the mean full-time equivalent basic salary for Agenda for Change band 6 of the July 2012-June 2013 NHS staff earnings estimates for qualified nurses.1 An additional 14.7 per cent can be added to reflect payments for activity such as over-time, shift work and geographic allowances.2 See the preface for information on changes to salaries, and section V for further information on pay scales.
B. Salary oncosts £7,794 per year Employer’s national insurance is included plus 14 per cent of salary for employer’s contribution to superannuation.
C. Qualifications £10,439 per year Qualification costs have been calculated using the method described in Netten et al. (1998).3 Current cost information has been provided by the Department of Health and Health Education England (HEE).4 See table 7.4 for more details.
D. Overheads Management, administration and estates staff Non-staff
£7,636 per year £16,597 per year
Taken from NHS (England) Summarised accounts.5 Management and other non-care staff costs were 19.31 per cent of direct care salary costs and included administration and estates staff. Non-staff costs were 41.97 per cent of direct care salary costs. They include costs to the provider for office, travel/transport and telephone, education and training, supplies and services (clinical and general), as well as utilities such as water, gas and electricity.
E. Capital overheads £2,966 per year Based on the new-build and land requirements of community health facilities, but adjusted to reflect shared use of both treatment and non-treatment space.6,7 Capital costs have been annuitised over 60 years at a discount rate of 3.5 per cent.
F. Travel No information available on average mileage covered per visit. From July 2013, NHS reimbursement will be based on a single rate for the first 3500 miles travelled (67p) and a reduced rate thereafter, irrespective of the type of car or fuel used (24p).8
Working time 41.93 weeks per year 37.5 hours per week
Unit costs are based on 1,572 hours per year: 225 working days minus sickness absence and training/study days as reported for all NHS staff groups.9
Ratio of direct to indirect time
No current information available. See previous editions of this volume for sources of information. Please complete our new time-use survey: https://www.surveymonkey.com/s/VVTDL7W.
Duration of contact No current information available. Please complete our new time-use survey: https://www.surveymonkey.com/s/VVTDL7W.
London multiplier 1.19 x (A to B) 1.32 x E
Allows for the higher costs associated with working in London.6,7,10
Non-London multiplier 0.97 x (A to B) Allows for the lower costs associated with working outside London.6,7 Unit costs available 2012/2013 (costs including qualifications given in brackets) £42 (£49) per hour.
1 Health & Social Care Information Centre (2013) NHS staff earnings estimates 2013 (not publicly available), Health & Social Care Information Centre,
Leeds. 2 Health & Social Care Information Centre (2013) NHS staff earnings estimates 2013, Health & Social Care Information Centre, Leeds. 3 Netten, A., Knight, J., Dennett, J., Cooley, R. & Slight, A. (1998) Development of a ready reckoner for staff costs in the NHS, Vols 1 & 2, Personal Social
Services Research Unit, University of Kent, Canterbury. 4 Personal communication with the Department of Health and Health Education England (HEE), 2013. 5 Audit Commission (2012) Summarised accounts 2011-2012, NHS, London. 6 Building Cost Information Service (2013) Surveys of tender prices, Royal Institute of Chartered Surveyors, London. 7 Personal communication with the Department for Communities and Local Government, 2011. 8 NHS Employers (2013) New mileage arrangements for Agenda for Change staff,
http://www.nhsemployers.org/PayAndContracts/LatestNews/Pages/New-pay-circular-for-Agenda-for-Change-Staff.aspx [accessed 1 October 2013]. 9 Contracted hours are taken from NHS Careers (2012) Pay and benefits, National Health Service, London. http://www.nhscareers.nhs.uk/ [accessed 9
October 2013]. Training days as recommended by professional bodies. Working days and sickness absence rates as reported in Health & Social Care Information Centre (2012) Sickness absence rates in the NHS: January-March 2012 and annual summary 2009-10 to 2011-12, Information Centre, Leeds.
10 Department of Health estimate (2013) based on the Market Forces Factor (MFF).

Unit Costs of Health and Social Care 2013 187
10.5 Clinical support worker nursing (community) Costs and unit estimation
2012/2013 value Notes
A. Wages/salary £16,193 per year Based on the mean full-time equivalent basic salary for Agenda for Change band 2 of the July 2012-June 2013 NHS staff earnings estimates for unqualified Nurses.1 An additional 14.7 per cent can be added to reflect payments for activity such as over-time, shift work and geographic allowances.2 See the preface for information on changes to salaries, and section V for further information on pay scales.
B. Salary oncosts £3,468 per year Employer’s national insurance is included plus 14 per cent of salary for employer’s contribution to superannuation.
C. Overheads Management, administration and estates staff Non-staff
£3,796 per year £8,251 per year
Taken from NHS (England) Summarised accounts.3 Management and other non-care staff costs were 19.31 per cent of direct care salary costs and included administration and estates staff. Non-staff costs were 41.97 per cent of direct care salary costs. They include costs to the provider for office, travel/transport and telephone, education and training, supplies and services (clinical and general), as well as utilities such as water, gas and electricity.
D. Capital overheads £1,028 per year Based on the new-build and land requirements of community health facilities, but adjusted to reflect shared use of both treatment and non-treatment space.4,5 It is assumed that an auxiliary nurse uses one-sixth of the treatment space used by a district nurse. Capital costs have been annuitised over 60 years at a discount rate of 3.5 per cent.
E. Travel No information available on average mileage covered per visit. From July 2013, NHS reimbursement will be based on a single rate for the first 3500 miles travelled (67p) and a reduced rate thereafter, irrespective of the type of car or fuel used (24p).6
Working time 42.4 weeks per year37.5 hours per week
Unit costs are based on 1,590 hours per year: 225 working days minus sickness absence and training/study days as reported for all NHS staff groups.7
Ratio of direct to indirect time on: Home visits Patient-related work
1:0.45 1:0.20
No time use information is currently available for clinical support workers. Assuming that a clinical support worker carries out the same number of home visits as a district nurse, a study reported that a district nurse visits (including travel) accounted for 69 per cent of total time with 83 per cent of time spent on patient-related tasks and 17 per cent on non-patient-related tasks.8 Based on the McKinsey report,9 the median number of visits per day carried out by district nurses was 5.6 in 2008. No information is available on the duration of a visit. Please complete our new time-use survey: https://www.surveymonkey.com/s/VVTDL7W.
London multiplier 1.19 x (A to B) 1.32 x E
Allows for the higher costs associated with working in London.4,5,10
Non-London multiplier 0.97 x (A to B) Allows for the lower costs associated with working outside London.4,5
Unit costs available 2012/2013 £21 per hour; £30 per hour of home visiting; £25 per hour of patient-related work.
1 Health & Social Care Information Centre (2013) NHS staff earnings estimates 2013 (not publicly available), Health & Social Care Information Centre, Leeds. 2 Health & Social Care Information Centre (2013) NHS staff earnings estimates 2013, Health & Social Care Information Centre, Leeds. 3 Audit Commission (2012) Summarised accounts 2011-2012, NHS, London. 4 Building Cost Information Service (2013) Surveys of tender prices, Royal Institute of Chartered Surveyors, London. 5 Personal communication with the Department for Communities and Local Government, 2011. 6 NHS Employers (2013) New mileage arrangements for Agenda for Change staff, http://www.nhsemployers.org/PayAndContracts/LatestNews/Pages/New-pay-
circular-for-Agenda-for-Change-Staff.aspx [accessed 1 October 2013]. 7 Contracted hours are taken from NHS Careers (2012) Pay and benefits, National Health Service, London. http://www.nhscareers.nhs.uk/ [accessed 9 October
2013]. Training days as recommended by professional bodies. Working days and sickness absence rates as reported in Information Centre (2012) Sickness absence rates in the NHS: January-March 2012 and annual summary 2009-10 to 2011-12, Information Centre, Leeds.
8 County Durham and Tees Valley (2005) Workload, capacity and skill mix in Sedgefield locality teams, Final Report, Sedgefield Integrated Teams. http://www.dhcarenetworks.org.uk/_library/Resources/ICN/Workload,%20Capacity%20and%20Skill%20Mix%20Sedgefield%20integrated%20teams_Final%20Report.pdf [accessed 9 October 2013].
9 Department of Health (2010) Achieving world class productivity in the NHS, 2009/10-2013/14: the McKinsey report, Department of Health, London. 10 Department of Health estimate (2013) based on the Market Forces Factor (MFF).

188 Unit Costs of Health and Social Care 2013
10.6 Nurse (GP practice) Costs and unit estimation 2012/2013 value Notes A. Wages/salary £25,744 per year Based on the mean full-time equivalent basic salary for Agenda for Change band
5 of the July 2012-June 2013 NHS staff earnings estimates for qualified Nurses. 1 An additional 14.7 per cent can be added to reflect payments for activity such as over-time, shift work and geographic allowances. 2 See the preface for information on changes to salaries, and section V for further information on pay scales.
B. Salary oncosts £6,123 per year Employer’s national insurance is included plus 14 per cent of salary for employer’s contribution to superannuation.
C. Qualifications £10,439 per year Qualification costs have been calculated using the method described in Netten et al. (1998).3 Current cost information has been provided by the Department of Health and Health Education England (HEE).4 See table 7.4 for more details.
D. Overheads Management and administration Office, general business and premises (including advertising and promotion)
£6,153 per year £11,799 per year
No information available on management and administrative overheads for practice nurses. The same level of support has been assumed for practice nurses as for other NHS staff (19.31 per cent of direct care salary costs). No information available on overheads for a practice nurse. All information on office and general business expenses is drawn from the GP earnings and expenses report.5 Office and general business, premises and other expenses calculated as the ratio of practice nurse salary costs to all GP employees’ salary costs.
E. Capital overheads Buildings
£3,051 per year
Calculated as the ratio of GP practice nurse salary costs to net remuneration of GP salary and based on new-build and land requirements for a GP practitioner’s suite and annuitised over 60 years at a discount rate of 3.5 per cent.6,7
F. Travel No information available on average mileage covered per visit. From July 2013, NHS reimbursement will be based on a single rate for the first 3500 miles travelled (67p) and a reduced rate thereafter, irrespective of the type of car or fuel used (24p).8
Working time 42 weeks per year 37.5 hours per week
Unit costs are based on 1,575 hours per year: 225 working days minus sickness absence and training/study days as reported for all NHS staff groups.9
Ratio of direct to indirect time on: face-to-face contacts
1:0.30
Based on proportion of time spent on surgery consultations (67.9%), phone consultations (5.2%), clinics (2.5%) and home and care home visits (1.2%). Patient direct to indirect contact ratios allocate all non-contact time to all contact time. Taken from the 2006/07 UK General Practice Workload Survey.10 Please complete our new time-use survey: https://www.surveymonkey.com/s/VVTDL7W.
Duration of contact 15.5 minutes Per surgery consultation. Based on the 2006/07 UK General Practice Survey.10 Patient contacts 60 per week Average number of consultations per week.10 London multiplier 1.19 x (A to B)
Allows for the higher costs associated with London compared to the national average cost.11
Unit costs available 2012/2013 (costs including qualifications given in brackets) £34 (£40) per hour; £44 (£52) per hour of face-to-face contact.
1 Health & Social Care Information Centre (2013) NHS staff earnings estimates 2013 (not publicly available), Health & Social Care Information Centre, Leeds. 2 Health & Social Care Information Centre (2013) NHS staff earnings estimates 2013, Health & Social Care Information Centre, Leeds. 3 Netten, A., Knight, J., Dennett, J., Cooley, R. & Slight, A. (1998) Development of a ready reckoner for staff costs in the NHS, Vols 1 & 2, Personal Social Services
Research Unit, University of Kent, Canterbury. 4 Personal communication with the Department of Health and Health Education England (HEE), 2013. 5 Information Centre (2012) GP earnings and expenses 2009/2010, Information Centre, Leeds. http://data.gov.uk/dataset/gp-earnings-and-expenses/ [accessed 3
October 2013]. 6 Building Cost Information Service (2011) Surveys of tender prices, Royal Institute of Chartered Surveyors, London. 7 Personal communication with the Department for Communities and Local Government, 2011. 8 NHS Employers (2013) New mileage arrangements for Agenda for Change staff, http://www.nhsemployers.org/PayAndContracts/LatestNews/Pages/New-pay-
circular-for-Agenda-for-Change-Staff.aspx [accessed 1 October 2013]. 9 Contracted hours are taken from NHS Careers (2012) Pay and benefits, National Health Service, London. http://www.nhscareers.nhs.uk/ [accessed 9 October
2013]. Training days as recommended by professional bodies. Working days and sickness absence rates as reported in Information Centre (2012) Sickness absence rates in the NHS: January-March 2012 and annual summary 2009-10 to 2011-12, Information Centre, Leeds.
10 Information Centre (2007) 2006/07 UK general practice workload survey, Primary Care Statistics, Information Centre, Leeds. 11 Department of Health estimate (2013) based on the Market Forces Factor (MFF).

Unit Costs of Health and Social Care 2013 189
10.7 Nurse advanced (includes lead specialist, clinical nurse specialist, senior specialist)1 Costs and unit estimation 2012/2013 value NotesA. Wages/salary £38,057 per year Based on the mean full-time equivalent basic salary for Agenda for Change band 7 of the
July 2012-June 2013 NHS staff earnings estimates for qualified Nurses.2 An additional 14.7 per cent can be added to reflect payments for activity such as over-time, shift work and geographic allowances.3 See the preface for information on changes to salaries, and section V for further information on pay scales.
B. Salary oncosts £9,547 per year Employer’s national insurance is included plus 14 per cent of salary for employer’s contribution to superannuation.
C. Qualifications £10,439 per year Qualification costs have been calculated using the method described in Netten et al.(1998).4 Current cost information has been provided by the Department of Health and Health Education England (HEE).5 See the preface for more information on qualifications and also table 7.4 for details.
D. Overheads Management, administration and estates staff Non-staff
£9,192 per year £19,979 per year
Taken from NHS (England) Summarised accounts.6 Management and other non-care staff costs were 19.31 per cent of direct care salary costs and included administration and estates staff. Non-staff costs were 41.97 per cent of direct care salary costs. They include costs to the provider for office, travel/transport and telephone, education and training, supplies and services (clinical and general), as well as utilities such as water, gas and electricity.
E. Capital overheads £4,426 per year Based on the new-build and land requirements of community health facilities, but adjusted to reflect shared use of treatment and non-treatment space.7,8 Capital costs have been annuitised over 60 years at a discount rate of 3.5 per cent.
Working time 41.9 weeks per year 37.5 hours per week
Unit costs are based on 1,572 hours per year: 225 working days minus sickness absence and training/study days as reported for all NHS staff groups.9
Length of consultation: surgery home telephone
15 minutes 25 minutes 6 minutes
Information provided by 27 nurse practitioners working in primary care contacted about duration of consultations. Venning et al. (2000) found that nurse practitioners spent a mean of 11.57 minutes face-to-face with patients (SD 5.79 mins) and an additional 1.33 minutes per patient in getting prescriptions signed.10
Ratio of direct to indirect time on: face-to-face contacts patient contact (incl. telephone)
1:0.71 1:0.55
Information provided by 27 nurse practitioners on time use.11 Surgery consultations 58 per cent, home visits 0.4 per cent and telephone consultations 6.4 per cent. Getting prescriptions signed 1.4 per cent. Travel time to home visits was negligible (0.1%). Another study found that 60 per cent of a nurse practitioner/clinical nurse specialist’s time was spent on clinical activities.12 Another study on the role of nurse specialists in epilepsy found that clinical activities accounted for 40 per cent of the time.13 Please complete our new time-use survey: https://www.surveymonkey.com/s/VVTDL7W.
London multiplier 1.19 x (A to B) 1.50 x E
Allows for the higher costs associated with London compared to the national average cost.7,8,14
Non-London multiplier 0.97 x (A to B) Allows for the lower costs associated with working outside London compared to the national average cost.7,8
Unit costs available 2012/2013 (costs including qualifications given in brackets)£52 (£58) per hour; £88 (£100) per hour in surgery; £80 (£90) per hour of client contact cost; £22 (£25) per surgery consultation.
1 A term for nurse practitioners specifically has not been developed due to the great variation in the use of the term NP. Personal correspondence with the
RCN NP Adviser has suggested that the best match is the Advance Nurse profile (Band 7). 2 Health & Social Care Information Centre (2013) NHS staff earnings estimates 2013 (not publicly available), Health & Social Care Information Centre,
Leeds. 3 Health & Social Care Information Centre (2013) NHS staff earnings estimates 2013, Health & Social Care Information Centre, Leeds. 4 Netten, A., Knight, J., Dennett, J., Cooley, R. & Slight, A. (1998) Development of a ready reckoner for staff costs in the NHS Vols 1 & 2, Personal Social
Services Research Unit, University of Kent, Canterbury. 5 Personal communication with the Department of Health and Health Education England (HEE), 2013. 6 Audit Commission (2012) Summarised Accounts 2011-2012, NHS, London. 7 Building Cost Information Service (2013) Surveys of tender prices, Royal Institute of Chartered Surveyors, London. 8 Personal communication with the Department for Communities and Local Government, 2011. 9 Contracted hours are taken from NHS Careers (2012) Pay and benefits, National Health Service, London. http://www.nhscareers.nhs.uk/ [accessed 9
October 2013]. Training days as recommended by professional bodies. Working days and sickness absence rates as reported in Information Centre (2012) Sickness absence rates in the NHS: January-March 2012 and annual summary 2009-10 to 2011-12, Information Centre, Leeds.
10 Venning, P., Durie, A., Roland, M., Roberts, C. & Leese, B. (2000) Randomised controlled trial comparing cost effectiveness of general practitioners and nurse practitioners in primary care, British Medical Journal, 320, 1048-1053.
11 Curtis, L. & Netten, A. (2007) The costs of training a nurse practitioner in primary care: the importance of allowing for the cost of education and training when making decisions about changing the professional, Journal of Nursing Management, 15, 4, 449-457.
12 Ball, J. (2005) Maxi Nurses. Advanced and Specialist Nursing Roles, Results from a Survey of RCN Members in Advanced and Specialist Nursing Roles, Royal College of Nursing, London.
13 Higgins, S., Lanfear, J. & Goodwin, M. (2006) Qualifying the role of nurse specialists in epilepsy: data from diaries and interviews, British Journal of Neuroscience Nursing, 2, 5, 239-245.
14 Department of Health estimate (2013) based on the Market Forces Factor (MFF).

190 Unit Costs of Health and Social Care 2013
10.8a General practitioner — cost elements Costs and unit estimation
2012/2013 value Notes (for further clarification see Commentary)
A. Net remuneration £106,100 per year Average income before tax for GPMS contractor GPs for England.1 B. Practice expenses: Direct care staff Administrative and clerical staff Office & general business Premises Other: includes advertising, promotion and entertainment Car and travel
£22,153 per year £35,807 per year £9,568 per year £13,015 per year £16,700 per year £1,400 per year
Each FTE equivalent practitioner (excluding GP registrars & GP retainers) employed 0.47 FTE practice nurse (includes salary and oncosts).2 Each FTE equivalent practitioner (excluding GP registrars & GP retainers) employed 1.10 FTE administrative and clerical staff 1,2 (includes salary and oncosts). Based on information taken from the GP earnings and expenses report. 1,2
All office & general business, premises and other expenses including advertising, promotion and entertainment are based on expenditure taken from the GP earnings and expenses report.1 Each GP employs 3.04 members of staff (including practice nurses, other patient care staff plus administrators and clerical staff).1,2 Office & general business, premises and other expenses calculated as the ratio of GP salary costs to all GP employees salary costs. Based on information taken from the GP earnings and expenses report.1,2
C. Qualifications £44,286 per year Qualification costs have been calculated using the method described in Netten et al. (1998).3 Current cost information has been provided by the Department of Health and Health Education England (HEE).4 See the preface for more information on qualifications and also table 7.4 for details.
D. Ongoing training £2,489 per year This cost comprises an amount for the generic curriculum, the post-graduate centres’ infrastructure, and study leave. Included also are the costs of the course organisers, administrative support, trainers’ workshops, vocational training and internal courses for GP tutors. Excluded are the costs of running the library and post-graduate centres.5
E. Capital costs: – Premises
£12,573 per year
Based on new-build and land requirements for a GP practitioner suite. Capital costs have been annuitised over 60 years at a discount rate of 3.5 per cent.6,7
Working time 43.5 weeks per year 41.4 hours per week
Based on information taken from the 6th National GP Worklife Survey.8 Respondents to this 2010 survey reported working an average of 41.4 hours per week and a mean number of 7.5 sessions. Twenty one per cent of respondents (218/1,053) reported undertaking out-of-hours work (median number of hours=4). Unit costs based on 1,801 hours per year.
Ratio of direct to indirect time: Face-to-face time (excludes travel time). Out of surgery visits (home visits and clinics) (includes travel time)
1:0.57 1:0.99
Based on information taken from the 2006/07 UK General Practice Workload Survey,9 the proportion of time spent on surgery consultations was 44.5%. Telephone consultations and clinic consultations formed 6.3 per cent of a GP’s time and home and care home visits including travel time absorbed 8.6 per cent. Patient direct to indirect contact ratios allocate all non-contact time to all contact time. Multipliers allocate travel time to out-of-surgery visits. Based on information taken from the GP Work life Survey,7 almost 66 per cent of time is devoted to direct patient care.
Consultations: surgery clinic telephone home visit
11.7 minutes 17.2 minutes 7.1 minutes 11.4 minutes
Based on the 2006/07 UK General Practice Workload Survey,8 the time spent on a home visit includes only time spent in the patient’s home. We assume an average of 12 minutes travel time per visit. This travel time has been allowed for in the estimation of the ratio of direct to indirect time spent on home visits. See commentary to table 10.8c.
Unit costs for 2012/2013 are given in table 10.8b
1 Information Centre (2012) GP earnings and expenses 2010/2011, Information Centre, Leeds. http://data.gov.uk/dataset/gp-earnings-and-expenses/
[accessed 9 October 2013]. 2 Information Centre (2012) General practice staff 2011, Information Centre, Leeds. 3 Netten, A., Knight, J., Dennett, J., Cooley, R. & Slight, A. (1998) Development of a ready reckoner for staff costs in the NHS, Vols 1 & 2, Personal Social
Services Research Unit, University of Kent, Canterbury. 4 Personal communication with the Department of Health and Health Education England (HEE), 2013. 5 Personal communication with the London Deanery, 2006. 6 Building Cost Information Service (2013) Surveys of tender prices, Royal Institute of Chartered Surveyors, London. 7 Personal communication with the Department for Communities and Local Government and the Valuation Office, 2012. 8 Hann, M., Santos, R., Sutton, M., Gravelle, H. & Sibbald, B. (2011) Sixth national GP worklife survey: Final Report, NPCRDC, Manchester. 9 Information Centre (2007) 2006/07 General Practice Workload Survey, Primary Care Statistics, Information Centre, Leeds.
http://www.dhsspsni.gov.uk/gp_workload_survey_2006_07.pdf [accessed 9 October 2013].

Unit Costs of Health and Social Care 2013 191
10.8b General practitioner — unit costs Unit cost 2012/2013 Including direct care staff costs Excluding direct care staff costs
With qualification costs
Without qualification
costs
With qualification costs
Without qualification costs
Annual (including travel) £264,090 £219,804 £241,937 £197,651Annual (excluding travel) £262,690 £218,404 £240,537 £196,251Per hour of GMS activity1 £147 £122 £134 £110Per hour of patient contact1 £230 £192 £211 £172Per minute of patient contact1 £3.80 £3.20 £3.50 £2.90Per hour of patient contact (out of surgery i.e. clinics and home visits)2
£292 £243 £267 £218
Per out of surgery visit minute2 £4.90 £4.00 £4.50 £3.60Per patient contact lasting 11.7 minutes1
£45 £37 £41 £34
Per patient contact lasting 17.2 minutes1
£66 £55 £60 49
Per telephone consultation lasting 7.1 minutes1
£27 £23 £25 £20
Per out of surgery visit lasting 23.4 minutes2
£114 £95 £104 £85
Prescription costs per consultation (net ingredient cost)
£44.643
Prescription costs per consultation (actual cost)
£41.353
.
1 Excludes travel. 2 Includes travel. 3 Personal communication with the Prescribing and Primary Care Group at the IC, 2012; and information on consultations: taken from Hippisley-Cox, J.,
Fenty, J. & Heaps, M. (2007) Trends in Consultation Rates in General Practice 1995 to 2006: Analysis of the QResearch Database, Final Report to the Information Centre and Department of Health, Information Centre, Leeds.

192 Unit Costs of Health and Social Care 2013
10.8c General practitioner — commentary General note about GP expenditure. The General Medical Service contract (GMS),1 introduced in 2003, was designed to improve the way that primary care services are funded, and to allow practices greater flexibility to determine the range of services they wish to provide, including opting out of additional services and out-of-hours care. Allowing for whole-time equivalence (FTE). The NHS Health & Social Care Information Centre has estimated that the number of FTE practitioners (excluding GP registrars and GP retainers) has increased from 31,391 in 2011 to 31,578 in 2012.2 FTE practice staff included 14,695 practice nurses, 8,327 direct patient care staff, 60,326 administrative and clerical and 2,199 other staff.2 Assuming that administrative and clerical staff are shared equally between GP practitioners and direct patient care staff (including practice nurses), each FTE practitioner employs 1.10 FTE administrative and clerical staff (60,326/54,600). Direct care staff. On average in 2011, each FTE equivalent practitioner (excluding GP registrars & GP retainers) employed 0.47 FTE practice nurse staff (14,695/31,578). All direct care staff have been costed at the same level as a band 5 GP practice nurse (see table 10.5). Qualifications. The equivalent annual cost of pre-registration and post-graduate medical education. The investment in training has been annuitised over the expected working life of the doctor.3 Post-graduate education costs calculated using information provided by the Department of Health and the Health Education England.4 This includes the cost of the two-year foundation programme, two years on a General Practice Vocational Training Scheme (GP-VTS) and a further year as a general practice registrar.5 Prescription costs. Prescription costs per consultation are £44.64 (net ingredient cost (NIC)) and £41.35 (actual cost). NIC is the basic cost of the drug, while the actual cost is the NIC less the assumed average discount plus the container allowance (and plus on-cost for appliance contractors). The prescription cost per consultation has been calculated by first dividing the number of prescriptions per GP by the number of consultations per GP (30,762/5,751) to give the number of prescriptions per GP consultation (5.35) and multiplying this by the actual cost per GP prescription (£7.73)6 and the NIC per GP prescription (£8.99).6 The number of consultations for all GPs was 181,600,000 in 20077,8 and the number of prescriptions per GP was 30,762 in 2012.9,10 The total actual cost of GP prescriptions was £7,511,603,923 in 2012 and NIC of GP prescriptions was £8,107,157,036.6
Activity. The 2006/07 UK General Practice Workload Survey provides an overview of the entire workload and skill-mix of general practices in the UK in 2006/07. Staff in a representative sample of 329 practices across the UK completed diary sheets for one week in September or December. As the survey was targeted at work in the practice, it excludes work done elsewhere, as well as any work identified as out-of-hours (OOH) not relating to the GMS/PMS/PCTMS practice contract.
1 NHS Employers (2003) General medical services contract, NHS Employers, London. 2 Information Centre (2012) General practice staff 2011, Information Centre, Leeds. 3 Netten, A., Knight, J., Dennett, J., Cooley, R. & Slight, A. (1998) Development of a ready reckoner for staff costs in the NHS, Vols 1 & 2, Personal Social
Services Research Unit, University of Kent, Canterbury. 4 Personal communication with the Department of Health and Health Education England (HEE), 2013. 5 NHS Employers (2006) Modernising medical careers: a new era in medical training, NHS Employers, London. 6 Personal communication with the Prescribing and Primary Care Group at the IC, 2013. 7 Hippisley-Cox, J., Fenty, J. & Heaps, M. (2007) Trends in consultation rates in general practice 1995 to 2006: analysis of the QResearch Database. Final
Report to the Information Centre and Department of Health, Information Centre, Leeds. 8 No further work on the number of GP consultations since 2007/08. 9 Personal correspondence with the Information Centre, 2009. 10Personal correspondence with Prescribing and Primary Care, 2013; Health & Social Care Information Centre (HSCIC).

Unit Costs of Health and Social Care 2013 193
III. COMMUNITY-BASED SOCIAL CARE

194 Unit Costs of Health and Social Care 2013

11. Social care staff
11.1 Social work team leader/senior practitioner/senior social worker 11.2 Social worker (adult) 11.3 Social worker (children) 11.4 Social work assistant 11.5 Home care worker 11.6 Community occupational therapist (local authority) 11.7 Home care manager 11.8 Family support worker


Unit Costs of Health and Social Care 2013 197
11.1 Social work team leader/senior practitioner/senior social worker Costs and unit estimation 2012/2013 value Notes A. Salary £38,592 per year The average salary for a social work team leader was £35,410 for 2007/08.1 As no
new salary estimates are available, this has been inflated to reflect the pay increments for social workers reported in the Local Government Earnings Surveys 2009, 2010, 2011, 2012 and 2013.2
B. Salary oncosts £12,011 per year Employer’s national insurance is included plus 20 per cent of salary for employer’s contribution to superannuation.3
C. Qualifications £25,430 per year Qualification costs have been calculated using the method described in Netten et al. (1998).4 Current cost information is drawn from research by Curtis et al. (2011).5
D. Ongoing training The General Social Care Council sets out a requirement that all social workers, as a condition of their three-yearly renewal of registration, should engage in development activity to meet a ‘post registration teaching and learning’ requirement of 15 days or 90 hours.6 No costs are available.
E. Overheads Direct overheads Indirect overheads
£14,675 per year £8,096 per year
Direct overheads were 29 per cent of direct care salary costs. They include costs to the provider for administration and management, as well as for office, training and utilities such as water, gas and electricity. Indirect overheads were 16 per cent of direct care salary costs. They include general management and support services such as finance and human resource departments.7
F. Capital overheads £1,897 per year Based on the new-build and land requirements for a local authority office and shared facilities for waiting, interviews and clerical support.8,9 Capital costs have been annuitised over 60 years at a discount rate of 3.5 per cent.
G. Travel No information available on average mileage covered per visit. For information see Green Book: National Agreement on Pay and Conditions of Service.10 Please complete our new time-use survey: https://www.surveymonkey.com/s/SZMF5YL.
Working time 41 weeks per year 37 hours per week
Includes 29 days annual leave and 8 statutory leave days. Ten days for study/training and 8.2 days sickness leave have been assumed based on the median average sickness absence level in England for all authorities.9,11 Unit costs are based on 1,516 hours per year.
Ratios of direct to indirect time on: client-related work face-to-face contact
1:0.39 1:2.45
Ratios are estimated on the basis that 72 per cent of time is spent on client-related activities including direct contact (25%), case-related recording (23%), case-related work in own agency (10%) and case-related inter-agency work (14%).12 Face-to-face contact is not a good indicator of input to clients.
Duration of visit It is not possible to estimate a cost per visit as there is no information available on the number or duration of visits. Please complete our new time-use survey: https://www.surveymonkey.com/s/SZMF5YL.
London multiplier 1.10 x A 1.49 x F Allows for the higher costs associated with London compared to the national average cost.1,8,9
Non-London multiplier 0.96 x A 0.96 x F Allows for the lower costs associated with working outside London compared to the national average cost.1,8,9
Unit costs available 2012/2013 (costs including qualifications given in brackets) £50 (£67) per hour; £69 (£93) per hour of client-related work; £172 (£230) per hour of face-to-face contact (includes A to E).
1 Local Government Association Analysis and Research (2008) Local government earnings survey 2007, Local Government Analysis and Research, London. 2 Local Government Association (2013) Local government pay and workforce research, http://www.local.gov.uk/research-pay-and-workforce/ [accessed
16 October 2013]. 3 Thurley, D. (2011) Local government pension scheme, 2010 onwards, House of Commons, London. 4 Netten, A., Knight, J., Dennett, J., Cooley, R. & Slight, A. (1998) Development of a ready reckoner for staff costs in the NHS, Vols 1 & 2, Personal Social
Services Research Unit, University of Kent, Canterbury. 5 Curtis, L. Moriarty, J. & Netten, A. (2012) The costs of qualifying a social worker, British Journal of Social Work, 42, 4, 706-724. 6 British Association of Social Workers (2011) Social Work Careers, British Association of Social Workers. http://www.basw.co.uk/social-work-careers/
[accessed 9 October 2013]. 7 Based on information taken from Selwyn, J. et al. (2009) Adoption and the inter-agency fee, University of Bristol, Bristol; and Glendinning, C. et al. (2010)
Home care re-ablement services: investigating the longer-term impacts, Final Report, University of York, PSSRU Kent, Department of Health, London. 8 Building Cost Information Service (2013) Surveys of tender prices, Royal Institute of Chartered Surveyors, London. 9 Personal communication with the Department for Communities and Local Government, 2011. 10 Local Government Employers (2012) Green Book: national agreement on pay and conditions of service, Local Government Association, London.
http://www.local.gov.uk/web/guest/workforce/-/journal_content/56/10180/3510601/ARTICLE/ [accessed 9 October 2013]. 11Local Government Association (2012) Local government workforce survey 2011/12, http://www.local.gov.uk/local-government-intelligence/-
/journal_content/56/10180/3328402/ARTICLE/ [accessed 9 October 2013]. 12Baginsky, M., Moriarty, J., Manthorpe, J., Stevens, M., MacInnes, T. & Nagendran, T. (2010) Social workers’ workload survey, Messages from the
frontline, findings from the 2009 survey and interviews with senior managers, Children’s Workforce Development Council, King’s College, University of London, New Policy Institute.

198 Unit Costs of Health and Social Care 2013
11.2 Social worker (adult services) Costs and unit estimation 2012/2013 value Notes A. Salary £30,831 per year Information taken from the Local Government Earnings Survey 20131 showed that
the mean basic salary for a social worker was £30,831. The mean gross salary was £31,824. (The information provided does not distinguish between the salary of an adult or of a children’s social worker).
B. Salary oncosts £9,388 per year Employer’s national insurance is included plus 20 per cent of salary for employer’s contribution to superannuation.2
C. Qualifications £25,430 per year Qualification costs have been calculated using the method described in Netten et al. (1998).3 Current cost information is drawn from research carried out by Curtis et al. (2011).4
D. Ongoing training The General Social Care Council sets out a requirement that all social workers, as a condition of their three-yearly renewal of registration, should engage in development activity to meet a ‘post registration teaching and learning’ requirement of 15 days or 90 hours.5 No costs are available.
E. Overheads Direct overheads Indirect overheads
£11,663 per year £6,435 per year
Direct overheads were 29 per cent of direct care salary costs. They include costs to the provider for administration and management, as well as for office, training and utilities such as water, gas and electricity. Indirect overheads were 16 per cent of direct care salary costs. They include general management and support services such as finance and human resource departments.6
F. Capital overheads £1,897 per year Based on the new-build and land requirements for a local authority office and shared facilities for waiting, interviews and clerical support.7,8 Capital costs have been annuitised over 60 years at a discount rate of 3.5 per cent.
G. Travel No information available on average mileage covered per visit. For information see Green Book: National Agreement on Pay and Conditions of Service.9 Please complete our new time-use survey: https://www.surveymonkey.com/s/SZMF5YL.
Working time 41 weeks per year 37 hours per week
Includes 29 days annual leave and 8 statutory leave days.8,9 Ten days for study/training and 8.2 days sickness leave have been assumed based on the median average sickness absence level in England for all authorities. 10 Unit costs are based on 1,516 hours per year.
Ratios of direct to indirect time on: client-related work face-to-face contact
1:0.39 1:3.00
Ratios are estimated on the basis that 72 per cent of time is spent on client-related activities including direct contact (25%), case-related recording (23%), case-related work in own agency (10%) and case-related inter-agency work (14%).11 Face-to-face contact is not a good indicator of input to clients. Please complete our new time-use survey: https://www.surveymonkey.com/s/SZMF5YL.
Duration of visit It is not possible to estimate a cost per visit as there is no information available on the number or duration of visits.
London multiplier 1.10 x A 1.49 x F Allows for the higher costs associated with London compared to the national average cost.1,7,8
Non-London multiplier 0.96 x A 0.96 x F Allows for the lower costs associated with working outside London compared to the national average cost.1,7,8
Unit costs available 2012/2013 (costs including qualifications given in brackets) £40 (£57) per hour; £55 (£79) per hour of client-related work; £159 (£226) per hour of face-to-face contact (includes A to E).
1 Local Government Association Analysis and Research (2013) Local government earnings survey 2012/2013, Local Government Association, London. 2 Thurley, D. (2011) Local government pension scheme, 2010 onwards, House of Commons, London. 3 Netten, A., Knight, J., Dennett, J., Cooley, R. & Slight, A. (1998) Development of a ready reckoner for staff costs in the NHS, Vols 1 & 2, Personal Social
Services Research Unit, University of Kent, Canterbury. 4 Curtis, L. Moriarty, J. & Netten, A. (2011) The costs of qualifying a social worker, British Journal of Social Work, doi:10.1093/bjsw/bcr113.
http://bjsw.oxfordjournals.org/content/early/2011/08/22/bjsw.bcr113.short?rss=1/ [accessed 26 September 2013]. 5 British Association of Social Workers (2011) Social work careers, The British Association of Social Workers. www.basw.co.uk/social-work-careers/
[accessed 9 October 2013]. 6 Based on information taken from Selwyn, J. et al. (2009) Adoption and the inter-agency fee, University of Bristol, Bristol; and Glendinning, C. et al. (2010)
Home care re-ablement services: investigating the longer-term impacts, Final Report, University of York, PSSRU Kent, Department of Health, London. 7 Building Cost Information Service (2013) Surveys of tender prices, Royal Institute of Chartered Surveyors, London. 8 Personal communication with the Department for Communities and Local Government, 2011. 9Local Government Association (2012) Green Book: national agreement on pay and conditions of service, Local Government Association, London.
http://www.local.gov.uk/web/guest/workforce/-/journal_content/56/10180/3510601/ARTICLE/ [accessed 3 October 2013]. 10Local Government Association (2012) Local government workforce survey 2010/11, http://www.local.gov.uk/local-government-intelligence/-
/journal_content/56/10180/3328402/ARTICLE/ [accessed 9 October 2013]. 11 Baginsky, M., Moriarty, J., Manthorpe, J., Stevens, M., MacInnes, T. & Nagendran, T. (2010) Social Workers’ Workload Survey, Messages from the
Frontline, Findings from the 2009 Survey and Interviews with Senior Managers, Children’s Workforce Development Council, King’s College, University of London, New Policy Institute.

Unit Costs of Health and Social Care 2013 199
11.3 Social worker (children’s services) Costs and unit estimation 2012/2013 value Notes A. Salary £30,831 per year Information taken from the Local Government Earnings Survey 20131 showed
that the mean basic salary for a social worker was £30,831. The mean gross salary was £31,824. (Information provided does not distinguish between the salary of an adult and children’s social worker).
B. Salary oncosts £9,388 per year Employer’s national insurance is included plus 20 per cent of salary for employer’s contribution to superannuation.2
C. Qualifications £25,430 per year Qualification costs have been calculated using the method described in Netten et al. (1998).3 Current cost information is drawn from research carried out by Curtis et al. (2011).4
D. Ongoing training The General Social Care Council sets out a requirement that all social workers, as a condition of their three-yearly renewal of registration, should engage in development activity to meet a ‘post registration teaching and learning’ requirement of 15 days or 90 hours.5 No costs are available.
E. Overheads Direct overheads Indirect overheads
£11,663 per year £6,435 per year
Direct overheads were 29 per cent of direct care salary costs. They include costs to the provider for administration and management, as well as for office, training and utilities such as water, gas and electricity. Indirect overheads were 16 per cent of direct care salary costs. They include general management and support services such as finance and human resource departments.6
F. Capital overheads £1,897 per year Based on the new-build and land requirements for a local authority office and shared facilities for waiting, interviews and clerical support.7,8 Capital costs have been annuitised over 60 years at a discount rate of 3.5 per cent.
G. Travel No information available on average mileage covered per visit. For information see Green Book: National Agreement on Pay and Conditions of Service.9 Please complete our new time-use survey: https://www.surveymonkey.com/s/SZMF5YL.
Working time 41 weeks per year 37 hours per week
Includes 29 days annual leave and 8 statutory leave days.10 Ten days for study/training and 8.2 days sickness leave have been assumed based on the median average sickness absence level in England for all authorities.11 Unit costs are based on 1,516 hours per year.
Ratios of direct to indirect time on: client-related work
1:0.39
Ratios are estimated on the basis that 72 per cent of time is spent on client-related activities including direct contact (26%), case-related recording (22%), case-related work in own agency (12%) and case-related inter-agency work (12%).12 Please complete our new time-use survey: https://www.surveymonkey.com/s/SZMF5YL.
London multiplier 1.46 x E Allows for the higher costs associated with London compared to the national average cost.1,7,8
Non-London multiplier 0.96 x E Allows for the lower costs associated with working outside London compared to the national average cost.1,7,8
Unit costs available 2012/2013 (the costs with qualifications costs are given in brackets) £40 (£57) per hour; £55 (£79) per hour of client-related work; £153 (£218) per hour of face-to-face contact (includes A to E).
1 Local Government Association Analysis and Research (2012) Local government earnings survey 2011/2012, Local Government Association, London. 2 Thurley, D. (2011) Local government pension scheme, 2010 onwards, House of Commons, London. www.parliament.uk/briefing-papers/SN05823.pdf
[accessed 9 October 2013]. 3 Netten, A., Knight, J., Dennett, J., Cooley, R. & Slight, A. (1998) Development of a ready reckoner for staff costs in the NHS, Vols 1 & 2, Personal Social
Services Research Unit, University of Kent, Canterbury. 4 Curtis, L. Moriarty, J. & Netten, A. (2012) The costs of qualifying a social worker, British Journal of Social Work, 42, 4, 706-724. 5 British Association of Social Workers (2011) Social Work Careers, The British Association of Social Workers http://www.basw.co.uk/social-work-careers/
[accessed 9 October 2013]. 6 Based on information taken from Selwyn, J. et al. (2009) Adoption and the inter-agency fee, University of Bristol, Bristol; and Glendinning, C. et al. (2010)
Home care re-ablement services: investigating the longer-term impacts, Final Report, University of York, PSSRU Kent, Department of Health, London. 7 Building Cost Information Service (2013) Surveys of tender prices, Royal Institute of Chartered Surveyors, London. 8 Personal communication with the Department for Communities and Local Government, 2011. 9 Local Government Employers (2012) Green Book: national agreement on pay and conditions of service, Local Government Association, London.
http://www.local.gov.uk/web/guest/workforce/-/journal_content/56/10180/3510601/ARTICLE/ [accessed 9 October 2013]. 10Local Government Association (2012) Local government workforce survey 2010/11, http://www.local.gov.uk/local-government-intelligence/-
/journal_content/56/10180/3328402/ARTICLE/ [accessed 9 October 2013]. 11 Local Government Association (2012) Local government workforce survey 2010/11, http://www.local.gov.uk/local-government-intelligence/-
/journal_content/56/10180/3328402/ARTICLE/ [accessed 9 October 2013]. 12Baginsky, M., Moriarty, J., Manthorpe, J., Stevens, M., MacInnes, T. & Nagendran, T. (2010) Social workers’ workload survey, messages from the frontline,
findings from the 2009 survey and interviews with senior managers, Children’s Workforce Development Council, King’s College, University of London, New Policy Institute.

200 Unit Costs of Health and Social Care 2013
11.4 Social work assistant Costs and unit estimation 2012/2013 value NotesA. Salary £22,715 per year Information taken from the Local Government Earnings Survey 20131
showed that the mean basic salary for a social work assistant was £22,715. The mean gross salary was £23,037.
B. Salary oncosts £6,644 per year Employer’s national insurance is included plus 20 per cent of salary for contribution to superannuation.2
C. Overheads Direct overheads Indirect overheads
£8,514 per year £4,697 per year
Direct overheads were 29 per cent of direct care salary costs. They include costs to the provider for administration and management, as well as for office, training and utilities such as water, gas and electricity.Indirect overheads were 16 per cent of direct care salary costs. They include general management and support services such as finance and human resource departments.3
D. Capital overheads £1,897 per year Based on the new-build and land requirements for a local authority office and shared facilities for waiting, interviews and clerical support.4,5 Capital costs have been annuitised over 60 years at a discount rate of 3.5 per cent.
E. Travel No information available on average mileage covered per visit. For information see Green Book: National Agreement on Pay and Conditions of Service.6 Please complete our new time-use survey: https://www.surveymonkey.com/s/SZMF5YL.
Working time 40.7 weeks per year37 hours per week
Includes 29 days annual leave and 8 statutory leave days. Ten days for study/training and 8.2 days sickness leave have been assumed based on the median average sickness absence level in England for all authorities.7Unit costs are based on 1,509 hours per year.
Ratios of direct to indirect time on: client-related work face-to-face contact
No current information is available about the proportion of social work assistant time spent on client-related outputs. See previous editions of this volume for sources of information. Please complete our new time-use survey: https://www.surveymonkey.com/s/SZMF5YL.
London multiplier 1.16 x A 1.49 x D
Allows for the higher costs associated with London compared to the national average cost.1,4,5
Non-London multiplier 0.96 x D Allows for the lower costs associated with working outside London compared to the national average cost.1,4,5
Unit costs available 2012/2013 £30 per hour.
1 Local Government Association Analysis and Research (2012) Local government earnings survey 2011/2012, Local Government Association, London. 2 Thurley, D. (2011) Local government pension scheme, 2010 onwards, House of Commons, London. 3 Based on information taken from Selwyn, J. et al. (2009) Adoption and the inter-agency fee, University of Bristol, Bristol; and Glendinning, C. et al. (2010)
Home care re-ablement services: investigating the longer-term impacts, Final Report, University of York, PSSRU Kent, Department of Health, London. 4 Personal communication with the Department for Communities and Local Government, 2011. 5 Building Cost Information Service (2013) Surveys of tender prices, Royal Institute of Chartered Surveyors, London. 6 Local Government Employers (2012) Green Book: national agreement on pay and conditions of service, Local Government Association, London.
http://www.local.gov.uk/local-government-intelligence/-/journal_content/56/10180/3328402/ARTICLE/ [accessed 9 October 2013]. 7 Local Government Association (2012) Local government workforce survey 2010/11, http://www.local.gov.uk/local-government-intelligence/-
/journal_content/56/10180/3328402/ARTICLE/ [accessed 9 October 2013].

Unit Costs of Health and Social Care 2013 201
11.5 Community occupational therapist (local authority) Costs and unit estimation
2012/2013 value Notes
A. Wages/salary £31,469 per year Information taken from the Local Government Earnings Survey 20131 showed that the mean basic salary for an occupational therapist was £31,469. The mean gross salary was £32,258.
B. Salary oncosts £9,603 per year Employer’s national insurance is included plus 20 per cent of salary for employer’s contribution to superannuation.2
C. Qualifications £5,531 per year Qualification costs have been calculated using the method described in Netten et al. (1998).3 Current cost information has been provided by the Department of Health and the Higher Education Funding Council for England (HEFCE).4 See the preface for more information on qualifications and also table 7.4 for details.
D. Overheads Direct overheads Indirect overheads
£11,911 per year £6,572 per year
Direct overheads were 29 per cent of direct care salary costs. They include costs to the provider for administration and management, as well as for office, training and utilities such as water, gas and electricity.5 Indirect overheads were 16 per cent of direct care salary costs. They include general management and support services such as finance and human resource departments.5
E. Capital overheads £1,897 per year Based on the new-build and land requirements for a local authority office and shared facilities for waiting, interviews and clerical support.6,7 Capital costs have been annuitised over 60 years at a discount rate of 3.5 per cent.
F. Working time 41 weeks per year 37 hours per week
Includes 29 days annual leave and 8 statutory leave days. Ten days for study/training and 8.6 days sickness leave have been assumed based on average of all social work sectors for 2009/2010.8,9 Unit costs are based on 1,516 hours per year.
Ratio of direct to indirect time on: client contact
No current information is available on the proportion of time spent with clients. See previous editions of this volume for sources of information. Please complete our new time-use survey: https://www.surveymonkey.com/s/SZMF5YL.
London multiplier 1.09 x A 1.57 x E Allows for the higher costs associated with London compared to the national average cost.1,6,7
Non-London multiplier 0.97 x E Allows for the lower costs associated with working outside London compared to the national average cost.1,6,7
Unit costs available 2012/2013 (costs including training given in brackets)£41 (£44) per hour.
1 Local Government Association Analysis and Research (2013) Local government earnings survey 2012/2013, Local Government Association, London. 2 Thurley, D. (2011) Local government pension scheme, 2010 onwards, House of Commons, London, www.parliament.uk/briefing-papers/SN05823.pdf
[accessed 9 October 2013]. 3 Netten, A., Knight, J., Dennett, J., Cooley, R. & Slight, A. (1998) Development of a ready reckoner for staff costs in the NHS, Vols 1 & 2, Personal Social
Services Research Unit, University of Kent, Canterbury. 4 Personal communication with the Department of Health and the Higher Education Funding Council for England (HEFCE) Higher Education Funding
Council for England (HEFCE), 2011. 5 Based on information taken from Selwyn et al. (2009) Adoption and the inter-agency fee, University of Bristol, Bristol; and Glendinning et al. (2010) Home
care re-ablement services: investigating the longer-term impacts, Final Report, University of York, PSSRU Kent, Department of Health, London. 6 Building Cost Information Service (2013) Surveys of tender prices, Royal Institute of Chartered Surveyors, London. 7 Personal communication with the Department for Communities and Local Government, 2011. 8 Local Government Employers (2012) Green Book: national agreement on pay and conditions of service, Local Government Association, London.
http://www.local.gov.uk/local-government-intelligence/-/journal_content/56/10180/3328402/ARTICLE/ [accessed 9 October 2013]. 9 Local Government Association (2013) Local government workforce survey 2012/13, http://www.local.gov.uk/local-government-intelligence/-
/journal_content/56/10180/3328402/ARTICLE/ [accessed 9 October 2013].

202 Unit Costs of Health and Social Care 2013
11.6 Home care worker This table provides information on the costs of a home care worker. Salary information is taken from the National Minimum Dataset for Social Care (Skills for Care, 2013).1 Based on PSS EX1 2011/2012,2 the mean hourly cost of all home care including LA-funded and independent provision was £17, the mean hourly cost of LA home care was £35 and the mean hourly cost was £15 for independent sector provision. See Jones (2005) for findings on the costs of independently provided home care3 and Mickelborough (2011)4 for more information on the domiciliary care market. Costs and unit estimation
2012/2013 value Notes
A. Wages/salary £13,632 per year The median annual salary for a public and independent sector care worker in August 2013 was £13,632 (£6.80 gross hourly salary). A senior home care worker would earn £16,984 per year (£7.30 gross hourly salary).1
B. Salary oncosts £3,574 per year Employer’s national insurance is included plus 20 per cent of salary for employer’s contribution to superannuation.5
C. Overheads Direct overheads
£4,990 per year
Direct overheads were 29 per cent of direct care salary costs. They include costs to the provider for administration and management, as well as for office, training and utilities such as water, gas and electricity.6
Indirect overheads £2,753 per hour Indirect overheads were 16 per cent of direct care salary costs. They include general management and support services such as finance and human resource departments.6
D. Travel No information available on average mileage covered per visit. For information see Green Book: National Agreement on Pay and Conditions of Service. 7
Working time 41.9 weeks per year 37 hours per week
Includes 29 days annual leave, 8 days statutory leave, 8.2 days of sickness and 5 days for training.7,8 The median number of hours worked by home care workers in 2008 (1,301).9
Ratios of direct to indirect time on: Face-to-face
1:0.25
No current information available on the proportion of time spent with clients. It is likely however that if 19 per cent of a home care workers’ time is spent travelling (see duration of visit below),10 the proportion of total time spent with clients is approximately 80 per cent.
Duration of visit Just over half of local authority funded visits lasted 30 minutes. Sixteen per cent of visits were 15 minutes and 19 per cent of a home care workers’ time was spent travelling.10 Please complete our new time-use survey: https://www.surveymonkey.com/s/SZMF5YL.
Service use 7 hours per week (364 hours per year)
On average, individual service users received 364 hours of home care in 2011/12 (7 hours per week).10
Price multipliers for unsocial hours4
1.00 1.086 1.035 1.093 1.036 1.031 1.039
Day-time weeklyDay-time weekend ) Night-time weekday ) for an independent sector home care hour Night-time weekend ) provided for private purchasers Day-time weekend ) Night-time weekday ) for an independent sector home care hour Night-time weekend ) provided for social services
Unit costs available 2012/2013 Based on the price multipliers for independent sector home care provided for private purchasers:£19 per weekday hour; (£21 per day-time weekend, £20 per night-time weekday, £21 per night-time weekend). Face-to-face: £24 per hour weekday; (£26 per day-time weekend, £25 per night-time weekday, £26 per night-time weekend). Based on the price multipliers for independent sector home care provided for social services: £19 per weekday hour; (£20 per day-time weekend, £20 per night-time weekday, £20 per night-time weekend). Face-to-face: £24 per hour weekday; (£25 per day-time weekend, £25 per night-time weekday, £25 per night-time weekend).
1 Skills for Care (2013) The national minimum dataset for social care (NMDS-SC) and data protection: guidance for employers, Skills for Care.
https://www.nmds-sc-online.org.uk/research/researchdocs.aspx?id=10/ [accessed 26 September 2013]. 2 Health & Social Care Information Centre (2013) PSS EX1 2011/12, Health & Social Care Information Centre, Leeds. 3 Jones, K. (2005) The cost of providing home care, in L. Curtis & A. Netten (eds) Unit Costs of Health and Social Care 2005, Personal Social Services
Research Unit, University of Kent, Canterbury. 4 Mickelborough, P. (2011) Domiciliary care, UK Market Report, Laing & Buisson, London. 5 Thurley, D. (2011) Local government pension scheme, 2010 onwards, House of Commons, London. www.parliament.uk/briefing-papers/sn05823.pdf
[accessed 9 October 2013]. 6 Based on information taken from Selwyn, J. et al. (2009) Adoption and the inter-agency fee, University of Bristol, Bristol; and Glendinning, C. et al. (2010)
Home care re-ablement services: investigating the longer-term impacts, Final Report, University of York, PSSRU Kent, Department of Health, London. 7 Local Government Employers (2012) Green Book: national agreement on pay and conditions of service, Local Government Association, London.
http://www.local.gov.uk/local-government-intelligence/-/journal_content/56/10180/3328402/ARTICLE/ [accessed 9 October 2013]. 8 Local Government Association (2013) Local government workforce survey 2011/12, http://www.local.gov.uk/local-government-intelligence/-
/journal_content/56/10180/3328402/ARTICLE/ [accessed 9 October 2013]. 9 Information Centre (2010) Community care statistics 2008, home care services for adults, England, Information Centre, Leeds. 10 United Kingdom Home Care Association (UKHCA) (2013) An overview of the UK domiciliary care sector, Home Care Association Limited.
http://www.ukhca.co.uk/pdfs/domiciliarycaresectoroverview.pdf [accessed 4 November 2013].

Unit Costs of Health and Social Care 2012 203
11.7 Home care manager Salary information in this table is taken from the National Minimum Dataset for Social Care (NMDS-SC)1 and has been based on the salary of a Registered Manager. Costs and unit estimation
2012/2013 value Notes
A. Wages/salary £30,766 per year Median salary for a home care manager has been taken from the National Minimum Dataset for Social Care (NMDS-SC).1
B. Salary oncosts £9,366 per year Employer’s national insurance is included plus 20 per cent of salary for employer’s contribution to superannuation.2
C. Qualifications No information available.D. Overheads: Direct Indirect
£11,638 per year £6,421 per year
Direct overheads were 29 per cent of direct care salary costs. They include costs to the provider for administration and management, as well as for office, training and utilities such as water, gas and electricity. Indirect overheads were 16 per cent of direct care salary costs. They include general management and support services such as finance and human resource departments.3
E. Capital overheads £1,897 per year Based on the new-build and land requirements of a local office and shared facilities for waiting, interviews and clerical support.4,5 Capital costs have been annuitised over 60 years at a discount rate of 3.5 per cent.
F. Travel No information available on average mileage covered per visit. For information see Green Book: National Agreement on Pay and Conditions of Service.6
Working time 41 weeks per year 37 hours per week
Includes 29 days annual leave and 8 statutory leave days. Ten days for study/training and 8.2 days sickness leave have been assumed based on average of all social work sectors for 2009/2010.7 Unit costs are based on 1,515 hours per year.
Ratios of direct to indirect time on: client-related work face to-face contact
1:0.56 1:3.17
Ratios are used to estimate the full cost of direct and indirect time required to deliver each output. The study found that care managers spent 24 per cent of their time in direct contact with the service user and carer and an additional 40 per cent on client-related activities. Twenty-five per cent of time was spent on non-client-related administrative tasks such as dealing with telephone enquiries, lunch/breaks and training. 11.1 per cent was spent on travelling to service users, carers and meetings.8 Please complete our new time-use survey: https://www.surveymonkey.com/s/SZMF5YL.
Frequency of visits Duration of visits
9 per week 45 minutes
Average number of visits per week per worker.8 Average duration of visits.8
Caseload per worker 14 Number of cases per care manager.8
London multiplier 1.25 x A 1.49 x E Allows for the higher costs associated with London compared to the national average cost.4,5
Non-London multiplier
0.97 x E Relative London costs are drawn from the same source as the base data for each cost element.4,5
Unit costs available 2012/2013 £40 per hour; £62 per hour of client-related work; £166 per hour of face-to-face contact.
1 Skills for Care (2012) The national minimum dataset for social care (NMDS-SC) and data protection: guidance for employers, Skills for Care,
https://www.nmds-sc-online.org.uk/research/researchdocs.aspx?id=10/ [accessed 26 September 2013]. 2 Thurley, D. (2011) Local government pension scheme, 2010 onwards, House of Commons, London. www.parliament.uk/briefing-papers/SN05823.pdf
[accessed 9 October 2013]. 3 Based on information taken from Selwyn, J. et al. (2009) Adoption and the inter-agency fee, University of Bristol, Bristol; and Glendinning, C. et al. (2010)
Home care re-ablement services: investigating the longer-term impacts, Final Report, University of York, PSSRU Kent, Department of Health, London. 4 Building Cost Information Service (2013) Surveys of tender prices, Royal Institute of Chartered Surveyors, London. 5 Personal communication with the Department for Communities and Local Government, 2011. 6 Local Government Employers (2012) Green Book: national agreement on pay and conditions of service, Local Government Association, London.
http://www.local.gov.uk/local-government-intelligence/-/journal_content/56/10180/3328402/ARTICLE/ [accessed 9 October 2013]. 7 Local Government Association (2012) Local Government Workforce Survey 2010/11, http://www.local.gov.uk/local-government-intelligence/-
/journal_content/56/10180/3328402/ARTICLE/ [accessed 9 October 2013]. 8 Weinberg, A., Williamson, J., Challis, D. & Hughes, J. (2003) What do care managers do? A study of working practice in older people’s services, British
Journal of Social Work, 33, 901-919.

204 Unit Costs of Health and Social Care 2013
11.8 Family support worker Family support workers provide emotional and practical help and advice to families who are experiencing long- or short-term difficulties. A study carried out by the Centre for Child and Family Research (CCFR)1 explored the costs of Intensive Family Support Services received by 43 families in two local authority areas (sites 1 and 2). In site 1, the average length of the intervention was just over one year (413 days) and ranged from seven months to one year, nine months. The average length of the intervention in Site 2 was just under one year (269 days) and ranged from two months to just under two years. The average cost of the IFS service per family in one local authority was £6,171 (£3,152-£9,950) and in the other £5,230 (£1,089-£14,271). Costs and unit estimation
2012/2013 value Notes
A. Wages/salary £22,941 per year Information taken from the Local Government Earnings Survey 2008 showed that the mean salary for a family support worker was £21,296.2 As no new salary estimates are available, this has been inflated to reflect the pay increments for social workers reported in the Local Government Earnings Surveys 2009, 2010, 2011 and 2012. 3
B. Salary oncosts £6,721 per year Employer’s national insurance is included plus employer’s contribution to superannuation (20%).4
C. Training No information available.D. Overheads Direct overheads Indirect overheads
£8,602 per year £4,746 per year
Direct overheads were 29 per cent of direct care salary costs. They include costs to the provider for administration and management, as well as for office, training and utilities such as water, gas and electricity.4 Indirect overheads were 16 per cent of direct care salary costs. They include general management and support services such as finance and human resource departments.5
E. Capital overheads £1,897 per year Based on the new-build and land requirements for a local authority office and shared facilities for waiting, interviews and clerical support.6,7 Capital costs have been annuitised over 60 years at a discount rate of 3.5 per cent.
F. Travel No information available on average mileage covered per visit. For information see Green Book: National Agreement on Pay and Conditions of Service.8 Please complete our new time-use survey: (https://www.surveymonkey.com/s/SZMF5YL).
Working time 41.9 weeks per year 37 hours per week
Includes 29 days annual leave and 8 statutory leave days. Five days for study/training and 8.2 days sickness leave have been assumed based on average of all social work sectors for 2011/2012.8,9 Unit costs are based on 1552 hours per year.
Ratios of direct to indirect time on: client related work
No current information is available on the proportion of time spent with clients. See previous editions of this volume for sources of information. Please complete our new time-use survey: (https://www.surveymonkey.com/s/SZMF5YL).
London multiplier 1.16 x A Allows for the higher costs associated with London compared to the national average cost.9
Unit costs available 2012/2013 £29 per hour; £49 per hour of client related work.
1 McDermid, S. & Holmes, L. (2013) The cost effectiveness of action for children’s intensive family support services, Final Report, Centre for Child and Family
Research, Loughborough University. http://socialwelfare.bl.uk/subject-areas/services-client-groups/families/actionforchildren/153741intensive-family-support-cost-effectiveness_full-report.pdf [accessed 3 October 2013].
2 Local Government Association Analysis and Research (2008) Local Government Earnings Survey 2007, Local Government Analysis and Research, London. 3 Local Government Association (2013) Local government pay and workforce research, http://www.local.gov.uk/research-pay-and-workforce [accessed 16
October 2013]. 4 Thurley, D. (2011) Local government pension scheme, 2010 onwards, House of Commons, London. www.parliament.uk/briefing-papers/SN05823.pdf
[accessed 9 October 2013]. 5 Based on information taken from Selwyn, J. et al. (2009) Adoption and the inter-agency fee, University of Bristol, Bristol; and Glendinning, C. et al. (2010)
Home care re-ablement services: investigating the longer-term impacts, Final Report, University of York, PSSRU Kent, Department of Health, London. 6 Personal communication with the Department for Communities and Local Government, 2011. 7 Building Cost Information Service (2013) Surveys of tender prices, Royal Institute of Chartered Surveyors, London. 8 Local Government Employers (2013) Green Book: national agreement on pay and conditions of service, Local Government Association, London.
http://www.local.gov.uk/local-government-intelligence/-/journal_content/56/10180/3328402/ARTICLE/ [accessed 9 October 2013]. 9 Local Government Association (2012) Local Government Workforce Survey 2011/12, http://www.local.gov.uk/local-government-intelligence/-
/journal_content/56/10180/3328402/ARTICLE/ [accessed 9 October 2013].

Unit Costs of Health and Social Care 2011 205
12. Health and social care teams
12.1 NHS community mental health team (CMHT) for older people with mental health problems
12.2 Community mental health team for adults with mental health problems 12.3 Crisis resolution team for adults with mental health problems 12.4 Assertive outreach team for adults with mental health problems 12.5 Early intervention team for adults with mental health problems 12.6 Generic single disciplinary CAMHS team 12.7 Generic multi-disciplinary CAMHS team 12.8 Dedicated CAMHS team 12.9 Targeted CAMHS team 12.10 Transition services for children with complex needs when transferring to
adulthood

206 Unit Costs of Health and Social Care 2013

Unit Costs of Health and Social Care 2013 207
12.1 NHS community mental health team (CMHT) for older people with mental health problems Based on information taken from the Older People’s Mental Health Mapping framework,1,2,3 the mean average cost for all community mental health teams for older people with mental health problems in 2012/2013 was £128 per face-to-face contact. Costs have been uprated using the HCHS pay & prices inflator. Costs and unit estimation
2012/2013 value Notes
A. Wages/salary £29,635 per year Based on mean basic salaries for Agenda for Change (AfC) bands.4 Weighted to reflect input of community nurses (43%), social workers/approved social workers (12%), consultants (6%) and others. Weighted average salaries for each type of worker were multiplied by the proportion of that type of worker in the team to produce a generic CMHT (OP) worker salary.1 See the preface for information on changes to salaries, and section V for further information on pay scales.
B. Salary oncosts £7,568 per year Employer’s national insurance is included plus 14 per cent of salary for employer’s contribution to superannuation.
C. Overheads Management, administration and estates staff Non-staff
£7,184 per year £15,614 per year
Taken from NHS (England) Summarised accounts.5 Management and other non-care staff costs were 19.31 per cent of direct care salary costs and included administration and estates staff. Non-staff costs were 41.97 per cent of direct care salary costs. They include costs to the provider for office, travel/transport and telephone, education and training, supplies and services (clinical and general), as well as utilities such as water, gas and electricity.
D. Capital overheads
£2,966 per year Based on the new-build and land requirements of an NHS office and shared facilities for waiting, interviews and clerical support.6,7 Capital costs have been annuitised over 60 years at a discount rate of 3.5 per cent.
Working time 42.1 weeks per year 37.5 hours per week
Unit costs are based on 1,577 hours per year: 225 working days minus sickness absence and training/study days as reported for all NHS staff groups.8
Ratios of direct to indirect time
No current information on time use is available. See previous editions of this volume for sources of information.
Frequency of visits Duration of visits
8 60 minutes
Average number of visits per week per worker. Average duration of visits.
Caseload per CMHT
32 cases per care staff
Based on mental health combined mapping data.1 In 2008/09 there was an average of 389 cases per service and 32 cases per year per generic CMHT.
London multiplier 1.19 x A1.45 x D
Allows for higher costs associated with working in London.6,7,9
Non-London multiplier
0.97 x A0.97 x D
Allows for lower costs associated with working outside London.6,7,9
Unit costs available 2012/2013 £40 per hour per team member; £62,967 annual cost of team member
1 Care Services Improvement Partnership, Mental Health Strategies (2009) Combined mapping framework, http://nmhdu.org.uk/silo/files/service-
mapping.pdf [accessed 17 January, 2013]. 2 Lingard, J. & Milne, A. (2004) Commissioned by the children, older people & social care policy directorate, Integrating Older People’s Mental Health
Services, Community Mental Health Teams for Older People, http://nmhdu.org.uk/silo/files/integrating-opmh-services.pdf [accessed 9 October 2013]. 3 Mental Health Strategies (2009) 2008/09 National survey of investment in adult mental health services, Mental Health Strategies for the Department of
Health, London. 4 Health & Social Care Information Centre (2012) NHS staff earnings estimates 2013, Health & Social Care Information Centre, Leeds. 5 Audit Commission (2012) Summarised accounts 2011-2012, NHS, London. 6 Building Cost Information Service (2013) Surveys of tender prices, Royal Institute of Chartered Surveyors, London. 7 Personal communication with the Department for Communities and Local Government, 2011. 8 Contracted hours are taken from NHS Careers (2012) Pay and benefits, National Health Service, London. http://www.nhscareers.nhs.uk/ [accessed 9
October 2013]. Working days and sickness absence rates as reported in Information Centre (2012) Sickness absence rates in the NHS: January-March 2012 and annual summary 2009-10 to 2011-12, Information Centre, Leeds.
9 Department of Health (2013) based on the Market Forces Factor (MFF).

208 Unit Costs of Health and Social Care 2013
12.2 Community mental health team for adults with mental health problems Composed of professionals from a wide range of disciplines, community mental health teams (CMHTs) are intended to provide an effective local mental health service that prioritises those whose problems are severe and long-term.1 Information has been taken from the mental health combined mapping website2 and is based on data received from 787 service providers. There were, on average, 15 care staff per team. NHS reference costs3 report that the mean average weighted cost per contact with a community mental health team for adults with mental health problems was £125. Costs have been uprated using the HCHS pay & prices Inflator. Costs and unit estimation
2012/2013 value Notes
A. Wages/salary £26,799 per year Based on mean basic salaries for Agenda for Change (AfC) bands.4 Weighted to reflect input of community nurses (31%), social workers/approved social workers (18%), consultants (6%) OTs and physiotherapists (5%), carer support (5%) and others. Weighted average salaries for each type of worker were multiplied by the proportion of that type of worker in the team to produce a generic CMHT worker salary.2 See the preface for information on changes to salaries, and section V for further information on pay scales.
B. Salary oncosts £6,610 per year Employer’s national insurance is included plus 14 per cent of salary for employer’s contribution to superannuation.
C. Qualifications Information not available for all care staff.D. Overheads Management, administration and estates staff Non-staff
£6,451 per year £14,022 per year
Taken from NHS (England) Summarised accounts.5 Management and other non-care staff costs were 19.31 per cent of direct care salary costs and included administration and estates staff. Non-staff costs were 41.97 per cent of direct care salary costs. They include costs to the provider for office, travel/transport and telephone, education and training, supplies and services (clinical and general), as well as utilities such as water, gas and electricity.
E. Capital overheads
£2,966 per year Based on the new-build and land requirements of an NHS office and shared facilities for waiting, interviews and clerical support.6,7 Capital costs have been annuitised over 60 years at a discount rate of 3.5 per cent.
Working time 42.1 wks per year 37.5 hrs per week
Unit costs are based on 1,577 hours per year: 225 working days minus sickness absence and training/study days as reported for all NHS staff groups.8
Ratio of direct to indirect time
No current information on time use is available. See previous editions of this volume for sources of information.
Caseload per CMHT
24 cases per CMHT
Based on mental health combined mapping data.1 In 2008/09, there was an average of 404 cases per service and 24 cases per year per generic CMHT.
London multiplier 1.19 x A, 1.45 x E Allows for higher costs associated with working in London.6,7,9 Non-London multiplier
0.97 x A, 0.97 x E Allows for the lower costs associated with working outside London.6,7,9
Unit costs available 2012/2013 £36 per hour per team member; £56,849 annual cost of team member
1 Mental Health Strategies (2009) 2008/09 National survey of investment in adult mental health services, Mental Health Strategies for the Department of Health,
London. 2 Care Services Improvement Partnership, Mental Health Strategies (2009) Combined mapping framework, http://nmhdu.org.uk/silo/files/service-mapping.pdf
[accessed 17 January 2013]. 3 http://www.dh.gov.uk/en/Publicationsandstatistics/Publications/PublicationsPolicyAndGuidance/DH_123459 [accessed 9 October 2013]. 4 Health & Social Care Information Centre (2012) NHS staff earnings estimates 2013, Health & Social Care Information Centre, Leeds. 5 Audit Commission (2012) Summarised accounts 2011-2012, NHS, London. 6 Building Cost Information Service (2013) Surveys of tender prices, Royal Institute of Chartered Surveyors, London. 7 Personal communication with the Department for Communities and Local Government, 2011. 8 Contracted hours are taken from NHS Careers (2012) Pay and benefits, National Health Service, London. http://www.nhscareers.nhs.uk/ [accessed 9 October 2013]
Working days and sickness absence rates as reported in Information Centre (2012) Sickness absence rates in the NHS: January-March 2012 and annual summary 2009-10 to 2011-12, Information Centre, Leeds.
9 Department of Health (2013) based on the Market Forces Factor (MFF).

Unit Costs of Health and Social Care 2013 209
12.3 Crisis resolution team for adults with mental health problems Crisis resolution is an alternative to inpatient hospital care for service users with serious mental illness, offering flexible, home-based care 24 hours a day, seven days a week. Information has been taken from the mental health combined mapping website1 and is based on data received from 270 service providers. There were, on average, 17 care staff per team. NHS reference costs2 report that the mean average cost for a crisis resolution team for 2011 was £184 per team contact, with an interquartile range of £140 to £213. Costs have been uprated using the HCHS pay & prices Inflator. See the 2008/09 National Survey of Investment in Adult Mental Health Services and McCrone et al. (2008) for more information on Crisis Resolution Teams.3,4 Costs and unit estimation
2012/2013 value Notes
A. Wages/salary £27,848 per year Based on mean salaries for Agenda for Change (AfC) bands.5 Weighted average salaries for each type of worker were multiplied by the proportion of that type of worker in the team to produce a generic crisis resolution worker salary. Teams included medical staff, nurses, psychologists, social workers, social care and other therapists.1 See the preface for information on changes to salaries, and section V for further information on pay scales.
B. Salary oncosts £6,824 per year Employer’s national insurance is included plus 14 per cent of salary for employer’s contribution to superannuation.
C. Training No costs available. Crisis resolution work involves a major re-orientation for staff who have been accustomed to working in different ways.
D. Overheads Management, administration and estates staff Non-staff
£6,695 per year £14,552 per year
Taken from NHS (England) Summarised accounts.6 Management and other non-care staff costs were 19.31 per cent of direct care salary costs and included administration and estates staff. Non-staff costs were 41.97 per cent of direct care salary costs. They include costs to the provider for office, travel/transport and telephone, education and training, supplies and services (clinical and general), as well as utilities such as water, gas and electricity.
E. Capital overheads £2,966 per year Based on the new-build and land requirements of an NHS office and shared facilities for waiting, interviews and clerical support.7,8 Costs have been annuitised over 60 years at a discount rate of 3.5 per cent.
Working hours of team members
42.1 weeks per year 37.5 hours per week
Unit costs are based on 1,577 hours per year: 225 working days minus sickness absence and training/study days as reported for all NHS staff groups.9
Service hours 24 hours per day 7 days per week
In general, the team should operate seven days a week, 24 hours per day throughout the year. This can be done if two shifts a day are scheduled for mornings and afternoons.10
Duration of episode 27 days The National Survey reported that 27 days was the average duration of episode. The mean longest time that teams stay involved is 75.6 days.11
Caseload 36 cases per service 2 cases per care staff
Based on mental health combined mapping data1 average caseloads for 2008/09 were 36 cases per service and 2 cases per year per crisis resolution team member.
London multiplier 1.19 x A, 1.39 x E Allows for higher costs associated with working in London.7,8,12 Non-London multiplier 0.97 x A, 0.96 x E Allows for lower costs associated with working outside London.7,8,12 Unit costs available 2012/2013 (costs including qualifications given in brackets) £37 per hour per team member; £58,886 annual cost of team member
1 Care Services Improvement Partnership, Mental Health Strategies (2009) Combined mapping framework, http://nmhdu.org.uk/silo/files/service-mapping.pdf
[accessed 17 January 2013]. 2 Department of Health (2013) NHS reference costs 2011-2012, https://www.gov.uk/government/news/financial-year-2011-to-2012-reference-costs-published [accessed 2 October 2013]. 3 McCrone, P., Dhanasiri, S., Patel, A., Knapp, M. & Lawton-Smith, S. (2008) Paying the price, the cost of mental health care in England to 2026, King’s Fund, London. 4 Mental Health Strategies (2009) 2008/09 National survey of investment in adult mental health services, Mental Health Strategies for the Department of Health,
London. 5 Health & Social Care Information Centre (2012) NHS staff earnings estimates 2013, Health & Social Care Information Centre, Leeds. 6 Audit Commission (2012) Summarised accounts 2011-2012, NHS, London. 7 Building Cost Information Service (2013) Surveys of tender prices, Royal Institute of Chartered Surveyors, London. 8 Personal communication with the Department for Communities and Local Government, 2011. 9 Contracted hours are taken from NHS Careers (2012) Pay and benefits, National Health Service, London. http://www.nhscareers.nhs.uk/ [accessed 9 October
2013]. Working days and sickness absence rates as reported in Information Centre (2012) Sickness absence rates in the NHS: January-March 2012 and annual summary 2009-10 to 2011-12, Information Centre, Leeds.
10Sainsbury Centre for Mental Health (2010) Mental health topics, crisis resolution, http://www.centreformentalhealth.org.uk/pdfs/crisis_resolution_mh_topics.pdf [accessed 9 October 2013].
11Onyett, S., Linde, K., Glover, G. et al (2007) Crisis resolution and inpatient mental health care in England, University of Durham. 12Department of Health (2013) based on the Market Forces Factor (MFF).

210 Unit Costs of Health and Social Care 2013
12.4 Assertive outreach team for adults with mental health problems Assertive outreach teams provide intensive support for people with severe mental illness who are ‘difficult to engage’ in more traditional services.1 Information has been taken from the mental health combined mapping website2 and is based on data received from 248 service providers. See the 2008/09 National Survey of Investment in Adult Mental Health Services and McCrone et al. (2008) for more information on this service.3,4 NHS reference costs5 report the mean average cost for an assertive outreach team contact for 2011 was £127. Costs have been uprated using the HCHS pay & prices inflator. Costs and unit estimation
2012/2013 value Notes
A. Wages/salary £24,720 per year Based on mean salaries for Agenda for Change (AfC) bands.6 Weighted average salaries for each type of worker were multiplied by the proportion of that type of worker in the team to produce a generic Assertive Outreach Team worker salary. Teams included doctors, nurses, psychologists, social workers, social care, other therapists and volunteers.2 See preface and section V for further information on pay scales.
B. Salary oncosts £6,076 per year Employer’s national insurance is included plus 14 per cent of salary for employer’s contribution to superannuation.
C. Overheads Management, administration and estates staff Non-staff
£5,947 per year £12,925 per year
Taken from NHS (England) Summarised accounts.7 Management and other non-care staff costs were 19.31 per cent of direct care salary costs and included administration and estates staff. Non-staff costs were 41.97 per cent of direct care salary costs. They include costs to the provider for office, travel/transport and telephone, education and training, supplies and services (clinical and general), as well as utilities such as water, gas and electricity.
D. Capital overheads £2,966 per year Based on the new-build and land requirements of an NHS office and shared facilities.8,9 Capital costs have been annuitised over 60 years at a discount rate of 3.5 per cent.
Ratio of direct contact to total contact time: face-to-face contacts
1:0.48
Of the assertive outreach team contacts, 68 per cent were face-to-face with the patient, 13 per cent were by telephone, 11 per cent of all attempts at contact were unsuccessful and a further 6 per cent involved contact with the carer (face-to-face or by phone). Of the face-to-face contacts with patients, 63 per cent took place in the patient’s home or neighbourhood, 27 per cent in service settings and 10 per cent in other settings.10
Working hours of team members
42 weeks per year 37.5 hours per week
Unit costs are based on 1,577 hours per year: 225 working days minus sickness absence and training/study days as reported for all NHS staff groups.11
Service hours 24 hours per day Working hours of most services are flexible, although 24-hour services are rare. Duration of contact 30 minutes Median duration of contact. Assertive outreach staff expect to see their clients
frequently and to stay in contact, however difficult that may be. Typically studies have shown that at least 95 per cent of clients are still in contact with services even after 18 months.10
Caseload 72 cases per service 7 cases per care staff
Based on mental health combined mapping data,2 average caseloads for 2008/09 were 72 cases per service and 7 cases per year per assertive outreach team member.
London multiplier 1.19 x A,1.39 x E Allows for the higher costs associated with working in London.8,9,12 Non-London multiplier
0.97 x A,0.96 x E Allows for lower costs associated with working outside London.8,9,12
Unit costs available 2012/2013 (costs including qualifications given in brackets) £33 per hour per team member; £49 per hour of patient contact; £52,634 annual cost of team member
1 Sainsbury Centre for Mental Health (2001) Mental health topics, assertive outreach, Sainsbury Centre for Mental Health (updated 2003), London. 2 Care Services Improvement Partnership, Mental Health Strategies (2009) Combined mapping framework, http://nmhdu.org.uk/silo/files/service-mapping.pdf
[accessed 17 January 2013]. 3 Mental Health Strategies (2009) 2008/09 National survey of investment in adult mental health services, Mental Health Strategies for the Department of Health,
London. 4 McCrone, P., Dhanasiri, S., Patel, A., Knapp, M. & Lawton-Smith, S. (2008) Paying the price, the cost of mental health care in England to 2026, King’s Fund, London. 5 Department of Health (2013) NHS reference costs 2011-2012, https://www.gov.uk/government/news/financial-year-2011-to-2012-reference-costs-published [accessed 2 October 2013]. 6 Health & Social Care Information Centre (2012) NHS staff earnings estimates 2013, Health & Social Care Information Centre, Leeds. 7 Audit Commission (2012) Summarised accounts 2011-2012, NHS, London. 8 Building Cost Information Service (2013) Surveys of tender prices, Royal Institute of Chartered Surveyors, London. 9 Personal communication with the Department for Communities and Local Government, 2012 10 Wright, C., Burns, T., James, P., Billings, J., Muijen, M. Priebe, S. Ryrie, I., Watts, J. & White, I. (2003) Assertive outreach teams in London: models of operation,
British Journal of Psychiatry, 183, 2, 132-138. 11 Contracted hours are taken from NHS Careers (2012) Pay and benefits, National Health Service, London, http://www.nhscareers.nhs.uk/ [accessed 9 October
2013]. Training days as recommended by professional bodies. Working days and sickness absence rates as reported in Information Centre (2012) Sickness absence rates in the NHS: January-March 2012 and annual summary 2009-10 to 2011-12, Information Centre, Leeds.
12 Department of Health (2013) based on the Market Forces Factor (MFF).

Unit Costs of Health and Social Care 2013 211
12.5 Early intervention team for adults with mental health problems Early intervention is a service for young people aged 14-35 during the first three years of a psychotic illness. They provide a range of services, including anti-psychotic medications and psycho-social interventions, tailored to the needs of young people with a view to facilitating recovery.1 Staff and caseload information for this table has been taken from the mental health combined mapping website2 and is based on data received from 150 service providers. NHS reference costs3 report the mean average cost for an early intervention team contact for 2011 was £177, with an interquartile range of £148-£194. See the 2008/09 National Survey of Investment in Adult Mental Health Services4 and McCrone et al. (2008) for more information on Early Intervention Teams.5 See the preface for information on changes to salaries, and section V for further information on pay scales. Costs and unit estimation
2012/2013 value Notes
A. Wages/salary £27,809 per year Based on median salaries for Agenda for Change (AfC) bands.6 Weighted average salaries for each type of worker were multiplied by the proportion of that type of worker in the team to produce a generic assertive outreach team worker salary. Teams included doctors, nurses, psychologists, social workers, social care, other therapists and volunteers.2 Loss of earnings based on the minimum wage has been assumed for volunteers.7
B. Salary oncosts £6,858 per year Employer’s national insurance is included plus 14 per cent of salary for employer’s contribution to superannuation.
C. Training Sainsbury Centre for Mental Health runs a part-time post-graduate certificate (EIP) over a one-year period which includes 20 days of teaching.8
D. Overheads Management, administration and estates staff Non-staff
£6,694 per year £14,550 per year
Taken from NHS (England) Summarised accounts.9 Management and other non-care staff costs were 19.31 per cent of direct care salary costs and included administration and estates staff. Non-staff costs were 41.97 per cent of direct care salary costs. They include costs to the provider for office, travel/transport and telephone, education and training, supplies and services (clinical and general), as well as utilities such as water, gas and electricity.
E. Capital overheads £2,966 per year Based on the new-build and land requirements of an NHS office and shared facilities.10,11 Capital costs have been annuitised over 60 years at a discount rate of 3.5 per cent.
Working time per staff member
42 weeks per year 37.5 hours per week
Unit costs are based on 1,577 hours per year: 225 working days minus sickness absence and training/study days as reported for all NHS staff groups.12
Service hours Teams tend to operate 9.00 a.m. – 5.00 p.m. but some flexibility is planned. Caseload 98 cases per service
9 cases per care staff Based on mental health combined mapping data.2 Caseload data for 2008/09 were 98 cases per service and 9 cases per early intervention team member.
Ratio of direct to indirect time
No information available
London multiplier 1.19 x A 1.39 x E
Allows for higher costs associated with working in London.10,11,13
Non-London multiplier
0.97 x A 0.96 x E
Allows for lower costs associated with working outside London.10,11,13
Unit costs available 2012/2013 (costs including qualifications given in brackets) £37 per hour; £58,877 annual cost of team member
1 Sainsbury Centre for Mental Health (2003) A window of opportunity: a practical guide for Developing Early Intervention in Psychosis Services, Briefing 23, Sainsbury
Centre for Mental Health, London. 2 Care Services Improvement Partnership, Mental Health Strategies (2009) Combined Mapping Framework, http://nmhdu.org.uk/silo/files/service-mapping.pdf
[accessed 17 January 2013]. 3 Department of Health (2013) NHS reference costs 2011-2012, https://www.gov.uk/government/news/financial-year-2011-to-2012-reference-costs-published [accessed 2 October 2013]. 4 Mental Health Strategies (2009) 2008/09 national survey of investment in adult mental health services, Mental Health Strategies for the Department of Health,
London. 5 McCrone, P., Dhanasiri, S., Patel, A., Knapp, M. & Lawton-Smith, S. (2008) Paying the price, the cost of mental health care in England to 2026, King’s Fund, London. 6 Health & Social Care Information Centre (2012) NHS staff earnings estimates 2013, Health & Social Care Information Centre, Leeds. 7 Directgov (2013) The national minimum wage rates, https://www.gov.uk/national-minimum-wage-rates/ [accessed 9 October 2013]. 8 Sainsbury Centre for Mental Health (2004) Post-graduate certificate in early intervention for psychosis, Sainsbury Centre for Mental Health, London. 9 Audit Commission (2012) Summarised accounts 2011-2012, NHS, London. 10 Building Cost Information Service (2013) Surveys of tender prices, Royal Institute of Chartered Surveyors, London. 11Personal communication with the Department for Communities and Local Government, 2011. 12Contracted hours are taken from NHS Careers (2012) Pay and benefits, National Health Service, London. http://www.nhscareers.nhs.uk/ [accessed 9 October
2013]. Working days and sickness absence rates as reported in Information Centre (2012) Sickness absence rates in the NHS: January-March 2012 and annual summary 2009-10 to 2011-12, Information Centre, Leeds.
13Department of Health (2013) based on the Market Forces Factor (MFF).

212 Unit Costs of Health and Social Care 2013
12.6 Generic single-disciplinary CAMHS team These teams provide services for children and young people with particular problems requiring particular types of intervention and within a defined geographical area.1 Staff, caseload and cost information has been taken from the Child and Adolescent Mental Health Service (CAMHS)2,3 mapping database, and is based on returns from 2,094 teams of which 60 teams were generic single-disciplinary teams. The staff in these teams are almost exclusively clinical psychologists, educational psychologists and other therapists. The exceptions are teams of primary mental health workers which focus on psychological therapies. There are on average 4.13 wte per team (excluding administrative staff and managers). Costs have been uprated to 2012/2013 price levels using the appropriate inflators. Costs and unit estimation
2012/2013 value Notes
A. Wages/salary plus oncosts
£39,623 per year Average salary for single generic team member based on National Child and Adolescent Mental Health Service cost data.2,3 See the preface for information on changes to salaries, and section V for further information on pay scales.
B. Overheads Management, administration and estates staff Non-staff
£7,651 per year £16,630 per year
Taken from NHS (England) Summarised accounts.4 Management and other non-care staff costs were 19.31 per cent of direct care salary costs and included administration and estates staff. Non-staff costs were 41.97 per cent of direct care salary costs. They include costs to the provider for office, travel/transport and telephone, education and training, supplies and services (clinical and general), as well as utilities such as water, gas and electricity.
C. Capital overheads £2,966 per year Based on the new-build and land requirements of an NHS office and shared facilities.5,6 Capital costs have been annuitised over 60 years at a discount rate of 3.5 per cent. Based on the assumption that each team has one shared office.
Working time 42.2 weeks per year 37.5 hours per week
Unit costs are based on 1,577 hours per year: 225 working days minus sickness absence and training/study days as reported for all NHS staff groups.7
Ratio of direct to indirect time on: patient-related work face-to-face contact
1:0.63 1:1.06
Information taken from National Child and Adolescent Mental Health Service Mapping data.2 Staff activity was reported at the team level by Strategic Health Authority (SHA) averaging as follows: education and training (9%), research and evaluation (5%), administration and management (23%), consultation and liaison (13%) and clinical (49%).
Duration of episode 26 per cent of cases lasted 4 weeks or less, 25 per cent for 13 weeks or less, 18 per cent for 26 weeks or less, 16 per cent for 52 weeks or less and 15 per cent for more than 52 weeks.
Caseload per team 60 cases per team Based on 60 teams and a caseload of 3,604.2 London multiplier 1.19 x A
1.39 x C Allows for higher costs associated with working in London. 5,6,8
Non-London multiplier 0.97 x A 0.96 x C
Allows for lower costs associated with working outside London. 5,6,8
Unit costs available 2012/2013 £42 per hour per team member; £69 per hour per patient-related activity; £87 per hour per team member face-to-face contact; £66,870 annual cost of team member
1 YoungMinds (2001) Guidance for primary care trusts, child and adolescent mental health: its importance and how to commission a comprehensive
service, Appendix 3: Key Components, Professionals and Functions of Tiered Child and Adolescent Mental Health Services, Child and Adolescent Mental Health Services, www.youngminds.org.uk/pctguidance/app3.php [accessed 9 October 2013].
2 Child and Adolescent Mental Health Service (CAMHS) mapping (2009), Durham University & Department of Health, http://www.childrensmapping.org.uk/ [accessed 17 November 2013].
3 The CAMHS team cost data are no longer being collected so information for this table has been uprated this year. 4 Audit Commission (2012) Summarised accounts 2011-2012, NHS, London. 5 Building Cost Information Service (2013) Surveys of tender prices, Royal Institute of Chartered Surveyors, London. 6 Personal communication with the Department for Communities and Local Government, 2011. 7 Contracted hours are taken from NHS Careers (2012) Pay and benefits, National Health Service, London. http://www.nhscareers.nhs.uk/ [accessed 9
October 2013]. Working days and sickness absence rates as reported in Information Centre (2012) Sickness absence rates in the NHS: January-March 2012 and annual summary 2009-10 to 2011-12, Information Centre, Leeds.
8 Department of Health (2013) based on the Market Forces Factor (MFF).

Unit Costs of Health and Social Care 2013 213
12.7 Generic multi-disciplinary CAMHS team Staff mix, time use, caseload and cost information for this table has been taken from the Child and Adolescent Mental Health Service (CAMHS)1,2 mapping database, and is based on returns from 2,094 teams of which 421 teams were generic multi-disciplinary. Generic teams provide the backbone of specialist CAMHS provision, ensuring a range of therapeutic interventions were available to children, young people and families locally. Multidisciplinary generic teams, as the name implies, were largely staffed by a range of mental health professionals. The average size of multidisciplinary teams was 10.9 wte (excluding administrative staff and managers). Costs have been uprated to 2012/2013 price levels using the appropriate inflators. Costs and unit estimation
2012/2013 value
Notes
A. Wages/salary plus oncosts
£52,741 per year
Average salary plus oncosts for a generic multi-disciplinary team member based on National Child and Adolescent Mental Health Service cost data. The teams (excluding administrative and unqualified staff) included nurses (22%), doctors (18%), social workers (9%), clinical psychologists (15%), child psychotherapists (5%), occupational therapists (2%), mental health workers (10%), family therapists (5%), educational psychologists (1%) and other qualified therapists and care staff (13%).1,2 See the preface for information on changes to salaries, and section V for further information on pay scales.
B. Overheads Management, administration and estates staff Non-staff
£10,184 per year £22,135 per year
Taken from NHS (England) Summarised accounts.3 Management and other non-care staff costs were 19.31 per cent of direct care salary costs and included administration and estates staff. Non-staff costs were 41.97 per cent of direct care salary costs. They include costs to the provider for office, travel/transport and telephone, education and training, supplies and services (clinical and general), as well as utilities such as water, gas and electricity.
C. Capital overheads £2,966 per year Based on the new-build and land requirements of an NHS office and shared facilities . 4,5 Capital costs have been annuitised over 60 years at a discount rate of 3.5 per cent. Based on the assumption that each team has one shared office.
Working time 42 weeks per year 45.73 hours per week
Unit costs are based on 1,577 hours per year: 225 working days minus sickness absence and training/study days as reported for all NHS staff groups.6
Ratio of direct to indirect time on: patient-related work face-to-face contact
1:0.63 1:1.06
Information taken from National Child and Adolescent Mental Health Service Mapping data.1 Staff activity was reported at the team level by Strategic Health Authority (SHA) averaging as follows: education and training (9%), research and evaluation (5%), admin and management (23%), consultation and liaison (13%) and clinical (49%).
Duration of episode (all CAMHS teams)
19 per cent of cases lasted for 4 weeks or less, 21 per cent for 13 weeks or less, 19 per cent for 26 weeks or less, 17 per cent for 52 weeks or less and 25 per cent for more than 52 weeks.
Caseload per team 191 cases per team
Based on 421 teams and 80,386 cases.1
London multiplier 1.19 x A 1.39 x C
Allows for higher costs associated with working in London.4,5,7
Non-London multiplier
0.97 x A 0.96 x C
Allows for lower costs associated with working outside London. 4,5,7
Unit costs available 2012/2013 £56 per hour per team member; £91 cost per hour per team member for patient-related activities; £115 cost per hour per team member for face-to-face contact
1 Child and Adolescent Mental Health Service (CAMHS) mapping (2009), Durham University & Department of Health, http://www.childrensmapping.org.uk/
[accessed 17 November 2013]. 2 The CAMHS Mapping data are no longer being collected so information for this table has been uprated this year. 3 Audit Commission (2012) Summarised accounts 2011-2012, NHS, London. 4 Building Cost Information Service (2013) Surveys of tender prices, Royal Institute of Chartered Surveyors, London. 5 Personal communication with the Department for Communities and Local Government, 2011. 6 Contracted hours are taken from NHS Careers (2012) Pay and benefits, National Health Service, London. http://www.nhscareers.nhs.uk/ [accessed 9
October 2013]. Working days and sickness absence rates as reported in Information Centre (2012) Sickness absence rates in the NHS: January-March 2012 and annual summary 2009-10 to 2011-12, Information Centre, Leeds.
7 Department of Health (2013) based on the Market Forces Factor (MFF).
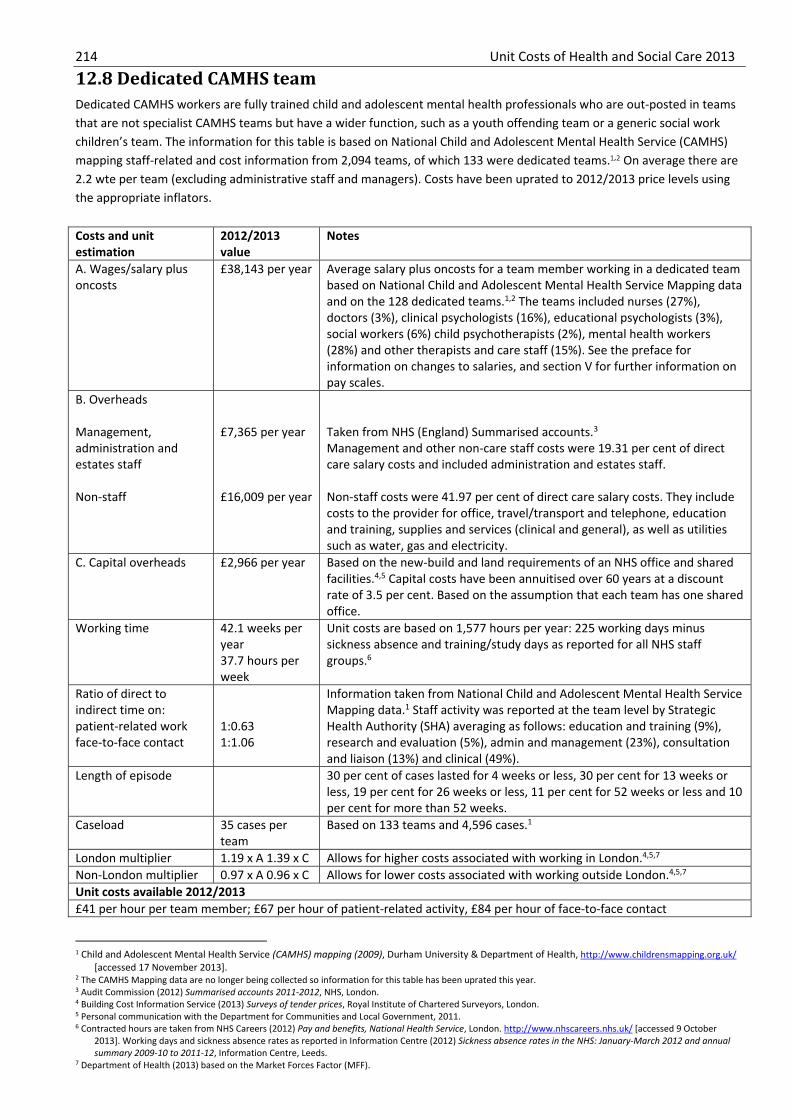
214 Unit Costs of Health and Social Care 2013
12.8 Dedicated CAMHS team Dedicated CAMHS workers are fully trained child and adolescent mental health professionals who are out-posted in teams that are not specialist CAMHS teams but have a wider function, such as a youth offending team or a generic social work children’s team. The information for this table is based on National Child and Adolescent Mental Health Service (CAMHS) mapping staff-related and cost information from 2,094 teams, of which 133 were dedicated teams.1,2 On average there are 2.2 wte per team (excluding administrative staff and managers). Costs have been uprated to 2012/2013 price levels using the appropriate inflators. Costs and unit estimation
2012/2013 value
Notes
A. Wages/salary plus oncosts
£38,143 per year Average salary plus oncosts for a team member working in a dedicated team based on National Child and Adolescent Mental Health Service Mapping data and on the 128 dedicated teams.1,2 The teams included nurses (27%), doctors (3%), clinical psychologists (16%), educational psychologists (3%), social workers (6%) child psychotherapists (2%), mental health workers (28%) and other therapists and care staff (15%). See the preface for information on changes to salaries, and section V for further information on pay scales.
B. Overheads Management, administration and estates staff Non-staff
£7,365 per year £16,009 per year
Taken from NHS (England) Summarised accounts.3 Management and other non-care staff costs were 19.31 per cent of direct care salary costs and included administration and estates staff. Non-staff costs were 41.97 per cent of direct care salary costs. They include costs to the provider for office, travel/transport and telephone, education and training, supplies and services (clinical and general), as well as utilities such as water, gas and electricity.
C. Capital overheads £2,966 per year Based on the new-build and land requirements of an NHS office and shared facilities.4,5 Capital costs have been annuitised over 60 years at a discount rate of 3.5 per cent. Based on the assumption that each team has one shared office.
Working time 42.1 weeks per year 37.7 hours per week
Unit costs are based on 1,577 hours per year: 225 working days minus sickness absence and training/study days as reported for all NHS staff groups.6
Ratio of direct to indirect time on: patient-related work face-to-face contact
1:0.63 1:1.06
Information taken from National Child and Adolescent Mental Health Service Mapping data.1 Staff activity was reported at the team level by Strategic Health Authority (SHA) averaging as follows: education and training (9%), research and evaluation (5%), admin and management (23%), consultation and liaison (13%) and clinical (49%).
Length of episode 30 per cent of cases lasted for 4 weeks or less, 30 per cent for 13 weeks or less, 19 per cent for 26 weeks or less, 11 per cent for 52 weeks or less and 10 per cent for more than 52 weeks.
Caseload 35 cases per team
Based on 133 teams and 4,596 cases.1
London multiplier 1.19 x A 1.39 x C Allows for higher costs associated with working in London.4,5,7
Non-London multiplier 0.97 x A 0.96 x C Allows for lower costs associated with working outside London.4,5,7
Unit costs available 2012/2013 £41 per hour per team member; £67 per hour of patient-related activity, £84 per hour of face-to-face contact
1 Child and Adolescent Mental Health Service (CAMHS) mapping (2009), Durham University & Department of Health, http://www.childrensmapping.org.uk/
[accessed 17 November 2013]. 2 The CAMHS Mapping data are no longer being collected so information for this table has been uprated this year. 3 Audit Commission (2012) Summarised accounts 2011-2012, NHS, London. 4 Building Cost Information Service (2013) Surveys of tender prices, Royal Institute of Chartered Surveyors, London. 5 Personal communication with the Department for Communities and Local Government, 2011. 6 Contracted hours are taken from NHS Careers (2012) Pay and benefits, National Health Service, London. http://www.nhscareers.nhs.uk/ [accessed 9 October
2013]. Working days and sickness absence rates as reported in Information Centre (2012) Sickness absence rates in the NHS: January-March 2012 and annual summary 2009-10 to 2011-12, Information Centre, Leeds.
7 Department of Health (2013) based on the Market Forces Factor (MFF).

Unit Costs of Health and Social Care 2013 215
12.9 Targeted CAMHS team These teams provide services for children and young people with particular problems or for those requiring particular types of therapeutic interventions. The information for this table is based on National Child and Adolescent Mental Health Service (CAMHS) mapping data and returns from 2,094 teams, of which 335 were dedicated teams.1,2 On average there are 4.2 wte per team (excluding administrative staff and managers). Costs have been uprated to 2012/2013 price levels using the appropriate inflators. Costs and unit estimation
2012/2013 value
Notes
A. Wages/salary plus oncosts
£41,409 per year
Average salary for a team based on National Child and Adolescent Mental Health Service Mapping data.1,2 Teams included nurses (20%), doctors (6%), social workers (15%), clinical psychologists (22%), educational psychologists (1%), child psychotherapists (3%), family therapists (4%) and other therapists and care staff (29%).1 See the preface for information on changes to salaries, and section V for further information on pay scales.
B. Overheads Management, administration and estates staff Non-staff
£7,996 per year £17,379 per year
Taken from NHS (England) Summarised accounts.3 Management and other non-care staff costs were 19.31 per cent of direct care salary costs and included administration and estates staff. Non-staff costs were 41.97 per cent of direct care salary costs. They include costs to the provider for office, travel/transport and telephone, education and training, supplies and services (clinical and general), as well as utilities such as water, gas and electricity.
C. Capital overheads £2,966 per year Based on the new-build and land requirements of an NHS office and shared facilities.4,5 Capital costs have been annuitised over 60 years at a discount rate of 3.5 per cent. Based on the assumption that each team has one shared office.
Working time 42 weeks per year 37.9 hours per week
Unit costs are based on 1,577 hours per year: 225 working days minus sickness absence and training/study days as reported for all NHS staff groups.6
Ratio of direct to indirect time on: patient-related work face-to-face contact
1:0.63 1:1.06
Information taken from National Child and Adolescent Mental Health Service Mapping data. Staff activity was reported at the team level by Strategic Health Authority (SHA) averaging as follows: education and training (9%), research and evaluation (5%), admin and management (23%), consultation and liaison (13%) and clinical (49%).
Duration of episode 22 per cent of cases lasted for 4 weeks or less, 24 per cent for 13 weeks or less, 18 per cent for 26 weeks or less, 16 per cent for 52 weeks or less and 20 per cent for more than 52 weeks.
Caseload 47 cases per team
Based on 335 teams and 15,653 cases.1
London multiplier 1.19 x A 1.39 x C
Allows for higher costs associated with working in London.4,5,7
Non-London multiplier 0.97 x A 0.96 x C
Allows for lower costs associated with working in London.4,5,7
Unit costs available 2012/2013 £44 per hour per team member; £72 cost per hour per team member for patient-related activities; £91 cost per hour per team member for face-to-face contact
1 Child and Adolescent Mental Health Service (CAMHS) mapping (2009), Durham University & Department of Health, http://www.childrensmapping.org.uk/
[accessed 17 November 2013]. 2 The CAMHS Mapping data are no longer being collected so information for this table has been uprated this year. 3 Audit Commission (2012) Summarised accounts 2011-2012, NHS, London. 4 Building Cost Information Service (2013) Surveys of tender prices, Royal Institute of Chartered Surveyors, London. 5 Personal communication with the Department for Communities and Local Government, 2011. 6 Contracted hours are taken from NHS Careers (2012) Pay and benefits, National Health Service, London. http://www.nhscareers.nhs.uk/ [accessed 9
October 2013]. Working days and sickness absence rates as reported in Information Centre (2012) Sickness absence rates in the NHS: January-March 2012 and annual summary 2009-10 to 2011-12, Information Centre, Leeds.
7 Department of Health (2013) based on the Market Forces Factor (MFF).

216 Unit Costs of Health and Social Care 2013
12.10 Transition services for children with complex needs when transferring to adulthood This table has been based on a study carried out by Sloper et al. (2010)1 in which the costs for five transition services were studied in-depth. Three of the five transition services have been selected for inclusion here and represent low, median and high cost services (based on cost per case per year).
12.10.1 Transition services for children: medium cost Relaunched in June 2007, the service was fully staffed for the first time just before the research interviews were undertaken. The team has no case-holding responsibilities or budget but works to co-ordinate transition for young people with very complex needs. The team supports 184 young people. The average costs per working hour (including steering group) is £55 (£58) and the cost per case per year is £905 and £957 respectively. Time use: direct contact (7%), meetings with family (12%), liaison (45%) and report writing or assessments (36%). Staff member Whole-time-equivalent (WTE)
on transition £ per year
Team manager/business support 2.0 wte £81,747 Social worker/social work assistant 1.5 wte £78,952 Other support and supervision <0.1 £5,875 Total for staff £166,574 Steering group Total hours per year Managers: children’s services 56 £2,700 Managers: adult services 42 £1,934 Managers: health 32 £1,935 Managers: education/training 60 £2,922 Total for steering group £9,491 TOTAL COST £176,065
1 Sloper, P., Beecham, J., Clarke, S., Franklin, A., Moran, N. & Cusworth, L. (2010) Models of multi-agency services for transition to adult services for
disabled young people and those with complex health needs: impact and costs, Social Policy Research Unit, University of York & Personal Social Services Research Unit, University of Kent, Canterbury.
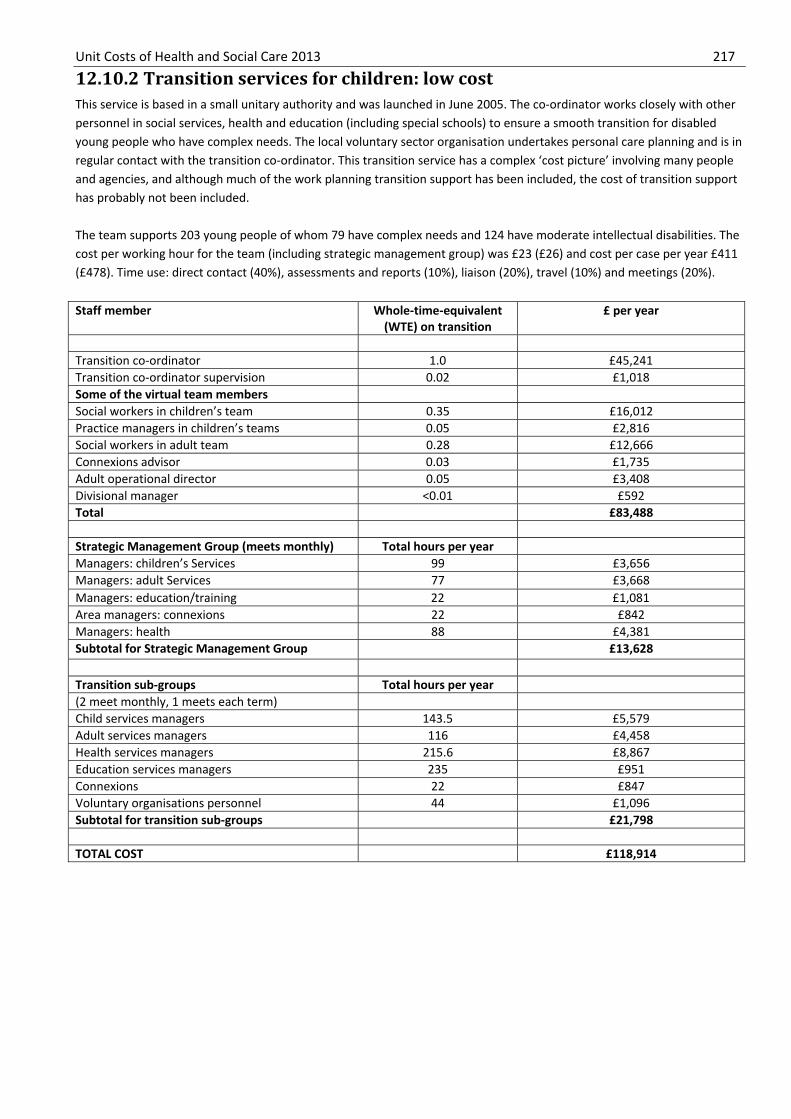
Unit Costs of Health and Social Care 2013 217
12.10.2 Transition services for children: low cost This service is based in a small unitary authority and was launched in June 2005. The co-ordinator works closely with other personnel in social services, health and education (including special schools) to ensure a smooth transition for disabled young people who have complex needs. The local voluntary sector organisation undertakes personal care planning and is in regular contact with the transition co-ordinator. This transition service has a complex ‘cost picture’ involving many people and agencies, and although much of the work planning transition support has been included, the cost of transition support has probably not been included. The team supports 203 young people of whom 79 have complex needs and 124 have moderate intellectual disabilities. The cost per working hour for the team (including strategic management group) was £23 (£26) and cost per case per year £411 (£478). Time use: direct contact (40%), assessments and reports (10%), liaison (20%), travel (10%) and meetings (20%). Staff member Whole-time-equivalent
(WTE) on transition £ per year
Transition co-ordinator 1.0 £45,241 Transition co-ordinator supervision 0.02 £1,018 Some of the virtual team members Social workers in children’s team 0.35 £16,012 Practice managers in children’s teams 0.05 £2,816 Social workers in adult team 0.28 £12,666 Connexions advisor 0.03 £1,735 Adult operational director 0.05 £3,408 Divisional manager <0.01 £592 Total £83,488 Strategic Management Group (meets monthly) Total hours per yearManagers: children’s Services 99 £3,656 Managers: adult Services 77 £3,668 Managers: education/training 22 £1,081 Area managers: connexions 22 £842 Managers: health 88 £4,381 Subtotal for Strategic Management Group £13,628 Transition sub-groups Total hours per year (2 meet monthly, 1 meets each term) Child services managers 143.5 £5,579 Adult services managers 116 £4,458 Health services managers 215.6 £8,867 Education services managers 235 £951 Connexions 22 £847 Voluntary organisations personnel 44 £1,096 Subtotal for transition sub-groups £21,798 TOTAL COST £118,914

218 Unit Costs of Health and Social Care 2013
12.10.3 Transition services for children: high cost This transition team is located in an education department within an integrated disabled children’s service. The team was set up in November 2007 and the research interviews were undertaken in October 2008. There had been problems getting staff in place; many interviewees were involved in statutory duties as well and felt they had only just got to the point where transition work could begin. The team supports 76 young people. The average costs per working hour (including steering group) is £38 (£39) and cost per case per year is £3,715 (£3,785). Time use: face-to-face contact (12%), telephone contact (17%): assessments and writing reports (28%); meetings with people and families (11%); liaison away from meetings (12%); travel (12% and general administration (10%). Staff member Whole-time-equivalent
(WTE) on transition £ per year
Children’s services Manager transition team/administrator 0.50 £22,030 Social workers/key workers 0.75 £33,304 Nurse (cyp)/trainee psychologist 0.70 £33,950 Connexions TPAs 1.00 £39,095 Adult services Manager adult team 0.60 £33,448 Social worker (adult) 0.80 £36,191 Senior practitioner 0.75 £41,812 Nurse (adult) 0.80 £37,344 Supervision (various managers, not included above)
0.08 £5,155
Subtotal for children’s services £282,329 Total hours per year Steering group and sub-groups Managers: children’s services 33 £1,629 Managers: adult services 14 £686 Managers: education/training 12 £540 Services managers: local authority 42 £862 Connexions 22.5 £1,611 Subtotal for steering group £5,328 TOTAL COST £287,657

IV. HOSPITAL-BASED HEALTH CARE STAFF

220 Unit Costs of Health and Social Care 2013

Unit Costs of Health and Social Care 2013 221
13. Hospital-based scientific and professional staff
13.1 Hospital physiotherapist 13.2 Hospital occupational therapist 13.3 Hospital speech and language therapist 13.4 Hospital dietitian 13.5 Hospital radiographer 13.6 Hospital pharmacist 13.7 Allied health professional support worker

222 Unit Costs of Health and Social Care 2013

Unit Costs of Health and Social Care 2013 223
13.1 Hospital physiotherapist Using data from the NHS reference costs,1 the mean average cost for a non-consultant-led (non-admitted) follow-up physiotherapy attendance in 2011/12 was £34, with an interquartile range of £28 to £38. Costs have been uprated using the HCHS pay & prices inflator. Costs and unit estimation
2012/2013 value Notes
A. Wages/salary £23,441 per year Based on the mean full-time equivalent basic salary for Agenda for Change band 5 (for qualified allied health professionals) of the July 2012-June 2013 NHS staff earnings estimates.2 An additional 8.7 per cent can be added to reflect payments for activity such as over-time, shift work and geographic allowances. The Electronic Staff Records (ESR) system shows that the mean basic salary for all physiotherapists is £33,043. See the preface for information on changes to salaries, and section V for further information on pay scales.
B. Salary oncosts £5,483 per year Employer’s national insurance is included plus 14 per cent of salary for employer’s contribution to superannuation.
C. Qualifications £5,549 per year Qualification costs have been calculated using the method described in Netten et al. (1998).3 Current cost information has been provided by the Department of Health and Health Education England (HEE).4
D. Overheads Management, administration and estates staff Non-staff
£5,585 per year £12,139 per year
Taken from NHS (England) Summarised accounts.5 Management and other non-care staff costs were 19.31 per cent of direct care salary costs and included administration and estates staff. Non-staff costs were 41.97 per cent of direct care salary costs. They include costs to the provider for office, travel/transport and telephone, education and training, supplies and services (clinical and general), as well as utilities such as water, gas and electricity.
E. Capital overheads £4,776 per year Based on the new-build and land requirements of NHS facilities, but adjusted to reflect shared use of both treatment and non-treatment space. 6,7 No allowance has been made for the cost of equipment. Capital costs have been annuitised over 60 years at a discount rate of 3.5 per cent.
F. Travel No information available on average mileage covered per visit. From July 2013, NHS reimbursement will be based on a single rate for the first 3500 miles travelled (67p) and a reduced rate thereafter, irrespective of the type of car or fuel used (24p).8
Working time 42.7 weeks per year 37.5 hours per week
Unit costs are based on 1,601 hours per year: 225 working days minus sickness absence and training/study days as reported for all NHS staff groups.9
Ratio of direct to indirect time
No current information available.
Duration of contacts 32.9 minutes 23.3 minutes 13.1 minutes
Surgery consultation Clinic consultation Telephone consultation All based on information taken from the 2006/07 General Practice Workload Survey.10
London multiplier 1.19 x (A to B),1.46 x E
Allows for the higher costs associated with London compared to the national average cost.6,7,11
Non-London multiplier
0.97 x E Allows for the lower costs associated with working outside London compared to the national average cost.6,7,11
Unit costs available 2012/2013 (costs including qualifications given in brackets) £32 (£36) per hour.
1 Department of Health (2013) NHS reference costs 2011-2012, https://www.gov.uk/government/news/financial-year-2011-to-2012-reference-costs-published [accessed 2 October 2013]. 2 Health & Social Care Information Centre (2013) NHS staff earnings estimates 2013 (not publicly available), Health & Social Care Information Centre,
Leeds. 3 Netten, A., Knight, J., Dennett, J., Cooley, R. & Slight, A. (1998) Development of a ready reckoner for staff costs in the NHS, Vols 1 & 2, Personal Social
Services Research Unit, University of Kent, Canterbury. 4 Personal communication with the Department of Health and Health Education England (HEE), 2013. 5 Audit Commission (2012) Summarised accounts 2011-2012, NHS, London. 6 Building Cost Information Service (2013) Surveys of tender prices, Royal Institute of Chartered Surveyors, London. 7 Personal communication with the Department for Communities and Local Government, 2011. 8 NHS Employers (2013) New mileage arrangements for Agenda for Change staff,
http://www.nhsemployers.org/PayAndContracts/LatestNews/Pages/New-pay-circular-for-Agenda-for-Change-Staff.aspx [accessed 1 October 2013]. 9 Contracted hours are taken from NHS Careers (2012) Pay and benefits, National Health Service, London. http://www.nhscareers.nhs.uk/ [accessed 9
October 2013]. Training days as recommended by professional bodies. Working days and sickness absence rates as reported in Information Centre (2012) Sickness absence rates in the NHS: January-March 2012 and annual summary 2009-10 to 2011-12, Information Centre, Leeds.
10Information Centre (2007) 2006/07 UK General Practice Workload Survey, Primary Care Statistics, Information Centre, Leeds. 11Department of Health (2013) based on the Market Forces Factor (MFF).

224 Unit Costs of Health and Social Care 2013
13.2 Hospital occupational therapist Using data from the NHS reference costs,1 the mean average cost for a non-consultant led (non-admitted) follow-up occupational therapy attendance in 2011/12 was £53, with an interquartile range of £30 to £64. Costs have been uprated using the HCHS pay & prices inflator. Costs and unit estimation
2012/2013 value Notes
A. Wages/salary £23,441 per year Based on the mean full-time equivalent basic salary for Agenda for Change band 5 (for qualified Allied Health Professionals) of the July 2012-June 2013 NHS staff earnings estimates. 2 An additional 8.7 per cent can be added to reflect payments for activity such as over-time, shift work and geographic allowances. The Electronic Staff Records (ESR) system shows that the mean basic salary for all occupational therapists is £31,943. See the preface for information on changes to salaries, and section V for further information on pay scales.
B. Salary oncosts £5,483 per year Employer’s national insurance is included plus 14 per cent of salary for employer’s contribution to superannuation.
C. Qualifications £5,531 per year Qualification costs have been calculated using the method described in Netten et al. (1998).3 Current cost information has been provided by the Department of Health and Health Education England (HEE).4
D. Overheads Management, administration and estates staff Non-staff
£5,585 per year £12,139 per year
Taken from NHS (England) Summarised accounts.5 Management and other non-care staff costs were 19.31 per cent of direct care salary costs and included administration and estates staff. Non-staff costs were 41.97 per cent of direct care salary costs. They include costs to the provider for office, travel/transport and telephone, education and training, supplies and services (clinical and general), as well as utilities such as water, gas and electricity.
E. Capital overheads £4,776 per year Based on the new-build and land requirements of NHS facilities, but adjusted to reflect shared use of both treatment and non-treatment space.6,7 No allowance has been made for the cost of equipment. Capital costs have been annuitised over 60 years at a discount rate of 3.5 per cent.
F. Travel No information available on average mileage covered per visit. From July 2013, NHS reimbursement will be based on a single rate for the first 3500 miles travelled (67p) and a reduced rate thereafter, irrespective of the type of car or fuel used (24p).8
Working time 42.7 weeks per year 37.5 hours per week
Unit costs are based on 1,601 hours per year: 225 working days minus sickness absence and training/study days as reported for all NHS staff groups.9
Ratio of direct to indirect time
No current information available.
London multiplier 1.19 x (A to B) 1.35 x E
Allows for the higher costs associated with London compared to the national average cost.6,7,10
Non-London multiplier 0.97 x E Allows for the lower costs associated with working outside London compared to the national average cost.6,7,10
Unit costs available 2012/2013 (costs including qualifications given in brackets) £32 (£36) per hour.
1 Department of Health (2013) NHS reference costs 2011-2012, https://www.gov.uk/government/news/financial-year-2011-to-2012-reference-costs-published/ [accessed 2 October 2013]. 2 Health & Social Care Information Centre (2013) NHS staff earnings estimates 2013 (not publicly available), Health & Social Care Information Centre, Leeds. 3 Netten, A., Knight, J., Dennett, J., Cooley, R. & Slight, A. (1998) Development of a ready reckoner for staff costs in the NHS, Vols 1 & 2, Personal Social Services
Research Unit, University of Kent, Canterbury. 4 Personal communication with the Department of Health and Health Education England (HEE), 2013. 5 Audit Commission (2012) Summarised accounts 2011-2012, NHS, London. 6 Building Cost Information Service (2013) Surveys of tender prices, Royal Institute of Chartered Surveyors, London. 7 Personal communication with the Department for Communities and Local Government, 2011. 8 NHS Employers (2013) New mileage arrangements for Agenda for Change staff, http://www.nhsemployers.org/PayAndContracts/LatestNews/Pages/New-pay-
circular-for-Agenda-for-Change-Staff.aspx [accessed 1 October 2013]. 9Contracted hours are taken from NHS Careers (2012) Pay and benefits, National Health Service, London. http://www.nhscareers.nhs.uk/ [accessed 9 October 2013].
Training days as recommended by professional bodies. Working days and sickness absence rates as reported in Information Centre (2012) Sickness absence rates in the NHS: January-March 2012 and Annual Summary 2009-10 to 2011-12, Information Centre, Leeds.
10Department of Health (2013) based on the Market Forces Factor (MFF).
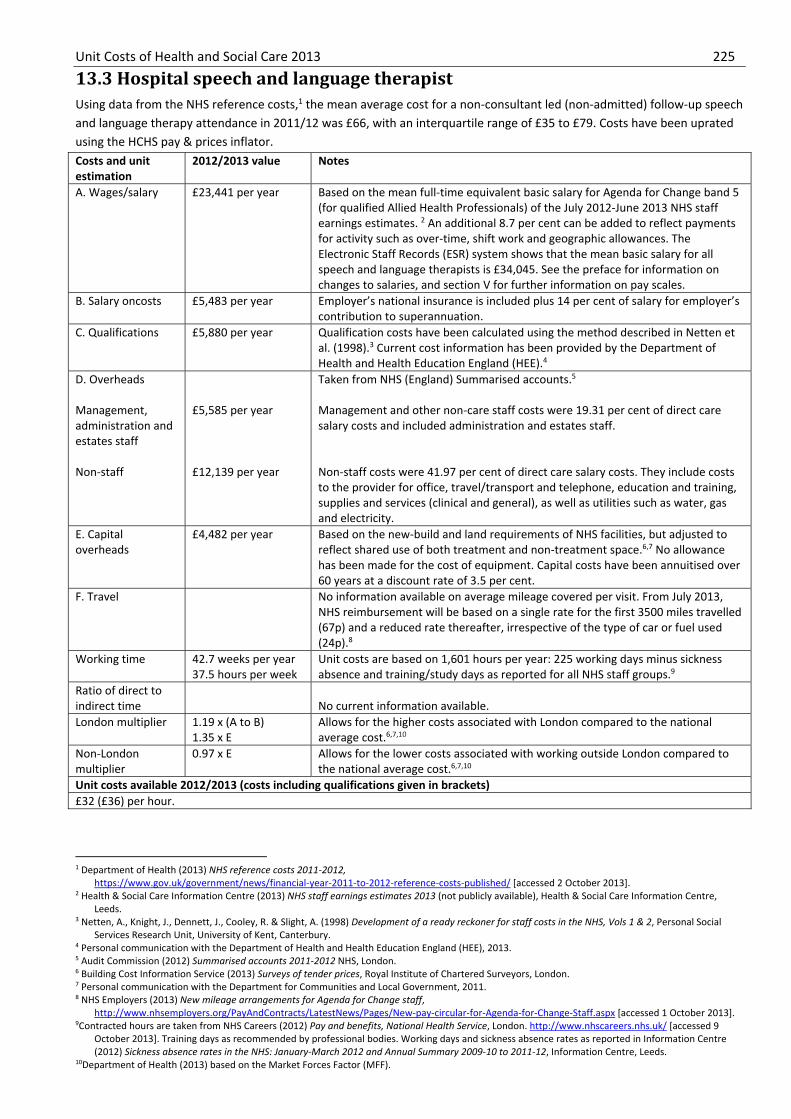
Unit Costs of Health and Social Care 2013 225
13.3 Hospital speech and language therapist Using data from the NHS reference costs,1 the mean average cost for a non-consultant led (non-admitted) follow-up speech and language therapy attendance in 2011/12 was £66, with an interquartile range of £35 to £79. Costs have been uprated using the HCHS pay & prices inflator. Costs and unit estimation
2012/2013 value Notes
A. Wages/salary £23,441 per year Based on the mean full-time equivalent basic salary for Agenda for Change band 5 (for qualified Allied Health Professionals) of the July 2012-June 2013 NHS staff earnings estimates. 2 An additional 8.7 per cent can be added to reflect payments for activity such as over-time, shift work and geographic allowances. The Electronic Staff Records (ESR) system shows that the mean basic salary for all speech and language therapists is £34,045. See the preface for information on changes to salaries, and section V for further information on pay scales.
B. Salary oncosts £5,483 per year Employer’s national insurance is included plus 14 per cent of salary for employer’s contribution to superannuation.
C. Qualifications £5,880 per year Qualification costs have been calculated using the method described in Netten et al. (1998).3 Current cost information has been provided by the Department of Health and Health Education England (HEE).4
D. Overheads Management, administration and estates staff Non-staff
£5,585 per year £12,139 per year
Taken from NHS (England) Summarised accounts.5 Management and other non-care staff costs were 19.31 per cent of direct care salary costs and included administration and estates staff. Non-staff costs were 41.97 per cent of direct care salary costs. They include costs to the provider for office, travel/transport and telephone, education and training, supplies and services (clinical and general), as well as utilities such as water, gas and electricity.
E. Capital overheads
£4,482 per year Based on the new-build and land requirements of NHS facilities, but adjusted to reflect shared use of both treatment and non-treatment space.6,7 No allowance has been made for the cost of equipment. Capital costs have been annuitised over 60 years at a discount rate of 3.5 per cent.
F. Travel No information available on average mileage covered per visit. From July 2013, NHS reimbursement will be based on a single rate for the first 3500 miles travelled (67p) and a reduced rate thereafter, irrespective of the type of car or fuel used (24p).8
Working time 42.7 weeks per year 37.5 hours per week
Unit costs are based on 1,601 hours per year: 225 working days minus sickness absence and training/study days as reported for all NHS staff groups.9
Ratio of direct to indirect time
No current information available.
London multiplier 1.19 x (A to B) 1.35 x E
Allows for the higher costs associated with London compared to the national average cost.6,7,10
Non-London multiplier
0.97 x E Allows for the lower costs associated with working outside London compared to the national average cost.6,7,10
Unit costs available 2012/2013 (costs including qualifications given in brackets) £32 (£36) per hour.
1 Department of Health (2013) NHS reference costs 2011-2012, https://www.gov.uk/government/news/financial-year-2011-to-2012-reference-costs-published/ [accessed 2 October 2013]. 2 Health & Social Care Information Centre (2013) NHS staff earnings estimates 2013 (not publicly available), Health & Social Care Information Centre,
Leeds. 3 Netten, A., Knight, J., Dennett, J., Cooley, R. & Slight, A. (1998) Development of a ready reckoner for staff costs in the NHS, Vols 1 & 2, Personal Social
Services Research Unit, University of Kent, Canterbury. 4 Personal communication with the Department of Health and Health Education England (HEE), 2013. 5 Audit Commission (2012) Summarised accounts 2011-2012 NHS, London. 6 Building Cost Information Service (2013) Surveys of tender prices, Royal Institute of Chartered Surveyors, London. 7 Personal communication with the Department for Communities and Local Government, 2011. 8 NHS Employers (2013) New mileage arrangements for Agenda for Change staff,
http://www.nhsemployers.org/PayAndContracts/LatestNews/Pages/New-pay-circular-for-Agenda-for-Change-Staff.aspx [accessed 1 October 2013]. 9Contracted hours are taken from NHS Careers (2012) Pay and benefits, National Health Service, London. http://www.nhscareers.nhs.uk/ [accessed 9
October 2013]. Training days as recommended by professional bodies. Working days and sickness absence rates as reported in Information Centre (2012) Sickness absence rates in the NHS: January-March 2012 and Annual Summary 2009-10 to 2011-12, Information Centre, Leeds.
10Department of Health (2013) based on the Market Forces Factor (MFF).

226 Unit Costs of Health and Social Care 2013
13.4 Hospital dietitian Costs and unit estimation
2012/2013 value Notes
A. Wages/salary £23,441 per year Based on the mean full-time equivalent basic salary for Agenda for Change band 5 (for qualified Allied Health Professionals) of the July 2012-June 2013 NHS staff earnings estimates.1 An additional 8.7 per cent can be added to reflect payments for activity such as over-time, shift work and geographic allowances. The Electronic Staff Records (ESR) system shows that the mean basic salary for all dietitians is £32,744. See the preface for information on changes to salaries, and section V for further information on pay scales.
B. Salary oncosts £5,483 per year Employer’s national insurance is included plus 14 per cent of salary for employer’s contribution to superannuation.
C. Qualifications £5,738 per year Qualification costs have been calculated using the method described in Netten et al. (1998).2 Current cost information has been provided by the Department of Health and Health Education England (HEE).3
D. Overheads Management, administration and estates staff Non-staff
£5,585 per year £12,139 per year
Taken from NHS (England) Summarised accounts.4 Management and other non-care staff costs were 19.31 per cent of direct care salary costs and included administration and estates staff. Non-staff costs were 41.97 per cent of direct care salary costs. They include costs to the provider for office, travel/transport and telephone, education and training, supplies and services (clinical and general), as well as utilities such as water, gas and electricity.
E. Capital overheads
£3,614 per year Based on the new-build and land requirements of NHS facilities, but adjusted to reflect share use of both treatment and non-treatment space.5,6 Capital costs have been annuitised over 60 years at a discount rate of 3.5 per cent.
F. Travel No information available on average mileage covered per visit. From July 2013, NHS reimbursement will be based on a single rate for the first 3500 miles travelled (67p) and a reduced rate thereafter, irrespective of the type of car or fuel used (24p).7
Working time 42.7 weeks per year 37.5 hours per week
Unit costs are based on 1,601 hours per year: 225 working days minus sickness absence and training/study days as reported for all NHS staff groups.8
Ratio of direct to indirect time
No current information available.
London multiplier 1.19 x (A to B) 1.38 x E
Allows for the higher costs associated with London compared to the national average cost.5,6,9
Non-London multiplier
0.97 x E Allows for the lower costs associated with working outside London compared to the national average cost.5,6,9
Unit costs available 2012/2013 (costs including qualifications given in brackets)£31 (£35) per hour.
1 Health & Social Care Information Centre (2013) NHS staff earnings estimates 2013 (not publicly available), Health & Social Care Information Centre,
Leeds. 2 Netten, A., Knight, J., Dennett, J., Cooley, R. & Slight, A. (1998) Development of a ready reckoner for staff costs in the NHS, Vols 1 & 2, Personal Social
Services Research Unit, University of Kent, Canterbury. 3 Personal communication with the Department of Health and Health Education England (HEE), 2013. 4 Audit Commission (2012) Summarised accounts 2011-2012, NHS, London. 5 Building Cost Information Service (2013) Surveys of tender prices, Royal Institute of Chartered Surveyors, London. 6 Personal communication with the Department for Communities and Local Government, 2011. 7 NHS Employers (2013) New mileage arrangements for Agenda for Change staff,
http://www.nhsemployers.org/PayAndContracts/LatestNews/Pages/New-pay-circular-for-Agenda-for-Change-Staff.aspx [accessed 1 October 2013]. 8 Contracted hours are taken from NHS Careers (2012) Pay and benefits, National Health Service, London. http://www.nhscareers.nhs.uk/ [accessed 9
October 2013]. Training days as recommended by professional bodies. Working days and sickness absence rates as reported in Information Centre (2012) Sickness absence rates in the NHS: January-March 2012 and annual summary 2009-10 to 2011-12, Information Centre, Leeds.
9 Department of Health (2013) based on the Market Forces Factor (MFF).

Unit Costs of Health and Social Care 2013 227
13.5 Hospital radiographer Using data from the NHS reference costs,1 the mean average cost for a radiotherapy inpatient was £339 and for a regular day or night case was £661. An outpatient contact was £107. Costs have been uprated using the HCHS pay & prices inflator. Costs and unit estimation
2012/2013 value Notes
A. Wages/salary £23,441 per year Based on the mean full-time equivalent basic salary for Agenda for Change band 5 (for qualified Allied Health Professionals) of the July 2012-June 2013 NHS staff earnings estimates.2 An additional 8.7 per cent can be added to reflect payments for activity such as over-time, shift work and geographic allowances. The Electronic Staff Records (ESR) system shows that the mean basic salary for all Diagnostic and Therapeutic Radiologists is £32,875. See the preface for information on changes to salaries, and section V for further information on pay scales.
B. Salary oncosts £5,483 per year Employer’s national insurance is included plus 14 per cent of salary for employer’s contribution to superannuation.
C. Qualifications £5,910 per year Qualification costs have been calculated using the method described in Netten et al. (1998).3 Current cost information has been provided by the Department of Health and Health Education England (HEE).4
D. Overheads Management, administration and estates staff Non-staff
£5,585 per year £12,139 per year
Taken from NHS (England) Summarised accounts.5 Management and other non-care staff costs were 19.31 per cent of direct care salary costs and included administration and estates staff. Non-staff costs were 41.97 per cent of direct care salary costs. They include costs to the provider for office, travel/transport and telephone, education and training, supplies and services (clinical and general), as well as utilities such as water, gas and electricity.
E. Capital overheads £7,175 per year Based on the new-build and land requirements of NHS facilities, but adjusted to reflect shared use of both treatment and non-treatment space.6,7 Capital costs have been annuitised over 60 years at a discount rate of 3.5 per cent.
Working time 42.7 weeks per year 37.5 hours per week
Unit costs are based on 1,601 hours per year: 225 working days minus sickness absence and training/study days as reported for all NHS staff groups.8
Ratio of direct to indirect time
No current information available.
London multiplier 1.19 x (A to B) 1.38 x E
Allows for the higher costs associated with London compared to the national average cost.6,7,9
Non-London multiplier
0.97 x E Allows for the lower costs associated with working outside London compared to the national average cost.6,7,9
Unit costs available 2012/2013 (costs including qualifications given in brackets)£34 (£37) per hour.
1 Department of Health (2013) NHS reference costs 2011-2012, https://www.gov.uk/government/publications/reference-costs-guidance-for-2011-12/
[accessed 9 October 2013] 2 Health & Social Care Information Centre (2013) NHS staff earnings estimates 2013 (not publicly available), Health & Social Care Information Centre,
Leeds. 3 Netten, A., Knight, J., Dennett, J., Cooley, R. & Slight, A. (1998) Development of a ready reckoner for staff costs in the NHS, Vols 1 & 2, Personal Social
Services Research Unit, University of Kent, Canterbury. 4 Personal communication with the Department of Health and Health Education England (HEE), 2013. 5 Audit Commission (2012) Summarised accounts 2011-2012, NHS, London. 6 Building Cost Information Service (2013) Surveys of tender prices, Royal Institute of Chartered Surveyors, London. 7 Personal communication with the Department for Communities and Local Government, 2011. 8 Contracted hours are taken from NHS Careers (2012) Pay and benefits, National Health Service, London. http://www.nhscareers.nhs.uk/ [accessed 9
October 2013]. Training days as recommended by professional bodies. Working days and sickness absence rates as reported in Information Centre (2012) Sickness absence rates in the NHS: January-March 2012 and annual summary 2009-10 to 2011-12, Information Centre, Leeds.
9 Department of Health (2013) based on the Market Forces Factor (MFF).

228 Unit Costs of Health and Social Care 2013
13.6 Hospital pharmacist Costs and unit estimation
2012/2013 value Notes
A. Wages/salary £30,712 per year Based on the mean full-time equivalent basic salary for Agenda for Change band 6(for qualified Allied Health Professionals) of the July 2012-June 2013 NHS staff earnings estimates.1 An additional 8.7 per cent can be added to reflect payments for activity such as over-time, shift work and geographic allowances. The Electronic Staff Records (ESR) system shows that the mean basic salary for all pharmacists is £41,000. See preface and section V for further information on pay scales.
B. Salary oncosts £7,505 per year Employer’s national insurance is included plus 14 per cent of salary for employer’s contribution to superannuation.
C. Qualifications £9,747 per year
Qualification costs have been calculated using the method described in Netten et al.(1998).2 Current cost information has been provided by the Department of Health. The cost of the clinical placement for pharmacists has been provided by Dr Lynne Bollington. See Bollington & John (2012)3 for more information. These costs exclude external training courses that supplement work-based learning and may cover specific components of the General Pharmaceutical Council's performance standards and/or examination syllabus. See table 7.4 for more details on training.
D. Overheads Management, administration and estates staff Non-staff
£7,379 per year £16,039 per year
Taken from NHS (England) Summarised accounts.4 Management and other non-care staff costs were 19.31 per cent of direct care salary costs and included administration and estates staff. Non-staff costs were 41.97 per cent of direct care salary costs. They include costs to the provider for office, travel/transport and telephone, education and training, supplies and services (clinical and general), as well as utilities such as water, gas and electricity.
E. Capital overheads £4,251 per year Based on the new-build and land requirements of a pharmacy, plus additional space for shared facilities.5,6 Capital costs have been annuitised over 60 years at a discount rate of 3.5 per cent.
F. Travel No information available on average mileage covered per visit. From July 2013, NHS reimbursement will be based on a single rate for the first 3500 miles travelled (67p) and a reduced rate thereafter, irrespective of the type of car or fuel used (24p).7
Working time 43 weeks per year 37.5 hours per week
Unit costs are based on 1,609 hours per year: 225 working days minus sickness absence and training/study days as reported for all NHS staff groups.8
Ratio of direct to indirect time on: direct clinical patient time patient-related activities
1:1 1:0.43
Ratios are estimated on the basis that 50 per cent of time is spent on direct clinical patient activities, 20 per cent of time on dispensary activities and 30 per cent on non-clinical activity.9
London multiplier 1.19 x (A to B) 1.37 x E
Allows for the higher costs associated with London compared to the national average cost.6,7,10
Non-London multiplier 0.97 x E Allows for the lower costs associated with working outside London compared to the national average cost.6,7,10
Unit costs available 2012/2013 (costs including qualifications given in brackets)£41 (£47) per hour; £82 (£94) per cost of direct clinical patient time (includes travel); £59 (£67) per cost of patient-related activities.
1 Health & Social Care Information Centre (2013) NHS staff earnings estimates 2013 (not publicly available), Health & Social Care Information Centre, Leeds. 2 Netten, A., Knight, J., Dennett, J., Cooley, R. & Slight, A. (1998) Development of a ready reckoner for staff costs in the NHS, Vols 1 & 2, Personal Social Services
Research Unit, University of Kent, Canterbury. 3 Bollington, L. & John, D. (2012) Pharmacy education and training in the hospital service in Wales: Identifying demand and developing capacity. STS Publishing,
Cardiff. 4 Audit Commission (2012) Summarised accounts 2011-2012, NHS, London. 5 Building Cost Information Service (2013) Surveys of tender prices, Royal Institute of Chartered Surveyors, London. 6 Personal communication with the Department for Communities and Local Government, 2011. 7 NHS Employers (2013) New mileage arrangements for Agenda for Change staff, http://www.nhsemployers.org/PayAndContracts/LatestNews/Pages/New-pay-
circular-for-Agenda-for-Change-Staff.aspx [accessed 1 October 2013]. 8 Contracted hours are taken from NHS Careers (2012) Pay and benefits, National Health Service, London. http://www.nhscareers.nhs.uk/ [accessed 9 October
2013]. Training days as recommended by professional bodies. Working days and sickness absence rates as reported in Information Centre (2012) Sickness absence rates in the NHS: January-March 2012 and annual summary 2009-10 to 2011-12, Information Centre, Leeds.
9 Personal communication with the Greater Manchester Workforce Development Corporation, 2003. 10 Department of Health (2013) based on the Market Forces Factor (MFF).

Unit Costs of Health and Social Care 2013 229
13.7 Allied health professional support worker Allied health professional support workers provide vital assistance to health-care professionals in diagnosing, treating and caring for patients. They work in a variety of settings depending on their role, such as in patient’s homes, a GP clinic or in a hospital department.1 Costs and unit estimation
2012/2013 value Notes
A. Wages/salary £16,193 per year Based on the mean full-time equivalent basic salary for Agenda for Change band2 (for unqualified Allied Health Professionals) of the July 2012-June 2013 NHS staff earnings estimates.2 An additional 8.7 per cent can be added to reflect payments for activity such as over-time, shift work and geographic allowances. The Electronic Staff Records (ESR) system shows that the mean basic salary for all health care support workers is £16,300. See the preface for information on changes to salaries, and section V for further information on pay scales.
B. Salary oncosts £3,468 per year Employer’s national insurance is included plus 14 per cent of salary for employer’s contribution to superannuation.
C. Qualifications £0 Training costs are assumed to be zero, although many take NVQ courses.D. Overheads Management, administration and estates staff Non-staff
£3,796 per year £8,251 per year
Taken from NHS (England) Summarised accounts.3 Management and other non-care staff costs were 19.31 per cent of direct care salary costs and included administration and estates staff. Non-staff costs were 41.97 per cent of direct care salary costs. They include costs to the provider for office, travel/transport and telephone, education and training, supplies and services (clinical and general), as well as utilities such as water, gas and electricity.
E. Capital overheads £3,159 per year Based on the new-build and land requirements of NHS facilities, but adjusted to reflect shared use of both treatment and non-treatment space.4,5 Capital costs have been annuitised over 60 years at a discount rate of 3.5 per cent.
F. Travel No information available on average mileage covered per visit. From July 2013, NHS reimbursement will be based on a single rate for the first 3500 miles travelled (67p) and a reduced rate thereafter, irrespective of the type of car or fuel used (24p).6
Working time 43 weeks per year 37.5 hours per week
Unit costs are based on 1,606 hours per year: 225 working days minus sickness absence and training/study days as reported for all NHS staff groups.7
Ratio of direct to indirect time
No current information available.
London multiplier 1.34 x E Allows for the higher costs associated with London compared to the national average cost.4,5,8
Non-London multiplier
0.97 x E Allows for the lower costs associated with working outside London compared to the national average cost.4,5,8
Unit costs available 2012/2013 £22 per hour.
1 NHS Careers (2011) Clinical support staff, National Health Service, London. http://www.nhscareers.nhs.uk/explore-by-career/wider-healthcare-
team/careers-in-the-wider-healthcare-team/clinical-support-staff/ [accessed 9 October 2013]. 2 Health & Social Care Information Centre (2013) NHS staff earnings estimates 2013 (not publicly available), Health & Social Care Information Centre,
Leeds. 3 Audit Commission (2012) Summarised accounts 2011-2012, NHS, London. 4 Building Cost Information Service (2013) Surveys of tender prices, Royal Institute of Chartered Surveyors, London. 5 Personal communication with the Department for Communities and Local Government, 2011. 6 NHS Employers (2013) New mileage arrangements for Agenda for Change staff,
http://www.nhsemployers.org/PayAndContracts/LatestNews/Pages/New-pay-circular-for-Agenda-for-Change-Staff.aspx [accessed 1 October 2013]. 7 Contracted hours are taken from NHS Careers (2012) Pay and benefits, National Health Service, London. http://www.nhscareers.nhs.uk/ [accessed 9
October 2013]. Training days as recommended by professional bodies. Working days and sickness absence rates as reported in Information Centre (2012) Sickness absence rates in the NHS: January-March 2012 and annual summary 2009-10 to 2011-12, Information Centre, Leeds.
8 Department of Health (2013) based on the Market Forces Factor (MFF).

Unit Costs of Health and Social Care 2013 231
14. Hospital-based nurses
14.1 Nurse team manager (includes ward managers, sisters and clinical managers) 14.2 Nurse team leader (includes deputy ward/unit manager, ward team leader, senior
staff nurse 14.3 Nurse, day ward (includes staff nurse, registered nurse, registered practitioner) 14.4 Nurse, 24-hour ward (includes staff nurse, registered nurse, registered
practitioner) 14.5 Clinical support worker


Unit Costs of Health and Social Care 2013 233
14.1 Nurse team manager (includes ward manager, sister and clinical manager) Costs and unit estimation
2012/2013 value Notes
A. Wages/salary £38,057 per year Based on the mean full-time equivalent basic salary for Agenda for Change band 7 of the July 2012-June 2013 NHS staff earnings estimates for qualified nurses.1 An additional 14.7 per cent can be added to reflect payments for activity such as over-time, shift work and geographic allowances.2 See the preface for information on changes to salaries, and section V for further information on pay scales.
B. Salary oncosts £9,546 per year Employer’s national insurance is included plus 14 per cent of salary for employer’s contribution to superannuation.
C. Qualifications £10,438 per year Qualification costs have been calculated using the method described in Netten et al. (1998).3 Current cost information has been provided by the Department of Health and the Higher Education Funding Council for England (HEFCE).4 See table 7.4 for more details.
D. Overheads Management, administration and estates staff Non-staff
£9,192 per year £19,979 per year
Taken from NHS (England) Summarised accounts.5 Management and other non-care staff costs were 19.31 per cent of direct care salary costs and included administration and estates staff. Non-staff costs were 41.97 per cent of direct care salary costs. They include costs to the provider for office, travel/transport and telephone, education and training, supplies and services (clinical and general), as well as utilities such as water, gas and electricity.
E. Capital overheads £2,416 per year Based on the new-build and land requirements of NHS facilities, but adjusted to reflect shared use of office space for administration, and recreational and changing facilities.6,7 Treatment space has not been included. Capital costs have been annuitised over 60 years at a discount rate of 3.5 per cent.
Working time 42 weeks per year 37.5 hours per week
Unit costs are based on 1569 hours per year: 225 working days minus sickness absence and training/study days as reported for all NHS staff groups.8
Ratio of direct to indirect time on: face-to-face contacts
1:1.44
Based on the McKinsey report commissioned by the Department of Health in 2009,9 hospital nurses are estimated to spent 41 per cent of their time on patient care with 59 per cent of their time spent on non-patient activities such as paperwork and administration, handing over and co-ordination, discussion with other nurses, and preparing medication (away from patients).
London multiplier 1.19 x (A to B) 1.37 x E
Allows for the higher costs associated with working in London.6,7,10
Non-London multiplier
0.96 x E Allows for the lower costs associated with working outside London.6,7
Unit costs available 2012/2013 (costs including qualifications given in brackets)£50 (£57) per hour; £123 (£139) per hour of patient contact.
1 Health & Social Care Information Centre (2013) NHS staff earnings estimates 2013 (not publicly available), Health & Social Care Information Centre,
Leeds. 2 Health & Social Care Information Centre (2013) NHS staff earnings estimates 2013, Health & Social Care Information Centre, Leeds. 3 Netten, A., Knight, J., Dennett, J., Cooley, R. & Slight, A. (1998) Development of a ready reckoner for staff costs in the NHS, Vols 1 & 2, Personal Social
Services Research Unit, University of Kent, Canterbury. 4 Personal communication with the Department of Health and the Higher Education Funding Council for England (HEFCE), 2011. 5 Audit Commission (2012) Summarised accounts 2011-2012, NHS, London. 6 Building Cost Information Service (2013) Surveys of tender prices, Royal Institute of Chartered Surveyors, London. 7 Personal communication with the Department for Communities and Local Government, 2011. 8 Contracted hours are taken from NHS Careers (2012) Pay and benefits, National Health Service, London. http://www.nhscareers.nhs.uk/ [accessed 9
October 2013]. Training days as recommended by professional bodies. Working days and sickness absence rates as reported in Information Centre (2012) Sickness absence rates in the NHS: January-March 2012 and annual summary 2009-10 to 2011-12, Information Centre, Leeds.
9 Department of Health (2010) Achieving world class productivity in the NHS, 2009/10-2013/14: the McKinsey report, Department of Health, London. www.nhshistory.net/mckinsey%20report.pdf [accessed 9 October 2013].
10Department of Health (2013) based on the Market Forces Factor (MFF).

234 Unit Costs of Health and Social Care 2013
14.2 Nurse team leader (includes deputy ward/unit manager, ward team leader, senior staff nurse) Costs and unit estimation
2012/2013 value Notes
A. Wages/salary £31,752 per year Based on the mean full-time equivalent basic salary for Agenda for Change band 6 of the July 2012-June 2013 NHS staff earnings estimates for qualified nurses.1 An additional 14.7 per cent can be added to reflect payments for activity such as over-time, shift work and geographic allowances.2 See the preface for information on changes to salaries, and section V for further information on pay scales.
B. Salary oncosts £7,794 per year Employer’s national insurance is included plus 14 per cent of salary for employer’s contribution to superannuation.
C. Qualifications £10,438 per year Qualification costs have been calculated using the method described in Netten et al. (1998).3 Current cost information has been provided by the Department of Health and the Higher Education Funding Council for England (HEFCE).4 See table 7.4 for more details.
D. Overheads Management, administration and estates staff Non-staff
£7,636 per year £16,597 per year
Taken from NHS (England) Summarised accounts.5 Management and other non-care staff costs were 19.31 per cent of direct care salary costs and included administration and estates staff. Non-staff costs were 41.97 per cent of direct care salary costs. They include costs to the provider for office, travel/transport and telephone, education and training, supplies and services (clinical and general), as well as utilities such as water, gas and electricity.
E. Capital overheads £2,416 per year Based on the new-build and land requirements of NHS facilities, but adjusted to reflect shared use of office space for administration, and recreational and changing facilities.6,7 Treatment space has not been included. Capital costs have been annuitised over 60 years at a discount rate of 3.5 per cent.
Working time 42 weeks per year 37.5 hours per week
Unit costs are based on 1,569 hours per year: 225 working days minus sickness absence and training/study days as reported for all NHS staff groups.8
Ratio of direct to indirect time on: face-to-face contacts
1:1.44
Based on the McKinsey report commissioned by the Department of Health in 2009,9 hospital nurses are estimated to spent 41 per cent of their time on patient care with 59 per cent of their time spent on non-patient activities such as paperwork and administration, handing over and co-ordination, discussion with other nurses, and preparing medication (away from patients).
London multiplier 1.19 x (A to B) 1.37 x E
Allows for the higher costs associated with working in London.6,7,10
Non-London multiplier
0.96 x E Allows for the lower costs associated with working outside London.6,7
Unit costs available 2012/2013 (costs including qualifications given in brackets)£42 (£49) per hour; £103 (£119) per hour of patient contact.
1 Health & Social Care Information Centre (2013) NHS staff earnings estimates 2013 (not publicly available), Health & Social Care Information Centre,
Leeds. 2 Health & Social Care Information Centre (2013) NHS staff earnings estimates 2013, Health & Social Care Information Centre, Leeds. 3 Netten, A., Knight, J., Dennett, J., Cooley, R. & Slight, A. (1998) Development of a ready reckoner for staff costs in the NHS, Vols 1 & 2, Personal Social
Services Research Unit, University of Kent, Canterbury. 4 Personal communication with the Department of Health and the Higher Education Funding Council for England (HEFCE), 2011. 5 Audit Commission (20112) Summarised accounts 2011-2012, NHS, London. 6 Building Cost Information Service (2013) Surveys of tender prices, Royal Institute of Chartered Surveyors, London. 7 Personal communication with the Department for Communities and Local Government, 2011. 8 Contracted hours are taken from NHS Careers (2012) Pay and benefits, National Health Service, London. http://www.nhscareers.nhs.uk/ [accessed 9
October 2013]. Training days as recommended by professional bodies. Working days and sickness absence rates as reported in Information Centre (2012) Sickness absence rates in the NHS: January-March 2012 and annual summary 2009-10 to 2011-12, Information Centre, Leeds.
9 Department of Health (2010) Achieving world class productivity in the NHS, 2009/10-2013/14: the McKinsey report, Department of Health, London. www.nhshistory.net/mckinsey%20report.pdf [accessed 9 October 2013].
10Department of Health (2013) based on the Market Forces Factor (MFF).

Unit Costs of Health and Social Care 2013 235
14.3 Nurse, day ward (includes staff nurse, registered nurse, registered practitioner) Costs and unit estimation
2012/2013 value Notes
A. Wages/salary £25,744 per year Based on the mean full-time equivalent basic salary for Agenda for Change band5 of the July 2012-June 2013 NHS staff earnings estimates for qualified nurses. 1 An additional 14.7 per cent can be added to reflect payments for activity such as over-time, shift work and geographic allowances. 2 The Electronic Staff Records (ESR) system shows that the mean basic salary for a staff nurse is £29,459. See the preface for information on changes to salaries, and section V for further information on pay scales.
B. Salary oncosts £6,123 per year Employer’s national insurance is included plus 14 per cent of salary for employer’s contribution to superannuation.
C. Qualifications £10,438 per year Qualification costs have been calculated using the method described in Netten et al. (1998).3 Current cost information has been provided by the Department of Health and the Higher Education Funding Council for England (HEFCE).4 See table 7.4 for more details.
D. Overheads Management, administration and estates staff Non-staff
£6,153 per year £13,374 per year
Taken from NHS (England) Summarised accounts.5 Management and other non-care staff costs were 19.31 per cent of direct care salary costs and included administration and estates staff. Non-staff costs were 41.97 per cent of direct care salary costs. They include costs to the provider for office, travel/transport and telephone, education and training, supplies and services (clinical and general), as well as utilities such as water, gas and electricity.
E. Capital overheads £2,415 per year Based on the new-build and land requirements of NHS facilities, but adjusted to reflect shared use of office space for administration, and recreational and changing facilities.6,7 Treatment space has not been included. Capital costs have been annuitised over 60 years at a discount rate of 3.5 per cent.
Working time 42 weeks per year 37.5 hours per week
Unit costs are based on 1,569 hours per year: 225 working days minus sickness absence and training/study days as reported for all NHS staff groups.8
Ratio of direct to indirect time on: face-to-face contacts
1:1.44
Based on the McKinsey report commissioned by the Department of Health in 2009,9 hospital nurses are estimated to spent 41 per cent of their time on patient care with 59 per cent of their time spent on non-patient activities such as paperwork and administration, handing over and co-ordination, discussion with other nurses, and preparing medication (away from patients).
London multiplier 1.19 x (A to B) 1.34 x E
Allows for the higher costs associated with working in London.6,7,10
Non-London multiplier
0.96 x E Allows for the lower costs associated with working outside London.6,7
Unit costs available 2012/2013 (costs including qualifications given in brackets)£34 (£41) per hour; £84 (£100) per hour of patient contact.
1 Health & Social Care Information Centre (2013) NHS staff earnings estimates 2013 (not publicly available), Health & Social Care Information Centre,
Leeds. 2 Health & Social Care Information Centre (2013) NHS staff earnings estimates 2013, Health & Social Care Information Centre, Leeds. 3 Netten, A., Knight, J., Dennett, J., Cooley, R. & Slight, A. (1998) Development of a ready reckoner for staff costs in the NHS , Vols 1 & 2, Personal Social
Services Research Unit, University of Kent, Canterbury. 4 Personal communication with the Department of Health and the Higher Education Funding Council for England (HEFCE), 2011. 5 Audit Commission (2012) Summarised accounts 2011-2012, NHS, London. 6 Building Cost Information Service (2013) Surveys of tender prices, Royal Institute of Chartered Surveyors, London. 7 Personal communication with the Department for Communities and Local Government, 2011. 8 Contracted hours are taken from NHS Careers (2012) Pay and benefits, National Health Service, London. http://www.nhscareers.nhs.uk/ [accessed 9
October 2013]. Training days as recommended by professional bodies. Working days and sickness absence rates as reported in Information Centre (2012) Sickness absence rates in the NHS: January-March 2012 and annual summary 2009-10 to 2011-12, Information Centre, Leeds.
9 Department of Health (2010) Achieving world class productivity in the NHS, 2009/10-2013/14: the McKinsey report, Department of Health, London. www.nhshistory.net/mckinsey%20report.pdf [accessed 9 October 2013].
10Department of Health (2013) based on the Market Forces Factor (MFF).
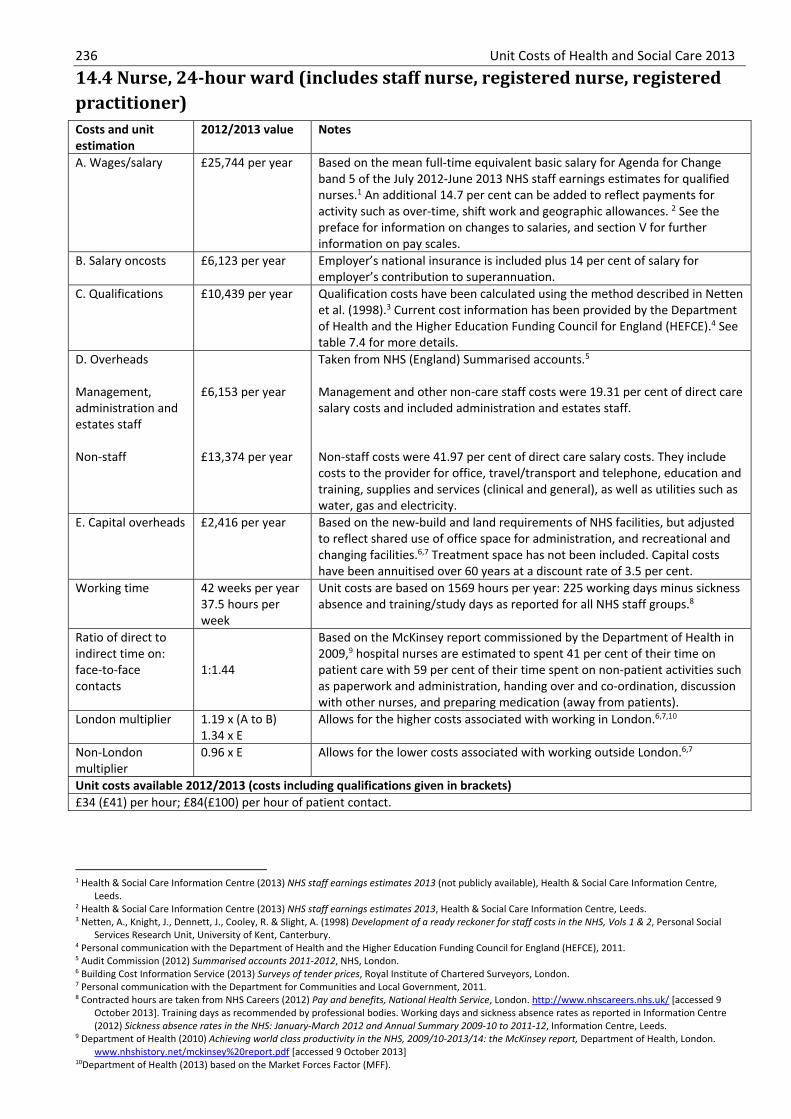
236 Unit Costs of Health and Social Care 2013
14.4 Nurse, 24-hour ward (includes staff nurse, registered nurse, registered practitioner) Costs and unit estimation
2012/2013 value Notes
A. Wages/salary £25,744 per year Based on the mean full-time equivalent basic salary for Agenda for Change band 5 of the July 2012-June 2013 NHS staff earnings estimates for qualified nurses.1 An additional 14.7 per cent can be added to reflect payments for activity such as over-time, shift work and geographic allowances. 2 See the preface for information on changes to salaries, and section V for further information on pay scales.
B. Salary oncosts £6,123 per year Employer’s national insurance is included plus 14 per cent of salary for employer’s contribution to superannuation.
C. Qualifications £10,439 per year Qualification costs have been calculated using the method described in Netten et al. (1998).3 Current cost information has been provided by the Department of Health and the Higher Education Funding Council for England (HEFCE).4 See table 7.4 for more details.
D. Overheads Management, administration and estates staff Non-staff
£6,153 per year £13,374 per year
Taken from NHS (England) Summarised accounts.5 Management and other non-care staff costs were 19.31 per cent of direct care salary costs and included administration and estates staff. Non-staff costs were 41.97 per cent of direct care salary costs. They include costs to the provider for office, travel/transport and telephone, education and training, supplies and services (clinical and general), as well as utilities such as water, gas and electricity.
E. Capital overheads £2,416 per year Based on the new-build and land requirements of NHS facilities, but adjusted to reflect shared use of office space for administration, and recreational and changing facilities.6,7 Treatment space has not been included. Capital costs have been annuitised over 60 years at a discount rate of 3.5 per cent.
Working time 42 weeks per year 37.5 hours per week
Unit costs are based on 1569 hours per year: 225 working days minus sickness absence and training/study days as reported for all NHS staff groups.8
Ratio of direct to indirect time on: face-to-face contacts
1:1.44
Based on the McKinsey report commissioned by the Department of Health in 2009,9 hospital nurses are estimated to spent 41 per cent of their time on patient care with 59 per cent of their time spent on non-patient activities such as paperwork and administration, handing over and co-ordination, discussion with other nurses, and preparing medication (away from patients).
London multiplier 1.19 x (A to B) 1.34 x E
Allows for the higher costs associated with working in London.6,7,10
Non-London multiplier
0.96 x E Allows for the lower costs associated with working outside London.6,7
Unit costs available 2012/2013 (costs including qualifications given in brackets)£34 (£41) per hour; £84(£100) per hour of patient contact.
1 Health & Social Care Information Centre (2013) NHS staff earnings estimates 2013 (not publicly available), Health & Social Care Information Centre,
Leeds. 2 Health & Social Care Information Centre (2013) NHS staff earnings estimates 2013, Health & Social Care Information Centre, Leeds. 3 Netten, A., Knight, J., Dennett, J., Cooley, R. & Slight, A. (1998) Development of a ready reckoner for staff costs in the NHS, Vols 1 & 2, Personal Social
Services Research Unit, University of Kent, Canterbury. 4 Personal communication with the Department of Health and the Higher Education Funding Council for England (HEFCE), 2011. 5 Audit Commission (2012) Summarised accounts 2011-2012, NHS, London. 6 Building Cost Information Service (2013) Surveys of tender prices, Royal Institute of Chartered Surveyors, London. 7 Personal communication with the Department for Communities and Local Government, 2011. 8 Contracted hours are taken from NHS Careers (2012) Pay and benefits, National Health Service, London. http://www.nhscareers.nhs.uk/ [accessed 9
October 2013]. Training days as recommended by professional bodies. Working days and sickness absence rates as reported in Information Centre (2012) Sickness absence rates in the NHS: January-March 2012 and Annual Summary 2009-10 to 2011-12, Information Centre, Leeds.
9 Department of Health (2010) Achieving world class productivity in the NHS, 2009/10-2013/14: the McKinsey report, Department of Health, London. www.nhshistory.net/mckinsey%20report.pdf [accessed 9 October 2013] 10Department of Health (2013) based on the Market Forces Factor (MFF).

Unit Costs of Health and Social Care 2013 237
14.5 Clinical support worker (hospital) Costs and unit estimation
2012/2013 value Notes
A. Wages/salary £16,193 per year Based on the mean full-time equivalent basic salary for Agenda for Change band 2 of the July 2012-June 2013 NHS staff earnings estimates. 1 An additional 14.7 per cent can be added to reflect payments for activity such as over-time, shift work and geographic allowances. 2 See the preface for information on changes to salaries, and section V for further information on pay scales.
B. Salary oncosts £3,468 per year Employer’s national insurance is included plus 14 per cent of salary for employer’s contribution to superannuation.
C. Qualifications No professional qualifications assumed.D. Overheads Management, administration and estates staff Non-staff
£3,796 per year £8,251 per year
Taken from NHS (England) Summarised accounts.3 Management and other non-care staff costs were 19.31 per cent of direct care salary costs and included administration and estates staff. Non-staff costs were 41.97 per cent of direct care salary costs. They include costs to the provider for office, travel/transport and telephone, education and training, supplies and services (clinical and general), as well as utilities such as water, gas and electricity.
E. Capital overheads £1,543 per year Based on the new-build and land requirements of NHS facilities, but adjusted to reflect shared use of office space for administration, and recreational and changing facilities.4,5 Treatment space has not been included. It is assumed that clinical support workers use one-sixth of an office. Capital costs have been annuitised over 60 years at a discount rate of 3.5 per cent.
Working time 42 weeks per year 37.5 hours per week
Unit costs are based on 1,588 hours per year: 225 working days minus sickness absence and training/study days as reported for all NHS staff groups.6
Ratio of direct to indirect time
No current information available. See previous editions of this volume for sources of information.
London multiplier 1.19 x (A to B) 1.35 x E
Allows for the higher costs associated with working in London.4,5,7
Non-London multiplier 0.96 x E Allows for the lower costs associated with working outside London.4,5
Unit costs available 2012/2013 £21 per hour.
1 Health & Social Care Information Centre (2013 NHS staff earnings estimates 2013 (not publicly available), Health & Social Care Information Centre, Leeds. 2 Health & Social Care Information Centre (2013) NHS staff earnings estimates 2013, Health & Social Care Information Centre, Leeds. 3 Audit Commission (2012) Summarised accounts 2011-2012, NHS, London. 4 Building Cost Information Service (2013) Surveys of tender prices, Royal Institute of Chartered Surveyors, London. 5 Personal communication with the Department for Communities and Local Government, 2011. 6 Contracted hours are taken from NHS Careers (2012) Pay and benefits, National Health Service, London. http://www.nhscareers.nhs.uk/ [accessed 9
October 2013] Training days as recommended by professional bodies. Working days and sickness absence rates as reported in Information Centre (2012) Sickness absence rates in the NHS: January-March 2012 and Annual Summary 2009-10 to 2011-12, Information Centre, Leeds.
7 Department of Health (2013) based on the Market Forces Factor (MFF).


15. Hospital-based doctors
15.1 Foundation house officer 1 15.2 Foundation house officer 2 15.3 Registrar group 15.4 Associate specialist 15.5 Consultant: medical 15.6 Consultant: surgical 15.7 Consultant: psychiatric


Unit Costs of Health and Social Care 2013 241
15.1 Foundation house officer 1 The Foundation Programme is a two-year, general post-graduate medical training programme which is compulsory for all newly-qualified medical practitioners in the UK. The Foundation Programme forms the bridge between medical school and specialist/general practice training.1
Costs and unit estimation
2012/2013 value
Notes
A. Wages/salary £22,883 per year The mean basic salary for foundation officers (year 1) and house officers, taken from the July 2012-June 2013 Electronic Staff Record (ESR).2 An additional 35.4 per cent can be added to reflect payments for activity such as over-time, shift work and geographic allowances.3 See the preface for information on changes to salaries, and section V for further information on pay scales.
B. Salary oncosts £5,314 per year Employer’s national insurance is included plus 14 per cent of salary for employer’s contribution to superannuation.
C. Qualifications £19,800 per year Qualification costs have been calculated using the method described in Netten et al. (1998).4 Current cost information has been provided by the Department of Health and Health Education England (HEE).5 See table 7.4 for more details. For hospital doctors, post-graduate study consists of a two-year Foundation Programme.6 During the first year, trainees hold only provisional registration with the General Medical Council, full registration being granted on successful completion of the first year.
D. Overheads Management, administration and estates staff Non-staff
£5,435 per year £11,813 per year
Taken from NHS (England) Summarised accounts.7 Management and other non-care staff costs were 19.31 per cent of direct care salary costs and included administration and estates staff. Non-staff costs were 41.97 per cent of direct care salary costs. They include costs to the provider for office, travel/transport and telephone, education and training, supplies and services (clinical and general), as well as utilities such as water, gas and electricity.
E. Ongoing training £2,516 per year This cost comprises an amount for the generic curriculum, the post-graduate centres’ infrastructure and study leave. Included also are the costs of the course organisers, administrative support, trainers’ workshops, vocational training and internal courses for GP tutors. Excluded are the costs of running the library and post-graduate centres.8
F. Capital overheads
£3,387 per year Based on the new-build and land requirements of NHS facilities.9,10 Adjustments have been made to reflect shared use of administration and recreational facilities, including accommodation for night-time duties. Treatment space has not been included. Capital costs have been annuitised over 60 years at a discount rate of 3.5 per cent.
Working time 44.6 weeks per year 48 hours per week
Unit costs are based on 2,140 hours per year: 225 working days minus sickness absence and training/study days as reported for all NHS staff groups.11 Under the European Working Time Directive (EWTD), the majority of foundation officers (Year 1) are now working up to 48 hours per week, 19.7 per cent are working up to 56 hours and 11.3 per cent are working 40 hours.12
Ratio of direct to indirect time on: patient-related activity
No current information available on patient-related activity. See previous editions of this publication for sources of information. Please complete our new time-use survey: https://www.surveymonkey.com/s/SZMF5YL.
London multiplier 1.19 x (A to B) 1.38 x E
Allows for the higher costs associated with London.9,10,13
Non-London multiplier
0.97 x (A to B) 0.97 x E
Allows for the lower costs associated with working outside London.9,10,13
Unit costs available 2012/2013 (costs including qualifications given in brackets) £25 (£34) per hour (48 hour week); £22 (£29) per hour (56 hour week); £30 (£41) per hour (40 hour week). (Includes A to F).
1 National Health Service (2011) The foundation programme, http://www.foundationprogramme.nhs.uk/pages/home/ [accessed 9 October 2013]. 2 Health & Social Care Information Centre (2013) NHS staff earnings estimates 2013 (not publicly available), Health & Social Care Information Centre, Leeds. 3 Health & Social Care Information Centre (2013) NHS staff earnings estimates 2013, Health & Social Care Information Centre, Leeds. 4 Netten, A., Knight, J., Dennett, J., Cooley, R. & Slight, A. (1998) Development of a ready reckoner for staff costs in the NHS, Vols 1 & 2, Personal Social Services
Research Unit, University of Kent, Canterbury. 5 Personal communication with the Department of Health and Health Education England (HEE), 2013. 6 National Health Service (2008) Modernising medical careers, National Health Service, London. 7 Audit Commission (2012) Summarised accounts 2011-2012, NHS, London. 8 Personal communication with the London Deanery, 2006. 9 Building Cost Information Service (2013) Surveys of tender prices, Royal Institute of Chartered Surveyors, London. 10 Based on Personal communication with the Department for Communities and Local Government, 2011. 11Contracted hours are taken from NHS Careers (2012) Pay and benefits, National Health Service, London. http://www.nhscareers.nhs.uk/ [accessed 9 October
2013]. Working days and sickness absence rates as reported in Information Centre (2012) Sickness absence rates in the NHS: January-March 2012 and annual summary 2009-10 to 2011-12, Information Centre, Leeds.
12Provided by the Department of Health, 2009. 13Department of Health (2013) based on the Market Forces Factor (MFF).

242 Unit Costs of Health and Social Care 2013
15.2 Foundation house officer 2 The Foundation Programme is a two-year, general post-graduate medical training programme which is compulsory for all newly-qualified medical practitioners in the UK. The Foundation Programme forms the bridge between medical school and specialist/general practice training.1 Costs and unit estimation
2012/2013 value Notes
A. Wages/salary £28,018 per year The mean basic salary for foundation officers (year 2), taken from the July 2012-June 2013 Electronic Staff Record (ESR).2 An additional 35.4 per cent can be added to reflect payments for activity such as over-time, shift work and geographic allowances.3 See the preface for information on changes to salaries, and section V for further information on pay scales.
B. Salary oncosts £6,756 per year Employer’s national insurance is included plus 14 per cent of salary for employer’s contribution to superannuation.
C. Qualifications £23,790 per year Qualification costs have been calculated using the method described in Netten et al. (1998).4 Current cost information has been provided by the Department of Health and Health Education England (HEE).5 See table 7.4 for more details. For hospital doctors, post-graduate study consists of a two-year Foundation Programme.6 During the first year, trainees hold only provisional registration with the General Medical Council, full registration being granted on successful completion of the first year.
D. Overheads Management, administration and estates staff Non-staff
£6,714 per year £14,594 per year
Taken from NHS (England) Summarised accounts.7 Management and other non-care staff costs were 19.31 per cent of direct care salary costs and included administration and estates staff. Non-staff costs were 41.97 per cent of direct care salary costs. They include costs to the provider for office, travel/transport and telephone, education and training, supplies and services (clinical and general), as well as utilities such as water, gas and electricity.
E. Ongoing training £2,516 per year This cost comprises an amount for the generic curriculum, the post-graduate centres’ infrastructure and study leave. Included also are the costs of the course organisers, administrative support, trainers’ workshops, vocational training and internal courses for GP tutors. Excluded are the costs of running the library and post-graduate centres.8
F. Capital overheads £3,387 per year Based on the new-build and land requirements of NHS facilities.9,10 Working time 44.6 weeks per
year 48 hours per week
Unit costs are based on 2,140 hours per year: 225 working days minus sickness absence and training/study days as reported for all NHS staff groups.11 Under the European Working Time Directive (EWTD), the majority of foundation officers (Year 2) are now working up to 48 hours per week. 22.3 per cent are working up to 56 hours and 13 per cent are working 40 hours.12
Ratio of direct to indirect time on: patient-related activity
No current information available on patient-related activity. See previous editions of this publication for sources of information. Please complete our new time-use survey: https://www.surveymonkey.com/s/SZMF5YL.
London multiplier 1.19 x (A to B) 1.38 x E
Allows for the higher costs associated with London.9,10,13
Non-London multiplier 0.97 x (A to B) 0.97 x E
Allows for the lower costs associated with working outside London.9,10,13
Unit costs available 2012/2013 (costs including qualifications given in brackets) £29 (£40) per hour (48 hour week). £25 (£35) per hour (56 hour week). £35 (£48) per hour (40 hour week). (Includes A to F).
1 National Health Service (2011) The foundation programme, www.foundationprogramme.nhs.uk/pages/home/ [accessed 9 October 2013]. 2 Health & Social Care Information Centre (2013) NHS staff earnings estimates 2013 (not publicly available), Health & Social Care Information Centre,
Leeds. 3 Health & Social Care Information Centre (2013) NHS staff earnings estimates 2013, Health & Social Care Information Centre, Leeds. 4 Netten, A., Knight, J., Dennett, J., Cooley, R. & Slight, A. (1998) Development of a ready reckoner for staff costs in the NHS, Vols 1 & 2, Personal Social
Services Research Unit, University of Kent, Canterbury. 5 Personal communication with the Department of Health and Health Education England (HEE), 2013. 6 National Health Service (2008) Modernising medical careers, National Health Service, London. 7 Audit Commission (2012) Summarised accounts 2011-2012, NHS, London. 8 Personal communication with the London Deanery, 2006. 9 Building Cost Information Service (2013) Surveys of tender prices, Royal Institute of Chartered Surveyors, London. 10Personal communication with the Department for Communities and Local Government, 2011. 11Contracted hours are taken from NHS Careers (2012) Pay and benefits, National Health Service, London. http://www.nhscareers.nhs.uk/ [accessed 9
October 2013]. Working days and sickness absence rates as reported in Information Centre (2012) Sickness absence rates in the NHS: January-March 2012 and annual summary 2009-10 to 2011-12, Information Centre, Leeds.
12Provided by the Department of Health, 2009. 13Department of Health (2013) based on the Market Forces Factor (MFF).

Unit Costs of Health and Social Care 2013 243
15.3 Registrar group In terms of staff numbers, registrars comprise the largest group of doctors (registrars, senior registrars, specialist registrars (SpRs) and specialty registrars (STR). Costs and unit estimation
2012/2013 value
Notes
A. Wages/salary £37,248 per year
The mean basic salary for registrars, taken from the July 2012-June 2013 Electronic Staff Record (ESR).1 An additional 35.4 per cent can be added to reflect payments for activity such as over-time, shift work and geographic allowances.2 See the preface for information on changes to salaries, and section V for further information on pay scales.
B. Salary oncosts £9,321 per year Employer’s national insurance is included plus 14 per cent of salary for employer’s contribution to superannuation.
C. Qualifications £39,295 per year
Qualification costs have been calculated using the method described in Netten et al. (1998).3 Current cost information has been provided by the Department of Health and Health Education England (HEE).4 See table 7.4 for more details. Specialty registrar training involves three years’ full-time post-graduate training with at least two of the years in a specialty training programme.5,6
D. Overheads Management, administration and estates staff Non-staff
£8,992 per year £19,545 per year
Taken from NHS (England) Summarised accounts.7 Management and other non-care staff costs were 19.31 per cent of direct care salary costs and included administration and estates staff. Non-staff costs were 41.97 per cent of direct care salary costs. They include costs to the provider for office, travel/transport and telephone, education and training, supplies and services (clinical and general), as well as utilities such as water, gas and electricity.
E. Ongoing training £2,516 per year This cost comprises an amount for the generic curriculum, the post-graduate centres’ infrastructure and study leave. Included also are the costs of the course organisers, administrative support, trainers’ workshops, vocational training and internal courses for GP tutors. Excluded are the costs of running the library and post-graduate centres.8
F. Capital overheads £3,387 per year Based on the new-build and land requirements of NHS facilities.9,10 Adjustments have been made to reflect shared use of administration and recreational facilities, including accommodation for night-time duties. Treatment space has not been included. Capital costs have been annuitised over 60 years at a discount rate of 3.5 per cent.
Working time 42.5 weeks per year 48 hours per week
Unit costs are based on 2,039 hours per year: 225 working days minus sickness absence and training/study days as reported for all NHS staff groups.11 Under the European Working Time Directive (EWTD), the majority of specialist registrars are now working up to 48 hours per week. 34 per cent are working up to 56 hours and 3.9 per cent are working 40 hours.12
Ratio of direct to indirect time on: patient-related activity
No current information available on patient-related activity. See previous editions of this publication for sources of information. Please complete our new time-use survey: https://www.surveymonkey.com/s/SZMF5YL.
London multiplier 1.19 x (A to B) 1.38 x E
Allows for the higher costs associated with London.9,10,13
Non-London multiplier
0.97 x (A to B) 0.97 x E
Allows for the lower costs associated with working outside London.9,10,13
Unit costs available 2012/2013 (costs including qualifications given in brackets) £40 (59) per hour (48 hour week); £34 (£56) per hour (56 hour week); £48 (£71) per hour (40 hour week). (Includes A to F).
1 Health & Social Care Information Centre (2013) NHS staff earnings estimates 2013 (not publicly available), Health & Social Care Information Centre,
Leeds. 2 Health & Social Care Information Centre (2013) NHS staff earnings estimates 2013, Health & Social Care Information Centre, Leeds. 3 Netten, A., Knight, J., Dennett, J., Cooley, R. & Slight, A. (1998) Development of a ready reckoner for staff costs in the NHS, Vols 1 & 2, Personal Social
Services Research Unit, University of Kent, Canterbury. 4 Personal communication with the Department of Health and Health Education England (HEE), 2013. 5 National Health Service (2008) Modernising medical careers, National Health Service, London. 6 NHS Employers (2008) Terms and conditions of service for specialty doctors – England (2008), NHS Employers, London. 7 Audit Commission (2012) Summarised accounts 2011-2012, NHS, London. 8 Personal communication with the London Deanery, 2006. 9 Building Cost Information Service (2013) Surveys of tender prices, Royal Institute of Chartered Surveyors, London. 10Personal communication with the Department for Communities and Local Government, 2011. 11Contracted hours are taken from NHS Careers (2012) Pay and benefits, National Health Service, London. http://www.nhscareers.nhs.uk/ [accessed 9
October 2013]. Working days and sickness absence rates as reported in Information Centre (2012) Sickness absence rates in the NHS: January-March 2012 and annual summary 2009-10 to 2011-12, Information Centre, Leeds.
12Provided by the Department of Health, 2009. 13Department of Health (2013) based on the Market Forces Factor (MFF).

244 Unit Costs of Health and Social Care 2013
15.4 Associate specialist An associate specialist is a doctor who has trained and gained experience in a medical or surgical specialty but has not become a consultant. These doctors usually work independently but will be attached to a clinical team led by a consultant in their specialty. Some of them are listed on the GMC’s specialist register and are eligible to take on a consultant post. The reasons why they do not include: a wish to concentrate on clinical work and to avoid the administrative pressures of a consultant post; a desire to have a better work/life balance; and, in some cases, a lack of opportunity to access higher training posts. They do, however, take part in the full range of clinical work, including teaching junior doctors.1,2,3
Costs and unit estimation
2012/2013 value
Notes
A. Wages/salary £75,808 per year
The mean basic salary for associate specialists, taken from the July 2012-June 2013 Electronic Staff Record (ESR). 4 An additional 35.4 per cent can be added to reflect payments for activity such as over-time, shift work and geographic allowances.5 See the preface for information on changes to salaries, and section V for further information on pay scales.
B. Salary oncosts £20,041 per year
Employer’s national insurance is included plus 14 per cent of salary for employer’s contribution to superannuation.
C. Qualifications £45,596 per year
Qualification costs have been calculated using the method described in Netten et al. (1998).6 Current cost information has been provided by the Department of Health and Health Education England (HEE).7 See table 7.4 for more details. Associate Specialist training involves at least four years’ full-time post-graduate training, at least two of which will be in a specialty training programme.8
D. Overheads Management, administration and estates staff Non-staff
£18,508 per year £40,227 per year
Taken from NHS (England) Summarised accounts.9 Management and other non-care staff costs were 19.31 per cent of direct care salary costs and included administration and estates staff. Non-staff costs were 41.97 per cent of direct care salary costs. They include costs to the provider for office, travel/transport and telephone, education and training, supplies and services (clinical and general), as well as utilities such as water, gas and electricity.
E. Ongoing training £2,516 per year This cost comprises an amount for the generic curriculum, the post-graduate centres’ infrastructure and study leave. Included also are the costs of the course organisers, administrative support, trainers’ workshops, vocational training and internal courses for GP tutors. Excluded are the costs of running the library and post-graduate centres.10
F. Capital overheads £3,387 per year Based on the new-build and land requirements of NHS facilities.11,12 Adjustments have been made to reflect shared use of administration and recreational facilities, including accommodation for night-time duties. Treatment space has not been included. Capital costs have been annuitised over 60 years at a discount rate of 3.5 per cent.
Working time 45.3 weeks per year 40 hrs per week
Unit costs are based on 1,699 hours per year: 225 working days minus sickness absence and training/study days as reported for all NHS staff groups.13 The new associate specialist full time contract is based on 10 Programmed Activities (40 hours per week).14
Ratio of direct to indirect time on: patient-related activity
No current information available on patient-related activity. See previous editions of this publication for sources of information. Please complete our new time-use survey: https://www.surveymonkey.com/s/SZMF5YL.
London multiplier 1.19 x (A to B) 1.39 x E
Allows for the higher costs associated with London.11,12,15
Non-London multiplier
0.97 x (A to B) 0.97 x E
Allows for the lower costs associated with working outside London.11,12,15
Unit costs available 2012/2013 (costs including qualifications given in brackets) £94 (121) per hour (40 hour week).
1 British Medical Association (2008) Staff and associate specialists committee newsletter. 2 British Medical Association (2008) Your contract, your decision, BMA Staff and Associate Specialists Group. 3 British Medical Association (2009) Glossary of doctors, www.bma.org.uk/patients_public/whos_who_healthcare/glossdoctors.jsp 4 Health & Social Care Information Centre (2013) NHS staff earnings estimates 2013 (not publicly available), Health & Social Care Information Centre, Leeds. 5 Health & Social Care Information Centre (2013) NHS staff earnings estimates 2013, Health & Social Care Information Centre, Leeds. 6 Netten, A., Knight, J., Dennett, J., Cooley, R. & Slight, A. (1998) Development of a ready reckoner for staff costs in the NHS, Vols 1 & 2, Personal Social Services
Research Unit, University of Kent, Canterbury. 7 Personal communication with the Department of Health and Health Education England (HEE), 2013. 8 National Health Service (2008) Modernising medical careers, National Health Service, London. 9 Audit Commission (2012) Summarised accounts 2011-2012, NHS, London. 10Personal communication with the London Deanery, 2006. 11Building Cost Information Service (2013) Surveys of tender prices, Royal Institute of Chartered Surveyors, London. 12Personal communication with the Department for Communities and Local Government, 2011. 13Contracted hours are taken from NHS Careers (2012) Pay and benefits, National Health Service, London. http://www.nhscareers.nhs.uk/ [accessed 9 October
2013]. Working days and sickness absence rates as reported in Information Centre (2013) Sickness absence rates in the NHS: January 2013 – March 2013, Information Centre, Leeds.
14NHS Employers (2011) Specialty and associate specialist contracts, British Medical Association, London. http://www.nhsemployers.org/Aboutus/Publications/Documents/FAQs-Specialty-and-Associate-Specialist-Contracts.pdf [accessed 9 October 2013].
15Department of Health (2013) based on the Market Forces Factor (MFF).
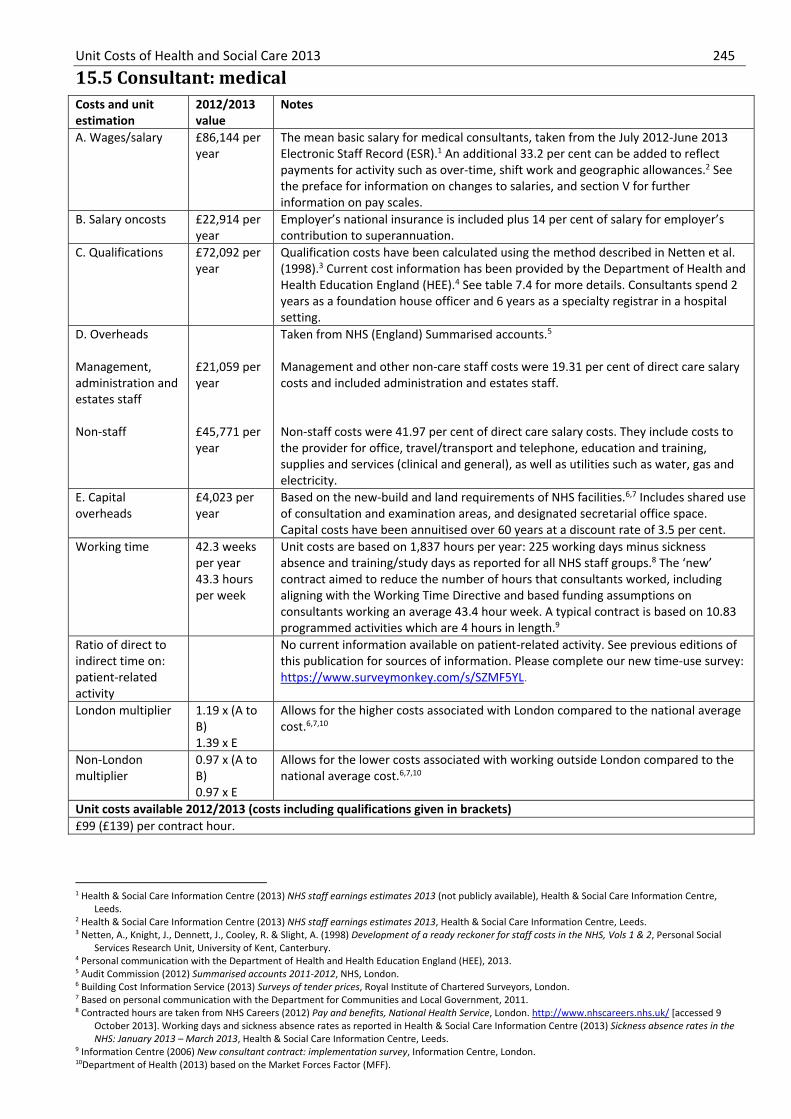
Unit Costs of Health and Social Care 2013 245
15.5 Consultant: medical Costs and unit estimation
2012/2013 value
Notes
A. Wages/salary £86,144 per year
The mean basic salary for medical consultants, taken from the July 2012-June 2013 Electronic Staff Record (ESR).1 An additional 33.2 per cent can be added to reflect payments for activity such as over-time, shift work and geographic allowances.2 See the preface for information on changes to salaries, and section V for further information on pay scales.
B. Salary oncosts £22,914 per year
Employer’s national insurance is included plus 14 per cent of salary for employer’s contribution to superannuation.
C. Qualifications £72,092 per year
Qualification costs have been calculated using the method described in Netten et al.(1998).3 Current cost information has been provided by the Department of Health and Health Education England (HEE).4 See table 7.4 for more details. Consultants spend 2 years as a foundation house officer and 6 years as a specialty registrar in a hospital setting.
D. Overheads Management, administration and estates staff Non-staff
£21,059 per year £45,771 per year
Taken from NHS (England) Summarised accounts.5
Management and other non-care staff costs were 19.31 per cent of direct care salary costs and included administration and estates staff. Non-staff costs were 41.97 per cent of direct care salary costs. They include costs to the provider for office, travel/transport and telephone, education and training, supplies and services (clinical and general), as well as utilities such as water, gas and electricity.
E. Capital overheads
£4,023 per year
Based on the new-build and land requirements of NHS facilities.6,7 Includes shared use of consultation and examination areas, and designated secretarial office space. Capital costs have been annuitised over 60 years at a discount rate of 3.5 per cent.
Working time 42.3 weeks per year 43.3 hours per week
Unit costs are based on 1,837 hours per year: 225 working days minus sickness absence and training/study days as reported for all NHS staff groups.8 The ‘new’ contract aimed to reduce the number of hours that consultants worked, including aligning with the Working Time Directive and based funding assumptions on consultants working an average 43.4 hour week. A typical contract is based on 10.83 programmed activities which are 4 hours in length.9
Ratio of direct to indirect time on: patient-related activity
No current information available on patient-related activity. See previous editions of this publication for sources of information. Please complete our new time-use survey: https://www.surveymonkey.com/s/SZMF5YL.
London multiplier 1.19 x (A to B) 1.39 x E
Allows for the higher costs associated with London compared to the national average cost.6,7,10
Non-London multiplier
0.97 x (A to B) 0.97 x E
Allows for the lower costs associated with working outside London compared to the national average cost.6,7,10
Unit costs available 2012/2013 (costs including qualifications given in brackets)£99 (£139) per contract hour.
1 Health & Social Care Information Centre (2013) NHS staff earnings estimates 2013 (not publicly available), Health & Social Care Information Centre,
Leeds. 2 Health & Social Care Information Centre (2013) NHS staff earnings estimates 2013, Health & Social Care Information Centre, Leeds. 3 Netten, A., Knight, J., Dennett, J., Cooley, R. & Slight, A. (1998) Development of a ready reckoner for staff costs in the NHS, Vols 1 & 2, Personal Social
Services Research Unit, University of Kent, Canterbury. 4 Personal communication with the Department of Health and Health Education England (HEE), 2013. 5 Audit Commission (2012) Summarised accounts 2011-2012, NHS, London. 6 Building Cost Information Service (2013) Surveys of tender prices, Royal Institute of Chartered Surveyors, London. 7 Based on personal communication with the Department for Communities and Local Government, 2011. 8 Contracted hours are taken from NHS Careers (2012) Pay and benefits, National Health Service, London. http://www.nhscareers.nhs.uk/ [accessed 9
October 2013]. Working days and sickness absence rates as reported in Health & Social Care Information Centre (2013) Sickness absence rates in the NHS: January 2013 – March 2013, Health & Social Care Information Centre, Leeds.
9 Information Centre (2006) New consultant contract: implementation survey, Information Centre, London. 10Department of Health (2013) based on the Market Forces Factor (MFF).
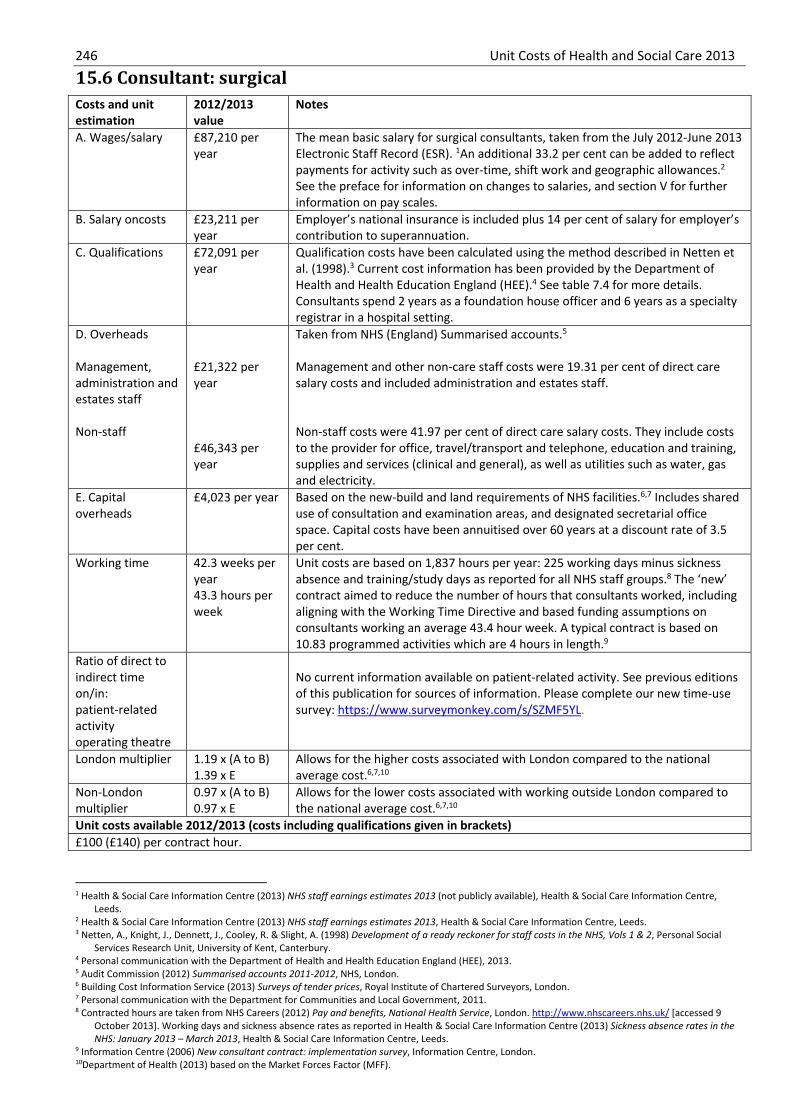
246 Unit Costs of Health and Social Care 2013
15.6 Consultant: surgical Costs and unit estimation
2012/2013 value
Notes
A. Wages/salary £87,210 per year
The mean basic salary for surgical consultants, taken from the July 2012-June 2013 Electronic Staff Record (ESR). 1An additional 33.2 per cent can be added to reflect payments for activity such as over-time, shift work and geographic allowances.2 See the preface for information on changes to salaries, and section V for further information on pay scales.
B. Salary oncosts £23,211 per year
Employer’s national insurance is included plus 14 per cent of salary for employer’s contribution to superannuation.
C. Qualifications £72,091 per year
Qualification costs have been calculated using the method described in Netten et al. (1998).3 Current cost information has been provided by the Department of Health and Health Education England (HEE).4 See table 7.4 for more details. Consultants spend 2 years as a foundation house officer and 6 years as a specialty registrar in a hospital setting.
D. Overheads Management, administration and estates staff Non-staff
£21,322 per year £46,343 per year
Taken from NHS (England) Summarised accounts.5 Management and other non-care staff costs were 19.31 per cent of direct care salary costs and included administration and estates staff. Non-staff costs were 41.97 per cent of direct care salary costs. They include costs to the provider for office, travel/transport and telephone, education and training, supplies and services (clinical and general), as well as utilities such as water, gas and electricity.
E. Capital overheads
£4,023 per year Based on the new-build and land requirements of NHS facilities.6,7 Includes shared use of consultation and examination areas, and designated secretarial office space. Capital costs have been annuitised over 60 years at a discount rate of 3.5 per cent.
Working time 42.3 weeks per year 43.3 hours per week
Unit costs are based on 1,837 hours per year: 225 working days minus sickness absence and training/study days as reported for all NHS staff groups.8 The ‘new’ contract aimed to reduce the number of hours that consultants worked, including aligning with the Working Time Directive and based funding assumptions on consultants working an average 43.4 hour week. A typical contract is based on 10.83 programmed activities which are 4 hours in length.9
Ratio of direct to indirect time on/in: patient-related activity operating theatre
No current information available on patient-related activity. See previous editions of this publication for sources of information. Please complete our new time-use survey: https://www.surveymonkey.com/s/SZMF5YL.
London multiplier 1.19 x (A to B) 1.39 x E
Allows for the higher costs associated with London compared to the national average cost.6,7,10
Non-London multiplier
0.97 x (A to B) 0.97 x E
Allows for the lower costs associated with working outside London compared to the national average cost.6,7,10
Unit costs available 2012/2013 (costs including qualifications given in brackets)£100 (£140) per contract hour.
1 Health & Social Care Information Centre (2013) NHS staff earnings estimates 2013 (not publicly available), Health & Social Care Information Centre,
Leeds. 2 Health & Social Care Information Centre (2013) NHS staff earnings estimates 2013, Health & Social Care Information Centre, Leeds. 3 Netten, A., Knight, J., Dennett, J., Cooley, R. & Slight, A. (1998) Development of a ready reckoner for staff costs in the NHS, Vols 1 & 2, Personal Social
Services Research Unit, University of Kent, Canterbury. 4 Personal communication with the Department of Health and Health Education England (HEE), 2013. 5 Audit Commission (2012) Summarised accounts 2011-2012, NHS, London. 6 Building Cost Information Service (2013) Surveys of tender prices, Royal Institute of Chartered Surveyors, London. 7 Personal communication with the Department for Communities and Local Government, 2011. 8 Contracted hours are taken from NHS Careers (2012) Pay and benefits, National Health Service, London. http://www.nhscareers.nhs.uk/ [accessed 9
October 2013]. Working days and sickness absence rates as reported in Health & Social Care Information Centre (2013) Sickness absence rates in the NHS: January 2013 – March 2013, Health & Social Care Information Centre, Leeds.
9 Information Centre (2006) New consultant contract: implementation survey, Information Centre, London. 10Department of Health (2013) based on the Market Forces Factor (MFF).

Unit Costs of Health and Social Care 2013 247
15.7 Consultant: psychiatric Costs and unit estimation
2012/2013 value
Notes
A. Wages/salary £87,718 per year
The mean basic salary for psychiatric consultants, taken from the July 2012-June 2013 Electronic Staff Record (ESR).1 An additional 33.2 per cent can be added to reflect payments for activity such as over-time, shift work and geographic allowances.2 See the preface for information on changes to salaries, and section V for further information on pay scales.
B. Salary oncosts £23,352 per year
Employer’s national insurance is included plus 14 per cent of salary for employer’s contribution to superannuation.
C. Qualifications £72,092 per year
Qualification costs have been calculated using the method described in Netten et al. (1998).3 Current cost information has been provided by the Department of Health and Health Education England (HEE).4 See table 7.4 for more details. Consultants spend 2 years as a foundation house officer and 6 years as a specialty registrar in a hospital setting.
D. Overheads Management, administration and estates staff Non-staff
£21,447 per year £46,616 per year
Taken from NHS (England) Summarised accounts.5 Management and other non-care staff costs were 19.31 per cent of direct care salary costs and included administration and estates staff. Non-staff costs were 41.97 per cent of direct care salary costs. They include costs to the provider for office, travel/transport and telephone, education and training, supplies and services (clinical and general), as well as utilities such as water, gas and electricity.
E. Capital overheads
£4,023 per year Based on the new-build and land requirements of NHS facilities.6,7 Includes shared use of consultation and examination areas, and designated secretarial office space. Capital costs have been annuitised over 60 years at a discount rate of 3.5 per cent.
Working time 42.3 weeks per year 43.3 hours per week
Unit costs are based on 1,837 hours per year: 225 working days minus sickness absence and training/study days as reported for all NHS staff groups.8 The ‘new’ contract aimed to reduce the number of hours that consultants worked, including aligning with the Working Time Directive and based funding assumptions on consultants working an average 43.3 hour week. A typical contract is based on 10.83 programmed activities which are 4 hours in length.9
Ratio of direct to indirect time on: face-to-face contacts patient-related activity
1:1.58 1:0.95
Information taken from a sample of around 500 consultants.10 The proportion of working time spent on face-to-face settings including contact with patients, carrying out assessments and contact with family members was 34 per cent. Other patient-related activities added a further 9.5 per cent for meetings with patients or family. Time spent teaching has been disregarded and non-contact time has been treated as an overhead on time spent in patient contact. Please complete our new time-use survey: https://www.surveymonkey.com/s/SZMF5YL.
London multiplier 1.19 x (A to B) 1.39 x E
Allows for the higher costs associated with London compared to the national average cost 6,7,11
Non-London multiplier
0.97 x (A to E) 0.97 x E
Allows for the lower costs associated with working outside London compared to the national average cost.6,7,11
Unit costs available 2012/2013 (costs including qualifications given in brackets)£101 (£140) per contract hour; £261 (£362) per face-to-face contact; £197 (£273) per patient-related hour (includes A to F).
1 Health & Social Care Information Centre (2013) NHS staff earnings estimates 2013 (not publicly available), Health & Social Care Information Centre,
Leeds. 2 Health & Social Care Information Centre (2013) NHS staff earnings estimates 2013, Health & Social Care Information Centre, Leeds. 3 Netten, A., Knight, J., Dennett, J., Cooley, R. & Slight, A. (1998) Development of a ready reckoner for staff costs in the NHS, Vols 1 & 2, Personal Social
Services Research Unit, University of Kent, Canterbury. 4 Personal communication with the Department of Health and Health Education England (HEE), 2013. 5 Audit Commission (2012) Summarised accounts 2011-2012, NHS, London. 6 Building Cost Information Service (2013) Surveys of tender prices, Royal Institute of Chartered Surveyors, London. 7 Personal communication with the Department for Communities and Local Government, 2011. 8 Contracted hours are taken from NHS Careers (2012) Pay and benefits, National Health Service, London. http://www.nhscareers.nhs.uk/ [accessed 9
October 2013]. Working days and sickness absence rates as reported in Health & Social Care Information Centre (2013) Sickness absence rates in the NHS: January 2013 – March 2013, Health & Social Care Information Centre, Leeds.
9Information Centre (2006) New consultant contract: implementation survey, Information Centre, London. 10Royal College of Psychiatrists (2003) Workload and working patterns in consultant psychiatrists, College Research Unit, Royal College of Psychiatrists,
London. 11Department of Health (2013) based on the Market Forces Factor (MFF).


V. SOURCES OF INFORMATION 16. Inflation indices 17. NHS Staff Earning Estimates 18. Care home fees 19. Glossary 20. References 22. List of useful sources 23. List of items from previous volumes


Unit Costs of Health and Social Care 2013 251
16. Inflation indices
16.1 The BCIS house rebuilding cost index and the retail price index BCIS calculates the house rebuilding cost index for the Association of British Insurers (ABI). The index is based on an average of house types and cannot therefore reflect changes in all rates from the house rebuilding cost tables as regional trends, labour and materials contents differ.1 The retail price index is a measure of inflation published monthly by the Office for National Statistics. It measures the change in the cost of a basket of retail goods and services.2 Year BCIS/ABI Retail price
Rebuilding cost index (1988=100)
Annual % increases
Index(1986/87= 100)
Annual % increases
2002 176.6 6.6 175.1 2.22003 183.8 4.1 180.0 2.82004 191.3 4.1 184.0 2.22005 206.1 7.7 188.2 2.32006 219.8 6.7 193.7 2.92007 228.7 4.0 199.9 3.22008 243.5 6.5 208.5 4.32009 236.9 -2.7 212.6 2.02010 239.5 1.1 222.7 4.82011 252.0 5.2 234.5 5.32012 Not available Not available 242.0 3.2
16.2 The hospital & community health services (HCHS) index Hospital and community health services (HCHS) pay and price inflation is a weighted average of two separate inflation indices: the pay cost index (PCI) and the health service cost index (HSCI). The PCI measures pay inflation in the HCHS. The PCI is itself a weighted average of increases in unit staff costs for each of the staff groups within the HCHS sector. Pay cost inflation tends to be higher than pay settlement inflation because of an element of pay drift within each staff group. Pay drift is the tendency for there to be a gradual shift up the incremental scales, and is additional to settlement inflation. The estimate of pay inflator for the current year is based on information supplied by the Department of Health and on pay awards of NHS staff. The HSCI is calculated monthly to measure the price change for each of 40 sub-indices of goods and services purchased by the HCHS. The sub-indices are weighted together according to the proportion of total expenditure which they represent to give the overall HSCI value. The pay cost index and the health service cost index are weighted together according to the proportion of HCHS expenditure on each. This provides an HCHS combined pay & prices inflation figure.3 Year Hospital & community health services (HCHS)
Pay & prices index(1987/8=100)
Annual % increases Prices4 Pay4
2002/03 213.7 0.9 5.02003/04 224.8 1.5 7.32004/05 232.3 1.0 4.52005/06 240.9 1.9 4.72006/07 249.8 3.0 4.12007/08 257.0 1.8 3.52008/09 267.0 5.2 3.02009/10 268.6 -1.3 1.82010/11 276.7 2.8 3.12011/12 282.5 4.1 0.92012/13 289.1 3.1 1.9
1 Building Cost Information Service (2013) Indices and forecasts, Royal Institute of Chartered Surveyors, London
http://www.rics.org/uk/knowledge/bcis/about-bcis/rebuilding/bcis-house-rebuilding-cost-index/ [accessed 9 October 2013]. 2 Source www.statistics.gov.uk [accessed 9 October 2013]. 3 Provided by the Department of Health, 2013. 4 Provided by the Department of Health, 2013. The methodology for the pay cost index was revised in 2011/12 and now uses Electronic Staff Record data
at occupation code level. Pay cost data are therefore not comparable with earlier years. The 2012/13 pay inflator has been estimated using the average of the three previous years.

252 Unit Costs of Health and Social Care 2013
16.3 Gross domestic product (GDP) deflator and the tender price index for public sector buildings For non-staff revenue, Her Majesty’s Treasury’s (HMT) GDP deflator is a measure of general inflation in the domestic economy. HMT produces the GDP deflator from data provided by the ONS and extends the series to future years by applying forecasts of the inflation rate. The BIS PUBSEC tender price index (PUBSEC) is used by the Office for National Statistics (ONS) to deflate capital expenditure in health and social care. Year Personal social services prices/gross
domestic product deflator1 annual % increases
Tender price index for public sector building(non-housing) (PUBSEC)1
Index (1995=100) Annual % increases
2004/05 2.76 156 7.22005/06 1.83 166 6.42006/07 2.87 170 2.72007/08 2.51 187 9.82008/09 2.80 191 2.32009/10 2.76 172 -10.32010/11 2.61 169 -1.82011/12 2.29 176 4.22012/13 1.50 180 2.6 16.4 The PSS pay & prices index The data and methodology used to calculate the PSS pay & prices index has been extensively reviewed this year, following changes in the collection and availability of pay and workforce data. Workforce data for the children’s sector, which accounted for 11 per cent of the total whole time equivalent (WTE) workforce in 2010, is no longer collected and the indices below are for the adult sector alone. This year therefore, three indices have been produced including, for the first time, one for the independent sector. No forecasts for this sector have been made prior to 2010/11. The PSS pay annual percentage increases are calculated using data on rates of hourly pay change for each occupation group in the PSS sector from the Annual Survey of Hours and Earnings (ASHE), published by Office for National Statistics (ONS).2
The following occupation groups are used for analysis: managers, social workers, nurses, occupational therapists, community and care workers. In addition, two support groups were identified: administrative/office and ancillary staff. As it was not possible to collect detailed data on all staff working in these groups, it was assumed that their pay increases were in line with the average for England. These pay changes were weighted by the proportion of PSS staff in each group and the different pay levels of each group: i.e. that occupation group’s share of the total PSS pay bill. Workforce data for 2012 from the National Minimum Data Set for Social Care (NMDS-SC), collected by Skills for Care (SfC), is used this year for the proportion of PSS staff in each occupation group. This data source has replaced the NHS IC’s SSDS001 return since 2010, but does not include the children’s sector. For further information on changes to this year’s inflators, contact Armin Kirthi-Singha ([email protected]). Pay changes for 2012/13 are projected using an average of the pay changes in the past three years. This assumes that pay increases next year will be in line with the previous trend. The PSS pay & prices (including capital) is calculated by taking the weighted sum of three indices: pay index, capital index and non-staff revenue index, and the PSS pay & prices (excluding capital) is calculated by taking the weighted sum of two indices: pay index and non-staff revenue index.
1 Provided by the Department of Health, 2013. 2 This work contains statistical data from ONS which is Crown copyright and reproduced with the permission of the controller of HMSO and Queen’s
Printer for Scotland. The use of the ONS statistical data in this work does not imply the endorsement of the ONS in relation to the interpretation or analysis.

Unit Costs of Health and Social Care 2013 253
16.4.1 The PSS annual percentage increases for adult services (all sectors) Year PSS all sectors, adults only1
Annual % increasesPay & prices (excluding
capital) Pay & prices (including
capital) Pay
2003/04 3.9 4.2 4.12004/05 3.2 4.2 3.92005/06 2.8 3.7 3.42006/07 4.1 4.5 5.12007/08 2.6 3.9 3.02008/09 2.1 2.4 2.42009/10 1.9 0.3 2.22010/11 -0.1 -0.3 -0.42011/12 0.4 0.8 0.12012/13 -0.1 (E) 0.1 (E) -0.4 (E)
16.4.2 The PSS annual percentage increases for adult local authority services Year PSS local authority, adults only1
Annual % increasesPay & prices (excluding
capital) Pay & prices (including
capital) Pay
2003/04 3.5 3.9 3.92004/05 4.0 4.3 4.32005/06 3.3 3.6 3.62006/07 4.4 4.5 4.72007/08 2.9 3.5 3.22008/09 2.3 2.4 2.32009/10 1.8 1.4 1.92010/11 0.3 0.2 0.22011/12 -0.1 0.1 -0.22012/13 -0.3 (E) -0.2 (E) -0.4 (E)
16.4.3 The PSS annual percentage increases for adult independent services Year PSS independent care, adults only1
Annual % increasesPay & prices (excluding capital) (no information
available)
Pay & prices (including capital)
Pay
2010/11 -0.4 -0.52011/12 1.0 0.12012/13 0.3 (E) -0.4 (E)
1 Provided by the Department of Health, 2013.

254 Unit Costs of Health and Social Care 2013
17. NHS staff earning estimates1
17.1 Mean annual basic pay per FTE for non-medical occupational groupings, NHS England Mean annual basic pay per FTE Ambulance staff £24,426 Administration and estates staff £26,454 Healthcare assistants and other support staff £16,522 Nursing, midwifery and health visiting staff £28,390 Nursing, midwifery and health visiting learners £21,561 Scientific, therapeutic and technical staff £31,496 Healthcare scientists £28,958
17.2 Mean annual basic pay per FTE for qualified nursing, midwifery & health visiting staff by Agenda for Change band, NHS England
Mean annual basic pay per FTE Band 4 £19,890 Band 5 £25,744 Band 6 £31,752 Band 7 £38,057 Band 8a £45,022 Band 8b £53,806 Band 8c £63,832 Band 8d £75,792 Band 9 £90,753
17.3 Mean annual basic pay per FTE for qualified allied health professionals staff by Agenda for Change band, NHS England Mean annual basic pay per FTE Band 4 £21,058 Band 5 £23,441 Band 6 £30,712 Band 7 £38,146 Band 8a £45,593 Band 8b £54,599 Band 8c £65,466 Band 8d £78,479 Band 9 £95,805
1 More specific enquiries relating to pay by grade or staff group should be directed to the Health & Social Care Information Centre, www.hscic.gov.uk.
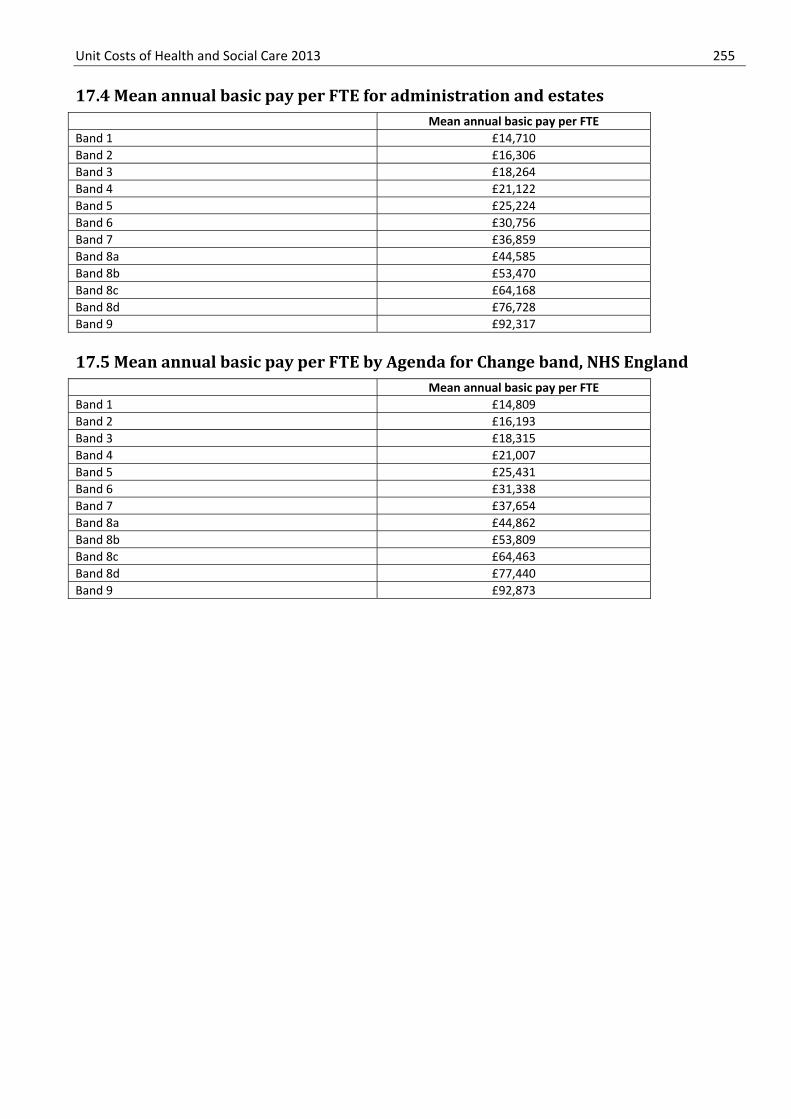
Unit Costs of Health and Social Care 2013 255
17.4 Mean annual basic pay per FTE for administration and estates Mean annual basic pay per FTE Band 1 £14,710Band 2 £16,306Band 3 £18,264Band 4 £21,122Band 5 £25,224Band 6 £30,756Band 7 £36,859Band 8a £44,585Band 8b £53,470Band 8c £64,168Band 8d £76,728Band 9 £92,317
17.5 Mean annual basic pay per FTE by Agenda for Change band, NHS England Mean annual basic pay per FTE Band 1 £14,809Band 2 £16,193Band 3 £18,315Band 4 £21,007Band 5 £25,431Band 6 £31,338Band 7 £37,654Band 8a £44,862Band 8b £53,809Band 8c £64,463Band 8d £77,440Band 9 £92,873

256 Unit Costs of Health and Social Care 2013 17.6 Mean annual basic pay per FTE for NHS staff groups Mean basic salary per full-time equivalent All nurses, midwives and health visiting staff Qualified £30,619 Nursery nurses and nursing assistants £17,748 Science technical & therapeutic staff (ST&T): allied health professionals
Qualified £33,393 Unqualified £18,470 ST&T staff: other Qualified £35,469 Unqualified £19,517 Ambulance staff Qualified £26,662 Unqualified £18,477 Former pay negotiating council groups Senior managers £75,759 Managers £47,777 Administrative & clerical £22,031 Maintenance & works £22,041 Source of tables 17.1-17.6: Health & Social Care Information Centre (2013) NHS staff earnings estimates, 12 month period July 2012 to June 2013. Processed using data taken from the Electronic Staff Record Data Warehouse, as at September 2013.
Copyright © 2013, Re-used with the permission of The Health & Social Care Information Centre. All rights reserved. General notes
a. Inspection of data suggests that discretionary point payments are sometimes included with basic pay for consultants. b. These figures represent payments made using the Electronic Staff Record to NHS Staff who are directly paid by NHS
organisations. It does not include, for example, elements of pay for clinical staff which are paid to the individual by universities, or other non-NHS organisations providing NHS care.
c. Figures rounded to the nearest £100. d. Figures based on data from all NHS organisations who are using ESR (two Foundation Trusts have not taken up ESR).

Unit Costs of Health and Social Care 2013 257
18. Care home fees
18.1 The minimum and maximum fee for single and shared rooms for local authority nursing and residential care homes in the UK1 Nursing homes Residential care homes Min Max Min Max Min Max Single room Single room Shared roomAdults under 65 years £407 Dementia £466 £517 £504 £435Learning disability £806 £934 £632 Mental health £455 £649 Older people £479 £526 £471 £532 £457 £773Physical disability £1,112 £890 Average cost of all care home fees
£476 £526 £559 £611 £501 £735
18.2 The minimum and maximum fee for single and shared rooms for private and voluntary nursing and residential care homes in the UK1
Nursing homes Residential care homes Min Max Min Max Min Max Min Max Single room Shared room Single room Shared roomBrain injury rehabilitation
£1,305 £2,899 £1,025 £4,500 £1,550 £1,904 NA NA
Dementia £595 £816 £564 £758 £466 £589 £460 £537Learning disability £859 £1,254 £636 £1,028 £837 £1,328 £489 £708Mental health £777 £1,052 £565 £666 £560 £782 £453 £581Older people £592 £777 £552 £667 £453 £569 £430 £507Physical disability £683 £1,048 £630 £884 £638 £994 £499 £744Sensory impairment £570 £1,080 £746 £1,120 £487 £487Substance misuse problems
£854 £1,193 £795 £820 £587 £683 £631 £642
Average cost of all private/voluntary sector care home fees
£609 £815 £559 £696 £538 £716 £440 £524
1 Laing & Buisson (2013) Annual Survey of UK Local Authority Baseline Fee Rates 2013/14, Laing & Buisson.

258 Unit Costs of Health and Social Care 2013
19. Glossary Agency overheads Overhead costs borne by managing agency. Annuitising Converting a capital investment (such as the cost of a building) into the annual equivalent cost for the period over which the investment is expected to last. Child and adolescent mental health services (CAMHS) is a name for NHS-provided services for children with mental health needs in the UK. In the UK they are often organised around a tier system. Tier 3 services, for example, are typically multidisciplinary in nature and the staff come from a range of professional backgrounds. Capital overheads Buildings, fixtures and fittings employed in the production of a service. Care package costs Total cost of all services received by a patient per week. Cost function analysis Statistical analysis using a multivariate technique ‘designed to simultaneously tease out the many influences on cost’. Department for Work and Pensions (DWP) is the largest government department in the United Kingdom, created on 8 June 2001, from the merger of the employment part of the Department for Education and Employment and the Department of Social Security and headed by the Secretary of State for Work and Pensions, a Cabinet position. Direct overheads Day-to-day support for a service, such as immediate line management, telephone, heating and stationery. Discounting Adjusting costs using the time preference rate spread over a period of time in order to reflect their value at a base year. Durables Items such as furniture and fittings. Indirect overheads Ongoing managing agency costs such as personnel, specialist support teams and financial management. Long-term The period during which fixed costs such as capital can be varied. Marginal cost The cost of an additional unit of a service. Oncosts Essential associated costs such as an employer’s national insurance contributions. Opportunity cost The value of the alternative use of the assets tied up in the production of the service. Per average stay Cost per person of a typical stay in a residential facility or hospital. Per client hour Cost of providing the service for one hour of patient attendance. The costs of time not spent with clients are allocated to the time spent with clients. Per clinic visit Cost of one client attending a clinic. This allows for overall time spent on non-clinical activity to be allocated to the total time spent with clients in any setting. Per consultation Cost per attendance in a clinic or surgery. This also allows for overall time spent on non-clinical activity to be allocated to the total time spent with clients. Per example episode Cost of a typical episode of care, comprising several hours of a professional’s time.

Unit Costs of Health and Social Care 2013 259 Per home visit Cost of one visit to a client at home. This includes the cost of time spent travelling for the visit, the proportion of time spent on non-clinical activity which is attributable to visiting patients in their own home, and the time spent on visiting patients at home. Per hour in clinic Cost of one hour spent by a professional in a clinic. Time spent on non-clinical activity is allocated to the total time spent with clients in any setting. Per hour of client contact Cost of one hour of professional time spent attending to clients. This also includes the costs of time not spent with clients and allocates this to the time spent with clients. Per hour of client-related work Hourly cost of time spent on activities directly related to the client. This is not necessarily time spent in face-to-face contact with the client. Per hour of direct outputs (teams) Cost of one hour of team activity which results in a measurable activity by any member(s) of the team. Per hour of face-to-face contact Hourly cost of time spent in face-to-face contact with clients. This also includes the costs of time not spent with clients and allocates this to the time spent with clients. Per hour of home visiting Cost of one hour spent by a professional undertaking visits to clients at home. This includes the cost of time spent travelling. It also allows for overall time spent on non-clinical activity to be allocated to the total time spent with clients in any setting. Per hour of patient-related work or per patient-related hour Hourly cost of time spent on activities directly related to the patient. This is not necessarily time spent in face-to-face contact with the patient. Per hour on duty Hourly cost of time spent by a hospital doctor when on duty. This includes time spent on-call when not actually working. Per hour worked Hourly cost of time spent by a hospital doctor when working. This may be during the normal working day or during a period of on-call duty. Per inpatient day Cost per person of one day in hospital. Per patient day Cost per person of receiving a service for one day. Per permanent resident week Total weekly cost of supporting a permanent resident of a residential facility. Per procedure Cost of a procedure undertaken in a clinic or surgery. This includes the cost of time spent on non-clinical activity and the total time spent with clients. Per professional chargeable hour Hourly cost of services provided when paid for by the client. Per resident week Cost per person per week spent in a residential facility. Per session (day care) Cost per person of each morning or afternoon attendance in a day care facility. Per session per client Cost per person of one session. Per short-term resident week Total weekly cost of supporting a temporary resident of a residential facility. Price base The year to which cost information refers.

260 Unit Costs of Health and Social Care 2013 Ratio of direct to indirect time spent on client-related work/direct outputs/face-to-face contact/clinic contacts/home visits The relationship between the time spent on direct activities (such as face-to-face contact) and time spent on other activities. For example, if the ratio of face-to-face contact to other activities is 1:1.5, each hour spent with a client requires 2.5 paid hours. Overheads NHS overheads Management and other non-care staff overheads include administration and estates staff. Non-staff overheads include costs to the provider for office, travel/transport and telephone, education and training, supplies and services (clinical and general), as well as utilities such as water, gas and electricity. Local authority overheads Direct overheads include costs to the provider for administration and management, as well as for office, training and utilities such as water, gas and electricity. Indirect overheads include general management and support services such as finance and human resource departments. Short-term The period during which durable assets cannot be immediately added to or removed from the existing stock of resources. SSMSS Social services management and support services: overhead costs incurred by a local authority as defined by CIPFA guidelines. These include indirect overheads such as finance and personnel functions. Time preference rate The rate at which future costs or benefits are valued in comparison to current or base year’s costs or benefits.

Unit Costs of Health and Social Care 2013 261
20. References Allen, C. & Beecham, J. (1993) Costing services: ideals and reality, in A. Netten & J. Beecham (eds) Costing community care:
theory and practice, Ashgate, Avebury. Appleby, J., Crawford, R. & Emmerson, C. (2009) How cold will it be? Prospects for NHS funding: 2011-17, King's Fund and
Institute for Fiscal Studies, London. Association of Directors of Children’s Services Ltd (2012) ADCS’s position statement, what is care for?
http://www.adcs.org.uk/download/position-statements/2012/ADCS%20Position%20Statement%20What%20is%20care%20for.pdf [accessed 15 July 2013].
Audit Commission (2012) Summarised accounts 2011-2012, NHS, London. Audit Commission (2012) Reducing the costs of assessments and reviews, http://archive.audit-
commission.gov.uk/auditcommission/sitecollectiondocuments/Downloads/20120823assessmentsandreview.pdf [accessed 13 July 2013].
Baginsky, M., Moriarty, J., Manthorpe, J., Stevens, M., MacInnes, T. & Nagendran, T. (2010) Social workers’ workload survey, messages from the frontline, findings from the 2009 survey and interviews with senior managers, Children’s Workforce Development Council, King’s College, University of London, New Policy Institute.
Ball, J. (2005) Maxi Nurses. Advanced and specialist nursing roles, results from a survey of RCN members in advanced and specialist nursing roles, Royal College of Nursing, London.
Baqir, W., Learoyd, T., Sim, A. & Todd, A. (2011) Cost analysis of a community pharmacy ‘minor ailment scheme’ across three primary care trusts in the North East of England, Journal of Public Health, 33, 4, 551-555, doi:10.1093/pubmed/fdr012.
Barlow, J., Davis, H., McIntosh, E., Jarrett, P., Mockford, C. & Stewart-Brown, S. (2006) Role of home visiting in improving parenting and health in families at risk of abuse and neglect: results of a multicentre randomised controlled trial and economic evaluation, Archives of Disease in Childhood, 92, 3, 229-233.
Barrett,B., Byford, S., Crawford, M., Patton, R., Drummond, C., Henry, J. & Touquet, R. (2006) Cost-effectiveness of screening and referral to an alcohol health worker in alcohol misusing patients attending an accident and emergency department: a decision-making approach, Drug and Alcohol Dependence, 81, 1, 47-54.
Barrett, B., Byford, S., Sharac, J., Hudry, K., Leadbitter, K., Temple, K., Aldred, C., Slonims, V., Green, J. & the PACT Consortium (2012) Service and wider societal costs of very young children with autism, Journal of Autism and Developmental Disorders, 42, 5, 797-804.
Barton, G., Hodgekins, J., Mugford, M., Jones, P., Croudace, T. & Fowler, D. (2009) Cognitive behaviour therapy for improving social recovery in psychosis: cost-effectiveness analysis, Schizophrenia Research, 112, 1-3, 158-163.
Barton, P., Bryan, S., Glasby, J., Hewitt, G., Jagger, C., Kaambwa, B., Martin, G., Nancarrow, S., Parker, H., Parker, S., Regen, E. & Wilson, A. (2006) A national evaluation of the costs and outcomes of intermediate care for older people. Executive Summary, Intermediate Care National Evaluation Team (ICNET), University of Birmingham and University of Leicester.
Baumann, M., Evans, S., Perkins, M., Curtis, L., Netten, A., Fernandez, J.L. & Huxley, P. (2007) Organisation and features of hospital, intermediate care and social services in English sites with low rates of delayed discharge, Health & Social Care in the Community, 15, 4, 295-305.
Bayer, S. & Barlow, J. (2010) Analysis of data on the impact of telecare provided under telecare capital grant, Imperial College Business School, London.
Beck, A. (1964) Thinking and depression: theory and therapy, Archives of General Psychiatry, 10, 6, 561-571. Beck, J. (2011) Cognitive Behavior Therapy, 2nd edition, Guildford Press, New York. Bedfordshire Police (2012) 2012/13 Fees and charges handbook,
http://www.bedfordshire.police.uk/PDF/bedfordshire_fees_and_charges.pdf [accessed 9 October 2013]. Beecham, J. (2000) Unit Costs – Not exactly child’s play: a guide to estimating unit costs for children’s social care,
Department of Health, Dartington Social Research Unit and the Personal Social Services Research Unit, University of Kent.
Beecham, J. & Knapp, M. (1992) Costing psychiatric interventions, in G. Thornicroft, C. Brewin & J. Wing (eds) Measuring Mental Health Needs, Oxford University Press, Oxford.
Beecham, J., Sloper, P., Greco, V. & Webb, R. (2007) The costs of key worker support for disabled children and their families, Child: Care, Health and Development, 33, 5, 611-618.
Beecham, J., Perkins, M., Snell, T. & Knapp, M. (2009) Treatment paths and costs for young adults with acquired brain injury in the United Kingdom, Brain Injury, 23, 1, 30-38.

262 Unit Costs of Health and Social Care 2013 Beresford, B., Stuttard, L., Clarke, S., Maddison, J. & Beecham, J. (2012) Managing behaviour and sleep problems in disabled
children: An investigation into the effectiveness and costs of parent-training interventions, Research Report DFE-RR204a, Department for Education, London.
Bollington, L. & John, D. (2012) Pharmacy education and training in the hospital service in Wales: identifying demand and developing capacity, STS Publishing, Cardiff.
Bond, G., Drake, R. & Becker, D. (2008) An update on randomized controlled trials of evidence based supported employment, Psychiatric Rehabilitation Journal, 31, 280-289.
Bonin, E., Stevens, M., Beecham, J., Byford, S. & Parsonage, M. (2011) Costs and longer-term savings of parenting programmes for the prevention of persistent conduct disorder: a modelling study, BMC Public Health 2011, 11:803 doi:10.1186 1471-2458-11-803.
Bonin, E., Beecham, J., Dance, C. & Farmer, E. (2013) Support for adoption: the first six months, British Journal of Social Work, published online 28 February 2013.
Bower, P., Cartwright, M., Hirani, S., Barlow, J., Hendy, J., Knapp, M., Henderson, C., Rogers, A., Sanders, C., Bardsley, M., Steventon, A., Fitzpatrick, R., Doll, H. & Newman, S. (2011) A comprehensive evaluation of the impact of telemonitoring in patients with long-term conditions and social care needs: protocol for the Whole System Demonstrator cluster randomised trial, BMC Health Services Research, 11, 184.
British Association for Counselling and Psychotherapy (2011) BACP definition of counselling, BACP, http://www.bacp.co.uk/ [accessed 25 July 2013].
British Association of Social Workers (2011) Social work careers, British Association of Social Workers, www.basw.co.uk/social-work-careers/ [accessed 25 July 2013].
British Medical Association (2008) Staff and Associate Specialists Committee newsletter, http://www.bma.org.uk/news/branch_newsletters/staff_associates_newsletter/sascnewsletter1008.jsp [accessed 25 July 2013].
British Medical Association (2008) Your contract, your decision, BMA Staff and Associate Specialists Group, http://www.bma.org.uk/ [accessed 25 July 2013].
British Medical Association (2009) Glossary of doctors, http://www.bma.org.uk/patients_public/whoswho_healthcare/glossdoctors.jsp [accessed 25 July 2013].
Building Cost Information Service (2002) BCIS access audit price guide, http://www.rics.org/uk/shop/BCIS-Access-Audit-Price-Guide-6233.aspx [accessed 13 July 2013].
Building Cost Information Service (2013) Surveys of tender prices, BCIS, Royal Institute of Chartered Surveyors, London. Building Cost Information Service (2013) Indices and forecasts, BCIS, Royal Institute of Chartered Surveyors, Kingston-upon-
Thames. Burns, T., Catty, J., Becker, T., Drake, R., Fioritti, A., Knapp, M., Lauber, C., Rossler, W., Tomov, T., Van Busschbach, J., White,
S. & Wiersma, D. (2007) The effectiveness of supported employment for people with severe mental illness: a randomised controlled trial, The Lancet, 370, 1146-1152.
Butler, S., Baruch, G., Hickey, N. & Fonagy, P. (2011) A randomized controlled trial of multi systemic therapy and statutory therapeutic intervention for young offenders, Journal of the American Academy of Child and Adolescent Psychiatry, 50, 12, 1220-1235.e2.
Byford, S., Knapp, M., Greenshields, J., Ukoummune, O., Jones, V., Thompson, S.G., Tyrer, P., Schmidt, U. & Davidson, K. (2003) Cost-effectiveness of brief cognitive behaviour therapy versus treatment as usual in recurrent deliberate self-harm: A decision-making approach, Psychological Medicine, 33, 6.
Byford, S., Barrett, B., Roberts, C., Wilkinson, P., Dubicka, B., Kelvin, R.G., White, L., Ford, C., Breen, S. & Goodyer, I. (2007) Cost-effectiveness of selective serotonin reuptake inhibitors and routine specialist care with and without cognitive behavioural therapy in adolescents with major depression, British Journal of Psychiatry, 191, 6, 521-527.
Care Services Improvement Partnership, Mental Health Strategies (2009) Combined mapping framework, http://nmhdu.org.uk/silo/files/service-mapping.pdf [accessed 17 January, 2013].
Cartwright, M., Hirani, S., Rixon, L., Beynon, M., Doll, H., Bardsley, M., Steventon, A., Knapp, M., Henderson, C., Rogers, A., Bower, P., Sanders, C., Fitzpatrick, R., Barlow, J. & Newman, S. (2013) Effect of telehealth on quality of life and psychological outcomes over 12 months (Whole System Demonstrator telehealth questionnaire study): nested study of patient reported outcomes in a pragmatic, cluster randomised controlled trial, British Medical Journal, 346, f653. http://www.bmj.com/highwire/filestream/633183/field_highwire_adjunct_files/7/ and http://www.bmj.com/highwire/filestream/633183/field_highwire_adjunct_files/0/ [accessed 16 July 2013].

Unit Costs of Health and Social Care 2013 263 Chisholm, D., Godfrey, E., Ridsdale, L., Chalder, T., King, M., Seed, P., Wallace, P., Wessely, S. & Fatigue Trialists' Group
(2001) Chronic fatigue in general practice: economic evaluation of counselling versus cognitive behaviour therapy, British Journal of General Practice, 51, 462, 15-18.
Cochrane, H., Liyanage, S. & Nantambi, R. (2007) Palliative care statistics for children and young adults, Department of Health, London. http://www.dh.gov.uk/en/Publicationsandstatistics/Publications/PublicationsPolicyAndGuidance/DH_123459/ [accessed 25 July 2013].
Connor, A., Lillywhite, R. & Cooke, M. (2010) The carbon footprint of a renal service in the United Kingdom, QJM, 103, 12, 965-975.
Connor, A., Lillywhite, R. & Cooke, M. (2011) The carbon footprints of home and in-centre maintenance hemodialysis in the United Kingdom, Hemodialysis International, 15, 1, 39-51.
Connor, A., Mortimer, R. & Higgins, R. (2011) The follow-up of renal transplant recipients by telephone consultation: three years experience from a single UK renal unit, Clinical Medical Journal, 11, 3, 242-246.
Consumer Focus (2010) Equipment for older and disabled people: an analysis of the market, http://www.consumerfocus.org.uk/files/2010/11/Equipment-for-older-and-disabled-people-an-analysis-of-the-market.pdf [accessed 13 July 2013].
Cottrell, E., Chambers, R. & O'Connell, P. (2012) Using simple telehealth in primary care to reduce blood pressure: a service evaluation, BMJ Open, 2.
County Durham and Tees Valley (2005) Workload, capacity and skill mix in Sedgefield Locality Teams, Final Report, Sedgefield Integrated Teams.
Craft, A. & Killen, S. (2007) Palliative care services for children and young people in England, Department of Health, London. http://www.rcn.org.uk/__data/assets/pdf_file/0012/488991/004_328.pdf [accessed 10 September 2013].
Curtis, L. (2005) The costs of recuperative care housing, in L. Curtis (ed.) Unit Costs of Health and Social Care 2005, Personal Social Services Research Unit, University of Kent, Canterbury.
Curtis, L. (2007) Unit Costs of Health and Social Care 2007, Personal Social Services Research Unit, University of Kent, Canterbury.
Curtis, L. (2008) Unit Costs of Health and Social Care 2008, Personal Social Services Research Unit, University of Kent, Canterbury.
Curtis, L. (2010) Unit Costs of Health and Social Care 2010, Personal Social Services Research Unit, Canterbury. Curtis, L. (2012) Unit Costs of Health and Social Care 2012, PSSRU, Canterbury. Curtis, L. & Netten, A. (2007) The costs of training a nurse practitioner in primary care: the importance of allowing for the
cost of education and training when making decisions about changing the professional mix, Journal of Nursing Management, 15, 4, 449-457.
Curtis, L., Moriarty, J. & Netten, A. (2010) The expected working life of a social worker, British Journal of Social Work, 40, 5, 1628-1643.
Curtis, L. Moriarty, J. & Netten, A. (2012) The costs of qualifying a social worker, British Journal of Social Work, 42, 4, 706-724.
Dance, C., Ouwejan, D., Beecham, J. & Farmer, E. (2008) Adoption agency linking and matching practice in adoption in England and Wales, Survey Findings, Department for Education, Research Brief DCSF-RBX-16-08. https://www.education.gov.uk/publications/standard/publicationDetail/Page1/DCSF-RBX-16-08/ [accessed 25 July 2013].
Dance, C., Ouwejan, D., Beecham, J. & Farmer, E. (2010) Linking and Matching: a survey of adoption agency practice in England and Wales, BAAF, London.
Darton, R., Forder, J., Bebbington, A., Netten, A., Towers, A-M. & Williams, J. (2006) Analysis to support the development of the relative needs formula for older people, PSSRU Discussion Paper 2265/3, Personal Social Services Research Unit, University of Kent, Canterbury.
Darton, R., Bäumker, T., Callaghan, L. & Netten, A. (2011) The PSSRU evaluation of the extra care housing initiative: technical report, Personal Social Services Research Unit, University of Kent, Canterbury.
Department for Business, Innovation & Skills (2012) Making the higher education system more efficient and diverse, https://www.gov.uk/government/policies/making-the-higher-education-system-more-efficient-and-diverse/ [accessed 11 July 2013].
Department for Children, Schools and Families (2008) Aiming high for disabled children: short breaks implementation guidance, Department for Children, Schools and Families, London.

264 Unit Costs of Health and Social Care 2013 Department for Education (2003) Every child matters,
https://www.education.gov.uk/publications/eOrderingDownload/CM5860.pdf [accessed 10 September 2013] Department for Education (2006) DfES Children’s Services: children’s homes and fostering, PricewaterhouseCoopers,
London. Department for Education (2011) Children looked after in England including adoption and care leavers, year ending 31
March 2011, SSDA903. http://www.education.gov.uk/rsgateway/DB/SFR/s001084/sfr20-2012md.pdf [accessed 25 July 2013].
Department for Education (2012) Section 251 data archive:outturn data-detailed level 2008-09 onwards, outturn summary 2010-11, Department for Education, London.
Department for Education (2012) Children’s homes in England data pack, http://media.education.gov.uk/assets/files/pdf/c/childrens%20homes%20data%20pack%20march%202012.pdf [accessed 15 July 2013].
Department for Education (2013) Data pack: improving permanence for looked after children, http://www.education.gov.uk/a00227754/looked-after-children-data-pack/ [accessed 1 October 2013].
Department for Education (2013) Children’s homes datapack, http://www.education.gov.uk/childrenandyoungpeople/families/childrenincare/childrenshomes/a00192000/childrens-homes-data-pack/ [accessed 15 July 2013].
Department for Education and Skills (2005) Children in need in England: results of a survey of activity and expenditure as reported by Local Authority Social Services’ children and families teams for a survey week in February 2005, Department for Education and Skills, London.
Department for Work and Pensions (2011) Benefits uprating, http://gmwrag.files.wordpress.com/2010/12/benefit_rates_2011_2012.pdf [accessed 25 July 2013].
Department for Work and Pensions (2012) Social security benefit uprating, http://www.dwp.gov.uk/docs/benefitrates2012.pdf [accessed 25 July 2013].
Department of Health (2001) Equipment. NHS Trusts – capital accounting manual 2001, Department of Health. Department of Health (2001) The expert patient: a new approach to chronic disease management in the 21st century, The
Stationery Office, London. Department of Health (2002) National child and adolescent mental health service mapping data, Department of Health,
London. Department of Health (2005) Building telecare in England,
http://webarchive.nationalarchives.gov.uk/20130107105354/http://www.dh.gov.uk/en/Publicationsandstatistics/Publications/PublicationsPolicyAndGuidance/DH_4115303/ [accessed 16 July 2013].
Department of Health (2006) Vocational services for people with severe mental health problems: commissioning guidance, CSIP for Department of Work and Pensions & Department of Health.
Department of Health (2008) PSS EX1 2007/08, Department of Health, London. Department of Health (2008) End of life care strategy:promoting high quality care for adults at the end of their life,
https://www.gov.uk/government/publications/end-of-life-care-strategy-promoting-high-quality-care-for-adults-at-the-end-of-their-life/ [accessed 11 July, 2013].
Department of Health (2009) PSS EX1 2008/09, Department of Health, London. Department of Health (2010) Achieving world class productivity in the NHS, 2009/10-2013/14: the McKinsey Report,
Department of Health, London. Department of Health (2010) A vision for adult social care: capable communities and active citizens, Department of Health. Department of Health (2011) Advice note on nursing care bands, Department of Health, London. Department of Health (2011) Commissioning services for people with dementia,
http://webarchive.nationalarchives.gov.uk/+/www.dh.gov.uk/en/Publicationsandstatistics/Publications/PublicationsPolicyAndGuidance/Browsable/DH_127381 [accessed 25 July 2013].
Department of Health (2011) Whole Systems Demonstrator programme, https://www.gov.uk/government/uploads/system/uploads/attachment_data/file/215264/dh_131689.pdf [accessed 16 July 2013].
Department of Health (2012) Caring for our future, http://www.dh.gov.uk/health/2012/07/careandsupportwhitepaper/ [accessed 25 July 2013].
Department of Health (2012) IAPT three-year report: the first million patients, Department of Health, London.

Unit Costs of Health and Social Care 2013 265 Department of Health (2013) NHS reference costs 2011-2012,
http://www.dh.gov.uk/en/Publicationsandstatistics/Publications/PublicationsPolicyAndGuidance/DH_131140/ [accessed 25 July 2013].
Department of Health (2013) Department of Health 2013-14 Corporate Plan, https://www.gov.uk/government/publications/department-of-health-corporate-plan-2013-14/ [accessed 11 July 2013].
Department of Health (2013) Guide to the healthcare system in England, including the statement of NHS accountability, https://www.gov.uk/government/publications/guide-to-the-healthcare-system-in-england/ [accessed 11 July 2013].
Department of Health (2013) Personal correspondence with the Department of Health. Department of Health & Department for Education and Skills (2004) National service framework for children, young people
and maternity services, Department of Health & Department for Education and Skills, London. Department of Health, Social Services and Public Safety (2003) The new NHS/HPSS pay system, March 2003, Department of
Health, Social Services and Public Safety, London. Directgov (2013) The national minimum wage rates,
www.direct.gov.uk/en/Employment/Employees/TheNationalMinimumWage/DG_10027201/ [accessed 25 July 2013]. Durham University (2012) Children’s service mapping, Durham. http://www.childrensmapping.org.uk/ [accessed 10
September 2013]. Edwards, R., Céilleachair, A., Bywater, T., Hughes, D. & Hutchings, J. (2007) Parenting programme for parents of children at
risk of developing conduct disorder: cost and effectiveness analysis, British Medical Journal, 334, 682-688. Ekers, D., Godfrey, C., Gilbody, S., Parrott, S., Richards, D., Hammond, D. & Hayes, A. (2011) Cost utility of behavioural
activation delivered by the non-specialist, British Journal of Psychiatry, 199, 510-511, doi:10.1192/bjp.bp.110.090266. Expert Patients Programme Community Interest Company, EPP Price Guide 2008/2009, London,
http://www.expertpatients.co.uk/ [accessed 25 July 2013]. Felce, D., Perry, J., Romeo, R., Robertson, J., Meek, A., Emerson, E. & Knapp, M. (2008) Outcomes and costs of community
living semi-independent living and fully staffed group homes, American Journal on Mental Retardation, 113, 2, 87-101. Forder, J., Jones, K., Glendinning, C., Caiels, J., Welch, E., Baxter, K., Davidson, J., Windle, K., Irvine, A., King, D. & Dolan, P.
(2012) Evaluation of the personal health budget pilot programme, PSSRU, University of Kent. Fostering Network (2013) Unit costs of support care, London. Fostering Network Wales Strengthening Families Support Care Project (2013) Unit costs of support care,
http://www.fostering.net/sites/www.fostering.net/files/resources/wales/unit_costs_of_support_care_.pdf [accessed 17 October 2013].
France, A., Munro, E. & Waring, A. (2010) The evaluation of arrangements for effective operation of the new local safeguarding children boards in England, Final Report, Department for Education, London.
Georghiou, T., Davies, S., Davies, A. & Bardsley, M. (2012) Understanding patterns of health and social care at the end of life, Nuffield Trust, London, http://www.nuffieldtrust.org.uk/publications/health-social-care-end-life/ [accessed 15 July 2013].
Gershon, P. (2004) Releasing resources for the frontline: independent review of public sector efficiency, HM Treasury, London.
Glendinning, C., Challis, D., Fernandez, J., Jacobs, S., Jones, K., Knapp, M., Manthorpe, J., Moran, N., Netten, A., Stevens, M. & Wilberforce, M. (2008) Evaluation of the individual budgets pilot programme, Final Report, Social Policy Research Unit, University of York, York.
Glendinning, C., Jones, K., Baxter, K., Rabiee, P., Curtis, L., Wilde, A., Arksey, H. & Forder, J. (2010) Home care re-ablement services: investigating the longer-term impacts, Final Report, University of York, PSSRU Kent, Department of Health, London.
Goodyer, I., Harrington, R., Breen, S., Dubicka, B., Leech, A., Rothwell, J., White, L., Ford, C., Kelvin, R., Wilkinson, P., Barrett, B., Byford, S. & Roberts, C. (2007) A randomised controlled trial of SSRIs with and without cognitive behavioural therapy in adolescents with major depression, British Medical Journal, 335:142, doi:10.1136/bmj.39224.494340.55.
Graves, N., Walker, D., Raine, R., Hutchings, A. & Roberts, J.A. (2002) Cost data for individual patients included in clinical studies: no amount of statistical analysis can compensate for inadequate costing methods, Health Economics, 11, 735-739.
Greco, V., Sloper, P., Webb, R. & Beecham, J. (2005) An exploration of different models of multi-agency partnerships in key worker services for disabled children: effectiveness and costs, Social Policy Research Unit, University of York.
Haines, A., Wilkinson, P., Tonne C. & Roberts, I. (2009) Aligning climate change and public health policies, The Lancet, 374, 9707, 2035-2038.

266 Unit Costs of Health and Social Care 2013 Hammond, G., Croudace, T., Radhakrishnan, M., Lafortune, L., Watson, A., McMillan-Shields, F. & Jones, P. (2012)
Comparative effectiveness of cognitive therapies delivered face-to-face or over the telephone: an observational study using propensity methods. PLoS ONE [Electronic Resource], 7, 9, e42916.
Hann, M., Santos, R., Sutton, M., Gravelle, H. & Sibbald, B. (2011) Sixth national GP worklife survey, Final Report, NPCRDC, Manchester.
Hazeldine, T., Clark, W., Deller, L. & Vasileios, P. (2010) MAC curves NHS England: marginal abatement cost curve, Cambridge: SDU, http://www.sduhealth.org.uk/documents/publications/1268054230_JynW_the_marginal_abatement_cost_curve_(mac_curve)_-_in.pdf [accessed 15 July 2013].
Health & Social Care Information Centre (2013) NHS staff earnings estimates September 2012, Health & Social Care Information Centre, Leeds
Health & Social Care Information Centre (2013) NHS staff earnings estimates – October-December 2012, http://www.hscic.gov.uk/article/2021/Website-Search?productid=11289&q=staff+earnings&sort=Relevance&size=10&page=1&area=both#top/ [accessed 5 October 2013].
Health & Social Care Information Centre (2013) Electronic Records System estimates June 2013, Health & Social Care Information Centre, Leeds.
Health & Social Care Information Centre (2013) General practice staff 2012, Health & Social Care Information Centre, Leeds. Health & Social Care Information Centre (2013) GP earnings and expenses 2009/2010, Health & Social Care Information
Centre, Leeds, http://www.hscic.gov.uk/article/2268/NHS-Occupation-Codes/ [accessed 10 September 2013] Health & Social Care Information Centre (2013) GP earnings and expenses 2012/2013, Health & Social Care Information
Centre, Leeds. Health & Social Care Information Centre (2013) NHS staff earnings estimates to March 2013,
https://catalogue.ic.nhs.uk/publications/workforce/earnings/nhs-staff-earn-mar-2013/nhs-staf-earn-est-to-Mar-2013.pdf [accessed 11 July 2013].
Health & Social Care Information Centre (2013) NHS staff earnings estimates June 2013, Health & Social Care Information Centre, Leeds.
Health & Social Care Information Centre (2013) PSS EX1 2011/12, Health & Social Care Information Centre, Leeds. Health & Social Care Information Centre (2013) Sickness absence rates in the NHS: January 2013 – March 2013, Health &
Social Care Information Centre, Leeds. Health and Social Care Act (2012) Health and Social Care Act 2012,
http://www.legislation.gov.uk/ukpga/2012/7/contents/enacted/ [accessed 11 July 2013]. Healthcare Finance (2013) Costing lessons,
http://www.google.co.uk/url?sa=t&rct=j&q=&esrc=s&frm=1&source=web&cd=1&ved=0CC8QFjAA&url=http%3A%2F%2Fwww.hfma.org.uk%2Fdownload.ashx%3Ftype%3Dinfoservice%26id%3D630&ei=9j1VUpPcBPHa0QXRpoGwDg&usg=AFQjCNH3WxTfhZMddNaavQv9cbPiqgNa-A&sig2=NaSbnHLDHfyRH8KlVelC4A/ [accessed 9 October 2013].
Henderson, C., Knapp, M., Fernandez, J. L., Beecham, J., Hirani, S. Cartwright, C. Rixon, L. Beyon, M. Rogers, A. Bower, P. Doll, H., Fitzpatrick, R.,Steventon, A. Bardsley, A. Hendy, M. & J. Newman, S. (2013) Cost effectiveness of telehealth for patients with long term conditions (Whole Systems Demonstrator telehealth questionnaire study): nested economic evaluation in a pragmatic, cluster randomised controlled trial, British Medical Journal, 346, f1035, http://www.bmj.com/content/346/bmj.f1035/ [accessed 24 September 2013].
Henderson, C., Knapp, M., Fernández, J.-L., Beecham, J. Hirani, S., Beynon, M., Cartwright, M., Rixon, L., Doll, H. Bowyer, P., Steventon, A., Rogers, A., Fitzpatrick, R., Barlow, J., Bardsley, M. & Newman, S. (2013) Cost-effectiveness of telecare for people with social care needs: the Whole Systems Demonstrator cluster randomised trial, in preparation.
Hendy, J., Chrysanthaki, T., Barlow, J., Knapp, M., Rogers, A., Sanders, C., Bower, P., Bowen, R., Fitzpatrick, R., Bardsley, M., & Newman, S. (2012) An organisational analysis of the implementation of telecare and telehealth: the Whole Systems Demonstrator, BMC Health Services Research, 12, 403.
Higher Education Funding Council for England (HEFCE) (2012) Review of clinical subject weightings, http://www.hefce.ac.uk/pubs/rereports/year/2012/clinsubjwghtgs/ [accessed 15 July 2013].
Higher Education Funding Council for England (HEFCE) (2013) Funding for universities and colleges for 2012-13 and 2013-14: board decisions, http://www.hefce.ac.uk/pubs/year/2013/cl042013/ [accessed 15 July 2013].
Higgins, S., Lanfear, J. & Goodwin, M. (2006) Qualifying the role of nurse specialists in epilepsy: data from diaries and interviews, British Journal of Neuroscience Nursing, 2, 5, 239-245.
Unit Costs of Health and Social Care 2013 267 Hippisley-Cox, J., Fenty, J. & Heaps, M. (2007) Trends in consultation rates in general practice 1995 to 2006: analysis of the
Qresearch Database. Final Report to Health & Social Care Information Centre and Department of Health, Health & Social Care Information Centre, Leeds.
HM Government (2008) Climate Change Act 2008, http://www.legislation.gov.uk/ukpga/2008/27/contents/ [accessed 15 July 2013].
Hollinghurst, S., Peters, T., Kaur, S., Wiles, N., Lewis, G. & Kessler, D. (2010) Cost-effectiveness of therapist-delivered online cognitive-behavioural therapy for depression: randomised controlled trial, British Journal of Psychiatry, 197, 4 297-304.
Holmes, L. & Jones, A. (forthcoming) Unit costs of decision making for looked after children and children in need, Loughborough: Centre for Child and Family Research, Loughborough University.
Holmes, L. & McDermid, S. (2010) The costs of short break provision, in L. Curtis (ed.) Unit Costs of Health and Social Care 2011, Personal Social Services Research Unit, University of Kent, Canterbury.
Holmes, L. & McDermid, S. (2012) Understanding costs and outcomes in child welfare services: a comprehensive costing approach to managing your resources, Jessica Kingsley, London.
Holmes, L. & Soper, J. (2010) Update to the cost of foster care, Loughborough University, Loughborough. http://www.fostering.net/sites/www.fostering.net/files/public/resources/reports/update_cost_foster_care.pdf [accessed 25 July 2013].
Holmes, L., Westlake, D. & Ward, H. (2008) Calculating and comparing the costs of multidimensional treatment foster care, Report to the Department for Children, Schools and Families, Loughborough Centre for Child and Family Research, Loughborough University.
Holmes, L., McDermid, S. & Sempik, J. (2009) The costs of short break provision: report to the Department for Children, Schools and Families, Centre for Child and Family Research, Loughborough University.
Holmes, L., McDermid, S., Padley, M. & Soper, J. (2012) Exploration of the costs and impact of the Common Assessment Framework, Research Report DFE-RR210, Department for Education, London.
Holmes, L., Ward, H. & McDermid, S. (2012) Calculating and comparing the costs of multidimensional treatment foster care in English local authorities, Children and Youth Services Review, 34, 2141-2146
Hunter Human Capital (2012) Community pharmacist salary survey: 2012, http://www.hhcuk.com/hhc_salary_survey_2012_pharm.pdf [accessed 21 October 2013].
Imison, C., Buchan, J. & Xavier, S. (2009) NHS workforce planning, limitations and possibilities, King’s Fund, London, http://www.kingsfund.org.uk/sites/files/kf/NHS-Workforce-Planning-Candace-Imison-James-Buchan-Su-Xavier-Kings-Fund-November-2009.pdf [accessed 16 July 2013].
Information Centre (2006) New Consultant Contract: implementation survey, Health & Social Care Information Centre, London.
Information Centre (2007) 2006/07 UK general practice workload survey, Primary Care Statistics, Health & Social Care Information Centre, Leeds.
Information Centre (2008) Workforce summary – chiropody and podiatry, October 2008 – England Only, NHS Workforce Review Team, Health & Social Care Information Centre, Leeds.
Information Centre (2010) Community care statistics 2008, home care services for adults, England, Health & Social Care Information Centre, Leeds.
Ismail, K., Thomas, S., Maissi, E., Chalder, T., Schmidt, U., Bartlett, J., Patel, A., Dickens, C., Creed, F. & Treasure, J. (2010) A randomised controlled trial of cognitive behaviour therapy and motivational interviewing for people with Type 1 diabetes mellitus with persisitent sub-optimal glycaemic control, Health Technology Assessment, 14, 22.
Johnson, R., Jones, G., Wiles, N., Chaddock, C., Potter, R., Roberts, C., Symmons, D., Watson, P., Torgerson, D. & Macfarlane, G. (2007) Active exercise, education, and cognitive behavioral therapy for persistent disabling low back pain: a randomized controlled trial, Spine, 32, 15, 1578-1585.
Jones, K. (2005) The cost of providing home care, in L. Curtis & A. Netten (eds) Unit Costs of Health and Social Care 2005, Personal Social Services Research Unit, University of Kent, Canterbury.
Kavanagh, S., Schneider, J., Knapp, M., Beecham, J. & Netten, A. (1992) Elderly people with cognitive impairment: costing possible changes in the balance of care, PSSRU Discussion Paper 817/2, Personal Social Services Research Unit, University of Kent, Canterbury.
Kennedy, T., Jones, R., Darnley, S., Seed, P., Wessley, S. & Chalder, T. (2005) Cognitive behaviour therapy in addition to antispasmodic threatment for irritable bowel syndrome in primary care: randomised controlled trial, British Medical Journal, 331, 435.
268 Unit Costs of Health and Social Care 2013 Knapp, M., Romeo, R. & Beecham, J. (2007) The economic consequences of autism in the UK, report to the foundation for
people with learning disabilities, London. Knapp, M., Romeo, R. & Beecham, J. (2009) Economic cost of autism in the UK, Autism, 13, 3, May, 317-336. Knapp, M., McDaid, D. & Parsonage, M. (2011) Mental health promotion and mental illness prevention: the economic case,
Department of Health, London. www.lse.ac.uk/LSEHealthAndSocialCare/pdf/MHPP%20The%20Economic%20Case.pdf [accessed 25 July 2013].
Kubitschke, L. & Cullen, K. (2010) ICT & Ageing: European study on users, markets and technologies, Final Report, Commission of the European Communities, Brussels.
Kuipers, E., Fowler, D., Garety, P., Chisholm, D., Freeman, D., Dunn, G., Bebbington, P. & Hadley, C. (1998) London-East Anglia randomised controlled trial of cognitive-behavioural therapy for psychosis. III: Follow-up and economic evaluation at 18 months, British Journal of Psychiatry, 173, 61-68.
Kuyken, W., Byford, S., Taylor, R., Watkins, E., Holden, E., White, K., Barrett, B., Byng, R., Evans, A., Mullan, E. & Teasdale, J. (2008) Mindfulness-based cognitive therapy to prevent relapse in recurrent depression, Journal of Consulting & Clinical Psychology, 76, 966-978.
Laing & Buisson (2011) Care of elderly people: UK Market Survey 2012/2013, Laing & Buisson, London. Laing & Buisson (2011) Illustrative cost models in learning disabilities social care provision, Department of Health, London,
http://www.laingbuisson.co.uk/portals/1/media_packs/Fact_Sheets/Illustrative_Costs_PLD.pdf [accessed 11 July 2013]. Laing & Buisson (2011) 2010 Care homes complete data, London. Laing & Buisson (2012) Care of elderly people: UK Market Survey 2012/2013, Laing & Buisson, London. Laing & Buisson (2013) Councils rely on a 'hidden tax' on older care home residents,
http://www.laingbuisson.co.uk/MediaCentre/PressReleases/CareofElderly201213PressRelease.aspx [accessed 15 July 2013].
Lam, D., McCrone, P., Wright, K. & Kerr, N. (2005) Cost-effectiveness of relapse-prevention cognitive therapy for bipolar disorder: 30-month study, British Journal of Psychiatry, 186, 500-506.
Lamb, S., Hansen, Z., Lall, R., Castelnuovo, E., Withers, E., Nichols, V., Potter, R., Underwood, M. & Back Skills Training Trial investigators (2010) Group cognitive behavioural treatment for low-back pain in primary care: a randomised controlled trial and cost-effectiveness analysis, The Lancet, 375, 9718, 916-923.
Law, J., Zeng, B., Lindsay, G. & Beecham, J. (2012) Cost-effectiveness of interventions for children with speech, language and communication needs (SLCN): a review using the Drummond and Jefferson (1996) 'Referee's Checklist', International Journal of Language and Communication Disorders, 47, 5, 477-486.
Layard, R. (2006) The case for psychological treatment centres, British Medical Journal, 332, 7548, 1030-1032. Liddle, M. (1998) Wasted lives: counting the cost of juvenile offending, National Association for the Care and Resettlement
of Offenders (NACRO), London. Lingard, J. & Milne, A. (2004) Commissioned by the children, older people & social care policy directorate, Integrating Older
People’s Mental Health Services, Community Mental Health Teams for Older People, http://nmhdu.org.uk/silo/files/integrating-opmh-services.pdf [accessed 10 September 2013].
Lloyds Banking Group (2013) Halifax house price index, http://www.lloydsbankinggroup.com/media/pdfs/halifax/2013/060913_HPI.pdf [accessed 14 October 2013].
Local Government Association Analysis and Research (2008) Local government earnings survey 2007, Local Government Analysis and Research, London.
Local Government Association Analysis and Research (2010) Local government earnings survey, England 2009, Local Government Association, London.
Local Government Association Analysis and Research (2012) Local government earnings survey 2012/2013, Local Government Association, London.
Local Government Association (2012) Local government workforce survey 2010/11, http://www.local.gov.uk/local-government-intelligence/-/journal_content/56/10180/3328402/ARTICLE/ [accessed 25 July 2013].
Local Government Employers (2010) Local government sickness absence levels and causes survey 2008-2009, Local Government Association, London.
Local Government Employers (2012) Green Book: national agreement on pay and conditions of service, Local Government Association, London, http://www.lge.gov.uk/lge/core/page.do?pageId=119175/ [accessed 25 July 2013].
Lowson, K., Lowson, P. & Duffy, S. (2007) Independent review of palliative care services for children and young people: economic study, Final Report, York Health Economics Consortium, Department of Health Independent Review Team, London.

Unit Costs of Health and Social Care 2013 269 Mahon, J. (2008) Towards the new children in need census, York Consulting,
http://www.education.gov.uk/research/data/uploadfiles/DCSF-RW039.pdf [accessed 25 July 2013]. Mansell, J., Knapp, M., Beadle-Brown, J. & Beecham, J. (2007) Deinstitutionalisation and community living – outcomes and
costs: report of a European study, Volume 2: Main Report, Tizard Centre, University of Kent, Canterbury. Mansell, J., Knapp, M., Beadle-Brown, J. & Beecham, J. (2007) Deinstitutionalisation and community living – outcomes and
costs: report of a European study, Country Report: United Kingdom, Tizard Centre, University of Kent, Canterbury. Matrix Evidence & Bazian (2008) Prioritising investments in public health, Department of Health, London. McCrone, P., Ridsdale, L., Darbishire, L. & Seed, P. (2004) Cost-effectiveness of cognitive behavioural therapy, graded
exercise and usual care for patients with chronic fatigue in primary care, Psychological Medicine, 34, 991-999. McCrone, P., Knapp, M., Proudfoot, J., Ryden, C., Cavanagh, K., Shapiro, D., Ilson, S., Gray, J., Goldberg, D., Mann, A., Marks,
I., Everitt, B. & Tylee, A. (2004) Cost-effectiveness of computerised cognitive-behavioural therapy for anxiety and depression in primary care: randomised controlled trial, British Journal of Psychiatry, 185, 55-62.
McCrone, P., Weeramanthri, T., Knapp, M., Rushton, A., Trowell, J., Miles, G. & Kolvin, I. (2005) Cost-effectiveness of individual versus group psychotherapy for sexually abused girls, Child and Adolescent Mental Health, 10, 26-31.
McCrone, P., Dhanasiri, S., Patel, A., Knapp, M. & Lawton-Smith, S. (2008) Paying the price: the cost of mental health care in England to 2026, King’s Fund, London.
McCrone, P., Knapp, M., Kennedy, T., Seed, P., Jones, R., Darnley, S. & Chalder, T. (2008) Cost-effectiveness of cognitive behavioural therapy in addition to mebeverine for irritable bowel syndrome, European Journal of Gastroenterology and Hepatology, 20, 4, 255-263.
McCrone, P., Sharpe, M., Chalder, T., Knapp, M., Johnson, A., Goldsmith, K. & White, P. (2012) Adaptive pacing, cognitive behaviour therapy, graded exercise, and specialist medical care for chronic fatigue syndrome: a cost-effectiveness analysis, PLoS ONE [Electronic Resource], 7, 8, e40808.
McDermid, S. & Holmes, L. (2013) The cost effectiveness of action for children’s intensive family support services, Final Report, Centre for Child and Family Research, Loughborough University. http://socialwelfare.bl.uk/subject-areas/services-client-groups/families/actionforchildren/153741intensive-family-support-cost-effectiveness_full-report.pdf [accessed 3 October 2013].
McGurk, S. & Mueser, K. (2004) Cognitive functioning, symptoms and work in supported employment: a review and heuristic model, Schizophrenia Research, 70, 147-174.
McIntosh, E. & Barlow, J. (2006) The costs of an intensive home visiting intervention for vulnerable families, in A. Netten & L. Curtis (eds) Unit Costs of Health and Social Care 2006, PSSRU, University of Kent, Canterbury.
Mental Health Strategies (2009) 2008/09 National survey of investment in adult mental health services, Mental Health Strategies for the Department of Health, London.
Mickelborough, P. (2011) Domiciliary care, UK market report, Laing & Buisson, London. Mooney, A., Statham, J., Knight, A. & Holmes, L. (2012) Understanding the market for secure children’s homes, Summary
Report, A rapid response study for the Department for Education, Childhood Wellbeing Research Centre, Loughborough.
National Audit Office (2009) NHS pay modernisation in England: Agenda for Change, The Stationery Office, London. National Audit Office (2010) NHS (England) summarised accounts 2009-2010, The Stationery Office, London. National Audit Office (2011) Transforming NHS ambulance services, http://www.nao.org.uk/wp-
content/uploads/2011/06/n10121086.pdf [accessed 11 July, 2013]. National Health Service (2008) Modernising medical careers, National Health Service, London. National Health Service (2012) Specialised services national definitions set,
http://www.specialisedservices.nhs.uk/info/specialised-services-national-definitions/ [accessed 25 July 2013]. National Institute for Health and Clinical Excellence (NICE) (2007) Commissioning a memory assessment service for the early
identification and care of people with dementia, http://www.nice.org.uk/Search.do?searchText=Commissioning+a+memory+assessment+service+for+the+early+identification+and+care+of+people+with+dementia&newsearch=true#/search/?reload [accessed 25 July 2013].
National Institute for Health and Clinical Excellence (NICE) (2007) Parent-training/education programmes in the management of children with conduct disorders, National Institute for Health and Clinical Excellence, London.
National Institute for Health and Clinical Excellence (NICE) (2008) Cognitive behavioural therapy for the management of common mental health problems: commissioning guide, NICE, London.
National Treatment Agency for Substance Misuse (2009) Annual Report, 2008/09, http://www.nta.nhs.uk/uploads/nta_annual_report_08-09_2.pdf [accessed 25 July 2013].

270 Unit Costs of Health and Social Care 2013 National Treatment Agency for Substance Misuse (2010) NDTMS dataset G, definition, business definition for adult drug
treatment providers. http://www.nta.nhs.uk/uploads/yptreatmentbusinessdefinitionv7.05.pdf [accessed 25 July 2013]. National Union of Students (2013) What are the costs of study and living? http://www.nus.org.uk/en/advice/money-and-
funding/info-and-advice/average-costs-of-living-and-study/ [accessed 15 July 2013]. Naylor, A. & Appleby, J. (2012) Sustainable health and social care: connecting environmental and financial performance.
King’s Fund, London, http://www.kingsfund.org.uk/publications/sustainable-health-and-social-care/ [accessed 15 July 2013].
Neil, E., Cossar, J., Lorgelly, P. & Young, J.( 2010) Helping birth families: a study of service provision, costs and outcomes, http://www.adoptionresearchinitiative.org.uk/study5.html [accessed 25 July 2013].
Netten, A. (1992) Some cost implications of caring for people, Interim Report, PSSRU Discussion Paper 809/4, Personal Social Services Research Unit, University of Kent, Canterbury.
Netten, A. (1999) Family support workers: costs of services and informal care, PSSRU Discussion Paper 1634, Personal Social Services Research Unit, University of Kent, Canterbury.
Netten, A. & Knight, J. (1999) Annuitizing the human capital investment costs of health service professionals, Health Economics, 8, 245-255.
Netten, A., Bebbington, A., Darton, R., Forder, J. & Miles, K. (1998) Cross-sectional survey of residential and nursing homes for elderly people, PSSRU Discussion Paper 1423, Personal Social Services Research Unit, University of Kent, Canterbury.
Netten, A., Dennett, J. & Knight, J (1998) Unit Costs of Health and Social Care 1998, Personal Social Services Research Unit, University of Kent, Canterbury.
Netten, A., Knight, J., Dennett, J., Cooley, R. & Slight, A. (1998) Development of a ready reckoner for staff costs in the NHS, Vols 1 & 2, Personal Social Services Research Unit, University of Kent, Canterbury.
Netten, A., Knight, J., Dennett, J., Cooley, R. & Slight, A. (1998) A ready reckoner for staff costs in the NHS, Vol 2. Methodology, Personal Social Services Research Unit, University of Kent, Canterbury.
Netten, A., Dennett, J. & Knight, J. (1999) Unit Costs of Health and Social Care 1999, Personal Social Services Research Unit, University of Kent, Canterbury.
NHS Careers (2011) Clinical support staff, National Health Service, London. http://www.nhscareers.nhs.uk/explore-by-career/wider-healthcare-team/careers-in-the-wider-healthcare-team/clinical-support-staff/ [accessed 10 September 2013].
NHS Employers (2003) General medical services contract, NHS Employers, London. NHS Employers (2005) Agenda for Change, NHS terms and conditions of service handbook, NHS Employers, London. NHS Employers (2006) Junior doctors’ terms & conditions of service, NHS Employers, London. NHS Employers (2006) Modernising medical careers: a new era in medical training, NHS Employers, London. NHS Employers (2006) Pay circular (AfC) 1/2006. Pay and conditions for NHS staff covered by the Agenda for Change
agreement, NHS Employers, London. NHS Employers (2008) Terms and conditions of service for specialty doctors – England (2008), NHS Employers, London. NHS Employers (2010) The community pharmacy – a guide for general practitioners and practice staff,
http://www.nhsemployers.org/Aboutus/Publications/Pages/Community-pharmacy-guide-GPs-practice-staff.aspx [accessed 3 October 2013].
NHS Employers (2011) Specialty and associate specialist contracts, British Medical Association, London. http://www.nhsemployers.org/Aboutus/Publications/Documents/FAQs-Specialty-and-Associate-Specialist-Contracts.pdf [accessed 25 July 2013].
NHS Employers (2012) Current mileage allowances, http://www.nhsemployers.org/payandcontracts/agendaforchange/pages/payrates.aspx [accessed 10 September 2013].
NHS Health & Social Care Information Centre & Social Care Team (2010) Survey of carers in households 2009/10, The Health & Social Care Information Centre. http://www.hscic.gov.uk/pubs/carersurvey0910 [accessed 10 September 2013].
NHS Stoke-on-Trent (2011) “Florence” the simple telehealth service, NHS Stoke-on-Trent, http://www.networks.nhs.uk/nhs-networks/simple-telehealth/documents/STH%20DS01%20-%20Patient%20v1%20draft%2009.pdf [accessed 19 July 2013].
Nihira, K., Leland, H. & Lambert, N. (1993) Adaptive behavior scale — residential and community, 2nd edition, Pro-Ed, Austin, Texas.
North West Public Health Observatory (2011) A review of the cost-effectiveness of individual level behaviour change interventions, Health and Wellbeing Alliance, Manchester. www.champspublichealth.com/writedir/0c65health_choices%20-%20FINAL.pdf [accessed 25 July 2013].

Unit Costs of Health and Social Care 2013 271 Noyes, J., Hain, R., Tudor Edwards, R., Spencer, L., Bennett, V., Hobson, L., & Thompson, A. (2010) My choices project
report, Bangor University, CRC Cymru, Cardiff University School of Medicine, N Warwickshire PCT, Royal College of Paediatrics and Child Health, Public Health Wales NHS Trust, Bath and NE Somerset PCT. http://www.bangor.ac.uk/healthcaresciences/research/My%20Choices%20Project%20Report%20-%2022-09-2011.pdf [accessed 25 July 2013].
Office for National Statistics (2007) Family spending 2007 edition, Office for National Statistics, London, http://www.ons.gov.uk/ons/rel/family-spending/family-spending/2007-edition/index.html [accessed 10 September 2013].
Office for National Statistics (2009) Family spending, 2008, Office for National Statistics, London, http://www.statistics.gov.uk/ [accessed 25 July 2013].
Office for National Statistics (2011) Family spending 2011 edition, Office for National Statistics, London, available at http://www.ons.gov.uk/ons/rel/family-spending/family-spending/family-spending-2011-edition/index.html [accessed 10 September 2013].
Ofsted (2008) Children on bullying, Ofsted, http://www.ofsted.gov.uk/resources/children-bullying/ [accessed 25 July 2013]. Ofsted (2013) Official statistics: children's social care inspections and outcomes,
http://www.ofsted.gov.uk/resources/official-statistics-childrens-social-care-inspections-and-outcomes/ [accessed 15 July 2013].
Onyett, S., Linde, K., Glover, G., Floyd, S., Bradley, S. & Middleton, H. (2007) Crisis resolution and inpatient mental health care in England, University of Durham.
Palmer, S., Davidson, K., Tyrer, P., Gumley, A., Tata, P., Norrie, J., Murray, H. & Seivewright, H. (2006) The cost-effectiveness of cognitive behavior therapy for borderline personality disorder: results from the BOSCOT trial, Journal of Personality Disorders, 20, 5, 466-481.
Patel, A., Maissi, E., Chang, H., Rodrigues, I., Smith, M., Thomas, S., Chalder, T., Schmidt, U., Treasure, J. & Ismail, K. (2011) Motivational enhancement therapy with and without cognitive behaviour therapy for Type 1 diabetes: economic evaluation from a randomized controlled trial, Diabetic Medicine, 28, 4, 470-479.
Pollard, A., Taylor, T., Fleming, L., Stahl-Timmins, W., Depledge, M. & Osborne N. (2012) Mainstreaming carbon management in healthcare systems: A bottom-up modeling approach, Environmental Science & Technology, 47, 2, 678-686.
PricewaterhouseCoopers LLP (2011) Cost of service inquiry for community pharmacy, Department of Health & Pharmaceutical Services Negotiating Committee, London. http://www.pwc.co.uk/assets/pdf/cost-of-service-inquiry-for-community-pharmacy-appendices.pdf [accessed 10 September 2013].
Reilly, S., Venables, D., Challis, D., Hughes, J. & Abendstern, M. (2004) Day care services for older people with dementia in the north west of England, Personal Social Services Research Unit, Manchester University, Manchester.
Rentright (2009) Average price for England, http://www.rentright.co.uk/country/england/3_rrpi.aspx [accessed 25 July 2013].
Richardson, G., Gravelle, H., Weatherly, H. & Richie, G. (2005) Cost-effectiveness of interventions to support self-care: a systematic review, International Journal of Technology Assessment in Health Care, 21, 4, 423-432.
Richardson, G., Kennedy, A., Reeves, D., Bower, P., Lee, V., Middleton, E., Gardner, C., Gately, C. & Rogers, A. (2008) Cost-effectiveness of the Expert Patients Programme (EPP) for patients with chronic conditions, Journal of Epidemiology and Community Health, 62, 361-367.
Romeo, R., Knapp, M., Banerjee, S., Morris, J., Baldwin, R., Tarrier, N., Pendleton, N., Horan, M. & Burns, A. (2011) Treatment and prevention of depression after surgery for hip fracture in older people: cost-effectiveness analysis, Journal of Affective Disorders, 128, 3, 211-219.
Royal College of Psychiatrists (2003) Workload and working patterns in consultant psychiatrists, College Research Unit, Royal College of Psychiatrists, London.
Sainsbury Centre for Mental Health (2001) Mental health topics, assertive outreach, Sainsbury Centre for Mental Health (updated 2003), London.
Sainsbury Centre for Mental Health (2001) Mental health topics, crisis resolution, Sainsbury Centre for Mental Health, London.
Sainsbury Centre for Mental Health (2003) A window of opportunity: a practical guide for developing early intervention in Psychosis Services, Briefing 23, Sainsbury Centre for Mental Health, London.
Sainsbury Centre for Mental Health (2004) Post-graduate certificate in early intervention for psychosis, Sainsbury Centre for Mental Health, London.

272 Unit Costs of Health and Social Care 2013 Salford City Council (2011) Mental health, Salford City Council. www.salford.gov.uk/mh-partnership.htm [accessed 9
October 2013]. Sanders, C., Rogers, A., Bowen, R., Bower, P., Hirani, S. Cartwright, M., Fitzpatrick, R., Knapp, M., Barlow, J., Hendy, J.,
Chrysanthaki, T., Bardsley, M. & Newman, S. (2012) Exploring barriers to participation and adoption of telehealth and telecare within the Whole Systems Demonstrator trial: a qualitative study, BMC Health Services Research, 12, 220.
Schmidt, U., Lee, S., Beecham, J., Perkins, S., Treasure, J., Yi, I., Winn, S., Robinson, P., Murphy, R., Keville, S., Johnson-Sabine, E., Jenkins, M., Frost, S., Dodge, L., Berelowitz, M. & Eisler, I. (2007) A randomized controlled trial of family therapy and cognitive behavior therapy guided self-care for adolescents with bulimia nervosa and related disorders, American Journal of Psychiatry, 164, 4, 591-598.
Schneider, J., Boyce, M., Johnson, R., Secker, J., Grove, B. & Floyd, M. (2009) Impact of supported employment on service costs and income of people, Journal of Mental Health, 18, 6, 533-542.
Seivewright, H., Green, J., Salkovskis, P., Barrett, B., Nur, U. & Tyrer, P. (2008) Cognitive-behavioural therapy for health anxiety in a genitourinary medicine clinic: randomised controlled trial, British Journal of Psychiatry, 193, 332-337.
Selwyn, J. & Sempik, J. (2011) Recruiting adoptive families: the costs of family finding and the failure of the inter-agency fee, British Journal of Social Work, 41, 415-431.
Selwyn, J., Sturgess, W., Quinton, D. & Baxter, C. (2003) Costs and outcomes of non-infant adoptions, report to the Department of Health, Hadley Centre for Adoption and Foster Care Studies, University of Bristol.
Selwyn, J., Sempik, J., Thurston, P. & Wijedasa, D. (2009) Adoption and the inter-agency fee, University of Bristol, Bristol. Sesami Research and Practice Partnership (2007) The SESAMI evaluation of employment support in the UK: background
and baseline data, Journal of Mental Health, 16, 3, 375-388. Shah, A., Pennington, M., Heginbotham, C. & Donaldson, C. (2011) Deprivation of liberty safeguards in England:
implementation costs, British Journal of Psychiatry, 199, 232-238, doi:10.1192/bjp.bp.110.089474. Sharac, J., McCrone, P., Rushton, A. & Monck, E. (2011) Enhancing adoptive parenting: a cost-effectiveness analysis, Child
and Adolescent Mental Health, 16, 2, 110-115. Simpson, S., Corney, R., Fitzgerald, P. & Beecham, J. (2000) A randomised controlled trial to evaluate the efficacy and cost-
effectiveness of counselling with patients with chronic depression, report to the NHS Health Technology Assessment Programme, 4, 36.
Skills for Care (2012) The national minimum dataset for social care (NMDS-SC) and data protection: guidance for employers, Skills for Care. www.nmds-sc-online.org.uk/help/Article.aspx?id=22 [accessed 25 July 2013].
Sloper, P., Beecham, J., Clarke, S., Franklin, A., Moran, N. & Cusworth, L. (2010) Models of multi-agency services for disabled young people and those with complex health needs: impact and costs, Social Policy Research Unit, University of York & PSSRU, Kent.
Smit, F., Willemse, P., Meulenbeek, M., Koopmanschap, A., van Balkom, P., Spinhoven, P. & Cuijpers (2009) Preventing panic disorder: cost-effectiveness analysis alongside a pragmatic randomised trial, Cost Effectiveness Resource Allocation, 7, 8.
Smith, A., Tennison, I., Roberts, I., Cairns, J. & Free, C. (2013) The carbon footprint of behavioural support services for smoking cessation, Tobacco Control, http://tobaccocontrol.bmj.com/content/early/2013/03/11/tobaccocontrol-2012-050672.abstract/ [accessed 15 July 2013].
Starr, M. (2012) Nottingham case study: the carbon impact of mental health services, http://sustainablehealthcare.org.uk/knowledge/ [accessed 15 July 2013].
Startup, M., Jackson, M., Evans, K. & Bendix, S. (2005) North Wales randomized controlled trial of cognitive behaviour therapy for acute schizophrenia spectrum disorders: two-year follow-up and economic evaluation, Psychological Medicine, 35, 9, 1307-1316.
Steventon, A., Bardsley, M., Billings, J., Dixon, J., Doll, H., Beynon, M., Hirani, S., Cartwright, M., Rixon, L., Knapp, M., Henderson, C., Rogers, A., Hendy, J., Fitzpatrick, R. & Newman, S. (2012) Effect of telehealth on use of secondary care and mortality: findings from the Whole System Demonstrator cluster randomised trial, British Medical Journal, 344, e3874.
Steventon, A., Bardsley, M., Billings, J., Dixon, J. Doll, H., Beynon, M., Hirani, S., Cartwright, M., Rixon, L., Knapp, M., Henderson, C., Rogers, A., Hendy, J., Fitzpatrick, R. & Newman, S. (2013) Effect of telecare on use of health and social care services: findings from the Whole Systems Demonstrator cluster randomised trial, Age and Ageing, doi:10.1093/ageing/aft008.

Unit Costs of Health and Social Care 2013 273 Stoddart, A., Hanley, J., Wild, S., Pagliari, C., Paterson, M., Lewis, S., Sheikh, A., Krishan, A., Padfield, P. & McKinstry, B.
(2013) Telemonitoring-based service redesign for the management of uncontrolled hypertension (HITS): cost and cost-effectiveness analysis of a randomised controlled trial, British Medical Journal Open, 3.
Sustainable Development Unit (2009) Saving carbon, improving health, SDU, Cambridge, http://www.sdu.nhs.uk/documents/publications/1237308334_qylG_saving_carbon,_improving_health_nhs_carbon_reducti.pdf [accessed 16 July 2013].
Sustainable Development Unit (2010) Saving money by saving carbon, SDU, Cambridge, http://www.sdu.nhs.uk/documents/publications/Savemoney1.1.pdf [accessed 16 July 2013].
Sustainable Development Unit (2012) NHS England carbon footprint update, SDU, Cambridge, http://www.sdu.nhs.uk/documents/resources/Carbon_Footprint_Published_2012.pdf [accessed 16 July 2013].
Sustainable Development Unit (2012) Goods and services carbon hotspots – full report, SDU, Cambridge, http://www.sdu.nhs.uk/documents/resources/Hotspot_full.pdf [accessed 16 July 2013].
Tennison, I. (2010) Indicative carbon emissions per unit healthcare activity, Eastern Region Public Health Observatory, 2010, http://www.erpho.org.uk/viewResource.aspx?id=20967/ [accessed 16 July 2013].
Thomas, C. (2013) Adoption for looked after children: messages from research, British Association for Adoption & Fostering (BAAF).
Thornicroft, G. (2006) Shunned: discrimination against people with mental illness, Oxford University Press, Oxford. Thurley, D. (2011) Local government pension scheme, 2010 onwards, House of Commons, London. Tidmarsh, J. & Schneider, J. (2005) Typical costs of Sure Start local programmes, in L. Curtis (ed.) Unit Costs of Health and
Social Care 2005, Personal Social Services Research Unit, University of Kent, Canterbury. Turner-Stokes, L. (2010) Specialist neuro-rehabilitation services: providing for patients with complex rehabilitation needs,
British Society of Rehabilitation Medicine http://www.bsrm.co.uk/ClinicalGuidance/Levels_of_specialisation_in_rehabilitation_services5.pdf [accessed 25 July 2013].
Turner-Stokes, L., Bill, A. & Dredge, R. (2012) A cost analysis of specialist inpatient neurorehabilitation services in the UK, Clinical Rehabilitation, 26, 3, 256-263, http://cre.sagepub.com/content/26/3/256 [accessed 25 July 2013].
Turner-Stokes, L., Sutch, S. & Dredge, R. (2012) Healthcare tariffs for specialist inpatient neurorehabilitation services: rationale and development of a UK casemix and costing methodology, Clinical Rehabilitation, 26, 3, 264-79. doi:10.1177/0269215511417467, http://cre.sagepub.com/content/26/3/264/[accessed 25 July 2013].
United Kingdom Home Care Association (UKHCA) (2012) An overview of the UK domiciliary care sector, Home Care Association Limited.
van der Gaag, M., Stant, A., Wolters, K., Buskens, E. & Wiersma, D. (2011) Cognitive-behavioural therapy for persistent and recurrent psychosis in people with schizophrenia-spectrum disorder: cost-effectiveness analysis, British Journal of Psychiatry, 198, 1, 59-65, sup 51.
Venning, P., Durie, A., Roland, M., Roberts, C. & Leese, B. (2000) Randomised controlled trial comparing cost effectiveness of general practitioners and nurse practitioners in primary care, British Medical Journal, 320, 1048-1053.
Walker, S., Griffin, S., Claxton, K., Palmer, S. & Sculpher, M. (2012) Appropriate perspectives for health care decisions, in L. Curtis (ed.) Unit Costs of Health and Social Care 2012, PSSRU, University of Kent, http://www.pssru.ac.uk/project-pages/unit-costs/2012/ [accessed 16 July 2013].
Ward, H., Holmes, L. & Soper, J. (2008) Costs and consequences of placing children in care, Jessica Kingsley, London. Webster-Stratton, C. & Hancock, L. (1998) Training for parents of young children with conduct problems: content, methods
and therapeutic processes, in C.E. Schaefer & J.M. Briesmeister (eds) Handbook of parent training, Vol. 9, September, John Wiley, New York.
Weinberg, A., Williamson, J., Challis, D. & Hughes, J. (2003) What do care managers do? A study of working practice in older people’s services, British Journal of Social Work, 33, 901-919.
White, P., Goldsmith, K., Johnson, A., Potts, L., Walwyn, R., DeCesare, J., Baber, H., Burgess, M., Clark, L., Cox, D., Bavinton, J., Angus, B., Murphy, G., Murphy, M., O'Dowd, H., Wilks, D., McCrone, P., Chalder, T. & Sharpe, M. (2005) Comparison of adaptive pacing therapy, cognitive behaviour therapy, graded exercise therapy, and specialist medical care for chronic fatigue syndrome (PACE): a randomised trial, The Lancet, 377, 9768, 823-836.
Winters, L., Armitage, M., Stansfield, J. Scott-Samuel & Farrar, A. (2010) Wellness services – evidence based review and examples of good practice, Final Report, Liverpool Public Health Observatory.

274 Unit Costs of Health and Social Care 2013 Wittenberg, R., Hu, B., Hancock, R., Morciano, M., Comas-Herrera, A., Malley, J. & King, D. (2011) Projections of demand for
and costs of social care for older people in England, 2010 to 2030, under current and alternative funding systems, PSSRU, London.
Wright, C., Burns, T., James, P., Billings, J., Johnson, S., Muijen, M., Priebe, S., Ryrie, I., Watts, J. & White, I. (2003) Assertive outreach teams in London: models of operation, British Journal of Psychiatry, 183, 2, 132-138.
YoungMinds (2001) Guidance for primary care trusts, child and adolescent mental health: it’s importance and how to commission a comprehensive service, Appendix 3: Key Components, professionals and functions of tiered child and adolescent mental health services, Child and Adolescent Mental Health Services, http://www.youngminds.org.uk/pctguidance/app3.php [accessed 25 July 2013].

Unit Costs of Health and Social Care 2013 275
21. Index of references Allen, C., 30, 261 Appleby, J., 14, 30, 261, 270 Association of Directors of Children’s Services Ltd, 25,
261 Audit Commission, 7, 52, 53, 58, 69, 93, 111, 112, 175,
176, 177, 178, 179, 180, 183, 184, 185, 186, 187, 189, 207, 208, 209, 210, 211, 212, 213, 214, 215, 223, 224, 225, 226, 227, 228, 229, 233, 234, 235, 236, 237, 241, 242, 243, 244, 245, 246, 247, 261
Baginsky, M., 197, 198, 199, 261 Ball, J., 189, 261 Baqir, W., 180, 261 Barlow, J., 30, 150, 261, 269 Barrett, B., 69, 138, 139, 261 Barton, G., 19, 261 Barton, P., 43, 261 Baumann, M., 43, 261 Bayer, S., 30, 261 Beck, A., 19, 261 Beck, J., 19, 261 Bedfordshire Police, 147, 261 Beecham, J., 30, 73, 74, 75, 91, 99, 148, 152, 165, 261 Beresford, B., 7, 104, 262 Bollington, L., 228, 262 Bond, G.R., 55, 262 Bonin, E., 7, 96, 102, 262 Bower, P., 30, 262 British Association for Counselling and Psychotherapy,
54, 262 British Association of Social Workers, 197, 198, 199, 262 British Medical Association, 244, 262 Building Cost Information Service, 7, 39, 40, 44, 48, 49,
50, 51, 52, 53, 54, 58, 76, 79, 80, 81, 86, 87, 111, 175, 176, 177, 178, 179, 180, 183, 184, 185, 186, 187, 188, 189, 190, 197, 198, 199, 200, 201, 203, 204, 207, 208, 209, 210, 211, 212, 213, 214, 215, 223, 224, 225, 226, 227, 228, 229, 233, 234, 235, 236, 237, 241, 242, 243, 244, 245, 246, 247, 251, 262
Burns, T., 55, 262 Butler, S., 93, 262 Byford, S., 19, 262 Care Services Improvement Partnership, 207, 208, 209,
210, 211, 262 Cartwright, M., 30, 262 Child Health CAMHS and Maternity Mapping, 212, 213 Chisholm, D., 19, 263 Cochrane, H., 166, 263, 280 Connor, A., 14, 263 Consumer Focus, 7, 109, 263 Cottrell, E., 30, 263 County Durham and Tees Valley, 183, 185, 187, 263 Craft, A., 166, 263 Crossroads Counselling Practice, 54 Cullen, K., 31, 268 Curtis, L., 7, 19, 30, 41, 42, 97, 110, 114, 149, 150, 156,
189, 197, 198, 199, 263 Dance, C., 95, 263 Darton, R., 41, 125, 126, 127, 128, 129, 263 Department for Business, Innovation & Skills, 7, 263
Department for Children, Schools and Families, 97, 99, 263
Department for Communities and Local Government, 128
Department for Education, 7, 25, 86, 87, 88, 94, 144, 145, 157, 158, 159, 160, 161, 258, 264
Department for Education and Skills, 88, 90, 264, 265 Department for Work and Pensions, 73, 74, 75, 130, 264 Department of Health, 7, 19, 30, 37, 39, 44, 47, 48, 53,
55, 68, 69, 85, 107, 113, 115, 144, 166, 175, 176, 177, 178, 179, 180, 183, 184, 185, 186, 187, 188, 189, 190, 192, 201, 207, 208, 209, 210, 211, 212, 213, 214, 215, 223, 224, 225, 226, 227, 228, 229, 233, 234, 235, 236, 237, 241, 242, 243, 244, 245, 246, 247, 251, 263, 264, 265, 268
Directgov, 211, 265 Durham University, 212, 213, 214, 215, 265 Edwards, R.T., 101, 265 Ekers, D., 53, 265 Expert Patients Programme Community Interest
Company, 113, 265 Felce, D., 73, 74, 75, 265 Forder, J., 7, 135, 265 Fostering Network, 8, 157, 162, 265 France, A., 100, 265 Georghiou, T., 8, 120, 265 Gershon, P., 25, 265 Glendinning, C., 8, 114, 130, 197, 198, 199, 200, 201,
202, 203, 204, 265 Goodyer, I., 52, 265 Graves, N., 19, 265 Greco, V., 91, 265 Haines, A., 14, 265 Hammond, G., 19, 266 Hancock, L., 101, 273 Hann, M., 190, 266 Hazeldine, T., 14, 266 Health & Social Care Information Centre, 8, 37, 38, 39,
40, 44, 48, 49, 50, 51, 54, 69, 76, 79, 80, 81, 111, 125, 126, 127, 128, 129, 130, 175, 176, 177, 178, 179, 183, 184, 186, 187, 188, 189, 190, 192, 202, 207, 208, 209, 210, 211, 223, 226, 228, 229, 233, 234, 235, 236, 237, 241, 242, 243, 244, 245, 246, 247, 256, 266, 267
Health and Social Care Act (2012), 8, 266 Healthcare Finance, 8, 266 Henderson, C., 30, 266 Hendy, J., 31, 266 Higgins, S., 189, 266 Higher Education Funding Council for England (HEFCE), 8,
266 Hippisley-Cox, J., 191, 192, 267 HM Government, 8, 14, 267 Hollinghurst, S., 19, 267 Holmes, L., 8, 88, 97, 98, 99, 148, 152, 156, 157, 162,
204, 267, 269 Hunter Human Capital, 180, 267 Imison, C., 8, 267 Ismail, K., 19, 267 John, D., 228, 262

276 Unit Costs of Health and Social Care 2013 Johnson, R., 19, 267 Jones, A., 98, 267 Jones, K., 114, 202, 267 Kavanagh, S., 37, 38, 267 Kennedy, T., 19, 267 Killen, S., 166, 263 Knapp, M., 59, 73, 74, 75, 138, 140, 141, 142, 261, 268 Knight, J., 8, 270 Kubitschke, L., 31, 268 Kuipers, E., 19, 268 Kuyken, W., 19, 58, 268 Laing & Buisson, 8, 37, 38, 39, 136, 137, 257, 268 Lam, D.,, 19, 268 Lamb, S., 19, 268 Law, J., 85, 268 Layard, R., 19, 268 Liddle, M., 146, 268 Lingard, J., 207, 268 Lloyds Banking Group, 129, 268 Local Government Association, 197, 198, 199, 200, 201,
202, 203, 204, 268 Local Government Association Analysis and Research,
197, 198, 199, 200, 201, 204, 268 Local Government Employers, 197, 198, 199, 200, 201,
202, 203, 204, 268 Lowson, K., 166, 268 Mahon, J., 89, 269 Mansell, J., 73, 74, 75, 269 Matrix Evidence, 115, 269 McCrone, P., 19, 20, 209, 210, 211, 269 McDermid, S., 8, 99, 148, 152, 156, 157, 162, 204, 267,
269 McGurk, S., 55, 269 McIntosh, E., 150, 269 Mental Health Strategies, 207, 208, 209, 210, 211, 262,
269 Mickelborough, P., 202, 269 Milne, A., 207, 268 Mooney, A., 86, 269 Mueser, K., 55, 269 National Audit Office, 8, 107, 269 National Health Service, 241, 242, 243, 244, 269 National Institute for Health and Clinical Excellence
(NICE), 20, 44, 59, 102, 115, 269 National Treatment Agency for Substance Misuse, 65, 66,
67, 68, 269, 270 National Union of Students, 8, 270 Naylor, A., 14, 270 Neil, E., 95, 96, 270 Netten, A., 7, 8, 53, 69, 110, 125, 127, 175, 176, 177, 180,
183, 184, 185, 186, 188, 189, 190, 192, 197, 198, 199, 201, 223, 224, 225, 226, 227, 228, 233, 234, 235, 236, 241, 242, 243, 244, 245, 246, 247, 263, 270
NHS Careers, 53, 54, 58, 69, 93, 175, 176, 177, 178, 179, 180, 183, 184, 185, 186, 187, 188, 189, 207, 208, 209, 210, 211, 212, 213, 214, 215, 223, 224, 225, 226, 227, 228, 229, 233, 234, 235, 236, 237, 241, 242, 243, 244, 245, 246, 247, 270
NHS Employers, 54, 175, 176, 177, 178, 179, 180, 183, 184, 185, 186, 187, 188, 192, 223, 224, 225, 226, 228, 229, 243, 270
NHS Information Centre & Social Care Team, 270 NHS Stoke-on-Trent, 31 Nihira, K., 73, 74, 75, 270 North West Public Health Observatory, 115, 270 Noyes, J., 92, 271 Office for National Statistics, 41, 125, 126, 127, 128, 129,
252, 271 Ofsted, 25, 60, 271 Onyett, S., 209, 271 Palmer, S., 20, 271 Patel, A., 20, 271 Pollard, A., 14, 271 PricewaterhouseCoopers, 180, 271 Reilly, S., 40, 50, 51, 271 Rentright, 130, 271 Richardson, G., 113, 271 Romeo, R., 20, 271 Royal College of Psychiatrists, 247, 271 Sainsbury Centre for Mental Health, 209, 210, 211, 271 Salford City Council, 50, 51, 272 Sanders, C., 31, 272 Schmidt, U., 20, 272 Schneider, J., 55, 149, 151, 154, 272, 273 Seivewright, 20, 272 Selwyn, J., 94, 95, 96, 144, 145, 147, 197, 198, 199, 200,
201, 202, 203, 204, 272 Sempik, J., 94, 272 Sesami Research and Practice Partnership, 55, 272 Shah, A., 57, 272 Sharac, J., 96, 272 Simpson, S., 54, 272 Skills for Care, 202, 203, 272 Sloper, P., 216, 272 Smit, F., 20, 272 Smith, A., 14, 272 Soper, J., 88, 267 Starr, M., 14, 272 Startup, M., 20, 272 Steventon, A., 31, 272 Stoddart, A., 31, 273 Sustainable Development Unit, 14, 273 Tennison, I., 15, 273 Thomas, C., 94, 273 Thornicroft, G., 55, 273 Thurley, D., 197, 198, 199, 200, 201, 202, 203, 204, 273 Tidmarsh, J., 149, 151, 154, 273 Turner-Stokes, L., 117, 119, 273 United Kingdom Home Care Association (UKHCA), 202,
273 van der Gaag, M., 20, 273 Venning, P., 189, 273 Walker, S., 15, 273 Ward, H., 8, 97, 143, 151, 152, 157, 162, 267, 273 Webster-Stratton, C., 101, 273 Weinberg, A., 203, 273 White, P., 20, 273 Williams, J., 125, 127 Winters, L., 116, 273 Wittenberg, R., 31, 274 Wright, C., 210, 274 YoungMinds, 212, 274

Unit Costs of Health and Social Care 2013 277
22. List of useful sources Audit Commission: http://www.audit-commission.gov.uk/Pages/default.aspx
Building Cost Information Service: http://www.bcis.co.uk/site/index.aspx BCIS is the UK’s leading provider of cost and price information for construction and property occupancy.
Care Quality Commission: http://www.cqc.org.uk/ The Care Quality Commission is the new health and social care regulator for England and replaces the Healthcare Commission, Commission for Social Care Inspection and the Mental Health Act Commission which all ceased to exist on 31 March 2009.
Centre for Child and Family Research: http://www.lboro.ac.uk/research/ccfr/
Centre for Health Related Studies: http://www.bangor.ac.uk/research/rae_egs/groups_by_school.php.en?SchoolID=0770&SchName=School%20of%20Healthcare%20Sciences/
Chartered Institute of Public Finance and Accountancy (CIPFA): http://www.cipfa.org/ The CIPFA Statistical Information Service (SIS) was established as a partnership between individual authorities and CIPFA. SIS has been undertaking detailed annual surveys of local authority operations for more than a century, and the ‘CIPFA Statistics’ still remain the only impartial and comprehensive account of the extent and achievements of each individual council. Surveys are conducted in the following areas: education, environmental services, environmental health, housing, leisure, planning, public protection, social services, transport.
Daycare Costs Survey 2011, http://www.daycaretrust.org.uk/pages/childcare-costs-surveys.html
Department for Education: http://www.education.gov.uk/
Department for Work and Pensions: http://www.dwp.gov.uk/
Family Resource Survey: http://research.dwp.gov.uk/asd/frs/
Federation of Ophthalmic & Dispensing Opticians: http://www.fodo.com/
Health & Social Care Information Centre (HSCIC): http://www.ic.nhs.uk/ The Health & Social Care Information Centre (IC) is a Special Health Authority set up on 1 April 2005 to take over most DH statistical collection and dissemination and some functions of the former NHS Information Authority. This includes information on Personal Social Services Expenditure.
Hospital Episode Statistics (HES): http://www.hesonline.nhs.uk/ This is the national statistical data warehouse for England of the care provided by NHS hospitals and for NHS hospital patients treated elsewhere. HES is the data source for a wide range of health-care analysis for the NHS, Government and many other organisations and individuals. The HES database is a record-level database of hospital admissions and is currently populated by taking an annual snapshot of a sub-set of the data submitted by NHS Trusts to the NHS-Wide Clearing Service (NWCS). Quarterly information is also collected. A separate database table is held for each financial year, containing approximately 11 million admitted patient records from all NHS Trusts in England.
Joseph Rowntree Foundation: http://www.jrf.org.uk/ This website provides information on housing and care.
Laing & Buisson: http://www.laingbuisson.co.uk/ Laing & Buisson, an independent company, provides authoritative data, statistics, analysis and market intelligence on the UK health.

278 Unit Costs of Health and Social Care 2013 Livability: http://www.livability.org.uk/
National Council for Palliative Care: http://www.ncpc.org.uk/
National End of Life Care Intelligence network: http://www.endoflifecare-intelligence.org.uk/home/
National Institute for Health and Clinical Excellence: http://www.nice.org.uk/
National Prescribing Centre: http://www.npc.co.uk/
Personal Social Services Expenditure Data (PSS EX1 data): http://www.ic.nhs.uk/statistics-and-data-collections/
PSSRU at LSE, London School of Economics and Political Science: http://www2.lse.ac.uk/LSEHealthAndSocialCare/Home.aspx
Pub Med: http://www.pubmedcentral.nih.gov/
Reference Costs: http://www.dh.gov.uk/en/Publicationsandstatistics/Publications/PublicationsPolicyAndGuidance/DH_123459/
This website gives details on how and on what NHS expenditure was used. The Reference Costs/ Reference Costs Index publication is the richest source of financial data on the NHS ever produced. As in previous years, its main purpose is to provide a basis for comparison within (and outside) the NHS between organisations, and down to the level of individual treatments.
Social Care Institute for Excellence: http://www.scie.org.uk/
Social Care Online: http://www.scie-socialcareonline.org.uk/
Social Policy Research Unit, University of York: http://www.york.ac.uk/inst/spru/
YoungMinds: http://www.youngminds.org.uk/ YoungMinds is a national charity committed to improving the mental health of all children and young people.

Unit Costs of Health and Social Care 2013 279
23. List of items from previous volumes Editorials and articles
2001 Child care costs in social services Independent sector home care providers in England Unit costs for multi-country economic evaluations
2002 A nurse practitioner service for nursing and residential care The costs of child and adolescent psychiatric inpatient units The new PSS EX1 return on expenditure and unit costs Mapping mental health services in England Developing health accounts for the United Kingdom
2003 The costs of intermediate care schemes The Rapid Response Service Reference costs
2004 The costs of adoption The costs of undertaking core assessments The development of unit costs for social work processes Estimating the unit costs for Home-Start support
2005 The cost of providing home care Personal social services pay & prices index Typical costs of Sure Start local programme services
2006 Guest editorial – Conducting and interpreting multi-national economic evaluations: the measurement of costs The costs of an intensive home visiting programme for vulnerable families Direct payments rates in England Training costs of person centred planning The baker’s dozen: unit costs and funding
2007 The costs of telecare: from pilots to mainstream implementation The Health BASKET Project: documenting the benefit basket and evaluating service costs in Europe Recording professional activities to aid economic evaluations of health and social care services
2008 Guest editorial – National Schedule of Reference Costs data: community care services The challenges of estimating the unit cost of group-based therapies Costs and users of Individual Budgets
2009 Guest editorial – Economics and Cochrane and Campbell methods: the role of unit costs Estimating unit costs for Direct Payments Support Organisations The National Dementia Strategy: potential costs and impacts SCIE’s work on economics and the importance of informal care

280 Unit Costs of Health and Social Care 2013 2010 The costs of short-break provision The impact of the POPP programme on changes in individual service use The Screen and Treat programme: a response to the London bombings Expected lifetime costs of social care for people aged 65 and over in England
2011 The costs of extra care housing Shared Lives – model for care and support Calculating the cost and capacity implications for local authorities implementing the Laming (2009) recommendations
2012 Guest Editorial: appropriate perspectives for health care decisions Using time diaries to contribute to economic evaluation of criminal justice interventions Costing multi-site, group-based CBT workshops A review of approaches to measure and monetarily value informal care Tables
2006 Adolescent support worker Educational social work team member Behavioural support service team member Learning support service team member
2007 All children’s service withdrawn, but reinstated in 2010
2008 Paramedic and emergency ambulance services
2009 Cost of maintaining a drugs misuser on a methadone treatment programme Unpaid care
2010 Voluntary residential care for older people Nursing-Led Inpatient Unit (NLIU) for intermediate care Local authority sheltered housing for older people Housing association sheltered housing for older people Local authority very sheltered housing for older people Housing association very sheltered housing for older people Local authority residential care (staffed hostel) for people with mental health problems Local authority residential care (group home) for people with mental health problems Voluntary sector residential care (staffed hostel) for people with mental health problems Private sector residential care (staffed hostel) for people with mental health problems Acute NHS hospital services for people with mental health problems NHS long-stay hospital services for people with mental health problems Voluntary/non-profit organisations providing day care for people with mental health problems Sheltered work schemes for people with mental health problems Village communities for people with learning disabilities The costs of community-based care of technology-dependent children

Unit Costs of Health and Social Care 2013 281 2011 Approved social worker
2012 High-dependency care home for younger adults with physical and sensory impairments Residential home for younger adults with physical and sensory impairments Special needs flats for younger adults with physical and sensory impairments Rehabilitation day centre for younger adults with brain injury Comparative costs of providing sexually abused children with individual and group psychotherapy

ISSN 1368-230XISBN 978-1-902671-87-1

![Codes in Pediatric Acute Care-The Lessons Learned[1]m.b5z.net/i/u/6110456/f/Codes_in_Pediatric_Acute... · Codes in Pediatric Acute Care: The Lessons Learned Donnett Bell, ... Code](https://img.pdfslide.us/doc/110x75/5b77bf027f8b9ade6f8da023/codes-in-pediatric-acute-care-the-lessons-learned1mb5znetiu6110456fcodesinpediatricacute.jpg)

![HEDIS Code Quick Reference Guide—Women’s … Pregnancy Care Postpartum Care [Commercial, Medicaid] Codes to identify Postpartum Visits CPT (Preferred Codes) CPT Category II HCPCS](https://img.pdfslide.us/doc/110x75/5aadfbf47f8b9a22118b6f39/hedis-code-quick-reference-guidewomens-pregnancy-care-postpartum-care.jpg)


![HEDIS Code Quick Reference Guide—Women’s Health Services · 2 Pregnancy Care Postpartum Care [Commercial, Medicaid] Codes to identify Postpartum Visits CPT (Preferred Codes) CPT](https://img.pdfslide.us/doc/110x75/5d6693b988c9939c338b641f/hedis-code-quick-reference-guidewomens-health-services-2-pregnancy-care.jpg)