Embed Size (px)
Citation preview
CodeLink compatible
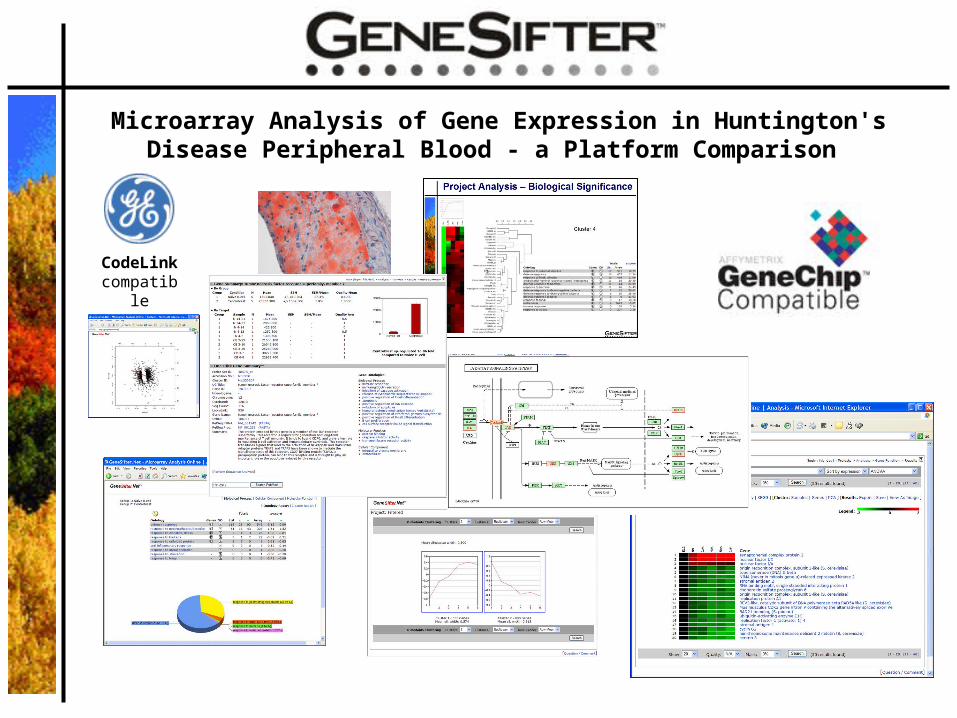
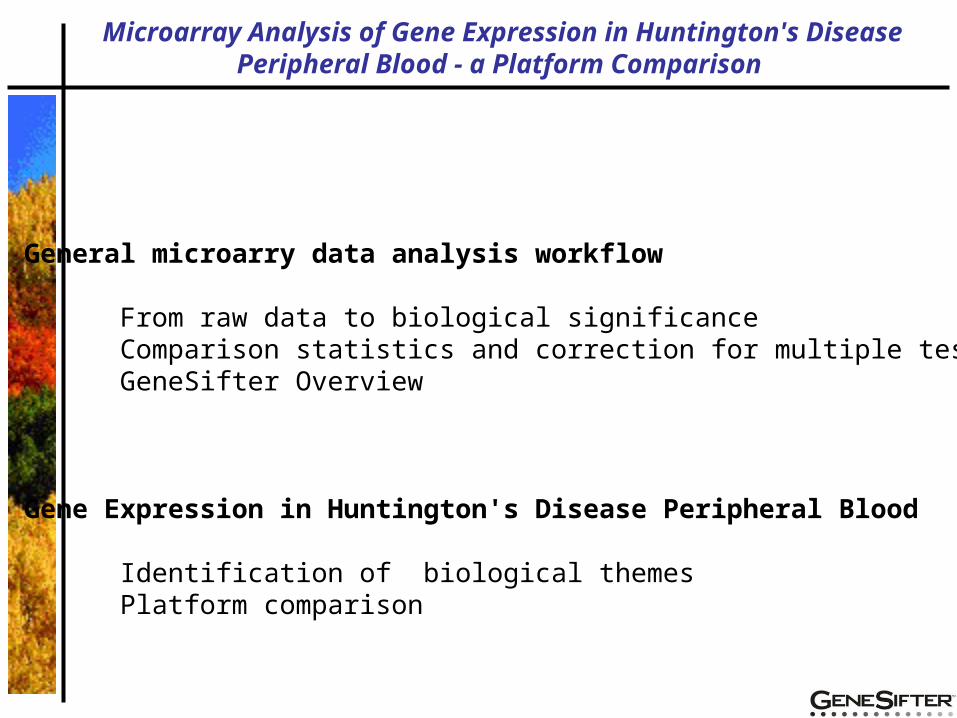
Microarray Analysis of Gene Expression in Huntington's Disease Peripheral Blood - a Platform Comparison

General microarry data analysis workflow
From raw data to biological significanceComparison statistics and correction for multiple testingGeneSifter Overview
Gene Expression in Huntington's Disease Peripheral Blood
Identification of biological themesPlatform comparison
Microarray Analysis of Gene Expression in Huntington's Disease Peripheral Blood - a Platform Comparison
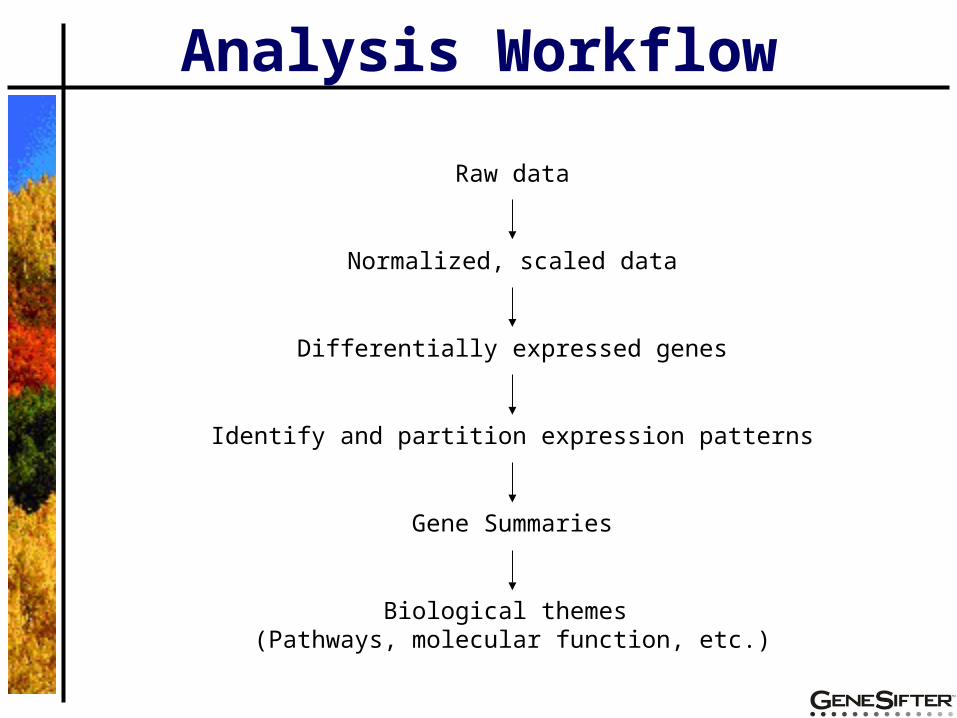
Analysis Workflow
Normalized, scaled data
Differentially expressed genes
Identify and partition expression patterns
Gene Summaries
Biological themes (Pathways, molecular function, etc.)
Raw data
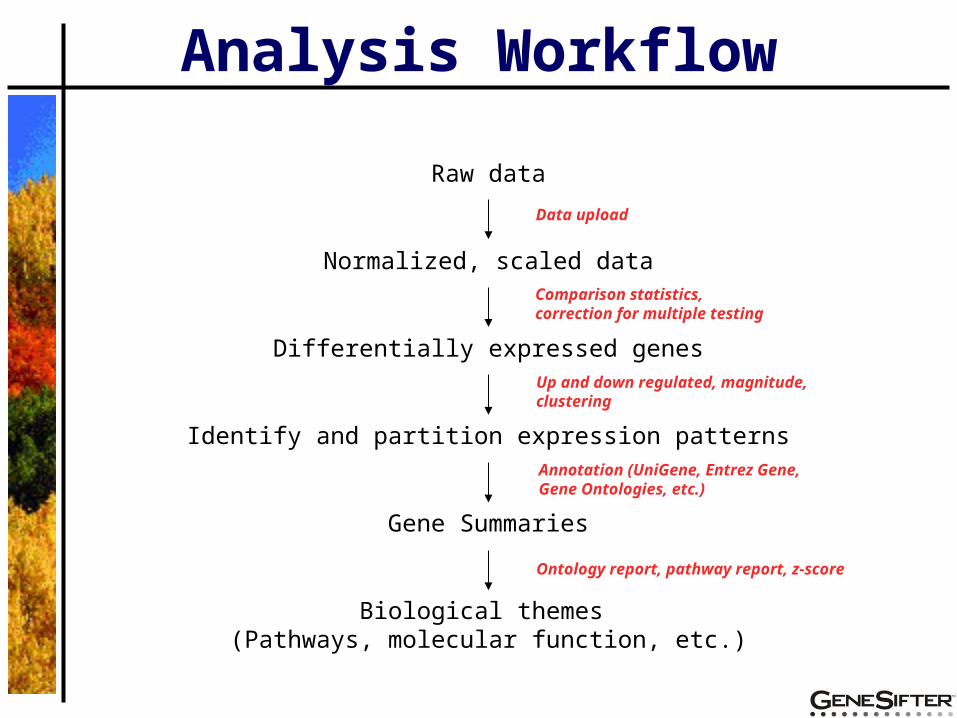
Analysis Workflow
Normalized, scaled data
Differentially expressed genes
Identify and partition expression patterns
Gene Summaries
Biological themes (Pathways, molecular function, etc.)
Raw data
Comparison statistics, correction for multiple testing
Up and down regulated, magnitude, clustering
Annotation (UniGene, Entrez Gene, Gene Ontologies, etc.)
Ontology report, pathway report, z-score
Data upload
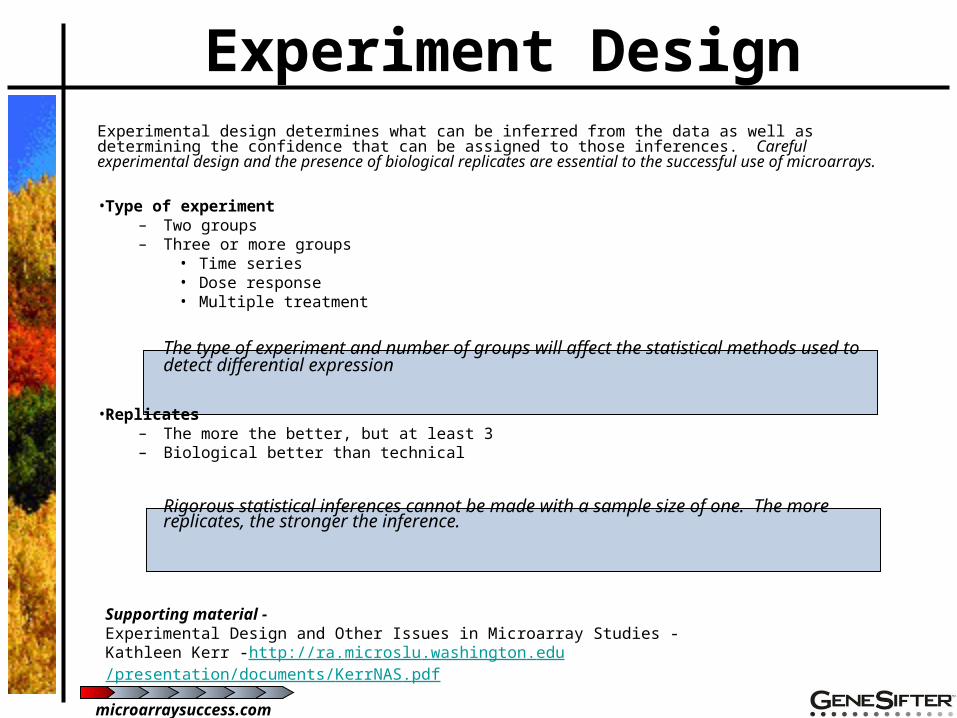
Experiment DesignExperimental design determines what can be inferred from the data as well as determining the confidence that can be assigned to those inferences. Careful experimental design and the presence of biological replicates are essential to the successful use of microarrays.
•Type of experiment– Two groups– Three or more groups
• Time series• Dose response• Multiple treatment
The type of experiment and number of groups will affect the statistical methods used to detect differential expression
•Replicates– The more the better, but at least 3– Biological better than technical
Rigorous statistical inferences cannot be made with a sample size of one. The more replicates, the stronger the inference.
Supporting material - Experimental Design and Other Issues in Microarray Studies - Kathleen Kerr -http://ra.microslu.washington.edu/presentation/documents/KerrNAS.pdf
microarraysuccess.com
Differential Expression
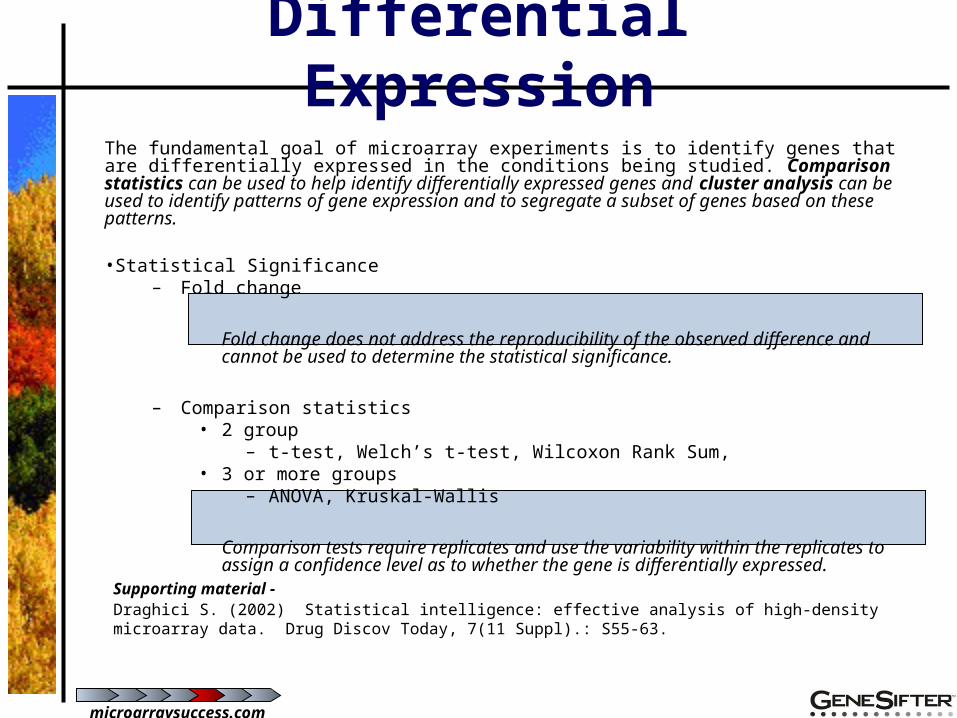
The fundamental goal of microarray experiments is to identify genes that are differentially expressed in the conditions being studied. Comparison statistics can be used to help identify differentially expressed genes and cluster analysis can be used to identify patterns of gene expression and to segregate a subset of genes based on these patterns.
•Statistical Significance– Fold change
Fold change does not address the reproducibility of the observed difference and cannot be used to determine the statistical significance.
– Comparison statistics• 2 group
– t-test, Welch’s t-test, Wilcoxon Rank Sum, • 3 or more groups
– ANOVA, Kruskal-Wallis
Comparison tests require replicates and use the variability within the replicates to assign a confidence level as to whether the gene is differentially expressed.
Supporting material - Draghici S. (2002) Statistical intelligence: effective analysis of high-density microarray data. Drug Discov Today, 7(11 Suppl).: S55-63.
microarraysuccess.com
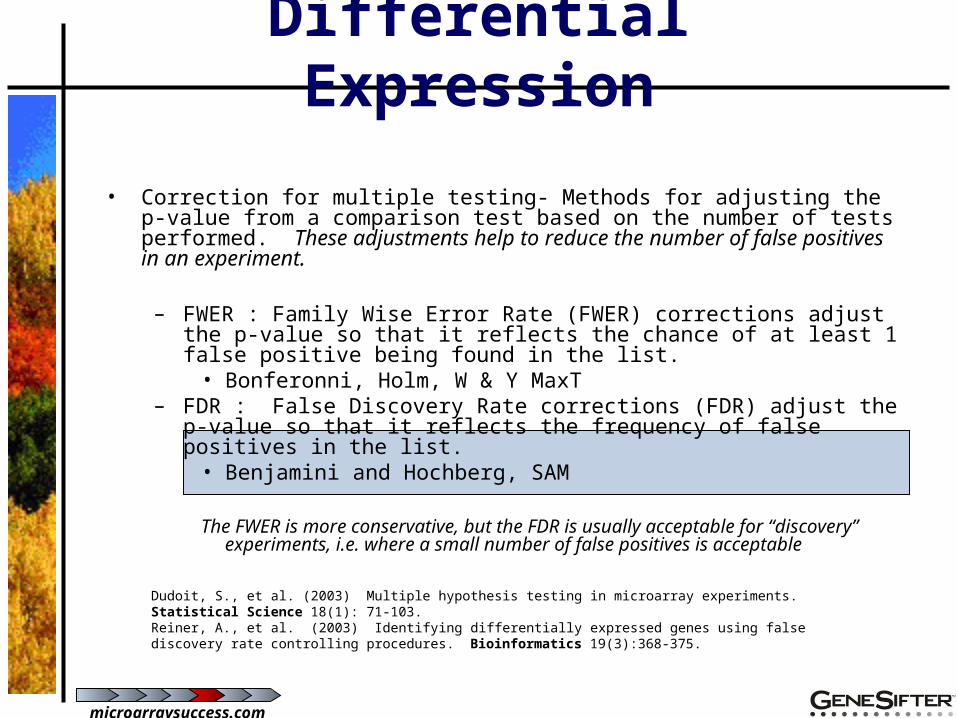
• Correction for multiple testing- Methods for adjusting the p-value from a comparison test based on the number of tests performed. These adjustments help to reduce the number of false positives in an experiment.
– FWER : Family Wise Error Rate (FWER) corrections adjust the p-value so that it reflects the chance of at least 1 false positive being found in the list.
• Bonferonni, Holm, W & Y MaxT– FDR : False Discovery Rate corrections (FDR) adjust the p-value so that it
reflects the frequency of false positives in the list.• Benjamini and Hochberg, SAM
The FWER is more conservative, but the FDR is usually acceptable for “discovery” experiments, i.e. where a small number of false positives is acceptable
Dudoit, S., et al. (2003) Multiple hypothesis testing in microarray experiments. Statistical Science 18(1): 71-103.Reiner, A., et al. (2003) Identifying differentially expressed genes using false discovery rate controlling procedures. Bioinformatics 19(3):368-375.
Differential Expression
microarraysuccess.com
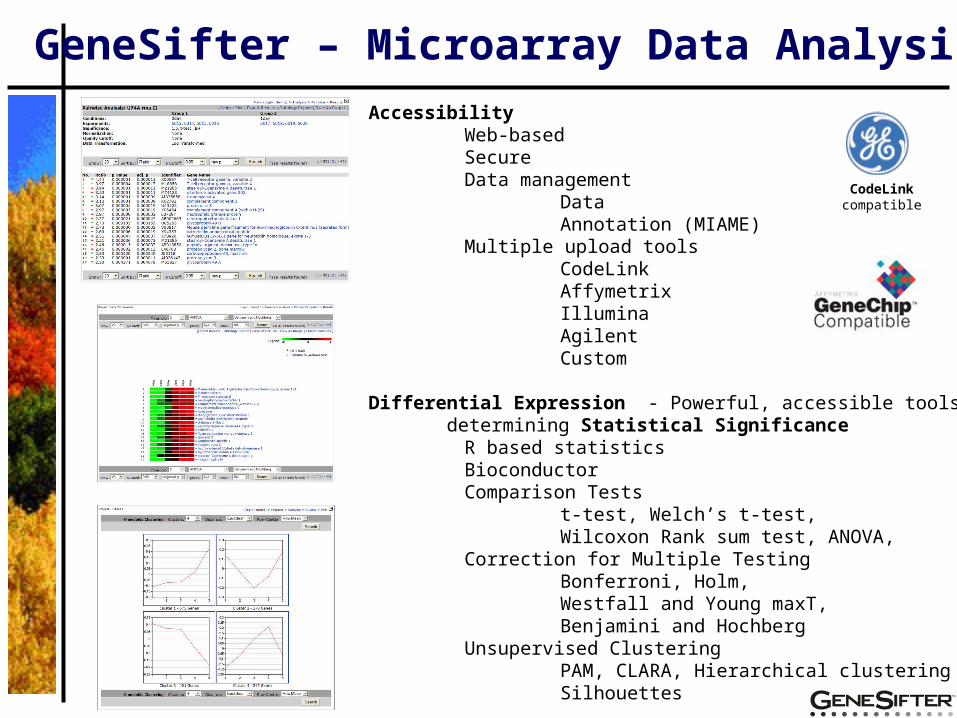
AccessibilityWeb-basedSecureData management
DataAnnotation (MIAME)
Multiple upload toolsCodeLinkAffymetrixIlluminaAgilent Custom
Differential Expression - Powerful, accessible tools for determining Statistical Significance
R based statisticsBioconductorComparison Tests
t-test, Welch’s t-test, Wilcoxon Rank sum test, ANOVA,
Correction for Multiple TestingBonferroni, Holm, Westfall and Young maxT, Benjamini and Hochberg
Unsupervised ClusteringPAM, CLARA, Hierarchical clusteringSilhouettes
GeneSifter – Microarray Data Analysis
CodeLink compatible
GeneSifter – Microarray Data Analysis
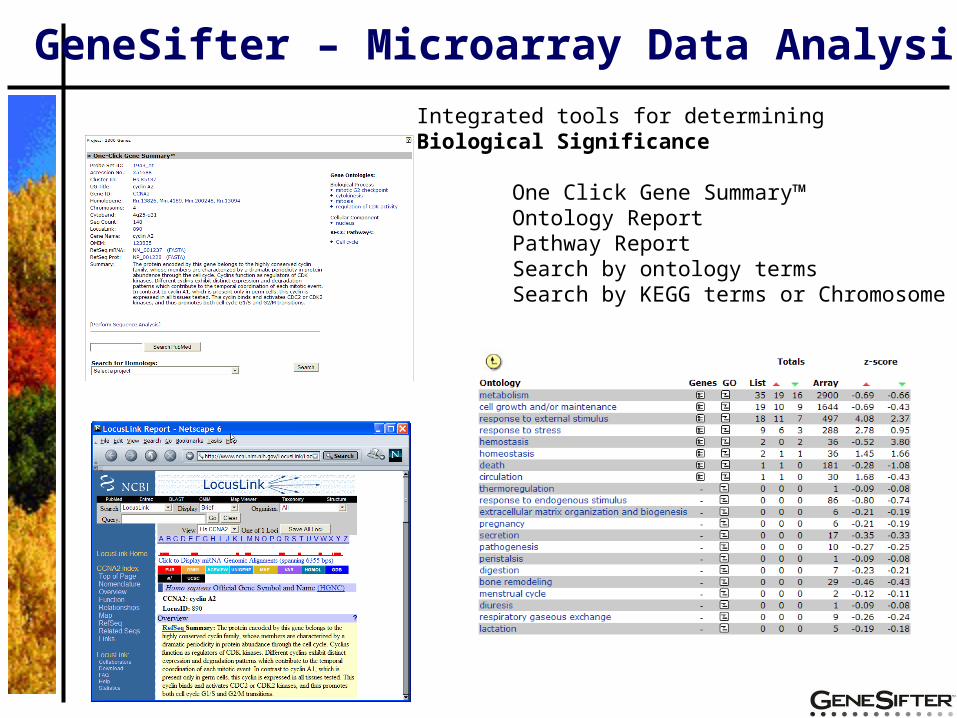
Integrated tools for determining Biological Significance
One Click Gene Summary™Ontology ReportPathway ReportSearch by ontology termsSearch by KEGG terms or Chromosome

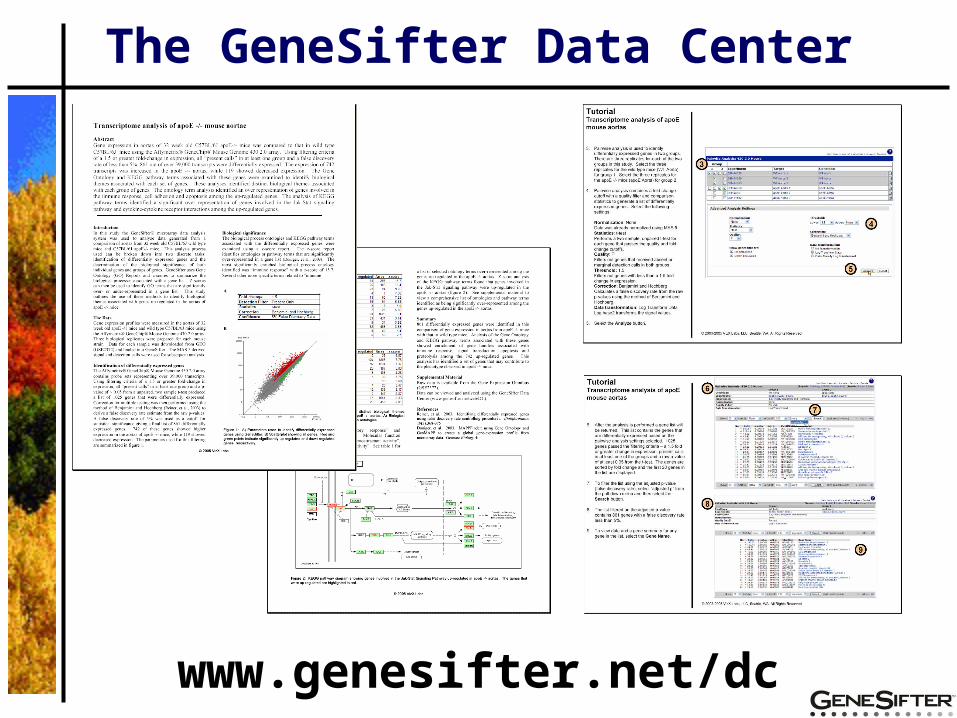
The GeneSifter Data Center
• Free resourceTrainingResearchPublishing
• 5 areasCardiovascularCancerNeuroscienceImmunologyOral Biology
• Access to :DataAnalysis summaryTutorialsWebEx
The GeneSifter Data Center
www.genesifter.net/dc
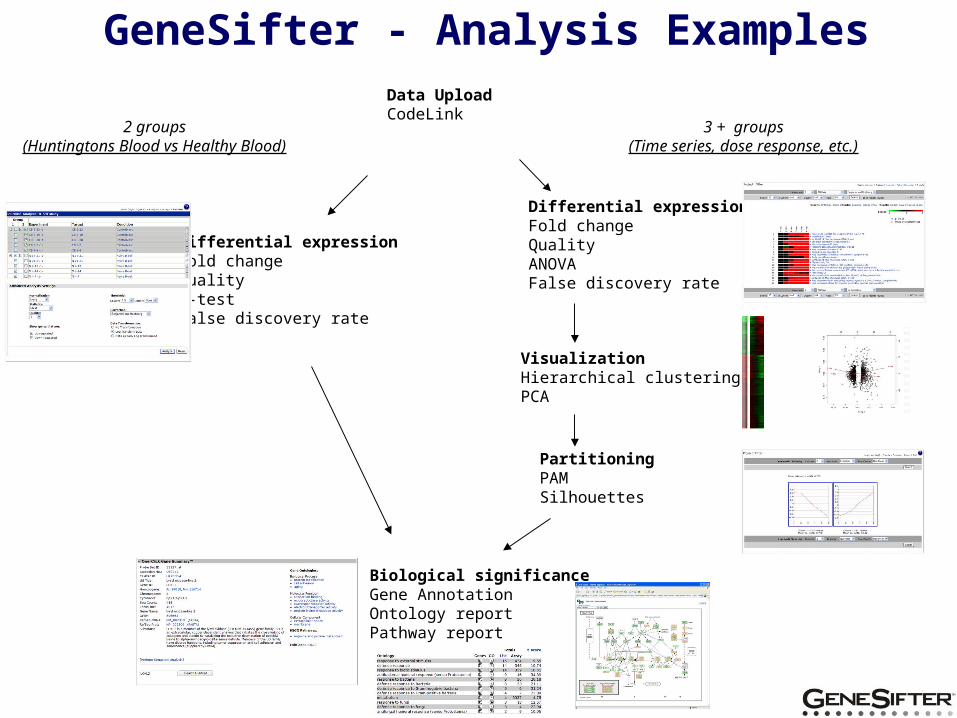
GeneSifter - Analysis Examples
Differential expressionFold changeQualityt-test False discovery rate
Differential expressionFold changeQualityANOVA False discovery rate
VisualizationHierarchical clusteringPCA
PartitioningPAMSilhouettes
Data UploadCodeLink
Biological significanceGene AnnotationOntology reportPathway report
2 groups(Huntingtons Blood vs Healthy Blood)
3 + groups(Time series, dose response, etc.)
General microarry data analysis workflow
From raw data to biological significanceComparison statistics and correction for multiple testingGeneSifter Overview
Gene Expression in Huntington's Disease Peripheral Blood
Identification of biological themesPlatform comparison
Microarray Analysis of Gene Expression in Huntington's Disease Peripheral Blood - a Platform Comparison
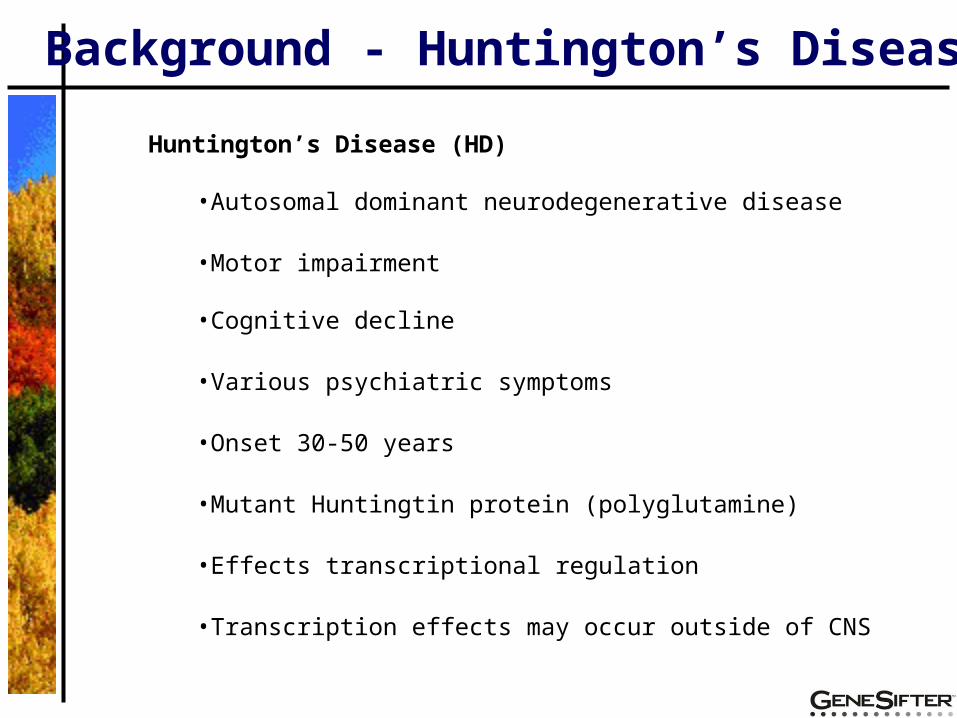
Background - Huntington’s Disease
Huntington’s Disease (HD)
•Autosomal dominant neurodegenerative disease
•Motor impairment
•Cognitive decline
•Various psychiatric symptoms
•Onset 30-50 years
•Mutant Huntingtin protein (polyglutamine)
•Effects transcriptional regulation
•Transcription effects may occur outside of CNS
Pairwise Analysis
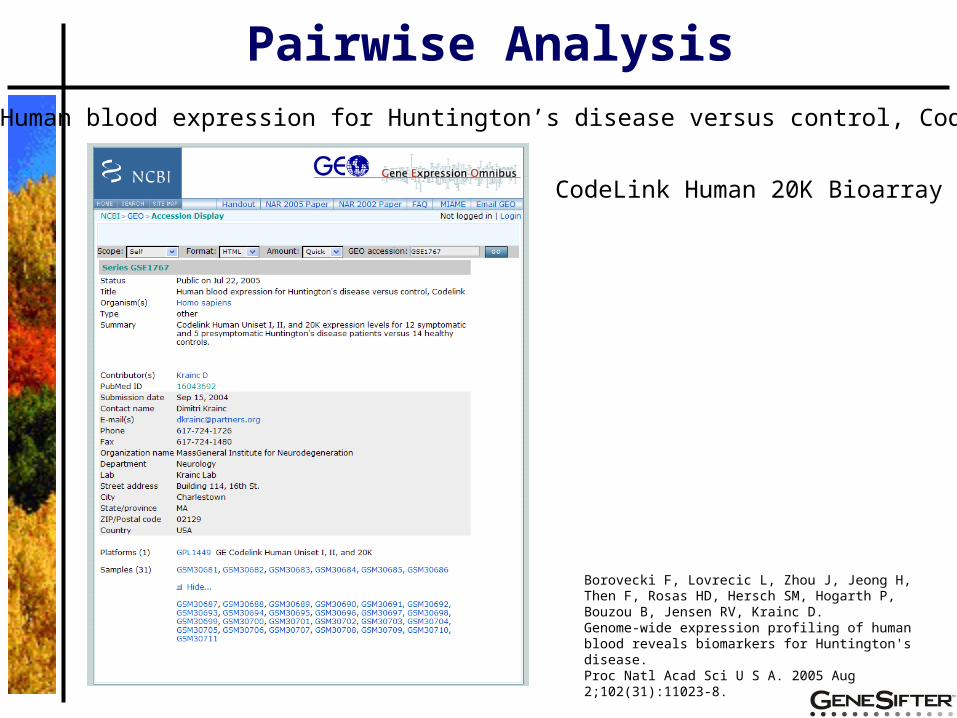
CodeLink Human 20K Bioarray
Human blood expression for Huntington’s disease versus control, CodeLink
Borovecki F, Lovrecic L, Zhou J, Jeong H, Then F, Rosas HD, Hersch SM, Hogarth P, Bouzou B, Jensen RV, Krainc D. Genome-wide expression profiling of human blood reveals biomarkers for Huntington's disease. Proc Natl Acad Sci U S A. 2005 Aug 2;102(31):11023-8.
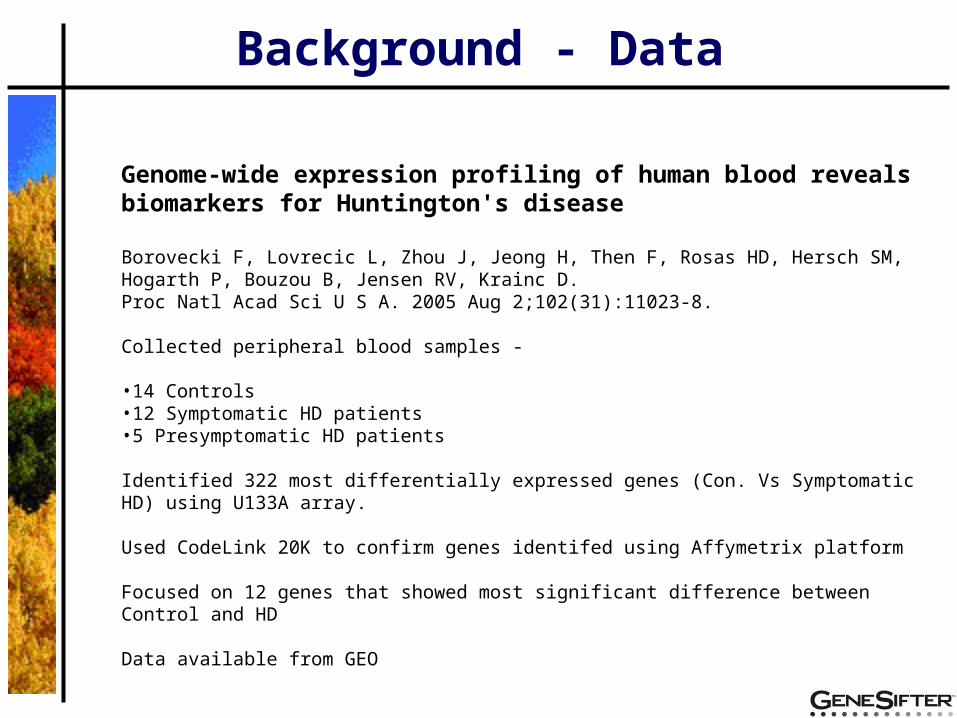
Genome-wide expression profiling of human blood reveals biomarkers for Huntington's disease
Borovecki F, Lovrecic L, Zhou J, Jeong H, Then F, Rosas HD, Hersch SM, Hogarth P, Bouzou B, Jensen RV, Krainc D. Proc Natl Acad Sci U S A. 2005 Aug 2;102(31):11023-8.
Collected peripheral blood samples -
•14 Controls•12 Symptomatic HD patients•5 Presymptomatic HD patients
Identified 322 most differentially expressed genes (Con. Vs Symptomatic HD) using U133A array.
Used CodeLink 20K to confirm genes identifed using Affymetrix platform
Focused on 12 genes that showed most significant difference between Control and HD
Data available from GEO
Background - Data
Pairwise Analysis
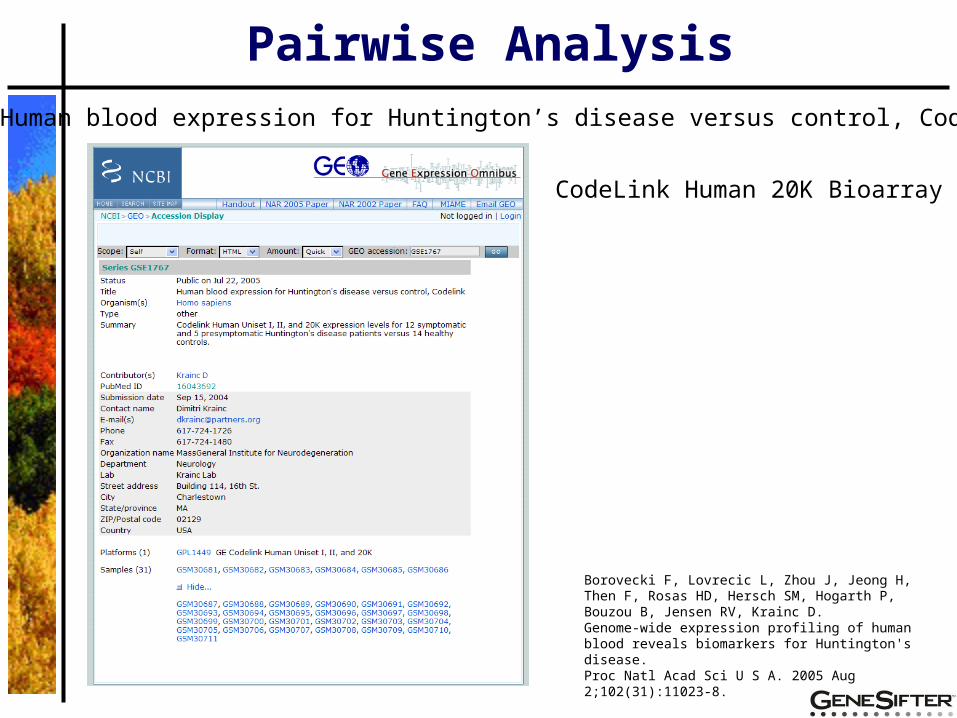
CodeLink Human 20K Bioarray
Human blood expression for Huntington’s disease versus control, CodeLink
Borovecki F, Lovrecic L, Zhou J, Jeong H, Then F, Rosas HD, Hersch SM, Hogarth P, Bouzou B, Jensen RV, Krainc D. Genome-wide expression profiling of human blood reveals biomarkers for Huntington's disease. Proc Natl Acad Sci U S A. 2005 Aug 2;102(31):11023-8.
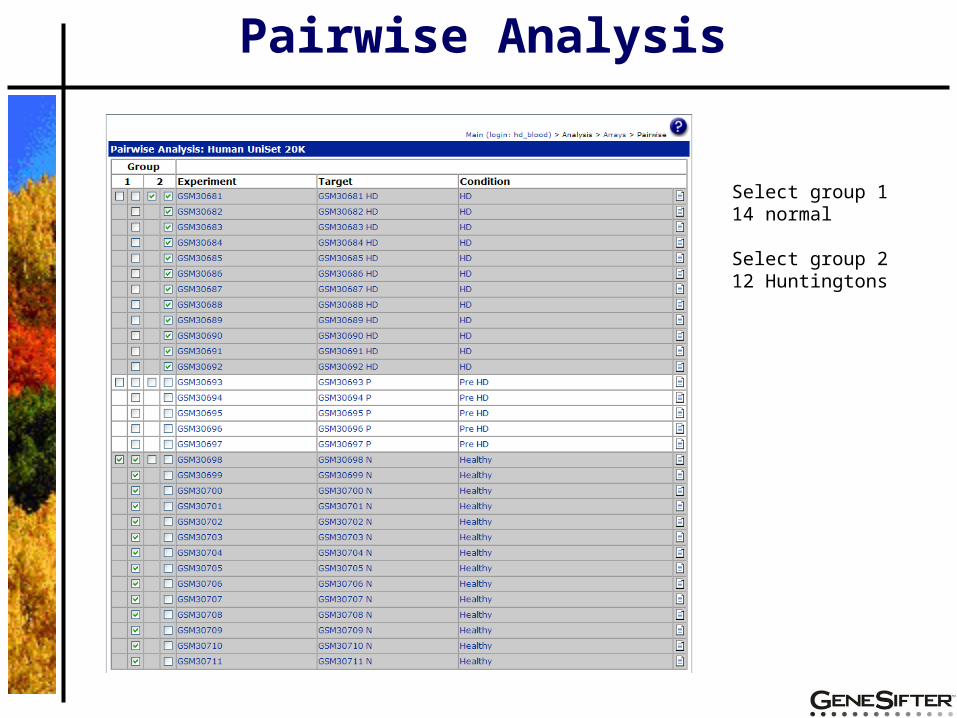
Pairwise Analysis
Select group 114 normal
Select group 212 Huntingtons
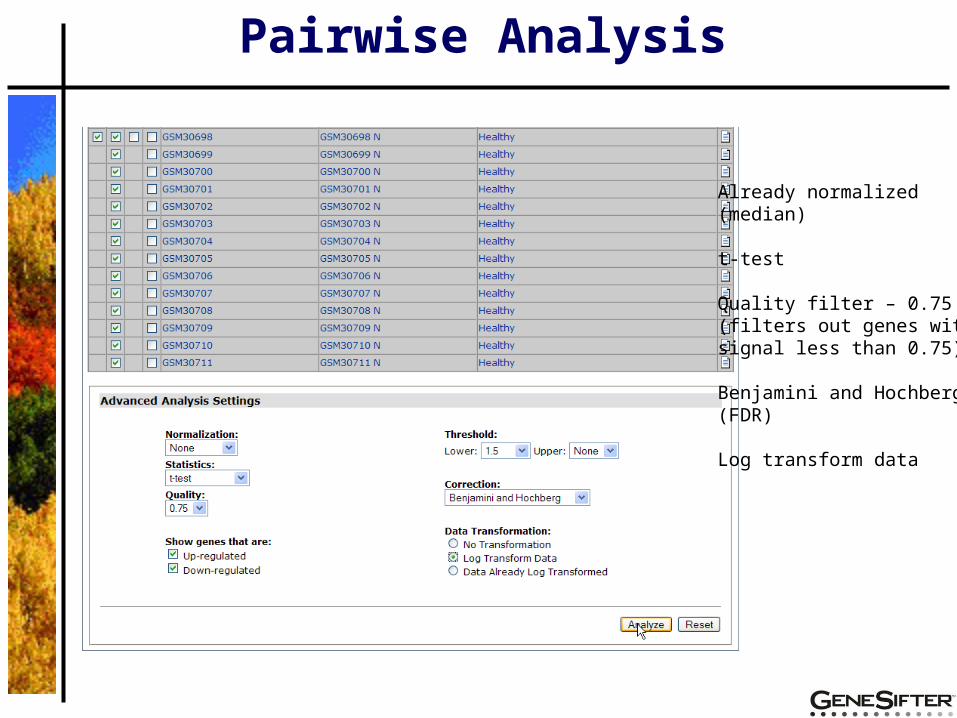
Already normalized (median)
t-test
Quality filter – 0.75(filters out genes with signal less than 0.75)
Benjamini and Hochberg (FDR)
Log transform data
Pairwise Analysis
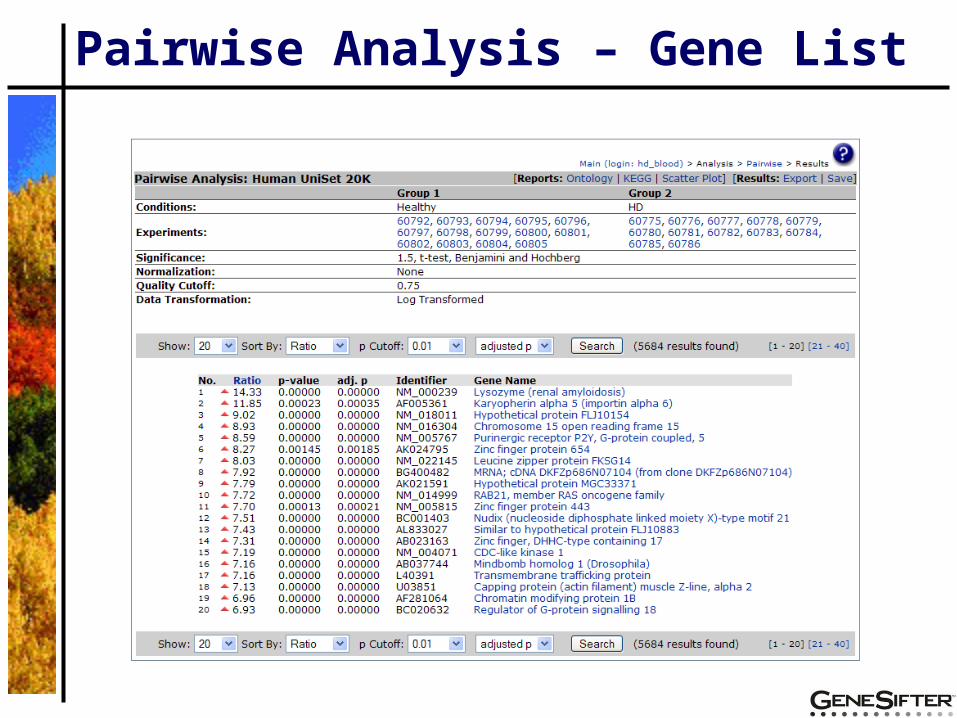
Pairwise Analysis – Gene List
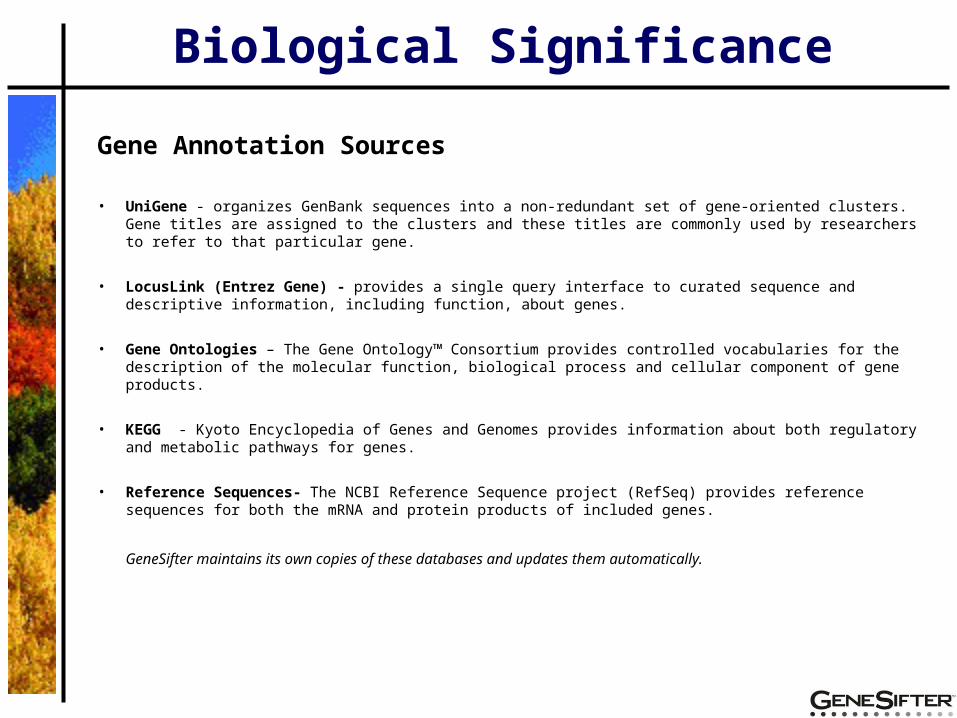
Biological Significance
Gene Annotation Sources
• UniGene - organizes GenBank sequences into a non-redundant set of gene-oriented clusters. Gene titles are assigned to the clusters and these titles are commonly used by researchers to refer to that particular gene.
• LocusLink (Entrez Gene) - provides a single query interface to curated sequence and descriptive information, including function, about genes.
• Gene Ontologies – The Gene Ontology™ Consortium provides controlled vocabularies for the description of the molecular function, biological process and cellular component of gene products.
• KEGG - Kyoto Encyclopedia of Genes and Genomes provides information about both regulatory and metabolic pathways for genes.
• Reference Sequences- The NCBI Reference Sequence project (RefSeq) provides reference sequences for both the mRNA and protein products of included genes.
GeneSifter maintains its own copies of these databases and updates them automatically.
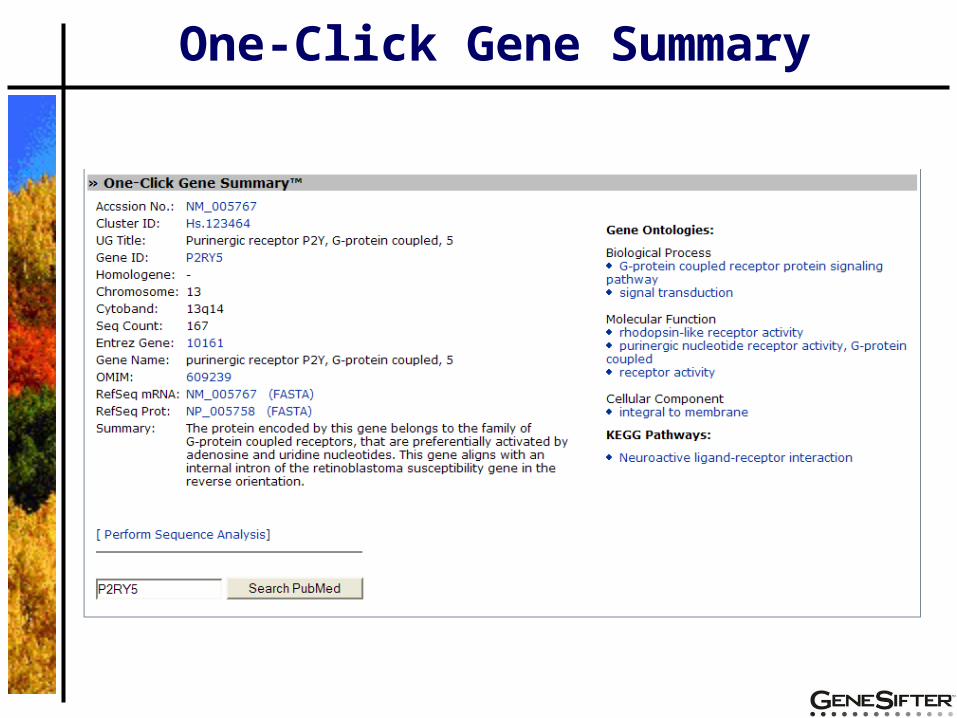
One-Click Gene Summary
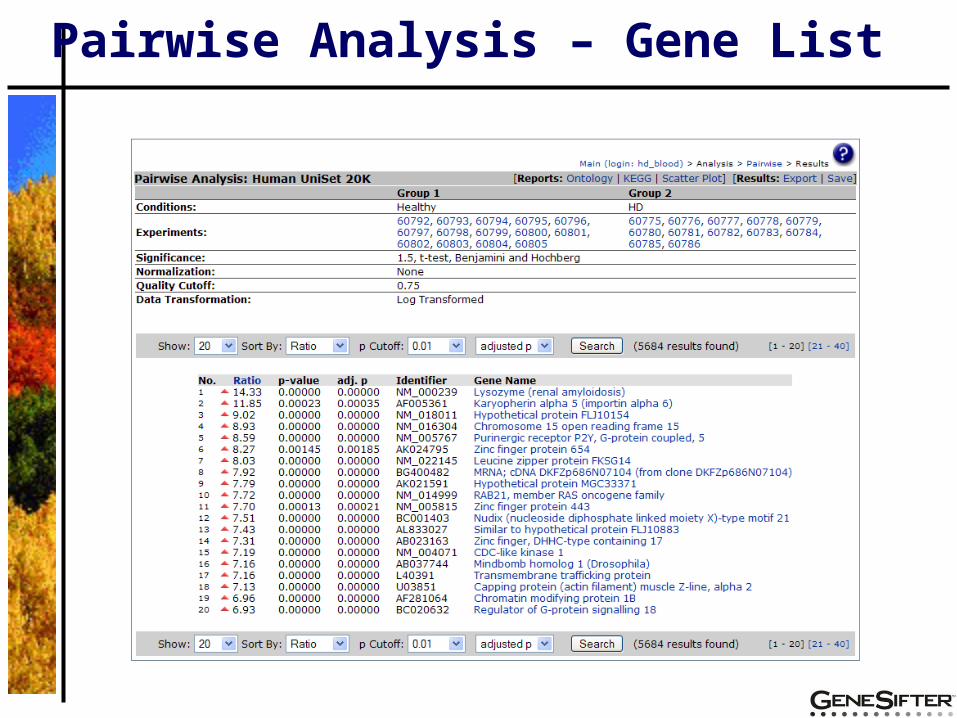
Pairwise Analysis – Gene List
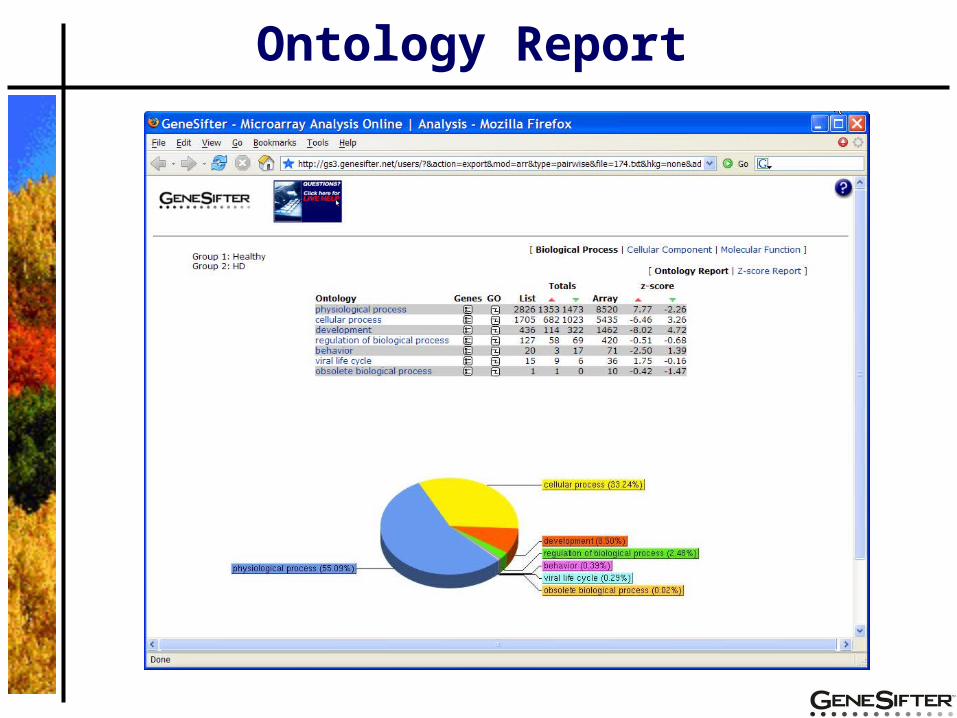
Ontology Report
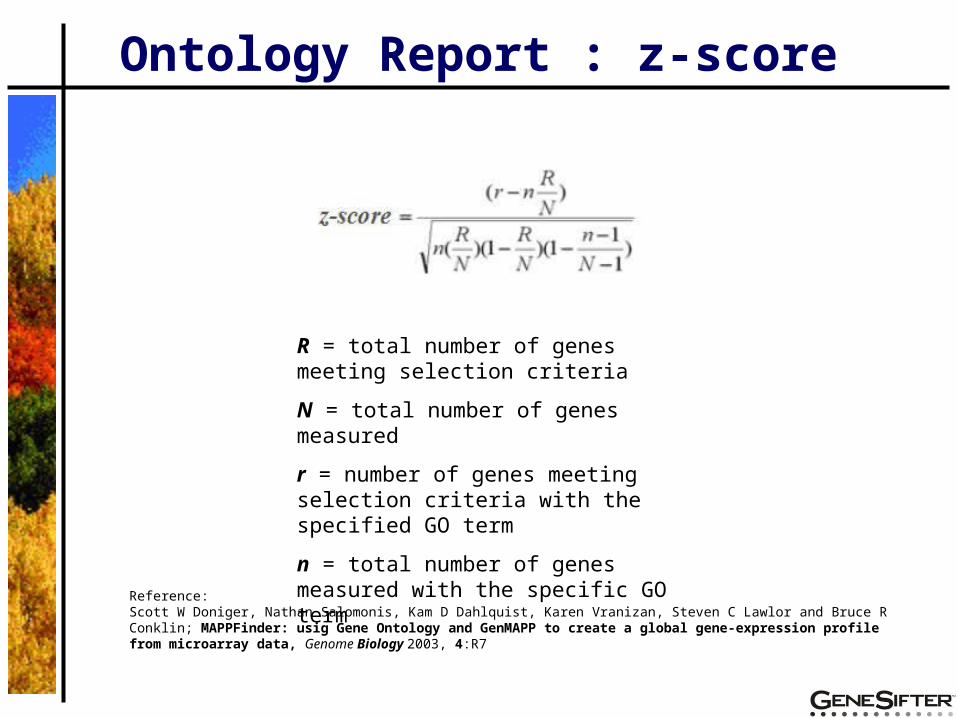
Ontology Report : z-score
R = total number of genes meeting selection criteria
N = total number of genes measured
r = number of genes meeting selection criteria with the specified GO term
n = total number of genes measured with the specific GO term
Reference:Scott W Doniger, Nathan Salomonis, Kam D Dahlquist, Karen Vranizan, Steven C Lawlor and Bruce R Conklin; MAPPFinder: usig Gene Ontology and GenMAPP to create a global gene-expression profile from microarray data, Genome Biology 2003, 4:R7
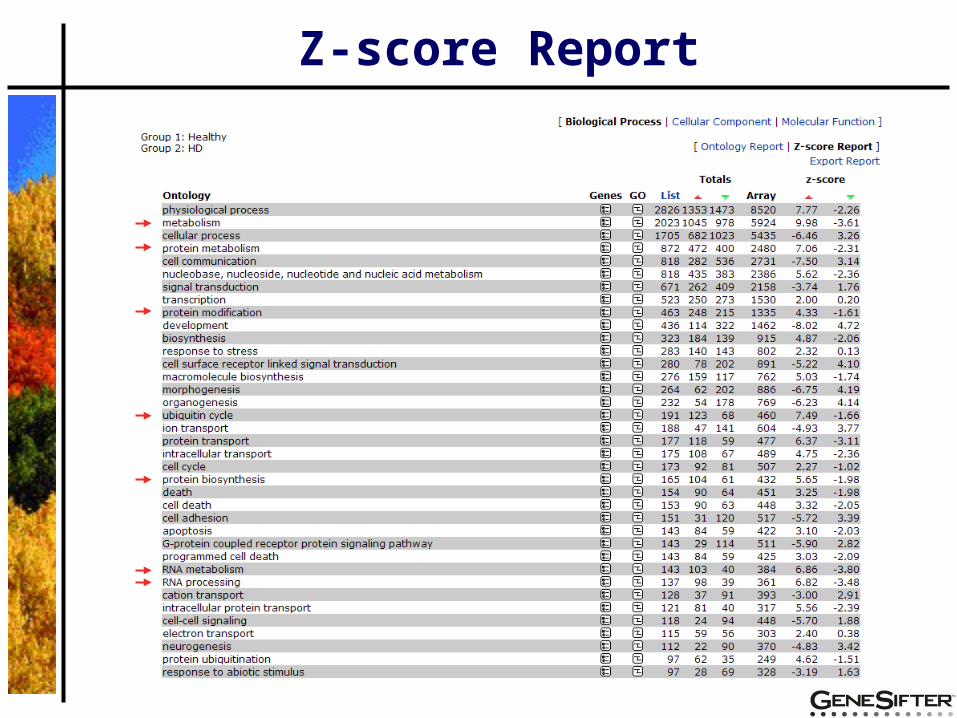
Z-score Report
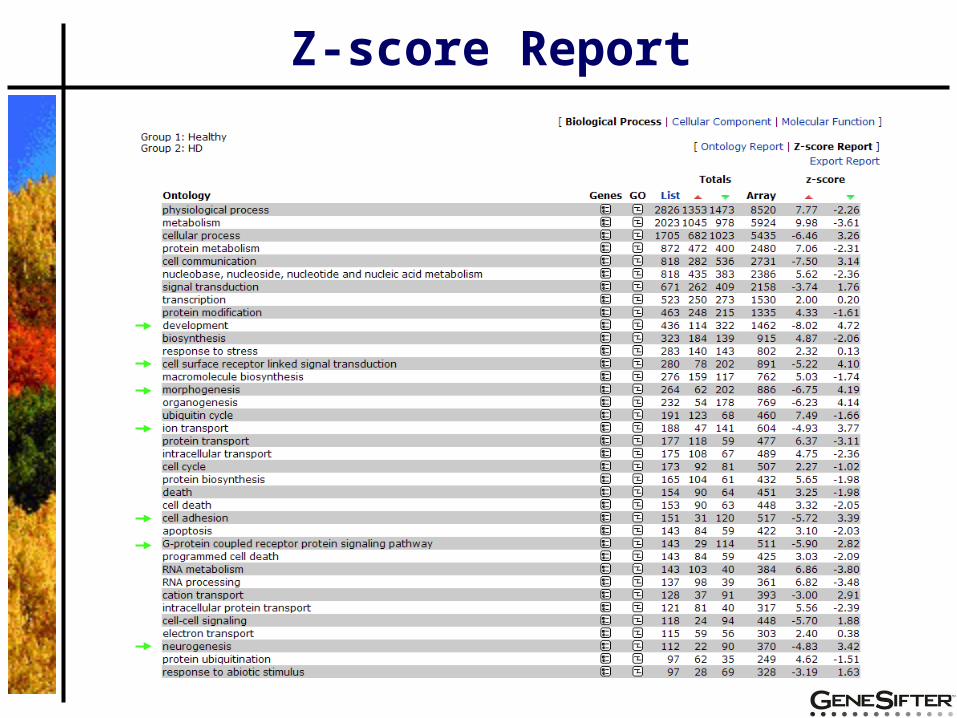
Z-score Report
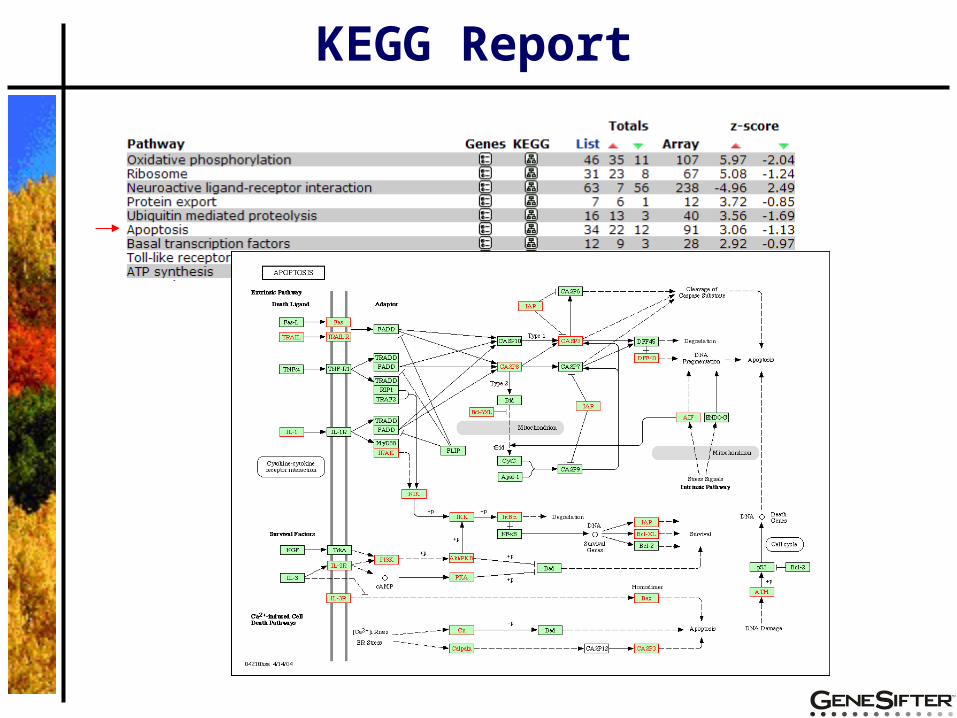
KEGG Report
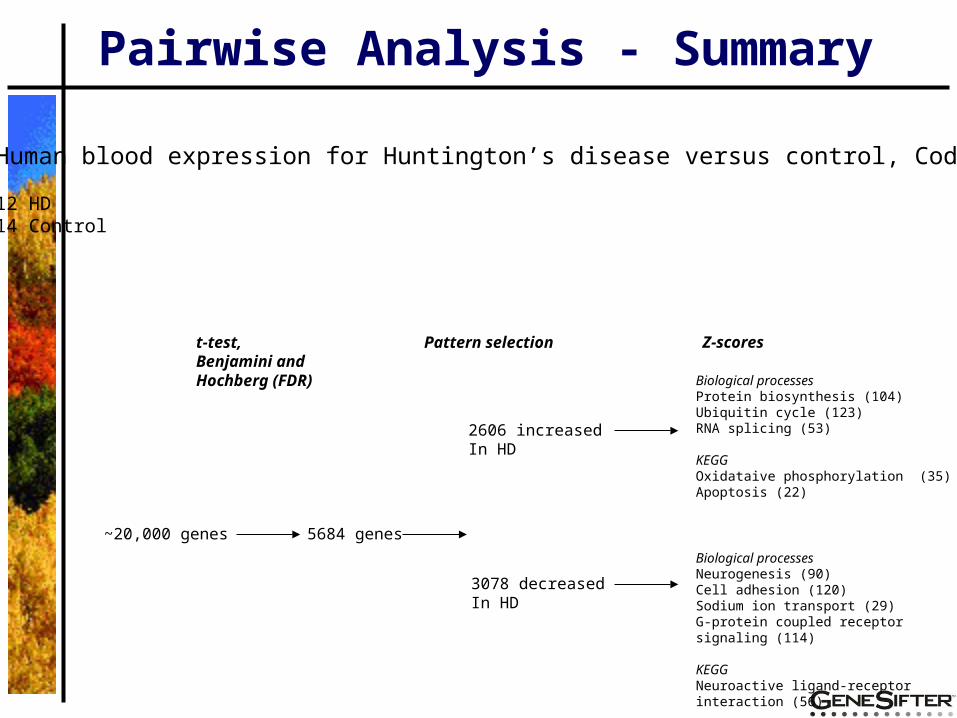
Pairwise Analysis - Summary
~20,000 genes 5684 genes
2606 increasedIn HD
Biological processesProtein biosynthesis (104)Ubiquitin cycle (123)RNA splicing (53)
KEGGOxidataive phosphorylation (35)Apoptosis (22)
Biological processesNeurogenesis (90)Cell adhesion (120)Sodium ion transport (29)G-protein coupled receptor signaling (114)
KEGGNeuroactive ligand-receptor interaction (56)
3078 decreasedIn HD
Human blood expression for Huntington’s disease versus control, CodeLink
12 HD14 Control
Z-scores Pattern selectiont-test, Benjamini and Hochberg (FDR)

General microarry data analysis workflow
From raw data to biological significanceComparison statistics and correction for multiple testingGeneSifter Overview
Gene Expression in Huntington's Disease Peripheral Blood
Identification of biological themesPlatform comparison
Microarray Analysis of Gene Expression in Huntington's Disease Peripheral Blood - a Platform Comparison
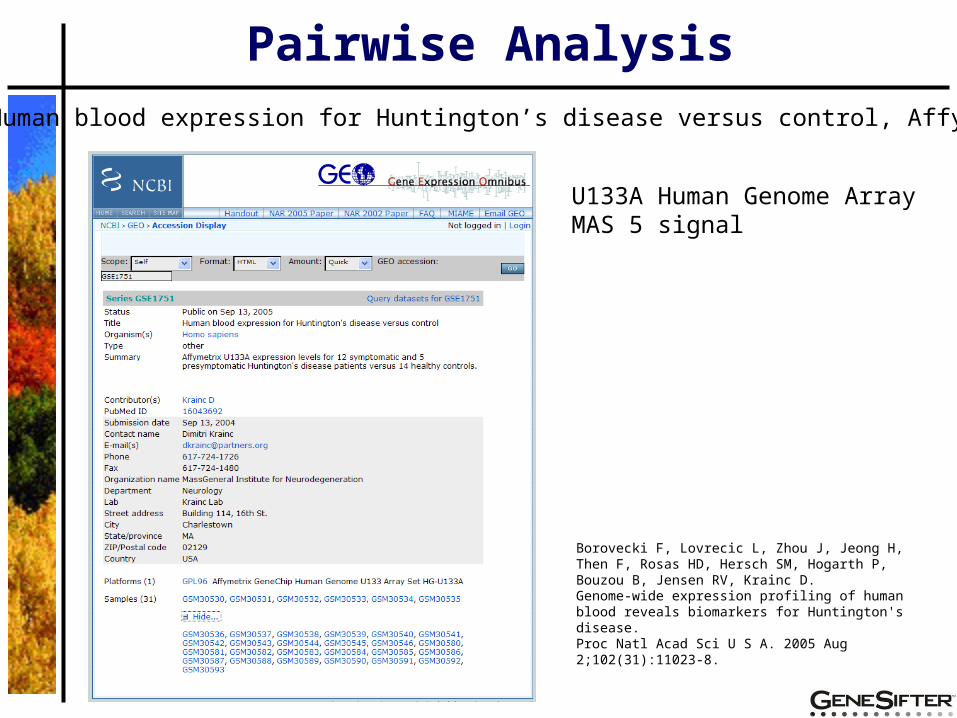
Pairwise Analysis
U133A Human Genome ArrayMAS 5 signal
Human blood expression for Huntington’s disease versus control, Affymetrix
Borovecki F, Lovrecic L, Zhou J, Jeong H, Then F, Rosas HD, Hersch SM, Hogarth P, Bouzou B, Jensen RV, Krainc D. Genome-wide expression profiling of human blood reveals biomarkers for Huntington's disease. Proc Natl Acad Sci U S A. 2005 Aug 2;102(31):11023-8.
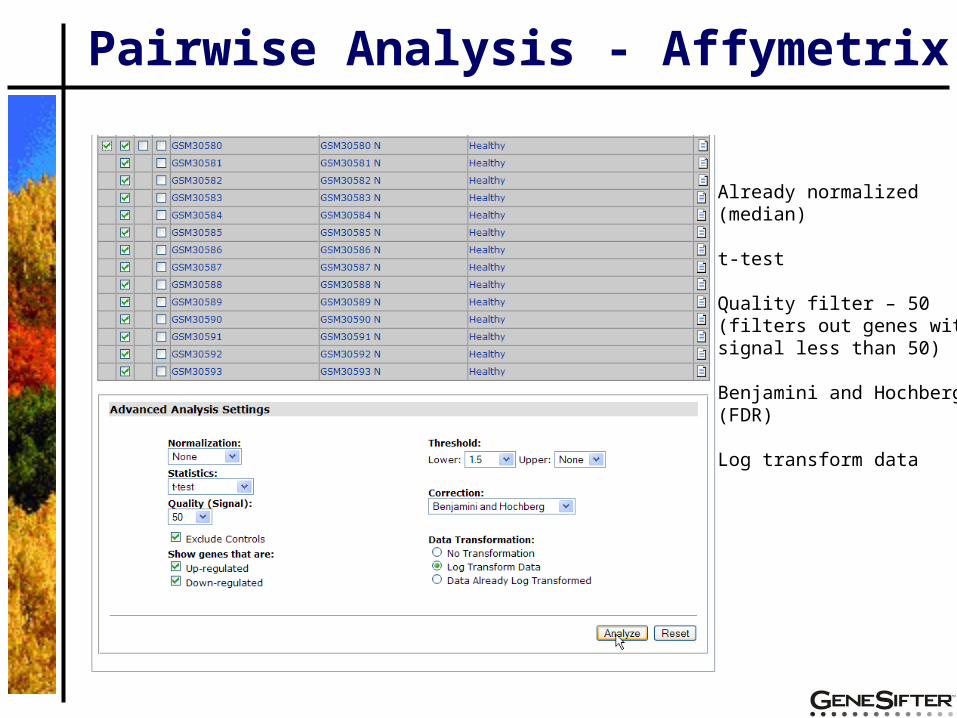
Already normalized (median)
t-test
Quality filter – 50(filters out genes with signal less than 50)
Benjamini and Hochberg (FDR)
Log transform data
Pairwise Analysis - Affymetrix
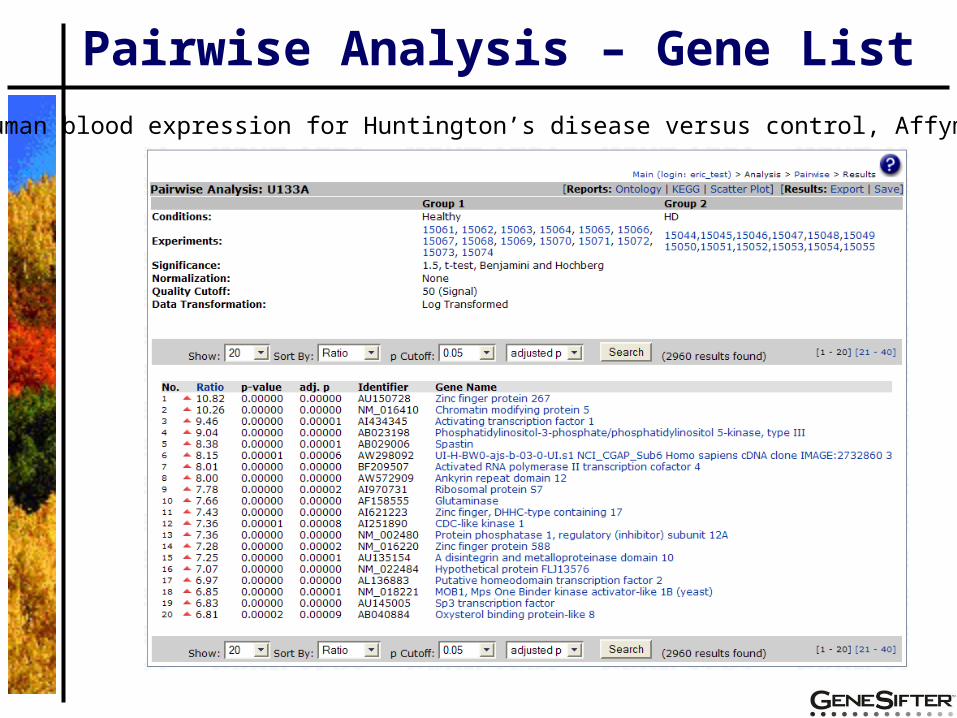
Pairwise Analysis – Gene List
Human blood expression for Huntington’s disease versus control, Affymetrix
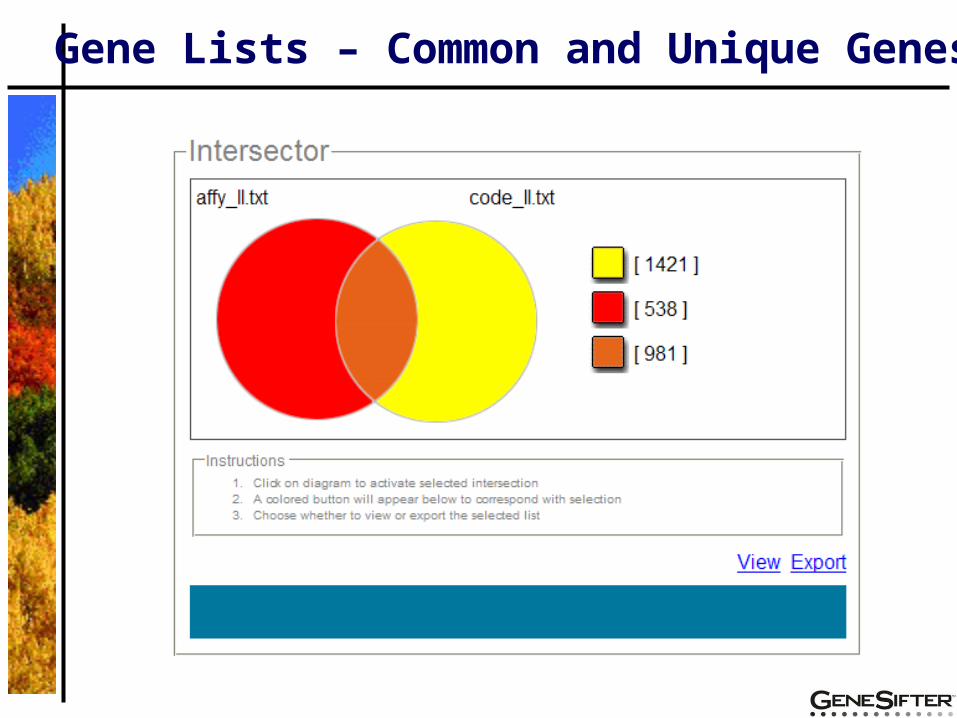
Gene Lists – Common and Unique Genes
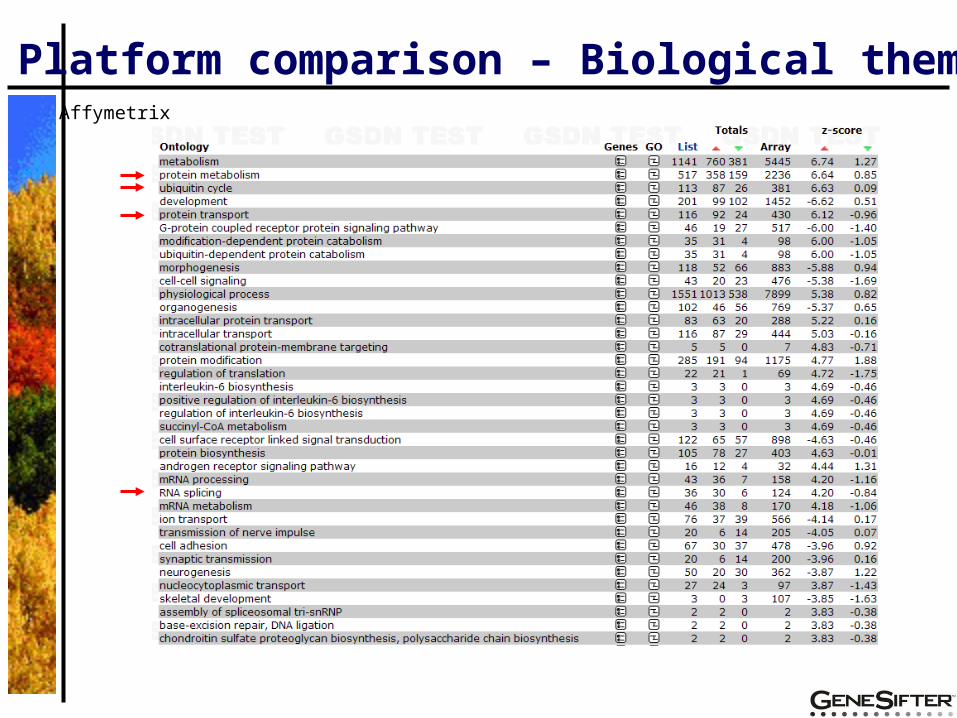
Platform comparison – Biological themesAffymetrix
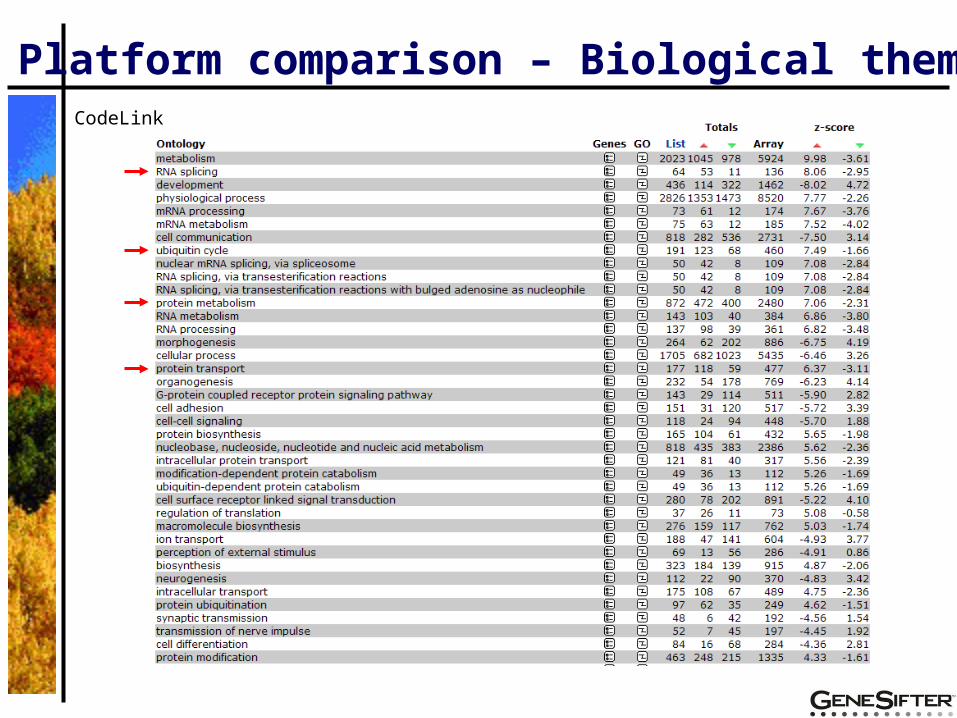
Platform comparison – Biological themesCodeLink

GeneSifter - Analysis Examples
Differential expressionFold changeQualityt-test False discovery rate
Differential expressionFold changeQualityANOVA False discovery rate
VisualizationHierarchical clusteringPCA
PartitioningPAMSilhouettes
Data UploadCodeLink
Biological significanceGene AnnotationOntology reportPathway report
2 groups(Huntingtons Blood vs Healthy Blood)
3 + groups(Time series, dose response, etc.)
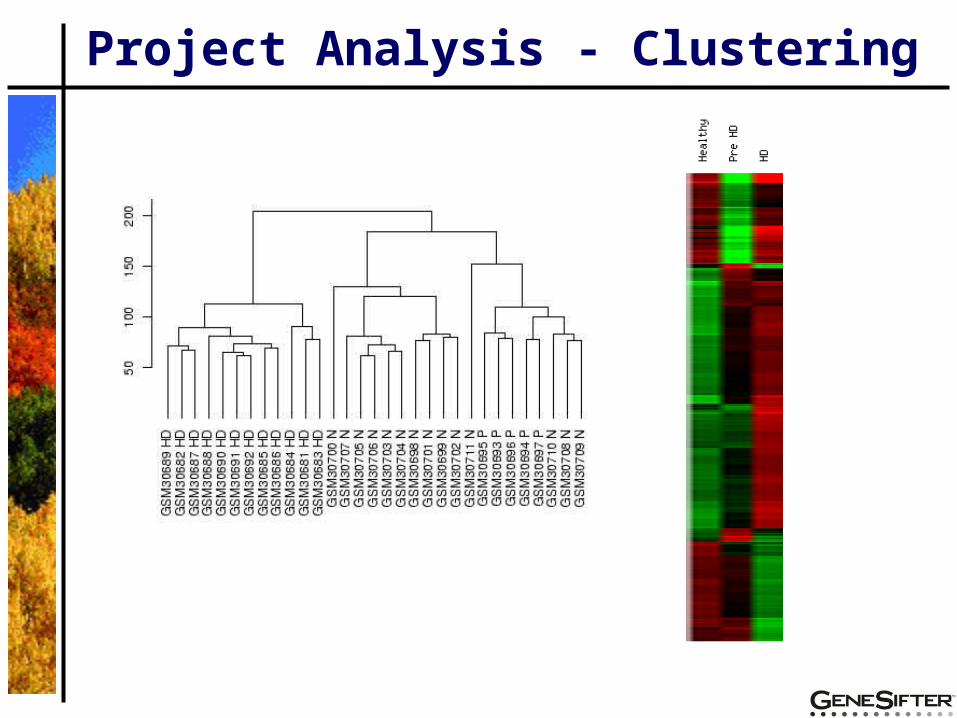
Project Analysis - Clustering
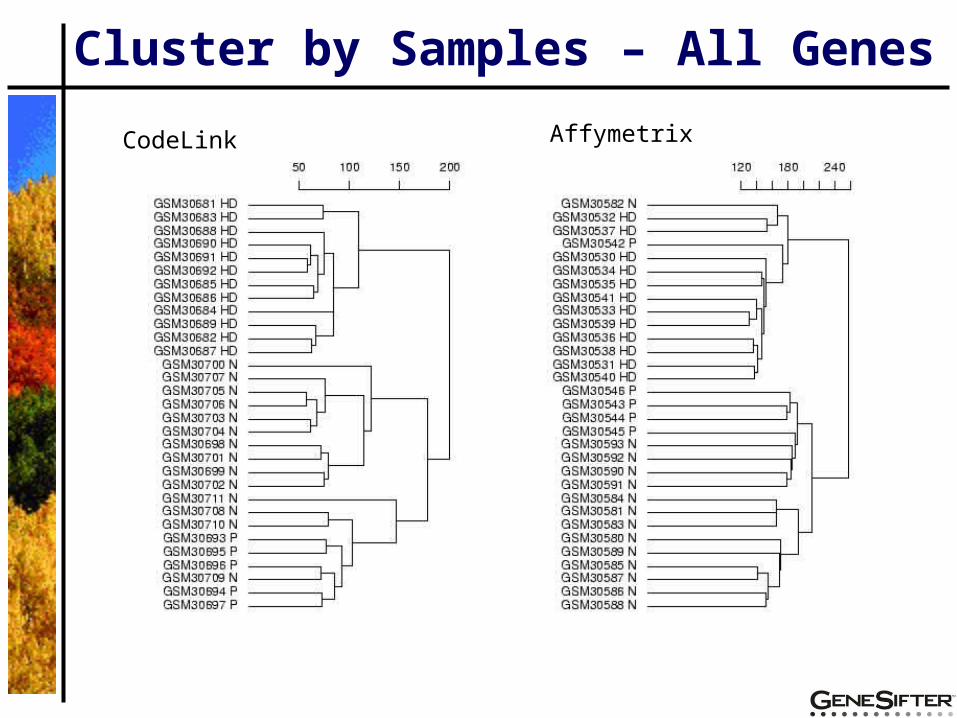
Cluster by Samples – All Genes
CodeLink Affymetrix
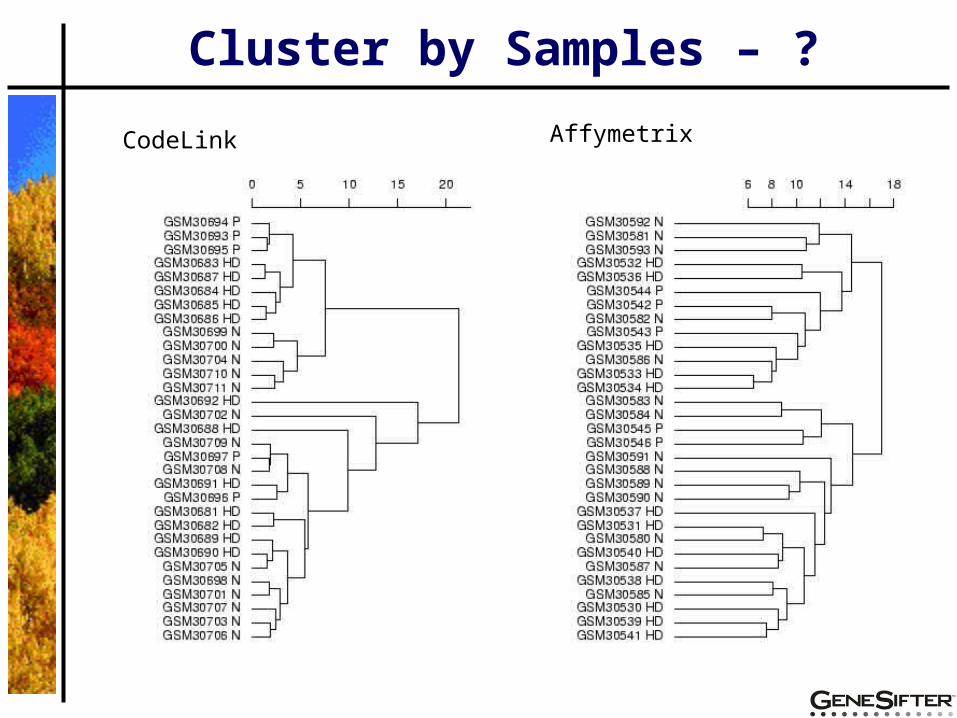
Cluster by Samples – ?
CodeLink Affymetrix
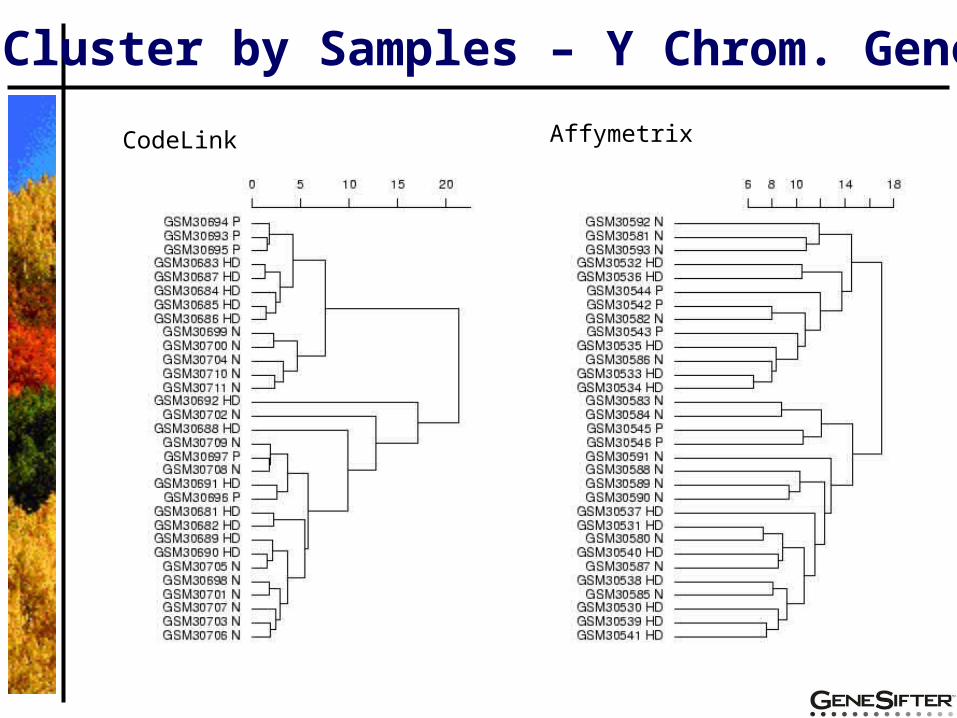
Cluster by Samples – Y Chrom. Genes
CodeLink Affymetrix
Platform Comparison - Summary
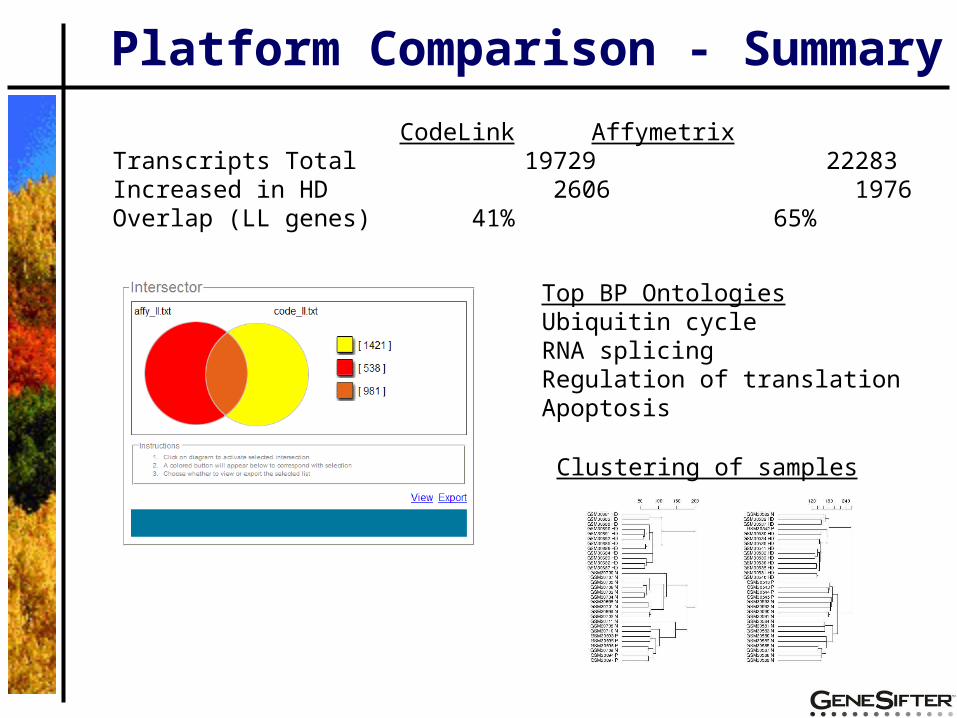
CodeLink AffymetrixTranscripts Total 19729 22283Increased in HD 2606 1976Overlap (LL genes) 41% 65%
Top BP OntologiesUbiquitin cycleRNA splicingRegulation of translationApoptosis
Clustering of samples
Platform Comparison - Summary
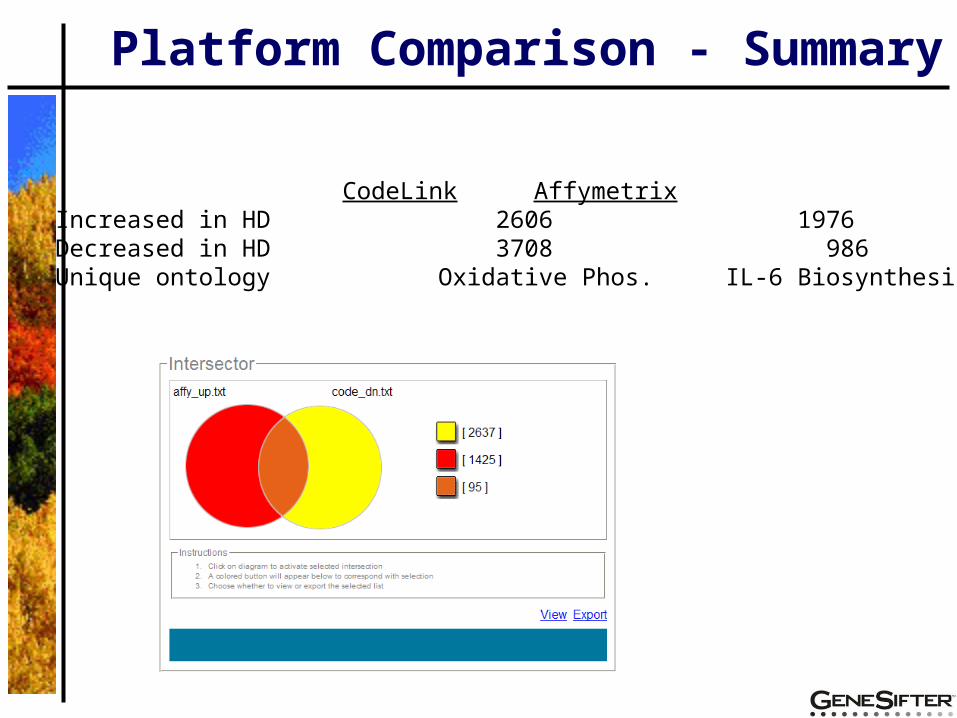
CodeLink AffymetrixIncreased in HD 2606 1976Decreased in HD 3708 986Unique ontology Oxidative Phos. IL-6 Biosynthesis
DataDataPublicationPublication
BiologicalBiologicalSignificanceSignificance
Differential Differential ExpressionExpression
System System AccessAccess
DataDataManagementManagement
PlatformPlatformSelectionSelection
Experiment Experiment DesignDesign
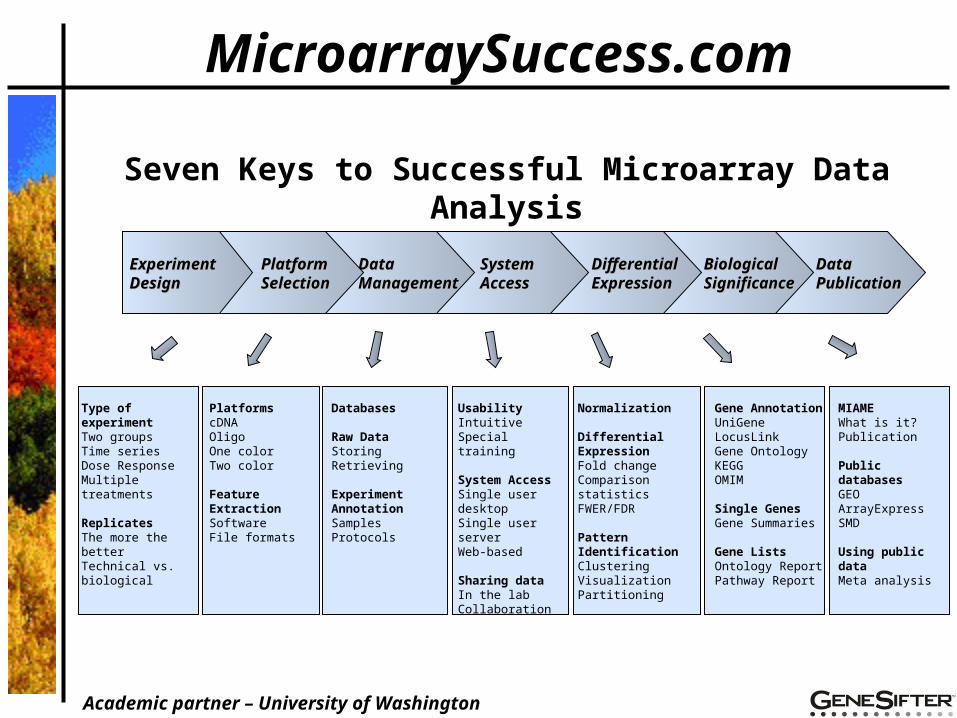
Type of experimentTwo groupsTime seriesDose ResponseMultiple treatments
ReplicatesThe more the betterTechnical vs. biological
PlatformscDNAOligoOne colorTwo color
Feature ExtractionSoftwareFile formats
Databases
Raw DataStoringRetrieving
Experiment AnnotationSamplesProtocols
UsabilityIntuitiveSpecial training
System AccessSingle user desktopSingle user serverWeb-based
Sharing dataIn the labCollaboration
Normalization
Differential ExpressionFold changeComparison statisticsFWER/FDR
Pattern IdentificationClusteringVisualizationPartitioning
Gene AnnotationUniGeneLocusLinkGene OntologyKEGGOMIM
Single GenesGene Summaries
Gene ListsOntology ReportPathway Report
MIAMEWhat is it?Publication
Public databasesGEOArrayExpressSMD
Using public dataMeta analysis
Seven Keys to Successful Microarray Data Analysis
MicroarraySuccess.com
Academic partner – University of Washington

The GeneSifter Data Center
www.genesifter.net/dc
Eric Olson
Thank You
www.genesifter.netTrial account, tutorials, sample data and Data Center
CodeLink compatible