Embed Size (px)
Citation preview

February 28 - March 2, 2016
Oscar Landerretche M. Chairman of the Board
BMO CAPITAL MARKETS 25th GLOBAL METALS & MINING CONFERENCE
CODELCO: RECENT DEVELOPMENTS AND PERSPECTIVES
2 Copyrights© 2015 CODELCO-CHILE. Todos los Derechos Reservados. | Copyrights© 2015 by CODELCO-CHILE. All Rights Reserved.
CODELCO HIGHLIGHTS
Copyrights© 2015 CODELCO-CHILE. Todos los Derechos Reservados. | Copyrights© 2015 by CODELCO-CHILE. All Rights Reserved. 3
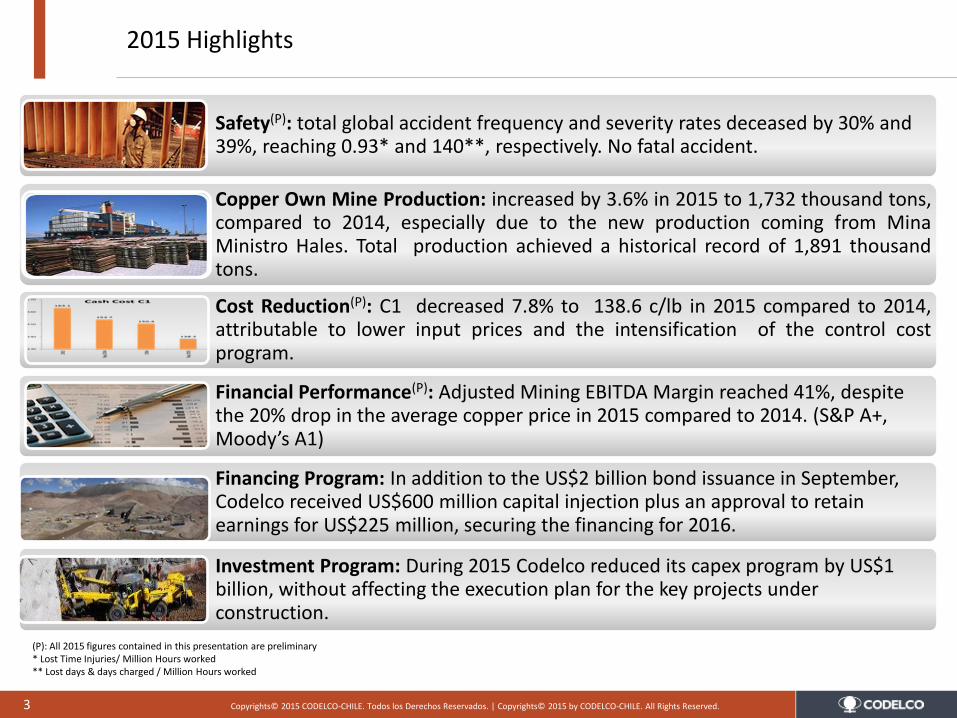
2015 Highlights
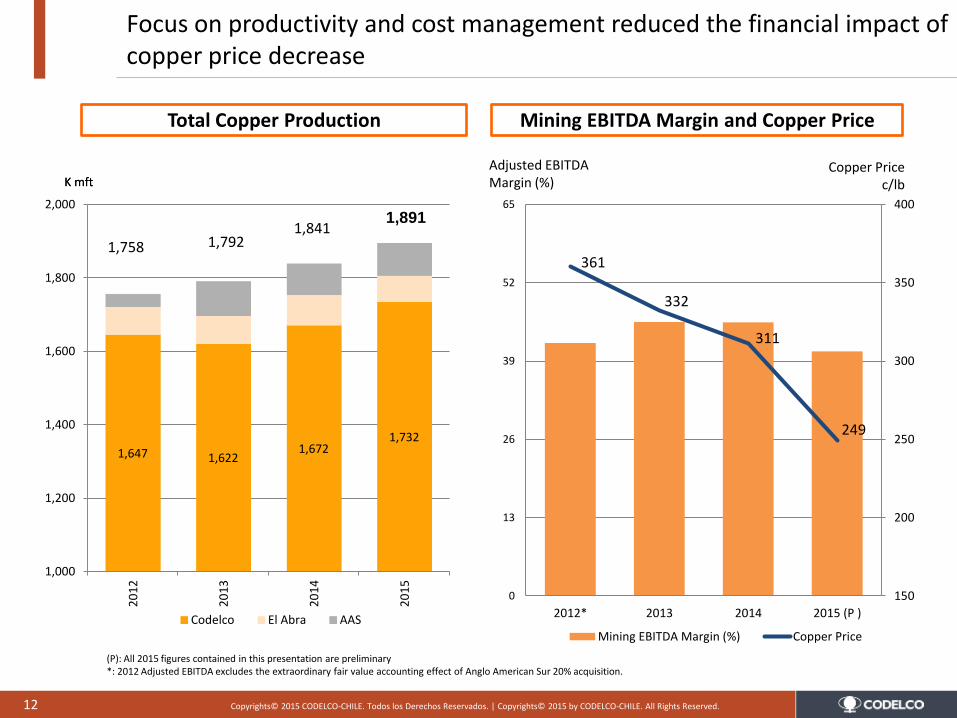
Copper Own Mine Production: increased by 3.6% in 2015 to 1,732 thousand tons, compared to 2014, especially due to the new production coming from Mina Ministro Hales. Total production achieved a historical record of 1,891 thousand tons.
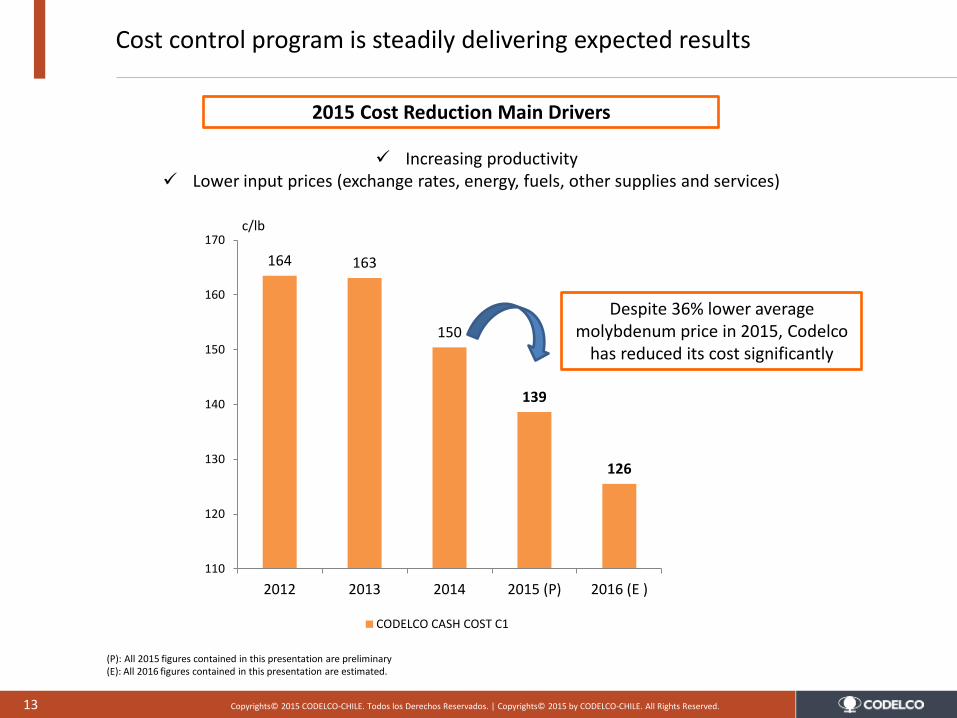
Cost Reduction(P): C1 decreased 7.8% to 138.6 c/lb in 2015 compared to 2014, attributable to lower input prices and the intensification of the control cost program.
Financial Performance(P): Adjusted Mining EBITDA Margin reached 41%, despite the 20% drop in the average copper price in 2015 compared to 2014. (S&P A+, Moody’s A1)
Financing Program: In addition to the US$2 billion bond issuance in September, Codelco received US$600 million capital injection plus an approval to retain earnings for US$225 million, securing the financing for 2016.
Investment Program: During 2015 Codelco reduced its capex program by US$1 billion, without affecting the execution plan for the key projects under construction.
Safety(P): total global accident frequency and severity rates deceased by 30% and 39%, reaching 0.93* and 140**, respectively. No fatal accident.
(P): All 2015 figures contained in this presentation are preliminary * Lost Time Injuries/ Million Hours worked ** Lost days & days charged / Million Hours worked
Copyrights© 2015 CODELCO-CHILE. Todos los Derechos Reservados. | Copyrights© 2015 by CODELCO-CHILE. All Rights Reserved. 4
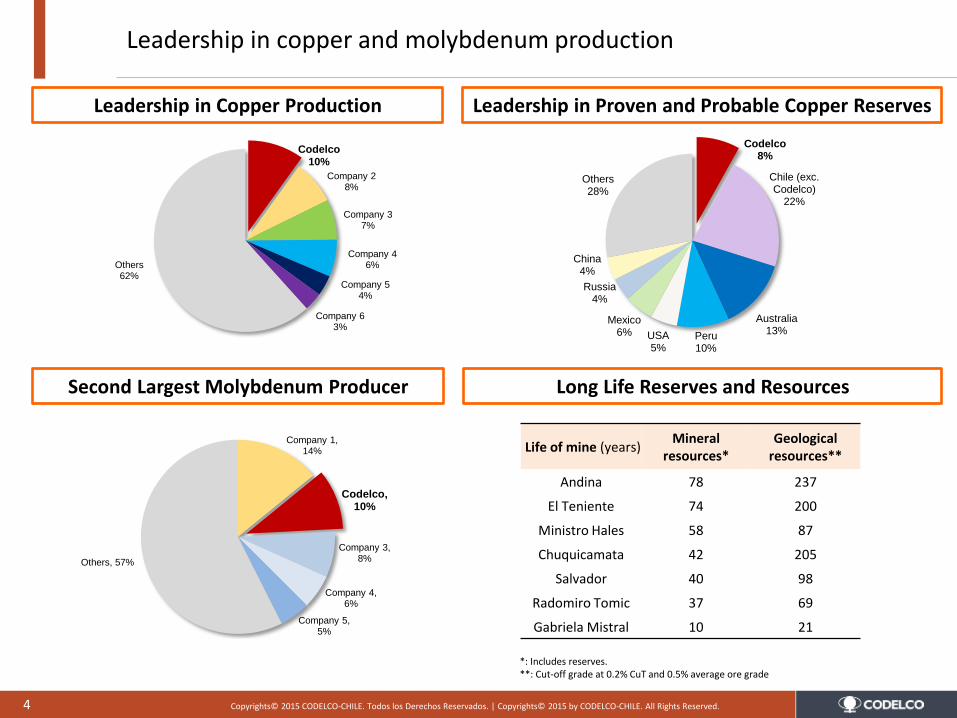
Leadership in copper and molybdenum production
Long Life Reserves and Resources
Leadership in Proven and Probable Copper Reserves Leadership in Copper Production
Second Largest Molybdenum Producer
Codelco 8%
Chile (exc. Codelco)
22%
Australia 13%
Peru 10%
USA 5%
Mexico 6%
Russia 4%
China 4%
Others 28%
Codelco 10%
Company 2 8%
Company 3 7%
Company 4 6%
Company 5 4%
Company 6 3%
Others 62%
Company 1, 14%
Codelco, 10%
Company 3, 8%
Company 4, 6%
Company 5, 5%
Others, 57%
Life of mine (years) Mineral
resources* Geological
resources**
Andina 78 237
El Teniente 74 200
Ministro Hales 58 87
Chuquicamata 42 205
Salvador 40 98
Radomiro Tomic 37 69
Gabriela Mistral 10 21
*: Includes reserves. **: Cut-off grade at 0.2% CuT and 0.5% average ore grade
Copyrights© 2015 CODELCO-CHILE. Todos los Derechos Reservados. | Copyrights© 2015 by CODELCO-CHILE. All Rights Reserved. 5
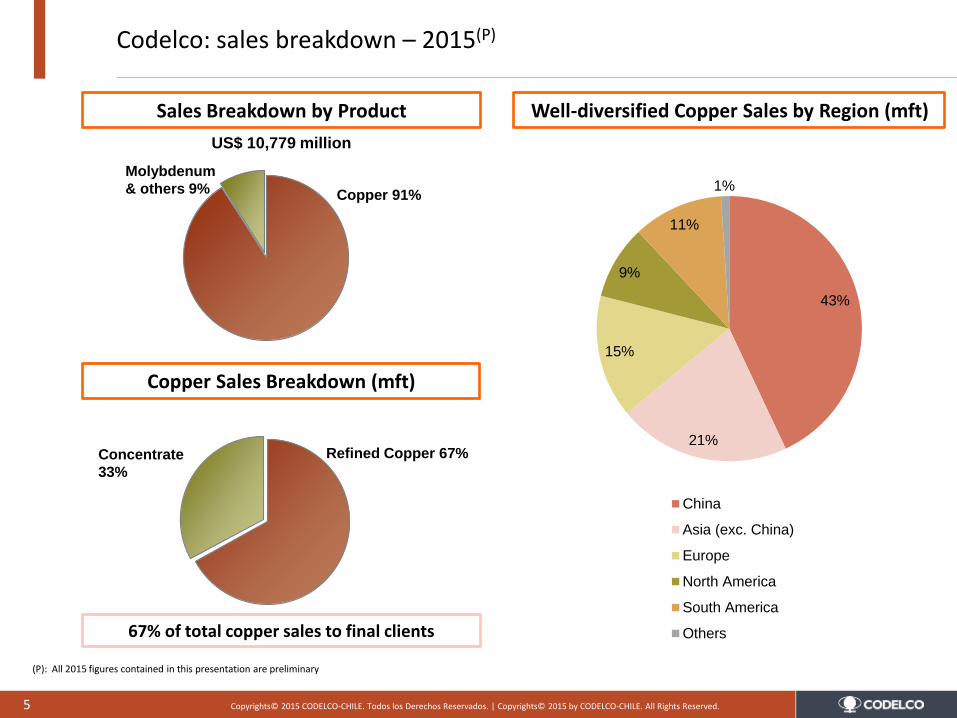
Codelco: sales breakdown – 2015(P)
Refined Copper 67% Concentrate
33%
Well-diversified Copper Sales by Region (mft)
Copper Sales Breakdown (mft)
Sales Breakdown by Product
43%
21%
15%
9%
11%
1%
China
Asia (exc. China)
Europe
North America
South America
Others67% of total copper sales to final clients
Copper 91%
Molybdenum
& others 9%
US$ 10,779 million
(P): All 2015 figures contained in this presentation are preliminary
Copyrights© 2015 CODELCO-CHILE. Todos los Derechos Reservados. | Copyrights© 2015 by CODELCO-CHILE. All Rights Reserved. 6
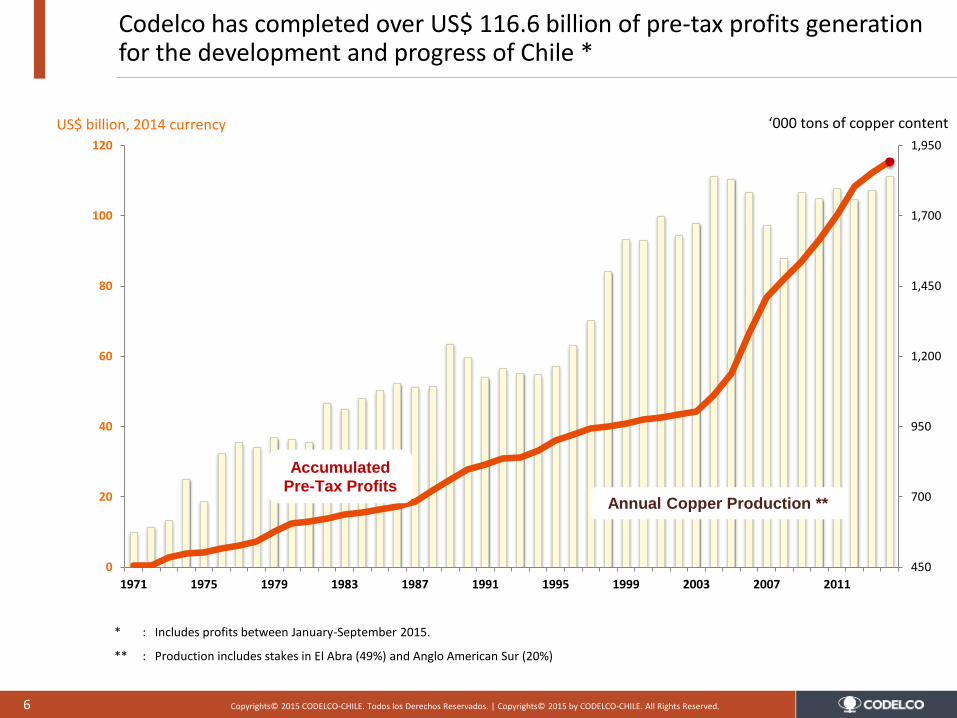
Codelco has completed over US$ 116.6 billion of pre-tax profits generation for the development and progress of Chile *
* : Includes profits between January-September 2015.
** : Production includes stakes in El Abra (49%) and Anglo American Sur (20%)
450
700
950
1,200
1,450
1,700
1,950
0
20
40
60
80
100
120
1971 1975 1979 1983 1987 1991 1995 1999 2003 2007 2011
Accumulated Pre-Tax Profits
Annual Copper Production **
US$ billion, 2014 currency ‘000 tons of copper content
7 Copyrights© 2015 CODELCO-CHILE. Todos los Derechos Reservados. | Copyrights© 2015 by CODELCO-CHILE. All Rights Reserved.
COPPER MARKET
8 Copyrights© 2015 CODELCO-CHILE. Todos los Derechos Reservados. | Copyrights© 2015 by CODELCO-CHILE. All Rights Reserved.
Copper price
c/lb
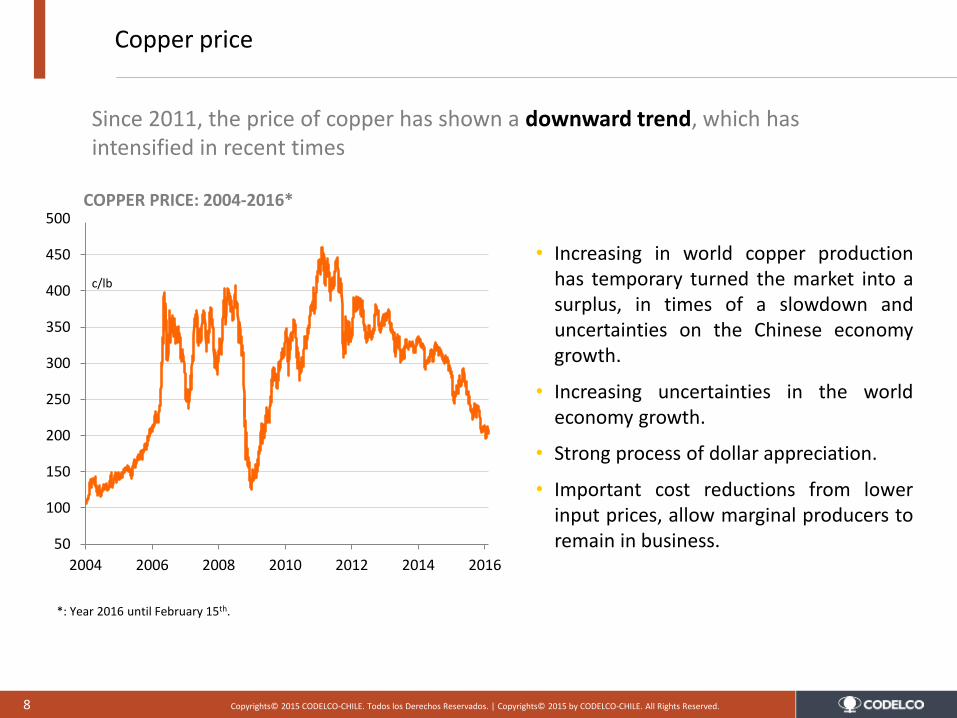
*: Year 2016 until February 15th.
50
100
150
200
250
300
350
400
450
500
2004 2006 2008 2010 2012 2014 2016
COPPER PRICE: 2004-2016*
Since 2011, the price of copper has shown a downward trend, which has intensified in recent times
• Increasing in world copper production has temporary turned the market into a surplus, in times of a slowdown and uncertainties on the Chinese economy growth.
• Increasing uncertainties in the world economy growth.
• Strong process of dollar appreciation.
• Important cost reductions from lower input prices, allow marginal producers to remain in business.
Copyrights© 2015 CODELCO-CHILE. Todos los Derechos Reservados. | Copyrights© 2015 by CODELCO-CHILE. All Rights Reserved. 9
Market outlook for the following years 2016 currency
-100
0
100
200
300
400
2015 2016 2017 2018 2019 2020
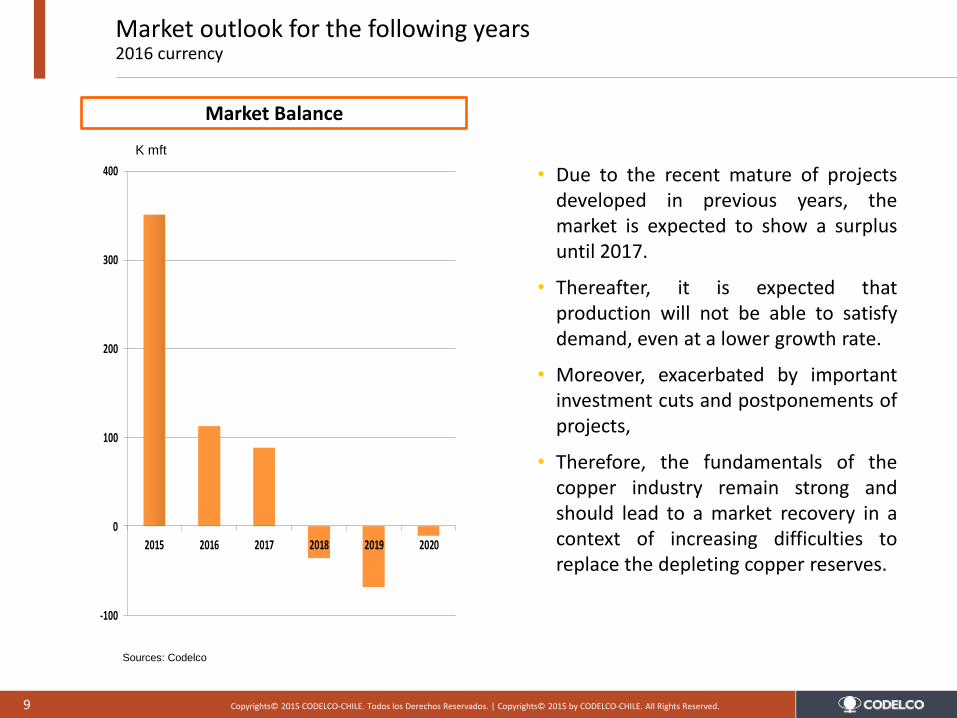
Sources: Codelco
Market Balance
K mft
• Due to the recent mature of projects developed in previous years, the market is expected to show a surplus until 2017.
• Thereafter, it is expected that production will not be able to satisfy demand, even at a lower growth rate.
• Moreover, exacerbated by important investment cuts and postponements of projects,
• Therefore, the fundamentals of the copper industry remain strong and should lead to a market recovery in a context of increasing difficulties to replace the depleting copper reserves.
Copyrights© 2015 CODELCO-CHILE. Todos los Derechos Reservados. | Copyrights© 2015 by CODELCO-CHILE. All Rights Reserved. 10
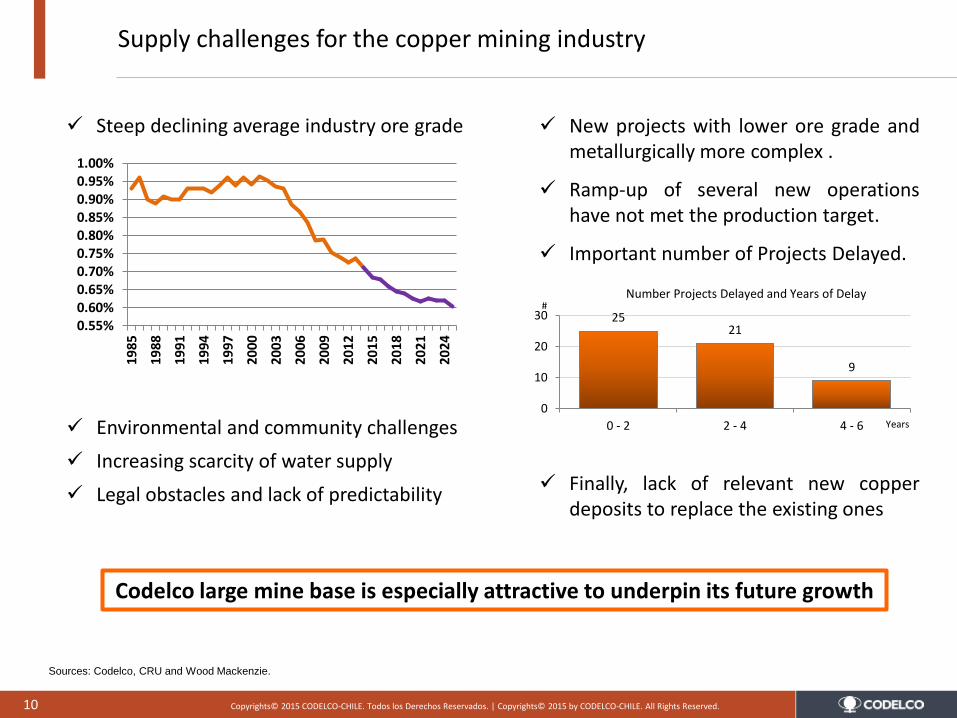
Steep declining average industry ore grade
Environmental and community challenges
Increasing scarcity of water supply
Legal obstacles and lack of predictability
New projects with lower ore grade and metallurgically more complex .
Ramp-up of several new operations have not met the production target.
Important number of Projects Delayed.
Finally, lack of relevant new copper deposits to replace the existing ones
Sources: Codelco, CRU and Wood Mackenzie.
Supply challenges for the copper mining industry
Number Projects Delayed and Years of Delay
0.55%0.60%0.65%0.70%0.75%0.80%0.85%0.90%0.95%1.00%
19
85
19
88
19
91
19
94
19
97
20
00
200
3
20
06
20
09
20
12
20
15
20
18
20
21
202
4
25 21
9
0
10
20
30
0 - 2 2 - 4 4 - 6
#
Years
Codelco large mine base is especially attractive to underpin its future growth
11 Copyrights© 2015 CODELCO-CHILE. Todos los Derechos Reservados. | Copyrights© 2015 by CODELCO-CHILE. All Rights Reserved.
CODELCO’S OPERATING AND FINANCIAL REVIEW
Copyrights© 2015 CODELCO-CHILE. Todos los Derechos Reservados. | Copyrights© 2015 by CODELCO-CHILE. All Rights Reserved. 12
Focus on productivity and cost management reduced the financial impact of copper price decrease
Adjusted EBITDA Margin (%)
Copper Price c/lb
(P): All 2015 figures contained in this presentation are preliminary *: 2012 Adjusted EBITDA excludes the extraordinary fair value accounting effect of Anglo American Sur 20% acquisition.
K mft
361
332
311
249
150
200
250
300
350
400
0
13
26
39
52
65
2012* 2013 2014 2015 (P )
Mining EBITDA Margin (%) Copper Price
K mft
1,647 1,622 1,672
1,732
1,000
1,200
1,400
1,600
1,800
2,000
20
12
20
13
20
14
20
15
Codelco El Abra AAS
1,758
1,891
1,792 1,841
Total Copper Production Mining EBITDA Margin and Copper Price
Copyrights© 2015 CODELCO-CHILE. Todos los Derechos Reservados. | Copyrights© 2015 by CODELCO-CHILE. All Rights Reserved. 13
Cost control program is steadily delivering expected results
c/lb
164 163
150
139
126
110
120
130
140
150
160
170
2012 2013 2014 2015 (P) 2016 (E )
CODELCO CASH COST C1
Increasing productivity Lower input prices (exchange rates, energy, fuels, other supplies and services)
Despite 36% lower average molybdenum price in 2015, Codelco
has reduced its cost significantly
2015 Cost Reduction Main Drivers
(P): All 2015 figures contained in this presentation are preliminary (E): All 2016 figures contained in this presentation are estimated.
14 Copyrights© 2015 CODELCO-CHILE. Todos los Derechos Reservados. | Copyrights© 2015 by CODELCO-CHILE. All Rights Reserved.
CODELCO’S CURRENT OPERATIONS AND THEIR FUTURE TRANSFORMATION
Copyrights© 2015 CODELCO-CHILE. Todos los Derechos Reservados. | Copyrights© 2015 by CODELCO-CHILE. All Rights Reserved. 15
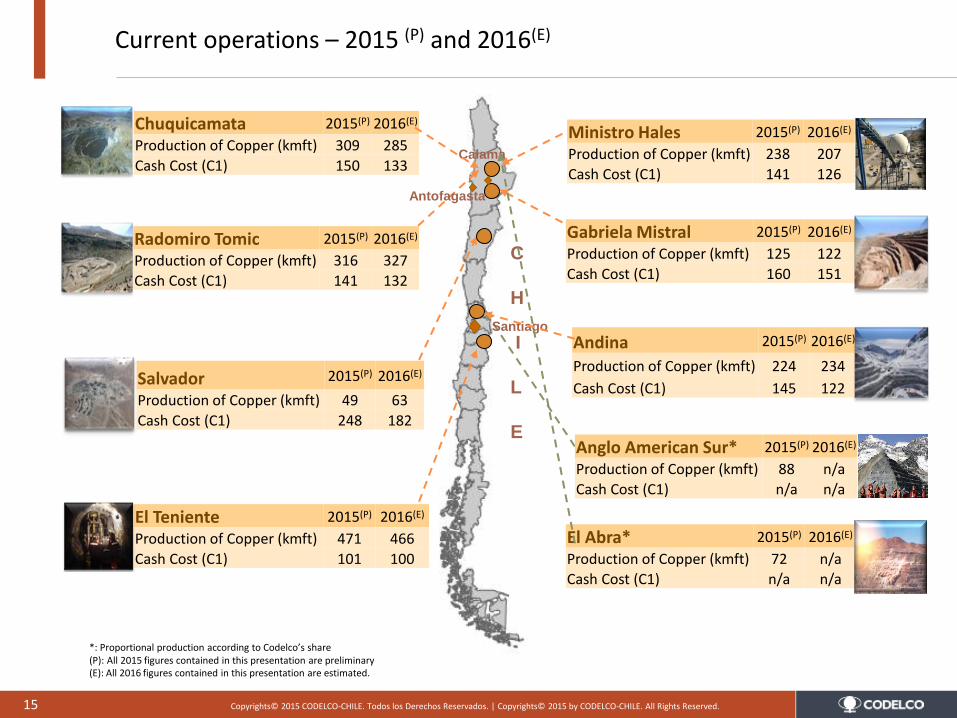
Current operations – 2015 (P) and 2016(E)
Santiago
Calama
C
H
I
L
E
Antofagasta
Radomiro Tomic 2015(P) 2016(E)
Production of Copper (kmft) 316 327
Cash Cost (C1) 141 132
Gabriela Mistral 2015(P) 2016(E)
Production of Copper (kmft) 125 122
Cash Cost (C1) 160 151
Salvador 2015(P) 2016(E)
Production of Copper (kmft) 49 63
Cash Cost (C1) 248 182
Andina 2015(P) 2016(E)
Production of Copper (kmft) 224 234
Cash Cost (C1) 145 122
El Teniente 2015(P) 2016(E)
Production of Copper (kmft) 471 466
Cash Cost (C1) 101 100
Chuquicamata 2015(P) 2016(E)
Production of Copper (kmft) 309 285
Cash Cost (C1) 150 133
El Abra* 2015(P) 2016(E)
Production of Copper (kmft) 72 n/a
Cash Cost (C1) n/a n/a
Anglo American Sur* 2015(P) 2016(E)
Production of Copper (kmft) 88 n/a
Cash Cost (C1) n/a n/a
Ministro Hales 2015(P) 2016(E)
Production of Copper (kmft) 238 207
Cash Cost (C1) 141 126
*: Proportional production according to Codelco’s share (P): All 2015 figures contained in this presentation are preliminary (E): All 2016 figures contained in this presentation are estimated.
Copyrights© 2015 CODELCO-CHILE. Todos los Derechos Reservados. | Copyrights© 2015 by CODELCO-CHILE. All Rights Reserved. 16
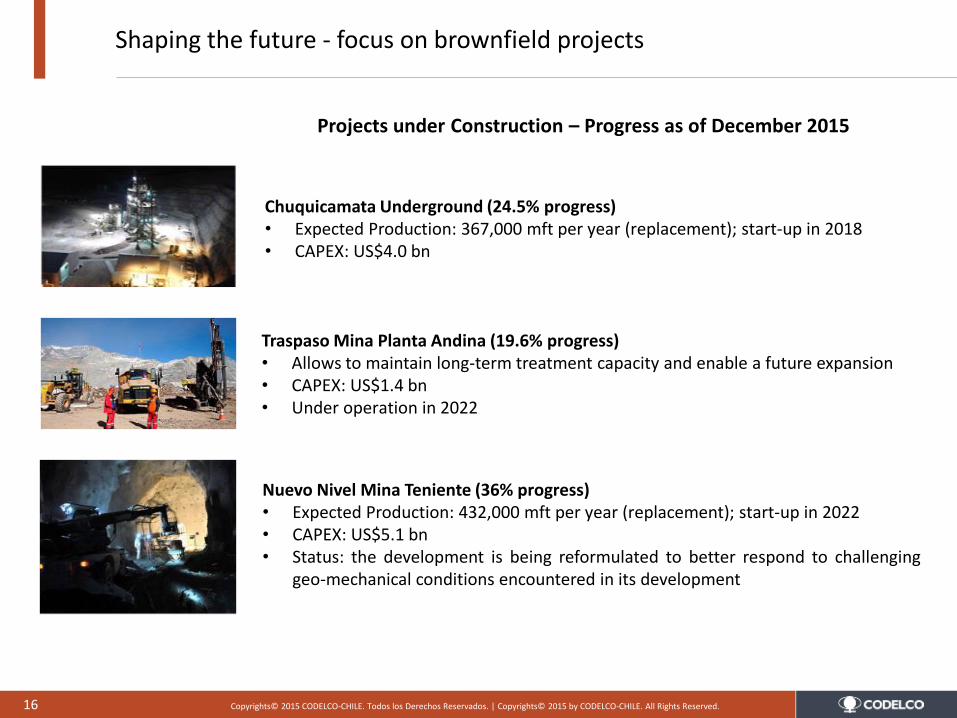
Shaping the future - focus on brownfield projects
Chuquicamata Underground (24.5% progress) • Expected Production: 367,000 mft per year (replacement); start-up in 2018 • CAPEX: US$4.0 bn
Traspaso Mina Planta Andina (19.6% progress) • Allows to maintain long-term treatment capacity and enable a future expansion • CAPEX: US$1.4 bn • Under operation in 2022
Projects under Construction – Progress as of December 2015
Nuevo Nivel Mina Teniente (36% progress) • Expected Production: 432,000 mft per year (replacement); start-up in 2022 • CAPEX: US$5.1 bn • Status: the development is being reformulated to better respond to challenging
geo-mechanical conditions encountered in its development
Copyrights© 2015 CODELCO-CHILE. Todos los Derechos Reservados. | Copyrights© 2015 by CODELCO-CHILE. All Rights Reserved. 17
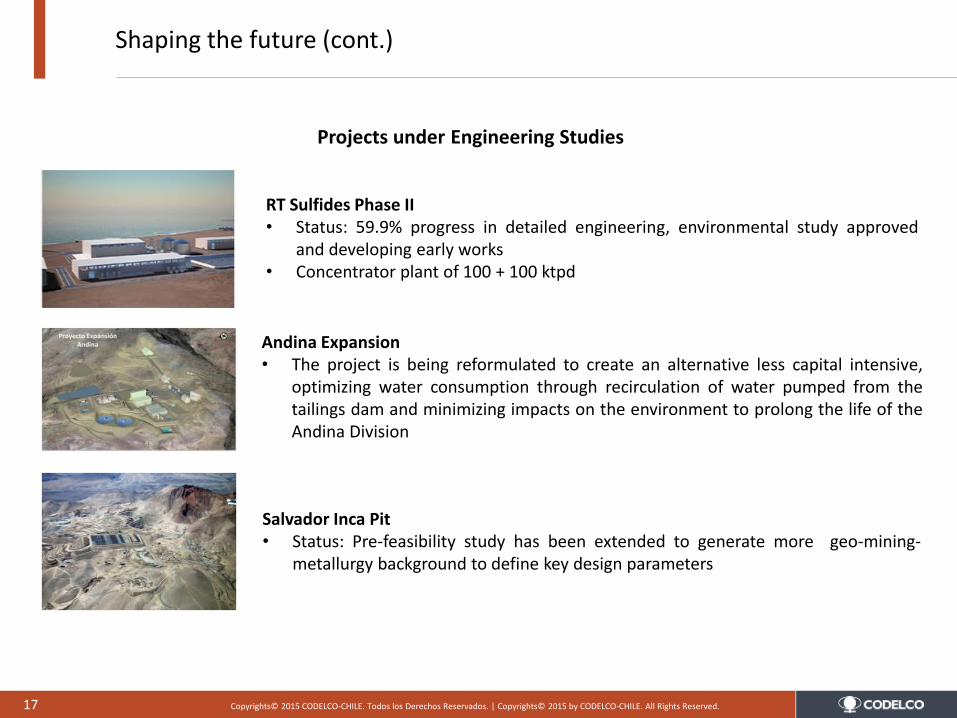
Shaping the future (cont.)
RT Sulfides Phase II • Status: 59.9% progress in detailed engineering, environmental study approved
and developing early works • Concentrator plant of 100 + 100 ktpd
Andina Expansion • The project is being reformulated to create an alternative less capital intensive,
optimizing water consumption through recirculation of water pumped from the tailings dam and minimizing impacts on the environment to prolong the life of the Andina Division
Projects under Engineering Studies
Salvador Inca Pit • Status: Pre-feasibility study has been extended to generate more geo-mining-
metallurgy background to define key design parameters
18 Copyrights© 2015 CODELCO-CHILE. Todos los Derechos Reservados. | Copyrights© 2015 by CODELCO-CHILE. All Rights Reserved.
CODELCO STRATEGY
Copyrights© 2015 CODELCO-CHILE. Todos los Derechos Reservados. | Copyrights© 2015 by CODELCO-CHILE. All Rights Reserved. 19
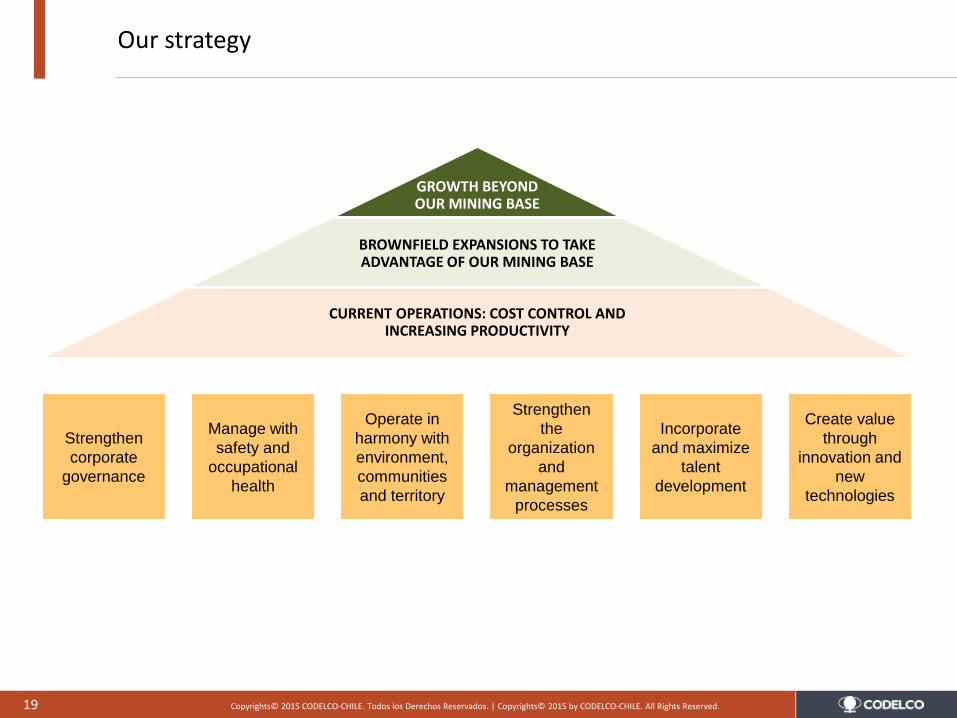
Our strategy
Strengthen
corporate
governance
Manage with
safety and
occupational
health
Operate in
harmony with
environment,
communities
and territory
Strengthen
the
organization
and
management
processes
Create value
through
innovation and
new
technologies
Incorporate
and maximize
talent
development
GROWTH BEYOND OUR MINING BASE
BROWNFIELD EXPANSIONS TO TAKE ADVANTAGE OF OUR MINING BASE
CURRENT OPERATIONS: COST CONTROL AND INCREASING PRODUCTIVITY
Copyrights© 2015 CODELCO-CHILE. Todos los Derechos Reservados. | Copyrights© 2015 by CODELCO-CHILE. All Rights Reserved. 20
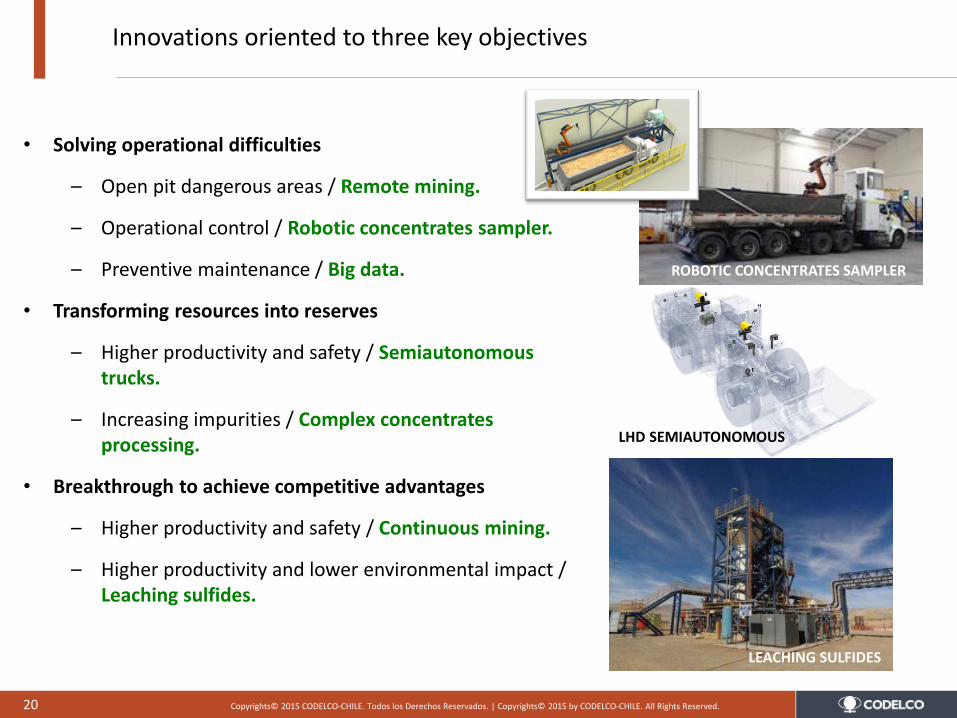
Innovations oriented to three key objectives
• Solving operational difficulties
– Open pit dangerous areas / Remote mining.
– Operational control / Robotic concentrates sampler.
– Preventive maintenance / Big data.
• Transforming resources into reserves
– Higher productivity and safety / Semiautonomous trucks.
– Increasing impurities / Complex concentrates processing.
• Breakthrough to achieve competitive advantages
– Higher productivity and safety / Continuous mining.
– Higher productivity and lower environmental impact / Leaching sulfides.
ROBOTIC CONCENTRATES SAMPLER
LHD SEMIAUTONOMOUS
LEACHING SULFIDES
21 Copyrights© 2015 CODELCO-CHILE. Todos los Derechos Reservados. | Copyrights© 2015 by CODELCO-CHILE. All Rights Reserved.
FINANCING PLAN
Copyrights© 2015 CODELCO-CHILE. Todos los Derechos Reservados. | Copyrights© 2015 by CODELCO-CHILE. All Rights Reserved. 22
0
500
1000
1500
2000
2500
16 17 18 19 20 21 22 23 24 25 35 36 42 43 44
Local bonds International bonds Bank debt
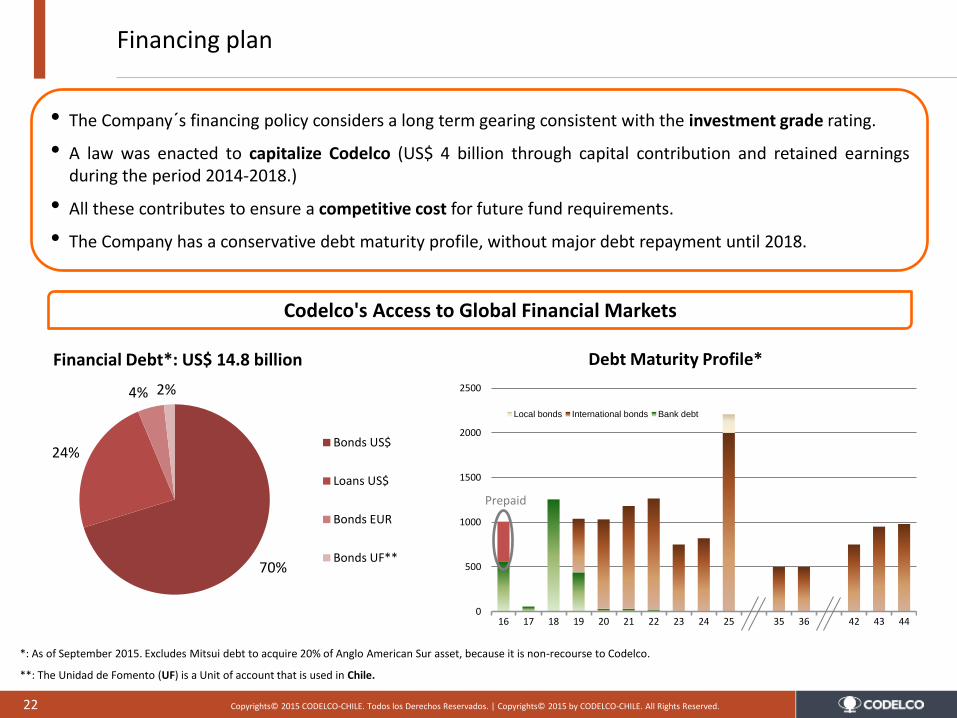
Financing plan
Codelco's Access to Global Financial Markets
70%
24%
4% 2%
Financial Debt*: US$ 14.8 billion
Bonds US$
Loans US$
Bonds EUR
Bonds UF**
*: As of September 2015. Excludes Mitsui debt to acquire 20% of Anglo American Sur asset, because it is non-recourse to Codelco.
**: The Unidad de Fomento (UF) is a Unit of account that is used in Chile.
Debt Maturity Profile*
• The Company´s financing policy considers a long term gearing consistent with the investment grade rating.
• A law was enacted to capitalize Codelco (US$ 4 billion through capital contribution and retained earnings during the period 2014-2018.)
• All these contributes to ensure a competitive cost for future fund requirements.
• The Company has a conservative debt maturity profile, without major debt repayment until 2018.
Prepaid
23 Copyrights© 2015 CODELCO-CHILE. Todos los Derechos Reservados. | Copyrights© 2015 by CODELCO-CHILE. All Rights Reserved.
SUMMARY
Copyrights© 2015 CODELCO-CHILE. Todos los Derechos Reservados. | Copyrights© 2015 by CODELCO-CHILE. All Rights Reserved. 24
In summary
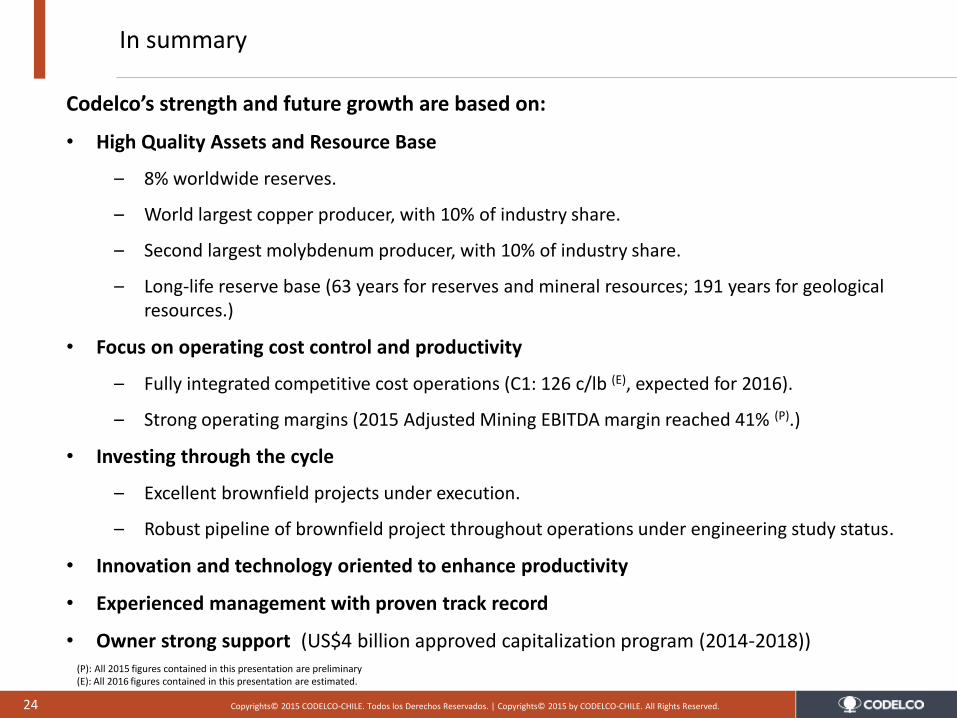
Codelco’s strength and future growth are based on:
• High Quality Assets and Resource Base
– 8% worldwide reserves.
– World largest copper producer, with 10% of industry share.
– Second largest molybdenum producer, with 10% of industry share.
– Long-life reserve base (63 years for reserves and mineral resources; 191 years for geological resources.)
• Focus on operating cost control and productivity
– Fully integrated competitive cost operations (C1: 126 c/lb (E), expected for 2016).
– Strong operating margins (2015 Adjusted Mining EBITDA margin reached 41% (P).)
• Investing through the cycle
– Excellent brownfield projects under execution.
– Robust pipeline of brownfield project throughout operations under engineering study status.
• Innovation and technology oriented to enhance productivity
• Experienced management with proven track record
• Owner strong support (US$4 billion approved capitalization program (2014-2018)) (P): All 2015 figures contained in this presentation are preliminary (E): All 2016 figures contained in this presentation are estimated.
Copyrights© 2015 CODELCO-CHILE. Todos los Derechos Reservados. | Copyrights© 2015 by CODELCO-CHILE. All Rights Reserved. 25
This presentation has been prepared by Corporación Nacional del Cobre de Chile (“Codelco” or the “Company”) This presentation does
not constitute or form part of an offer or any solicitation to any other person or to the general public to subscribe for or otherwise acquire
securities issued by Codelco in any jurisdiction or an inducement to enter into investment activity, nor shall it (or any part of it) or the fact
of its distribution or availability, form the basis of, or be relied on in connection with, or act as any inducement to enter into, any contract or
commitment or investment decision.
The information contained in this independently presentation has not been verified and is subject to change without notice. No
representation or warranty express or implied is made as to and no reliance should be placed on, the fairness, accuracy, completeness or
correctness of the information or the opinions contained herein. None of the Company, any of its respective affiliates, advisers or
representatives shall have any liability whatsoever (in negligence or otherwise) for any loss howsoever arising from any use of this
presentation or its contents or otherwise arising in connection with the presentation.
This presentation is only for persons having professional experience in matters relating to investments and must not be acted or relied on
by people who are not relevant persons.
This presentation includes ‘forward-looking statements’. These statements may include words such as “anticipated”, “believe”, “intend”,
“estimate”, “expect”, “preliminary” and words of similar meaning. All statements other than statements of historical facts included in this
presentation, including, without limitation, those regarding the Company’s financial position, business strategy, plans and objectives of
management for future operations (including development plans and objectives relating to the Company’s products and services) are
forward-looking statements. Such forward-looking statements involve known and unknown risks, uncertainties and other important factors
that could cause the actual results, performance or achievements of the Company to be materially different from future results,
performance or achievements expressed or implied by such forward looking statements. Such forward-looking statements are based on
numerous assumptions regarding the Company’s present and future business strategies and the environment in which the Company will
operate in the future. These forward-looking statements speak only as at the date of this presentation. The Company expressly disclaims
any obligation or undertaking to disseminate any updates or revisions to any forward-looking statements contained herein to reflect any
change in the Company’s expectations with regard thereto or any change in events, conditions or circumstances on which any such
statement is based.
As is standard in the industry, CODELCO divides its mineral holdings into two categories, reserves and resources. Resources are ore
bodies of economic value that have been identified and evaluated through exploration, reconnaissance and sampling. Reserves are the
portion of the resource that can be extracted based on an economic, environmental and technological analysis set forth in the mining
plan. Reserves and resources are both subdivided further, based on the degree of knowledge that CODELCO has of their extent and
composition. The system used by CODELCO for categorizing mineral ore is widely used within the mining industry (and codified in such
international regulations as the Joint One Reserves Committee (JORC) code of Australia, the South African Mineral Resources
Committee (SAMREC), and the Reporting Code of Great Britain). Other systems of categorization are also used; one such system is that
used by the U.S. Geological Survey. This presentation may not be taken away with you. The contents of this presentation may not be
reproduced, redistributed or passed on, directly or indirectly, to any other person or published, in whole or in part, for any purpose.
Disclaimer
February 28 - March 2, 2016
Oscar Landerretche M. Chairman of the Board
BMO CAPITAL MARKETS 25th GLOBAL METALS & MINING CONFERENCE
CODELCO: RECENT DEVELOPMENTS AND PERSPECTIVES
Copyrights© 2015 CODELCO-CHILE. Todos los Derechos Reservados. | Copyrights© 2015 by CODELCO-CHILE. All Rights Reserved. 27
Notes