Embed Size (px)
Citation preview

COCOA RESEARCH INSTITUTE OF GHANA
ANNUAL REPORT
1110
Published byCocoa Research Institute of GhanaNew Tafo-Akim

ISSN 0855 - 0506
Suggested Abbreviation: Rep. Cocoa Res. Inst., Ghana, 2010/2011
© Cocoa Research Institute of Ghana, 2011
All rights reserved. No part of this publication may be reproduced, distributed, or transmitted in any form or by any means, including photocopying, recording, or other electronic or mechanical methods, without the prior written permission of the copyright holder. Application for such permission should be addressed to the publisher.
Cocoa Research Institute of Ghana (CRIG)
P. O. Box 8
New Tafo-Akim
Eastern Region.
Ghana.
Printed in the Republic of Ghana

CONTENTS
Management Committee
Senior Staff List
General Report 01
Plantation Management Division 03
CRIG sub-stations 07
Cocoa Establishment Thrust 15
Cocoa Management Thrust 27
Cocoa Improvement Thrust 59
Cocoa Insects Management Thrust 67
Cocoa Swollen Shoot Virus (CSSV) Thrust 78
Cocoa Fungal Disease Management Thrust 92
New Product Development Thrust 111
Coffee Agronomy Thrust 123
Coffee Improvement Thrust 134
Coffee Pests and Diseases Management Thrust 138a
Kola Development Thrust 139
Shea and Cashew Development Thrust 146

MANAGEMENT COMMITTEE
Cocoa Research Institute of Ghana Annual Report 2010-2011
ChairmanProf. Yaw AhenkorahPost Office Box BC 208Burma Camp, Accra.
MembersMr. Anthony FofieDeputy Chief Executive (A&QC)COCOBOD, Accra
Dr. Yaw Adu-AmpomahExecutive DirectorCocoa Research Institute, Tafo
Rev. (Fr.) Prof. Daniel Mensah BonsuU. C. C., Cape Coast
Dr. M. Owusu-AkyawCrop Research Institute, Kumasi
Mr. F. E. NsiahCSSVD Control Unit, Accra
Mr. Kofi Afrisah NuhuMinistry of Trade & IndustryAccra
Mr. J. A. AsamoahDirector of ResearchCOCOBOD, Accra
Dr. I. Y. OpokuStaff RepresentativeCocoa Research Institute, Tafo
SecretaryMr. A. A. AppletonGeneral Administrative ManagerCocoa Research Institute, Tafo

SENIOR STAFF LIST ( )APRIL 2010 - MARCH 2011
Cocoa Research Institute of Ghana Annual Report 2010-2011
Office of the Executive Director
Executive Director
F.M. Amoah, BSc. (Ghana), Ph.D (London)
Deputy Executive Director (Coffee)
F.K. Oppong, B.Sc. (Ghana), Ph.D. (Bangor)
Deputy Executive Director (Cocoa)
I.Y. Opoku, B.Sc. (KNUST), Ph.D. (Imperial College)
Scientific Secretary
Victress Johnson (Mrs.), BSc. (UCC), M.Phil (Ghana)
Senior Private Secretary
Reindorf Nyarko, Private Secretary Certificate
Administration
Deputy Executive Director(Gen. Admi)
Pauline A. Dadzawa B.A Hons (Ghana),Post Graduate Diploma(GIMPA)
Human Resource Manager
M. Osman Abu, B.A. Hons (Ghana); M.Phil (Ghana) Postgraduate Dip. in Public Admin. (GIMPA)
Prin. Human Resource Officer
Francis Gyamfi Ocran, B.A. Hons. (Ghana), MBA ( Ghana)
Human Resource Officer
Andrew Asamoa Frimpong-Manso, B.M. S
(UCC)
Senior Security Officer
Joshua Matey Osiaw
Security Officer
Richardson Owusu, Dip. in Prison Admin. (Ghana)
Private Secretary
G. Opoku-Agyeman (Mrs), Private Secretary Certificate
Primary School Headmistress Sussana Bismarck, B. Ed. (UCC) M.Ed.Mgt. (UCC) Teachers R.S. Jiagge Dip. Maths Education (UCEW)
P.A. Sersah, B.Ed (UCEW)
Elizabeth Owusua
J.W.K. Degadzor, Dip. Agric. Education (UCC)
E. Ansah Addae
Y.T.Opare Donkor
G. K. Baffoe, B.Ed. (UCEW)
Samuel Obeng Adjei, B.Ed. (UCC)
Gladys Kuwornu, B.Ed (UCEW)
Michael Aboagye Asamoah, B.Ed (UCC)
Seth Twumasi Bosompem, B.Ed (UCC)
Frederick Appiah Ampofo, B.Ed (UCEW )
Benjamin Ofori, B.A. Arts (UCC)
Accounts/Audit
Accounts Manager
John Odametey, ICA (Ghana), MBA(GIMPA)
Accounts Officers
C. K Davudu, HND Accountancy
J.R. Kwami
E.N. Akutey, ICA II
Emmanuel Appiah, ICA I
James Buabeng, ICA I

Cocoa Research Institute of Ghana Annual Report 2010-2011
Dora Tekper, HND Accountancy
John Opoku Arthur HND(Accountancy) MBA(Paris)
Valetine Ahoe
G. K. Tawiah ICA I
Audit Manager
Peter Henson -
Quatey ACCA (UK)
Audit Officer
Isaac Gregory Azumah, ICA(Ghana)
Emmanuel Ampofo, AIA
Scientific Information Division
Information System Manager
E. Attah Asamoah BSc. Computer Science (Ghana)
Public Affairs Officers
Florence Asuamah, Dip. in Journalism
J. Bishop Kabutey, Dip. in Public Relations and
Advertising
Information Systems
Officer
V. Marji Larweh, B. Ap Sc. (RMIT); Dip.
in Stats. (Ghana), BSc Computer Science (KNUST)
Betty Owusu
D. Mills-Robertson (Mrs)
Library Officers
Rose Lowor (Mrs.), Dip. in Librarianship (Ghana) Postgraduate Cert. in Management (UNE)
S. L. Gyamfi, Dip. in Librarianship (Ghana)
Agronomy
Head
K. Opoku Ameyaw, BSc. (Ghana) Ph.D. (Reading)
Research Officers
Kofi Acheampong, M.Sc. (KNUST), M.Phil.
(Reading)
Sampson Konlan, PhD(KNUST)
Patricia L. Adu-Yeboah, B.Sc. (U.S.T)
Technical Officers K.H.Y. Fiawotso, Dip. in Hort. (KNUST) Osei Sarkodie, Dip. in Agric. Mech. (Ghana) E. K. Akpertey H. R. Dorgbadzi
Soil Science Head
K. Ofori-Frimpong, B. Sc. (UCC), Dip. Edu.
(UCC),
Ph.D. (Reading)
A. A. Afrifa, B.Sc. (KNUST), M. Agric Sc. (Reading)
Solomon Acquaye, B.Sc. (U.S.T), Ph.D. (Chiba)
Alfred Arthur, PhD (KNUST)
A. Boateng, BSc. (UCC)
E. Atanga Nyaaba, Dip. in Hort. (KNUST)
S.Y. Mawudeku, Dip. Agric. Ed. (UCEW)
Divine Addo, B.Sc. Lab. Tech. (UCC)
Okrah Gyekye, Diploma in Agric (Ghana)
Entomology
Ag. Head
A.R. Cudjoe, M.Sc (Moscow), Ph.D. (London)
Research Officers
J.E. Sarfo, B.Sc. (Ghana) M.Phil (Ghana)

Cocoa Research Institute of Ghana Annual Report 2010-2011
E. Agyemang Dwomoh, M.Phil (KNUST) Ph.D (KNUST)
R. Adu Acheampong, M.Phil (Ghana), PhD(Imperial)
Godfred Awudzi, B.Sc. (KNUST).
Technical Officers
Abraham K. Nkansah, Dip. in Lab.Tech.(UCC)
S.K. Ahadzi, B.Sc. Agric. (Ghana)
Esther Eunice Koranteng Dip. in Agric(UCC)
Godfred A.Somuah
Plant Breeding
Head
B. Adomako, B.Sc. (KNUST), M.Sc.(Lond), DIC., Ph.D (Wales)
Research Officers
Francis Padi B.Sc. (KNUST), Ph.D.
(UEA, Norwich)
Esther Anim-Kwapong, B.Sc. (Ghana). M. Phil. (Birmingham & Reading).
Enock K. Nsiah, B.Sc. (Ghana) M.Phil (Tromso)
Stephen Yaw Opoku, B.Sc. (Ghana). M. Phil (Ghana)
Ofori Atta, BSc. (Ghana), PhD(Germany)
Mustapha Abu Dadzie, B.Sc. (KNUST).
Paul K.K. Adu-Gyamfi, B.Sc. (KNUST).
Abraham Akpertey, B.Sc. (Ghana).
Technical Officers
S.A. Bosompem
Paul Seglah, Diploma in Statistics (Ghana)
P.E. Mensah, Dip. Lab. Tech. (UCC)
Emmanuel Ewe, Dip. in Agric. (Ghana), BSc (UCC)
Ernest K. K. Akotia, Dip. Hort. (KNUST)
A. Barfi Boamah, Dip in Agric (Ghana)
Debora Cobbina (Mrs), BSC. Agric (UCC)
Doris Akrobor, BSc Agric Tech. (UDS).
Plant Pathology
Head H.K. Dzahini-Obiatey, B.Sc. (Ghana), M.Sc. (Norwich) PhD(Reading)
Research Officers A.Y. Akrofi, B.Sc. (KNUST), M.Sc. (Bristol) M.K. Assuah, BSc. (UCC), M. Phil (Ghana)
Owusu Domfeh, BSc. (KNUST), M.Sc. (Bristol)
G. Akumfi Ameyaw, BSc. (KNUST), PhD (Reading )
Ishmael Amoako Atta, BSc.(KNUST), MSc.(KNUST) Technical Officers
E. Dede Anochi, Dip. in Lab. Tech. (UCC)
D.M. Adoblanui, Dip. Post Harvest Tech. (Ghana)
Osei Asare Bediako, Dip. in Agric. (Ghana)
Mercy Ofori, Lab Mycology Certificate
Rashid Bin Hakeem, Dip. in Agric. Education (UCEW)
S. Akomea Frempong,
Lab. Tech. Diploma (UCC)
Physiology/Biochemistry
Ag. Head
J.F. Takramah, B.Sc. (Ghana), Ph.D.(Windsor)
Research Officers
A. Oppong Dwapayin, B. Sc. (UCC), Dip. in Educ.
S.T. Lowor,

Cocoa Research Institute of Ghana Annual Report 2010-2011
(UCC), Ph.D. (Reading)
S.T. Lowor, B.Sc. M.Phil.(Ghana) PhD (New England
Winifred Oforiwaa Kumi BSC (Ghana) M.Phil. (Ghana)
Mercy Anne Salifu, BSc (KNUST)
Technical Officers
J.N. Boafo, Lab. Tech. Diploma (UCC)
Plantation Management
Head
T. Tweneboa -Koduah, B.Sc. (Ghana)
Technical Officers
P.K. Bartels, Dip. in Lab. Tech. (UCC)
W.A. Darko, Dip. Hort. (KNUST)
Seth D. D. Asare
Alex Opare, Dip. Hort. (KNUST)
Environmental Health Officers
K. Anyomi
Jacob Asiedu Mensah
General Services
Head
Felix Quist, BSc. (KNUST)
Deputy Gen. Services Manager Daniel Ashitei Ashitey, MSc. Civil Engineering Electronics Engineer E. O. Afotey, M.Sc. (Minsk), MBA(GIMPA) Estate Officer Samuel Ayi -Donkor BSc.(KNUST) Works Superintendent M. Dautey, Inst of Tech Supervision Cer t (Weija)
R.A.A. Obeng, HND (B. Tech.)
Alfred Ackon, HND Civil Engineering
Alex Pipim Danquah, Ref/Air Con. Tech. III
Electrical Superintendent
C.K. Osei, City & Guilds Final Cert.
Transport Officer
Y.Z.K. Ayewubo, M.V.T. III, Diploma in Logistic a nd Transport
Mechanical Superintendent
Johnson Nkansah, HND Mech. Eng
Sub-stations
Afosu
Head
G.J. Anim-Kwapong, B.Sc. (Ghana), Ph.D. (Wales)
Technical Officer
Roger Fiakpornu, Dip. Hort. (KNUST)
I.A. Darko, Dip. in Gen. Agric.
(Ghana)
Sarfo Abbrese
Bole
Ag. Head
Julius Yeboah, BSc. (KNUST), MSc. (KNUST)
Research Officer
Michael T. Barnor, BSc. (Ghana), MSc.(Japan)
Technical Officer
Kwabena Acheampong
Justus Gariba,(UEW)
Victor N. Agene, BE.D Agric (UW)
Human Resource Officer
Martin Chenpuo, Diploma in Mgt Studies (UCC)
Sub-Station Bunso
Head
E .O. K. Oddoye, B.Sc. (Ghana), M. Phil
(Camb)
PhD.(Ghana)

Cocoa Research Institute of Ghana Annual Report 2010-2011
Technical Officer
James Ahuble
Social Science & Statistical Unit
Ag. Head
F. Baah, B.Sc. (KNUST), Ph.D. (Reading)
Research Officers
F. Aneani, B.Sc. (Ghana), M. Phil. (Ghana)
Mercy Asamoah, B.A. Hons.(Ghana), M.Phil (Ghana), PhD(Ghana)
Vincent Anchirina, B.Sc. (Ghana) M.Sc. (Reading)
Frank Owusu Ansah, B.Sc. (KNUST) M.Sc. (KNUST)
Technical Officer
Sampson Duodu
Alberta Badu-Yeboah,
BSc Agric (KNUST)
Frederick
Amon-Armah, BSc (Ghana)
New Product Development Unit Ag. Head C.K. Agyente-Badu, B.Sc. (Ghana), M.Phil(KNUST) Research Officer Esther Gyedu Akoto, (Mrs) B.Sc. (Ghana) MPhil.(Ghana),
Ph.D(Ghana) Technical Officers
M. H. Andoh, HND (Chem. Eng.)
K. Asante Amponsah
Dominic Kwame Owusu
John Sefa, Diploma in Statistics (Ghana)
Commercial Unit
Resthouse Superintendent
Doris A. Addo, Dip. in Home Science
Ext. (Ghana)
Asibi Apotogse, BSc. Adm in(Ghana), HND Acct(K’Poly)
Plantation Officers
Mabang/Acherensua
Osei-Wusu Afriyie, National Dip. in General Agric. (Ghana), Cert. in Community Forestry (
Bangkok)
Wantram
Ofori Ntiamoah, Diploma in Gen Agric (Ghana)
Worakese
E. Owusu Gyekye, Dip. in Agric. (Ghana)

GENERAL REPORT
01
Cocoa Research Institute of Ghana Annual Report 2010-2011
New arrivals, March 2010 – April 2011
The following Research Scientists were engaged: Dr. Sampson Konlan was appointed thResearch Scientist at the Agronomy Division on 11 October, 2010 and Dr. Alfred Arthur was
also appointed Research Scientist for Soil Science whilst Mr. Justus Gariba was appointed thTechnical Officer for CRIG Sub-station, Bole on 25 October, 2010
Promotions
Dr. I. Y Opoku, Principal Research Scientist was promoted to the position of Chief Research stScientist, effective 1 December, 2010 Mr. M.O Abu Deputy Human Resource Manager was
promoted to the position of Human Resource Manger, Rev. Fr. Dr. E. O. K. Oddoye Senior Research Scientist, Drs. G. J Anim-Kwapong Senior Research Scientist, H. Dzahini-Obiatey, Senior Research Scientist, A.A Afrifa, Senior Research Scientist, J. K Takramah, Senior Research Scientist, and Mr. Andrews Y. Akrofi Senior Research Scientist were all
stpromoted to the position of Principal Research Scientists on 1 December, 2010 and Dr. (Mrs.) Mercy Asamoah Research Scientists was also promoted to the position of Senior
stResearch Scientist on 1 December, 2010. Mr. Julius Yeboah Research Scientist and Mrs. Esther Anim-Kwapong Research Scientist were also promoted to the position of Senior
stResearch Scientist effective 1 December, 2010. Dr. George Ameyaw-Akumfi Assistant thResearch Scientist was upgraded to the position of Research Scientist effective 18 August,
2010.
thMr. Isaac G. Azumah was upgraded to the position of Senior Audit Officer on 15 June, 2010
The following persons were promoted from Senior grade to Principal Officers namely: Mr. Dickson M. Adoblanui, Principal Technical Officer, Mr. Osei Asare Bediako, Prin. Technical Officer, Mr. Ebenezer N. Atangah, Prin. Technical Officer, Rev. Agyenim Boateng, Prin.
stTechnical Officer. Mrs. Doris A. Addo Prin. G/H Supt. All promotions took effect from 1 October, 2010.
The following were also promoted from Officer grade to Senior Officer. Mr. John O. Arhur, Senior Accounts Officer, Ms. Dora Tekper, Senior Accounts Officer, Mr. Samuel F. Akomah, Senior Technical Officer, Mr. Divine Addo, Senior Technical Officer. All promotion took
steffect from 1 October, 2009Mrs. Vincentia Aheto, Mrs. Yayra Domfeh, Messer. Daniel Tierifar, Seth D. Yeboah, George O. Nkansah, George J. Kai, Stephen A. Amankwah and Francis O. Awuku all junior staff were also promoted to the positions of Accounts Officers and Technical Officers respectively
steffectively 1 October, 2010.

Transfers-out
Messer. John Odametey Accounts Manager, was transferred to Cocobod Head Officer, Accra ston 1 September, 2010. Mr. M. O Abu, Human Resource Manager was also transferred to
stCSSVD CU on 1 September, 2010. Similarly, Dr. Solomon Acquaye Research Scientist was thtransferred to HI-TECH (COCOBOD) effective 11 April, 2011 and Mr. Thomas Tweneboah
thKoduah Deputy Technical Manager was also transferred to CSSVD CU effective 11 April, 2011
Transfers-in
Messer Christopher M. Asakie, Human Resource Manager, Albert Yeboah, Accounts Manager, Francis A. Abarigah, Deputy Human Resource Mnager and Martin Asiamah Deputy Accounts Manager were all transferred from Seed Production Unit, Accra and
thQuality Control Company Limited effective 15 September, 2010 respectively. Similarly Mr. Isaac G. Azumah Senior Audit Officer was also transferred from Quality Control
thCompany Accra effective 15 June, 2010
RetirementsthMr. K. Asante Amponsah, Technical Officer retired on 4 November, 2010, Mr. Osei
rdSarkodie Prin. Technical Officer retired on 23 November, 2010. Mr. Kofi Anyomi Senior thEnvironmental Health Officer retired on 18 December, 2010, Dr. Frank Boakye Antwi,
thResearch Scientist resigned on 19 October, 2010, Mr. Paul Seglah Technical Officer stvoluntarily retired on 1 November, 2010 whilst, Ms. Betty Owusu Senior Info Systems
thOfficer retired on 15 April, 2010.
Study leave
The following Research Scientists were also pursuing Ph.D and Masters programmes both locally and foreign in various universities during the period. Mr. Andrews Yaw Akrofi, Senior Research Officer, Kwame Nkrumah University of Science and Technology, Kumasi, Mr. J. E. Sarfo, Research Officer, University of Greenwich, UK, Mr. Frank Owusu Ansah, Research Scientist , University of Reading, UK, Mr. Godfred K. Awudzi, Assistant Research Scientist, University of Reading, UK, Mr. Abraham Akpertey, Assistant Research Scientist, University of Illinois, USA. The following senior officers were also pursuing degree programme in various universities during the period. Mrs. Pauline A. Dadzawa, Deputy Executive Director(Gen. Admi), GIMPA, Mr. Samuel L. Gyamfi, University of Ghana, Mr. Charles K. Davudu, Institute of Professional Studies, Mrs. Gift Opoku Agyameng, GIMPA, Mr. Roger K. Fiakpornu, University of Cape Coast, Mr. Emmanuel D. Anoch,i University of Cape Coast, Mr. Y. Z. K. Ayewubo, Senior Transport Officer, GIMPA, Ms. Esther E. Koranteng, Technical Officer, University of Cape Coast, Mr. Emmanuel Ewe, Senior Technical Officer, University of Cape Coast. Mr. Ebenezer A. Asamoah, Kwame Nkrumah University of Science and Technology, Kumasi, Mr. Felix Quist, GIMPA
Cocoa Research Institute of Ghana Annual Report 2010-2011
02
Land use and development
Three new plots totalling 18 acres (7.28 hectares) are at various stages of development for cocoa cultivation. Six acres in Block R shall be a Demonstration Cocoa Farm. Another 10 acres in Block R and 2 acres in Block K are for Seed Garden establishment. The Plant Breeding Division is developing five new plots of various sizes in Blocks D, E, O and U totalling 6 acres (2.43 hectares) as experimental coffee farms.
Weather
Over the period, the total rainfall recorded was 1778.4 mm from 144 wet days. The figure for the previous year was 1248 mm and 123 wet days. There was precipitation in every month with the least monthly rainfall of 17.7 mm from five wet-days recorded in December. The wettest month was October 2010 with 338.6 mm of rain from 22 wet-days representing 19.0 percent of the total rainfall.
The warmest month during the period was April 2010 with a mean maximum temperature of 33.5 °C and the mildest month was January 2011 with a mean of 19.5 °C. The total sunshine duration recorded over the period was 2134.4 hours. As expected December was very clear and sunny with 245.2 hours of sunshine that is more than double the sunny period experienced in August which was cloudy with 100.3 hours of sunshine.
Cocoa production
Monthly cocoa production figures are in Table 1. Apart from June and July cocoa production increased from August to peak production in November with 147,676 pods and declined rapidly to a low of 3,011 pods in March 2011. November also recorded the lowest discard production of 7.5% as against the highest of 44.9% recorded in May.
PLANTATION MANAGEMENT DIVISION
Cocoa Research Institute of Ghana Annual Report 2010-2011
03

The Fermentation Unit received 472,232 field usable cocoa pods made up of 401,052 pods from the Scientific Divisions and 71,180 pods from the Plantation/Station Management Division during the crop year for processing as in Table 2. After breaking, 74,234 pods being 15.7 percent of the field usable cocoa were discarded. Black pod infestation, mammalian damage, capsid damage, germinated beans and immature ripening are the factors that contributed to the waste or discarded cocoa. No pods were sold.
Cocoa Research Institute of Ghana Annual Report 2010-2011
Table 1: Monthly Cocoa Production.
Month
Field
Usable
Pods Rcvd
No of Pods Broken
Wet Wt of Cocoa
Beans (kg)
% of Discarded
Cocoa
Discards
Pods Fermented
April 2010
11397
3715
7682
740
32.6
May
14712
6608
8104
772
44.9
June
40800
8631
32169
3181
21.2
July
42864
10552
32312
3203
24.6
August 33100 4865 28235 2817 14.7
September 39457 4895 34562 3492 12.4 October 80061 8541 71520 7298 10.7
November
147676
11132
136544
13635
7.5
December
35483
8224
27259
2694
23.2
January 2011
20306
4924
15382
1527
24.2
February
3365
1267
2078
208
37.7
March
3011
880
2131
212
29.2
Total
472,232
74,234
397,998
39,779
15.7
Table 2: Summary of Cocoa Production
Division
Pods Received
No of Pods Broken
Wet Weight of Beans (kg)
Discarded
Fermented
Scientific Divisions
401,052 61,947
339,105
33,995
Plantation/Management 71,18?0 12,287 58,893 5,784
Total 472,232 74,234 397,998 39,779
04

Cocoa Research Institute of Ghana Annual Report 2010-2011
Cocoa processing
The result of processing is in Table 3 below. The 397,998 fermented cocoa pods representing 84.3 percent of production that yielded 39,779 kg of wet cocoa beans produced 13,937.5 kg (≈14.0 tonnes) of dry cocoa beans through 46 fermentations. The conversion factor from wet to dry cocoa beans was 35. A mean of 9.6 and 27 pods gave one kilogram of wet and dry cocoa beans respectively.
Table 3: Result of Processing.
Source No of Pods Fermented
Wet Wt of Beans
Dry Wt. of Beans
% Dry Wt of Beans
No of Pods/kg
Wet Wt Dry Wt Scientific Divisions 339,105 33,995 11,910.9 35.0 10.2 29.1
Plantation/Management 58,893 5,784 2026.6 35.0 8.9 25.4 Total 397,998 39,779 13,937.5 35.0* 9.6* 27.3*
*Mean Values
Nursery activities
Thirty thousand cocoa seedlings have been raised for sale to farmers. Flowering plants and other ornamentals are in stock for landscaping and sale to the public. Seedlings of forest or timber trees species like terminalia, etc. have been propagated for re-forestation purposes.
Revenue
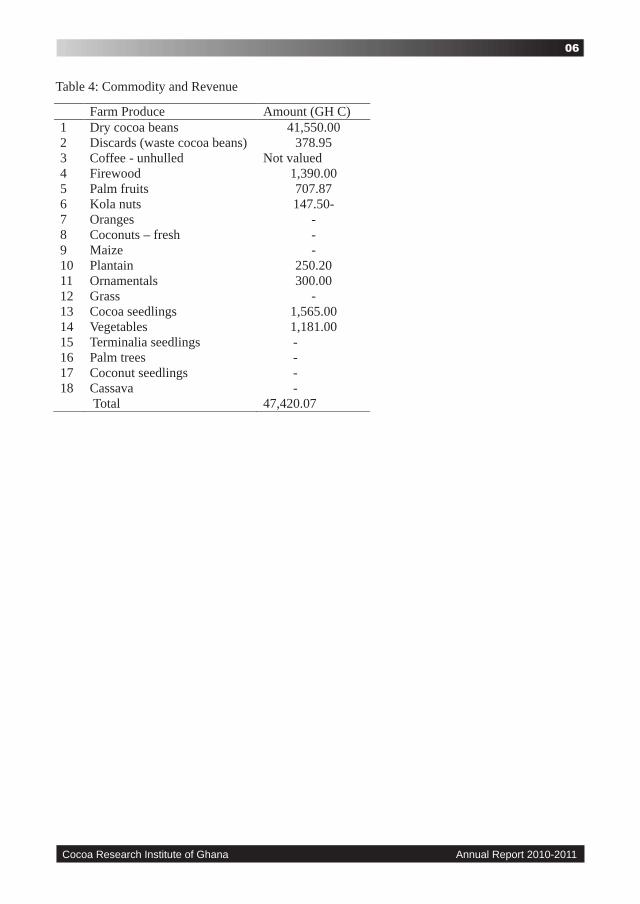
A total of 223 bags of cocoa at 62.5 kg wt per bag which is the equivalent of 13,937.5 kg of dry cocoa beans and 689 kg of waste dry cocoa were handed over to the Central Stores for sale. The unhulled coffee processed by the Agronomy Division weighed 2700 kg. An amount of forty-one thousand, five hundred and and fifty Ghana cedis (GH C 41,550.00) was realised from the sale of cocoa beans. The 689 kg of waste cocoa beans fetched an amount of three hundred and seventy-eight Ghana cedis and ninety-five pesewas. In the Commodity and Revenue Table below are the other farm produce handled during the period under review.
05
Cocoa Research Institute of Ghana Annual Report 2010-2011
Farm Produce
Amount (GH C)
1
Dry cocoa beans
41,550.00
2
Discards (waste cocoa beans)
378.95
3
Coffee
-
unhulled
Not valued
4
Firewood
1,390.00
5
Palm fruits
707.87
6
Kola nuts
147.50-
7
Oranges
-
8
Coconuts –
fresh
-
9
Maize
-
10 Plantain 250.20 11
Ornamentals
300.00
12
Grass
-
13
Cocoa seedlings
1,565.00
14
Vegetables
1,181.00
15
Terminalia seedlings
-
16
Palm trees
-
17
Coconut seedlings
-
18
Cassava
-
Total
47,420.07
Table 4: Commodity and Revenue
06

Land use
Two new trials were established within the year under review. These are; 1. Rootstock Genotype effect cocoa establishment and yield in drought prone areas (N1). 2. Evaluation of Guyana clones (M6). Regular maintenance schedule were adhered to on cocoa, coffee, and kola experimental plots during the year under review. Regular maintenance schedules were strictly adhered to on cocoa, coffee and kola experimental plots throughout the year. Pentadesma butyraceae, Shea observational plot, Terminalia superb/ Terminalia ivorensis and oil palm plantation which are all non- experimental plots were also maintained.
Weather and cropping
The annual rainfall recorded during the reporting year was 1,521.1 mm which was 3.58% higher than the 2009/2010 record of 1,466.7 mm. There were however higher rainy days (109 days as against 93 days recorded in 2009/2010).
General crop growth was excellent as a result of fairly good rainfall distribution pattern within the year. A total of 6.26 metric tons of dry cocoa beans was obtained from both experimental and non experimental plots during the year, which was 14.38% higher than the previous year's records of 5.36 tons. The yield of dry unhulled coffee berries was 8.45 metric tons which was 75.07% lower than that of the previous year of 33.9 metric tons due to coppicing of major of the coffee plots.
Revenue
A total amount of forty-six thousand five hundred and sixty-one Ghana cedis only (GH¢ 46,561.00) was realized as revenue during the year under review. This amount was 23.28% higher than what was realized in 2009/2010. The revenue generated did not include proceeds from the sale of the 8.45 metric tons of dry unhulled coffee berries.
CRIG SUBSTATION
AFOSU
Cocoa Research Institute of Ghana Annual Report 2010-2011
07

Weather
The total number of rains recorded was 80 resulting in 1362.9mm of rainfall. The mean maximum and minimum temperatures for the same period were 32.8 and 21.1, respectively; whiles mean relative humidity of 73.8% and 53.6% for 900 and 1500, respectively.
Shea research
Four new trials, “Effects of gamma irradiation of sheanut seeds and stem cuttings on growth traits of shea, Germplasm collection and diversity study of shea (Vitelleria paradoxa) in Ghana, “Effect of period of girdling and hormone on the rooting performance” and “Effect of types of cuttings and hormone application on the rooting performance of shea” were initiated/conducted within the period under review. Shea germplasm collection was carried in all districts in upper west and east regions except Bawku central due to the then pending conflict within the municipality. Also, an Mphil student from the University of Ghana conducted his research project on the topic, 'Asexual propagation techniques of sheanut (vitellaria paradoxa c.f. Gaertn)' at the station during the period.
Cocoa Research Institute of Ghana Annual Report 2010-2011
Revenue sources and amounts:
Items
GH¢
Cocoa Pods
144.50
Cocoa Seedlings
7,820.00
Kola Nuts
1,765.00
Dried Cocoa Beans
20,024.00
Fire Wood
200.00
Palm Fruits
226.00
Plantains 375.00 Rest House Revenue
15,882.5
Meteo Data
124.00
Total
46,561.00
BOLE
08

Cashew research
A four acre experimental trial, “Effect of polythene bag size on cashew seedling growth, development and ease of transporting' was established within the period under consideration. Routine maintenance activities were carried out on all existing cashew trials including germplasm evaluation, clonal evaluation, propagation and fertilizer trials. A total of 15000 cashew clones of elite cashew varieties in the scion bank were produced and distributed to farmers under the Cashew Development Project.
Cashew plantation
A team of sprayers from the entomology division carried out the control of insect pest on cashew plantation at the station. Raw cashew nut yield obtained from plantations and cashew experimental fields was 17040kg (213bags). Cashew yield for the season under consideration was31% lower than that of the preceding year.
School
A unit classroom block with lavatory and headmaster's office was completed. Subsequently, 35 five pupils were admitted to Kg2.
Cashew Processing
The cashew processing plant saw the acquisition and installation of a BORMA and Cooker with one ton/day processing capacity.
Honey production
The station obtained 52 gallons of pure honey from 40 fully colonized bee hives.
Livestock
Screening of the station's herd by veterinary officers from the Central Veterinary Laboratory, Pong-Tamale revealed the presence of bovine tuberculosis and brucellosis within the herd. Seventy-four animals were sold whiles 53 animals mainly, heifers were purchased for replacement.
Revenue
Revenue generated by various activities at the station is as indicated below.
Cocoa Research Institute of Ghana Annual Report 2010-2011
09

Item GH?
Livestock sales 23,767
Cashew nut 42120
Honey sales 2700
Total 68,587
Cocoa Research Institute of Ghana Annual Report 2010-2011
Weather/Rainfall
The total annual rainfall recorded on 112 wet days was 2,329.10mm. April, 2010 and October, 2010 gave the highest total rainfall of 368.8 mm and 353.7mm, respectively. The months of October and September, 2010, however, recorded the highest number of wet days of 19 and 14 respectively. The details of the annual rainfall figures are shown in the table below:
BUNSO
st stAnnual Rainfall Figures (1 April, 2010 – 31 March, 2011)
Month/Year
Wet days
Amount (mm)
April, 2010
11
368.8
May, 2010
10
306.5
June, 2010
10
250.5
July,2010
6
279.4
August, 2010
8
135.5
September, 2010
14
200.9
October, 2010
19
353.7
November, 2010 10 138.8 December, 2010
2
7.8
January, 2011
2
20.7
February, 2011
7
80.6
March, 2011
13
185.9
Total
112
2,329.10
10

.Cashew scion bank
Maintenance activities such as weeding, pruning of flowers and off-shoots of grafted seedlings as well as watering of sown nuts and young seedlings were carried out. Insecticide
stand fungicide applications were also carried out during the period under review. As at 31 March, 2011, the Bank had 249 grafted plants in stock. The already established plants are doing very well on the field.
Cocoa plots
Regular maintenance activities which include weeding, pruning, removal of basal chupons, epiphytes and mistletoes were carried out in the cocoa plots. Other activities undertaken during the period included regular inspection and recording of any incidence of the cocoa swollen shoot virus disease and regular spraying by the Mirid Investigation Team at Bunso to control pests. During the period fertilizer application was also carried out in all mature cocoa plots, except those that are earmarked for specific experimental projects. A total of 342,665 usable cocoa pods were harvested from all the cocoa plots during the period.
Coffee plots
Like the cocoa plots, regular maintenance activities such as weeding, pruning and topping of the coffee trees were carried out in all the coffee plots during the period under review. A total number of 54 bags of unhulled dry coffee berries were harvested from all the coffee plots.
Kola plots
As done in the cocoa and coffee plots, regular maintenance activities such as weeding, pruning as well as removal of mistletoes/epiphytes were carried out in all the kola plots. A total of 3297.83kg of kola nuts were collected from the progeny plot which showed a reduction of 1.5% in the previous year's yield. Kola plots (1&11) also yielded 3853.36kg and 3231.65kg respectively. In all, 10,382.84kg of kola nuts were realized from all the kola plots.
Coffee propagation
During the period under review, the propagators made a total of 44 trips to Tafo and Afosu stSub-Station for coffee cuttings. As at 31 March, 2011, a total of 58,558 cuttings had been
harvested and inserted. Out is this number, 5,230 propagated clones were supplied to Afosu Sub-Station and 400 clones to individual farmers at Afosu. The propagation was, however, continued in order to meet the 60,000 target that was allocated to the Station to achieve within the year. The propagation shed was also extended (with 80 metal poles) within the period under review. Maintenance activities such as watering of the inserted cuttings and constant clearing of the shed were also carried out within the period.
Cocoa Research Institute of Ghana Annual Report 2010-2011
11

Cocoa nursery
The Station was able to raise 60,000 cocoa seedlings for sale to interested cocoa farmers. As stat 31 March, 2011, no sale was made because the seedlings were not grown by then. Thus the
sale of the seedlings will be accounted for in 2011/2012 annual report. As regards to the 50,500 seedlings that were brought forward from 2009/2010 season, 4,487.50 seedlings were sold and the amount realized (GH¢4,487.50) was paid to chest. One thousand, two hundred (1,200) seedlings were sent to Tafo as protocol. Three thousand, one hundred and twenty five (3,125) seedlings were dead and one thousand three hundred (1,300) seedlings became stunted and could not be used and therefore declared as lost.
Oil palm plots
Maintenance activities such as weeding and pruning were carried out in the oil palm plots. A total of 971 bunches of palm fruits were harvested and sold to staff and the amount realized is shown in the revenue side.
Cocoa Research Institute of Ghana Annual Report 2010-2011
Revenue Gh¢
Dry Cocoa Beans - 27,250.00
Cocoa Seedlings - 4,487.50
Palm Fruits - 383.30
Kola Nuts - 2,467.25
Kola Seedlings - 177.50
Plantain - 975.67
Wawa Boards - 423.00
Emire Boards - 520.00
Eggs - 1,635.00
Unserviceable Items - 63.50
Total 38,382.72
12

Cocoa Research Institute of Ghana Annual Report 2010-2011
Coffee hulling
During the period under review, 472 bags of dry coffee were hulled, cleaned and sent to Tafo for further action.
Poultry/ livestock
Broliers: During the period under review, the Unit at Bunso had 450 broilers. These birds were raised and sold to staff during the Christmas season. Second batches of 400 broilers were also ordered in February, 2011. These batches of birds were sold to staff at Easter time.
Layers: The Unit had 217 layers. Eggs were collected and sold to staff at Bunso and Tafo respectively. Second batches of 600 pullets were also ordered in February, 2011. These birds are yet to be sold.
Pigs: The Unit also had 16 pigs at various stages of growth.
Sheep: Currently, the Unit has five ewes, two rams and a breeding ram in stock.
Mirid investigation team
During the period under review, the Mirid Investigation Team at Bunso carried out demarcation and maintenance of plots for small-scale insecticide trials. Pre, post and monthly treatment assessment, application of insecticides, tree population, yield and foliage assessment at Nsutam, Anum Apapam, Mfranor, Kokoteasua, Atiebu, Achiansa, Teawia, Subriso, Koodum, Akwasiho and Kwame Adjei. The team also carried out regular spraying of insecticides and fungicides on cocoa, kola, cashew and coffee plots at Ettokrom and Asiakwa Blocks at Bunso.
New establishments
L.C.T.I and R.V.T. I.
Cocoa clones were planted in June, 2011. However, most of the clones could not survive. This had called for re-planting to be done again later. Weeding, however, was constantly done to maintain the growth of shade trees and crops. During the period under review, some bunches of plantain were harvested from the plot and sold to staff. The amount realized from sale was paid to chest as indicated in the revenue side.
CSSVD/Miami project
Land preparation had been completed. Lining and pegging, planting of shade trees and digging of holes for planting of cocoa were completed. Weeding is also constantly done to
13

maintain growth of the shade plants. What remains to be done is planting of the clones.
Cocoa flower garden
Land preparation had been completed. Lining and pegging as well as planting of shade trees had also been completed. The few clones that were brought from Tafo were also planted. However more clones are needed to cover the 1-hectare plot. Weeding is constantly done to; maintain the plot.
Oil palm plantation
A 10-acre oil palm plot has been established for the Station. Weeding is constantly done to maintain growth of the plants. It is planned to extend the plantation by an additional 5 acres in 2011/2012 period.
Coffee wood garden
A 1-acre coffee wood garden has also been established for the Station. It is planned to extend it in 2011/2012 period.
Coffee fruit crop intercropping
stAs at 31 March, 2011, all the fruits crops had been planted. Regular maintenance activities such as weeding and replacement of dead fruit crops were carried out during the period.
Cocoa Research Institute of Ghana Annual Report 2010-2011
14

The yield of cocoa (Theobroma cacao L) recorded in the trial “The use of Pawpaw (Carica
papaya) as potential temporary shade for young cocoa” confirmed the results obtained during the establishment phase which showed lack of significant differences between the treatments in the vegetative growth of young cocoa plants. These results suggest that pawpaw could be used as alternative temporary shade for young cocoa during establishment. Evaluation of Cedrela odorata, a commercial timber species, as permanent shade in cocoa cultivation - Results obtained so far in this trial suggest that delayed thinning of Cedrela
thodorata planted at 6m x 6m until the 6 year after planting was detrimental to the growth and thyield of young cocoa plants. Thinning Cedrela, planted at 6m x 6m to 12m x 12m at the 4
year after planting resulted in better growth and initial yield of cocoa plants. After 3 years of treatment application in the trial investigating the effects of slash-burn, and slash-no burn as land clearing methods and intercrops on soil fertility, growth and yield of cocoa, no significant differences were observed between the slash and burn and slash and no burn treatments for the properties measured except Calcium which was higher in the slash and no burn plots. In the evaluation of a diversified cocoa /fruit tree system trial, treatments had no significant effect on the growth of cocoa at 8 months after transplanting. However, growth of the shade tree species at 20 months after transplanting was significantly affected by treatments. Milicia excelsa and Allanblackia floribunda exhibited very slow growth rates compared to Terminalia superb, T. ivorensis and other species.
Investigations into the use of Pawpaw (Carica papaya) as potential temporary shade for
young cocoa. (F. K. Oppong, K. Ofori-Frimpong, G. J. Anim-Kwapong, K. Opoku-Ameyaw and A. Y. Akrofi).
The experimental detail of the above trial which was presented in the 2004/2005 Annual Report (Rep. Cocoa Res. Inst. Ghana, 2004/2005., 20-21) was continued during the year under review. General maintenance of the experimental plot was carried out during the year. Previous results indicated that the use of pawpaw as temporary shade for cocoa during the initial three years of establishment had no adverse effects on the vegetative growth of young cocoa plants (Progress Report 2004/2005, 2005/2006, 2006/2007). The trial was however continued to study the residual effects of the treatments on yield of the cocoa plants. All activities planned for the year were carried out. The Afosu and Tafo trials entered their fourth and third year of bearing respectively. Routine monitoring of disease incidence in the plots was carried out at both locations.
COCOA ESTABLISHMENT THRUST
Cocoa Research Institute of Ghana Annual Report 2010-2011
15

Cocoa Research Institute of Ghana Annual Report 2010-2011
Results
Afosu – H4
There were no significant differences in the yield between the treatments during the 2010/11 season. The highest yield of dry cocoa beans was however recorded in Treatment 1 whereas the lowest yield was recorded in Treatment 2. Treatment 1 also gave the highest cumulative yield after 4 years of bearing followed by Treatment 5. Treatment 4 gave the lowest cumulative yield. There were no significant differences in the cumulative yield between the treatments (Table 1.1). The incidence of black pod disease, immature pods and pods damaged by rodents were generally low.
Table 1.1: Residual effects of treatments on yield of cocoa beans recorded during theinitial four years of bearing in Plot H4, Afosu
Treatment
Cocoa yield
(dry beans kg/ha)
2007/08
Cocoa yield
(dry beans kg/ha)
2008/09
Cocoa yield
(dry beans kg/ha)
2009/10
Cocoa yield
(dry beans kg/ha)
2010/11
4 years cumulative yield (kg/ha)
T1-Pawpaw planted at 3m x 3m and cocoa at 3m x 3m
43.2
159.0
307.1
555.0
1064.3
T2-Pawpaw planted at 3 x 1.5 m and cocoa at 3m x 3m
34.2
189.0
271.8
452.0
947.0
T3-Pawpaw planted at 3m x 6m and cocoa at 3m x 3m
39.9
116.0
286.8
503.0
945.7
T4-Pawpaw/plantain planted in alternate rows at 3m x 3m and cocoa at 3m x 3m
17.5
151.0
168.1
484.0
820.6
T5-Plantain planted at 3m x 3m and cocoa at 3m x 3m (Control)
30.8
189.0
277.1
486.0
982.9
Sig. level (5%)
ns
ns
ns
ns
ns
16

No significant yield differences were recorded in the Tafo trial in 2010/11. The yield recorded in Treatment 3 was however lower than that of the other treatments. Similar observations were made during the 2008/09 and 2009/10 seasons. The yield followed the same pattern over the 3-year period of bearing with Treatment 5 consistently giving the highest yield followed by Treatments 1 and 2. There were no significant differences (P< 0.05) in the cumulative yield between the treatments even though the yield recorded in Treatment 3 was much lower than those of the other treatments (Table 1.2). The incidence of black pod infection, rodent-damaged pods and percentage of immature pods were low in all the treatments.
Cocoa Research Institute of Ghana Annual Report 2010-2011
Treatment
Cocoa yield
(dry beans kg/ha)
2008/09
Cocoa yield
(dry beans kg/ha)
2009/10
Cocoa yield
(dry beans kg/ha)
2010/11
3 years cumulative yield (kg/ha)
T1-Pawpaw planted at 3m x 3m and cocoa at 3m x 3m
24.4
163.0
342.0
529.4
T2-Pawpaw planted at 3 x 1.5 m and cocoa at 3m x 3m
34.2
141.0
304.0
479.2
T3-Pawpaw planted at 3m x 6m and cocoa at 3m x 3m
17.5
65.0
208.0
290.5
T4-Pawpaw/plantain planted in alternate rows at 3m x 3m and cocoa at 3m x 3m
19.9
76.0
269.0
364.9
T5-Plantain planted at 3m x 3m and cocoa at 3m x 3m (Control)
34.5
174.0
476.0
684.5
Sig. level (5%)
ns
ns
ns
ns
Table 2: Residual effects of treatments on cocoa yield during the initial three years of bearing inPlot H25, Tafo.
Conclusion
The yield results recorded in the treatments over a period of four and three years at Afosu and Tafo respectively confirmed the results obtained during the establishment phase which showed lack of significant differences between the treatments in the vegetative growth of young cocoa plants. These results suggest that pawpaw could be used as alternative temporary shade for young cocoa during establishment.
17

Cocoa Research Institute of Ghana Annual Report 2010-2011
Evaluation of Cedrela odorata, a commercial timber species, as permanent shade in
cocoa cultivation. (F. K. Oppong, G. J. Anim-Kwapong, K. Ofori-Frimpong, J. E. Sarfo and A. Y. Akrofi).
The experimental details of the above trial were provided in the 2004/2005 Annual Report (Rep. Cocoa Res. Inst. Ghana, 2004/2005., 23-24). General maintenance of the treatment plots was carried out. Dead cocoa seedlings were replaced and pest and disease monitoring was done. Growth data on the cocoa, Cedrela odorata and Terminalia plants were also recorded. The Cedrela odorata trees in Treatments 3 and 4 were thinned to the planting distances indicated in the two treatments in June 2010. General maintenance of the plots was carried out and pest and disease monitoring was also done during the year. Harvesting and yield recording was carried out. Light transmitted through the canopy in each of the treatments was determined from August 2010 to March 2011.
ResultsthDelaying the thinning of the Cedrela plants until the 6 year after planting (Treatments 3 and
4) adversely affected the cocoa plants as poor yields were recorded in these treatments. Thinning the Cedrela plants in Treatments 3 and 4 from 6m x 6m to planting distances of 12m x 12m and 12m x 18m respectively in June 2010 allowed more light into the plots (Table 1.3) but this could not immediately impact positively on the growth and yield of cocoa plants (Table 1.4). Most of the leaves of the Cedrela, Terminalia and Gliricidia were shed during the dry season in January and February 2011 and this might have accounted for the lack of significant differences between the treatments in the percentage light transmitted into the plots (Table 1.3).
Flowering, pod set and pod developments were generally below expectation and this appeared to be a direct reflection of the individual treatments on the young cocoa trees. Yield of dry cocoa beans was generally low in all the plots. However, thinning the Cedrela plants
thfrom the initial planting density of 6m x 6m to 12m x 12m at the 4 year after planting resulted in significantly higher yield than all the other treatments (Table 1.4). There were no significant yield differences between Treatments 1, 3, 4 and 5. The higher yield recorded in Treatment 2 may be attributed to the high percentage light transmitted into the plot after thinning the Cedrela plants to the wider spacing of 12m x 12m. The same reason accounted for the bigger stems of the young cocoa recorded in Treatments 1 and 2 when the initial
thplanting distance of Cedrela was thinned from 6m x 6m to 6m x 12m and 12m x 12m at the 4 year in Treatments 1 and 2 respectively (CRIG Progress Report 2008/09, 2009/10).
18

Cocoa Research Institute of Ghana Annual Report 2010-2011
Table 1.3: Effects of treatments on percentage light transmitted into the plots at different periods
Treatments
August
2010
Sept.
2010
October
2010
Nov.
2010
January
2011
February
2011
March
2011
T1-
Cocoa + C. odorata
at 6m x 6m but thinned to 6m x 12m at 4th year
33.6
35.1
42.3
31.7
74.9
64.7
63.7
T2-
Cocoa + C. odorata
at 6m x 6m but thinned to 12m x 12m at 4th year
35.8
52.6
47.6
30.5
64.5
48.0
59.9
T3-
Cocoa + C. odorata
at 6m x 6m but thinned to 12m x 12m at 6th year
60.8
44.3
65.3
33.9
68.0
70.1
79.0
T4-
Cocoa + C. odorata
at 6m x
6m but thinned to 12m x 18m at 6th year
77.1
72.9
67.2
64.3
47.8
59.7
80.7
T5-
Cocoa + G. sepium at 6m x 6m but thinned later to 12m x 12m + and T. ivorensis at 12m x 18m (Control).
50.4
60.6
46.5
45.8
64.8
43.3
53.3
Sig. level (5%)
-
-
ns
-
ns
ns
19.8 Sig. level (1%):
l.s.d.
21.3
9.9
-
12.5
-
-
-
19

Cocoa Research Institute of Ghana Annual Report 2010-2011
Table 1.4: Effects of treatments on initial cocoa yield (kg/ha).
Treatments
Initial cocoa yield -2009/10
(kg/ha)
Cocoa yield –
2010/11 (kg/ha)
T1-
Cocoa + C. odorata
at 6m x 6m but thinned to 6m x 12m at 4th year
14.2
41.9
T2-
Cocoa + C. odorata
at 6m x 6m
but thinned to 12m x 12m at 4th year
8.2
92.8
T3-
Cocoa + C. odorata
at 6m x 6m but thinned to 12m x 12m at
6th year
0.6
8.1
T4- Cocoa + C. odorata at 6m x 6m but thinned to 12m x 18m at 6th year
0.8
11.7
T5- Cocoa + G. sepium at 6m x 6m but thinned later to 12m x 12m + and T. ivorensis
at 12m x 18m (Control).
16.2
24.9
Sig. level (5%)
ns
- Sig. level (1%):
l.s.d.
-
36.2
Conclusion
The results obtained so far suggest that delayed thinning of Cedrela odorata planted at 6m x th6m until the 6 year after planting was detrimental to the growth and yield of young cocoa
thplants. Thinning Cedrela, planted at 6m x 6m to 12m x 12m at the 4 year after planting resulted in better growth and initial yield of cocoa plants.
Remarks
Evidence from the data obtained so far could lead to the speculation that thinning Cedrela
odorata initially planted at 6m x 6m earlier than 4 years after planting could be more beneficial to the growth and development of young cocoa plants.
Effects of slash and burn and slash and no burn methods and intercrops on soil fertility,
growth and yield of cocoa, Bunso (K. Ofori-Frimpong, A. A. Afrifa, F. K. Oppong, K. Opoku Ameyaw, M. K. Assuah, A. R. Cudjoe and F. Aneani). The objectives of the above trial were provided in the 2007/2008 Annual Report (Rep. Cocoa
Res. Inst. Ghana, 2007/2008., 22-23). The experimental design was split with land clearing methods as main plots and cocoa/food crops combinations as sub plots with 4 replicates.
Main plot treatments- slash and burn- slash and no burn
Split-plot treatments
20

Figure 1.1: Effects of land clearing methods on soil pH
Cocoa Research Institute of Ghana Annual Report 2010-2011
- sole cocoa- cocoa + maize + cassava- cocoa + maize- cocoa + cassava
All activities planned in the trial for the year under review were carried out.
Results
Effects of slash and burn and slash and no burn methods of land clearing on some selected soil properties are presented in Figs 1.1-1.6.
After 3 years of treatment application there were no significant differences between the slash and burn and slash and no burn treatments for the properties measured except Calcium (Ca) which was higher in the slash and no burn plots.
Figure 1.2: Effects of land clearing methods on soil total N
21

Cocoa Research Institute of Ghana Annual Report 2010-2011
Figure 1.3: Effects of land clearing methods on soil organic C
Figure1. 4: Effects of land clearing methods on soil available P
Figure1. 5: Effects of land clearing methods on soil Exchangeable K
22

Cocoa Research Institute of Ghana Annual Report 2010-2011
Figure1.6: Effects of land clearing methods on Exchangeable Ca
Conclusion
No noticeable changes were observed for the major plant nutrients in burnt and no burnplots after 3 years of treatment application.
Evaluation of a diversified cocoa /fruit tree system – F2, Afosu (G. J. Anim-Kwapong, K. Opoku-Ameyaw, M. K. Assuah, A. A. Afrifa, A. R. Cudjoe, F. Aneani, A. O. Dwapanyin, O. Domfeh, F. Owusu-Ansah)
The objectives of the above trial were provided in the 2009/2010 Annual Report (Rep. Cocoa
Res. Inst. Ghana, 2009/2010).
Experimental design
Randomized complete block design with four replicates and treatments detailed as follows:
T1- Two each of Allanblackia floribunda, Ricinodendron heudelotii, Persea americana and
Tetrapleura tetraptera integrated as a mixed stand into cocoa at a spacing of 12m x 9m.
T2 – Two each of A. floribunda, R. heudelotii, P. americana and T. tetraptera integrated as a mixed stand into cocoa at a spacing of 12m x 12m.
T3 – Two each of A. floribunda, R. heudelotii, P. americana and T. tetraptera integrated as a mixed stand into cocoa at a spacing of 15m x 15m.
T4 - Two each of Terminalia superba, T. ivorensis and Milicia excelsa integrated as a mixed stand into cocoa at a spacing of 15m x 18m (control treatment).
23

Cocoa Research Institute of Ghana Annual Report 2010-2011
Cocoa was planted, a year after planting the shade trees, at a spacing of 3m x 3m in all the treatments. Plantain was planted to provide initial shade in all the treatments.
All the planned activities outlined for the year under review were successfully executed.
Results
The treatments had no significant effect on the growth of cocoa at eight months after transplanting (Table 1.5). The growth of the shade tree species at twenty (20) months after transplanting was significantly affected by treatments (Tables 1.6 and 1.7). Large growth increments were observed over the previous year's (2009/2010) growth (Tables 1.8 and 1.9). The control treatment which comprised T. superb, T. ivorensis and M. excelsa planted at 15 m x 15 m recorded the best growth during the period followed a similar trend as observed in 2009/2010. This was mainly due to the characteristic fast growth rate of the two Terminalia species. Milicia excelsa and Allanblackia floribunda exhibited very slow growth rates compared to the other species.
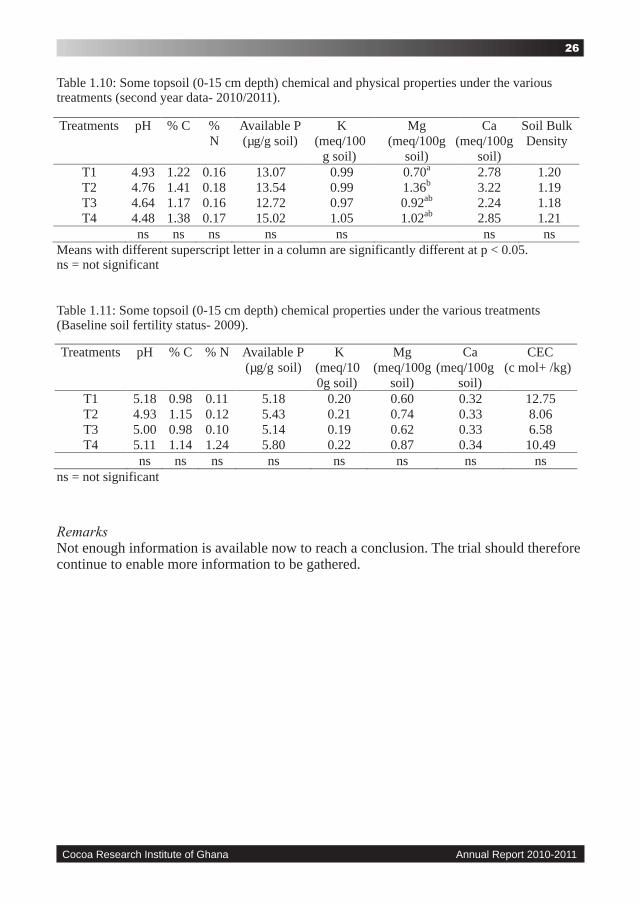
Differences in some soil chemical and physical properties in the various treatment plots were not significant (p=0.05) with the exception of Magnesium which recorded a significantly (p<0.05) higher value in treatment T4 compared to the other treatments. Generally, significant changes were observed in soil nutrient status between the baseline level (2009/2010) and the current year's (2010/2011) level. Specifically, pH declined whilst increases were observed in Magnesium levels across the treatments (Tables 1.10 and 1.11).
Table 1.5: Effect of shade tree species and density on growth of cocoa seedlings at 8 months aftertransplanting at Afosu
Treatments
Girth (mm)
Height (cm)
Means
SD
Means
SD
T1
14.5
1.2
94.5
1.6
T2
14.3
2.0
90.7
4.7
T3
15.2
1.3
94.3
3.2
T4 13.9 0.8 97.2 13.6 NS NS
NS = not significant
24

Cocoa Research Institute of Ghana Annual Report 2010-2011
Table 1.6: Effect of spacing on mean stem diameter and mean height (growth) of the mixed shadetree stand at 20 months after transplanting (2010/2011)
Treatments
Stem diameter (cm)
Height (cm)
Mean SD Mean SD T1 14.6a 3.1 266.5a 45.5 T2 12.5a 2.4 235.6a 52.2 T3 11.8a
2.5 208.5a 48.7
T4 21.1b
3.9 371.4b
46.4
Means with different superscript letter in a column are significantly different at p < 0.05.
Table 1.7: Mean stem diameter and height (growth) of the component shade trees in the mixedshade tree stand (n=8) at 20 months after transplanting (2010/2011)
Tree species Stem diameter (cm) SD Height (cm) SD Allanblackia floribunda (Sonkyi) 1.2 0.6 72.5 27.8
Ricinodendron heudelotii (Owama) 16.0 6.9 212.1 131.2 Persea americana (Paya) 15.8 3.1 311.6 99.0
Tetrapleura tetraptera
(Prekese)
17.9
2.9
310.8
60.5 Terminalia ivorensis
(Emire)
35.9
5.2
615.0
137.2 Milicia excelsa
(Odum)
1.0
2.4
89.3
16.2 Terminalia superba
(Ofram)
30.7
6.2
470.4
44.0
Table 1.8: Effect of spacing on mean stem diameter and mean height (growth) of the mixed shadetree stand at 9 months after transplanting (2009/2010)
Treatments
Stem diameter (cm)
Height (cm)
Mean
SD
Mean
SD
T1
1.6a
0.1
101.7a
15.7
T2
1.6a 0.2
99.8a
17.9
T3 1.3a 0.2 89.8a 11.1 T4 2.4b 0.1 157.5b 13.5
Means with different superscript letter in a column are significantly different at p < 0.05.
Table 1.9: Mean stem diameter and height (growth) of the component shade trees in the mixedshade tree stand (n=8) at 9 months after transplanting (2009/2010)
Tree species
Stem diameter (cm)
SD
Height (cm) SD
Allanblackia floribunda (Sonkyi) 1.0 0.24 47.1 14.1
Ricinodendron heudelotii (Owama) 1.3 0.35 91.0 34.6 Persea americana (Paya) 1.7 0.51 115.9 36.1
Tetrapleura tetraptera (Prekese) 1.8 0.48 131.0 31.6 Terminalia ivorensis (Emire) 3.4 0.24 196.3 33.6
Milicia excelsa (Odum) 0.9 0.10 92.3 19.5 Terminalia superba
(Ofram)
3.0
0.51
177.9
27.7
25
Cocoa Research Institute of Ghana Annual Report 2010-2011
Table 1.10: Some topsoil (0-15 cm depth) chemical and physical properties under the varioustreatments (second year data- 2010/2011).
Treatments
pH
% C
% N
Available P
(µg/g soil)
K
(meq/100g soil)
Mg
(meq/100g soil)
Ca
(meq/100g soil)
Soil Bulk Density
T1 4.93 1.22 0.16 13.07 0.99 0.70a 2.78 1.20 T2 4.76 1.41 0.18 13.54 0.99 1.36b 3.22 1.19 T3 4.64 1.17 0.16 12.72 0.97 0.92ab
2.24 1.18 T4 4.48 1.38 0.17 15.02 1.05 1.02ab
2.85 1.21
ns
ns
ns
ns
ns
ns
ns
Means with different superscript letter in a column are significantly different at p < 0.05.ns = not significant
Table 1.11: Some topsoil (0-15 cm depth) chemical properties under the various treatments(Baseline soil fertility status- 2009).
Treatments
pH
% C
% N
Available P
(µg/g soil) K
(meq/100g soil)
Mg
(meq/100g soil)
Ca
(meq/100g soil)
CEC
(c mol+ /kg)
T1 5.18 0.98 0.11 5.18 0.20 0.60 0.32 12.75 T2 4.93 1.15 0.12 5.43 0.21 0.74 0.33 8.06 T3 5.00 0.98 0.10 5.14 0.19 0.62 0.33 6.58 T4 5.11 1.14 1.24 5.80 0.22 0.87 0.34 10.49
ns
ns
ns
ns
ns
ns
ns
ns
RemarksNot enough information is available now to reach a conclusion. The trial should therefore continue to enable more information to be gathered.
ns = not significant
26
Intercropping cocoa with food crops is beneficial even in the absence of fertilizer application. This vindicates peasant farmer practice. Establishing cocoa by close planting and thinning slightly increases labour cost (established earlier on in the course of the trial), has no effect on yield and does not vindicate peasant farmer practice. Close planting at 1.5 m x 1.5 m does not confer any early yield advantage. Intercropping does not seem to affect the initial yield of cocoa and oil palm. Responses of cocoa to fertilizers vary with locations. Production of healthy and diseased pods did not differ significantly with the month of application of the fertilizers at the locations.
Reports compiled for the Forestry Department (Unpublished) show that there are about 674 species of woody plants attaining 5cm dbh (diameter at breast height) in the Ghanaian rain forest therefore, the 109 trees species encountered in the survey makes the cocoa production landscape relatively poor in tree species diversity. Though the cocoa production landscape is relatively low in tree species diversity as a result of farm establishment and management methods (rustic cocoa management system), it does contain important tree species that are potential mother trees for the long-term maintenance of the floristic (tree) composition of the landscape.
Women are actively involved in cocoa production as most of them are the owners of their cocoa farms. Though the farmers have a general positive attitude towards cocoa production they face many constraints including inadequate access to capital and labour, and poor extension support. The women however appear well informed on child labour issues. Scale adjustment was found to be the main marketing problem of farmers. The perception of farmers is that the liberalization of the internal marketing of cocoa has not helped to address marketing malpractices in the cocoa sector. Government should put in place measures such as introducing standard weights in all the buying centers so that farmers can verify whether the scales have been tampered with or not before having their beans weighed.
Effect of thinning on establishment and yield of cocoa (K. Opoku-Ameyaw, F.K. Oppong, K. Acheampong, K. Ofori-Frimpong and E. A. Dwomoh).
Routine maintenance of the plots and data recording continued from 2009/2010 (Rep. Cocoa
Res. Inst., Ghana, 2009/10). The yield of cocoa during the year was not significantly affected by the treatments (Table 1.2a). Close spacing of 1.5 m x 1.5 m with the highest tree population density continued to produce the lowest yield indicating that competition may be occurring between the plants in this treatment. Examination of the cumulative yield for the
COCOA MANAGEMENT THRUST
Cocoa Research Institute of Ghana Annual Report 2010-2011
27

Cocoa Research Institute of Ghana Annual Report 2010-2011
first six years indicates that close planting and pruning did not impart any positive effect on the trees. This could be attributed to the lack of significant treatment effect on growth observed the in early part of the trial.
Table 1.2a: Effect of thinning on early yields of cocoa
Thinning
regime
Yield (kg/ha)
‘05/06
‘06/07
‘07/08
08/09
09/10
‘10/11
Cumulative
T1 (1.5 m x 1.5 m)
9.6
156.2
271
107
49 78
670.8
T2 (1.5 m x 1.5 m thinned to 3.0 m x 3.0m)
26.2
138.9
516
139
65.7
81
966.8
T3 (1.5 m x 1.5 m thinned to 3.0 m x 3.0m)
14.0
118.9
575
141
60.1
106
1015.0
T4 (1.5 m x 3.0 m thinned to 3.0 x 3.0m)
24.2
116.6
420
193
106.0
94
923.8
T5 (3.0 m x 3.0 m)
12.9
124.8
434
229 180.4
161
1142.1
Lsd (5%)
ns
ns
Ns
ns
49.4
ns Cv (%)
78.4
47.4
41.1
51.7
34.8
52.1
ns - not significant at P=0.05
Similar to the yield of cocoa, black pod disease incidence was not significantly affectedby treatments (Table 1.2b)
Table 1.2b: Effect of thinning on black pod disease incidence
Thinning regime
% Black pod
‘05/06
‘06/07
‘07/08
08/09
09/10
‘10/11
T1 (1.5 m x 1.5 m)
6.6
20.1
36.3(36.9)
54.0 (47.3)
39.7 (39.0)
32.0 (32.5)
T2 (1.5 m x 1.5 m thinned to 3.0 m x 3.0m)
9.1
16.2
26.2 (30.6)
42.2 (40.3)
24.8 (29.7)
36.5 (36.5)
T3 (1.5 m x 1.5 m thinned to 3.0 m x 3.0m)
17.1
17.1
33.9
(35.6)
41.1 (39.8)
41.1 (39.7)
30.7 (33.3)
T4 (1.5 m x 3.0 m thinned to 3.0 x 3.0m)
14.3
10.8
28.9
(32.0)
42.1 (40.2)
23.7 (28.7)
27.9 (31.2)
T5 (3.0 m x 3.0 m)
6.8
15.1
7.9 (16.4) 29.9 (33.1)
17.2 (23.7)
31.6 (33.5)
Lsd (5%)
ns
ns
(9.4)
(7.46)
(8.8)
(ns) Cv (%)
Values in parenthesis are angular transformations; ns - not significant at P=0.05
28

Cocoa Research Institute of Ghana Annual Report 2010-2011
Similar to the previous years immature ripe pod production during the year was not significantly affected by treatments (Table 1.2c). However, the close spacing of 1.5 m x 1.5 m gave the highest amount of immature ripe pods. This could probably be as a result of the intense interplant competition within this system which might have affected the physiology and the production of the trees.
Table 1,2c: Effect of thinning on immature ripe pod production
Thinning regime
% Immature ripe pods
‘05/06
‘06/07
‘07/08
08/09
09/10
‘10/11
T1 (1.5 m x 1.5 m)
7.2
37.9
27.6
29.2 (32.6)
28.4 (32.2)
31.6 (33.9)
T2 (1.5 m x 1.5 m thinned to 3.0 m x 3.0m)
14.3
23.9
21.6
25.7 (30.4)
14.4 (18.8) 17.9 (21.7)
T3 (1.5 m x 1.5 m thinned to 3.0 m x 3.0m)
13.2
27.2
23.3
25.7 (30.4)
17.0 (21.2) 18.1 (25.2)
T4 (1.5 m x 3.0 m thinned to 3.0 x 3.0m)
10.8
24.0
17.4
20.4 (26.6)
13.9 (20.6)
24.6 (29.7)
T5 (3.0 m x 3.0 m) 6.8 25.9 11.1 21.0 (27.0) 13.1 (21.1) 22.6 (27.7) Lsd (5%) ns ns Ns ns ns ns Cv (%)
47.2
27.4
Values in parenthesis are angular transformations; ns - not significant at P=0.05
Cocoa/oil palm intercropping trial (K. Opoku-Ameyaw, F.K. Oppong, K. Acheampong, K. Ofori-Frimpong and E. A. Dwomoh).
Routine maintenance of the plots and data recording continued from 2009/2010 (Rep. Cocoa
Res. Inst., Ghana, 2009/10).There were no significant differences between treatments with regard to initial yield of cocoa beans, incidence of black pod and immature ripe. However cocoa under oil palm spaced at 10.1m triangular gave the lowest yield. Incidence of black pod and immature ripe pod production were slightly high in 10.1m triangular. In the case of black pod incidence it may be due to high humid atmosphere created as a result of close spacing of the oil palm. Intercropping did not significantly affect oil palm yield.
29

Cocoa Research Institute of Ghana Annual Report 2010-2011
Table2.2: Effect of intercropping on initial yields of cocoa and oil palm, incidence of black pod,immature ripe
Cropping systems
Yield (kg/ha)
% Black pods
% Immature
ripe
Oil palm (ton/ha)
Cocoa and oil palm spaced at 10.1m triangular
29.4
12.3 (19.5)
15.3 (20.5)
3.6
Cocoa and oil palm spaced at 10.7m triangular
41.3
11.5 (17.1)
4.2 (10.5)
3.2
Sole cocoa (control) 43.7 6.8 (10.3) 10.4 (15.1) -
Sole oil palm - - - 2.7 Sig. level
ns
ns
ns
ns
Cv%
58.2
49.4
29.7
47.2
Values in brackets are angular transformed
Cocoa-food crop intercropping (K. Opoku-Ameyaw, K. Osei-Bonsu, F. K. Oppong, K. Acheampong, K. Ofori-Frimpong and E. A. Dwomoh).
General maintenance of the plots and collection of cocoa yield data continued from Afosu and Bunso trials (Rep. Cocoa Res. Inst., Ghana, 2009/10). Similar to the previous years, the tenth year yield of cocoa beans was not significantly affected by the treatments (Table 1.1). This implies that intercropping with food crops did not impact negatively on the environment. Examination of the ten years cumulative yields indicated that with the exception of the cocoa/cassava combination, intercropping increased cocoa yields by 21.8% to 53.9%. This implies that in addition to the economic benefit established earlier on when the food crops were present, intercropping is also biologically beneficial for cocoa cultivation even in the absence of fertilizer application. Intercropping cocoa with food crops is beneficial even in the absence of fertilizer application. This vindicates peasant farmer practice.
30

Cocoa Research Institute of Ghana Annual Report 2010-2011
Tabl
e 1.
1: E
ffec
t of
inte
rcro
ppin
g on
the
yiel
d of
coc
oa b
eans
Tre
atm
ent
Y
ield
kg/
ha
2001
/
02
2002
/
03
2003
/
04
2004
/ 05
2005
/ 06
2006
/
07
2007
/
08 20
08/
09
20
09/
10
20
10/
11
C
umu-
lativ
e
% I
ncre
ase/
depr
essi
on in
yi
eld
rela
tive
to s
ole
coco
a
Sole
coc
oa
7.5
91
30
0
265
41
2 56
6
215
41
0 386
45
8
3110
.5
C
ocoa
/pla
ntai
n
3.1
13
4
517
48
0
730
750
57
6
444
750
40
3
4787
.1 +5
3.9
C
ocoa
/cas
sava
1.
3
82
284
20
3
280
412
28
2
449
378
46
5
2836
.3 -8
.8
Coc
oa/ m
aize
3.
1
76
525
38
9
674
591
42
0
515
559
41
2
4164
.1 +33
.9
Coc
oa/c
assa
va/p
lant
ain
0.
6
208
48
0
370
57
5 58
5
360
38
6 462
48
5
3911
.6 +25
.8
Coc
oa/c
assa
va/m
aize
13
.0
11
3
43
3
39
6
58
5 58
1
32
6
49
7
507
53
7
39
88.0
+28
.2
C
ocoa
/pla
ntai
n/m
aize
1.9
153
505
398
575
765
436
386
634
477
4330
.9
+39
.2
C
ocoa
/pla
ntai
n/ca
ssav
a/
M
aize
14.9
221
535
370
530
435
344
386
510
442
3787
.9
+21
.8
Se
d (2
4 df
)
Ns
Ns
ns
Ns
ns
ns
ns
Ns
ns
nss
CV
(%
)
87.3
47.7
36.8
44.0
40.6
48.8
34.7
38.4
28.3
th n
s –
not s
igni
fica
nt a
t 5%
pro
babi
lity;
* 1
0 y
ear
yiel
d
31

Cocoa Research Institute of Ghana Annual Report 2010-2011
Manipulation of cocoa cropping pattern through the timing of fertilizer application to
optimize cocoa production in black pod endemic areas (K. Ofori-Frimpong, A. A. Afrifa, I. Y. Opoku, A. O Dwapanyin, J. E Sarfo and F. Aneani)
General maintenance of the plots and collection of cocoa yield data continued from Afosu and Bunso trials (Rep. Cocoa Res. Inst., Ghana, 2008/09). Responses of cocoa to the fertilizers at different periods of fertilizer application varied with the locations (Table 2.4). Both the number of healthy and diseased pods were significantly (p=0.01) different between the locations. However at each location, the different periods of fertilizer application did not significantly (p=0.05) influence pods production.
32

Cocoa Research Institute of Ghana Annual Report 2010-2011
Mon
th o
f
fert
ilize
r ap
plic
atio
n
N
umbe
r of
pod
s ha
-1
A
cher
ensu
a
Te
chim
antia
Off
inso
Sefw
i W
iaw
so
Te
chim
an
H
ealth
y
Dis
ease
d H
ealth
y
Dis
ease
d
Hea
lthy
D
isea
sed
H
ealth
y
Dis
ease
d
Hea
lthy
D
isea
sed
May
13
191
17
78
4463
42
7
4688
2
807
39
52
308
13
432
33
0
June
95
31
904
61
82
827
46
982
72
6
3571
20
8
1276
1
403
Aug
ust
83
10
798
66
26
756
47
493
75
3
2358
17
1
1678
1
343
Sept
embe
r
7213
92
9
2133
12
29
4771
9
755
61
94
238
14
966
47
8
Oct
ober
83
29
814
13
60
1467
48
280
90
1
4149
14
0
2747
6
508
Unf
ertil
ized
75
95
1029
12
86
938
11
536
87
2
1955
11
5
1250
0
489
Mea
n
9028
.17
10
42
3675
94
0.67
41
482
80
2.33
36
96.5
19
6.67
16
319.
33
425.
17
L
SD b
etw
een
mea
ns o
f tw
o lo
catio
ns f
or h
ealth
y po
ds =
12,
208
(20
df)
LSD
bet
wee
n m
eans
of
two
loca
tions
for
dis
ease
d po
ds =
497
.7 (
20 d
f)
Tabl
e 2.
4: E
ffec
t of
diff
eren
t per
iods
of
fert
ilize
r ap
plic
atio
n on
pro
duct
ion
of h
ealth
y an
d di
seas
ed p
ods
33

A study of shade tree species diversity and characteristics in a cocoa agroecosystem. (G. J. Anim-Kwapong , A. A. Afrifa, K. Opoku-Ameyaw and M. K. Assuah )
Table 2.5 shows some quantitative farm characteristics that were recorded in the six cocoa growing regions [locations]. Information on shade tree species composition was collected from 166 cocoa farms [28 in Ashanti (AR); 27 in Brong-Ahafo (BAR); 34 in Eastern (ER); 26 in Central (CR); 26 in Western (WR) and 25 in Volta (VR)]. Only 17 out of the 166 respondents were women. There was no strong correlation among farm characteristics. The highest variance inflation factor was 3.2 for locations (respondents were younger in the Central and Western regions [variance explained by linear regression: 14%, p=0.005]. Farms were larger and older in Ashanti region [var. 10%, p=0.004; var. 11%, p=0.002]). Over 50% of the respondent had very little or no basic education (Figure 2.1).
Cocoa Research Institute of Ghana Annual Report 2010-2011
Table 2.5: Some characteristics of farmers and farms surveyed in the study area
Variable
Mean
Minimum
Maximum
Median
Farm size (acres)
5.7
0.5
25.0
5.0
Farm age (years)
56.0
25.0
85.0
50.0
Farmer age (years) 33.9 35.0 3.0 70.0 Shade tree size (DBH-cm)
67.9 12.7 639.3 62.0
Time under current management (years)
25.0
3.0
65.0
20.0
MSLC =Middle School Leaving Certificate
Figure 2.1: Education level of respondent farmers
34

Farmers' perception of illegal chainsaw operators stealing timber trees and destroying cocoa varied among locations. In Ashanti and Brong Ahafo regions perception was very high compared to the Eastern and Western regions but was non-existent in the Volta region. Despite the perception or otherwise, farmers nurtured and maintained some high value (class 1) timber tree species e.g. Edinam (Entandrophragma sp) and Odum (Milicia excela) as shade trees on their farms due to the high level of awareness of the benefits of shade trees to cocoa. Though none of the farms surveyed had suffered illegal chainsaw operation, 20% of farmers indicated that they have had contact with forestry department officials on issues of timber rights. All respondent (100%) said they actively guard against any activity that might threaten the productivity of their farms and consequently their livelihoods.
Species richness
Figure 2.2 shows the diversity (Species richness) recorded for each of the survey sites (locations). The Eastern (ER) and Volta (VR) regions recorded the highest and least diversity of 76 and 65 respectively. In the complete survey, 109 shade tree species were encountered of which 98% are indigenous to Ghana. Mango and Avocado pear (paya) which are exotic constituted the other 2%. The total number of shade trees encountered was 7643. Average number of shade tree species per farm was 18 (Minimum: 7, Maximum 36, Median 19).
Cocoa Research Institute of Ghana Annual Report 2010-2011
Figure 2.2: Number of shade tree species encountered in the separate locations (Regions)
35

Cocoa Research Institute of Ghana Annual Report 2010-2011
Diversity
Figure 2.3 is a rank-abundance curve for the tree species encountered in the survey. The curve is based on the total number of trees for every species ranked in descending order. The 10 most dominant species contain 42% of all the trees that were encountered. Two of these species, Ofram (Terminalia superba) and Odum are well known timber species (Table 2.6). Eleven percent of all the species recorded are known to be alternative host to the Cocoa Swollen Shoot Virus (CSSV) (Table 2.7).
Figure 2.3: Shade tree species rank-abundance curve for the survey with vertical axis on linear scale
Table 2.6: Abundance (numbers of trees) for the ten most dominant species in the survey
Species
Rank
Abundance
Proportion
Nyamedua
1
402
5.3
Ofram
2
389
5.1
Odum
3
369
4.8
Odoma
4
360
4.7
Konkroma
5
322
4.2
Sofo
6
293
3.8
Nyankyerene
7
284
3.7
Fruntum 8 278 3.6 Kuokuoninsuo 9 271 3.6 Owama 10 263 3.4 Total
3231
42.2
36

Cocoa Research Institute of Ghana Annual Report 2010-2011
Table 2.7: Abundance (tree numbers) of alternative host of CSSV encountered in the survey
Species
Rank
Abundance
Proportion
Sofo
6
293
3.8
Onyina
12
222
2.9
Akonkodie
15
195
2.6
Watapuo 27 92 1.2 Wawabema 39 51 0.7 Kwakuobese 71 7 0.1 Onyinakobin
77
5
0.1 Krabese
93
1
0.0001
Total
866
11.4
Figure 2.4 show the Rényi diversity profiles for the six locations (regions). All the profiles declined from left to right. This indicates that shade tree species were not evenly distributed for all the locations. The Volta region (VR) had the lowest profile and therefore had the least species diversity (species richness and evenness). The profile value for alpha = 0 provide information on species richness. The profile value is the logarithm of the species richness. The profile value for alpha = infinity provides information on the proportion of the most abundant species. Alpha = 1 is the Shannon diversity index and alpha = 2 is the logarithm of the reciprocal Simpson diversity index.
Figure 2.4: Rényi diversity profiles comparing the diversity of the locations.
37
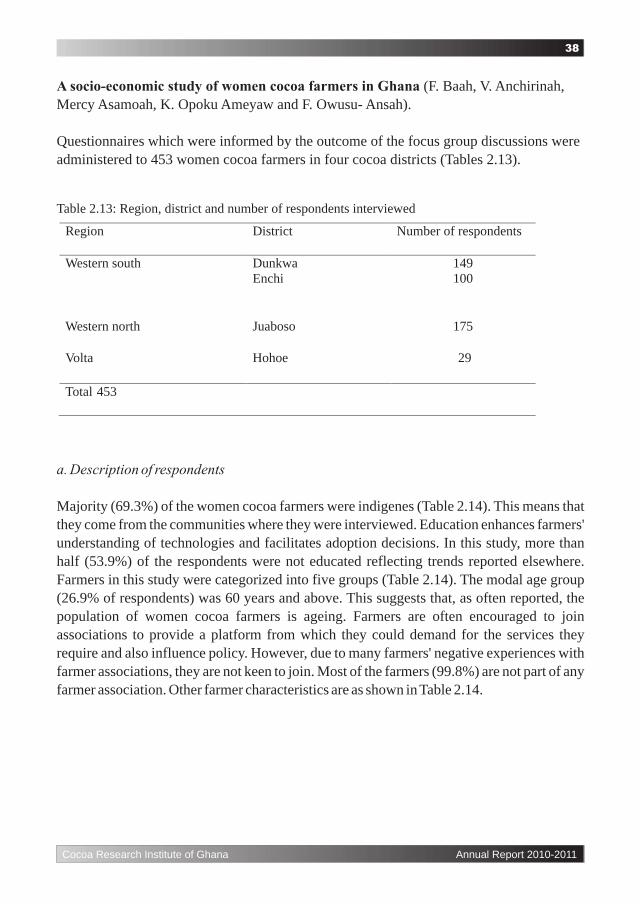
Cocoa Research Institute of Ghana Annual Report 2010-2011
A socio-economic study of women cocoa farmers in Ghana (F. Baah, V. Anchirinah, Mercy Asamoah, K. Opoku Ameyaw and F. Owusu- Ansah).
Questionnaires which were informed by the outcome of the focus group discussions were administered to 453 women cocoa farmers in four cocoa districts (Tables 2.13).
Table 2.13: Region, district and number of respondents interviewed
Region
District
Number of respondents
Western south
Dunkwa
Enchi 149
100
Western north Juaboso 175
Volta
Hohoe
29
Total
453
a. Description of respondents
Majority (69.3%) of the women cocoa farmers were indigenes (Table 2.14). This means that they come from the communities where they were interviewed. Education enhances farmers' understanding of technologies and facilitates adoption decisions. In this study, more than half (53.9%) of the respondents were not educated reflecting trends reported elsewhere. Farmers in this study were categorized into five groups (Table 2.14). The modal age group (26.9% of respondents) was 60 years and above. This suggests that, as often reported, the population of women cocoa farmers is ageing. Farmers are often encouraged to join associations to provide a platform from which they could demand for the services they require and also influence policy. However, due to many farmers' negative experiences with farmer associations, they are not keen to join. Most of the farmers (99.8%) are not part of any farmer association. Other farmer characteristics are as shown in Table 2.14.
38

Table 2.14: General feature of respondent women cocoa farmers
Cocoa Research Institute of Ghana Annual Report 2010-2011
Feature
Number of Farmers Reporting
Percentage
Residential Status
Indigene
1st Generation migrant
2nd Generation migrant
314
108
31
69.3
23.8
6.8
Age
(in years)
20-29
30-39
40-49
50-59
60 and above
31
102
110
88
122
6.8
22.5
24.3
19.4
26.9
Education
None
Primary
JSS Secondary/Commercial/Vocational College/University
244
77
113 18 1
53.9
17.0
24.9 4.0 0.2
Marital status Married
Single Divorced
Widowed
Cohabitation
272
21 68
90
2
60.0
4.6 15.0
19.9
0.4
Member of farmer organization?
Yes
No
1
452
0.2
99.8
b. Access to resources
(I) Land
Though most of the respondents (94.9%) were owner- operators, majority (82.6%) did not have any legal document confirming their ownership of the land on which they operate. They however have no sense of insecurity on the land. They conceded that having title deeds was helpful but they were put off by cost and red tape associated with the documentation process. Most of the women (85.2%) indicated that they did not experience any difficulty in acquiring their cocoa farm which they (40.8%) inherited from their families. Currently the situation is different, as 84.1% of the women said it is difficult to acquire new land now in their communities for cocoa cultivation. This they attributed in part to scarcity of land (28.4%) and land litigation (32.8%) issues (Table 2.15).
39

Cocoa Research Institute of Ghana Annual Report 2010-2011
Table 2.15: Access to land and related issues with regards to women cocoa farmers (n=453)
Feature
Frequency
Percentage
Farmer category
Owner-operator
Abunu tenant
Abusa tenant
430
17
6
94.9
3.8
1.3
Do you have documents covering your land?
Yes
No
79
374
17.4
82.6
How land was acquired?
Purchased
Leased
Inherited
Gift from husband
Gift from family
Sharecropping
11
16
185
89
135
17
2.4
3.5
40.8
19.6
29.8
3.8
Did you experience any difficulties in acquiring the land?
Yes
No
67
386
14.8
85.2
Difficulties associated with access to land for cocoa cultivation (n=67)
High cost of land Land scarcity Discrimination against
women Land litigation
14 19 12
22
20.9 28.4 17.9
32.8
Farmers rating of ease access to land for cocoa cultivation
Very easy
Easy
Difficult
Very diffi cult
15
57
176
205
3.3
12.6
38.9
45.2
Source: Survey data, 2010
(ii) Capital
Capital remains a vital resource in cocoa production as it enhances farmers' ability to adopt research recommendations and manage the farm sustainably. Most (87.6%) of the respondents depend on their own income for the maintenance of their cocoa farms as they do not have access to any credit facility. However, some women (12.4%) obtained credit from purchasing clerks (25.5%) and money lenders (23.6) for the maintenance of their cocoa farms and the upkeep of the homes (Table 2.16)
40

Cocoa Research Institute of Ghana Annual Report 2010-2011
Table 2.16: Access to capital by women cocoa farmers (n=453)
Feature
Frequency
Percentage
Access to any credit facility?
Yes
No
56
397
12.4
87.6
Source of Loan (n=55)
Purchasing clerk
Husband
Relative Money lender
Rural Bank Other Banks
Other
14
2
10 13 9 6 1
25.5
3.6
18.2 23.6 16.4 10.9 1.8
Rating of ease accessibility to loans?
Very easy
Easy
Difficult
Very difficult
3 7
178
265
0.7
1.5
39.3
58.4
(iii) Labour
Unlike men, Women cocoa farmers often complain about their inability to exploit their kinship ties to harness labour for their farm operations. Reliance solely on family labour for cocoa farming activities is no longer an option for most women cocoa farmers. This is partly because of relatively more children being at school in recent times and most out of school youth are in the towns and cities in search of jobs. Consequently, most (77.7%) of the women employed hired labour for the maintenance of their cocoa farms. The old age of the women and the poor state of health of many does not enable them to rely on their own strength to undertake maintenance activities on their farms. Most of the farmers felt that it was increasingly difficult for them to obtain labour for their farm operations (Table 2.17).
41

Cocoa Research Institute of Ghana Annual Report 2010-2011
Table 2.17: Labour related issues of women cocoa farmers (n=453)
Feature
Frequency
Percentage
Do you hire
labour
for farm operations?
Yes
No
352
101
77.7
22.3
Reasons for not using hired labour (n=101)
Wages too high Labourers not available
Other
94 2 5
93 2 5 Rating of ease of access to labour for farm
operations Very easy
Easy
Difficult
Very difficult
16
74
187
176
3.5
16.3
41.3
38.9
Total
453
100
Source: Survey data, 2010
c. Farmers' attitude towards cocoa cultivation
The study sought to explore the myriad of problems farmers face and their effects on the psychological evaluation of cocoa as an enterprise. Farmers were asked to respond to a series of positively and negatively worded statements on a five-point Likert scale. These statements were merely indicators of their attitudes and were derived from statements they made during the focus group discussions. The responses are presented in Table 2.18. Farmers displayed a generally positive attitudinal disposition towards cocoa cultivation production, agreeing to most of the positive statements (Table 2.18).
42

Cocoa Research Institute of Ghana Annual Report 2010-2011
Table 2.18: Farmers' reactions to attitudinal statements
Statement
Farmer response
Frequency
Percentage
1. Cocoa farming is the best way for women in this community to improve their standard
of living
Strongly disagree
Disagree
Undecided
Agree
Agree strongly
8
17
9
193
226
1.8
3.8
2.0
42.6
49.9
2. Cocoa farming provides a secured and reliable source of income especially in old age.
Strongly disagree
Disagree
Undecided
Agree
Agree strongly
2
4
8
216
223
0.4
0.9
1.8
47.7
49.2
3. To women farmers in this community, the future is cocoa
Strongly disagree
Disagree
Undecided
Agree
Agree strongly
2
10
7
205
229
0.4
2.2
1.5
45.3
50.6
4. The government is providing the necessary support to women cocoa farmers which have motivated them to maintain their farms well and boost output.
Strongly disagree
Disagree
Undecided
Agree Agree strongly
75
95
18
184 81
16.6
21.0
4.0
40.6 17.9
5. Many farmers do not see any future in cocoa and are therefore investing
in other
farms enterprises or even sending their children abroad in the hope of securing a better future.
Strongly disagree Disagree
Undecided Agree
Agree strongly
112 130
23 119 69
24.7 28.7
5.1 26.3 15.2
6. It has been suggested in some quarters that many farmers regard Cocoa Research Institute of Ghana (CRIG, WACRI) as being very remote from them.
Strongly disagree
Disagree
Undecided
Agree
Agree strongly
11
20
47
148
227
2.4
4.4
10.4
32.7
50.1
7. Extension support for farmers at the moment is very poor.
Strongly disagree
Disagree
Undecided
Agree
Agree strongly
7
19
13
156
258
1.5
4.2
2.9
34.4
57.0
8. It is better for someone Strongly disagree
187
41.5
43

Cocoa Research Institute of Ghana Annual Report 2010-2011
A study into marketing constraints farmers face in the cocoa sector and its effects on
their Attitude (F. Baah, V. Anchirinah, Mercy Asamoah and F. Owusu- Ansah)
Description of respondentsMajority of the respondents interviewed were males (94.2%) and most (69.2%) have had some form of formal education. The general characteristics of the sample are presented in Table 2.20.
Table 2.20: General features of respondents
Feature
Category of respondents
Frequency
Percentage
Sex
Male
Female 49
3 94.2
5.8
Religious inclination
Christianity
Islamic Others
50
1 1
96.2
1.9 1.9
Educational level JHS/Middle school Senior high school Vocational /technical
Polytechnics/university Other
36 11 3
1 1
69.2 21.2 5.8
1.9 1.9
Many (29%) of the purchasing clerks worked with Produce Buying Company (PBC) which remains the predominant company to which farmers sell their cocoa (Fig 2.8). It was found in the first phase of this study that 57.7% of farmers sold their cocoa to the Produce Buying Company. Adwumapa, Transroyal and Olam are some of the other companies to which farmers sell their produce
Figure 2.8: Proportion of purchasing clerks working with Licensed Buying Companies (LBCs).Problems of farmers as perceived by purchasing clerks
44

Cocoa Research Institute of Ghana Annual Report 2010-2011
Purchasing clerks were asked to mention the main problems of farmers and how farmers themselves and government can help address these problems. Farmers presenting low quality cocoa to PCs at the sheds is the main challenge to the farmers (Table 2.21). This is because it is a potential source of conflict when farmers' cocoa beans are either rejected or discounted. In addition, PCs feel that inadequate access to institutional credit is the bane of many farmers. It places them in the vicious cycle of acute indebtedness and occasional relief. They also stated that the financial problems of farmers could be addressed if they manage their finances well in addition to Government ensuring that access to institutional credit was improved.
Table 2.21: Problems of farmers from the perspectives of PCs
Problem
Number of times mentioned
Percentage
Poor access to institutional credit Presentation of low quality cocoa at the sheds Lack of inputs Low price of cocoa
High transportation cost
Delay in payment for farmers’ cocoa
37
52 26
19
13
13
24.0
32.5 16.2
11.9
8.1
8.1
Purchasing clerks response to farmers' allegations
Scale adjustment
Farmers allege that purchasing clerks adjust the weighing scales such that the true weight of their dry beans is reduced sometimes by as much as 12 kilogrammes. This was the number one marketing problem of farmers. Most of the PCs denied this but a few conceded that they do adjust the scale as reported by farmers. They insist that they were forced to do this to off-set some costs that they incur but are not reimbursed by the Licensed Buying Companies. These include security at the sheds, labour to re-dry cocoa and 'tips' to drivers of evacuating trucks. One or two PCs also confirmed that they were often required by the district managers to 'pay' them a number of bags of cocoa at the end of the season. Since they were not cocoa farmers, they have to pass on this cost to the farmers.
Inducing farmers to mortgage their farms for loans
Although PCs conceded that mortgaging farmers' farms for loans practice was rampant, they denied that they induced farmers to do that. It was rather the farmers who come to them with
45

Cocoa Research Institute of Ghana Annual Report 2010-2011
the offer of their cocoa farms for loans. The farmers were often in critical financial situations such as bereavement or wards going to university or secondary school, and therefore had to help. In doing this, many PCs said that they borrow from banks or use their own savings to help farmers.. It was said to be a very lucrative business especially during the lean season (outside the main harvesting months).
The district managers denied all the allegations made by the farmers and the PCs. They said that some PCs do engage in those malpractices but the LBCs frown on them and when caught, they were reprimanded.
How has the liberalization of internal marketing of cocoa fared?
Some purchasing clerks believe that the liberalization of the internal cocoa market system has ensured prompt cash payments to farmers and reduced the incidence of farmers being cheated. It has also brought about competition in the marketing of cocoa beans and even turn some farmers into PCs within their communities (Figure 2.9).
Figure 2.9: Positive effects of the Liberalization of the Internal marketing of cocoa from theperspectives of purchasing clerks
On the other hand, many buying companies and increased competition for cocoa beans has led in some instances to farmers compromising on the quality of their cocoa, increased theft of cocoa and PCs bolting with farmers' money among others (Figure 2.10).
46

Cocoa Research Institute of Ghana Annual Report 2010-2011
Figure 2.10: Some negative consequences of the internal liberalization of cocoa marketing(PCs' perspectives)
A survey of living standards in cocoa farming communities in Ghana (Mercy Asamoah, V. Anchirinah F. Owusu- Ansah and Victress Johnson).
Results from the focus group discussions indicate that the majority (90%) of the respondents regarded their current living conditions as poor, especially, those in the cocoa swollen shoot endemic areas in the Essam district of the Western Region. Interestingly, there is a perception among the farmers that it is only the seriously ill, the bed-ridden or the lazy person who could be described as poorest of the poor. Some of the respondents vehemently denied that they are poor based on their religious belief that denounces negative confession. Thus, although their own wealth ranking put them in the poor category, their religious faith puts them on an abstract level. To such people determination and hard work coupled with the availability of the needed productive assistance can lift them from the current poverty status to a better living condition. Figures 2.7 and 2.8 show how the farmers in Essam district described their current standard of living and wealth status. More than half of the respondents were neither happy about their standard of living nor their wealth status.
47

Cocoa Research Institute of Ghana Annual Report 2010-2011
Level of Education
No Formal Education
Primary School
JHS/Middle School
Secondary School
Vocational /Technical
Polytechnic/University
Other
355
170
804
76
40
16
7
24.2
11.6
54.8
5.2
2.7
1.1
.5
48

Cocoa Research Institute of Ghana Annual Report 2010-2011
Five levels of wealth/poverty were identified with clearly conceptualized and varying indicators to differentiate each stratum as perceived in each community. The levels were: wealthy, fairly wealthy/middle, average, poor and very poor. The respondents used eight variables to distinguish each level from the other. The variables were: cocoa production per year, number of labourers (both permanent and casuals) that one has, the size of one's well managed cocoa farm, the type, number and location of one' houses, ability to handle one's family responsibilities and the extended relations, educational level of one's children's, number of cars and other variables including nature of businesses apart from cocoa farms.
There are wide variations in the results because their decisions were informed by the type of community they lived in, the social amenities available and by their own beliefs. The general trend is that the farmers stratified themselves into wealth/ poverty status using their ownership of resources. The smaller communities (less than 1000 people) tended to use fewer numbers in each of the variables indicated by them (Tables 2.20 – 2.24).
Table 2.20: Perception of wealth status by cocoa farmers in Ashanti and Brong Ahafo regions usingcocoa production during a focus group discussion
Table2.21: Perception of wealth status by cocoa farmers in Ashanti and Brong Ahafo regions usingnumber of labour employed during a focus group discussion
Table 2.22: Perception of wealth status by cocoa farmers in Ashanti and Brong Ahafo regions usingnumber of acres of well managed farms during a focus group discussion
Communities
Wealthy
Middle
Average
Poor
Very poor
Konkontriso, B/A 80 45 25 1.5 0 Dwomo, B/A 60 15 10 5 1 Awadua, A/R 100 100 50 20 0
Bonsukrom, A/R
200
150
50
5
0
Communities
Wealthy
Middle
Average
Poor
Very poor
Konkontriso, B/A 5 3 2 0 0 Dwomo, B/A 10 6 3 1 0 Awadua, A/R 13 5 4 2 0
Bonsukrom, A/R
4
3
3
1
0
Communities
Wealthy
Middle
Average
Poor
Very poor
Konkontriso, B/A 150 60 35 3.5 0 Dwomo, B/A 350 75 90 30 7.5 Awadua, A/R 500 300 80 50 0
Bonsukrom, A/R
500
200
100
20
1
49

It is important to note that the majority of the farmers believed that significant improvement in their lives could be achieved by granting them sustainable credit, access to productive resources and improving community infrastructure. In addition, their children should be taken as the target of change by extending basic social amenities such as health posts, junior and senior high schools in the rural communities. By this, they advocated for improvement in government policies that directly or indirectly impact on their lives such as cocoa board scholarships to wards, increase in cocoa prices, reduction of input prices, making national health insurance scheme free for cocoa farmers and rural electrification projects. Based on these insights, it has been decided that the variables identified in the RRA shall be included in the questionnaire for the formal survey to assist in the stratification of cocoa farmers as per the objective of this study.
Studies on the agronomic efficacy of some foliar fertilizers on mature cocoa (A. A. Afrifa, K. Ofori-Frimpong, and S. Acquaye)
Routine maintenance and yield recording also continued (Rep. Cocoa Res. Inst., Ghana, 2009/2010).
Cocoa Research Institute of Ghana Annual Report 2010-2011
Table 2.23: Perception of wealth status by cocoa farmers in Ashanti and Brong Ahafo regions usingother business operated by a farmer
Village Very Wealthy Fairly wealthy Average wealthy Poor Very poor
Kokontriso Stores (10) Stores (6) Petty Trading 0 0 Dwommo Stores (10) Stores Store Livestock Livestock Awadua Stores/factory Stores Petty trading 0 0 Bonsukrom Stores (10) Stores (7) Stores (3) Petty Trading 0
Table 2.24: Perception of wealth status by cocoa farmers in Ashanti and Brong-Ahafo regions usingnumber/ type of vehicles owned by a farmer.
Town Very Wealthy Fairly wealthy Average wealthy Poor Very poor
Kokontinso 4 (C) 3 (C) 2 (C) 0 Dwomo 8 (P, C) 5 (P , C) 1 (P), 1(MB) 1 (B) 0 Awadua 5 (C), 2 (P) 3 (C) ,1 (P) 2 (C) , 1 (P) 1 (MB),(B) 0 Bonsukrrom 5 (C) , 4 (P) 2 (C) , 1 (P) 2 (C) , 1 (P) 1 (MB) 0
Legend: C - commercial cars (articulated truck, cargo cars and mini cab)P - private carsMB – motorbikeB - bicycle.
50
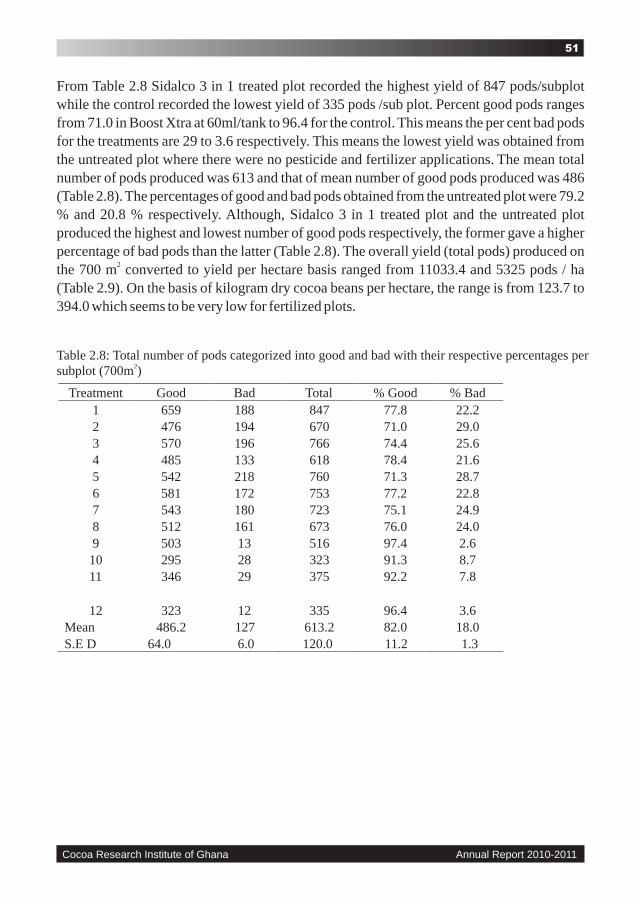
Cocoa Research Institute of Ghana Annual Report 2010-2011
From Table 2.8 Sidalco 3 in 1 treated plot recorded the highest yield of 847 pods/subplot while the control recorded the lowest yield of 335 pods /sub plot. Percent good pods ranges from 71.0 in Boost Xtra at 60ml/tank to 96.4 for the control. This means the per cent bad pods for the treatments are 29 to 3.6 respectively. This means the lowest yield was obtained from the untreated plot where there were no pesticide and fertilizer applications. The mean total number of pods produced was 613 and that of mean number of good pods produced was 486 (Table 2.8). The percentages of good and bad pods obtained from the untreated plot were 79.2 % and 20.8 % respectively. Although, Sidalco 3 in 1 treated plot and the untreated plot produced the highest and lowest number of good pods respectively, the former gave a higher percentage of bad pods than the latter (Table 2.8). The overall yield (total pods) produced on
2the 700 m converted to yield per hectare basis ranged from 11033.4 and 5325 pods / ha (Table 2.9). On the basis of kilogram dry cocoa beans per hectare, the range is from 123.7 to 394.0 which seems to be very low for fertilized plots.
Table 2.8: Total number of pods categorized into good and bad with their respective percentages per2subplot (700m )
Treatment
Good
Bad
Total
% Good
% Bad
1
659
188
847
77.8
22.2
2
476
194
670
71.0
29.0
3
570
196
766
74.4
25.6
4
485
133
618
78.4
21.6
5
542
218
760
71.3
28.7
6
581
172
753
77.2
22.8
7 543 180 723 75.1 24.9 8 512 161 673 76.0 24.0 9
503
13
516
97.4
2.6
10
295
28
323
91.3
8.7
11
346
29
375
92.2
7.8
12
323
12
335
96.4
3.6
Mean
486.2
127
613.2
82.0
18.0
S.E D
64.0
6.0
120.0
11.2
1.3
51

Fertilizer Verification Trials on Farmers Farms (A. A. Afrifa, K. Ofori-Frimpong and S. Acquaye)
General maintenance of the plots and collection of cocoa yield data continued on the trials plots (Rep. Cocoa Res. Inst., Ghana, 2009/10). From Table 2.5, T4 plots recorded the highest mean total pod of 9036.0 pods per the sub plot of 0.2 ha. The lowest of 4395.1 pods was recorded from control plot. Comparing the various fertilizer treatments with the control, it could be noted that yields from the fertilized plots were higher than the Control. The individual performances of the treatments in relation to the total number of pods obtained follows a descending order from the highest to the lowest as T6> T4>T2> T1> T3>T5>T7. Records on healthy and unusable pods produced are in Tables 2.6 and 2.7. The highest and the lowest percentages of healthy pods recorded in the trials were 96.5% and 92.7% for T4 and T7 respectively. The highest and the lowest percentages of unusable pods were recorded inT7 (7.3%) and T4 (3.5%). Converting the yield figures to kg/ha using 28 pods to 1kg dry cocoa beans, T6 treated plots produced the highest mean of 1020.4 kg/ha whiles T7 recorded the lowest mean yield 784.6 kg /ha. Considering the individual yield records, T6 treated plot in New Edubiase produced as high as 11806 pods /sub plot compared with 1804 pods/ subplot obtained from Bibiani, T7. Yield from the fertilized plots was almost the same. This means the fertilizers have almost the formulation and or from the same primary materials.
Cocoa Research Institute of Ghana Annual Report 2010-2011
Table 2.9: Total number of pods from the subplot converted to per hectare bases and kg dry cocoabeans.
Treatment
Total Pods / Ha
Kg Dry Cocoa Beans / Ha
1
11033.4
394.05
2
9514
339.7
3
10792
385.4
4
8775.6
313.4
5
10792
385.4
6 10692.6 381.8 7 10266.6 366.6 8 9556.6 341.3 9
8179.2
292.1
10
4586.6
163.8
11
5325
190.1
12
3464.8
123.7
Mean 8583.2 306.4 S.E D 640.2 45.3
52
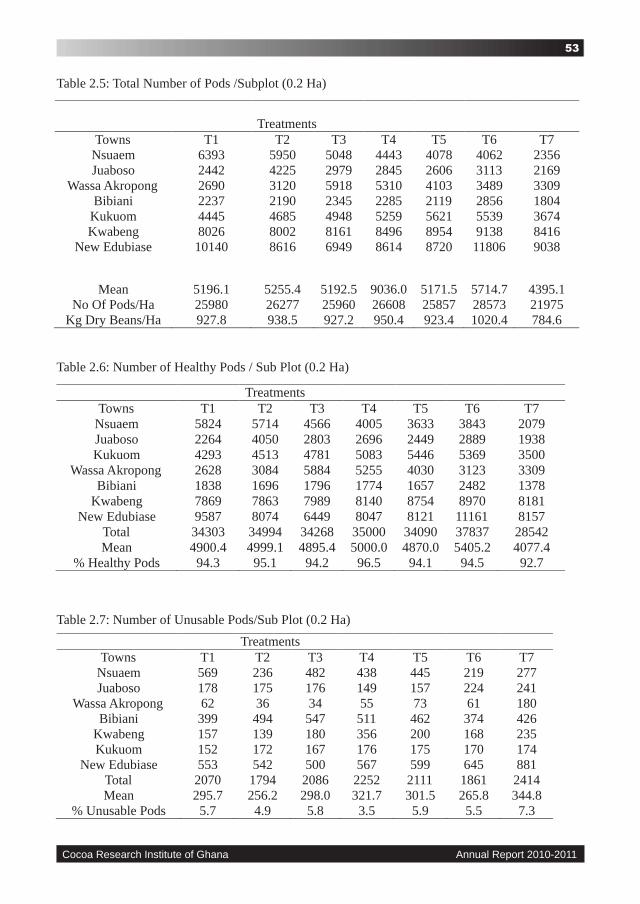
Cocoa Research Institute of Ghana Annual Report 2010-2011
Table 2.5: Total Number of Pods /Subplot (0.2 Ha)
Treatments
Towns
T1
T2
T3
T4
T5
T6
T7
Nsuaem
6393
5950
5048
4443
4078
4062
2356
Juaboso
2442
4225
2979
2845
2606
3113
2169
Wassa Akropong
2690
3120
5918
5310
4103
3489
3309
Bibiani
2237
2190
2345
2285
2119
2856
1804
Kukuom
4445
4685
4948
5259
5621
5539
3674
Kwabeng 8026 8002 8161 8496 8954 9138 8416 New Edubiase
10140 8616 6949 8614 8720 11806 9038
Mean
5196.1
5255.4 5192.5
9036.0
5171.5
5714.7
4395.1
No Of Pods/Ha
25980
26277
25960
26608
25857
28573
21975 Kg Dry Beans/Ha
927.8
938.5
927.2
950.4
923.4
1020.4
784.6
Table 2.6: Number of Healthy Pods / Sub Plot (0.2 Ha)
Treatments
Towns
T1
T2
T3
T4
T5
T6
T7
Nsuaem
5824
5714
4566
4005
3633
3843
2079
Juaboso
2264
4050
2803
2696 2449
2889
1938
Kukuom
4293
4513
4781
5083 5446
5369
3500
Wassa Akropong 2628 3084 5884 5255 4030 3123 3309
Bibiani 1838 1696 1796 1774 1657 2482 1378 Kwabeng 7869 7863 7989 8140 8754 8970 8181
New Edubiase
9587
8074
6449
8047 8121
11161
8157
Total
34303
34994
34268
35000
34090
37837
28542 Mean
4900.4
4999.1
4895.4
5000.0
4870.0
5405.2
4077.4
% Healthy Pods
94.3
95.1
94.2
96.5
94.1
94.5
92.7
Table 2.7: Number of Unusable Pods/Sub Plot (0.2 Ha)
Treatments
Towns
T1
T2
T3
T4
T5
T6
T7
Nsuaem
569
236
482
438
445
219
277
Juaboso
178
175
176
149
157
224
241
Wassa Akropong
62
36
34
55
73
61
180
Bibiani 399 494 547 511 462 374 426 Kwabeng 157 139 180 356 200 168 235 Kukuom 152 172 167 176 175 170 174
New Edubiase
553
542
500
567
599
645
881 Total
2070
1794
2086
2252 2111
1861
2414
Mean
295.7
256.2
298.0
321.7
301.5
265.8
344.8
% Unusable Pods
5.7
4.9
5.8
3.5
5.9
5.5
7.3
53

A comparative study on the agronomic efficacy of organic fertilizer on the performance
of mature cocoa (A. A. Afrifa, K. Ofori-Frimpong, and S. Acquaye)
General maintenance of the plots and collection of cocoa yield data continued on the trials plots (Rep. Cocoa Res. Inst., Ghana, 2009/10). Table 2.10 shows the total number of pods obtained from the various treatments at each location. Total number of pods from the treatments in each location ranges from 510 pods / subplot (0.2ha) in Assin Nsuaem T7 to15928 pods / subplot (0.2ha) in Techiman T5. T3 recorded mean number of total pods of 7220.7 pods / subplot (0.2ha) followed by T5 with 5310.6 pods / subplot (0.2ha). The lowest mean number of total pods was 2133.4 recorded from the control plotT7. Mean yield in kg dry beans per hectare ranges from 990.5 in the control to 3352.5 in treatment 3. The yield results seems higher than the yield results from most of the trial plots so far conducted. Table 2.11 shows the number of healthy pods obtained from the various treatments at each location for the individual treatments. Percentages of healthy pods to the total number of pods for the treatments for the locations range from 97.4% (T1) to 90.7 in the control. Table 2.12 shows the number of unusable pods obtained from the various treatments at each location. These figures converted to percentages ranges from 4.1 % for T3 to 9.3 % for T7. Looking at the yield figures from the trials for the first year, the candidate fertilizers are promising.
Cocoa Research Institute of Ghana Annual Report 2010-2011
Table 2.10: Total Number of Pods / Sub Plot (0.2 Ha)
Treatments
Towns
T1
T2
T3
T4
T5
T6
T7
Assin Nsuaem
2390
1516
1513
2063
970
961
510
Assin Fosu
2541
1944
2197
2108
2203
2206
1297
Sefwi Wiawso
2079
1493
1546
1546
1667
1735
1653
Juaso
2048
2630
2602
2184
2477
2950
2289
Twifo Praso
4060
2756
5575
4768
4309
3966
2530
Asankragua
9273
13083
7846
7971 11104
11646
3755
Bechem 2745 2642 2609 2886 2199 2311 1236 Mankranso 5414 5877 6452 6141 7070 8507 4418
Dormaa Ahenkro 3686 2263 3182 2801 2741 3870 1181 Asamankese
2012
2321
3675
3061
2420
2343
889 Techiman
10282
15670
10602
13843 15928
4596
1761
Enchi
2757
2965
3321
3795
4147
3435
2243
Jacobu
9781
6272
9750
10769
11799
13134
3973
Total
59068
61432
93870
63936
69034
61660
27735
Mean
4543.6
4725.5
7220.7
4918.1
5310.3
4743.0
2133.4
No Of Pods/Ha
22718
23627.5
36103.5
24590.5
26551.5
23175
10667
Kg Dry Beans/Ha
2109.5
2194
3352.5
2283.4
24655
2202.1
990.5
54

Cocoa Research Institute of Ghana Annual Report 2010-2011
Table 2.11: Number of Healthy Pods / Sub Plot (0.2 Ha)
Treatments
Towns
T1
T2
T3
T4
T5
T6
T7
Assin Nsuaem
1463
828
870
907
579
578
510
Assin Fosu
2431
1608
1867
1801
1848
1890
1015
Sefwi Wiawso
1894
1345
1373
1413
1484
1608
1502
Juaso
2048
2630
2598
2184
2462
2944
2253
Twifo Praso
3892
2648
5425
4639
4060
3735
2552
Asankragua
8661
12098
7188
7193
10169
10706
3327
Bechem
2495
2256
2609
2576
2031
2136
1144
Mankranso
4556
4949
5729
5140
5547
7015
3441
Dormaa Ahenkro
3240
1970
2737
2475
2445
3271
1058
Asamankese
2012
2318
3675
6061
2420
2343
889
Techiman
10038
15459
10446
13609
15433
4460
1669
Enchi
2529
2732
3090
3523
3862
3057
1947
Jacobu
9503
6153
9589
10620
11709
13049
3856
Total
54762
56994
57196
62141
64049
56792
25163
Mean
4558.6
4384.1
3264.8
4780.0
4926.8
4368.6
1935.6
% Healthy Pods
92.7
92.7
95.9
97.1
92.8
92.2
90.7
Table 2.12: Number of unusable Pods / Sub Plot (0.2 Ha)
Treatments
Towns T1 T2 T3 T4 T5 T6 T7 Assin Nsuaem 927 688 643 566 391 383 215
Assin Fosu 353 336 330 307 355 316 282 Sefwi Wiawso
185
148
173
133
183
127
151
Juaso
0
0
4
0
26
27
76
Twifo Praso
168
108
150
129
249
231
278
Asankragua
612
985
658
778
935
940
428
Bechem
250
386
172
310
168
175
92
Mankranso
854
928
723
1001
1523
1492
977
Dormaa Ahenkro
446
293
450
326
286
575
123
Asamankese
0
3
0
0
0
0
0
Techiman
244
211
156
234
495
136
92
Enchi
228
233
231
272
285
378
296
Jacobu
278
119
161
149
90
85
117
Total
4545
4438
3851
4205
4986
4865
3127
Mean
349.6
341.3
296.2
323.4
383.5
374.2
240.5
% Unusable Pods
7.6
7.3
4.1
2.9
7.2
7.8
9.3
55
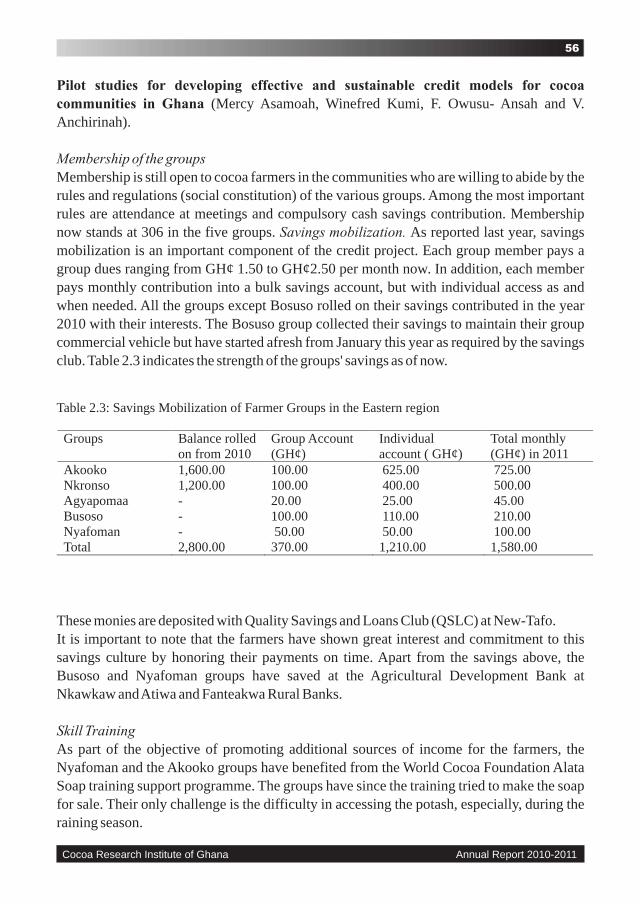
Pilot studies for developing effective and sustainable credit models for cocoa
communities in Ghana (Mercy Asamoah, Winefred Kumi, F. Owusu- Ansah and V. Anchirinah).
Membership of the groups
Membership is still open to cocoa farmers in the communities who are willing to abide by the rules and regulations (social constitution) of the various groups. Among the most important rules are attendance at meetings and compulsory cash savings contribution. Membership now stands at 306 in the five groups. Savings mobilization. As reported last year, savings mobilization is an important component of the credit project. Each group member pays a group dues ranging from GH¢ 1.50 to GH¢2.50 per month now. In addition, each member pays monthly contribution into a bulk savings account, but with individual access as and when needed. All the groups except Bosuso rolled on their savings contributed in the year 2010 with their interests. The Bosuso group collected their savings to maintain their group commercial vehicle but have started afresh from January this year as required by the savings club. Table 2.3 indicates the strength of the groups' savings as of now.
Cocoa Research Institute of Ghana Annual Report 2010-2011
Table 2.3: Savings Mobilization of Farmer Groups in the Eastern region
Groups
Balance rolled on from 2010
Group Account
(GH¢)
Individual account ( GH¢)
Total monthly (GH¢) in
2011
Akooko
Nkronso
Agyapomaa
Busoso
Nyafoman
Total
1,600.00
1,200.00
-
-
-
2,800.00
100.00
100.00
20.00
100.00
50.00
370.00
625.00
400.00
25.00
110.00
50.00
1,210.00
725.00
500.00
45.00
210.00
100.00
1,580.00
These monies are deposited with Quality Savings and Loans Club (QSLC) at New-Tafo. It is important to note that the farmers have shown great interest and commitment to this savings culture by honoring their payments on time. Apart from the savings above, the Busoso and Nyafoman groups have saved at the Agricultural Development Bank at Nkawkaw and Atiwa and Fanteakwa Rural Banks. Skill Training
As part of the objective of promoting additional sources of income for the farmers, the Nyafoman and the Akooko groups have benefited from the World Cocoa Foundation Alata Soap training support programme. The groups have since the training tried to make the soap for sale. Their only challenge is the difficulty in accessing the potash, especially, during the raining season.
56

Cocoa Research Institute of Ghana Annual Report 2010-2011
Credit Needs & Cash flow analysis
Interaction with the groups revealed that the farmers are in need of some soft loans for their farm maintenance, especially, for weeding as well as payment of their children's school fees. This is due to the fact that the majority of the farmers have more than one farm, all of which need equal attention in terms of maintenance coupled with their ageing problems and high cost of labour. It was clear that access to such loans is virtually non-existent. However, the Bosuso group had managed to secure some farm credit (in cash and in kind) from the Millennium Challenge Account ranging from GH¢500.00 to GH¢2,500 per person. Nevertheless, they complained about high cost of interest which was 28% per annum and some other improprieties on the part of the credit officers. A few of the women in the Akooko and Nkronso benefited from loans from the Savings Club. They could comply with the five monthly repayment schedule since they used the loans to enhance their trade rather than to maintain their farms. The farmers look forward to a farmer friendly loan that could meet their production characteristics.
The results of the cash flow indicates that that cocoa contributes greatly (about 92%) to farmers income (Fig2.4). Household expenditure also takes a chunk of farmers' income (Fig 2.4). Impliedly, although farmers get a lot of money from cocoa farming, very little is invested in the farms' maintenance.
Fig 2.4: Farm & household expenses of Akooko farmers for the year 2010
This calls for efforts to re-orient the minds of farmers towards business- like culture of investment for positive returns. Though on the average, total household expenditure is more than twice the farm expenditure, there was a very high variation in the household expenditure as compared to that of farm expenditure. Cash inflow is high between September and December as a result of sale of cocoa beans (Fig 2.5). Expenditure is also high in January and the last quarter of the year (Fig 2.6). This could be related to the increased farm activity around the last quarter of the year, Christmas festivities and the payment of school fees during those times.
57

Access to fertilizer on creditA total of 118 farmers have paid GH¢52.20 each as part of a 30% commitment fee for six bags of Hi-Tech fertilizer per person to be purchased from COCOBOD.
Cocoa Research Institute of Ghana Annual Report 2010-2011
N=22 N=22
58
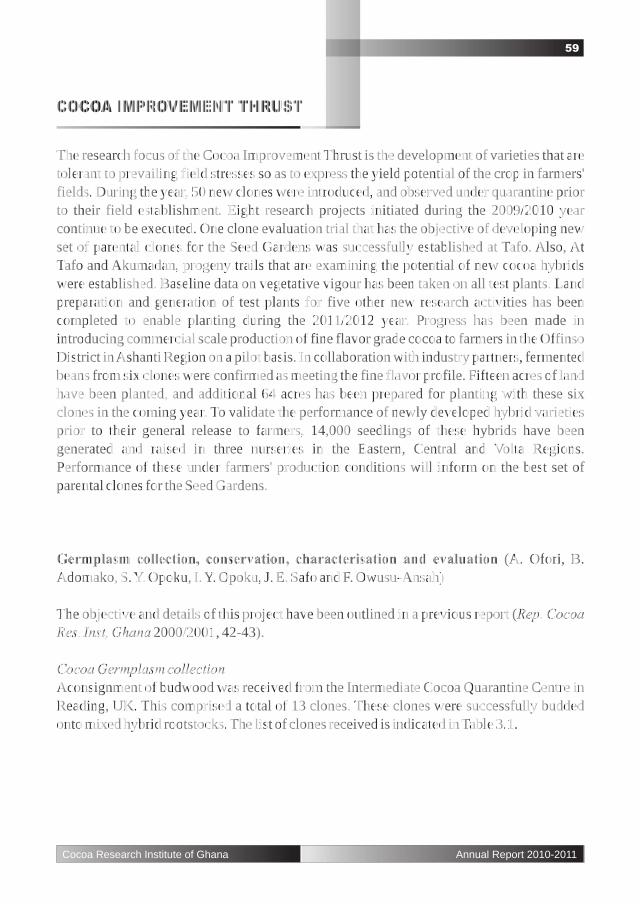
COCOA IMPROVEMENT THRUST
The research focus of the Cocoa Improvement Thrust is the development of varieties that are tolerant to prevailing field stresses so as to express the yield potential of the crop in farmers' fields. During the year, 50 new clones were introduced, and observed under quarantine prior to their field establishment. Eight research projects initiated during the 2009/2010 year continue to be executed. One clone evaluation trial that has the objective of developing new set of parental clones for the Seed Gardens was successfully established at Tafo. Also, At Tafo and Akumadan, progeny trails that are examining the potential of new cocoa hybrids were established. Baseline data on vegetative vigour has been taken on all test plants. Land preparation and generation of test plants for five other new research activities has been completed to enable planting during the 2011/2012 year. Progress has been made in introducing commercial scale production of fine flavor grade cocoa to farmers in the Offinso District in Ashanti Region on a pilot basis. In collaboration with industry partners, fermented beans from six clones were confirmed as meeting the fine flavor profile. Fifteen acres of land have been planted, and additional 64 acres has been prepared for planting with these six clones in the coming year. To validate the performance of newly developed hybrid varieties prior to their general release to farmers, 14,000 seedlings of these hybrids have been generated and raised in three nurseries in the Eastern, Central and Volta Regions. Performance of these under farmers' production conditions will inform on the best set of parental clones for the Seed Gardens.
Germplasm collection, conservation, characterisation and evaluation (A. Ofori, B. Adomako, S. Y. Opoku, I. Y. Opoku, J. E. Safo and F. Owusu-Ansah)
The objective and details of this project have been outlined in a previous report (Rep. Cocoa
Res. Inst, Ghana 2000/2001, 42-43).
Cocoa Germplasm collection
Aconsignment of budwood was received from the Intermediate Cocoa Quarantine Centre in Reading, UK. This comprised a total of 13 clones. These clones were successfully budded onto mixed hybrid rootstocks. The list of clones received is indicated in Table 3.1.
Cocoa Research Institute of Ghana Annual Report 2010-2011
59

Cocoa Research Institute of Ghana Annual Report 2010-2011
Table 3.1: Clones received from the International Cocoa Quarantine Unit at Reading in 2010
Clones
Accession Number
Clones
Accession Number
NA387
RUQ1057
GU227/G
RUQ771
GU249/H
RUQ228
GU114/P
RUG813
GU171
RUQ195
GU183/G
RUQ1543
PA156 (PER)
RUQ1531
NA670
RUQ1238
AM1/8(Pou)
RUQ469
GU207/H
RUQ225
MO109
RUQ1537
PA194 (PER)
RUQ966
NA26
RUQ1230
GU221/H
RUQ226
NA399
RUQ1572
GU123/V
RUQ187
GU123/V
RUQ1068
NA33
RUQ1577
UPA134
RUQ1172
GU136/H
RUQ221
GU147/H RUQ222 GU310/P RUQ815
LCTEEN37/A RUQ148 GU259/C RUQ203 NA756 RUQ468 GU168/H RUQ223 VENC4/11 (FRA)
RUQ1210
GU219/F
RUQ768
GU195/V
RUQ1069
GU255/V
RUQ149 LCTEEN15/5-3
RUQ685
MO4
RUQ1529
ICS60
RUQ959
RB29 (BRA)
RUQ129
NA232
RUQ1504
GU221/C
RUQ2OO
EQX27
RUQ857
GU226/V
RUQ1070
GU125/C
RUQ188
PBC123
RUQ1499
SILECIA5
RUQ1349
GU144/C
RUQ191
PA124 (PER)
RUQ1576
GU255/P
RUQ846
LCTEEN261/5-4
RUQ1452
PA169 (PER)
RUQ1479
GU243/H
RUQ814
NAP25
RUQ1547
CCN51
RUQ1347
LCTEEN127
RUQ69
60

For the germplasm plots at Tafo (D8, L6, Q6, Q6 EXT.4, Q6 EXT.2, Q6 EXT.3A, Q6 EXT.3B, Q6 EXT.3C, M6, M6 EXT, and Q9), the census indicate that 41.5% of the trees are surviving. For the out station plot at Assin Fosu, the surviving rate is about 60% of the original population.
Evaluation of cocoa clones for yield and resistance to black pod and cocoa swollen shoot
virus diseases (F. K. Padi, S. Y. Opoku, M. K. Assuah, O. Domfeh, A. R. Cudjoe and F. Owusu-Ansah)
The objective and details of this project have been outlined in the 2009/2010 report (Rep.
Cocoa Res. Inst, Ghana 2009/2010). Fifty-two clones were developed from the best families in 12 progeny trials. Stem diameter was measured in September 2010 and March 2011. Difference in diameter was used as estimate of vigour. The clones that flowered 9 months after transplanting (March 2011) had significantly higher vigour than those that did not (Fig 3.1).
Cocoa Research Institute of Ghana Annual Report 2010-2011
Figure 3.1: Increase in stem diameter of cocoa clones with or without flower cushions 9 months
after planting
Developing high yielding, disease resistant and drought tolerant cocoa hybrids (F. K. Padi, S. Y. Opoku, M. K. Assuah, O. Domfeh, A. R. Cudjoe and F. Owusu-Ansah)
The objective and details of this project have been outlined in the 2009/2010 report (Rep.
Cocoa Res. Inst, Ghana 2009/2010). The trial was planted at Akumadan and Tafo. At Akumadan, sixty four families were planted, whereas 60 families were planted at Tafo. Stem diameter was measured in September 2010 and March 2011. Difference in diameter was used as estimate of vigour. Ranking for vigour followed a normal distribution at both locations (Fig 3.2). At both locations, POUND 7 x POUND 10 was among the least vigour families whereas PA 7 x C6035/110 and T63/971 x SCA 9.
61
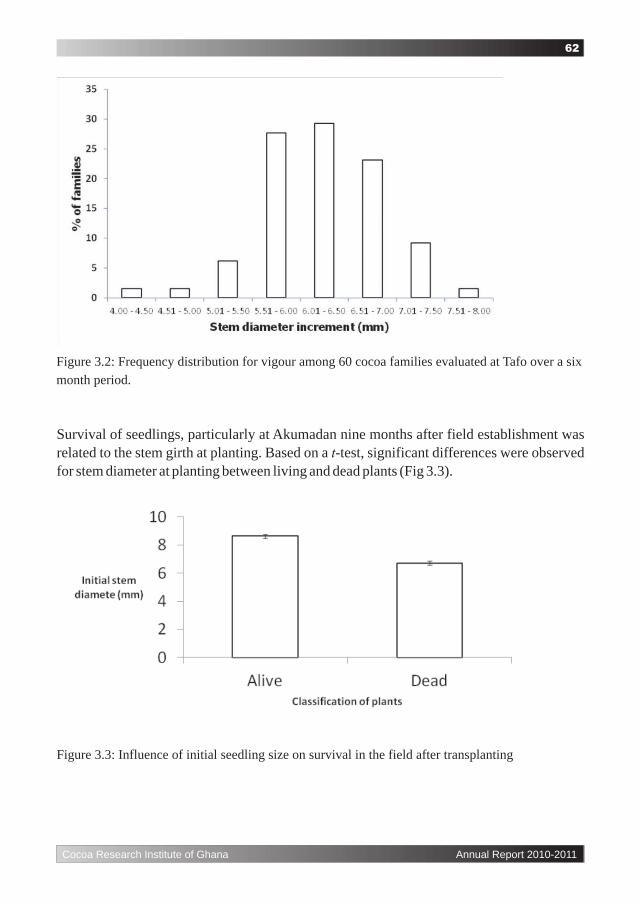
Cocoa Research Institute of Ghana Annual Report 2010-2011
Figure 3.2: Frequency distribution for vigour among 60 cocoa families evaluated at Tafo over a sixmonth period.
Survival of seedlings, particularly at Akumadan nine months after field establishment was related to the stem girth at planting. Based on a t-test, significant differences were observed for stem diameter at planting between living and dead plants (Fig 3.3).
Figure 3.3: Influence of initial seedling size on survival in the field after transplanting
62

Cocoa Research Institute of Ghana Annual Report 2010-2011
Though the initial seedling size appears important, the influence of genotype on survival was evident. Plotting of percent of surviving seedlings against initial girth reveals differential reaction of the families to surviving field establishment stress (Figure 3.4).
Figure 3.4: Relationship between seedling survival among cocoa families and seedling size attransplanting.
Estimation of general combining ability effects showed that there were no effects of male parents on survival. The effects of female parents on survival was significant, with PA 7 displaying the most positive effect on survival and CRG 03 the most negative influence on survival (Figure 3.5).
63
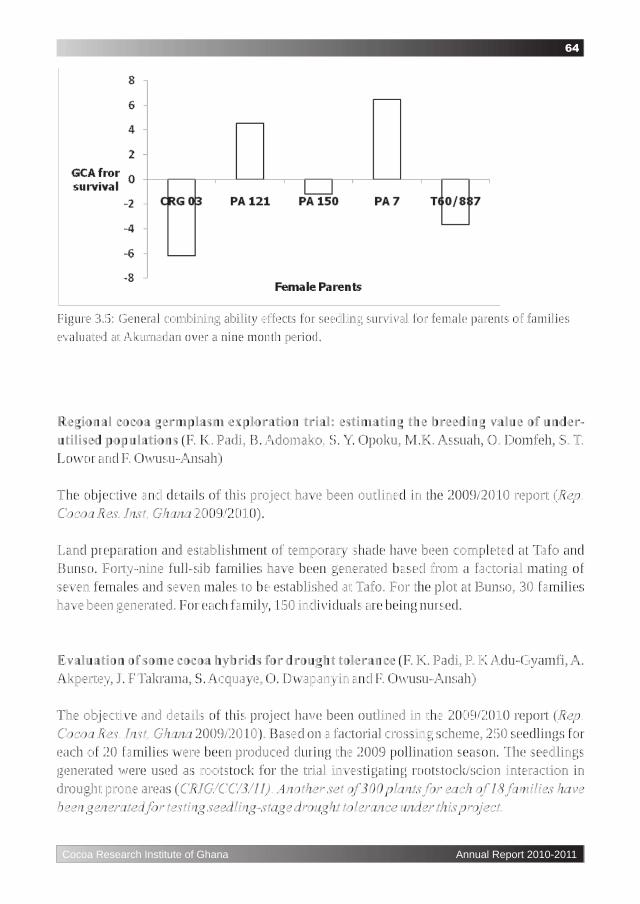
Figure 3.5: General combining ability effects for seedling survival for female parents of familiesevaluated at Akumadan over a nine month period.
Regional cocoa germplasm exploration trial: estimating the breeding value of under-
utilised populations (F. K. Padi, B. Adomako, S. Y. Opoku, M.K. Assuah, O. Domfeh, S. T. Lowor and F. Owusu-Ansah)
The objective and details of this project have been outlined in the 2009/2010 report (Rep.
Cocoa Res. Inst, Ghana 2009/2010).
Land preparation and establishment of temporary shade have been completed at Tafo and Bunso. Forty-nine full-sib families have been generated based from a factorial mating of seven females and seven males to be established at Tafo. For the plot at Bunso, 30 families have been generated. For each family, 150 individuals are being nursed.
Evaluation of some cocoa hybrids for drought tolerance (F. K. Padi, P. K Adu-Gyamfi, A. Akpertey, J. F Takrama, S. Acquaye, O. Dwapanyin and F. Owusu-Ansah)
The objective and details of this project have been outlined in the 2009/2010 report (Rep.
Cocoa Res. Inst, Ghana 2009/2010). Based on a factorial crossing scheme, 250 seedlings for each of 20 families were been produced during the 2009 pollination season. The seedlings generated were used as rootstock for the trial investigating rootstock/scion interaction in drought prone areas (CRIG/CC/3/11). Another set of 300 plants for each of 18 families have
been generated for testing seedling-stage drought tolerance under this project.
Cocoa Research Institute of Ghana Annual Report 2010-2011
64

Cocoa Research Institute of Ghana Annual Report 2010-2011
Evaluation of rootstock genotype effect on cocoa establishment and yield in drought
prone areas (F. K. Padi, P.K Adu-Gyamfi, A. Akpertey, J. F Takrama, S. Acquaye, O. Dwapanyin and F. Owusu-Ansah)
The objective and details of this project have been outlined in the 2009/2010 report (Rep.
Cocoa Res. Inst, Ghana 2009/2010). Land preparation for this trial has been completed at Afosu. For each of the 18 families being tested at rootstocks, three scion genotypes have been budded. The numbers of plants successfully generated for each rootstock-scion combination is indicated in Table 3.1.
Table 3.2: The number of cocoa plants successfully generated for a selection of rootstock:scion combinations
SCION
ROOTSTOCK
Pa 150
EET 59H
ICS 43
IMC 53 X PA 188
44
-
51
IMC 53 X SCA 12
53
65
56
IMC 53 X IMC 76
49
48
39
IMC 53 X POUND 10
49
55
-
NA 242 X IMC 76
42
50
23
NA 242 X PA 188
38
60
50
NA 242 X SCA 12
65
54
64
NA 79 X PA 188
50
60
57
PA 107 X IMC 76
49
63
41
PA 107 X PA 188 47 54 45 PA 107 X POUND 10
60
50
58
PA 107 X SCA 12
59
54
41
SCA 6 X POUND 10
41
52
53
SCA 6 X SCA 12
46
59
50
SCA 9 X IMC
76
61
54
50
SCA 9 X POUND 10
57
53
54
SCA 9 X SCA 12
56
54
48
T60/887 X POUND 10
23
56
54
T60/887 X POUND 15
36
45
37
T60/887 X POUND 7
40
43
-
65

Cocoa Research Institute of Ghana Annual Report 2010-2011
Evaluation of some genetic characteristics of selected Guiana cocoa clones (A. Ofori, B. Adomako, F. K. Padi, J. F. Takrama, G. J. Anim-Kwapong, O. Domfeh, M.K. Assuah, R. Adu-Acheampong and F. Owusu-Ansah)
The objective and details of this project have been outlined in the 2009/2010 report (Rep.
Cocoa Res. Inst, Ghana 2009/2010). The trial is located at Afosu and Tafo. So far, land preparation at both locations has been completed. Temporary shade using plantain has also been established.
Participatory Development of Improved Cocoa Varieties and Expansion of Production
Capacity of the existing Seed Gardens for Supply of Planting Materials to Farmers:
Cocoa Sector Support Programme (CSSP) II (S. Y Opoku, F. K Padi and B. Adomako)
The objective and details of this project have been outlined in the 2009/2010 report (Rep.
Cocoa Res. Inst, Ghana 2009/2010). In addition to the ten farms established in each of the Western, Brong Ahafo and Ashanti Regions during the previous year, the project was extended to farmers in three additional Regions. Data collection on the previously esablished plots have been initiated. The new Regions include the Central, Eastern and Volta Regions. Land prepration for each of the one acre of farmers' plots have been completed and temporary shade has bee established. In each region, a nursery has been established and for this year the three nurseries have collectively 14,080 seedlings.
Enhancing Farmers' Livelihood through production of Fine Flavour Cocoa (S. Y Opoku, F. K Padi and B. Adomako)
The objective and details of this project have been outlined in the 2009/2010 report (Rep.
Cocoa Res. Inst, Ghana 2009/2010). The project activities are located in the Offinso Distrct of the Ashanti Region. A total of 12,000 plants of six clones have been generated for planting this year. The six clones include CC 11, VENC 4, SGU 50, ICS 16, ICS 60, PLAYA ALTA. These were previously confirmed to have fermented beans meeting the fine flavour profile by industry parners. To increase the number of clones, dry fermented beans of 15 additional clones were prepared and sent to Hershey, USA for profiling.A total of 64 acres of farm sites have been selected at Offinso, and land preparation is underway. These will be planted next year.
To assist farmers with the techniques involved in the use of cloes as planting material, a manual on the use of clones is at an advanced stage of drafting.
66

COCOA INSECTS MANAGEMENT THRUST
Insect pests and their natural enemies remained important biological factors in sustaining cocoa production. The thrust continued with short and long term research activities directed at cocoa insects with special reference to understanding their biology, their population dynamics, and determining the efficacy of both conventional and natural products to control them. Search for alternatives to currently recommended insecticides for use on cocoa was pursued with the screening of fifteen (15) insecticide formulations at laboratory and cage stages. Another six (60 products were undergoing screening at small scale and three products at large scale researcher and farmer managed trials. Six (6) products were undergoing residue and taint trials and analysis. The tested formulation showed potentials for controlling mirids on cocoa. The search for a stable botanical product to replace neem seed extract to control mirids on organic farms, led to the screening of a formulated product, Pyrethrum 5 EW. The product showed good attributes for its consideration for use on cocoa. Stem borer, as an emerging insect pest of cocoa, was studied further to understand its biology in order to develop an integrated pest management strategy (IPM) strategy for its control. Hercules 50SC was screened on termites to replace Dursban which contained Chlopyrifos, a molecule banned on cocoa due to high residues. The insect problems on young cocoa was investigated further in order to identify the pests status of such insects and develop control measures for them. At all locations the known mirid species, termites, stem borers and attendant ants of mealybugs were dorminant. The thrus's major challenge was the urgent need to solve the pesticide residue problems in dry cocoa beans reported from Japan. Safer alternatives for residue free cocoa was imperative.
Integrated pest management programme in the cocoa industry in Ghana:
i. The use of pheromones and other semio-chemicalsii. The use of natural enemies
(A.R. Cudjoe, R. Adu- Acheampong, G. K. Awudzi, J. E. Sarfo, F. Aneani and M. Asamoah)
This objectives and details of this trial was reported in the 2008/2009 report (Rep. Cocoa Res.
Inst., Ghana, 2008/09, 76 - 80)
Work on mirid pheromone was an on-going PhD study which was to be presented later by the fellow. Under the use of natural enemies, work on the search for myco-insecticides for mirid control was carried out. Dead insects from cocoa farms were sampled. Collected insect samples were surface sterilized with 5% sodium hypochlorite and 75% ethanol solution. Cadavers were incubated on moistened
Cocoa Research Institute of Ghana Annual Report 2010-2011
67

sterile filter paper in Petri dishes and observed for growth of fungal pathogens. Growths originating from specimens were sub-cultured and further incubated for sporulation on Potato Dextrose Agar. Identification of fungal isolate was done using the manual on Pathogenic Fungi and Bacteria developed by the International Mycological Institute (IMI). Cultures of Beauveria bassiana were raised and conidia suspensions of different concentrations were prepared for bio-efficacy test. Insects treated with 1,000 and 2,000 spore concentrations died within 6 days with 50% re-isolation of fungus used for the inoculation one week after death of insect. Insects inoculated with spore concentrations of 3,000 spores/ml and 4,000 spore/ml died within 4 days with 70% re-isolation of fungus used for treatment 3 days after death of insect. Fungus re-isolated from all the concentrations used was identified as Beauveria bassiana. Cadavers without growth one week after treatment and two weeks after incubation were discarded. There was the need to confirm the entomopathogenicity of the isolate and produce quantities that could be used for small field work.
Screening and field trials on Conventional Insecticides for the control of cocoa mirids. (A.R. Cudjoe, R. Adu- Acheampong, E. A. Dwomoh, F. Aneani and M. Asamoah)The objective of this study was reported (Rep. Cocoa Res. Inst., Ghana, 2008/09, 80-84)Laboratory bio-assay and cage tests were conducted on fifteen (15) insecticide formulations. Small scale researcher-farmer trials were also conducted on seven insecticide products in Eastern, Central and Ashanti Regions (Reagent 50Sc, Sunpyram, Lambda Aceta, Bifenthrin 80W, XDE, Imida- bifenthrin and Attack). Large scale trials were also carried out for two products (Imida-bifenthrin and Attack). Residue and Taint analyses were done for six products (Seizer 100EC, EC 900, Callifan Super, Attack, Hercules 50SC and XDE 208SC). The 15 formulations tested in the laboratory differed in the LD LD values (Table 4.1). 50 and 95
When the insecticides were applied in semi-field 'cage' spray tests (at their respective LD 95
rates or lower), they were all found to be biologically active and, therefore, they were recommended for testing in small-scale field trials in 2011/2012 (Table 4.1).
Cocoa Research Institute of Ghana Annual Report 2010-2011
68

Cocoa Research Institute of Ghana Annual Report 2010-2011
Table 4.1a: Efficacy of different insecticides on mixed populations of S. Singularis at 24 hours afterapplication in laboratory and cage bio-assay.
Insecticide
Active ingredient of formulation
LD50
LD95
Akakil 200 SL
Aryna 80EC
Buffalo 40EW
BYI 02960
Cobra Super 45EC
Conka 2.5 EC
Cypermethrin
Deltamethrin
D-Lion 1.5% EF 300 [5.4, 4.5, 3.7,
3.5%] Lambda Aceta Lambda cyhalothrin 5.1EC
Normax 150 SC Thiacloprid 480SC
Viktory
Imidacloprid 200g/L
Acetamiprid 20g/L + Indoxacarb 60g/L
Acetamiprid 40g/L
Imino-bulenolide & propylene carbonate 200g/L
Acetamiprid 20g/L + Spinetoram 25g/L
Bifenthrin 2.5g/L Cypermethrin 10.1g/L Deltamethrin 25.5g/L Neem oil 15g/L Rosemary, Sesame, Peppermint, Thyme, Cinn’on
ë-
Cyhalothrin 15g/L + Acetamiprid 20g/L
ë-
Cyhalothrin 5.1g/L
á-
Cypermethrin 75g/L + Teflubenzuron 75g/L
Thiacloprid 480g/L
Thiamethoxam 100g/L + Deltamethrin 50g/L
0.0830
0.0933
0.0063
0.2377
0.1209
0.0001
0.0043
0.00001
0.0062 0.4420 0.0483 0.0047 0.0313 0.3424
0.4183
4.5870
0.7726
0.0327
0.9157
1.6471
0.0005
0.1067
0.4879
0.0849 3.2390 0.3524 0.0365 0.7146 1.2634
1.1821
69

Cocoa Research Institute of Ghana Annual Report 2010-2011
Table 4.2a Pesticides undergoing first year small scale screening
Test insecticides
Regent 50SC (Fipronil 50g /l)
Sunpyram (Nitenpyrum 500g/kg
Lambda Aceta (Lambda-cyhalothrin 30.2g/l
+ Acetamiprid 6g/l
Actara (Thiamethoxam 240g/l)
Bifenthrin 80W (Bifenthrin 80g/l
Untreated control
Mean percent population reduction
(Mean±
SE)
88.96 ± 4.5
99.5 ± 0.4
94.8 ± 0.9
98.9 ± 1.1
94.2 ± 1.8
-24.4
± 6.4
Mean No. of fresh damaged trees
7
5
11
4
4
22
Seasonal cumulative number of mirids
104
24
137
48
57
335
Table 4.2b: Insecticides undergoing second year small scale trials
Test Insecticides
XDE
(Sulfoxaflor 208SC) Imida bifenthrin
(Imidacloprid
250g/l + Bifenthrin 50g/l
Attack
(Emamectin Benzoate 50g/l
Mean percent population reduction (Mean± SE)
95.6
±
1.30
99
±
1.0
97.3
±
0.2
Mean No of fresh damaged trees
4 5 8
Seasonal cumulative number of mirids
71
69
145
70

Cocoa Research Institute of Ghana Annual Report 2010-2011
Satisfactory control (population reduction) was achieved with Sunpyram, Lambda Aceta, and Bifenthrin during the first year trials. The mirid population recovery (seasonal cumulative numbers) was unusually higher on the Lambda Aceta treated plots (Table 4.2a). The three insecticides screened in the second year were also effective against cocoa mirids with Imida bifenthrin being marginally effective than the other two (Table 4.2b). In large-scale researcher-farmer-managed trials, the average bean yield on the Imida bifenthrin and Attack plots were yielding 745.8 and 507.6kg/ha, respectively. Corresponding yields on the standard insecticides, Akatemaster and Confidor 200SL were 736.6 and 579.6, respectively. The proportion of users that had skin irritation after using Imida bifenthrin, Attack, Akatemaster and Confidor 200SL was 23, 20, 40 and 0%, respectively. Insecticides that were analyzed for residue and taint are summarized in Table 4.3.
Table 4.3: Insecticides undergoing residue and taint tests
Insecticides
Active ingredient
Seizer 100EC
Bifenthrin 100g/l
EC 900 (Miricon EC)
Deltamethrin and Pyrethrum
Callifan Super
Acetamiprid 100g/l +Bifenthrin 100g/l
Attack Emamectin benzoate Hercules 50SC Fipronil 50SC for termites control XDE 208SC
Sulfoxaflor 240g/l
In conclusion, the search for alternative insecticides for control of cocoa insect pests continued unabated. More new molecules were submitted for screening and hopefully, environmentally friendly products would be made available for cocoa.
Screening and use of botanical pesticides for the control of cocoa mirids and other
insects (A. R. Cudjoe, R. Adu- Acheampong, F. B. Antwi, G.K. Awudzi, F. Aneani and M. Asamoah)
The aim of this project was to identify insecticides of plant origin which are environmentally safer for the control of mirids and other insects within the context of an Integrated Pest Management (IPM) strategy. Four field rates- 0.33L/ha, 0.44L/ha, 0.55L/ha and 0.66L/ha of Pyrethrum 5EW was tested in a small scale field trials. Two applications of Pyrethrum 5 EW were made in August and September 2010 on 0.4 ha (one acre) plots of mature cocoa in 9 locations in the Suhum Kraboa-Coaltar District of the Eastern Region. In the field the efficacy of Pyrethrum 5EW (the rates tested) fell below the acceptable level of control (i.e. ≥ 95% population reduction) for suitable miridicides.
71

In conclusion, the seasonal cumulative numbers indicated shorter persistence of Pyrethrum compared with approved conventional insecticides. This product, targeted at controlling mirids in organic cocoa farms showed potential for replacing neem seed extract which was the only recommended organic insecticide for controlling cocoa mirids.
Development of an Integrated Pest Management (IPM) strategy for stem borer control
on cocoa by chemical and non-chemical methods (R. Adu- Acheampong, S. Lowor, J.E. Sarfo, M. Asamoah, F. Aneani and G. Ameyaw Akumfi)
Aim of the project was to develop an Integrated Pest Management (IPM) strategy for stem borer control on cocoa by chemical and non-chemical methods. Visual assessment of fresh borer holes and field trapping of adults were carried out. Trapped adult female borers were dissected and ovipositor extracts were collected and maintained at 4°C .Samples of collected insects were maintained in ventilated vials for emergence of parasitoids and humidified Petri dishes for sporulation of entomopathogens. Observations on sexual attraction and copulatory behaviour of the pest were also carried out. Eulophonotus myrmeleon was present on cocoa throughout the year. Occurrence of E. myrmeleon did not follow any particular pattern between Kwadaso and Tafo. There was decline in numbers in July and December at Kwadaso but a single decline at Tafo in October-November. No natural enemies were found, although occasionally, ants including Oecophylla longinoda have been seen pulling dead larvae into their nests. The insect did not thrive on other plants. Female moths were again found to attract males. No natural enemies have been found yet, although occasionally, ants including Oecophylla longinoda have been seen pulling dead larvae into their nests. The insect did not thrive on other plants. Female moths were again found to attract males. In conclusion, the studies added vital information to understanding the biology of the stem borer to contribute to its eventual control.
Cocoa Research Institute of Ghana Annual Report 2010-2011
Table 4.5: Efficacy of Pyrethrum 5EW on mixed populations of S. Singularis at 24 hours afterapplication
Field rates
0.33L/ha
0.44L/ha
0.55L/ha
0.66L/ha
Mean Percent population reduction (MEAN ± SE)
75.4 ± 14.4
75.6 ± 14.1
74.4 ± 21.8 66.6
± 20.8
Mean no. of fresh damaged trees
5.0 4.8 3.5 4.7
Seasonal cumulative no. of mirids
18
17
23
29
72

Assessing insect species associated with cocoa during establishment and developing
control methods against pest species (A. R. Cudjoe, G. K. Awudzi, M. Assuah, V. Anchirina, F. Owusu-Ansah, M. Asamoah and P. Adu Yeboah)
The objective of the study was to identify insect species associated with cocoa at the establishment stage and determine their pest status for control. Monthly assessment of insects continued on the plots that have been selected at Apregya 1 and 2, Adadekrom 1 and 2, Nkyesa, Minta Bomeng, Praso-Kuma, Wisiwisi and Tafo. At each location 30 randomly selected plants were inspected for insect species. Trained data collectors identified insects in
situ. They were separated into pest species, ants and Natural enemies. The accumulated numbers of insect species encountered were presented for each location. The relative abundance of species encountered was used as an indicator of its importance in the cocoa eco-system. Mirid damage was recorded over the period at all locations. The main insects encountered on young cocoa were grasshoppers, mealybugs, termites, mirids, stink bugs (Bathycoelia), stem borers, psyllids, defoliators such as Anomis spp. and Earias spp. The three important ant species, which attend mealybugs and aphids, Crematogaster
striatula/africana, Camponotus acvapimensis and Pheidole megacephala were recorded at all locations.
Cocoa Research Institute of Ghana Annual Report 2010-2011
Table 4.6: Temporal distributions of E. myrmeleon larvae on a 3-ha mature cocoa plantation atKwadaso, Ashanti Region.
Monthly counts per 0.4 ha
May 2010
July
August
September
October
November
December
February 2011
March
Larvae Adult Larvae Adult Larvae Adult Larvae Adult Larvae Adult Larvae Adult Larvae Adult Larvae Adult Larvae Adult 32
11
21
6
62
7
81
2
100
1
84
2
59
5
150
4
119
3
Fig 4.7: Mirid damage on young cocoa from different location
73

Cocoa Research Institute of Ghana Annual Report 2010-2011
Fig. 4.8: Mealybug populations on young cocoa from different locations
Fig 4.9: Attendant ant populations on young cocoa at different locations
74
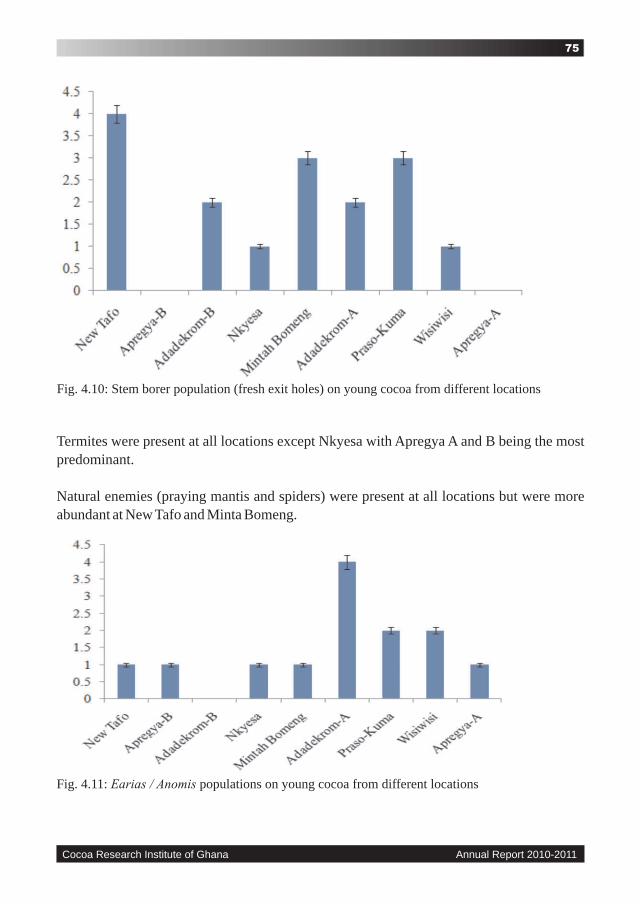
Cocoa Research Institute of Ghana Annual Report 2010-2011
Fig. 4.10: Stem borer population (fresh exit holes) on young cocoa from different locations
Termites were present at all locations except Nkyesa with Apregya A and B being the most predominant.
Natural enemies (praying mantis and spiders) were present at all locations but were more abundant at New Tafo and Minta Bomeng.
Fig. 4.11: Earias / Anomis populations on young cocoa from different locations
75

Cocoa Research Institute of Ghana Annual Report 2010-2011
Fig. 4.12: Termite presence on young cocoa from different locations
Fig. 4.13: Attendant ant species
76

In conclusion the insect species associated with young cocoa documented, are diverse and location specific for most species. The project will now focus on the development of pest management strategies that is environmentally friendly, species and location specific.
Studies on termites (Isoptera) associated with cocoa ecosystem (A. R. Cudjoe, J. E. Sarfo, A. A. Afrifa, I. Y. Opoku and J. F. Takramah)The objective of the study was to develop effective methods for termite control as a replacement for the use of products containing Chlorpyrifos which was banned for use on cocoa. Testing of the product, Hercules 50SC, at Afosu Plot D 12 continued. Monthly and Bi-monthly treatment regimes with cocoa plants tagged. Fifteen (15) trees per plot spaced at 3m x 3m covering 72 metre square. Hercules at 0.01g a.i. /tree and 200ml of solution applied per tagged tree. Water was used as control. Termite damage was recorded based on presence of bites, hollowness, runways found on cocoa plants. Death of plants was recorded. Non target insects were also assessed. The results showed that Hercules (Fipronil) had a protective capability against termites in both regimes i.e. monthly and bi-monthly application (Tables 4.14a & b)
Cocoa Research Institute of Ghana Annual Report 2010-2011
Tables 4.14a: Termites activity following the application of Hercules
Treatments
No. of trees with termite activities after Hercules treatment
Bites
Termite Runways
Hollow
Wilt
Death
Monthly 1 1 0 20 3 Bi-monthly 0 0 1 12 3
Control
1
6
19
15
26
Tables 4.14 b: Termite activity following the application of Hercules 50SC
Treatment
No. of trees with non-target insects after Hercules 50SC
treatment
Mealybugs
Aphids
Psyllids
Beetles Mirids
Caterpillars
Monthly 32 28 144 159 3 24
Bi-monthly 33 31 154 134 0 25
Control 27
15
140
273
1
20
In conclusion, the results showed that Hercules (Fipronil) had a protective capability against
termites in both treatment regime i.e. monthly and bi-monthly (Tables 4.14a & b). It showed potential as alternative to Dursban and other Chlorpyrifos based products banned on cocoa.
77

COCOA SWOLLEN SHOOT VIRUS THRUST
There was a worrying increase in the number of CSSV infections on CRIG plots in the year under review. The diseased trees were 101.1 % higher than what was recorded in the previous year (2009/2010). The number of trees coppiced also rose by an alarming 126.2 %. Plant Breeding plots were the most affected and this is a worrying situation. For the studies on the effect of mild strains on growth and yield of cocoa, N1 inoculated plants again and consistently had slightly bigger stems than the healthy control, and the highest growth was recorded for T85/799XT79/501. The main effect of strain on pod yield was statistically significant, and the N1 and SS365B treated trees out-yielded the healthy control. T85/799 x Pa7/808 and T85/799 x T79/501 have so far been consistent in being the highest in growth and yield in the presence of mild and severe CSSV and these could therefore be good candidates in cross-protection programmes. On the evaluation of mild strain symptom expressions and effect on growth, the type of cocoa variety grown affected yield significantly. Amazon-Amazon hybrid had the highest yield while Amelonado had the lowest. The outcome of the post sensitisation studies carried out to evaluate the impact of the awareness creation workshops, radio programmes and field visits for farmers on the threat posed by CSSV disease generally indicated a well-received programme by farmers, extension agents and other stakeholders.
The general consensus was that programme was well-conceived, planned and executed. On the basis of the outcome of the evaluation study the following recommendations are offered:
?Land tenure security in Ghana is one of the underlying social issues that could undermine efforts to effectively control CSSVD and hence must be brought to the fore, discussed and addressed.
?The sensitisation programme needs scaling up to other endemic areas in Ghana to ensure total containment of the disease.
?Extension officers and CSSVD spotters are vital players in the management of the disease. They have expressed some concerns including the provision of certain logistics and other motivational packages that needs to be addressed as matter of priority.
?Some platform should be created for sharing the outcome of the evaluation exercise so that all stakeholders become aware of them.
Cocoa Research Institute of Ghana Annual Report 2010-2011
78
Swollen shoot disease control at CRIG (H. Dzahini-Obiatey and G. A. Ameyaw)
The experimental detail of the above trial was presented in the 2009/2010 Annual Report (Rep. Cocoa Res. Inst. Ghana, 2009/2010).
The routine monthly inspections and treatment of swollen shoot disease were carried out for the year under review. As usual, the diseased trees found in outbreaks were completely removed while the adjoining apparently healthy trees were coppiced to the second or third row depending on the number of visible infections found. The worrying observation for the year under review is that the number of diseased cocoa trees removed has not only increased but has more than doubled i.e. 101.1% higher than the previous year (2009/2010). The story for the coppiced trees was not different either, the number was 126.2% higher than the previous year (2009/2010). The contribution of experimental plots as compared to the non-experimental plots to this statistics is even more staggering. The diseased trees removed from experimental increased by 132.4% while the coppiced trees from them increased by 185.2% over the previous year (2009/2010). The total number of plots with infection also increased from 35 to 38. Plot N17, an experimental plot belonging to Plant Breeding had the highest number of diseased trees removed i.e. 16.3 % of the total number trees removed. Plant Breeding plots were also the worst affected by the disease i.e. 67 % of all the diseased trees removed were from Plant Breeding plots. Overall, it seems CSSV control at CRIG is getting out of hand due partly to staff depletion of the control gang of the Plant Pathology Division. This worrying observation suggests the piece meal control, which is currently being implemented at CRIG may not be beneficial to contain the spread of the disease. The need to replenish staff of the control gang is strongly recommended as well as more drastic removal of infected trees from both experimental and non-experimental plots.
Cocoa Research Institute of Ghana Annual Report 2010-2011
79

Cocoa Research Institute of Ghana Annual Report 2010-2011
Table1: Number of CSSV diseased trees removed and coppiced from CRIG plots(2010/2011)
Plot No.
No. trees removed
No. of trees coppiced
Remarks
R2
12
6
Q6 Ext 3A
1
-
Q6 EXT. 4
15
10
Q6
68
8
Worst area Old Station
Q11
8
-
V4 4 8
G7 10 17
G8 35 32 B13
6
10
C6
16
8
D8
63
-
D17A
26
44
D17B
26
30
D18A
28
24
F12
1
3
G Annex 1&2
2
6
G11
33
21
H17
19
25
H24
1
5
H25
1
3
H26
13
-
J8A
13
23
J8B
7
18
80

The effect of CSSV mild strains on growth and yield of cocoa (O. Domfeh, H. Dzahini-Obiatey, G. A. Ameyaw, and E. Anochie).
The aims and objectives of this trial were clearly stated (Rep. Cocoa Res. Inst., Ghana, 1997/98, 110). Similar to what was reported last year (Rep. Cocoa Res. Inst., Ghana, 2009/2010), the main effects of strain and variety on stem circumference (growth) were significant (p<0.001). However, the effect of each mild strain on growth was not significantly different from that of the healthy control. The N1 inoculated plants had slightly bigger stems than that of the healthy control. This trend has been consistent for some years now. However, when combined with severe 1A, growth was significantly lower than that of the healthy control. The highest growth was recorded in the variety T85/799 x T79/501, while Amelonado recorded the lowest growth (Table 5.1). There was no interaction between strain and variety on growth.
Cocoa Research Institute of Ghana Annual Report 2010-2011
J9
A
20
31
J9
B
2
5
J9
C
27
-
K5
95
75
K5 Ext
13
19
K602
103
106
K7
51
66
L6
1
2
M5
27
20
N17
153
-
Worst area (square mile)
N18
A 8 21
N19 8 22
N22 2 2 T2
23
7
Grand total
941
677
81

The main effect of strain on pod yield (kg/ha) was significant (p=0.019). N1 and SS365B treated trees significantly out-yielded the healthy control. SS365B + 1A treatment also significantly out-yielded the control for the first time. The yield of N1 + 1A treatment was not significantly different from that of the control.
The main effect of variety on pod yield (kg/ha) was significant (p=0.05). The varieties T85/799 x Pa7/808 and T85/799 x T79/501 were the highest yielding, while the remaining ones recorded relatively lower yields, with T85/799 x T65/326 being the lowest for the second consecutive year (Table 5.2). There was no interaction between strain and variety on pod yield.
The results suggest that CSSV mild strains N1 and SS365B do not cause reduction in growth and yield of cocoa. T85/799 x Pa7/808 and T85/799 x T79/501 have so far been consistent in being the highest in growth and yield in the presence of mild and severe CSSV and these could therefore be good candidates in cross-protection programmes.
Cocoa Research Institute of Ghana Annual Report 2010-2011
Table 5.1: Effect of CSSV strains on stem circumference (mm) in six cocoa progenies on plot A23for the year 2010/2011.
Variety
Strain
Healthy
N1
N1 + 1A
SS365B
SS365B + 1A
Variety mean
Amel
305.5
354.9
319.3
310.1
273.1
312.6
T79/467 x T87/1312 368.2 370.6 290.0 375.4 351.3 351.1
T85/799 x Amel 346.8 354.0 353.4 316.4 314.9 337.1
T85/799 x Pa7/808 386.7 391.7 319.3 394.0 320.3 362.4 T85/799 x T65/326
359.1
358.9
318.2
323.9
298.4
331.7
T85/799 x T79/501
392.7
365.2
324.7
363.3
352.8
359.7
Strain mean
359.8
365.9
320.8
347.2
318.5
LSD (Variety) = 22.050.05
LSD (Strain) = 20.130.05
82

Table 5.2: Effect of CSSV strains on yield (kg/ha) in six cocoa progenies on plot A23 for the year2010/2011.
Variety
Strain
Healthy
N1
N1 + 1A
SS365B
SS365B + 1A
Variety
mean
Amel
133
364
266
593
163
304
T79/467 x T87/1312
114
363
185
590
557
362
T85/799 x Amel 284 472 308 287 517 374
T85/799 x Pa7/808 616 790 286 703 351 549
T85/799 x T65/326
160
314
205
298
328
261
T85/799 x T79/501
351
743
304
544
531
495
Strain mean
277508
259502408
LSD (Variety) = 206.50.05
LSD (Strain) = 188.50.05
Evaluation of mild strain protection of cocoa seedlings exposed to natural spread of
CSSV severe 1A (O. Domfeh, H. Dzahini-Obiatey, G. A. Ameyaw, and E. Anochie).
The aims and objectives of this trial were clearly stated (Rep. Cocoa Res. Inst., Ghana, 1995/96, 158-161). For the year under review, the type of cocoa variety grown significantly (P=0.003) affected the expression of CSSV symptoms. The number of trees with severe CSSV symptoms was highest in Amelonado and lowest in Amazon x Amelonado for the second consecutive year (Fig. 5.1). Even though more unprotected (healthy control) and N1-protected trees showed severe CSSV symptoms than SS365B protected plants, the difference was not significant (P = 0.299).
The type of cocoa variety grown affected yield significantly (P=0.015). Amazon-Amazon hybrid had the highest yield while Amelonado had the lowest (Fig. 5.1). Even though the effect of strain on yield was not significant, both N1 and SS365B protected plants yielded more than the unprotected control plants (Fig. 5.2).As reported in the previous year (Rep. Cocoa Res. Inst., Ghana, 2009/2010), cross-protection of the cocoa trees by N1 and SS365B against the adverse effects of CSSV 1A could not be firmly established. Amelonado, as expected, is confirmed by the results as being very susceptible to the swollen shoot virus.
Cocoa Research Institute of Ghana Annual Report 2010-2011
83

Fig. 5.1: Reaction of CSSV mild strains N1 and SS365B protected plants to natural spread of CSSV1A in three cocoa progenies for the year 2010/2011.
Fig.5.2: Effect of mild strain cross-protection on yield (kg/ha) in three cocoa progenies for the year2010/2011.
Cocoa Research Institute of Ghana Annual Report 2010-2011
84

Field assessment of the protective capability of mild strain SS365B against CSSV
severe 1A (plot a 20) (H. Dzahini-Obiatey, O. Domfeh, G. A. Ameyaw, and E. Anochie).
The aims and objectives of this trial were clearly stated (Rep. Cocoa Res. Inst., Ghana, 1993/94,117-118). Strain and variety did not significantly affect the spread of swollen shoot virus (Table 5.3). Yield was also not significantly affected by both strain and variety (Table 5.3). This unusual observation could be due to challenges with accurate recording of CSSV SS365B symptoms. This is because the trees have grown very tall and it is now difficult to distinguish between symptoms of CSSV 1A and those of SS365B. The trial will be coppiced this year.
Table 5.3: Effect of strain and variety on CSSV spread (number of trees showing symptoms of CSSV1A or SS365B) and cocoa yield (kg/ha) for the year 2010/2011.
Treatment
Spread (trees with severe symptoms)
Yield (kg/ha)
Strain
1A + Healthy
16.2
282
1A + SS365B
14.3
393
1A + SS365B + Healthy
12.4
290
Healthy
16.7
248
SS365B + Healthy
13.5
294
Variety T63/967 x T65/326
14.7
266
T85/99 x Amel
14.3
335
T85/799 x T79/501
14.9
304
Sign. level
ns
ns
cv%
s.e
16.40
2.39
23.60
71.00
Cocoa Research Institute of Ghana Annual Report 2010-2011
85

Cocoa Research Institute of Ghana Annual Report 2010-2011
Determination of the optimum number of rows of mild strain N1-inoculated cocoa trees
required for the control of CSSV severe 1A (plot a24) (O. Domfeh, G. A. Ameyaw, J. E. Sarfo, J. Yeboah, M. K. Assuah, S. Acquaye and F. Owusu-Ansah).
The aims and objectives of this trial were clearly stated (Rep. Cocoa Res. Inst., Ghana, 2006/2007, 118). As was reported last year (Rep. Cocoa Res. Inst., Ghana, 2009/2010) there were no significant differences in stem circumference and yield among the treatments during the year under review (Table 5.4). Table 5.5 also shows the spread pattern of CSSV severe 1A so far.
Table 5.4: Effect of inoculating different numbers of rows of cocoa with N1 on stem circumferenceand yield for the year 2010/2011.
Treatments
Circumference (mm)
Yield (Kg/ha)
All rows a fter source plants inoculated with N1 (T4)
254.8
633
First five outer rows after the source plants inoculated with N1 (T1)
249.3
436
First three outer rows after the source plants inoculated with N1 (T2)
241.8 492
No mild strain –
No plant inoculated wi th mild strain after source plants –
T3
229.3
506
Sig. level ns nscv % 4.20 21.90s.e 10.31 113.10
N.B. Source plants – two outermost rows of each treatment inoculated with CSSV 1A.
86
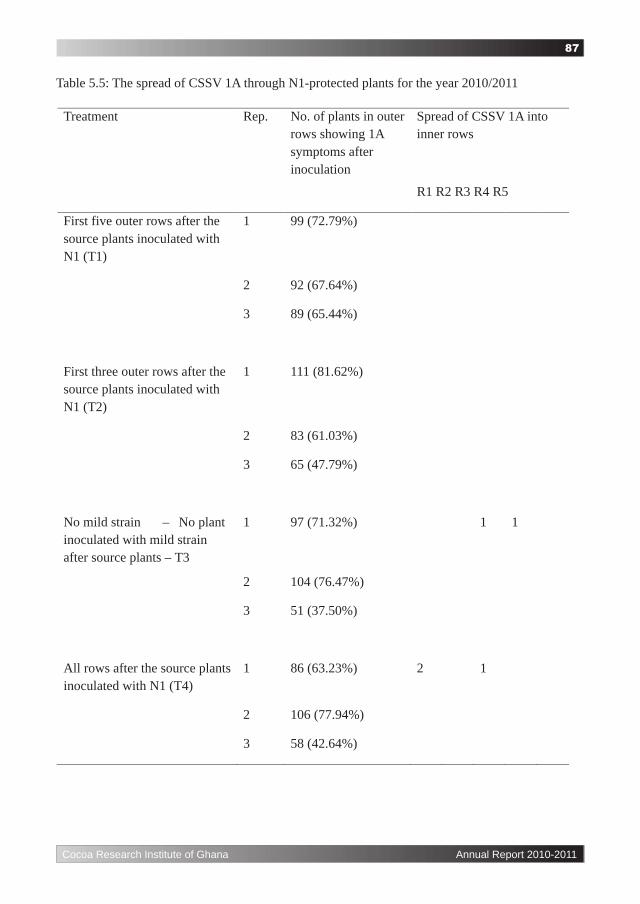
Table 5.5: The spread of CSSV 1A through N1-protected plants for the year 2010/2011
Treatment
Rep.
No. of plants in outer
rows showing 1A symptoms after inoculation
Spread of CSSV 1A into inner rows
R1
R2
R3
R4
R5
First five outer rows after the source plants inoculated with N1 (T1)
1
99 (72.79%)
2
92 (67.64%)
3
89 (65.44%)
First three outer rows after the source plants inoculated with N1 (T2)
1
111 (81.62%)
2 83 (61.03%)
3 65 (47.79%)
No mild strain –
No plant
inoculated with mild strain after source plants –
T3
1
97 (71.32%)
1
1
2
104 (76.47%)
3
51 (37.50%)
All rows after the source plants inoculated with N1 (T4)
1
86 (63.23%)
2
1
2
106 (77.94%)
3
58 (42.64%)
Cocoa Research Institute of Ghana Annual Report 2010-2011
87

Evaluation of the effects of CSSV mild strains on growth and yield of cocoa (plot B14).
(O. Domfeh, G. A. Ameyaw, H. Dzahini-Obiatey J. E. Sarfo, J. Yeboah, M. K. Assuah, S. Acquaye and F. Owusu-Ansah).
The aims and objectives of this trial were clearly stated (Rep. Cocoa Res. Inst., Ghana, 2006/2007, 118). Like in the previous year (Rep. Cocoa Res. Inst., Ghana, 2009/2010), there were no significant differences in stem circumference and yield among the treatments (Table 5.6).
Table 5.6: Effect of CSSV mild strain N1 and SS365B on growth and yield of cocoa for the year2010/2011.
Treatment
Circ. (mm)
Yield
(kg/ha)
N1
218.993
SS365B
205.766
Healthy
216.4103
Sig. level cv%
s.e
ns ns5.422.6 11.619.8
An integrated programme for the control of cocoa swollen shoot virus disease in West
and Central Africa (Dzahini-Obiatey, O. Domfeh, F. M. Amoah, I. Y. Opoku, M. Assuah, A. R. Cudjoe and F. Baah)
The aims and objectives of this trial were clearly stated (Rep. Cocoa Res. Inst. Ghana, 2009/2010)
Component 1
Post sensitisation studies (evaluation) were carried out in some of the districts covered in the component one of the programme. The method employed was focus groups discussions (FGDs) for farmers and a one-to-one interview using a checklist for extension agents (i.e. extension agents of Cocoa Swollen Shoot Disease Control Unit (CSSVDCU) of Ghana Cocoa Board). Twenty FGDs were conducted (Table 5.7). The farmers were sampled using lists of registered farmers in the district offices of the CSSVDCU. The sampling size was determined using the method by Casley and Kumar (1988). The extension agents were randomly selected based on their working relationship with the farmers. Taking out the
Cocoa Research Institute of Ghana Annual Report 2010-2011
88

districts in Ashanti, which was not covered in the programme, 105 farmers (Table 5.7) and 10 extension agents of CSSVDCU were interviewed, using standard questionnaires for the farmers and a one-on-one interview with a checklist in the informal mode for the extension agents. Details of the FGDs held for the farmers in the covered districts are shown in Table 5.7. A detailed report on the evaluation by Francis Baah and Edwin Badger is attached as an appendix.
Evaluation
Key issues that emerged in relation to the management of CSSVD from the FDGs held with the farmers were:
i. High cost of cocoa establishmentii. Loss of household income during cocoa re-establishmentiii. Tenure arrangement and security
By and large, farmers were generally satisfied with the objectives of the sensitisation programme. The use of radio programme (with phone in), the community sensitization and the farm visits excited the farmers.The farmers found no fault with the trainers or the project team or the content of the training materials. They however wished to have clearer and vivid pictures of the desirable and undesirable shade trees so that they could easily identify them on their farms.The farmers also expressed the following additional concerns in relation to the management of CSSVD in Ghana:
i. Delayed payment of ex-gratia ii. Delay and inadequate supply of cocoa seedlingsiii. High cost of cocoa inputs on the marketiv. The absence of recommended cocoa agrochemicals on the marketv. High cost of labour especially in mining communities
Interview with extension agents
The overall perception of the extension agents was that, the programme had gone on well in terms of the collaboration with CSSVDCU, which now manages cocoa extension. They felt that the programme had been well planned with the active involvement of farmers, extension agents, researchers and policy makers at the Ghana Cocoa Board (COCOBOD). They however felt that more extension materials including posters, leaflets and flyers were needed to saturate the cocoa communities with information on the management of CSSVD. They also re-echoed reluctance of farmers to the treatment of their CSSVD infected farms due to insecurity of tenure when the land does not carry cocoa.
Cocoa Research Institute of Ghana Annual Report 2010-2011
89

Table 5.7: Focus Groups Discussions and interviews held for farmers during evaluation exercise
Region
District
Number of FGDs held
Number of farmers interviewed
Brong Ahafo
Goaso, Dormaa Ahenkro
4
25
Central Nyakrom, Breman Asikuma
4 20
Western South
Dunkwa, Wassa Akropong
2
25
Western North
Juaboso, Akontombra, Enchi
4
35
Total
105
Important Remarks from farmers
Despite the general endorsement of the training materials by farmers, they made very useful suggestions for improvement on the leaflets, posters and flyers.The suggestions include:?Improvements in colour separation to make the pictures sharper?Inclusion of pictures of desirable and undesirable shade trees on cocoa farms in the
posters and leaflets to aid farmers' identification?Many more of the posters, leaflets and flyers need to be printed for distribution to farmers
Comments by Extension of officers
The extension officers made the following suggestions:i. That any new extension materials for the next phase should be pretested to ensure
that they are conveying the intend messages.ii. That the content of the radio sensitization and farmer rallies should be developed and
pretested so that the format is standardised for the various encounters with farmers and other stakeholders
iii. That the disease spotters who spend weeks in cocoa farming communities should be adequately resourced for them to do their work effectively. Items such as camp beddings, motorbikes should be provides while their overnight allowances must be paid regularly and on-time.
Cocoa Research Institute of Ghana Annual Report 2010-2011
90

Concluding remarks and recommendations
The outcome of the evaluation exercise generally indicates a well-received programme by farmers, extension agents and other stakeholders. The general consensus was that programme was well-conceived, planned and executed.On the basis of the outcome of the study the following recommendations are offered:?Land tenure security in Ghana is one the underlying social issues that could undermine
efforts to effectively control CSSVD and hence must be brought to the fore, discussed and addressed.
?The sensitisation programme needs scaling up to other endemic areas in Ghana to ensure total containment of the disease.
?Extension officers and CSSVD spotters are vital players in the management of the disease. They have expressed some concerns including the provision of certain logistics and other motivational packages that needs to be addressed as matter of priority.
?Some platform should be created for sharing the outcome of the evaluation exercise so that all stakeholders become aware of them.
Component 3:
Increasing knowledge and strengthening the information base for early identification
of CSSV infected cocoa trees.
Samples (budwood), which were collected during the visits to CSSV outbreak areas were biologically characterised by indexing them onto Amelonado cocoa by grafting. The rationale is to increase knowledge on CSSV and to strengthen the information base for early identification of CSSV infection in cocoa trees as well as to determine the nature of the various strains of the virus. The grafted cocoa seedlings have been studied using symptomatological and serological tests and analysis as a first step in the classification and characterisation of the sampled viruses. Some of the samples (infected and/or suspected leaves) were sent to France for further studies and characterisation.Those showing symptoms of CSSV have been characterised biologically and are being kept in the CSSV museum and gauze houses.
Out of the total number of 16 samples sent on 3 occasions to France, virus has been detected in 6 using CSSV primers. These six samples have thus, been sequenced and are being studied for their relationship with known and sequenced CSSV strains. Five have been found to be related to CSSV groups A and B (Muller and Sackey, 2005), while one is different from any known CSSV sequence. This is an interesting result, which needs to be pursued further, therefore more samples will have to be analysed to determine if this strain is in a different group altogether.
Cocoa Research Institute of Ghana Annual Report 2010-2011
91

COCOA FUNGAL DISEASEMANAGEMENT THRUST
In the 2010 black pod survey, Phytophthora megakarya continued to be the dominant species causing the disease in Ghana. All the cocoa growing regions are now P. megakarya endemic. This virulent pathogen continues to spread to other Districts of newly infected regions such as the Eastern and Central Regions. Birim South district of the Eastern Region was the newest district affected by P. megakarya. Other diseases assuming economic importance in Ghana are white thread blight, stem canker and root rots on cocoa. The incidence of leaf blight was also recorded.
The efficacies of CFG 7535, KG 002505, Fantic Plus, Fluazinam, Champ DP, Fungikill 50 WP and Sidalco Defender were assessed as fungicides for the control of black pod disease in Ghana. All the test fungicides were promising and compared well with Ridomil Gold, the reference fungicide. AIso, decoctions of Momordica charantia, Cryptolepis sanguinolenta
and Tridax procumbens and oils from Xylopia aethiopica, Monodora mystica and cashew nut shell liquid and their combinations have also been found to be effective for the control of the disease.
On a search for cocoa varieties resistant to the black pod disease, some eighteen apparently resistant clones assessed by the attached pod method were recorded. These clones which were collected from farmers' farms are being further evaluated. Also, progenies of Na79 (selfed) and Pound 7 × P30 were observed to be more resistant when the stems were inoculated and assessed for canker lesion development.
Survey of Phytophthora isolates in Ghana (A. Y. Akrofi, I. Y. Opoku and M. K. Assuah and J. E. Sarfo)
The survey of Phytophthora isolates in Ghana continued (Rep. Cocoa Res. Inst., Ghana, 1998/99, 114; 1999/2000, 110-111; 2005/06, 102-103).
In the year under review, visits were made to farmers' farms in Offinso district (Ashanti Region), Tano South, Ahafo-Ano South, Asunafo North and South (Brong-Ahafo Region) and East Akim, Suhum Kraboa-Coaltar, Birim North and South (Eastern Region). Randomly selected farms and farms with reported cases of higher black pod disease incidence or incidence of unusual or 'strange disease' on cocoa were visited. The severity of the black pod
Cocoa Research Institute of Ghana Annual Report 2010-2011
92

disease incidence and 'strange/new' disease on any particular farm was recorded. Diseased samples were taken from infected cocoa leaves, stems, pods and roots. These were cultured on agar media and the isolates identified based on their cultural and morphological characteristics. Rallies, organised farmer groupings and other forms of interactions were used to educate farmers and extension agents on practices for managing and controlling the black pod and other diseases on cocoa.
One hundred and seventy six (176) successful isolations of Phytophthora were made from the 200 samples collected from 57 farms (Table 6.2). Out of the 176 isolates, 20 (11.4 %) were identified as P. palmivora and 156 (88.6 %) as P. megakarya. P. megakarya continued its spread in the Eastern Region with farms in Birim South district being the newly affected district (Table 6.3). The distribution of Phytophthora in this survey confirms earlier reports that areas affected by the two species are eventually dominated by P. megakarya. Other fungi isolated from the remaining 24 samples were Lasiodiplodia theobromae, Fusarium spp. and Colletotrichum spp. These were mostly saprophytes. All the diseases found in the cocoa farms were already known in the country and none was new or 'strange'. These included stem canker caused by both P. palmivora and P. megakarya, leaf blight by Colletotrichum
gloeosporioides and white thread blight caused by Marasmius scandens. The distribution of the diseases is shown in Figure 6.1How different is this map from the previous ones?. Forty (70 %) of the 57 farms visited had severe thread blight disease incidence. Leaf blight incidence, however, occurred in 13 (22 %) of the farms. Stem canker was identified as the main cause of cocoa tree deaths in almost all the farms where such trees were encountered. Mistletoes infestation was widespread and on infested farms, the parasite was observed to be having a debilitating effect on the trees. Epiphytic plants including mosses, lichens and tree
+climbers were prevalent in poorly maintained and older (18 yrs) farms.
Leaf diseases on pawpaw, kola and coconut trees intercropped with cocoa on CRIG experimental plots were also studied. Newly infected pawpaw leaves were distorted, wrinkled and chlorotic. Such leaves die slowly by turning dark-brown and collapsing. The Kola leaves were infected with brown sunken necrotic spots, surrounded with yellow halo margins. Symptoms on the infected coconut leaves included older leaves close to the soil surface showing numerous dried-out brown lesions. Fungi found associated with the diseased leaves of pawpaw, kola and coconut were Fusarium, Colletotrichum and Pestalotia species respectively. Pure cultures of these fungi have been maintained for pathogenicity testing and future studies. Farmers and extension staffs were educated on management of black pod disease during the field visits. Scientists were involved in training of facilitators of Farmer Field Schools in a Training of Trainers (ToT) workshop on identification and management of cocoa diseases as part of the Sustainable Tree Crop Programme (STCP) in
Cocoa Research Institute of Ghana Annual Report 2010-2011
93

Cocoa Research Institute of Ghana Annual Report 2010-2011
Kumasi. A similar programme was organised for TECNOSERVE at Sefwi-Wiawso. Farmers' schools and outreach programmes were also organised for some farmer groups in the Eastern Region.
Phytophthora megakarya is certainly becoming the main cause of black pod disease in Ghana and must be a major source of concern to all stakeholders. The pathogen has now affected cocoa farms in Birim South district; in addition to East and West Akim, Birim North, Atiwa, Suhum Kraboa Coaltar and Fanteakwa districts in the Eastern region which were reported in previous years. The various educational programmes to sensitise farmers and extension agents on the management and control of the black pod disease, particularly the type caused by P. megakarya needs to be intensified and expanded to cover all cocoa growing districts.
Mistletoes and epiphytes infestations and white thread blight incidence are assuming economic importance in cocoa farms in Ghana and needs to be addressed.
Table 6.2: Isolation of phytophthora spp. from cocoa in three regions of Ghana
Region
District
No
of farms visited
No
of samples collected
Phytophthora isolates
P. palmivor
a
P.
megakarya
Ashanti
Offinso North
2
11
0
9
East Akim
17
47
0
42
Eastern Suhum Kraboa Coaltar
8 26 0 20
Birim North 11 34 10 19
Birim South 7 17 10 7
Tano South
2
16
0
11 Brong-
Ahafo
Asunafo North
3
16
0
16
Asunafo South
3
16
0
15
Ahafo Ano South
4
17
0
17
Total
57
200
20
156
94
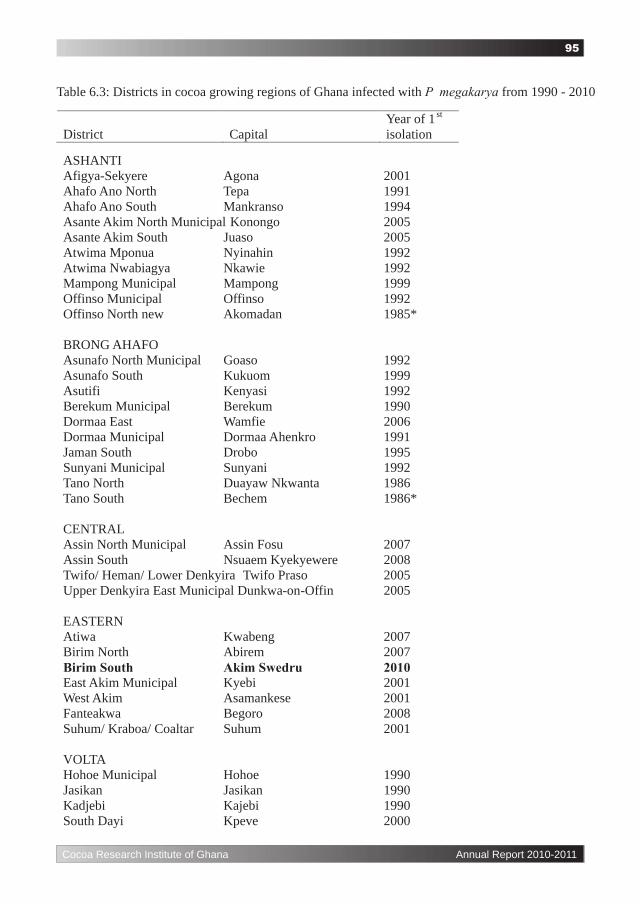
Cocoa Research Institute of Ghana Annual Report 2010-2011
Table 6.3: Districts in cocoa growing regions of Ghana infected with P megakarya from 1990 - 2010
District
Capital
Year of 1 st
isolation
ASHANTI
Afigya-Sekyere
Agona
2001
Ahafo Ano North
Tepa
1991
Ahafo Ano South
Mankranso
1994
Asante Akim North Municipal
Konongo
2005
Asante Akim South
Juaso
2005
Atwima Mponua
Nyinahin
1992
Atwima Nwabiagya
Nkawie
1992
Mampong Municipal
Mampong
1999
Offinso Municipal
Offinso
1992
Offinso North new
Akomadan
1985*
BRONG AHAFO
Asunafo North Municipal
Goaso
1992
Asunafo South Kukuom 1999 Asutifi Kenyasi 1992 Berekum Municipal Berekum 1990 Dormaa East Wamfie 2006 Dormaa Municipal Dormaa Ahenkro 1991 Jaman South Drobo 1995 Sunyani Municipal
Sunyani
1992
Tano North
Duayaw Nkwanta
1986 Tano South
Bechem
1986*
CENTRAL
Assin North Municipal
Assin Fosu
2007
Assin South
Nsuaem Kyekyewere
2008
Twifo/ Heman/ Lower Denkyira
Twifo Praso
2005
Upper Denkyira East Municipal
Dunkwa-on-Offin
2005
EASTERN
Atiwa
Kwabeng
2007
Birim North
Abirem
2007
Birim South
Akim Swedru
2010
East Akim Municipal
Kyebi
2001
West Akim
Asamankese
2001
Fanteakwa
Begoro
2008
Suhum/ Kraboa/ Coaltar
Suhum
2001
VOLTA
Hohoe Municipal
Hohoe
1990
Jasikan
Jasikan
1990
Kadjebi
Kajebi
1990
South Dayi
Kpeve
2000
95

Evaluation of fungicides for the control of black pod disease (M. K. Assuah, A.Y. Akrofi, I. Amoako-Attah, I.Y. Opoku, J. E. Sarfo and F. Baah)
As part of the search for better control of the black pod disease and reduce the high cost of fungicide application, the efficacies of some fungicides were assessed.
Field evaluation of candidate fungicides were conducted both at the small-scale, researcher managed and large scale, farmer managed levels during the year under review. At the small-scale level, eight fungicides, namely CA 2241, Revus, Dimethomorph + Chlorothalonil, Dimethomorph + Fluazinam, Carlit Express, Forum R, Volar and CA 2422 were tested at Tafo, a predominantly P. palmivora affected area and at Acherensua, a P. megakarya endemic area. Each fungicide was tested at two dosage levels and each level on a plot of 20 trees. The trial was replicated four times on a block design. At the large scale, seven fungicides, namely, Fantic, CFG 7535, KG 002506, Fungikill 50 WP, Fluazinam Sidalco Defender and Champ DP were evaluated at Biemso and Akomadan in Ashanti Region and Duayaw-Nkwanta and Goaso in Brong-Ahafo Region on farmers' farms on 200 tree plots. The fungicides under investigations are contained in Table 6.3. In all the trials, Ridomil Gold was used as the reference fungicide. In addition, untreated controls were included in the small scale trials. Cultural practices were common to all the treatment plots. Harvesting of pods was done monthly from August, 2010 to February, 2011 and at each harvest, pods were categorised into Healthy Ripe (HRP - pods completely free from black pod disease); Usable Black Pod (UBP - diseased pods but of commercial value) and Non-Usable Black Pod (NUBP - diseased pods and of no commercial value). From these data, Total Black Pod (TBP= UBP + NUBP), Fermentable Pods (FP= UBP + HRP) and percentage disease incidence [% DI= (TBP ÷ TP) x 100] were calculated. Where TP is the total number of pods given as (TP= HRP + TBP).
Cocoa Research Institute of Ghana Annual Report 2010-2011
WESTERN
Aowin/ Suaman Enchi 2001 Bia Essam 2008 Bibiani/ Anhwiaso/ Bekwai Bibiani 1999 Jomoro Half Assin 2009 Juaboso Juaboso 2003 Wassa West
Tarkwa Nsuaem
2008
Mpohor/ Wassa East
Daboase
2008 Nzema East Municipal
Axim
2009
Sefwi-Wiawso
Wiawso
1999
Wasa Amenfi East
Wassa Akropong
2000
Wasa Amenfi West
Asankragua
2001
*Districts confirmed to be infected earlier than commencement of the routine survey
96

Data for the small scale trials at Tafo and Acherensua are presented in Tables 6.4 to 6.8. In the Tafo trial 1, the lowest number of pods was obtained on Forum R at 75g but it was not significantly different from the other treatments except CA 2241 at 50g which had the highest number of pods (Table 6.4). The disease incidence recorded in plots treated with Volar at 100g was significantly lower than the control, the lower rates of DMM+Chloro and CA 2241. Fermentable pods obtained on all the treatments were not different from each other including the control (Table 6.4). In trial 2, more pods were obtained on plots treated with Carlit at 100g. The number was significantly higher than pods obtained from plots treated with DMM+Fluazinam at 75g which had the least number of pods (Table 6.5). The disease incidence ranged from 27.6 % on CA 2422 at 75g to 51.5 % on untreated control plots. However, among the fungicide treatments, %DI was not significantly different from each other. The highest DI was obtained on the untreated control and it was different from only CA 2422 at 75g. The FP obtained on all the treatments was not significantly different from each other (Table 6.5).
In similar trials at Acherensua, more cocoa pods were obtained on Ridomil Gold (661) plots. This was however, not significantly different from the other treatments (Table 6.6). The lowest DI of 11.8 % was obtained on CA 2422 at 100g but was not significantly different from the other fungicide treatments except Revus at 75ml which recorded 21.7 %. Untreated control had the highest DI of 22.9 % and it was significantly different from both rates of CA 2422 (Table 6.7). The lowest FP of 363 and 370 were obtained on Revus at 75 ml and untreated control, respectively. Those obtained from the remaining treatments were not significantly different from each other (Table 6.6). In trial 2 at Acherensua, pods obtained from the various treatment plots were not significantly different from each other (Table 6.7). The DI ranged from 11.1 % on DMM+Fluazinam at 75g to 20.6% on the untreated control plots but they were not significantly different (Table 6.7). Similarly, FP obtained from the various treatments was also not significantly different.
In the large scale trial, significantly higher number of pods was obtained from plots treated with Sidalco Defender at 100ml than those obtained from Fluazinam at 75 ml and Fantic at 50g (Table 6.8). The lowest DI of 19.8 % was obtained from CFG at 75g and it was significantly lower from the highest incidence of 28.9 % obtained from Ridomil Gold (reference fungicide) plots (Table 6.8). The highest FP of 1,880 was obtained on Sidalco Defender at 100ml and it significantly higher from the lowest FP of 1,288 obtained on plots treated with Fantic at 50g (Table 6.8).
The efficacies of some of the fungicides under screening compared favourably with that of the reference fungicide, Ridomil Gold, in the control of the black pod disease. At the large scale, all the seven test fungicides were more efficacious in controlling the disease than Ridomil Gold. CFG (75g), Fluazinam (75ml) and Fungikill were particularly effective during the season.
Cocoa Research Institute of Ghana Annual Report 2010-2011
97

Cocoa Research Institute of Ghana Annual Report 2010-2011
Table 6.3: Test fungicides and their status
S/N
Trade name
Active ingredient
Status
1.
DMM+Chloro
80g/kg Dimethomorph
+ 400g/kg chlothalonil
Small scale
2.
Revus
250 SC
23.3% Mandipropamide
Small scale
3.
DMM + Fluazinam
Dimethomorph + Fluazinam
Small scale
4.
CA 2241
266.6g/l
Tribasic Copper sulphate + 40g/L Zoxamid
Small scale
5.
Carlit Express
31.1%fosetyl Aluminium + 31.1% Mancozeb + 2.2% Benalaxyl
Small scale
6.
Forum R 60g/kg Dimethomorph + 400g/kg Copper
Small scale
7.
Volar
6% Dimethomorph +
40% Copper oxychloride
Small scale
8.
CA 2422
7.5% Mefonoxam
+
35% Copper hydroixde
Small scale
9.
Fluazinam
500g/l Fluazinam
Large scale
10.
Champ DP
57.6% Copper hydroxide
Large scale
11.
Fantic 75g
60% Copper
+ 9% Benelaxyl-M
Large scale
12.
Sidalco Defender
58.8% Copper oxychoride
Large scale
13.
CFG 7535
35% Copper oxide +
7.5%
Mefonoxam
Large scale
14.
KG 0025206
-
Large scale
15
Fungikill 50g
15 % Metalaxyl + 35 % copper
Large scale
98

Cocoa Research Institute of Ghana Annual Report 2010-2011
Table 6.4: Effect of fungicide application on black pod disease incidence and fermentable pods insmall scale trial 1 at Tafo
Fungicides
Total Pods
% Disease Incidence
Fermentable Pods
Volar (75g)
428
12.3
414
Volar (100g)
274
7.0
269
Forum R (75g)
178
12.8
170
Forum R (100g)
460
13.9
414
DMM+Chloro (50g)
256
21.3
224
DMM+Chloro (75 g)
424
9.3
411
CA 2241 (50g)
510
24.4
436
CA 2241 (75g)
394
11.9
375
Ridomil Gold (50g) 282 10.5 272
Control 484 22.7 431 LSD (p<0.05)
312.5
13.1
ns
Table 6.5: Effect of fungicide application on black pod disease incidence and fermentable pods insmall scale trial 2 at Tafo
Fungicides
Total Pods
% Disease Incidence
Fermentable
Pods
Carlit (75g)
393
41.9
268
Carlit (100g)
567
46.6
360
CA 2422 (75g) 388 27.6 303
CA 2422 (100g) 450 35.9 329
Revus (50ml) 426 35.7 317 Revus (75ml)
445
37.0
305
DMM+Fluazinam (75g)
362
44.5
234
DMM+Fluazinam (50g)
437
42.9
295
Ridomil Gold (50g)
393
32.1
293
Control
390
51.5
225
LSD (p<0.05)
193.2
22.8
ns
ns – not significant
ns – not significant
99

Cocoa Research Institute of Ghana Annual Report 2010-2011
Table 6.6: Effect of fungicide application on black pod disease incidence and fermentable pods insmall scale trial 1 at Acherensua
Fungicides
Total Pods
% Disease Incidence
Fermentable Pods
Revus (50ml)
481
18.2
426
Revus (75ml)
415
21.7
363
Forum R
(75g)
576
16.5
528
Forum R (100g)
497
19.2
448
DMM+Chloro (50g )
573
18.5
543
DMM+Chloro (75g)
527
16.9
494
CA 2422 (75g)
595
12.2
552
CA 2422 (100g)
629
11.8
556
Ridomil Gold (50 g) 661 13.5 614
Control 420 22.9 370 LSD (p<0.05) ns 9.23 238
ns – not significant
Table 6.7: Effect of fungicide application on black pod disease incidence and fermentable pods insmall scale trial 2 at Acherensua
Fungicides
Total Pods
% Disease Incidence
Fermentable Pods
Carlit (75g)
755
11.4
709
Carlit (100g)
684
15.0
646
CA 2241 (50g)
779
18.4
705
CA 2241 (75g)
594
14.9
544
Volar (75g)
526
19.1
470
Volar (100g)
595
15.1
543
DMM+Fluazinam (50g) 630 12.1 592
DMM+Fluazinam (75g) 630 11.1 593 Ridomil Gold (50g)
655
13.3
612
Control
647
20.6
574
LSD (p<0.05)
ns
ns
ns
ns – not significant
100
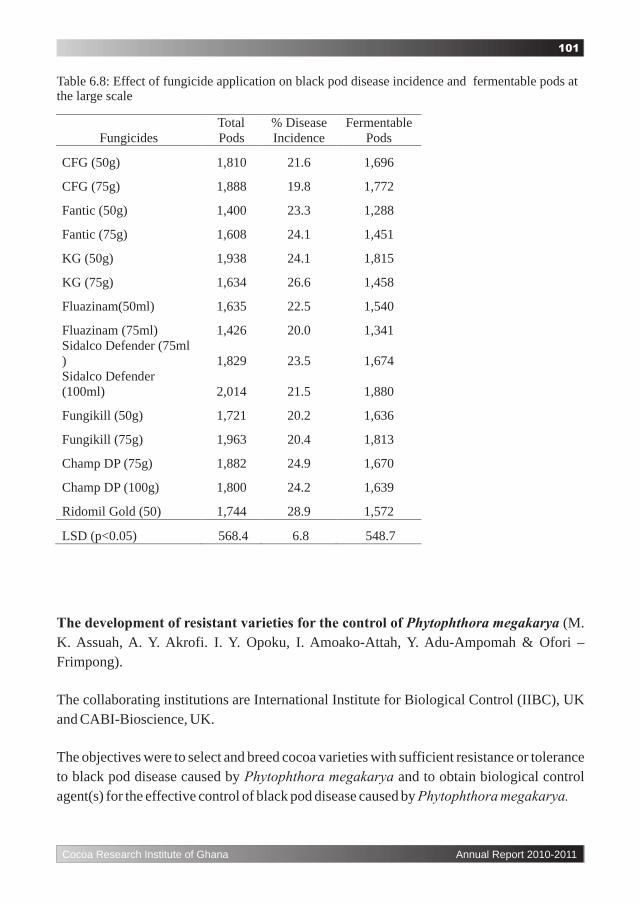
Cocoa Research Institute of Ghana Annual Report 2010-2011
Table 6.8: Effect of fungicide application on black pod disease incidence and fermentable pods atthe large scale
Fungicides
Total Pods
% Disease Incidence
Fermentable Pods
CFG (50g)
1,810
21.6
1,696
CFG (75g)
1,888
19.8
1,772
Fantic (50g)
1,400
23.3
1,288
Fantic (75g)
1,608
24.1
1,451
KG (50g)
1,938
24.1
1,815
KG (75g)
1,634
26.6
1,458
Fluazinam(50ml)
1,635
22.5
1,540
Fluazinam (75ml)
1,426
20.0
1,341
Sidalco Defender (75ml ) 1,829 23.5 1,674 Sidalco Defender (100ml) 2,014 21.5 1,880 Fungikill (50g)
1,721
20.2
1,636
Fungikill (75g)
1,963
20.4
1,813
Champ DP (75g)
1,882
24.9
1,670
Champ DP (100g)
1,800
24.2
1,639
Ridomil Gold (50)
1,744
28.9
1,572
LSD (p<0.05)
568.4
6.8
548.7
The development of resistant varieties for the control of Phytophthora megakarya (M. K. Assuah, A. Y. Akrofi. I. Y. Opoku, I. Amoako-Attah, Y. Adu-Ampomah & Ofori – Frimpong).
The collaborating institutions are International Institute for Biological Control (IIBC), UK and CABI-Bioscience, UK.
The objectives were to select and breed cocoa varieties with sufficient resistance or tolerance to black pod disease caused by Phytophthora megakarya and to obtain biological control agent(s) for the effective control of black pod disease caused by Phytophthora megakarya.
101

Cocoa Research Institute of Ghana Annual Report 2010-2011
Forty two (42) clonal collections with sufficient flowers were further evaluated for resistance to black pod disease by attached pod inoculation. To provide adequate number of uniform pods of similar age for screening, pollens of A1/154 and A1/197 which are known to be tolerant to P. megakarya black pod infection (Opoku et al., 2003) were collected from the trees in COCOBOD station plots. These were used to randomly hand pollinate flowers of the test trees. Three trees per clone were randomly selected and 10 attached pods were inoculated 4 months after pollination by spraying each pod with approximately 1 ml of P. megakarya
5zoospore suspension containing 2 x 10 spore/ml. The pods were enclosed in a polythene sheet with about 30mls of water to create a humid condition for infection. Disease assessment was done 7 days after inoculation by counting the number of infected pods per tree and number of lesions on each pod. The lesions were categorized as localized or expanding and rated on a scale of 1-8 as described by Iwaro (1996).
The levels of infection recorded following the attached pod inoculation are shown in Table 6.9. The lesion score ranged from 1.0 to 4.4 with overall mean lesion score of 1.4. As many as eighteen clones had mean lesion scores of 1.0, an indication of relatively higher resistance of these clones to the black pod disease. The most susceptible clone had a mean lesion score of 4.4. The lesions on the pods of this clone were localized.
Following the attached pod inoculation, wide variations in the level of resistance of the test clones to P. megakarya have been observed. The lesion score has been inconsistent for some of the clones over the years. These suggest that other factors, including the weather in any particular year, may be important in disease expression and hence the varied resistant levels of the clones. Additional attached pod inoculations as well as molecular analysis of the resistant levels of the clones are recommended to confirm the results.
References:Opoku, I.Y., Akrofi, A. Y., Abdul-Karimu, A. and Adu-Ampomah, Y. (2003). Selection of cocoa genotypes as parents for resistance to Phytophthora megakarya and Phytophthora
th th thpalmivora. In: 14 International Cocoa Research Conference, Accra, Ghana. 13 – 18 Oct, 2003. pp 817-825.
Iwaro, A. D. (1996). Strategies of variety improvement in cocoa with emphasis on durable disease resistance. An external review prepared for INGENIC. In: Proceedings of international workshop on the contribution of disease resistance to cocoa variety improvement. Salvador, Bahia, Brazil. Nov, 1996. pp 23-32.
102
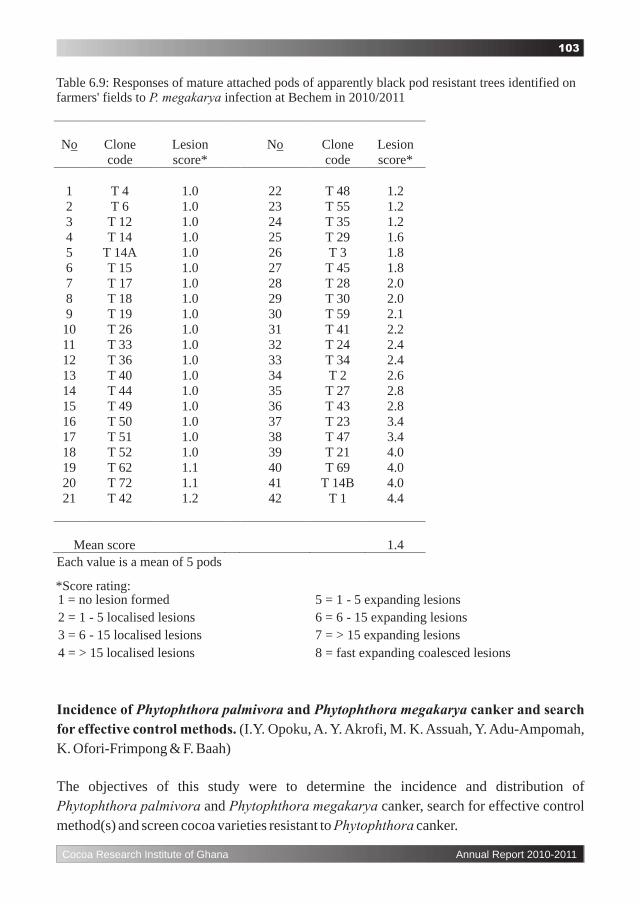
Cocoa Research Institute of Ghana Annual Report 2010-2011
Table 6.9: Responses of mature attached pods of apparently black pod resistant trees identified onfarmers' fields to P. megakarya infection at Bechem in 2010/2011
No
Clone code
Lesion score*
No
Clone code
Lesion score*
1
T 4
1.0
22
T 48
1.2
2
T 6
1.0
23
T 55
1.2
3
T 12
1.0
24
T 35
1.2
4
T 14
1.0
25
T 29
1.6
5
T 14A
1.0
26
T 3
1.8
6
T 15
1.0
27
T 45
1.8
7
T
17
1.0
28
T 28
2.0
8
T 18
1.0
29
T 30
2.0
9
T 19
1.0
30
T 59
2.1
10
T 26
1.0
31
T 41
2.2
11
T 33
1.0
32
T 24
2.4
12
T 36
1.0
33
T 34
2.4
13
T 40
1.0
34
T 2
2.6
14
T 44
1.0
35
T 27
2.8
15
T 49
1.0
36
T 43
2.8
16
T 50
1.0
37
T 23
3.4
17
T 51
1.0
38
T 47
3.4
18
T 52
1.0
39
T 21
4.0
19
T 62
1.1
40
T 69
4.0
20
T 72
1.1
41
T 14B
4.0
21
T 42
1.2
42
T 1
4.4
Mean score
1.4 Each value is a mean of 5 pods
*Score rating: 1 = no lesion formed 5 = 1 - 5 expanding lesions
2 = 1 - 5 localised lesions 6 = 6 - 15 expanding lesions
3 = 6 - 15 localised lesions 7 = > 15 expanding lesions
4 = > 15 localised lesions 8 = fast expanding coalesced lesions
Incidence of Phytophthora palmivora and Phytophthora megakarya canker and search
for effective control methods. (I.Y. Opoku, A. Y. Akrofi, M. K. Assuah, Y. Adu-Ampomah, K. Ofori-Frimpong & F. Baah)
The objectives of this study were to determine the incidence and distribution of Phytophthora palmivora and Phytophthora megakarya canker, search for effective control method(s) and screen cocoa varieties resistant to Phytophthora canker.
103

Fifteen progenies/clones were tested following the method previously reported (Rep. Cocoa
Res. Inst., Ghana, 2009/10). The barks of six-month old seedlings were each opened with a 2knife at about 10 cm from the soil surface. Agar plugs of 1 mm diameter were taken from the
margins of actively growing colonies of 5-day 10-day Is 10 day-old culture not too old for such inoculation. I will go for 5-day old culture which will be actively growingold P.
megakarya cultures and placed separately on the wounds with the mycelium portion on the wood of the seedling. Plastic film was wrapped over the inoculated point and tightly secured with adhesive tape. The seedlings were arranged in a CRD with three replicates (five seedlings per replicate). Three months later, the tape was removed and the margins of the observed lesions traced onto translucent sheets. The outer bark of all the seedlings were then carefully peeled off and the canker lesions developed on the wood were also traced out on separate translucent sheets. A leaf area meter, (winDIAS, Delta-T Devices Ltd., Cambridge, England), was used to measure the area of the lesions marked out on the translucent papers for the seedlings. The area of the lesions on the seedlings before and after scrapping of the bark were analysed separately with ANOVA and differences were separated by LSD.
The areas of Phytophthora canker lesions formed 3 months after inoculation are presented in 2Table 6.10. The largest canker area of 50 mm was observed on the bark of progeny Pa107
and it was significantly (p < 0.05) larger than the Na79 selfed, Pound7 x P30 and A1/154 x 2T85/187 which had the least values of 0, 7.5 and 17.4 mm respectively. With the exception of
three progenies (Pa107, N8/122 x T60/887 and T16/613 x P30), the canker lesions appeared smaller on the wood (after scrapping of the bark) than on the bark (Table 6.10). In an extreme
2instance, Pound7 x P30 showed lesion growth of 7.5 mm but when the bark was removed, the tissue underneath was free of lesion (Table 6.10). Is observation of the bark enough evidence of canker lesion development? From the table, external observation may be deceptive. It would have been ideal if weplated end of lesion on Phytophthhora selective medium to ascertain that the lesion was due to Phytophthora.
Na79 selfed and Pound7xP30 were apparently the most resistant among the progenies tested with Pa107 as the least resistant to P. megakarya infection.
Cocoa Research Institute of Ghana Annual Report 2010-2011
104

Studies on the incidence of Thread Blight Diseases (TBD) of cocoa and development of
control measures. (I. Amoako-Attah, M. K. Assuah, A. Y. Akrofi, I Y. Opoku, F. Aneani & K. Acheampong)
The objectives of the study were to determine the importance of Thread Blight Diseases (TBD) on cocoa and to develop effective measures to control them.
Cocoa Research Institute of Ghana Annual Report 2010-2011
Table 6.10: Phytophthora canker lesions on cocoa seedlings inoculated with agar plug of mycelia3 MAI
Cocoa progeny/clone
Before bark scraping (mm2)
After bark scraping (mm2)
Pa7
x
P30
29.8
10.0
N8/122
x
T60/887
26.6
33.3
T79/501
28.7
16.4
T85/799
x
AlphaB36
32.3
20.8
A1/154
x
T85/187
17.4
14.5
Pa107
50.0
66.6
EET59H 20.3 11.5
T85/799 35.7 30.6
Na33
x
Na79
32.3
17.3
AlphaB36
x
Sca9
32.2
21.0
T85/799
x
Amel
25.1
9.0
T16/613
x
P30
18.2
27.4
Na79
selfed
0.0
0.0
T85/799
x
T79/501
33.0
18.7
Pound7
x
P30
7.5
0.0
Lsd (5%)
31.8
32.2
1Each value is a mean of 15 seedlings.
105

Field observations indicate that the White Thread Blight Disease caused by Marasmius
scandens Mass is the most prevalent on cocoa farms in Ghana. White thread infected trees on Plot M 7 were selected for the study. The disease on each tree was assessed and categorised as mild (less than 25% of the canopy infected), moderately severe (more than 25% but less than 50% of the canopy infected), severe (more than 50% but less than 75% of the canopy infected) and very severe (more than 75% of the canopy infected). Twenty trees per category were randomly selected and twenty healthy trees were also included as control. At each harvest, pods located in either thread blight infected or uninfected parts of the canopy were grouped into diseased and healthy pods. Effects of thread blight severity and the relative pod positions in thread blight infected canopy on black pod disease incidence were assessed.
In the main crop season, black pod disease incidence (DI) was significantly higher on white thread blight (WTB) infected cocoa trees than the healthy ones. DI on the healthy trees was 38.7% of the blighted trees. Also on the blighted trees, DI in WTB infected part of the canopy was higher (p= 0.001) than those in the healthy part. That is, 49.1% more healthy pods were obtained from the healthy part of the canopy compared to the WTB canopy (Table 6.11). Though DI correlated well with the degree of WTB severity, significant differences were not detected in the DI on trees with more than 50% of the canopy blighted. Also, there were no significant interaction between WTB severity levels and the pod positions in blighted cocoa canopy.
The pattern of DI in light crop season was identical to that discussed for the main crop (Table 6.12). This, possibly, suggests that the presence of WTB which causes infected dead leaves hanging in the canopy creates humid conditions that favour fungal infection of the pods.
Earlier reports on the trial showed no clear relationship between WTB and DI. However, results of this season describe a relationship between WTB and DI. The study therefore needs to be repeated.
Cocoa Research Institute of Ghana Annual Report 2010-2011
106

Cocoa Research Institute of Ghana Annual Report 2010-2011
Table: 6.11. Negative binomial regression estimates of black pod disease incidence due to whitethread blight (WTB), severity levels and the relative position of cocoa pods in a blighted canopy- 2010 Main Crop Season
Variables
Categories
Estimates (%)
p-value
Tree’s WTB status
WTB present *
–
Healthy
38.7
0.001
Pod position
Blighted part *
–
Healthy part 50.8 0.001
WTB Severity Very severe * –
Severe 87.8 0.579
Moderately severe
71.0
0.156
Mildly severe
47.2
0.002
Constant
70.5
* These were the reference levels for the categories.
Table: 6.12. Negative binomial regression estimates of black pod disease incidence due to whitethread blight (WTB), severity levels and the relative position of cocoa pods in a blighted canopy- 2010 Light Crop Season
Variables
Categories
Estimates (%)
p-value
Tree’s WTB status
WTB present *
–
Healthy
36.2
0.001
Pod position
Blighted part *
–
Healthy part
55.9
0.001
WTB Severity Very severe * –
Severe 85.9 0.513
Moderately severe
69.4
0.111
Mildly severe
53.0
0.006
Constant
95.1
* These were the reference levels for the categories.
107

Cocoa Research Institute of Ghana Annual Report 2010-2011
The use of plant products as bio-fungicides for the control of important fungi on cocoa. (M. K. Assuah, S. T. Lowor, A. Y. Akrofi, I. Y. Opoku & I. Amoako-Attah)
To address environmental and health concerns about the use of synthetic chemicals in agriculture, this work was started to assess the effectiveness of botanicals in the control of fungi associated with cocoa.
In the year under review, the field performance of decoctions of whole plant of Momordica
charantia and Tridax procumbens and roots of Cryptolepis sanguinolenta, some of the most bio-active plants obtained so far and their combinations (1:1;v/v), were assessed for the
control of the black pod disease. The extracts were applied to the pods on 20 trees in a plot once a month from June to October and treatments were replicated three times in a randomised block design.What design is this? Ridomil Gold (a recommended fungicide) and untreated control were included as references. Pods were harvested monthly from October to February 2011 and were assessed for black pod disease incidence.
The effect of the plant products on black pod disease incidence is presented in fig. 6.1. Aqueous extract of Momordica charantia (MOM), and combinations of Tridax + Crypt and MOM + Tridax performed better than the untreated control. The performances however, were not as good as the reference fungicide, Ridomil Gold. The percent disease incidence was significantly lower on the reference fungicide plots than all the other treatments. Whole plant extract of Momordica charantia and combinations of decoctions of Momordica charantia + Tridax procumbens and T. procumbens + Cryptolepis sanguinolenta have proved promising. They will therefore be developed further, through formulation and testing, for possible use in the control of the black pod disease in organic cocoa cultivation.
Fig. 6.1: Effect of plant extracts on black pod disease incidence. Bars represent the standard errors
KEY: Crypt – Cryptolepis sanguinolenta Tridax – Tridax procumbens MOM -Momordica charantia
108

Studies on the effect of some plant oils and acetone extracts on growth and sporulation
of cocoa Phytophthoras in Ghana (S. T. Lowor, M. K. Assuah, P. C. Aculey & F. Owusu-Ansah)
The objective of this project was to determine the effect of some plant oils and acetone extracts on the growth and sporulation of cocoa Phytophthoras.
Field bioassays were conducted using two promising oils and their combination for the control of the black pod disease. The oils were applied to pods on 20 trees in a plot once a month from June to October and treatments were replicated three times in a block design. Ridomil Gold (a recommended fungicide) and untreated control were included as references. Pods were harvested monthly from October 2010 to February 2011 for black pod counts.
The effect of the oils on black pod disease incidence is presented in fig. 6.2. Oil from Xylopia
aethiopica (XA) and Cashew nut shell liquid (CNSL) performed better than the untreated control but their performance was not as good as the reference fungicide (Ridomil Gold treatment). The performance of the product when the two oils were combined was not different from that of the control.
In conclusion, the oil of Xylopia aetiopica and Cashew nut shell liquid have proved promising and will therefore be further developed through formulation and testing for possible use in the control of the black pod disease in organic cocoa cultivation.
Figure 6.2: Effect of plant oils on black pod disease incidence. Bars represent the standard errors
KEY: CNSL – Cashew nut shell liquidXA - Xylopia aethiopicaXAM – X. aethiopica +Monodora mystica
Cocoa Research Institute of Ghana Annual Report 2010-2011
109

Studies to determine the presence of metalaxyl resistant strains in Phytophthora megakarya. (I. Amoako-Attah, A. Y. Akrofi, M. K. Assuah, I. Y. Opoku & F. Owusu-Ansah)
The objective of this project was to determine the probable occurrence of strains of P.
megakarya resistant to metalaxyl in the field. Different weights of metalaxyl (Ridomil Gold) were separately incorporated into Carrot Agar (CA) medium to obtain final concentrations (g/15L of water) of 15 (three tenth of recommended), 25 (half of recommended), 50 (recommended) and 75 (one and half of the recommended) application rate. Approximately 20 ml of each concentration was poured into five replicate 90-mm diameter Petri dishes. Five CA plates containing no metalaxyl were included as control. All the plates were centrally inoculated with 10-mm diameter mycelia plugs from a 5-day old P. megakarya culture and
oincubated at 25 C. P. megakarya isolates obtained from sprayed farms were designated as metalaxyl resistant (MR) and those from non sprayed farms as metalaxyl sensitive (MS). Colony diameters of the incubated plates were measured 14 days after inoculation and only plates that had growths are presented here.
At the two weeks assessment period, colony diameters ranging from 18 to 34.5 mm were obtained on three of the isolates assigned letters A, B and C (Table 6.13). Isolate obtained from sprayed farm grew at slightly higher metalaxyl concentration than the others. However, none of the isolates grew at the recommended metalaxyl rate or above. The results, thus, did not show the presence of metalaxyl resistant strain among the P. megakarya isolates.
Table 6.13: Diametric colonies (mm) formed by metalaxyl sensitive (MS) and metalaxyl resistant(MR) P. megakarya isolates in vitro
Concentration (g/15L)
Isolates1
Remarks
A
(MS)
B (MR)
C (MS)
0
90
90
90 Sensitive
15 34.5 0 18.0 Lowly resistant
25 0 21.5 0 Mod resistant
50
0
0
0
Resistant
75
0
0
0
Highly resistant
1Isolates A and B were from the Brong-Ahafo region and C from the Eastern region.
Cocoa Research Institute of Ghana Annual Report 2010-2011
110

NEW PRODUCTS DEVELOPMENT THRUST
Work of the New Product Development Unit (NPDU) centered on the implementation of the Common Fund for Commodities (CFC) and the Ghana Cocoa Board financed programme entitled 'Pilot Plants to Process Cocoa by-products in Ghana'. Work continued on the production of cocoa based by-products. A gross revenue of GH¢172,383.94 was realized from the sale of these products. Dry cocoa beans production at the three CRIG plantations totaled 120.09 tonnes. Mabang/Acherensua and Worakese recorded an increase of 32.88% and 3.97% respectively over the previous year while Wantram recorded a decrease of 19.4%. Studies carried out on the beneficial usage of reject cashew kernels revealed that they could
-1form up to 300 g Kg of growing pig feeds without any deleterious effects and at this level maize is not required in the diet at all. A similar work is being carried out to investigate the use of shea kernel cake as a feed ingredient for poultry and livestock. The yeast, Kodamaea
ohmeri, gave gin and brandy of desirable characteristics as far as taste and smell are concerned in an on-going study aimed at developing standard operating procedures for large-scale production of alcohol and vinegar with micro-organisms derived from cocoa fermentation. Pleurotus ostreatus grown on cashew pulp had the least growth and significantly lower levels of total polyphenols than those grown on shea pulp, cocoa, kola and coffee husk. However, in terms of o-dihydric phenols and soluble sugars, cashew pulp had significantly higher amounts compared to the other six. Levels of Cadmium, Cobalt and Chromium were very low and within recommended levels for food. Iron and copper were however very high in P. ostreatus grown on kola and cocoa pod husk substrates. Ginger extract and Xylopia aethiopica at 200 ppm used in shelf life studies were found to slow down free fatty acid formation in shea butter stored for 20 months. Efforts by the Unit to add value to shea butter is very encouraging. Different cosmetic and edible products have successfully been developed and are now under observation.
Large-scale production and marketing of cocoa and cashew by-products (C. K. Agyente-Badu, J. F. Takrama, E. O. K. Oddoye, Esther Gyedu-Akoto, Winifred Kumi and F. Aneani)
Various quantities of products were produced for sale during the year. Procurement of raw materials, packaging materials and labels continued. Nine hundred and twenty litres (920 L) of sweatings was received from Worakese and is now undergoing fermentation for wine production at Tafo. The Unit reintroduced cashew apple juice production as well as added a new product, cashew nut butter, to the production line. The summary of production and the revenue derived from the sales of the products are
Cocoa Research Institute of Ghana Annual Report 2010-2011
111

presented in the Table 7.1. A gross revenue of GH¢172,383.94 was generated from the sales of various quantities of 16 by-products during the reporting period. Cocoa butter soap and alata samina recorded the highest sales of GH¢59,941.08 and GH¢26,990.10 respectively due to an increase in demand for the products (Table 7.1).
Cocoa Research Institute of Ghana Annual Report 2010-2011
Table 7.1 Summary of products produced during the year under review
Product
Unit
Quantity
Amount (GH¢)
Cocoa Gin
carton
39.66
2,343.00
Cocoa Brandy
"
39.58
2,338.00
Alata Samina
"
1539
26,990.10
Cocoa Butter Soap
"
2899
59,941.08
2nd Image Toilet Soap
cake
1000
900.00
Cocoa Butter Pomade L/S
carton
762
21,957.00
Cocoa Butter Pomade S/S
"
243
6,694.56
Cocoa Jam " 75.5 4,530.00 Cocoa Vinegar " 9 102.70 Cocoa Wine " 46 4,548.00 Cocoa Biscuits
"
421
6,765.60
Roasted Cashew Nuts
"
637.5
20,449.20 Cashew Jam
"
33.5
2,012.50
Cashew Nut Butter
"
140
6,544.00
Cashew Apple Juice
"
65
771.00
Raw Cashew Kernels
Kg
870
5,497.20
Total
172,383.94
Pigs and Chicken Production at Bunso
Twelve pigs were raised at Worakese cocoa plantation and sold during the reporting period. Two hundred and ten (210) layers and four hundred and two (402) broilers were raised at Bunso using feeds which included CPH as an ingredient and these were sold to staff. One thousand three hundred and ninety-seven crates of whole eggs and 59 crates of cracked eggs were collected and sold to staff.
Cocoa Plantations (S. Okrah-Gyekye, O. Ntiamoah and S. F. Akomea)The three CRIG Plantations focused on the production of cocoa beans, alcohol and potash during the period under review. Table 7.2 shows the summary of by-products generated at the various plantations. Figure 7.1 also shows the annual cocoa beans production records for the plantations. Annual production figures were 50.03, 25.93 and 44.13 tonnes for Worakese, Wantram and Mabang/Acherensua respectively.
112

Investigating the use of reject cashew kernels in pig feeding (E. O. K. Oddoye, K. Agyente-Badu and V. Anchirina)
This project which commenced in January 2010 and ended in June 2010 sought to address the problem of build-up of broken, scorched and oily cashew kernels (reject) at cashew processing plants in the country by identifying possible ways of using these kernels as feed ingredient for pigs. The feeding trials were carried out at Worakese plantation.
The chemical composition of reject cashew kernels, ingredient composition of experimental diets and the chemical composition of experimental diets are shown in tables 7.3, 7.4 and 7.5, respectively. Chemical composition of reject cashew kernels compared favourably with what was obtained in the literature. The inclusion of reject cashew kernel tended to lower feed costs (see table 7.4). The inclusion of palm oil in 0 RCK to raise energy levels resulted in
Cocoa Research Institute of Ghana Annual Report 2010-2011
Table 7.2 Summary of potash and alcohol production of at CRIG Plantations
Plantation
Potash (kg)
Cocoa alcohol (L) (%v/v)
Acherensua/Mabang 1909 575.5 (40%) Wantram 750 400 (40%) Worakese 2538 484 (90%) Tafo
471
23.3 (40%)
Figure 7.1 Annual production of cocoa at CRIG Plantations (1992/1993 - 2010/2011)
113

Cocoa Research Institute of Ghana Annual Report 2010-2011
high ether extract for that diet as compared with 150 RCK. There were no significant differences (P > 0.05) between treatments for average daily gain, average daily feed intake and feed conversion ratio (Table 7.6). Cost of gain, however, tended to decrease with the inclusion of reject cashew kernel (RCK) in the diet, with treatment 0 RCK being significantly (P < 0.05) higher than the other two diets and treatment 150 RCK being significantly (P < 0.05) higher than treatment 300 RCK.
Table 7.3 Chemical composition of reject cashew kernels (RCK)Chemical Composition
Dry matter (DM) (g Kg-1)
(g Kg-1DM)
870
Organic matter
(g Kg-1
DM)
980
Crude protein
(g Kg-1
DM)
229
Ether extract
(g Kg-1
DM)
580
Crude fibre (g Kg-1 DM) 27.5 Nitrogen-free extract (g Kg-1
DM) 13.5 Calcium
(g Kg-1
DM)
0.21
Phosphorus
(g Kg-1
DM)
7.3
Estimated ME (MJ kg-1)
5639
Table 7.4 Composition of experimental feeds
Experimental feed
Ingredients (g Kg-1)
0 RCK
150 RCK
300 RCK
Reject cashew kernel
0
150
300
Maize
310
250
0
Wheatbran
300
241
245.2
Copra cake
150
100
100
Cocoa pod husk
40
150
300
Soyabean cake
80
50
0
Palm oil
50
0
0
Tuna meal
50
40
40
Oyster shell
13
13
10
Common salt 2.5 2.5 2.5 Vitamin/mineral mix 1.25 1.25 1.25 Synthetic lysine
2.25
1.25
0
Michochem
1
1
1
TOTAL
1000
1000
1000
Calculated Analysis
Digestible Energy (MJ Kg-1)
12.3
12.5
12.9
Crude protein (g Kg-1)
173.9
170.2
171.8
Lysine (g Kg-1)
10.0
10.2
10.6
Methione + cystine (g Kg-1)
5.3
5.2
5.1
Calcium (g Kg-1)
8.0
8.3
8.5
Available phosphorus (g Kg-1)
6.6
6.6
7.4
Cost (GH¢ metric tonne-1)
430.00
360.00
280.00
114

NB1. 1GH¢ = 0.69USD as at December 20, 2010.2. Michochem is a commercial mould fixing agent which is added to feeds at a rate of 1 Kg per 1000 Kg of feed. It binds mycotoxins in vivo preventing them from causing harm to the animals.
Key0 RCK - Control
-1150 RCK - 150 g Kg reject cashew kernel in feed-1300 RCK - 300 g Kg reject cashew kernel in feed
Table 7.5 Proximate analysis of experimental feeds
Parameters
0RCK
150RCK
300RCK
Dry matter
(g Kg-1)
(g Kg-1DM)
880
880
875
Organic matter
(g Kg-1DM)
920
935
940
Crude protein
(g Kg-1DM)
185
189
177
Ether extract
(g Kg-1DM)
265
85
200
Crude fibre (g Kg-1DM) 63.2 119.6 163.3 NDF (g Kg-1DM) 525 600 610 ADF (g Kg-1DM)
440
550
365
ADL
(g Kg-1DM)
180
225
250
Calcium
(g Kg-1DM)
8.6
8.5
8.1
Phosphorus
(g Kg-1DM)
7
6.2
6
Table 7.6. Feed intake and average daily weight gain
0RCK
150RCK 300RCK
Mean
SED
SIG
Average daily gain (Kg day-1) 0.39 0.39 0.38 0.39 0.012 NS Average daily feed intake (Kg day-1) 2.31 2.22 2.15 2.23 0.066 NS Feed conversion ratio 5.92 5.77 5.68 5.79 0.276 NS Cost of gain (GH¢)
2.54a
2.08b
1.59c
2.07
0.098
*
Key0 RCK - Control
-1150 RCK - 150 g Kg reject cashew kernel in feed-1300 RCK - 300 g Kg reject cashew kernel in feed
Conclusion-1It was concluded that reject cashew kernels could form up to 300 g Kg of growing pig feeds
without any deleterious effects and at this level maize is not required in the diet at all.
Cocoa Research Institute of Ghana Annual Report 2010-2011
115

Investigating the use of shea kernel cake in animal feeding (E. O. K. Oddoye, K. Agyente-Badu and V. Anchirina)
The objective of this project is to assess the use of shea kernel cake as a feed ingredient for poultry and livestock. Samples were collected from seven different locations and in collaboration with Kwame Nkrumah University of Science and Technology (KNUST), some of the samples have been analysed for their chemical constituents. Work was also carried out on various methods for removing tannins from the cakes. Analysis of the residues for tannin and its comparison with the untreated control is in progress.
Although not statistically tested, there was quite a large variation between samples of shea nut cake, even among three (3) samples taken from three (3) different processors in the Bole township (Table 7.7). Even though the processors use basically the same methods of extraction (addition of water to allow shea fat to float to the surface) the methods have not been standardized and could lead to such variation. Generally, it appears that the water-based extraction produces a material with a lower level of tannin, as tannins are known to be water-soluble. The material from the Ghana Nuts Factory (Techiman) had the lowest tannin level of the industrial samples (Table 7.7). This is probably because they use a solvent-extraction method, followed by pressing. Again appreciable amounts of tannin may be taken away by the solvent
Table 7.7 Nutritional content of shea cake from different sources
Bole A
Bole B
Bole C
Shebu Industries, Tamale
Tamale
NPDU
Ghana Nut
Ltd, Techiman
Dry matter
900
885
940
905
Organic matter
945 955 960 980
Ether extract 425 390 545 330 Crude fibre 53.8 59.3 45.5 93.8 Crude protein
116
133
117
159 NDF
250
290
320
570 ADF
180
220
250
450
ADL
172.8
211.7
240
445.9
Tannin
0.319
0.244
0.206
0.447
0.940
0.386
0.356
KeyNDF – Neutral detergent fibreADF – Acid detergent fibreADL – Acid detergent lignin
Cocoa Research Institute of Ghana Annual Report 2010-2011
116

Developing standard operating procedures for large-scale production of alcohol and
vinegar with micro-organisms derived from cocoa fermentation (J. F. Takrama, Winifred Kumi, and V. Anchirina)
The objectives and the details of the fermentation process have been reported (Rep. Cocoa
Res. Inst., Ghana, 2008/2009). The alcohols produced by the different yeast strains were blended into gin and brandy. A consumer type of sensory evaluation was conducted for the blended gin and brandy to show how the various products are likely to be accepted on the market. Twenty untrained personnel from CRIG were used in the evaluation. Cocoa gin and brandy produced by the New Product Development Unit were used as controls (Tables 7.8 and 7.9).
Table 7.8 Sensory evaluation of formulated using cocoa gin obtained from alcohol distilled fromfermented cocoa pulp juice using different yeasts strains
Sample
Taste
Smell
Bitterness
Biting Effect
Bitter
Not Bitter
Water-
like
Biting
Not Biting
Good
Bad
Does Not Smell
Control
4
16
0
0
20
8
0
12
S fermentation
0
16
4
0
20
0
8
12
P. manshuric a
20
0
0
0
20
0
12
8
S. ludwigii
8
12
0
4
16
0
4
16
I. orientalis 12 8 0 0 20 0 12 8 P. kluyveri 0 8 12 8 12 0 4 16 P. carribica 0 20 0 0 20 0 4 16 K. ohmeri 4 16 0 4 16 4 4 12 C. orthopsilosis
4
16
0
0
20
0
8
12 S. cerevisiae/I.
orientalis
0
16
4
4
16
0
8
12
*Control = alcohol from triple distillation S Fermentation = spontaneous fermentation
Cocoa Research Institute of Ghana Annual Report 2010-2011
117

Table 7.9 Sensory evaluation of formulated cocoa brandy using alcohols distilled from fermentedcocoa pulp juice using different yeast strains
Sample
Taste
Smell
Bitterness
Biting Effect
Bitter
Not
Bitter Water-
like Biting
Not
Biting Good
Bad
Does Not
Smell
Control
15
5
0
0
20
5
5
10
S fermentation
5
15
0
5
15
0
15
5
P. manshurica 10 10 0 5 15 0 15 5 S. ludwigii 10 5 5 0 20 0 10 10 I. orientalis 20 0 0 0 20 0 15 5 P. kluyveri 0 15 5 10 10 0 10 10 P. carribica
5
10
5
0
20
0
10 10
K. ohmeri
0
20
0
10
10
5
10
5 C. orthopsilosis
5
10
5
5
15
0
15
5
S. cerevisiae/I. orientalis
5
10
5
10
10
0
5
15
Conclusion
After the sensory evaluation, it was deduced that K. ohmeri gave gin and brandy of desirable characteristics as far as taste and smell is concerned.
Evaluation of cashew and shea pulp, kola and coffee husk as substrates for cultivation
of edible mushroom (S. T Lowor, F. Owusu Ansah, M. Assuah, Winfred Kumi)
The objective of this study is to add value to cashew and shea pulp, coffee and kola husk which ordinarily go waste. Kola, Cocoa and coffee husk, cashew pulp and cashew shells were dried and fermented. Spawn for mushroom (Pleurotus ostreatus) was obtained from Food Research Institute and inoculated. It was realized that P. ostreatus colonized the substrate much easily when grown on saw dust and least growth was observed on cashew pulp (Figure 7.2).
Figure 7.2. Graph showing growth rate of P. ostreatus on various substrates
Cocoa Research Institute of Ghana Annual Report 2010-2011
118

Table 7.12 indicates some of the elemental composition of the mushrooms grown on various substrates. Levels of heavy metal compounds like Cadmium (Cd), Cobalt (Co) and Chromium (Cr) were very low and within recommended levels for food. Iron and copper were however very high in mushrooms grown on Kola and Cocoa pod husk substrates
Table 7.12: Mineral composition of mushroom harvested from various substrates
Substrate
Concentration (Total) mg/Kg
Fe
Mn
Cu
Zn
Cr Ni
Cd
Co
Cocoa pod husk
51.77
4.55
25.57
15.94 <0.006
1.71
<0.002
<0.005
Cashew shell 25.73 1.30 16.18 8.84 <0.006 0.08 <0.002 0.005 Cashew pulp 25.73 1.30 16.18 8.84 <0.006 0.54 <0.002 <0.005 Saw dust 30.41 0.97 15.82 12.99 <0.006 0.29 <0.002 <0.005 Kola husk
52.55
3.44
23.79
7.16 <0.006
1.88
<0.002
<0.005
Coffee husk
49.18
3.85
14.34
15.10 <0.006
<0.001
<0.002
<0.005
Mushroom grown on cashew pulp had significantly lower levels of total polyphenols
than the other five substrates (Table 7.13). In terms of o-dihydric phenols cashew pulp had significantly higher amounts compared to the other five. The influence of substrate on the sugar composition of mushroom is also reflected in Table 7.13 where the cashew pulp mushroom had significantly higher levels of soluble sugars than the others. Generally all the substrate grown mushroom had low levels of insoluble sugars and fat content. Percentage ash content was however high.
Table 7.13 Chemical composition of mushroom grown on various substrates
Phenolics (mg/g)
Carbohydrates (mg/g)
Percentage (%)
Substrate
O-dihydric
Total
soluble
Insoluble Ash
Fat
Cocoa pod husk 0.22 ± 0.03 5.09 ± 0.38 80.73 ± 1.4 29.55 ± 0.3 7.2 ± 0.4 2.83 ± 0. 16 Cashew shell 0.25 ± 0.04 6.11 ± 0.37 88.14 ± 2.0 34.16 ± 1.6 8.1 ± 0.2 1.51 ± 0.03 Cashew pulp 0.37 ± 0.01 4.46 ± 0.17 158.67 ± 0.5 47.82 ± 2.3 6.2 ± 0.6 1.32 ± 0.02 Coffee husk 0.22 ± 0.05 5.58 ± 0.18 111.89 ± 3.0 43.67 ± 2.7 7.7 ± 0.3 0.99 ± 0.01 Sawn dust
0.20
± 0.04
5.92
± 0.06
134.89 ± 8.1
27.78 ± 1.6
7.6 ± 0.2
1.57 ± 0.05
Kola husk
0.22
± 0.04
5.57
± 0.22
154.25 ± 3.4
32.03 ± 0.4
9.0 ± 0.5
0.95 ± 0.08
Biological efficiency
The biological efficiency based on the dry weight of each substrate is presented in Table 7.14 Maximum bioefficiency of Pleurotus ostreatus was on sawdust and the least on coffee husk.
Cocoa Research Institute of Ghana Annual Report 2010-2011
119
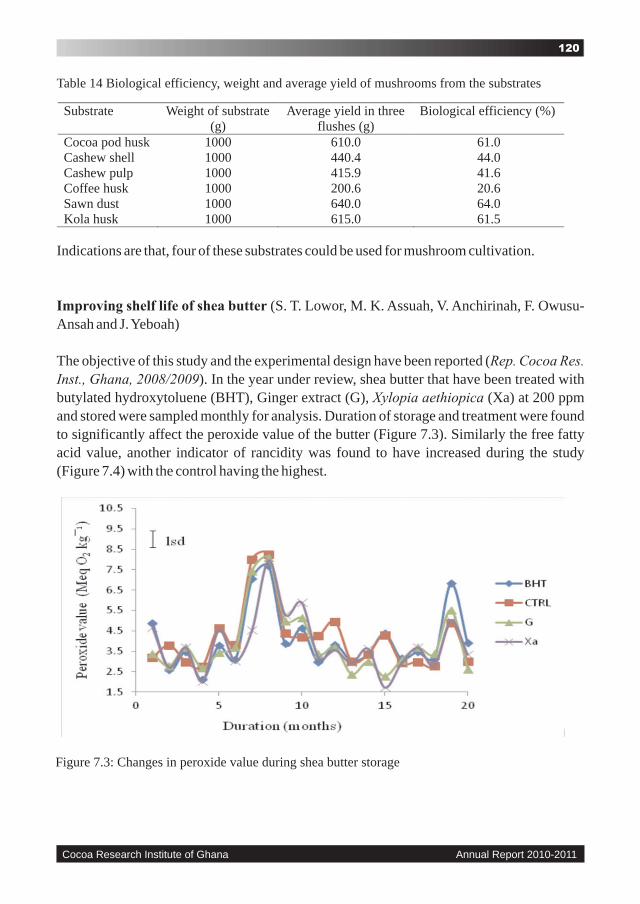
Cocoa Research Institute of Ghana Annual Report 2010-2011
Table 14 Biological efficiency, weight and average yield of mushrooms from the substrates
Substrate
Weight of substrate (g)
Average yield in three flushes (g)
Biological efficiency (%)
Cocoa pod husk
1000
610.0
61.0
Cashew shell 1000 440.4 44.0 Cashew pulp 1000 415.9 41.6 Coffee husk 1000 200.6 20.6 Sawn dust
1000
640.0
64.0 Kola husk
1000
615.0
61.5
Indications are that, four of these substrates could be used for mushroom cultivation.
Improving shelf life of shea butter (S. T. Lowor, M. K. Assuah, V. Anchirinah, F. Owusu-Ansah and J. Yeboah)
The objective of this study and the experimental design have been reported (Rep. Cocoa Res.
Inst., Ghana, 2008/2009). In the year under review, shea butter that have been treated with butylated hydroxytoluene (BHT), Ginger extract (G), Xylopia aethiopica (Xa) at 200 ppm and stored were sampled monthly for analysis. Duration of storage and treatment were found to significantly affect the peroxide value of the butter (Figure 7.3). Similarly the free fatty acid value, another indicator of rancidity was found to have increased during the study (Figure 7.4) with the control having the highest.
Figure 7.3: Changes in peroxide value during shea butter storage
120

Figure 7.4: Changes in free fatty acid during shea butter storage
Conclusion
Changes in the free fatty acid levels (FFA) and perioxide values of the stored butter increased, thus indicating that rancidity increases with time. The control sample seems to be deteriorating faster than the treated samples. Xa and G could be recommended for use to slow down FFA formation in shea butter compared to not using anything.
Development of shea butter-products (C. K. Agyente-Badu, S. T. Lowor, Winifred Kumi, F. Aneani and Mercy Asamoah)
The objective of this study is to add value to shea butter. Different cosmetic products namely toilet soaps, body lotions, body creams, body pomades and hair pomades have successfully been developed. Shea butter was also formulated into margarine and the samples are now under observation after which they may be reformulated and subjected to consumer preference and quality assessment. Consumer acceptance studies conducted on the body lotions were very encouraging. Further studies are being conducted on the development of other cosmetic and edible products from shea butter.
Evaluation of quality characteristics of cashew nuts and kernels in Ghana (Esther Gyedu-Akoto, S.T. Lowor, M. Assuah, E. Agyemang Dwomoh, F. Owusu-Ansah and S.Y. Opoku)
The objectives of this study have been reported (Rep. Cocoa Res. Inst., Ghana, 2008/2009). A total of 105 farmers and 2 buyers were interviewed in 10 cashew growing districts. The
Cocoa Research Institute of Ghana Annual Report 2010-2011
121

districts were Jaman North, Wenchi and Kintampo in tha Brong Ahafo Region, Yendi, Gonja West and Bole in the Northern Region, Jirapa and Nadowli in the Upper West Region, Afram Plains in the Eastern Region and Ho and Hohoe in the Volta Region. Samples of raw nuts were obtained from the farmers for quality assessment. Cutting test, determination of weight distribution, identification of insects and diseases of raw nuts were done. Insects that were found on the raw nuts during the period of quality assessment have been identified as Ephestia sp and Araecerus fasciculatus. Analysis of aflatoxin is on-going. Table 7.15 shows the minimum and maximum storage temperature and humidity under which the raw nuts were kept and their moisture contents. Most raw cashew nuts sampled had moisture contents ranging from 6.1-10.0%. However, nuts with high moisture contents came from the Brong Ahafo Region and this may be due to the high storage humidity in the area.
Table 7.15: Storage temperature, humidity and moisture contents of raw nuts
Region
Storage temp (o
C)
Humidity (%) Moisture content (%)
Min
Max
Min
Max
Min
Max
Upper West 20.7 32.2 28.4 36.3 8.9 17.6 Eastern 34.4 38.2 26.3 43.0 7.6 19.7 Brong Ahafo 27.6 38.3 42.0 89.0 7.8 21.1 Northern 33.8 36.4 25.0 72.3 8.9 17.6 Volta
21.1
23.7
63.3
81.7
5.7
21.4
For the year under review, nuts sampled from all the regions were mostly of the standard grade except for the Brong Ahafo region which produced excellent grade nuts. For weight distribution, most of the nuts weighed between 5.1-6.0 g followed 6.1-7.0 g indicating that the nuts were small in size.
Cocoa Research Institute of Ghana Annual Report 2010-2011
122

COFFEE AGRONOMY THRUST
In integrating Cedrela odorata into Robusta coffee cultivation, initial yield data indicate that although high initial density of the tree may not adversely affect vegetative growth of coffee plants, the yield could be negatively affected as a result of low light transmission into the plants. Sole application of inorganic fertilizers to coffee seedlings seems to depress the vegetative growth of coffee at Afosu. At Tafo, soil amendments significantly affected both the length and number of laterals of coffee plants. There was however, no significant difference between the chemical and manual weed control methods for the length and number of laterals. At Afosu, stem girth differed significantly (P < 0.05) between the soil amendments. Soil moisture in the dry season was not significantly different between the treatments at both locations. While intercropping significantly affected the girth of the coffee seedlings six months after transplanting, it had no effect on plant height. In evaluating the effects of poultry manure and its combinations with cocoa pod husk ash on yield of Robusta coffee, initial results indicate that the treatments influenced vigorous growth of new shoots during the raining season. Results from the evaluation of foliar fertilizer formulations on growth and yield of coffee showed that, after 24 months of planting in the field the fertilizers applied did not significantly influence the growth of young coffee plants.
Integrating Cedrela odorata into Robusta coffee cultivation (F. K. Oppong, G. J. Anim-Kwapong, K. Ofori-Frimpong, F. Owusu-Ansah, V. Anchirinah, A. R. Cudjoe, and M. K. Assuah).
The experimental detail of the above trial was presented in the 2009/2010 Annual Report (Rep. Cocoa Res. Inst. Ghana, 2009/2010). Routine maintenance of the experimental plots was carried out. The trial was laid out in a Randomized Complete Block Design (RCBD) with six treatments and four replications. The treatments were as follows: T1 - Coffee + C. odorata at 4.8 m x 4.8 m, T2 - Coffee + C. odorata at 4.8 m x 4.8 m but to be thinned to 4.8 m x
th9.6 m at 8 year, T3 - Coffee + C. odorata at 4.8 m x 9.6 m, T4 - Coffee + C. odorata at 4.8 m x th4.8 m but to be thinned to 9.6 m x 9.6 m at 8 year, T5 - Coffee + C. odorata at 7.2 m x 7.2 m
thand T6 - Coffee + Gliricidia sepium at 7.2 m x 7.2 m but to be thinned to 14.4 m x 14.4 m at 4 year (Control).The trial was located at Afosu.
The coffee plants did not show significant differences (P > 0.05) in girth and height between the treatments after 26 months in the field (Table 8.1). Similarly, there were no significant differences (P > 0.05) in the number of laterals and length of laterals of the coffee plants at 26 months after transplanting (Table 8.2). Percentage light transmitted through the canopies of
Cocoa Research Institute of Ghana Annual Report 2010-2011
123
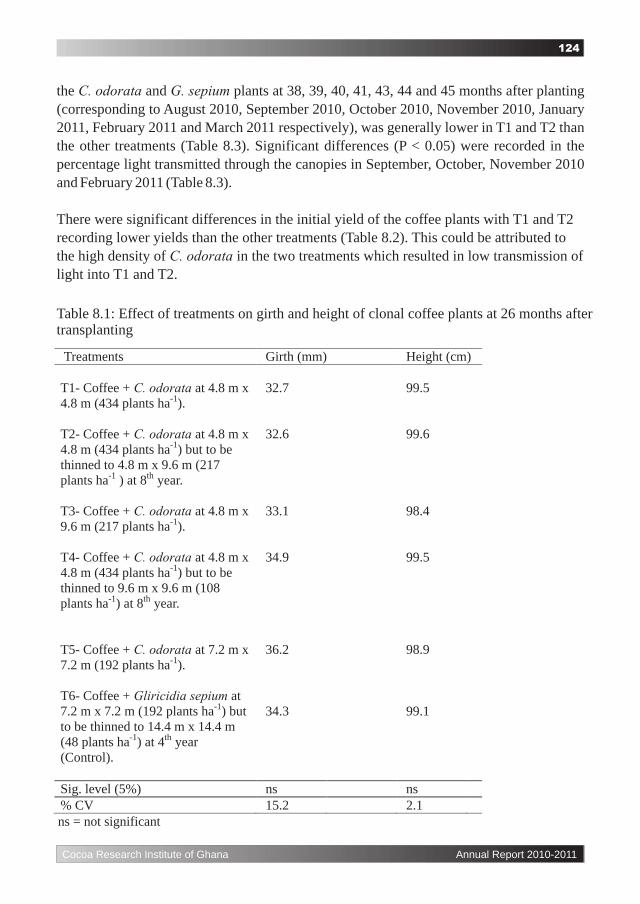
the C. odorata and G. sepium plants at 38, 39, 40, 41, 43, 44 and 45 months after planting (corresponding to August 2010, September 2010, October 2010, November 2010, January 2011, February 2011 and March 2011 respectively), was generally lower in T1 and T2 than the other treatments (Table 8.3). Significant differences (P < 0.05) were recorded in the percentage light transmitted through the canopies in September, October, November 2010 and February 2011 (Table 8.3).
There were significant differences in the initial yield of the coffee plants with T1 and T2 recording lower yields than the other treatments (Table 8.2). This could be attributed to the high density of C. odorata in the two treatments which resulted in low transmission of light into T1 and T2.
Cocoa Research Institute of Ghana Annual Report 2010-2011
Table 8.1: Effect of treatments on girth and height of clonal coffee plants at 26 months aftertransplanting
Treatments
Girth (mm)
Height (cm)
T1-
Coffee + C. odorata
at 4.8 m x 4.8 m (434 plants ha-1).
32.7
99.5
T2-
Coffee + C. odorata
at 4.8 m x 4.8 m (434 plants ha-1) but to be thinned to 4.8 m x 9.6 m (217 plants ha-1
) at 8th
year.
32.6
99.6
T3-
Coffee + C. odorata
at 4.8 m x 9.6 m (217 plants ha-1).
33.1
98.4
T4-
Coffee + C. odorata
at 4.8 m x
4.8 m (434 plants ha-1) but to be thinned to 9.6 m x 9.6 m (108 plants ha-1) at 8th
year.
34.9
99.5
T5-
Coffee + C. odorata
at 7.2 m x 7.2 m (192 plants ha-1).
36.2
98.9
T6-
Coffee + Gliricidia sepium
at 7.2 m x 7.2 m (192 plants ha-1) but to be thinned to 14.4 m x 14.4 m (48 plants ha-1) at 4th
year (Control).
34.3
99.1
Sig. level (5%)
ns
ns
% CV
15.2
2.1
ns = not significant
124

Cocoa Research Institute of Ghana Annual Report 2010-2011
Table 8.2: Effect of treatments on number of laterals and length of laterals of clonal coffee plants at26 months after transplanting and initial yield of coffee.
Treatments
Number of
laterals/plant
Mean length
Yield of
laterals/plant
hulled
(cm)
coffee
(kg/ha)
T1-
Coffee
+ C. odorata
at 4.8 m x 4.8 m (434 plants ha-1).
18.3
72.6
78.5
T2-
Coffee + C. odorata
at 4.8 m x 4.8 m (434 plants ha-1) but to be thinned to 4.8 m x 9.6 m (217 plants ha-1
) at 8th
year.
18.6
72.3
59.9
T3-
Coffee + C. odorata
at 4.8 m x
9.6 m (217 plants ha-1).
19.6
70.3
151.5
T4- Coffee + C. odorata at 4.8 m x 4.8 m (434 plants ha-1) but to be thinned to 9.6 m x 9.6 m (108
plants ha-1) at 8th
year.
18.9
75.6
167.1
T5-
Coffee + C. odorata
at 7.2 m x 7.2 m (192 plants ha-1).
20.7
81.4
213.6
T6-
Coffee + Gliricidia sepium
at 7.2 m x 7.2 m (192 plants ha-1) but to be thinned to 14.4 m x 14.4 m (48 plants ha-1) at 4th
year (Control).
20.0
80.6
194.7
Sig. level: L.s.d. (5%)
ns
ns
72.8
% CV
6.9
13.7
33.5
ns = not significant
125

Cocoa Research Institute of Ghana Annual Report 2010-2011
Table 8.3: Percentage light transmitted into treatment plots at monthly intervals.
Months
Treatments
August
2010
Sept.
2010
Oct.
2010
Nov.
2010
Jan.
2011
Feb.
2011
March
2011
T1-
Coffee + C. odorata
at 4.8 m x 4.8 m (434 plants ha-1).
21.7
32.4
30.3
32.6
62.6
45.7
74.1
T2-
Coffee + C. odorata
at 4.8 m x 4.8 m (434 plants ha-1) but to be thinned to 4.8 m x 9.6 m (217 plants ha-1
) at 8th
year.
22.6
35.1
25.9
21.4
53.1
54.1
61.8
T3-
Coffee + C. odorata
at 4.8 m x 9.6 m (217 plants ha-1).
35.8
53.5
55.9
43.0
63.2
82.0
70.9
T4- Coffee + C. odorata at 4.8 m x 4.8 m (434 plants ha-1) but to be thinned to 9.6 m x 9.6 m (108 plants ha-1) at 8th
year.
49.9
56.8
72.0
59.9
78.5
68.1
78.1
T5-
Coffee + C. odorata
at 7.2 m x
7.2 m (192 plants ha-1).
47.2
54.8
56.3
61.2
61.3
75.2
80.1
T6-
Coffee + Gliricidia sepium
at 7.2 m x 7.2 m (192 plants ha-1) but to be thinned to 14.4 m x 14.4 m (48 plants ha-1) at 4th
year (Control).
52.9
64.1
65.8
62.6
79.2
85.8
75.5
Sig. level: l.s.d. (5%)
ns
18.8
8.2
13.4
ns
13.5
ns
% CV
48.8
25.2
22.7
19.7
20.1
13.1
16.7
ns = not significant
Remarks
The initial yield data indicate although high initial density of Cedrela Odorata may not adversely affect the vegetative growth of coffee plants, the yield could be negatively affected.
126

Cocoa Research Institute of Ghana Annual Report 2010-2011
Investigating the productivity of coffee through the combined application of mulch,
fertilizers and weed control (K. Ofori-Frimpong, S. Acquaye, K. Opoku-Ameyaw, F.K. Oppong, M. K. Assuah, A.O. Dwapanyin, A. R. Cudjoe, V. Anchirinah and F. Owusu-Ansah).
The experimental detail of the above trial was presented in the 2009/2010 Annual Report (Rep. Cocoa Res. Inst. Ghana, 2009/2010). The investigation continued with routine maintenance of plots. The investigation was a split plot arranged in a randomized complete block design with four replications. The main plot factor was weed control with combination of mulch and fertilizer as subplot factor.
The treatments were as follows:
T1 - manual weed control
T2 - chemical weed control (CWC)
T3 - chemical weed control + coffee husk at 8 tonnes / ha
T4 - chemical weed control + fertilizer at 40g N: 20g P O : 40g K O / tree2 5 2
T5 - chemical weed control + coffee husk at 8 tonnes / ha + fertilizer at 40g N: 20g P O : 40g K O / tree2 5 2
T6 - chemical weed control + fertilizer at 60g N: 30g P O : 60g K O / tree2 5 2
T7 - chemical weed control + coffee husk at 8 tonnes / ha + fertilizer at 60g N: 30g P O : 60g K O / tree2 5 2
T8 - manual weed control + coffee husk at 8 tonnes / ha
T9 - manual weed control + fertilizer at 40g N: 20g P O : 40g K O / tree2 5 2
T10 - manual weed control l+ fertilizer 8 tonnes / ha + fertilizer at 40g N: 20g P O : 40g 2 5
K O / tree 2
T11 - manual weed control + fertilizer at 60g N: 30g P O : 60g K O / tree 2 5 2
T12 - manual weed control + coffee husk 8 tonnes / ha + fertilizer at 60g N: 30g P O : 2 5
60g K O / tree. The trial was located at Tafo and Afosu.2
127

At Tafo, soil amendments significantly affected both the length and number of laterals of coffee plants (Table 8.4). Plots receiving 60g N: 30g P O : 60g K O/tree produced shorter and 2 5 2
fewer number of laterals. There were however no significant difference between the chemical and manual weed control methods for the length and number of laterals.
Cocoa Research Institute of Ghana Annual Report 2010-2011
Table 8.4: Mean length of laterals (cm) and number of laterals of young coffee at 24 months aftertransplanting - Tafo
Treatments/Soil amendments
Mean length of
Laterals/plant (cm)
Mean Number of
laterals/plant
No soil amendments
75.0
55
Coffee husk at 8 tonnes/ha
85.6
71
40g N, 20g P2O5, 40g K2O/tree
88.3
70
Coffee husk at 8 tonnes/ha + 40g N, 20g P2O5, 40g K2O/tree 80.3
60
60g N, 30g P2O5, 60g K2O/tree 66.0 46 Coffee husk at 8 tonnes/ha + 60g N, 30g P2O5, 60g K2O/tree
78.8 61 Lsd at 5%
8.2
12
Weed control Manual
81.1
62
Chemical
76.9
58
Lsd at 5%
ns
ns
ns = not significant
At Afosu, stem girth differed significantly (p<0.05) between the soil amendments (Table 8.5). Plots receiving 40g N: 20 P2O5 K2O/tree had the lowest girth increment. At both Afosu, soil moisture in the dry season was not significantly different between the treatments (Table 8.6).
Treatments/Soil amendments
Girth (mm)
Height (cm)
No soil amendments
20.1
100.4
Coffee husk at 8 tonnes/ha
23.2
105.2
40g N, 20g P2O5, 40g K2O/tree
16.7 91.0
Coffee husk at 8 tonnes/ha + 40g N, 20g P2O5, 40g K2O/tree 30.5
100.0
60g N, 30g P2O5, 60g K2O/tree 20.3 102.4 Coffee husk at 8 tonnes/ha + 60g N, 30g P2O5, 60g K2O/tree 18.1 103.9 Lsd at 5% 10 ns Weed control
Manual
22.7
96.8
Chemical
20.3
104.2
Lsd at 5%
ns
ns
Table 8.5: Effects of treatments on coffee growth at 12 months after transplanting - Afosu
ns = not significant
128

Conclusion
Application of inorganic fertilizers alone to coffee seedlings seems to depress the growth of coffee stems weight at Afosu. Weed control treatments and soil amendments did not affect soil moisture content in the year under review.
Diversifying coffee cultivation through interplanting with fruit crops (K. Opoku-Ameyaw, F. K.Oppong, K. Ofori-Frimpong, A.R. Cudjoe, M.K. Assuah, V. Anchirinah and F. Owusu-Ansah).
The experimental detail of the above trial was presented in the 2009/2010 Annual Report (Rep. Cocoa Res. Inst. Ghana, 2009/2010). Routine maintenance was carried out on the trial plots in the reporting year. The trial was laid out in a Randomised Complete Block Design (RCBD) with four replications and six treatments. The treatments were as follows: T1 Sole coffee, T2 Coffee + coconut, T3 Coffee + avocado, T4 Coffee + citrus, T5 Coffee + pawpaw and T6 Coffee + pineapple. The trial was located at Bunso.
While intercropping significantly affected the girth of the coffee seedlings 6 months after transplanting, it had no effect on plant height (Table 8.7). The pawpaw established poorly and will have to be replanted.
Cocoa Research Institute of Ghana Annual Report 2010-2011
Table 8.6: Mean percentage soil moisture in Tafo and Afosu (December, 2010 – January, 2011)
Treatments/Soil amendments
% soil moisture (0-15cm depth)
Tafo
Afosu
No soil amendments
6.9
8.3
Coffee husk at 8 tonnes/ha
7.1
8.0
40g N, 20g P2O5, 40g K2O/tree
7.0
8.7
Coffee husk at 8 tonnes/ha + 40g N, 20g P2O5, 40g K2O/tree 7.4 8.4 60g N, 30g P2O5, 60g K2O/tree 7.4 8.4 Coffee husk at 8 tonnes/ha + 60g N, 30g P2O5, 60g K2O/tree 7.8 8.6 Lsd at 5% ns ns
Weed control
Manual
7.4
6.4
Chemical
7.1
6.0
Lsd at 5%
ns
ns
129

Effects of poultry manure and its combinations with cocoa pod husk ash on yield of
Robusta coffee (S. Acquaye, A. A. Afrifa, F. M. Amoah, V. Anchirinah, M. K. Assuah, J. E. Sarfo and F. Owusu Ansah).
The investigation commenced within the reporting period (i) to determine the biological effects and economics of the use of poultry manure alone or its combination with cocoa pod husk ash on Robusta coffee yield. The investigation was laid out in Randomized Complete Block Design (RCBD) with three replications and nine treatments. The treatments were as follows: T1 - Control (unfertilized), T2 - PM (5 tons/ha), T3 - PM (10 tons/ha), T4 - PM (15 tons/ha), T5 - PM (20 ton/ha), T6 - PM (5 tons/ha)
+ CPHA (200 kg/ha), T7 - PM (10 tons/ha) + CPHA (200 kg/ha), T8 - PM (15 tons/ha) + CPHA (200 kg/ha) and T9 - PM (20 ton/ha) + CPHA (200 kg/ha). The trial was located at Tafo and Afosu.
(Note: PM – poultry manure; CPHA - Cocoa Pod Husk Ash)
There was a vigorous growth of new shoots during the raining season. Three shoots were selected on each coppiced plant to serve as bearing stems for ensuing years.
Evaluation of foliar fertilizer formulations on yield of mature coffee (S. Acquaye, A. A. Afrifa, F. M. Amoah, V. Anchirinah, M. K. Assuah, A. R Cudjoe, F. Owusu Ansah and A. O. Dwapanyin)
The experimental detail of the above trial was presented in the 2009/2010 Annual Report (Rep. Cocoa Res. Inst. Ghana, 2009/2010). Routine plots maintenance continued. The trial
Cocoa Research Institute of Ghana Annual Report 2010-2011
Table 8.7: Effect of cropping system on the growth increment of coffee seedlings 6 months aftertransplanting
Cropping system
Girth increment (mm)
Height increment
(cm)
Sole coffee
1.1
5.3
Coffee + pawpaw
1.6
10.9
Coffee + coconut
1.5
5.8
Coffee + citrus 1.4 5.6 Coffee + avocado 1.2 5.7 Coffee + pineapple
1.9
6.3 Lsd
0.42
ns
%cv
13.4
31.6
ns- not significant at 5% probability
130

was laid out in a Randomized Complete Block Design (RCBD) with eight treatments replicated three times. The treatments applied/ha/yr were as follows: T1 - Unfertilized control, T2 - Soil NPK - 100kgN, 50kg P O , 100kg K O/ha, T3 – 1L Foliar NPK 20:2:4, T4 – 2 5 2
2L Foliar NPK 20:2:4, T5 – 1L Foliar NPK 10:10:10, T6 – 2L Foliar NPK 10:10:10, T7 – 1L Foliar NPK 6:0:20 and T8 – 2L Foliar NPK 6:0:20. The trial was located at Tafo.
Three shoots were selected to serve as bearing stems. No serious pest and disease incidence was observed.
Evaluation of foliar fertilizer formulations on growth and yield of coffee (S. Acquaye, A. A. Afrifa, F. M. Amoah, V. Anchirinah, M. K. Assuah ,A. R. Cudjoe, F. Owusu Ansah and A. O. Dwapanyin)
The trial continued with routine plots maintenance. The trial was laid out in a Randomized Complete Block Design (RCBD) with three replications. Twelve treatments applied/ha/yr were as follows: T1 - Unfertilized control, T2 - NPK - 100kgN, 50kg P O , 100kg K O/ha, T3 2 5 2
– 1L Foliar NPK 20:2:4, T4 – 2L Foliar NPK 20:2:4, T5 – 1L Foliar NPK 10:10:10, T6 – 2L Foliar NPK 10:10:10, T7 – 1L Foliar NPK 6:0:20, T8 – 2L Foliar NPK 6:0:20, T9 – 1L Foliar
NPK 13:1:12, T10– 2L Foliar NPK 13:1:12, T11 – 1L Foliar NPK 15:6:7 and T12 – 2L Foliar NPK 15:6:7. The trial was located at Tafo.
After 24 months of planting in the field, coffee plant height (Table 8.8) and stem girth (Table 8.9) were similar for the fertilizer treatments at each data recording date. With respect to plant height, the control performed better than all the other treatments except the NPK 13:1:12 (1L/ha) treatment. Treatment means were however, not significantly different. NPK 10:10:10 (1L/ha) treatment recorded the highest stem girth with NPK 15:6:7 (1L/ha) recording the lowest after 24 months of planting.
Cocoa Research Institute of Ghana Annual Report 2010-2011
131

Cocoa Research Institute of Ghana Annual Report 2010-2011
Table 8.8: Time-course of effects of fertilizer treatments on coffee plant height
Coffee plant height (cm)
Months after field planting
Treatment
0
3
6
9
12
15
18
21
24
Control
19.3
36.6
47.9
57.8
70.8
93.0
122.7
141.1
157.3
NPK
20.9
39.1
44.8
56.2
71.3
86.5
103.8
112.4
130.7
NPK 20:2:4 (1L/ha)
18.6
33.1
47.2
57.7
69.4 88.3
111.2
129.7
152.1
NPK 20:2:4 (2L/ha)
19.4
34.6
47.5
56.7
68.1 85.1
107.6
127.0
151.3
NPK 10:10:10 (1L/ha) 16.6 28.5 43.1 53.5 63.8 79.4 103.8 118.7 139.7
NPK 10:10:10 (2L/ha)
20.5 36.9 49.6 60.8 68.6 85.8 105.8 118.8 135.3 NPK 6:0:20 (1L/ha)
20.4
38.0
49.7
61.3
68.8 80.6
106.3
120.5
133.0
NPK 6:0:20 (2L/ha)
16.6
31.7
43.3
52.0
61.5 76.6
97.6
116.1
144.4
NPK 13:1:12 (1L/ha)
18.2
34.7
45.8
54.0
69.0
87.5
115.5
134.7
160.7
NPK 13:1:12 (2L/ha)
17.2
34.0
47.5
56.5
64.3
80.4
107.7
117.4
133.0
NPK 15:6:7 (1L/ha)
16.8
31.2
41.9
49.3
59.7
77.3
104.6
117.2
142.0
NPK 15:6:7 (2L/ha)
16.7
33.9
49.5
54.8
69.9
85.2
110.3
121.6
141.9
lsd (p≤ 0.05)
ns
ns
ns
ns
ns
ns
ns
ns
ns
ns = not significant
Table 8.9: Time-course of effects of fertilizer treatments on coffee plant girth
Coffee plant stem (mm)
Months after field planting
Treatment
0
3
6
9
12
15
18
21
24
Control
4.2
4.9
7.9
10.3
13.2
16.7
19.7
22.8
26.3
NPK
4.1
5.4
6.4
9.3
12.9
16.3
19.1
19.9
23.6
NPK 20:2:4 (1L/ha)
4.7
5.5
8.7
10.7
15.3 18.5
21.1
23.3
28.3
NPK 20:2:4 (2L/ha)
4.6
5.5
8.3
10.1
12.7 15.7
18.8
21.3
26.0
NPK 10:10:10 (1L/ha) 3.7 4.4 7.1 8.7 12.5 15.4 18.5 20.0 29.4
NPK 10:10:10 (2L/ha) 4.3 5.2 8.0 9.6 12.6 16.0 19.2 20.7 24.5 NPK 6:0:20 (1L/ha) 4.5 5.3 8.3 9.6 12.8 15.2 18.0 19.9 23.7 NPK 6:0:20 (2L/ha) 4.5 5.2 8.3 9.5 13.7 16.3 20.4 23.0 27.8 NPK 13:1:12 (1L/ha)
4.4
5.2
8.2
10.7
14.2 18.4
21.3
23.8
28.9
NPK 13:1:12 (2L/ha)
4.4
5.3
9.3
11.1
14.0 17.6
21.3
22.5
26.8
NPK 15:6:7 (1L/ha)
3.6
4.2
6.6
7.4
10.1
12.8
16.4
18.1
23.1
NPK 15:6:7 (2L/ha)
4.4
4.9
8.6
9.8
13.5
17.4
21.0
21.6
26.7
lsd (p≤ 0.05)
ns
ns
ns
ns
ns
ns
ns
ns
ns
ns = not significant
132

Conclusion
Application of foliar fertilizers did not significantly influence the growth of young plants
Cocoa Research Institute of Ghana Annual Report 2010-2011
133
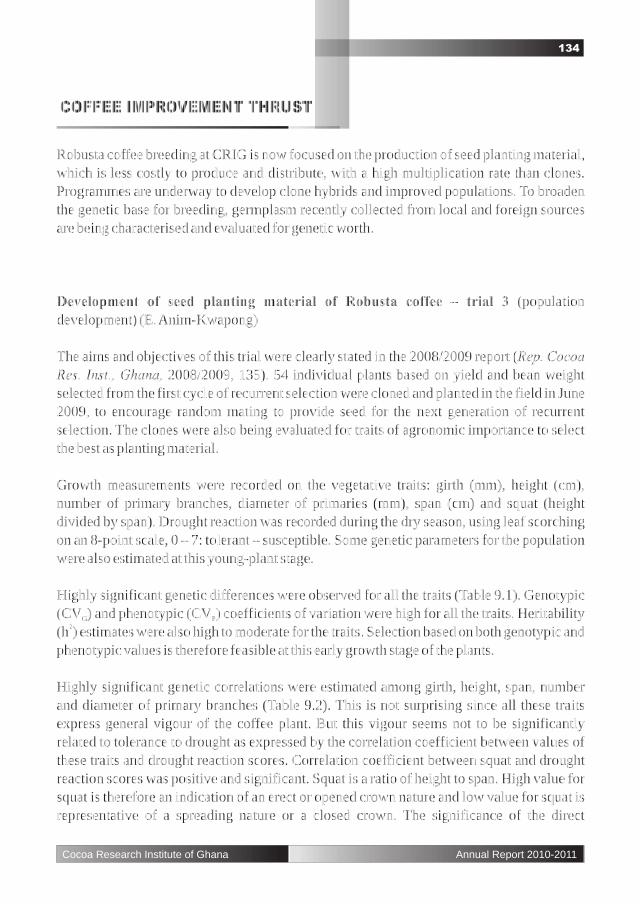
COFFEE IMPROVEMENT THRUST
Robusta coffee breeding at CRIG is now focused on the production of seed planting material, which is less costly to produce and distribute, with a high multiplication rate than clones. Programmes are underway to develop clone hybrids and improved populations. To broaden the genetic base for breeding, germplasm recently collected from local and foreign sources are being characterised and evaluated for genetic worth.
Development of seed planting material of Robusta coffee – trial 3 (population development) (E. Anim-Kwapong)
The aims and objectives of this trial were clearly stated in the 2008/2009 report (Rep. Cocoa
Res. Inst., Ghana, 2008/2009, 135). 54 individual plants based on yield and bean weight selected from the first cycle of recurrent selection were cloned and planted in the field in June 2009, to encourage random mating to provide seed for the next generation of recurrent selection. The clones were also being evaluated for traits of agronomic importance to select the best as planting material.
Growth measurements were recorded on the vegetative traits: girth (mm), height (cm), number of primary branches, diameter of primaries (mm), span (cm) and squat (height divided by span). Drought reaction was recorded during the dry season, using leaf scorching on an 8-point scale, 0 – 7: tolerant – susceptible. Some genetic parameters for the population were also estimated at this young-plant stage.
Highly significant genetic differences were observed for all the traits (Table 9.1). Genotypic (CV ) and phenotypic (CV ) coefficients of variation were high for all the traits. Heritability G P
2(h ) estimates were also high to moderate for the traits. Selection based on both genotypic and phenotypic values is therefore feasible at this early growth stage of the plants.
Highly significant genetic correlations were estimated among girth, height, span, number and diameter of primary branches (Table 9.2). This is not surprising since all these traits express general vigour of the coffee plant. But this vigour seems not to be significantly related to tolerance to drought as expressed by the correlation coefficient between values of these traits and drought reaction scores. Correlation coefficient between squat and drought reaction scores was positive and significant. Squat is a ratio of height to span. High value for squat is therefore an indication of an erect or opened crown nature and low value for squat is representative of a spreading nature or a closed crown. The significance of the direct
Cocoa Research Institute of Ghana Annual Report 2010-2011
134

association between squat and drought reaction shows that genotypes with opened crown are more susceptible to drought than their counterparts with closed crown.
Cocoa Research Institute of Ghana Annual Report 2010-2011
Table 9.1: Variation and heritability of vegetative traits at 15 months after field planting for fifty-fourgenotypes of Robusta coffee
Traits
Plot mean
P-value (%) CVP
(%)
CVG
(%)
h2
Girth
(mm)
15.8
0.1
26.0
10.5
0.32
Height (cm) 101 0.1 22.2 5.8 0.54
No. primaries 23 0.1 31.1 11.3 0.26 Diam. Primaries(mm) 3.8 0.1 20.5 9.0 0.38 Span (cm) 107 0.1 23.0 7.0 0.19 Drought reaction 3.19 0.1 33.6 14.1 0.35 Squat
0.96
0.1
18.7
9.7
0.53
Table 9.2: Genetic correlations among plant vegetative traits from 54 clones of Robusta coffee at 15months after field planting
1
2
3
4
5
6
1. Girth
-
2. Height
0.68***
-
3. No. primaries
0.65***
0.55***
-
4. Diameter of primaries
0.81*** 0.38**
0.36** -
5. Span 0.72*** 0.58*** 0.49*** 0.72*** -
6. Squat -0.10 0.63*** 0.14 -0.23 -0.26 -
7. Drought reaction -0.09 0.09 0.13 -0.16 -0.14 0.29*
* ** *** , , Significance at 0.05, 0.01 and 0.001 levels
Development of seed planting material of Robusta coffee – trial 4 (Hybrid development) (E. Anim-Kwapong)
The aims and objectives of this trial were also clearly stated (Rep. Cocoa Res. Inst., Ghana,
2008/2009, 135). Recording of data on important agronomic traits on the full-sib families continued this year.
Growth measurements were recorded on the vegetative traits: girth (mm), height (cm), number of primary branches, diameter of primaries (mm), span (cm) and squat (height
135

Cocoa Research Institute of Ghana Annual Report 2010-2011
divided by span). Drought reaction was recorded on an 8-point scale, 0 – 7: tolerant – susceptible as in trial 3. Similarly, some genetic parameters for the population were estimated.
Highly significant genetic differences were observed for all the traits (Table 9.3). Genotypic 2(CV ) and phenotypic (CV ) coefficients of variation were generally high. Heritability (h ) G P
estimates were also generally high to moderate. Selection based on both genotypic and phenotypic values is therefore feasible at this early growth stage of the plants.
Highly significant genetic correlations were estimated among girth, height, span, number and diameter of primary branches similar to what has been reported for trial 3 (Table 9.4). Significant and inverse genetic correlations were observed between drought reaction scores and the vegetative traits span and diameter of primary branches. Correlation coefficient between squat and drought reaction scores was positive. The direct association between squat and drought reaction in this trial tend to confirm the observation in trial 3 that genotypes with opened crown are more susceptible to drought than their counterparts with closed crown. The inverse association between drought reaction scores and span and diameter of primary branches also indicates that, plants with wider span and stronger primary branches are more drought-tolerant than their counterparts with smaller span and diameter of primary branches.
Table 9.3: Variation and heritability of vegetative traits at 15 months after field planting forforty-eight full-sib families of Robusta coffee
Traits
Plot mean
P-value (%)
CVP
(%)
CVG
(%)
h2
Girth(mm)
16.6
0.1
22.8
12.0
0.28
Height (cm)
100
0.1
21.5
11.2
0.27
No. primaries
17
0.1
34.0
20.5
0.36
Diam. Primaries(mm)
3.8
0.1
16.9
9.9
0.34
Span (cm) 97 0.1 28.3 15.2 0.29 Drought reaction 2.36 0.1 32.6 11.9 0.13 Squat 1.09 0.1 26.5 13.2 0.25
136

Table 9.4: Genetic correlations among plant vegetative traits from forty-eight full-sib families ofRobusta coffee at 15 months after field planting
1
2
3
4
5
6
1. Girth
-
2. Height
0.75***
-
3. No. primaries
0.84*** 0.65*** -
4. Diam. of primaries 0.81*** 0.65*** 0.62*** -
5. Span 0.75*** 0.63*** 0.69*** 0.79*** - 6. Squat -0.33*
0.10 -0.32*
-0.48***
-0.65***
- 7. Drought reaction
-0.20
-0.22
-0.01
-0.36*
-0.34*
0.19
* ** *** , , Significance at 0.05, 0.01 and 0.001 levels
Characterisation, evaluation and conservation of local coffee germplasm (E. Anim-Kwapong, G.J. Anim-Kwapong, R. Adu Acheampong, I. Amoako-Attah, S.T. Lowor and F. Owusu-Ansah).
The aims and objectives of this trial were also clearly stated (Rep. Cocoa Res. Inst., Ghana,
2009/2010). One hundred and ninety accessions from six localities in Ghana were planted in June 2010 at each of two locations, namely: Tafo and Afosu. Planting was done using a 14 x 14 lattice square design with three replications and five plants per accession per replication.
Data on survival percentage, reflecting success of establishment, was recorded for Tafo and Afosu nine months after field planting. At Tafo (Table 9.5), percent survival ranged from average of 91.3 % in accessions from Bepong to 96.8 in accessions from Bodi, compared with a mean survival percentage of 95.7.
Table 9.5: Mortality rate for 190 accessions collected from six sites recorded in March 2011 at Tafo
Collection site
No. accessions
Total planted
Total dead/ (% dead)
Bibiani
31
465
17 (3.7)
Manso Mim 38 570 22 (3.9) Brofoyedru 40 600 20 (3.3) Bodi 40 600 19 (3.2) Bepong 13 195 16 (8.2) Kenyasi 28 420 29 (6.9) Total
190
2850
123 (4.3)
Cocoa Research Institute of Ghana Annual Report 2010-2011
137

Cocoa Research Institute of Ghana Annual Report 2010-2011
Percent survival of the accessions at Afosu ranged from 86.7 in accessions from Bepong to 96.5% in accessions from Bodi compared with a mean survival percentage of 92.9 (Table 9.6). Survival of the plants at Afosu was lower than that at Tafo. This is not surprising as Afosu experienced a much severe drought over the period than Tafo. Similar trend in survival rate of the accessions was observed for the two locations, with accessions in Bepong recording lower survival rate than those from Bodi.
Table 9.6: Mortality rate for 190 accessions collected from six sites recorded in March 2011 at Afosu
Collection site
No. accessions
Total planted
Total dead/ (% dead)
Bibiani
31
465
54 (11.6)
Manso Mim
38
570
29 (5.1)
Brofoyedru
40
600
40 (6.7)
Bodi
40
600
21 (3.5)
Bepong 13 195 26 (13.3) Kenyasi 28 420 33 (7.9) Total 190 2850 203 (7.1)
138

COFFEE PESTS AND DISEASESMANAGEMENT THRUST
The thrust had only one ongoing research project to investigate into potentials of pathogens associated with the coffee berry borer, Hypothenemus hampei (Ferrara) (Coleoptera: Scolytidae). The pestilence of the coffee berry borer was a universal problem and its occurrence on coffee in Ghana was extremely important. Coffee plantations were surveyed and collections were made for insectary and laboratory studies. Cadavers of H. hampei, live insects, berries infested with H. hampei and dead insects other than H. hampei were the main samples collected. Out of a total of 1,050 insects collected from coffee fields during the period under review, 350 were collected dead while 700 live insects were reared in cages till they died. Incubation of the cadavers gave 74 % positive fungal sporulation. Fusarium spp, Aspergillus flavus, Beauveria bassiana, Penicillium digitatum and Hemileia vestatrix were isolated and identified from specimens collected and incubated for pathogen growth. They occurred at the following percentages: Fusarium spp (19%); Aspergillus flavus (32%); Beauveria bassiana (10%); Hemileia vastatrix (13%); Penicillium digitatum (19%) and unidentified fungus (7%). Hemileia vastatrix was identified as the fungus which causes the coffee rust disease. Further investigations were ongoing to obtain a pathogen for formulation of a myco-insecticide to control the berry borer.
Investigations into pest control potentials of pathogens associated with the coffee berry borer, Hypothenemus hampei (Ferrara) (Coleoptera: Scolytidae) (G. K. Awudzi, A. R. Cudjoe, M. K. Assuah, F. Owusu–Ansah)
The aim of the investigation is to identify pathogens associated with the coffee berry borer, Hypothenemus hampei (Ferrara) and explore the possibility of using such pathogens to manage the pest. Coffee plantations were surveyed and the following collections made for insectary and laboratory studies; cadavers of H. hampei, life insects, berries infested with H. hampei and dead insects other than H. hampei. Insects that were alive at the time of collection were reared in cages at the insectary, monitored till they die and incubated for possible emergence of pathogen. Cadavers of insects collected from coffee fields surveyed were surface sterilized with 5% sodium hypochlorite and 75% ethanol solution and washed with sterile distilled water (SDW). The cadavers were then left to dry for 48 hours and incubated on moistened sterile filter paper in Petri dishes and observed for growth of fungal pathogens. Growths originating from the specimens were sub-cultured and further incubated for sporulation on Potato Dextrose Agar (PDA) as described by Poinar and Thomas (1984). Identification of fungal isolate was done as described by the International Mycological Institute (IMI, 1983). The incidence of the isolates was recorded. 10µl of three different concentrations (2,000, 3,000 and 4,000 spores/ml) of aqueous suspension of the pathogen were dropped on each of the ten adult insects in Petri dishes lined with sterile filter paper, covered and kept for fungal growth. Ten adult insects were inoculated with SDW as control.
Cocoa Research Institute of Ghana Annual Report 2010-2011
138a

Cocoa Research Institute of Ghana Annual Report 2010-2011
The set up was replicated 10 times. Out of a total of 1,050 insects collected from coffee fields during the period under review, 350 were collected dead while 700 life insects were reared in cages till they died. Incubation of the cadavers gave 74 % positive fungal sporulation. Fusarium spp, Aspergillus flavus, Beauveria bassiana, Penicillium digitatum and Hemileia vastatrix were isolated and identified from specimens collected and incubated for pathogen growth. They occurred at the following percentages: Fusarium spp (19%); Aspergillus flavus (32%); Beauveria bassiana (10%); Hemileia vastatrix (13%); Penicillium digitatum (19%) and unidentified fungus (7%). Hemileia vastatrix was identified as the fungus which causes the coffee rust disease.
138b
Table 9.6a: Identification of entomopathogenic fungiIsolates
Growth Morphology
Colour
Phialides
Spores
Probable Organism
A
Sparse to abundant mycelium, wrinkled in old culture
White or peach
Simple lateral
Oval, cylindrical to straight micro conidia
Fusarium sp
B
Fasting growing and heavy sporing
Dirty green
Typically radiate
Typically globose to sub-globose
Aspergillus flavus
C
Powdery mycelia
White or pale yellow
Clustered globular to flask shaped conidia
Beauveria bassiana
D
Restricted and thin growth on synthetic media. Rapid, plane velvety growth on malt agar.
Dull yellow to grayish olive with age
Few in number
Smooth sub-globose to cylindrical but usually elliptical conidia.
Penicillium digitatum
E
Dense
sporangiosphores
Ash
Not seen
Not seen
Unknown fungus

Cocoa Research Institute of Ghana Annual Report 2010-2011
Aspergillus flavus, Penicillium digitatum and Fusarium sp were saprophytic, hence were not used for the bio-efficacy test. Insects treated with 2,000 and 3,000 spores/ml died within 5 days and had 50% fungal growth after two week of incubation of cadaver. Insects infested with the fungus suspension with spore concentration of 4,000 spore/ml died within 3 days with 75% fungal growth after two week of incubation of cadaver. Fungus growths on cadavers were identified to be Beauveria bassiana, the fungus used for the artificial inoculation.
In conclusion, Beauveria bassiana isolate tested were effective on the coffee berry borer. There was therefore the need to produce spores of the isolate in quantities that could be used in a small scale field trial.
138c
Fig. 7.4a: Incidence of entomopathogenic fungi isolated from incubated cadavers.

KOLA DEVELOPMENT THRUST
The kola introductions made in the year 2007 into the germplasm collection did not differ significantly from each other in girth size over ten months of observation. Yield of individual accessions in the progeny trials were generally high with mean yield around 1409Kg/Ha. Again significant differences observed in yield could be attributed to genotypic effect. In the young clonal trial, it was observed that ease of establishment depends on size. i.e the larger the girth size the better the establishment. Micro propagation of floral buds and immature embryo were also carried out during the year under review. It was realised that immature embryo performs better in media supplemented with GA hormone than the floral 3
buds.
Germplasm collection (A. Akpertey, G. J. Anim-Kwapong, A. A. Dadzie, F. M. Amoah, I. Y. Opoku and J. E. Sarfo)
The objectives of the Germplasm collection have been reported in (Rep. cocoa Research
Inst., Ghana, 1996/1997, 187). No new introductions were made into the genebank during the year under review. However, evaluation of clonal materials introduced in the year 2007 continued. Data analysis of both girth and height of the materials introduced were not significant at six and ten months after planting. See table 1.
Cocoa Research Institute of Ghana Annual Report 2010-2011
139

Cocoa Research Institute of Ghana Annual Report 2010-2011
Clone
Girth (mm)
Height (cm)
6months
12
months
6 months
12
months
AMGK I
13.93
18.56
69.74
79.23
AMSA I 13.65
17.30
73.09
78.50
AMOO I
13.29
16.78
52.08
57.24
AMKO
12.32
13.61
48.57
56.52
AMOO II
12.30
16.73
59.97
68.03
AMKA I 12.17
16.60
47.87
56.78
AMAM 12.11
14.38
57.65
66.16
AMGK II
11.27
12.55
42.42
59.18
AMGK III
11.11
14.56
68.66
78.20
AMKA II
11.11
16.18
52.97
63.36
AMSA IV 10.57 12.45 53.02 64.83
AMAP 9.86 14.71 52.53 55.82
AMSAII
9.49
13.46
58.64
63.82
Average
11.78
15.22
56.71
65.21
Range
9.49-13.93
15.22-18.56
56.71-69.74
65.21-79.23
Lsd (P<
0.05)
ns
4.60
18.16
ns
Table 1: Girth and Height measurements of kola clones at six and ten months after Planting
Kola progeny trials (A. Akpertey, G. J. Anim-Kwapong, A. M. Dadzie, F. M. Amoah, K. Ofori-Frimpong, I. Y. Opoku, J. E. Sarfo and F. Aneani)
The experimental detail of the above trial was presented in the 2008/2009 Annual Report (Rep. Cocoa Res. Inst. Ghana, 2008/2009, 142-144). The Kola progeny trial seeks to provide an in-depth information on kola yield, sterility and gestational cycles. Data analysis of 36 genotypes showed significant differences in yield among the genotypes evaluated. Net yield ranged between 465 – 2067 kg/ha with cross JX1/24 x JX1/22 being the highest yielding line during the crop year. Cross JX1/9 x JX1/11 recorded the highest weight per nut and also recorded a relatively high yield of 1723 kg/ha. See table 2
140

Table 2: Yield and yield components for year 2009/10 of kola progenies planted at Bunso
Cocoa Research Institute of Ghana Annual Report 2010-2011
Cross
Yield (kg/ha)
Average no. of trees/plot
Total pods harvested
Weight/nut (g)
JX1/5xJX1/9
1679
5.0
524
15.7
B1/296xB1/177
1627
5.0
552
17.6
B2/177xB2/156
1873
5.0
612
15.6
JX1/23xJX1/53
1716
5.0
583
15.8
JX1/17xJX1/9
1676
5.0
436
16.7
B1/11xB1/71
1457
5.0
583
13.7
B1/149xB1/151
1261
5.0
958
13.7
JX1/9xJX1/11
1723
5.0
498
18.7
JB1xA2
1254
5.0
573
15.7
B1/142xB1/151
1990
5.0
610
15.3
GX1/46xGX1/53
1978
5.0
471
18.0
GX1/46xGX1/16
1582
5.0
656
17.2
GX1/46xGX1/33
1800
5.0
578
16.4
B1/149xB1/180 1376 5.0 449 14.7
B1/236xB1/276 980 5.0 411 16.2 JX1/24xJX1/22
2067
5.0
560
16.4
B1/212xB1/210
1420
5.0
556
15.8
B1/209xB1/39
1785
5.0
670
14.4
CLUBxJB32
1841
5.0
485
17.2
B1/120xB1/193
1269
5.0
432
15.1
JX1/14xJX1/32
1309
5.0
388
17.7
JX1/17XJX1/5
1576
5.0
554
16.3
B1/211xB1/209
1229
5.0
419
16.3
B1/151xB1/147
1534
5.0
676
14.9
141

Table 2: Yield and yield components for year 2009/10 of kola progenies planted at Bunso (continued)
Cocoa Research Institute of Ghana Annual Report 2010-2011
B1/151xB1/149
1603
5.0
585
18.3
B1/151xB1/180
1134
5.0
354
15.3
B1/271xB1/200
1484
5.0
435
15.1
CLxBX1/441
1465
5.0
384
14.5
B1/208xB1/39
465
5.0
180
15.7
A2xJB1
1061
5.0
397
14.3
B1/208xB1/180
942
5.0
472
15.2
B2/218xB2/177
842
5.0
301
15.8
CLxJB1
958
5.0
262
16.0
JX1/7xJX1/53 1260 5.0 391 15.6
CLUBxW25 1051 5.0 230 16.3
CLUBxA2
476
5.0
121
17.0
Average
1409
5.0
482
15.9
Range
465-2067
3.0-5.0
121-958
13.7-18.7
Lsd (P<
0.05)
858.6
0.85
ns
ns
Kola clonal trial (A. Akpertey, G. J. Anim-Kwapong, A. M. Dadzie, F. M. Amoah, K. Ofori-Frimpong, I. Y. Opoku, J. E. Sarfo and F. Aneani)
The experimental detail of the above trial was presented in the 2008/2009 Annual Report (Rep. Cocoa Res. Inst. Ghana, 2008/2009, 145). Sixteen kola clones assessed for vigor and precocity showed significant differences among the clones evaluated. The average girths of the clones at six and ten month after planting were 8.49mm and10.14mm respectively. Table 3.
142

Cocoa Research Institute of Ghana Annual Report 2010-2011
Table 3: Girth and height of kola clones six and ten months after planting
Clone
Girth (mm)
Height (m)
6 months
10 months
6 months
10 months
A1
8.84
9.9
0.41
0.49
A10
9.47
10.72
0.43
0.48
A10/JB26
7.95
9.17
0.35
0.38
A12
7.75
9.78
0.34
0.43
A2
9.34
11.14
0.48
0.57
A2/A12
8.59
9.80
0.47
0.58
A22
8.83
10.87
0.37
0.48
A22/JB32
7.18
8.98
0.30
0.41
B1/22
10.02
11.87
0.51
0.61
B1/243 9.03 10.47 0.36 0.43
CLUB 9.71 11.37 0.55 0.64 JB17
8.25
10.12
0.31
0.37
JB26
5.99
7.84
0.30
0.42
JB27
7.19
8.76
0.37
0.47
JB3
9.55
11.12
0.44
0.52
JB32
8.47
10.36
0.39
0.46
Average
8.49
10.14
0.39
0.48
Range
7.18 -
10.02
7.84 -
11.87
0.3 -
0.55
0.37 -
0.58
Lsd (P<
0.05)
1.19
1.58
0.07
0.10
143

Cocoa Research Institute of Ghana Annual Report 2010-2011
Evaluation of budding and tissue culture technique for the propagation of kola (cola
nitida) in Ghana. (A. Akpertey, G. J. Anim-Kwapong, A. M. Dadzie, F. M. Amoah, K. Ofori-Frimpong, I. Y. Opoku, J. E. Sarfo and F. Aneani)
The objective of this project is:1. To develop, evaluate and improve modern and conventional method of propagating
kola (cola nitida).2. To provide farmers with the appropriate technological packages for kola budding.
Two main trials were carried out to assess 1. The effect of rootstock age on budding success.2. Propagation of kola by tissue culture.
Inflorescence and vegetative shoots were used as source of scions for the study. No significant differences were observed among the scions used. See table 4Micro propagation of floral buds and immature embryo showed that immature embryo performs better in media supplemented with GA hormone than the floral buds. Table 53
Table 4: Effect of rootstock age on success and growth of grafted kola seedlings.
Percentage “take”
Scion
A1 A12 JB1
Rootstock age (months) Average
Six 55.0 55.0 62.5 57.5 Eight
35.0
85.0
60.0
60.0
Ten
47.5
60.0
52.5
53.3
Twelve
65.0
65.0
77.5
69.2
Average
50.6
66.3
63.1
Lsd (P<
0.05)
ns
ns
ns
Scion
10.9
Scion*rootstock age
21.8
144

Cocoa Research Institute of Ghana Annual Report 2010-2011
Table 5: Callus characteristics of kola explants after 6 weeks of culturing
Explant
No. of explants in culture
No. of callus formed
Callus morphology
Callus type
% Callogenesis
No. contaminated
Leaves 50 10 Brown Friable 20 40
Embryo 50 30 Brown Friable 60 20
145

SHEA AND CASHEWDEVELOPMENT THRUST
Covering the propagating bin with a two layer white polythene sheet lid gave better rooting and reduced leaf drop. Higher success was achieved when semi-hardwood scions were grafted onto rejuvenated shoots and young plants.The absence of any significant adverse effect of intercropping on early yield of cashew indicates that cashew farms can be intercropped with yam and maize to enhance establishment and generate income to partially offset the cost of establishment. Confidor appears to give better protection to cashew trees than Akate-Master and Actara in the first year of insecticide application. Somatic embryos were induced from immature cotyledon explants following the transfer of embryogenic callus from M1 medium containing 0.1 mg/l and 0.01mg/l X to M1 medium without growth regulators after four weeks in darkness. Stamens and petal explants were the most responsive to M3 having % embryogenic calli means of 57.3% and 46.7% respectively, whereas ovaries were the most responsive explants to M1 medium with % embryogenic calli mean of 62.3%. But following transfer into their corresponding M1, M2 and M3 medium without growth regulators no embryo induction occurred.
Carlit Express and Ridomil Gold may be applied to control leaf blight disease of cashew. Gamma ray dose beyond 200Gy is 100% lethal to shea seeds. Also, radicle emergence may not be suitable for the determination of radio-sensitivity of shea seeds. Plumule emergence could be used for the determination of LD50 for shea seeds. From the results of this study, the LD50 for shea seeds was estimated to be 65Gy and could be used for mass irradiation of shea seeds for breeding programmes. Considerable variation was apparent among the Benin and the local accessions in terms of yield. The Benin and the local accessions at Wenchi performed better than those at Bole. Tentatively, it can be concluded that the Benin accessions (exotic) have a higher yield potential than the local ones.
No significant interaction effect for girth and height in the two locations was observed but the most vigorous genotypes were BE 575 in Bole and SG 266 in Wenchi. The low girth and height increases recorded among the genotypes in Bole may reflect the response of the genotypes to the low rainfall, humidity and high temperatures in the Guinea savanna zone.
There is the potential to add value to shea fruit pulp through the production of jam and possibly wine and vinegar. No significant effect of poultry manure and cow dung at the diferrent application rates on plant girth , height and number of leaves per plant were observed at three months after transplanting. There was a significant variation in the initial cashew nut yield. It may be too early to ascribe this significant difference to the effects of the soil amendments. Poultry manure or cow dung did not significantly influence plant growth parameter. It is early to observe any significant effects of organic manures on cashew nut
Cocoa Research Institute of Ghana Annual Report 2010-2011
146

yield. Some foliar fertilizer formulations could improve cashew nut yield but the practice is not economically viable. The interactive effects of fertilizers and their application periods significantly influenced cashew nut yield as the application of larger amounts of fertilizers at transplanting (0 month) resulted in significantly higher cashew nut yield than when fertilizers were applied at 6, 12 and 18 months after transplanting. Application of fertilizer in cashew is uneconomical and may result in huge losses.
The survival and growth vigour of seedlings raised six weeks before transplanting was higher than those raised for eight weeks and confirms earlier recommendation of transplanting cashew seedlings at six weeks after sowing. Smaller bag size increases survival of transplants, eases transportation and reduces volume of potting media thereby reducing cost than bigger bags.
Halving of leaves, pruning of roots and halving of leaves alongside root pruning could be used as pre-planting treatment to improve the survival of over-aged cashew seedlings aged beyond five months. Cashew seedlings below five months can be planted directly in the field without any pre-treatment. Stripping of leaves is the worst pre-treatment for over-aged cashew seedlings.
Sheanut tree improvement project (J. Yeboah, F. M. Amoah, A. Akrofi, M. Assuah and S. T. Lowor)
The experimental detail of the above trial was presented in the 2008/2009 Annual Report (Rep. Cocoa Res. Inst. Ghana, 2008/2009, 146-147). Analysis of the results showed significant interaction between the thickness of the white polythene sheet and hormone application on rooting, roots developed and leaf drop. Three layer of polythene sheet did not improve rooting with application of hormone. One and two layers of polythene sheet though improved rooting in the presence of hormone, were not significantly different (Tables 12.1). Two and three layers of polythenen sheet produced more roots with the application of hormone (Table 12.2). The highest number of leaf drop on cuttings was recorded by the one-layer of polythene sheet with application of hormone while the two and three layers of polythene gave the lowest number of leaf drop though there were not significantly different.
Cocoa Research Institute of Ghana Annual Report 2010-2011
147

Cocoa Research Institute of Ghana Annual Report 2010-2011
Table 12.1: Effect of poly sheet thickness and type of hormone on % rooting of stem cuttings
Hormone
Type
(%)
Poly
sheet thickness
Control
Seradix powder
Mean
One layer
20.0 (18.0)
60.0 (57.6)
(37.8)
Two layers
46.7 (48.0)
69.5 (71.5)
(59.3)
Three layers 30.0 (28.0) 30.0 (28.2) (28.1) Mean (31.3) (52.4)
Lsd (p=0.05) - Poly sheet thickness x Type of Hormone = (24.4) Numbers in parenthesis are angular transformed values
Table 12.2: Effect of poly sheet thickness and type of hormone on roots developed on rooted cuttings
Hormone
Type
(%)
Poly
sheet thickness
Control
Seradix powder
Mean
One layer
15.0
20.7
17.9
Two layers
14.0
23.0
18.5
Three layers 20.0 22.0 21.0 Mean 16.3 21.9
Lsd (p=0.05) - Poly sheet thickness x Type of Hormone = 3.3
Table 12.3: Effect of poly sheet thickness and type of hormone on % leaf drop of stem cuttings Hormone
Type
(%)
Poly sheet thickness
Control
Seradix powder
Mean
One layer
40.0 (45.0)
72.0 (71.3)
(58.2)
Two layers 30.0 (27.2) 33.0 (32.2) (29.7) Three layers 10.0 (13.3) 20.0 (18.0) (15.7) Mean (28.5) (40.5)
Lsd (p=0.05) - Poly sheet thickness x Type of Hormone = (24.7) Numbers in parenthesis are angular transformed values
Application of top working techniques for shea in Ghana (J. Yeboah, K.O. Ameyaw, A. A. Oppong Dwapanyin, E. A. Dwomoh, M. Assuah and F. Owusu-Ansah)
The experimental detail of the above trial was presented in the 2008/2009 Annual Report (Rep. Cocoa Res. Inst. Ghana, 2008/2009, 147-149). Analysis of the grafting success data shows significant (p<0.05) interaction between scions of different physiological age and grafting stocks. While semi-hardwood scions show higher success on both rejuvenated shoots (70%) and young plants (70%), softwood scions recorded a higher success on suckers (60%) (Table 12.4). Hardwood scions on the other hand recorded the lowest success for all
148

the grafting stock with the exception of rejuvenated shoots which was slightly (though not significant) higher than the softwood. There were no significant main interaction effects of scions of different physiological ages and grafting stock on dormant grafts at the end of the experiment. The mean dormant grafts (Table 12.5) for scion was 37.8 whilst that for the rootstock was 39.8.
Cocoa Research Institute of Ghana Annual Report 2010-2011
Table 12.4: Effect of physiological age of scion and type of rootstock on success of graft unionformation
Physiological
age of scions
Type
of
rootstock
Mean
Rejuvenated shoots
Seedlings
Young plants
Suckers
Softwood
47.7 (45.4)
50.0 (54.9)
47.7 (50.0)
60.0 (65.0)
(53.8)
Semi-hardwood 70.0 (72.3) 54.0 (56.9) 70.0 (69.9) 50.0 (33.2) (58.6) Hardwood 45.0 (46.7) 40.0 (37.3) 30.0 (34.0) 20.0 (23.0) (35.3)
Mean
(54.8)
(49.7)
(51.3)
(40.4)
Lsd (p=0.05) - Physiological age of scion x Type of rootstock = (21.7) Numbers in parenthesis are angular transformed values
Table 12.5: Main effect of age of scion of different physiological age and type of grafting stocks ondormant grafts
Treatment factor
Dormant grafts
Softwood
39.0 (42.8)
Semi-hardwood
32.5 (36.8)
Hardwood
42.0 (40.7)
Mean
CV
37.8
28%
Rootstocks Rejuvenated shoots 30.0Seedlings 45.0Young plants 42.0Suckers 42.1Mean 39.8 CV 23%
149

The effect of spacing on the growth and yield of cashew (K. Opoku-Ameyaw , F.M. Amoah, J. Yeboah, K. Ofori-Frimpong, M.K. Assuah, E.A. Dwomoh)
The trial had just commenced.
Cashew intercropping during establishment (K. Opoku-Ameyaw , F. K. Oppong, F, M. Amoah J. Yeboah, K. Ofori-Frimpong, M. K. Assuah, E.A. Dwomoh)
The experimental detail of the above trial was presented in the 2008/2009 Annual Report (Rep. Cocoa Res. Inst. Ghana, 2008/2009, 155-157).
Similar to the previous years, cashew yield during the year under review was not significantly affected by treatments (Table 12.8). This indicates that food crop intercropping during establishment did not have any residual effect on cashew yield. Economic analysis of the cropping systems performed earlier in the trial (2005-2007) showed the maize and yam intercrops to be profitable producing on average net benefits of Gh¢ 302.53 and Gh¢ 501.4,
respectively. Since these combinations in some cases produced slightly higher cumulative cashew yields than the sole cashew, they are the best options for farmers who would want to engage in cashew cultivation.
Cocoa Research Institute of Ghana Annual Report 2010-2011
Table 12.8: Effect of cropping system on the first four years' yield of cashew nuts at Bole
Cropping system
Cashew yield (kg/ha)
2008
2009
2010
2011
Cumulative
Sole cashew 70.8 149.5 (21.5) 96.6 (29.4) 157 (36.00 473.9 Cashew + groundnut 71.0 161.6 (10.6) 123.5 (32.4) 111 (52.0) 467.1 Cashew + maize 51.8 104.3 (20.8) 98.1 (33.7) 166 (56.0) 420.2 Cashew + sorghum 55.5 145.5 (36.2) 120.7 (16.1) 168 (49.0) 489.7 Cashew + yam 80.3 168.5 (10.5) 165.0 (68.3) 121 (16.6) 534.8 Cashew + sorghum/groundnut 74.9 161.3 (28.7) 88.7 (16.9) 122 (12.1) 446.9 Cashew + groundnut/maize
80.8
154.3 (59.7)
138.0 (51.5)
142 (3.6)
515.1
Sig. level
ns
n.s
Ns
ns
Values in parentheses are standard errors of the meansns- not significant at 5% probability
150

Studies on the population dynamics of the stem borer, Apate telebrans (Coleoptera:
Bostrichidae) on cashew and its control (E. A. Dwomoh, A. R Cudjoe, M. K. Assuah, F Aneani and F. Owusu-Ansah).
The experimental detail of the above trial was presented in the 2008/2009 Annual Report (Rep. Cocoa Res. Inst. Ghana, 2008/2009, 160-163).
The effects of Akate-Master, Actara and Confidor on borer infestation in cashew plantations are given in Table 12.6. Water (control) treated trees recorded the largest borer infestations in all the months. Confidor treated trees, however, recorded a significantly (P<0.05) lower borer infestation compared to that of the control in all the months. In December, January and February, mean numbers of infested trees in the control plantation were 6, 2 and 2 times, respectively, greater than those recorded in plantations treated with Confidor.
Cocoa Research Institute of Ghana Annual Report 2010-2011
Table 12.6: The effects of Akate-Master, Actara and Confidor on borer infestation on cashew(December- February 2011)
Mean borer entry holes in
Treatment
December
January
February
Akate-Master
0.8 ± 0.2
1.6 ± 0.3
1.1 ± 0.2
Actara 0.6 ± 0.2 1.5 ± 0.1 1.0 ± 0.2 Confidor 0.2 ± 0.1 0.7 ± 0.2 0.5 ± 0.2 Control
1.2 ± 0.3
1.7 ± 0.3
1.3 ± 0.2
LSD(P=0.05)
0.4
0.6
0.4
Investigations into pest control potentials of entomopathogens associated with the
major sap-sucking pests of cashew (Anacardium occidentale L.) in Ghana. (E. A. Dwomoh, R. Adu-Acheampong, I. Amoako-Atta, F. Aneani, Mercy Asamoah, F. Owusu-Ansah, Winifred O. Kumi, C.K. Agyente-Badu) Trial just commenced there is therefore no data available.
Development of in- vitro propagation technique for shea (P. K. Adu-Gyamfi, S.Y. Opoku, M. A Dadzie, S. T. Lowor and F. Owusu-Ansah) The experimental detail of the above trial was presented in the 2008/2009 Annual Report (Rep. Cocoa Res. Inst. Ghana, 2008/2009, 153-155). Significant differences (p< 0.05) among treatments (PGR mg/l) were observed for the percentage of embryogenic calli produced. Immature cotyledon explants became swollen and produced whitish to yellowish
151

Cocoa Research Institute of Ghana Annual Report 2010-2011
embryogenic callus at the cut ends after two weeks of inoculation on M1 and M2 media in both light (16hrs) and dark conditions. Explants cultured on M1 containing 0.1mg/l Y + 1.0 mg/l X in light produced the highest embryogenic callus (98%) whereas in dark condition 0.2mg/l X produced the highest embryogenic callus (88.9%) (Table 12.10). No callus (0%) was induced on 1mg/l Y + 0.01mg/l X in both light and dark conditions, instead, greenish, opaque embryos were induced directly without callus development. Somatic embryos were induced following the transfer of embryogenic callus from M1 medium containing 0.1 mg/l and 0.01mg/l X to M1 medium without growth regulators after four weeks.
In M2 no embryo induction occurred, only root proliferations and formation of nodular structures were observed in some of the treatments. Significant interaction effects were also observed among treatments in both light and dark conditions in M2 medium but not in M1 medium. M2 media containing 0.1mg/l X produced the highest embryogenic callus in light whereas 1mg/l Y + 1mg/l X medium in dark produced the highest embryogenic callus. The induction of embryogenic calli in M1 medium was also generally higher in light (mean 63.0 %) than in dark conditions (mean 60.7 %) whereas in M2 it is the vice versa a mean of (61.8%) embryonic calli in dark and a mean 44.4% in light. (Table 12.11). Tentatively, light is not essential for the induction of somatic embryos from immature cotyledons of shea since embryos developed in darkness.
Significant interaction effects were observed in the response of Stamens, petals and ovaries explants to various auxin/cytokinin combinations in M1, M2 and M3 basal medium (Table 12.12). Stamens and petal explants were the most responsive to M3 having % embryogenic calli means of 57.3% and 46.7% respectively, whereas ovaries were the most responsive explants to M1 medium with % embryogenic calli mean of 62.3%. But following transfer into their corresponding M1, M2 and M3 medium without growth regulators no embryo induction occurred.
152
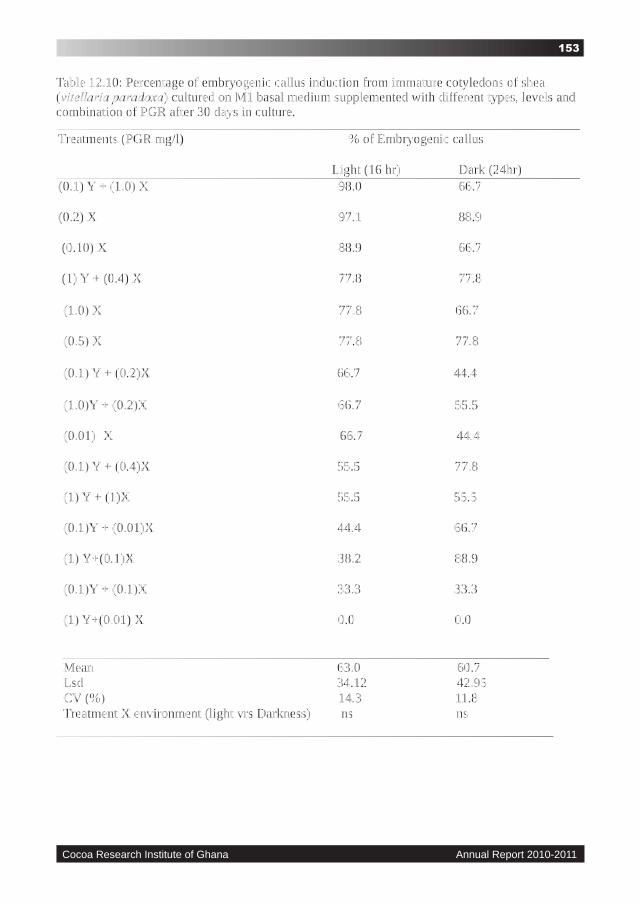
Cocoa Research Institute of Ghana Annual Report 2010-2011
Treatments (PGR mg/l)
% of Embryogenic callus
Light (16 hr)
Dark (24hr)
(0.1) Y + (1.0) X
98.0
66.7
(0.2) X
97.1 88.9
(0.10) X 88.9 66.7 (1) Y + (0.4) X 77.8 77.8
(1.0) X 77.8 66.7
(0.5) X
77.8 77.8
(0.1) Y + (0.2)X 66.7 44.4
(1.0)Y + (0.2)X
66.7 55.5
(0.01)
X 66.7 44.4
(0.1) Y + (0.4)X 55.5
77.8
(1) Y + (1)X 55.5 55.5
(0.1)Y + (0.01)X 44.4 66.7
(1)
Y+(0.1)X 38.2 88.9
(0.1)Y + (0.1)X 33.3 33.3
(1) Y+(0.01) X
0.0 0.0
Mean 63.0 60.7
Lsd
34.12 42.95 CV (%) 14.3 11.8
Treatment X environment (light vrs Darkness)
ns ns
Table 12.10: Percentage of embryogenic callus induction from immature cotyledons of shea(vitellaria paradoxa) cultured on M1 basal medium supplemented with different types, levels andcombination of PGR after 30 days in culture.
153

Table 12.11: Percentage of embryogenic callus induction from immature cotyledons of shea(vitellaria paradoxa) cultured on M1 basal medium supplemented with different types, levels andcombination of PGR after 30 days in culture.
Treatments (PGR mg/l)
% of Embryogenic callus
Light (16
hr)
Dark (24hr)
(0.10) X
86.7
53.3
(1)
Y + (0.4) X 80.0
53.3
(1.0) X
80.0 80.0
(0.1) Y + (1.0) X
73.3
46.7
(0.2) X
33.3
73.3
(0.5) X 46.7 80.0
(0.1) Y + (0.2)X 33.3 73.3
(1) Y + (0.2) X 46.7 53.3
(0.2) X 33.3 73.3
(0.1) Y + (0.4)X 20.0 80.0
(1) Y + (1)X
53.3 86.7
(0.1)Y + (0.01)X 53.3
20.0
(1) Y+ (0.1)X 20.0 33.3
(0.1)Y + (0.1)X 20.0 80.0
(1) Y + (0.01) X
0.0 46.7
Mean 44.4
61.8
Treatment X environment lsd (light and Darkness) 27.33
CV (%) 31.5
Cocoa Research Institute of Ghana Annual Report 2010-2011
154

Tabl
e 12
.12.
Perc
enta
ge o
f em
bryo
geni
c ca
llus
indu
ctio
n fr
om f
lora
l tis
sues
of
shea
(vi
tell
aria
par
adox
a) c
ultu
red
on M
1, M
2 an
d M
3 ba
sal
med
ium
sup
plem
ente
d w
ith d
iffe
rent
type
s, le
vels
and
com
bina
tion
of P
GR
aft
er 3
0 da
ys in
cul
ture
.
Tre
atm
ents
(PG
R m
g/l)
% o
f E
mbr
yoge
nic
callu
s
Stam
ens(
M1)
Sta
men
s(M
2) S
tam
ens(
M3)
O
vari
es(M
1) O
vari
es(M
2) O
vari
es(M
3) P
etal
s(M
1) P
etal
s(M
2) P
etal
s(M
3)
(1) Y
20.
0
20.0
20.0
33.
3
53
.3
33.
3
2
0.0
2
6.7
26.7
(1)
X
10
0.0
73
.0
1
00.0
100
.0
86.7
0
93
.3
86.
7
33
.3
100.
0
(1)
V
2
0.0
53
.3
53
.3
20.0
46.7
4
0.0
20.
0
13.
3
2
6.7
(1)
W
2
0.0
20
.0
20.
0
20.0
53.
3
2
0.0
6.
70
3
3.3
(1) Y
+ (
4) X
100.
0
5
3.0
1
00.0
100
.0
80.
0
8
6.7
60.
0
53.3
93.
3
(1)
W +
(4)
X
10
0.0
93.
3
100
.0
1
00.0
60.
0
9
3.3
60.
0
66.7
86.
7
(1)
V +
(4)
X
1
00.0
73.
0
100
.0
1
00.0
1
00.0
86.
7
6
6.7
93
.3
9
3.3
(1) Y
+ (
4) Z
33.3
3
4
0.0
40.0
5
3.3
46.7
46.
7
2
6.7
33
.3
3
3.3
(1
)
W
+ (
4) Z
3
3.33
20.
0
46.
67
8
0.0
86.7
33.3
20.
0
13.3
20.
0
HO
RM
OR
NE
FR
EE
2
0.0
13
.33
20.
0
16.7
0
20.
0
2
0.0
20.0
6
.70
20.
0
Mea
n
54.
67
4
8.67
57.3
3
62.
3
60.
7
58.0
4
0.7
38.
0
4
6.7
C
V (
%)
17.2
0
22
.7
37.1
0
(T
reat
men
t Lsd
)
8.6
65
12.9
2
14
.61
(T
reat
men
t X m
edia
Lsd
)
15
.01
2
2.38
25.3
0
KE
Y-
(M1,
M2,
M3)
-MO
DIF
IED
ME
DIU
M
13.3
Cocoa Research Institute of Ghana Annual Report 2010-2011
155

Aetiology and control of leaf blight disease(s) of cashew in Ghana: (M. K. Assuah, I. Y. Opoku, E. A. Dwomoh, J. Yeboah)
The experimental detail of the above trial was presented in the 2008/2009 Annual Report (Rep. Cocoa Res. Inst. Ghana, 2008/2009, 159).
No new organism was isolated during the year. The already isolated and identified organisms were recorded. These included Alternaria citri, Pestalotia spp, Lasiodiplodia theobromae,
Aspergillus and Penicillium spp.
The severity of the blight disease of the selected cashew plants increased from March to May for the higher severity scales (scales 4 & 3) but dropped sharply from July onwards (Fig. 12.12). This led to an increase in the lower scales (scales 1 & 2) and the number of trees without the disease symptoms. The severity of the disease remained low till the end of the year. This observation is in variance with the severity of the disease in previous years where higher severity scales were recorded from June to October. The observation in the current year can be attributed to the monthly application of fungicides for the control of the disease in August to November. This invariably accounted for the lower severity scales at a time when the blight disease was expected to be severe and also accounted for the higher number of trees without symptoms for most part of the year (Fig. 12.12).
Fig.12.12: Temporal severity of leaf blight disease on cashew at Bole.
Cocoa Research Institute of Ghana Annual Report 2010-2011
156

Key: Bars represent number of trees without the blight symptoms during the year.
The six fungicides under screening on the field for the control of the leaf blight disease on cashew are listed on Table 12.18. Generally, the severity of the blight disease decreased from July/August with the application of the fungicides (Fig.12.13). Carlit express and Ridomil Gold were more effective in controlling the blight disease than the other fungicides. The mean severity for the 20 trees which were sprayed with these fungicides was always below the lowest severity scale (1) for the application period. Goldazim, Agriete and Shavit were the least effective fungicides against the leaf blight disease on cashew (Fig. 12.13). The mean severity for the control trees was relatively high during the period.
Table 12.18: Fungicides under screening to control leaf blight disease of cashew
Name of fungicide
Active ingredient and concentration
Dosage used (/11L)
Goldazim
Carbendazim –
500g/L
5.5ml
Agriete
Fosetyl –Al –
800g/Kg
22 g
Carlit Express Fosetyl –
Al –
31.1% +
Mancozeb –
31.1% + Benalaxyl – 2.2%
32 g
Shavit
Folpet –
700g + Triadimenol –
1.5g/Kg
22 g
Sulfa
Sulphur –
80%
37 g
Ridomil Gold
Mefenozam –
6% + Copper (1) oxide –
60%
37 g
Fig. 12.13: Effect of different active ingredients of fungicides on cashew leaf blight disease control
Cocoa Research Institute of Ghana Annual Report 2010-2011
157

The effect of gamma-irradiation of shea seeds and cutting on growth traits of shea (M. T. Barnor, J. Yeboah, P. A. Gyamfi, F. K. Padi, F. O. Ansah, A. A. Afrifa, H. Obiatey)
The experimental detail of the above trial was presented in the 2009/2010 Annual Report (Rep. Cocoa Res. Inst. Ghana, 2009/2010).
Radicle emergence values for the various radiation doses are as presented in (Table 12.19). Radical emergence percentage ranged from 52 to 69%. The non-irradiated seeds attained 50% emergence within two weeks while irradiated seeds took 3 -4 weeks to attain 50% emergence (Fig.12.14). Radicel emergence was completed in 4 weeks for all treatments. Gamma irradiation did not show profound effect on radicle emergence but greatly affected subsequent root development.
Plumule emergence values for the various radiation doses are as presented in (Table12.19). Plumule emergence rate showed strong negative correlation with gamma rays (r= -0.796) (Table 12.20). Plumule emergence decreased with increasing irradiation dose with the exception of 50Gy which yielded higher emergence percentage than the control (0Gy). Only two (2) of 150 sprouted seeds irradiated with 200Gy of gamma rays produced seedlings representing 1.3% of irradiated seeds. No plumule emergence was recorded for 600 and 700Gy.
Seedling height showed a significant negative correlation with gamma rays (-0.976*). Growth reduction percentages of 18.1 and 20.3% were recorded for 50Gy and 100Gy, respectively (Table 12.19). The use of 50% growth reduction dose (GR ) as a measure of 50
radio-sensitivity may however, not be appropriate for the shea plant due to delay in plumule emergence of irradiated seeds as indicated in Fig.12.16.
Survivability of seedlings expressed as a percentage of the control is an important parameter in estimating radio-sensitivity. However, this could not be estimated in the current study because germinated seeds from all doses have survived up to the time of writing this report. Perhaps, seeds with severely damaged DNA died during radicle development. At higher doses of gamma rays, radicle of seeds emerged but could not develop the usual pseudo-taproot from which the plumule emerges. As a result, radicle emergence was recorded for all levels of gamma rays but plumule emergence decreased with increasing dose of gamma rays and no emergence was recorded for 600 and 700Gy (Fig 12.15)
Also, visible leaf variegation (chimeric) was observed in two seedlings from seeds irradiated at 50 Gy and 100 Gy (Fig 12.17). The leaves have pale green patches that have so far persisted in every generation leaves.
Cocoa Research Institute of Ghana Annual Report 2010-2011
158

Table l2.19: Radicle and plumule emergence percent and plant height of shea seeds irradiated withgamma rays
Dosage
Radicle emergence (%)
Plumule emergence (%)
Plant height (cm)
0Gy
69
54.7
7.19
50Gy 55 60.7 5.89 (18.1) 100Gy 52 27.3 5.73 (20.3) 200 Gy 52 1.3 Insufficient data 600 Gy
60
0 700Gy
55
0 Note: figures in parenthesis represent growth reduction as a percentage of the control (0Gy)
Table 12.20: Correlation of plant characters with gamma rays
Plant character
Correlation
Radicle emergence
-0.151
Plumule emergence -0.796 Plant height
-0.976*
Fig. 12.13: Radicle emergence of shea seeds irradiated with 0, 50, 100, 200, 600 and 700 Gy ofgamma rays
Fig.12.14: Radicle emergence of irradiated shea seeds
Cocoa Research Institute of Ghana Annual Report 2010-2011
159

Fig.12.15: Plumule emergence of irradiated shea seeds with time
Fig.12.16: LD (50% plumule emergence) of irradiated shea seeds with 0, 50, 100, 200, 600 and50
700 Gy of gamma rays
Cocoa Research Institute of Ghana Annual Report 2010-2011
160

Fig.12.17: seedlings with pale patches.
Cashew germplasm collection, conservation, characterization, evaluation and
utilization (M. A. Dadzie, K. Opoku-Ameyaw, J. Yeboah, M. Assuah, E. A. Dwomoh, Entomologist)
The experimental detail of the above trial was presented in the 2008/2009 Annual Report (Rep. Cocoa Res. Inst. Ghana, 2008/2009, 164).
Local accessions
The local accessions in Bole have an average yield of 1.5kg/tree and a yield range of 0 kg to 6.9 kg whereas in Wenchi an average yield of 2kg/tree with a yield range of 0 to 11.8kg was realized (Table 12.13). It can be deduced that differences in yields from these accessions in the two locations (Wenchi and Bole) could be attributed to the differences in environmental conditions (rainfall, soils, humidity) etc. The most outstanding accessions in Bole and Wenchi are CP/AS/EJ/F3/175 and WA/SG173/1 with yields of 6.9kg and 11.8kg respectively.
Tanzania accessions
Yields ranged from 0.03 to 3kg/tree with an average of 1kg/tree (Table 12.13). The highest yielding accession is TT15 giving yield of 3kg/tree and this represents a initial yield since its establishment. Floral characterization and cut test will be performed to determine their outturn values.
Benin accessions
Yield data collected indicate that, the Benin materials at Wenchi have an average yield of 2.5 kg per accession with a yield range of 0 to 14kg/tree whereas those in Bole had an average yield of 0.31kg per accession with a yield range of 0 to 1.5kg. From Table 12.13, it can be
Cocoa Research Institute of Ghana Annual Report 2010-2011
161

deduced that the yields in Bole are far lower than that of the materials in Wenchi. This could be attributed to environmental differences.
Brazillian accessions
No significant differences (p<0.05) were observed in the yield data collected from the five (5) accessions (Table 12.14). These accessions will be evaluated for nut sizes, outturn and earliness to flowering in the subsequent years.
Table 12.13: Yield performance of Benin, Tanzania and Local cashew accessions at Wenchi and Bole
Germplasm Location No. of Mean Yield Mean yield Yield Source Planted access. Kg/tree ('09) Kg ('10) range ('10)
Benin Bole 320 0.33 0.31 0.0-1.50 Wenchi 769 3.30 2.50 0.0-14.0
Local Bole 339 0.88 1.50 0.0-6.9 Materials
Wenchi 213 1.9 2.00 0.0-11.8
Tanzania Bole 1200 0.0 1.00 0.0-3.0
Accession Yield (kg)
A1
0.848
A2
0.884
A3 0.618 A4 0.892
A5
0.478
Mean
0.744
Lsd ns
Table 12.14: Yield performance of Brazillian dwarf cashew genotypes in Bole
Cocoa Research Institute of Ghana Annual Report 2010-2011
162
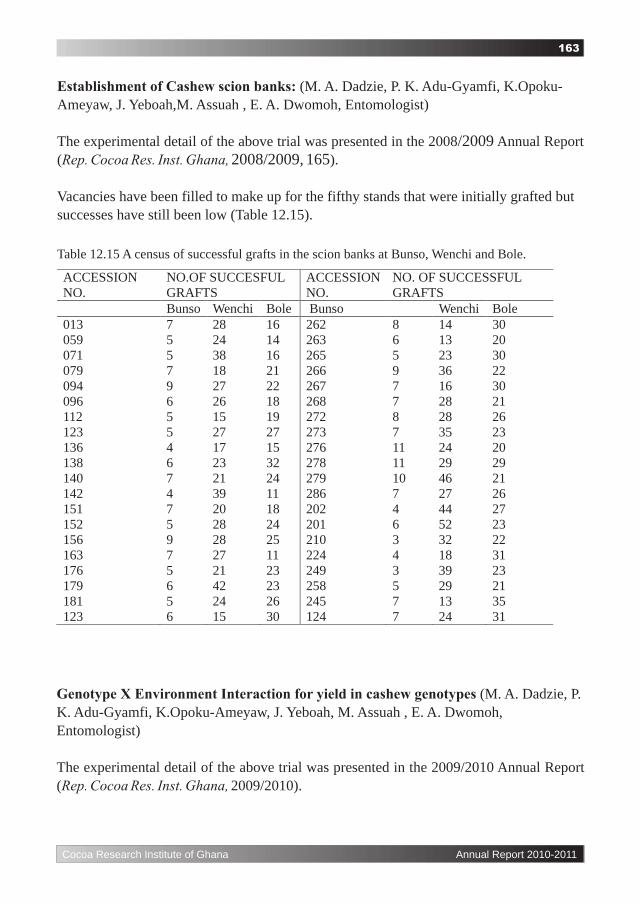
Establishment of Cashew scion banks: (M. A. Dadzie, P. K. Adu-Gyamfi, K.Opoku-Ameyaw, J. Yeboah,M. Assuah , E. A. Dwomoh, Entomologist)
The experimental detail of the above trial was presented in the 2008/2009 Annual Report (Rep. Cocoa Res. Inst. Ghana, 2008/2009, 165).
Vacancies have been filled to make up for the fifthy stands that were initially grafted but successes have still been low (Table 12.15).
Table 12.15 A census of successful grafts in the scion banks at Bunso, Wenchi and Bole.
ACCESSION NO.
NO.OF SUCCESFUL GRAFTS
ACCESSION NO.
NO. OF SUCCESSFUL GRAFTS
Bunso
Wenchi
Bole
Bunso
Wenchi
Bole
013
7
28
16
262
8
14
30
059
5
24
14
263
6
13
20
071
5
38
16
265
5
23
30
079
7
18
21
266
9
36
22
094
9
27
22
267
7
16
30
096
6
26
18
268
7
28 21
112
5
15
19
272
8
28 26
123 5 27 27 273 7 35 23 136 4 17 15 276 11 24 20 138 6 23 32 278 11 29 29 140 7 21 24 279 10 46 21 142
4
39
11
286
7
27 26
151
7
20
18
202
4
44 27
152
5
28
24
201
6
52
23
156
9
28
25
210
3
32
22
163
7
27
11
224
4
18
31
176
5
21
23
249
3
39
23
179
6
42
23
258
5
29
21
181
5
24
26
245
7
13
35
123
6
15
30
124
7
24
31
Genotype X Environment Interaction for yield in cashew genotypes (M. A. Dadzie, P. K. Adu-Gyamfi, K.Opoku-Ameyaw, J. Yeboah, M. Assuah , E. A. Dwomoh, Entomologist)
The experimental detail of the above trial was presented in the 2009/2010 Annual Report (Rep. Cocoa Res. Inst. Ghana, 2009/2010).
Cocoa Research Institute of Ghana Annual Report 2010-2011
163

Genotype by location effects
The analysis of variance indicated no significant genotype by environment interaction effects for mean girths and heights among the genotypes in the two locations (Tables 12.16 and 12.17). But SG 266 and BE 203 ranks among the top five (5) outstanding genotypes with higher girths and heights in the two locations. Growth measurements taken on the genotypes have also shown significant differences for both girth and height between the two locations. At Wenchi, mean girths and heights among the genotypes were higher than their corresponding genotypes in Bole. Generally, the genotypes in Wenchi are growing more vigorously than that in Bole (Table 12.16 & 12.17). The most vigorous genotypes were BE 575 in Bole and SG 266 in Wenchi with mean girths of 29.81mm and 62.8mm respectively (Table 12.16 & 12.17). The low girth and height increases recorded among the genotypes in Bole may reflect the response of the genotypes to the low rainfall, humidity and high temperatures in the Guinea savanna zone.
Cocoa Research Institute of Ghana Annual Report 2010-2011
164

Selections
Mean height (m)
Wenchi Bole
We
BAM 7
283.0 110.0
BE 203
227.0 140.0
SG 004
221.0 120.0
SG 224
218.0 102.0
SG 014
210.0
97.0
SG 266
210.0 115.0
BE 204
210.0 118.0
SB 9
194.0 089.0
KT 5
193.0 122.0
IDDM 29
171.0 116.0
KT 2 167.0 101.0
BE 575 166.0 113.0
BE 627
166.0 070.0
BE 739
165.0 123.0
KT 4
163.0
10.0
SG 273
157.0 10.0
KT 1
155.0 10.0
BAME 7
146.0 113.0
AKC
144.0 101.0
AKD
136.0 10.0
Mean 185.0 110.0
CV (%)
33.20 18.7
Lsd (G x L) ns ns
Table 12.16: The height of twenty (20) elite cashew materials recorded at Wenchi and Bole.
Cocoa Research Institute of Ghana Annual Report 2010-2011
165

Table 12.17: The girth of twenty (20) elite cashew materials recorded at Wenchi and Bole.
Selections Mean girth (mm)
Wenchi Bole
SG 266
62.8 28.31
SG 224
61.5 24.97
SG 004
60.6 26.6
IDDM29
59.7 28.08
BE 203
59.6
28.26
SB 9
57.1 24.58
SG 014
55.7 20.42
KT 4
55.4 25.34
BE 204
53.3 28.92
BAM 7
52.0
25.18
BAME 7
52.0 28.87
BE 627 50.7 16.0
SG 273 50.7 22.34
BE 575
50.3
29.81
KT 5
49.6 27.87
BE 739
49.5 28.84
KT 1
47.1 26.22
Mean
52.8 25.53
CV (%)
27.2 17.5
G x E (lsd) ns ns
Cocoa Research Institute of Ghana Annual Report 2010-2011
166

Development of edible products from shea (Vitellaria paradoxa) fruit pulp (Esther Gyedu Akoto, S.T. Lowort, C.K. Agyente-Badu, V. Anchirinah, J. Yeboah, Winifred Kumi, F. Owusu Ansah.
The experimental detail of the above trial was presented in the 2009/2010 Annual Report (Rep. Cocoa Res. Inst. Ghana, 2009/2010).
Proximate analysis on the shea jam showed that the shea fruit contains an appreciable amount of protein (3.38%). It also has high mineral content with the predominant ones being sodium, calcium and potassium (Table 2).
Parameter
Composition
Protein (%)
Polyphenols (mg/g)
Tot. Sugars (mg/g)
P (µg/g)
K
"
Ca
“
Mg
" Na
“
Zn (mg/kg)
Cu
"
Fe
"
Mn
"
3.83 ± 0.06
45.25
± 0.28
300.21
± 8.61
29.55
± 0.27
1461.35
± 14.32
288.13
± 21.7
114.10 ± 1.71 1111.99
± 6.74
5.06
± 0.15
0.19
± 0.02
2.82
± 0.12
12.02
± 0.38
Table 2: Proximate analysis on shea jam
Fermentation of shea pulp for 3, 4, 5 and 6 days also produced some alcohol. However, the alcoholic strengths obtained were low.
Table 3: Shea pulp distillation
Fermentation days
3
4
5
6
Pulp (kg)
20
20 20
20
Water (L) 66 52 56 50 Alcohol (%)
9
10
10
18
Alcohol (L)
9
9
7
8
Wine
Specific gravity of the shea fruit extract was 1.050 before amelioration with sucrose. Addition of the sugar raised the specific gravity to 1.085 before the aerobic fermentation. Maximum concentration of alcohol attained at the end of fermentation was 12.1%. The wine currently is being allowed to mature. The other half of the fruit extract that was converted into vinegar had a final acetic acid concentration of 4.4% after dilution. Table 4 shows the preliminary observation on the phenol and carbohydrate contents of the shea fruits.
Cocoa Research Institute of Ghana Annual Report 2010-2011
167

Table 4: Two characteristics of shea fruits sampled from the Upper West and Northern Regions
Phenolics (mg/g)
Carbohydrates (mg/g)
o-dihydric total Soluble Insoluble 0.02-1.51 4.4-22.4 8.7-74.6 2.6-25.6
Evaluating the growth and yield response of cashew to organic manures (S. Acquaye,K. Ofori-Frimpong,J. Yeboah, V. Anchirinah, M. K. Assuah, E. A. Dwomoh, F. Owusu Ansah, A. O. Dwapanyin)
The experimental detail of the above trial was presented in the 2009/2010 Annual Report (Rep. Cocoa Res. Inst. Ghana, 2009/2010). No significant effect of poultry manure and cow dung at the diferrent application rates on plant girth (Figure 1), height (Figure 2) and number of leaves per plant (Figure 3) were observed at three months after transplanting.
Figure 1. Time course of cashew plant girth at transplanting (baseline) and three months fromtransplanting as influenced by poultry manure (PM) and cow dung (CD) application. Figures besideacronyms indicate the annual application rates.
Figure 2. Time course of cashew plant height at transplanting (baseline) and three months fromtransplanting as influenced by poultry manure (PM) and cow dung (CD) application. Figures besideacronyms indicate the annual application rates.
Cocoa Research Institute of Ghana Annual Report 2010-2011
168

Figure 3. Time course of leaf number per cashew plant at transplanting (baseline) and three monthsfrom transplanting as influenced by poultry manure (PM) and cow dung (CD) application. Figuresbeside acronyms indicate the annual application rates.
Evaluating the Yield Response of Cashew to Organic Manures (S. Acquaye, K. Ofori-Frimpong, J. Yeboah, V. Anchirinah, M. K. Assuah, E. A. Dwomoh, F. Owusu Ansah, A. O. Dwapanyin)
The experimental detail of the above trial was presented in the 2009/2010 Annual Report (Rep. Cocoa Res. Inst. Ghana, 2009/2010). The nut yield after the initial soil amendment application ranged from 106.2kg/ha for CD20 to the lowest of 60 kg/ha for PM40, with a median yield of 76.0kg/ha (Figure 1). There was a significant variation in the initial cashew nut yield. It may be too early to ascribe this significant difference to the effects of the soil amendments.
Figure 1. First year nut yield of cashew trees receiving poultry manure (PM) or cow dung (CD).The numbers baside the manure acronyms indicate the annual rate of application. The vertical barindicates least significant difference.
Cocoa Research Institute of Ghana Annual Report 2010-2011
169
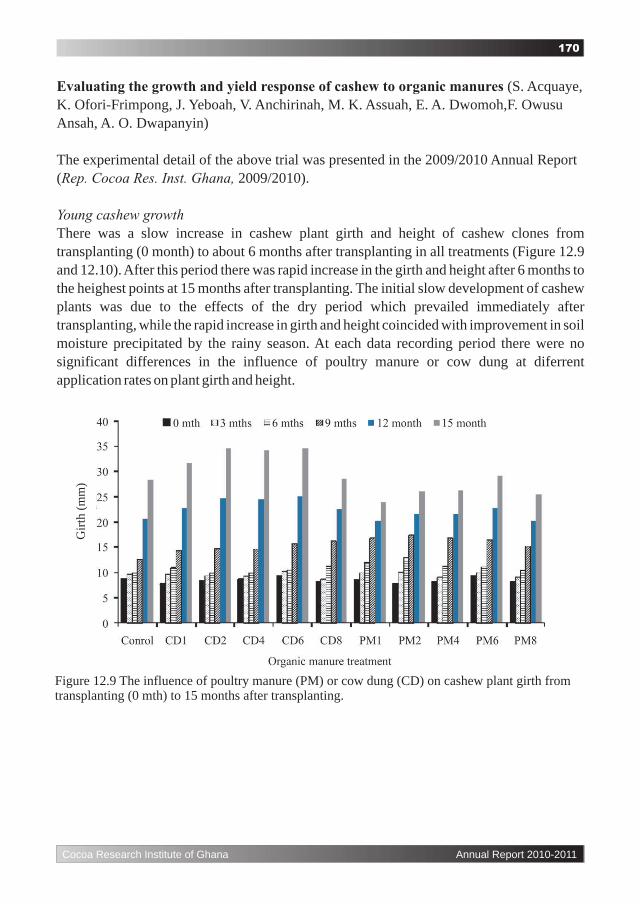
Evaluating the growth and yield response of cashew to organic manures (S. Acquaye, K. Ofori-Frimpong, J. Yeboah, V. Anchirinah, M. K. Assuah, E. A. Dwomoh,F. Owusu Ansah, A. O. Dwapanyin)
The experimental detail of the above trial was presented in the 2009/2010 Annual Report (Rep. Cocoa Res. Inst. Ghana, 2009/2010).
Young cashew growth
There was a slow increase in cashew plant girth and height of cashew clones from transplanting (0 month) to about 6 months after transplanting in all treatments (Figure 12.9 and 12.10). After this period there was rapid increase in the girth and height after 6 months to the heighest points at 15 months after transplanting. The initial slow development of cashew plants was due to the effects of the dry period which prevailed immediately after transplanting, while the rapid increase in girth and height coincided with improvement in soil moisture precipitated by the rainy season. At each data recording period there were no significant differences in the influence of poultry manure or cow dung at diferrent application rates on plant girth and height.
Gir
th (
mm
)
Figure 12.9 The influence of poultry manure (PM) or cow dung (CD) on cashew plant girth fromtransplanting (0 mth) to 15 months after transplanting.
Cocoa Research Institute of Ghana Annual Report 2010-2011
170

Hei
ght (
mm
)
Figure 12.10 The influence of poultry manure (PM) or cow dung (CD) on cashew plant height fromtransplanting (0 mth) to 15 months after transplanting.
Mature cashew yield
There was a significant variation in the initial cashew nut yield that ranged from 106.2kg/ha for CD20 to the lowest of 60 kg/ha for PM40, with a median yield of 76.0kg/ha in 2009/2010 (Figure 12.11). There was 30 -50% increases in nut yield of manure treatments from 2009/2010 to 2010/2011. However no significant differences were observed in the cashew nut yield of manure treatments in 2010/2011.
Nut
yie
ld (
kg/h
a)
Figure 12.11 Two year nut yield of cashew trees receiving poultry manure (PM) or cow dung (CD).Numbers baside the manure acronyms indicate the annual rate of application in kg/ha/yr. Thevertical bar indicates least significant difference in 2010 (p≤0.05).
Cocoa Research Institute of Ghana Annual Report 2010-2011
171

Evaluation of foliar fertilizer use on cashew (S. Acquaye, K. Ofori-Frimpong, J. Yeboah, V. Anchirinah, M. K. Assuah, E. A. Dwomoh,F. Owusu Ansah, A. O. Dwapanyin)
The experimental detail of the above trial was presented in the 2009/2010 Annual Report (Rep. Cocoa Res. Inst. Ghana, 2009/2010). There was no significant effect of liquid/foliar fertilizer treatments on the cashew nut yield in 2011 when all thirteen treatments tested were analyzed together (Fig. 12.3) and the five-year cumulative yield (Fig 12.4). From orthogonal analysis based on individual fertilizers, liquid/foliar fertilizer formulations NPK 20:2:4 (Fig 12.5), NPK 10:10:10 (Fig 12.6) and NPK 6:0:20 (Fig 12.7) at the three application rates did not significantly influence cashew nut yields from 2006/2007 to 2009/2010 cropping
-1 -1seasons. On the other hand, NPK 13:1:12 applied at 3L ha yr significantly improved cashew nut yield than 1 and 2 L/ha application rates in 2006/2007 and 2009/2010 (Fig 12.8). There was no serious pest and disease incidence.
Figure 12.3 Time course of cashew nut yield as affected by different foliar fertilizer formulationsapplied at different rates in 2011.
Nut
yie
ld (
kg/h
a)
Figure 12.4 Five-year cumulative cashew nut yield as affected by different foliar fertilizerformulations applied at different rates
Cocoa Research Institute of Ghana Annual Report 2010-2011
172

Nut
yie
ld (
kg/h
a)
Figure 12.5 Cashew nut yield as affected by application of liquid/foliar fertilizer NPK 20:2:4.
Nut
yie
ld (
kg/h
a)
Figure 12.6 Cashew nut yield as affected by application of liquid/foliar fertilizer NPK 10:10:10
Figure 12.7 Cashew nut yield as affected by application of liquid/foliar fertilizer NPK 6:0:20
Nut
yie
ld (
kg/h
a)
Cocoa Research Institute of Ghana Annual Report 2010-2011
173

Figure 12.8 Cashew nut yield as affected by application of liquid/foliar fertilizer NPK 13:1:12.Vertical bars indicate least significant values (p<0.05) at respective cropping seasons.
Nut
yie
ld (
kg/h
a)
Economic AnalysisEconomic analysis was done by the partial budget technique which used data on the average cost of fertilizers, application cost and nut picking, and benefit. The analysis was performed on the highest five-year nut yield that was achieved with the application of liquid fertilizer NPK 13:1:12. The gross benefit (GB), which is based on the nut yield and prevailing cashew producer price, was higher for fertilizers than that of the unfertilized control and was ranked as 3L/ha > 2L/ha = 1L/ha > control (Table 12.9). The total variable cost (TVC) which is made up of cost of fertilizer, application and nut picking cost was similar (i.e. Gh¢518.0 - Gh¢599.0) for the three fertilizer application rates as against the nut picking cost of Gh¢91.0 for the unfertilized control. However the net benefit (NB) was highest for the control and this was 3, 19 and 2 times the NB for 1, 2 and 3 L/ha application rates, respectively. This is as a result of the high TVCs of fertilizer application. All the foliar fertilizers gave negative Marginal Rate of Return (MRR) which is defined as the additional output obtained for every additional unit of input. The MRR was used to determine the profitability of fertilizer use and was calculated as [(Change in net benefit/Change in variable cost) x 100], where change means: [Net benefit or variable cost of fertilizer] minus [Net benefit or variable cost of control]. The negative MRRs mean that the usage of fertilizers on the cashew resulted in losses. For example, an investment of Gh¢1.00 made in using SIDALCO foliar fertilizer NPK 13:1:12 at the rate of 3L/ha, which gave the highest average yield, will result in a loss of Gh¢ 0.30.
Cocoa Research Institute of Ghana Annual Report 2010-2011
174

Table 12.9 Partial budget to compare economic benefit of applying foliar fertilizer (SIDALCO) tocashew using the highest five-year average nut yield obtained with application of foliar fertilizerformulation NPK 13:1:12
Item
Economic Parameter
Control
1L/ha
2L/ha
3L/ha
1
Benefit (Gh¢)
Average yield (kg/ha)
303.2
496.4
454.8
599.3
Gross benefit (Gh¢) (A)*
363.8
595.7
545.8
719.2
2
Varying cost
(Gh¢)
Fertilizer (Gh¢25.0/L)
0
25.0
50.0
75.0
Application (Gh¢5.5/day x 5md x 10 times)
0
275.0
275.0
275.0
Fuel (Gh¢7.0/application) x 10 times
0
70.0
70.0
70.0
Nut collection (Gh¢0.25/kg nut)
91.0
148.9
136.5
179.8
3
Total varying cost (B)*
91.0
518.9
531.5
599.8
4
Net Benefit
(A –
B)
272.85
76.77
14.36
119.38
5
Changes in benefits and cost
Change in net benefit
-196.1
-258.5
-153.5
Change in variable cost
428.0
440.5
508.8
6 Marginal Rate of Return (MRR) -46% -59% -30%
Effects of inorganic fertilizers and their application periods on the growth and yield of
cashew (S. Acquaye, K. Ofori-Frimpong, J. Yeboah, V. Anchirinah, M. K. Assuah, E. A. Dwomoh, F. Owusu Ansah, A. O. Dwapanyin)
The experimental detail of the above trial was presented in the 2009/2010 Annual Report (Rep. Cocoa Res. Inst. Ghana, 2009/2010). Similar to the previous years, there was significant mean and interaction effect of fertilizers and their application periods. Nut yield reduces with delay in fertilizer application with the sharpest decline occurring for the fertilizers in the first 6 months (Fig 12.1). The nature of the decline following a 6 month delay in application was however gradual with the exception of unfertilized control which generally did not change with delay in initial application. Application of F4 increased nut yield over the control with the exception of 18 months delay in application. The remaining two fertilizers however were not different from the unfertilized control after 6 months delay in application.
Cocoa Research Institute of Ghana Annual Report 2010-2011
175

Figure 12.1: Effects of interaction between fertilizer and their application periods on cashew nutyield in 2010/2011
Economic Analysis
Economic analysis was done by the partial budget technique which used data on the average cost of fertilizers and application costs (outflows), and benefit (inflows). The analysis was performed on nut yield at the period of fertilizer application (i.e. 0 month) that gave the highest among the four-year average nut yield. The gross benefit (GB), which is based on the nut yield and prevailing cashew producer price, was higher for fertilizers than that of the unfertilized control and was ranked as F4 > F3 > F2 > F1 (Table 12.7). The total variable cost (TVC) which is made up of cost of fertilizer, handling, application and nut picking cost was highest for F4 (Gh¢870.4) and this was approximately two and three times the TVC of F3 and F2, respectively, as against the minimal nut picking cost of Gh¢19.4 for the unfertilized control. However, the net benefit (NB) was highest for the control (Gh¢58.2) with all applied fertilizers having negative NB values as a result of their high TVCs. All the fertilizers had negative Marginal Rate of Return (MRR) which is defined as the additional output obtained for every additional unit of input. The MRR was used to determine the profitability of fertilizer use and was calculated as [(Change in net benefit/Change in variable cost) x 100], where change means: [Net benefit or variable cost of fertilizer] minus [Net benefit or variable cost of control]. The negative MRRs mean that the usage of fertilizers on the cashew resulted in losses. For example, an investment of Gh¢1.00 made in using fertilizer treatment F4, which gave the highest average yield, will result in a loss of Gh¢0.74.
Cocoa Research Institute of Ghana Annual Report 2010-2011
176

Table 12.7: Partial budget to compare economic benefit of applying inorganic fertilizers to cashewusing the highest four-year average nut yield obtained when fertilizers were applied at transplanting(0 month).
Item
Economic Parameter
F1
F2
F3
F4
1
Benefit (Gh¢)
Average yield (kg/ha)
64.7
125.3
192.8
248.1
Gross benefit (Gh¢) (A)*
77.7
150.4
231.3
297.7
2
Varying cost
(Gh¢)
Fertilizer 0 188.8 377.5 755.0 Application (5 MD @ Gh? 5/day) 0 25.0 25.0 25.0 Transport 0 16.0 16.0 16.0
Nut picking (Gh¢ 0.25/kg) 19.4 37.6 57.8 74.4 3 Total varying cost (B)* 19.4 267.3 476.3 870.4 4
Net Benefit
(A –
B)
58.27
-116.98
-245.01
-572.74
5
Changes in benefits and
cost Change in net benefit
-175.2
-303.3
-631.0
Change in variable cost
247.9
456.9
851.0
6
Marginal Rate of Return (MRR)
-71%
-66%
-74%
Notes: F - unfertilized control; F - 62.5N+62.5P O +12.5K O; F -125N+125P O +25K O; 1 2 2 5 2 3 2 5 2
F - 250N+250P O +50K O kg//ha/yr.4 2 5 2
Fertilizer cost: N = Gh¢1.7/kg; P and K = Gh¢1.1/kg; Current cashew selling price: Gh¢1.2/kg
Effect of polythene bag size on seedling development and ease of transplanting success
in cashew (Anacardium occidentale L.) (Patricia Adu-Yeboah, F. M. Amoah, A. O. Dwapanyin, K. Opoku-Ameyaw, J. Yeboah, S. Aquaye, F. Owusu Ansah,V. Anchirina)
The experimental detail of the above trial was presented in the 2009/2010 Annual Report (Rep. Cocoa Res. Inst. Ghana, 2009/2010).
Carting of seedlings to field
The volume of soil used in potting and weight of bags reduced proportionally with reduction in bag size, reducing carting difficulties. The approximate volume and weight of soil to pot each bag size and number of seedlings transported per person by head over a distance of 2.2 km are presented in Table 11.21. On the average, thirty-one (31) seedlings nursed in smallest bags could be carried per person while only eight (8) seedlings nursed in the normal sized bags could be transported per person.
Cocoa Research Institute of Ghana Annual Report 2010-2011
177

Table 11. 21: Number of seedlings transported per person by head portage. Bag size
Soil Vol. (cm 3)
(approx) Weight of bag
(kg) Average/head
Control -17.5 x 25cm
6020
2.60
8.0
T1 - 14 x 17.5cm 2700 1.02 17.0
T2 - 14 x 15.0cm 2310 0.90 20.0 T3 - 12.5 x 17.5cm 2150 0.76 24.0 T4 -
10.0 x 17.5cm
1380
0.54
30.0
T5 -
10.0 x 15.0cm
1180
0.49
31.0
Transplant survival
The polythene bags size for the nursery significantly (p≤0.05) affected seedling survival six months after transplanting. The Control and T1 (the two bigger bag sizes of the 8-week seedlings) had higher mortality than the other bag sizes (Fig. 11.18). This may be attributed to over-development of the root system in the bigger bags before transplanting and possibly, difficulty in handling the bags during transplanting. Seedling age and its interaction with bag size did not affect survival significantly. Reduced bag size reduced seedling mortality and improved survival of transplants than bigger nursery bags.
Seedling moisture and dry matter accumulation
Seedling total fresh weight was significantly (p<0.001) increased by age and bag size (Fig.11.19), however, the interaction between them was not significant.
Fig.11.18: Effect of age and nursery bag size on seedling mortality (%), six months after transplanting
Cocoa Research Institute of Ghana Annual Report 2010-2011
178

Fig.11.19: Effect of seedling age and nursery bag size on total seedling fresh weight at transplanting
Seedling total dry weight was significantly (p<0.001) increased by age and bag size (Fig.11.20), however, their interaction was not significant. The difference in age is due to accumulation of dry matter over the longer time.
Fig.11.20: Effect of seedling age and nursery bag size on total seedling dry weight at transplanting
Total percentage moisture in seedling tissue was significantly (p<0.001) increased by age (Fig 11.21), however, bag size and the interactions of the two factors were not significant. The younger seedlings had higher moisture with less dry matter accumulation within the shorter nursery period because the cells were possibly in the active cell division and elongation phase.
Cocoa Research Institute of Ghana Annual Report 2010-2011
179

Fig.11.21: Effect of age and nursery bag size on seedling moisture (%) at transplanting
Seedling stem girth at nursery (before transplanting) was significantly increased by age (p<0.001) and bag size (p<0.05) (Fig 11.22), however, their interaction was not significant. Stem girth increment, six months after transplanting, was not influenced by factors being studied (p>0.05).
Fig.11.22: Effect of age and nursery bag size on seedling girth (mm) at transplanting
Seedlings stem height at nursery (before transplanting) was significantly (p<0.001) increased by age (Fig. 11.23), however, bag size and its interactions with age were not significant (p>0.05).
Cocoa Research Institute of Ghana Annual Report 2010-2011
180

Fig.11.23: Effect of age and nursery bag size on seedling height (cm) at transplanting
Seedlings stem height increment, six months after transplanting (Fig.11.24) was significantly increased by age and its interaction with bag size (p<0.001), however, bag size was not significantly (p>0.05) affected. Generally, height increment in the six weeks old seedlings were greater than the eight weeks old ones except the smallest bags.
Fig.11.24: Effect of age and nursery bag size on seedling height increment, six months aftertransplanting
The number of leaves per seedling before transplanting, was significantly (p<0.001) increased by age (Fig.11.25), however, bag size and its interactions with age were not significant (p>0.05). Generally, the six weeks old seedlings had less number of leaves than the eight weeks old ones.
Cocoa Research Institute of Ghana Annual Report 2010-2011
181
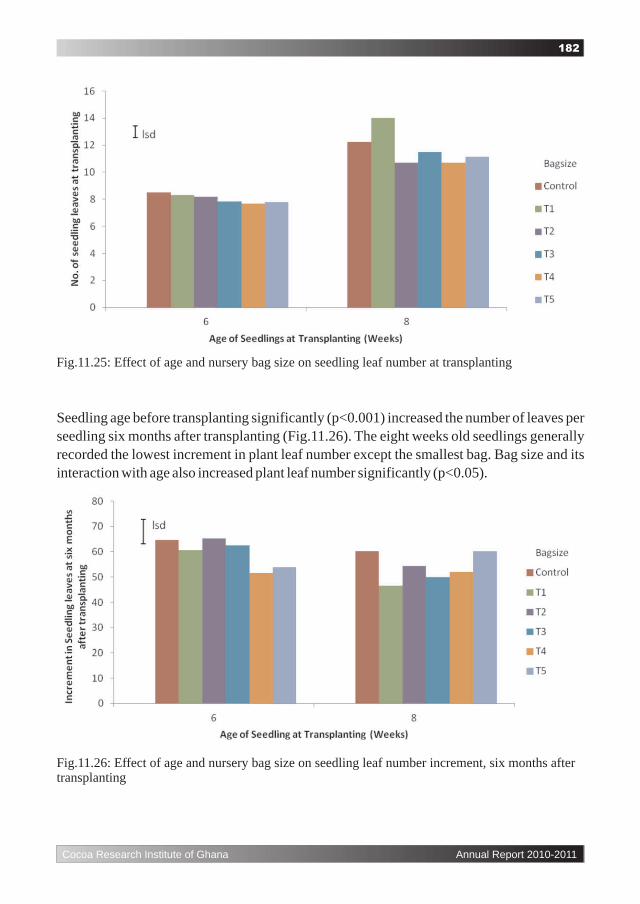
Fig.11.25: Effect of age and nursery bag size on seedling leaf number at transplanting
Seedling age before transplanting significantly (p<0.001) increased the number of leaves per seedling six months after transplanting (Fig.11.26). The eight weeks old seedlings generally recorded the lowest increment in plant leaf number except the smallest bag. Bag size and its interaction with age also increased plant leaf number significantly (p<0.05).
Fig.11.26: Effect of age and nursery bag size on seedling leaf number increment, six months aftertransplanting
Cocoa Research Institute of Ghana Annual Report 2010-2011
182

Improving the survival rate of transplanted over-aged cashew (Anarcadium
occidentale) seedlings (Patricia Adu-Yeboah, F. M. Amoah, A. O. Dwapanyin, K. Opoku-Ameyaw, J. Yeboah, S. Aquaye, F. Owusu Ansah,V. Anchirina)
The experimental detail of the above trial was presented in the 2009/2010 Annual Report (Rep. Cocoa Res. Inst. Ghana, 2009/2010).
The percentage survival of seedlings was significantly (p≤0.05) influenced by seedling age and pre-planting treatment (Fig. 11.27). Seedlings less than five months old and were pre-treated before transplanting recorded less survival than their controls. However, seedlings aged beyond six months which either had all their leaves halved (ALH) or roots pruned (PR) or leaves halved alongside root pruning (ALH+PR) gave higher survival above their controls, than the other pre-planting treatments. Leaf stripping (ALS) is the pre-treatment that supported the least survival of seedlings in all the categories.
Fig.11.27: Percentage survival of cashew seedlings as influenced by seedling age and pre-plantingtreatments at eighteen months after transplanting (ALH = All leaves halved; ALS = All leavesstripped; PR = Pruning of roots; NTRT =No pre-treatment)
Pre-planting treatments, seedling age and their interaction significantly influenced plant girth (mm), 18 months after transplanting (Fig.11.28). Generally, seedlings of different ages beyond five months and pre-treated by pruning of roots (PR) and halving of leaves alongside pruning of roots (ALH+PR) recorded bigger stem girth than their controls. All the other pre-treatments mostly had their girth records below their control.
Cocoa Research Institute of Ghana Annual Report 2010-2011
183

Pre-planting treatments and seedling age and their interaction significantly influenced plant height (cm), 18 months after transplanting (Fig.11.29). Apart from the All Leaves Stripped
(ALS) pre-treatment, all pre-treatments promoted height development than their controls in the field
Fig. 11.28: Effect of seedling age and pre-planting treatments on girth (mm) eighteen months aftertransplanting (ALH = All leaves halved; ALS = All leaves stripped; PR = Pruning of roots; NTRT=No pre-treatment)
Fig.11.29: Effect of seedling age and pre planting treatments on height (cm) eighteen months aftertransplanting (ALH = All leaves halved; ALS = All leaves stripped; PR = Pruning of roots; NTRT=No pre-treatment)
Cocoa Research Institute of Ghana Annual Report 2010-2011
184