Embed Size (px)
Citation preview

CoC
S~04
COMPARISON OF QUANTITY VERSUS QUALITYUSING PERFORMANCE, RELIABILITY, AND LIFE
CYCLE COST DATA. A CASE STUDY OF THEF-15, F-16, AND A-10 AIRCRAFT
THSIS
David C. MerkerFirst L~ieutenant, USAF
AFIT/GSM/LS%)/85S-23.DTIC._1 PI AIR FQUANTITYVERSUITUAIT
USNGPE DOMAnCE, RELIABILITY A ELELIFE
CYCLE COSTIATU.AT CAE AIR ORE HEO OG
.- jAITR UIVERSITY
W Wright.,Patterson Air Force Base, Ohio
.! 5"12 ,6 198
C.IT.

UAF'IT/GSL,4/L3Q/65:S "2 J
COMPARISON OF QUANTITY VERSUS QUALITYUSING PERFORMANCE, RELIABILITY, AND LIFE
CYCLE COST DATA. A CASE STUDY OF THEF-15, F-16, AND A-10 AIRCRAFT
THESIS
David C. MerkerFirst Lieutenant, USAF
AF12/ SM L" /8 .1-23 D.-T IC I., DEC 16198
Approved for pubiic release; distribution unlimited
IX

The contents of the document -are technically accurate, andno sensitive items, detrimental ideas, or deleteriousinformation are contained therein. Furthermore# the viewsexpressed in the document are those of the a~uthor(s) and doacot necessarily reflect Lhe views of the School of Systems
4 and Logistics, the Air University, the United States AirForce, or the Department of Defense,
i.!J tj AI It
C TD TC'A
IV
AFi T/GSM/LSQ/8 5S-23
COMPARISON OF QUANTITY VERSUS QUALITY USING
PERFORMANCE, RELIABILITY, AND LIFE CYCLE COST DATA.
A CASE STUDY OF THE F-15, F-16, AND A-10 AIRCRAFT.
THESIS
Presented to tne Faculty of the School of Systems and Logistics
of Lhe Air Force Institute of Technology
Air University
In Partial Fulfillment of the
ViRequirements for the Degree of
Master of Science in Systems Management
David C. Merker, B.S.
"First Lieutenant, USAF
September 1985
Approved for public release; distribution unlimited
•rn

Preface
The purpose of this study was to investigate the
quantity versus quality issue and to design a cost-
effectiveness model which incorporated mission
effectiveness, readiness, and life cycle costs. The
results of this thesis should help lefense decision makers
with weapon decisions which involve quantity versus quality
issues. The methodology that was developed, also has
general applications to other cost-effectiveness
comparisons.
During this research I have received a great deal of
support from many people. I would like to thank my faculty
advisor, Lt Col John Long for the many hours he devoted to
this effort. I v"ould also like to thank Dr. William Mauer
for his help and technical advice on the thesis. Finally,
I wish to thank my wife, Kathleen and sons, Jim and Daniel.
Without their support and understanding throughout the past
year, the thesis could not have been completed.
David C. Merker
ii

Table of Contents
Page
Preface. . . . . . . . . . . . . . . . . . . . . . . . ii
List of Figures. . . . . . . . . . . . . . . . . . . . v
List of Tables . . . . . . . . . . . . . . . . . . . . vi
_ Abstract . . . . . . . . . . . . . . . . . . . . . . . vii
I. Introduction . 11
Problem Statement . . . . . . . . . . . . .. 1-2Background. . . . . . . . . . . . . . . . . . 1-3Scope . . . . . . . . . . . . . . . . . .. . 1-6Research Objective. ............. 1-7Specific Research Questions . . . . . . . . . 1-7Assumptions . . . . . . . . . . . . . . . . . 1-9
I1. Literature Review . . . . . . . . . . . . . . . . 2-1
Introduction . . . . . . .... . 2-1"Advantages of Large Numbersof Simpler Aircraft . . . . . . . . . . . . . 2-3Disadvantages of Large Numbersof Simpler Aircraft . . . . . . .. . . . . 2-5Advantages of Smaller Numbersof More Complex Aircraft . . . . . . . . . . 2-7Disadvantages of the High TechnologyDesign Approach . .... 2-8The Defense Manager's Responsibilities . .* a 2-11Summary . . . . . . . . . . . . . . . . . . . 2-12
III. Design Background and Specific Methodology , . . 3-1
Background . . . . . . . . . . . . . . . . . 3-1The Objective . . . . . . .* 3-2The Alternatives ..... . . . . .. . 3-2The Costs . . . ...... . .......... . . . . 3-4The Criterion . . . . . . . . . . . . . . 3-4The Model . . . .' * * . . 3-5Justification of T;chniques ......... 3-5
Aircraft Effectiveness .......... 3-5Readiness . . ............... 3-6Life Cycle Costs; ........ .... 3-7
Specific Methodology . . .......... 3-8Attributes. . .. . . . 3-8Determine and Evaluate Respective Aircraft 3-12Multi-Attribute Value Function . . . . . . 3-13
1j~ iii
"Page
Individual Attribute Value Curves . . . 3-13Attribute Weights . . . . . . . . . . 3-15Equalization Calculations . . . . . . . 3-16
Readiness Values . . . . . . . . . . . . 3-17Life Cycle Costs Assoc'.atec u/•i•,iraft . . 3-18Cost-Effectiveness Model alculations. . . 3-19
IV. Calculations and Analysis . . . . .... 4-1
Determination of Attributes . . . . . . . .. 4-1Rank Ordering of Attributes . . . . . . . .. 4-3Determination of Aircraft Performance Levels. 4-4Development of Attribute Value Curves . . . . 4-6Attribute Weights.. ....... . . . . 4-7Equalization Calculation . . . . o . . . . . 4-8Readiness Calculations . . . . . . . . . . . 4-11Aircraft Cost Curves. . . . . . . . . . . . . 4-13Cost-Effectiveness Curve. . . . . . . . . . . 4-14
V. Summary and Conclusions . . . . . . . . . . . . . 5-1
Summary of Research . . . . . . . . . . . . . 5-1Conclusions of the Research Effort. . . . . . 5-2Recommendations . . . . . . . . . . . . . . . 5-5Suggestions for Further Research. . . . . . . 5-6
Appendix A: Individual Attribute Value Curves . . . . A-I
Appendix B: Attribute Weight Questionaire . . . . . . B-1
Appendix C: WSMIS Fully Mission Capable Data for theF-15, F-16, and A-10 Aircraft . . . . . . C-I
Bibliography . . . . . . . . . . . .. . . . . . Bib-I
Vita . . . . . . . . . . .D-,
iv
I C

List of Figures
Figure Page
1. General Cost Effectiveness Model . . . . . . . . 3-3
2. Example of Close Air Support Hierarchy . . . . . 3-11
3. Example Attribute Value Curve . . . . . . . . .. 3-15
4. Example Aircraft Cost Curve . . . . . . . . . . . 3-19
5. Augmented Close Air Support Hierarchy . . . . . . 4-2
6. A-10 Cost-Effectiveness Curve . . . . . . . . . . 4-16
7. F-16 Cost-Effectiveness Curve . . . . . . . . . . 4-17
8. F-15 Cost-Effectiveness Curve . . . . . . . . . . 4-17
9. Combined Cost-Effectiveness Curve . . . . . . . . 4-18
I,Vv
A

List of Tables
Table Page
1. Close Air Support Attributes ConsideredB> y Yonika . . . . . . . . . . . . . . . . . . 3-10
Ii. Close Air Support Attributes Consideredfor Analysis . . . . . . . . . . . . . . . . . 4-3
III. Ranked Close Air Support Attributes
Considered for Analysis . . . . . . . . . . . 4-4
IV. Individual Aircraft Attributes . . . . . . . 4-5
V. Attribute Ranges . . . . . . . . . . . . . . 4-6
VI. Attribute Weights . . . . . . . . . . . . . 4-7
VII. Multple Aircraft Attributes . . . . . . . . . 4-8
VIII. Aircraft Ranking . • . . . . .a. . . . . . 4-9
( Ix. Equalization Calculation . . . . . . . . 4-10
" X. Annual O&S Costs per 24 PAA Squadron . . . . . 4-14
Vi

AFIT/GSM/LSQ/85S-23
Abstract
ýhe primary emphasis of this research effort has been to
investigate the quantity versus quality issue and to design
a cost-effectiveness model to aid in evaluating it. This
model incorporates mission effectiveness, readiness, and
life cycle costs. The research effort was hinged around a
case study comparison of the F-15, F-16, and A-10 aircraft.
These aircraft were chosen because they represented varying
system complexities and were used as surrogates to high,
medium, and low complexity respectively. The comparisons
made in this thesis were intended to demonstrate the
usefulness of using aircraft effectiveness, readiness and
cost data in a mathematical cost-effectiveness model.
The methodology that was followed, involved combining
multi-attribute value theory, aircraft readiness data, and
aircraft Ii~e cycle cost information. The result of this
approach was a series of cost-effectiveness ratios, and a
.1 cost-effectiveness curve which incorporated the three close
air support aircraft. The cost-effectiveness curve provided
the costs, adjusted by both effectiveness and readiness
values. The results of this research indicate that the
approach used to develop the cost-effectiveness model does
provide a quantitative way to evaluate the problem of
quantity versus quality.
vii
COMPARISON OF QUANTITY VERSUS QUALITY USING
PERFORMANCE, RELIABILITY AND LIFE CYCLE COST DATA.
A CASE STUDY OF THE F-15, F-16, AND A-10 AIRCRAFT
I. Introduction
The costs associated with the development, production,
and deployment of new weapon systems are increasing at an
accelerated rate. Defense planners are constantly
confronted with the problem of developing systems that
provide the required national defense for the lowest price.
Increasing life cycle costs and production times are having
a significant effect on the readiness of the United States
armed forces, especially in the areas of availability and
supportability (14:70). Two types of weapon system design-
approaches that are frequently evaluated during the
conceptual phase are: 1) those that utilize superior system
performance and 2) those that use increased unit numbers to
meet mission requirements. In many cases either approach
can provide the required defense need; however, it is often
debated which one is the most cost effective.
The debate between the two weapon design approaches has
been voiced in many ways. Two of the more popular ways are
quality versus quantity and technology versus numbers. In
1-1

both of these cases the basic underlying question is the
same. Is it more cost effective to buy fewer high
technology weapon systems or a large number of less
sophisticated weapon systems?
In addition to the issue of weapon system costs, other
aspects of the Quantity versus Quality problem must be
addressed. One of the more important issues is the impact
of quantity versus quality decisions on national security.
The U.S. has followed the policy of creating weapons with
superior quality. United States officials and planners
believe that superior fighter quality will be the dominant
factor in future conflicts. It is commonly known, however,
tnat with regard to quantity versus quality the U.S.S.R.
has taken an approach opposite to the U.S. The U.S.S.R.
has committed themselves to creating a large force with
emphasis on superior numbers. Because of these different
fighting philosophies, and the unproven nature of each
sides assumptions, it is imperative that the quantity
versus quality issue be closely examined.
Problem Statement
There are two major system design philosophies that can
be used to meet the required defense needs. The first type
of design strives for advanced capability and requires
fewer individual numbers to perform a mission. The second
type of approach emphasizes simpler weapon design and
1-2
V'Vk

relies on greater numbers of units to meet the mission
threat. To date the research methods that have been used
ti quantify the costs associated with these two approaches
have not collectively taken into account irformance,
Sreliability, and life cycle cost data. because of this,
the information obtained from previous studies of quantity
versus quality do not provide an adequate basis of
comparison of the two design approaches.
The information and data obtainea from the comparison
of quantity versus quality, using a systematic mathematical
approach combining performance, reliability, and cost data,
will provide defense managers with a reproducible, less
biased decision tool. A mathematical approach will also
provide the manager with toore accurate information on the
costs and performane factors associated with the two
different system design approaches.
Background
A review of the work done on quantity versus quality
has revealed a great deal of activity. Past efforts toexamine the question appear to nave taken one of three
approaches,
The first approach found in the literature, looked at
the issue of quantity versus quality from a "gut" feel
positior. These reports usually looked at the problem from
the point of view of either a strategic/tactical or supply
1-3
availability position. The reports taking this path have
tended to rely on more subjective analysis rather than
rigorous mathematical models or computations. An example
of this type of approach is William S. Lind's article in
the September - October issue of Air University Review
titled "Quantity Versus Quality Is Not The Issue". In this
article Lind examines "typical" comments made by
individuals in favor of quantity. Without any computations
or rigorous analysis Lind concluded that:
The choice is not between quality and quantity. Itis between technological quility and tactical qualitywith quantity. We can choose between a small numberof relatively ineffective weapons or a larger numberof effective weapons. The real question is, why doesthe defense establishment prefer the former? (21:88)
In this case Mr. Lind made personal observations about
the issue of technology versus numbers, but did not use any
hard facts or data to back up his analysis. Because of his
nonrigorous approach to the problem his conclusions can be.
easily disputed by anyone with another point of view.
The second type of report written on this subject tends
to focus on the issue from the standpoint of life cycle
costs only. These research reports examined life cycle
cost issues of the problem using a rigorous cost analysis.
The cost analysis reports generally evaluated the two types
of system approaches side by side without regard to system
performance or reliability. An example of this approach is
a report done by the BDM Corporation for the Aeronautical
1-4
S. . .. . . . . . . . . . ... . ..*.. . ..1, . . . . . .• . .. . .: • . . . .• . . . . ...• ' , .. '. , . . , ,, '. . .• . . ." ' , ., . ' . , n , • • .. . , . [" • •

Systems Division's (ASD) Mission Analysis directorate in
1981. The report is titled "An Examination of the
Affordability of Increased Numbers of Less Complex, Less
Capable Aircraft". In this report the objective was to:
Estimate the numbers of aircraft that could beobtained by ,aaking trade-offs among procurementcosts, personnel costs, and maintenance costs,considering historical budget constraints. (3:8)
The report provides an overview of the effects of
different costs on possible aircraft numbers. BDM~s final
conclusion and recommendation to ASD was that "selections
considering quantities and qualities of forces must assess
relative effectiveness as well as costs" (3:87).
The final type of research available on the subject of
quantity versus quality evaluated the question using
scenarios to compare simple and complex systems. The
conclusions that appear in the literature for this type of
approach have been that simpler systems don't have the
capabilities of more complex systems.
An example of this type of report is " Austere vs.
Capable Aircraft Effectiveness Analysis" done by the Deputy
for Development Planning Directorate of Mission Analysis of
the Aeronautical Systems Division. The analysis used a
simulation model and compared the estimated numbers of A-I4
and F-15 aircraft that could be procured for equal life
cycle costs. This study appears to be the best comparison
used to date; however, it also neglects any reliability or
availability factors.
1-5

All three ajproaches take a limited view of the
question of quantity versus quality. The work cone in the
area of simulation and quantitative research has been
primarily initiated by the mission analysis directorates of
the Air Force Systems Command (AFSC). Unfortunately the
work done and methods used by these directorates are very
time consuming and are only used to evaluate systems on a
one time exception basis. The time and costs associated
with these studies are prohibitive, and not cost effective
for other than major weapon system decisions.
An added shortcoming of the quantitative reports
produced by APSC is that the computer simulation models do
not provide the defense manager with the insight into the
contributions of the individual aircraft characteristics.
The simulations also can not provide a view of the
interactions and synergisms associated with the collective
system's performance characteristics.
Scope
This research effort used only generally available
aircraft performance information and is unclassified. The
techniques and models used and developed by this research
do not compare all the possible performance or availability
characteristics of the representative aircraft, nor does it
examine all possible aircraft combinations. Only the Close
Air Support (CAS) mission was considered. The comparisons
1-6

made in this thesis are intended to demonstrate the
usefulnezz of combining aircraft effectiveness, readiness,
and cost data, in a logical mathematical model. This
logical mathematical model in turn is designed to help
defense managers to cope more effectively with problems
involving quantity versus quality.
Research Objective
The objective of this research effort was to investigate
the quantity versus quality issue and design a cost-
effectiveness model which incorporated mission
effectiveness, readiness, and life cycle costs. The
results of this thesis should allow a defense manager to
more adequately compare aircraft systems with advanced
capability versus systems that rely on greater numbers.
The methodology that was developed by this research has
general applications to other decision analyses involving
the quantity versus quality issue.
Specific Research Questions
Specific research questions that were investigated in
support of the objectives:
1. What are the aircraft attributee that most
substantially impact the Close Air Support (CAS) mission?
This question was directed to Maj Jack Shafer of the
Tactical Air Command (TAC) Combat Analysis Branch
(TAC/DOP). Major Shafer was the decision maker f.r the
thesis.
1-7

a. What are the individual performance
specifications of the representative aircraft for the
attributes selected in research question 4i?
2. What is the Multi-Attribute Value (MAV) function
for the attributes provided? This question is focused on
determining the rank order effectiveness of the
representative aircraft in the Close Air Support role.
3. What is the effectiveness ratio of one aircraft to
another, from the standpoint of performance? This will be
accomplished through a manipulation within the MAV function
to determine the effectiveness ratios of the representative
aircraft.
4. What are the "Steady State" readiness figures for
the aircraft? The steady state readiness numbers will
allow the effectiveness ratio determined from research
question #3 to be normalized with regards to aircraft
reliability data.
5. What are the estimated Life Cycle Costs (LCC) for
the representative fighter aircraft? The objective of this
question is to determine both the variable and fixed costs
associated with the three different fighter aircraft. To
allow an accurate comparison, the LCC data obtained for
each aircraft will be derived in the same way and include
the saine types of data.
6. dow appropriate is the application of the
methodology used for this research to other mission
1-3

decision analyses? The research performed in this thesis
should be generally applicable to other quantity versus
quality problems.
Assumptions
Four major assumptions will be followed in this
research:
1. All weapon systems that are compared have the
capability of performing the mission given sufficient
numbers.
2. Risks associated with the procurement of advanced
systems will be included in the cost of procurement.
3. Lead time and critical materials required to build
systems will not be considered as a factor of evaluation.
4. increased numbers involve increased resources (both
manpower and materials). These increased resources will
only be viewed from the standpoint of additional cost in
the mathematical calculations.
1-9

I1. Literature Review
Introduction
The United States government has recognized that the
cost of acquiring, fielding, and maintaining weapon systems
is growing at an astronomical rate. The increase in life
cycle costs and production time is ultimately effecting the
readiness of the United States armed forces in the areas of
availability and supportability (14:70). This trend has
caused the Department of Defense and the military servic s
'to institute programs to reduce life cycle costs and
increase productivity.
In light of these trends the United States has the
increased burden of developing effective ways to achieve
the best nation defense. There are three ways that
commanders and defense planners can develop and deploy air
power today: quantitatively, qualitatively, and a
combination of both (l12). Each of these three approaches
has advantages and disadvantages. Traditionally the United
States military leaders have followed one exclusive path.
The United states has emphasized quality overquantity in its efforts to counter the threatposed by numerically superior conventional Sovietforces. (19:4)
2-1
~~>A 41 ~ ~ ~ ~ r h~2.A.~ :~i~ i ~. ~

The issue of quantity versus quality has been around
for years, and many debates have occurred. In 1916
Frederick William Lancaster published a study on combat
effectiveness, looking at the combat issue from the stand
point of quantity versus quality.
Lancaster's law state[dl that the combat effectivenessof a force depends on the quality of the weaponsystems multiplied by the square of the size of theforce. (22:100)
4 This is one of the first formal attempts to try to
quantify the problem for the purposes of defense planning
and strategy. Since that time different policies have been
developed and tried within the Department of Defense.
Recently the emphasis on the issue of quantity versus
quality has increased. On 15 May 1979 The House Armed
Services Committee released a report that addressed the
problem of quantity versus quality,
The committee recommendled] that the EnhancedTactical Fighter (ETF) lnad in program be terminated.Instead of looking at aircraft that are more complex,more expensive, and more difficult to support andmaintain, the committee believes that the Air Forceshould expend some effort looking at less complex,less expensive aircraft concepts that will increasereadiness and increase numbers. (28:87)
In ocder to understand the implications of the quantity
versus quality issue it is important to know the many
factors involved with the question. The only way to make
an appropriate decision is to be aware of the trade offs.
2-2

Advantaeiý of Large Numbers of Simpler Aircraft
The advantages of large numbers of simpler aircraft can
be viewed in two ways. The first is the strengths
associated with simplified design. The second is the
effect that increased numbers have on readiness and war
fighting capability.
Simple aircraft offer the advantages of low cost(per aircraft], high manuverability, small sizeand lethality.., they have the capability to augmentcombat forces under conditions that would limit theeffectiveness of large sophisticated aircraft. (16:10)
The use of less sophisticated hardware to increase
reliability and system performance has been a very
practical approach to improve weapon effectiveness. "Most
industrial specialists agree that simplicity is probably
the single most important factor in achieving increased
reliability" (14:75). Success of several programs can be
directly attributed to the simplicity of their
system/subsystem design.
An example of a successful application of the
simplified system approach is the Hughes APG-65 multimode
radar system for the F-18 aircraft. The APG-65 has
approximately 15,000 parts and has achieved a Mean Time
Between Failure (MTBF) rate of approximately 110 hours. A
similar Hughes multimode radar selected for the F-4
aircraft with over 28,000 parts has only achieved a MTSF
rate of approximately 10 - 15 hours (14:75). In this case
2-3
T)A At n-

fewer parts and a less sophisticated design have improved
the MTBF ten fold. Another example of the use of less
sophisticated hardware is "the General Electric P404
engines powering the F-18 (which] have approximately 14,000
parts compared to 22,000 parts in the earlier General
Electric J79 engine ... the Mean-Time-Between-Failures on
the F404 engine is about five times that of the J79 ... "
(14:75).
In both of these cases the less sophisticated system
design provided the required performance with greater
reliability. Simplified design is good for a number of
reasons. Usually the most important reason, to the
manager, is the short term savings in the design andproduction costs. Another positive factor that must be
considered is the effect increased reliability will have on
lowering the operational and support costs in the future
(12:2).
The second major advantage is that availability of
larger numbers of aircraft is often useful to tactical
commanders. By increasing the physical numbers of aircraft
available for deployment, the range of influence of the
tactical forces can be substantially improved. Another
consideration is the effect greater numbers of aircraft
will have in a protracted conflict environment. Losses
2-4
V V

must be extected in combat, however, the more aircraft
available to fight, the less the impact of individual
losses. That is to say that if a force of two is available
to fight and one is shot down, the loss results in a 50%
reduction of the fighting force. However if a force of ten
was initially available, five individual units would have
to be eliminated in order to reduce the force by 50%.
A simplistic weapons approach was used quite
extensively in the Vietnam War by the Vietcong, who used
simple materials found in the field as crude weapons. For
example, the Vietoong would construct crude mortar
projectors out of pipes and bamboo. These weapons were
very inexpensive and simple to build. The individual units
were not very accurate, but, because of the large numbers
of units available, the overall system was very successful
in meeting its objectives. In this case the overall system
was very effective even though no one unit was required to
meet any stringent performance criteria.
Disadvantages of Large Numbers of Simpler Aircraft
The major fault with the less complex approach to
design is that even very simplistic weapon systems cost
substantial amounts of money when they are produced and
deployed in large numbers.
2-5

Larger numbers of austere [less complex] aircraftcan be procured versus a more capable aircraft fora given life cycle cost. However, the significantincrease in manpower (pilots, maintenance, etc) mustbe satisfied, the resulting basing and shelteringproblems must be resolved, and existing forcestructure constraints must be relieved. (9:4)
Large numbers of individual units can also cause a
great deal of strain on the spares and support pipelines.
An example of the effects of this strain can be illustrated
using historical data from the F-14A and F-1lIA aircraft
programs. In both of these programs there were not enough
spare parts available to meet the operational requirements.
Commanders were forced to remove working parts from downed
airplanes and use them to repair others. This is referred
to as "maintenance cannibalization" (14:44).
1 . on a per-l 0-sorties basis in fiscal year1979, that process (cannibalization] went ashigh as 69.6 [%] for the Grumman F-14A and39.4 M%] for the General Dynamics F-ll1A andF-1 1D . . (14:44)
This type of maintenance practice ultimately reduces
the overall availability of aircraft because the
cannibalized planes eventually develop other non-use
related maintenance problems. This type of situation can
be avoided by good initial planning by the acquisition
decision makers.
*2I
--•2-6

i
Advantages of Smaller Numbers of More Complex AircraftThe United States government has prided itself on its
ability to produce the 'best' weapon systems in the world
and in providing a strong defense for the U.S. and her
allies.
Proponents of quality fighters state thattechnology improvements are imperative to insuremore lethal and predictable results and to preventrecurrence of past mistakes in future combat. (16:1)
The decision to follow a technological quality design
approach is often made at very high levels of government.
One of the major considerations addressed by Department of
Defense planners and managers are the military personnel
responsible to act for the U.S. in time of conflict. The
human resources of the United States government are highly
regarded and not considered as 'generally expendable'. The
deployed weapons are built with the thought in mind that
the Armies should have the best equipment possible, and
this is achieved through the use of state-of-the-art
technology. Other governments, such as the USSR, consider
individuals as well as weapons as expendable and that
overwhelming numbers will be the deciding factor in future
conflicts.
Because of the advanced capabilities associated with
high technology programs, it is believed that fewer numbers
are necessary to achieve the desired defense need. It is
often thought that fewer numbers of individual units are
ea!-ier to maintain (16:4).
2-7

"Air Force planners must also address manageabilityof forces as still another justification forsophisticated aircraft. The probability of limitedforward operating locations in future combat zonessuggests that fewer aircraft incorporating the latesttechnological advances will be easier to manage andcontrol in at least three areas. In the communicationsarea... In the ground support area... Finally, fewerrecoveries and launches at forward operatinglocations. . . (16:4)
In the current era of super power cold war, it is
evident that the USSR is making strives toward military
improvement. In addition to the efforts of Russia to
maintain a quantity force, their advances in technology are
becoming very noticeable.
It is my impression that the Soviets will viscerallyprefer quantity over quality, but that they will soon(if not already) match our technological capabilities... In no case would I expect them [Soviets] to accepta numerical inferiority. (27:6)
With this thought in mind, it appears that any
lessening of the US technological advantage could tilt the
super power scale decisively in the direction of the Soviet
Union.
Disadvantages of the High Technology Design Approach
In a highly technological world the use of
sophisticated system designs to meet new and existing
threats is common. The problem with this type of thinking
is Lhat some system improvements are developed and
implemented without any real cost effectiveness comparisons
with existing or 'oieer' tecnnologies.
2-8

* iIn nearly every weapons system, designers havepushied technology as the solution to Americanmilitary problems, without distinguishing between• a .. innovations that simply bread extra layersof complexity and those that reiresent dramaticsteps toward simplicity and effectiveness. (13:21)
The advancement of the weapon technologies used
4 throughout the world has increased, the need for high
technology weapon systems in the United States. The
advantages and disadvantages of high technology, with
regard to cost, schedule, performance, and reliability, are
of constant concern to the program manager during the
acquisition of weapon systems. Many experts in the field
of weapon system acquisition agree that:
Complexity leads to: poorer reliability, loweravailability, [and] poorer maintainability, whichresults in low productivity, higher operating costs,increased maintenance load, and need for highlytrained personnel. (9:1)
Many of the new advanced weapon designs rely
exclusively on the use of state-of-the-art integrated
microcircuits. The microcircuit technology has improved
the actual number of processes that a system can perform;
however, the initial reliability of new microcircuit
technology has been, hiitorically, less than acceptable.
The increased use of modern microcircuits has sharply
decreased the reliability and performance of new weapon
systems. In fact, a technical survey in Aviation Week and
Space Technology even stated:
2-9

... in the past decade demands for increasedperformance became the primary driver of designefforts and the consistency with which a systemachieved this performance often became a inversefunction of it's sophistication and operationalcapability. (14:42)
The ARC-164 military radio illustrates the reliability
problems associated with 'pushing the state-of-the-art'.
It required almost five generations of design iterations
before it met the reliability standards required by the
Army (14:81). This redesign iteration was very expensive
and created substantial scheduling problems. This type of
design problem is generally known and is not uncommon. In
many cases, after several generations of design
improvements, the system no longer meets the state-of-the-
art requirements initially required.
One method used by design engineers to achieve greater
reliability with the new generation microcircuits is known
as redundant design. Redundant design creates multiple
electronic pathways within a system. This decreases the
reliability requirements of any one part while increasing
the operational reliability of the overall system. The
* major problem with redundancy is that it reriires very
expensive and time consuming engineering design. This
increases the cost of Research and Development (R&D) and,
in most cases, expands the schedule. The redundant desiin
approach is generally scrutinized by defense program
managers because it increases the front end costs of a
program (17:23).
~ {j.. ,$ \' V\~YY. ' 'V "~'.'2-1'0 ~
IUZ~~~~~~ 1f~ 11 ý Io111 1I

An added consideration that must be made by the pcogram
manager regarding high technology weapon systems is whether
or not they will require specially trained personnel or
special facilities to maintain them. This must be
considered by defense managers and planners due to the
additional costs and planning required for the system.
The Defense Manager's Responsibilities
The defense program manager has the overall
responsibility oi implementing the applicable regulations
and directives, and assuring that the system meets certain
performance criteria. Trade studies must be performed and
reviewed to determine the different design approaches that
will satisfy the regulations, directives, and performance
requirements. DoD Directive 50ia.40 rates the operational
availability of a system as important as its operational
performance. This directive requires defense program
managers to thoroughly consider system reliability and
performance factors.
In the area of system performance and reliability, the
program manager must insure that the system design meets a
predetermined availability and performance criteria. This
can be achieved by a number of different design approaches
(12:3). The manager must compare factors, such as life
cycle costs, producibility, maintainability,
supportability, and mission need, so that the best design
methodology can ou found.
2-11
'!A~

The refinement of requirements from general system
specifications to specific system specifications is
accomplished through a systematic review of cost, schedule,
and performance trade offs. One of the initial trade offs
that must be explored is the affect of different
performance requirements on the acquisition of the total
system. This type of trade study was performed on the F-15
aircraft to determine the optimum thrust-to-weight ratio of
the engine to the air frame. The trade study initially
determined that an 8:1 thrust-to-,weight ratio from an F-100
Pratt & Whitney engine would present more reliability
problems than the existing 5:1 and 6:1 ratio engines. When
the cost, schedule, and performance trades were all
completed and analyzed, it was determined that the 8:1
ratio was needed to meet the stringent performance
requirements. This decision increased the performance of
the aircraft at the expense of reliability and possibly
availability (14:44).
Sumnmary
There are many factors that influence the acquisition
of a new weapon system. Defense planners and managers must
iook at all the different elements of the problem. There
is a danger if only one of the elements is considered
without consideration of the others.
2-12

If reliability (for example] has the maximumpriority, the designer will use only the highestquality, expensive parts. Furthermore he willnormally build equipment larger and heavier sincelarger and heavier equipment tends to be morereliable. He will also need to trade off performance,survivability, and human factors. (20:26)
The aforementioned passage illustrates why weapon
decisions mus• be made with the total system requirements
in mind. The program manager must always trade off the
advantages and disadvantages of all the factors involved in
a program before making a decision. The emphasis must
always be on the total system to obtain the best mix of
possible design alternatives and life cycle costs.
The advantages [found with less sophisticatedaircraft] of predicted higher reliability, feweraircraft systems, and less complex maintenancemust be weighed against the disadvantages ofpossible increases in maintenance, supply, andservicing transactions at base level. (16:13)
The decisions made during the development and
production phases of a system are very complex and
interdependent. Design decisions made during the
acquisition phases will effect both the performance and
total life cycle costs of a system. These decisions must
be carefully considered because of the military importance
of these programs and the limited funds available. The
cost effectiveness studies used in the procurement of
weapon systems ultimately determine the total number and
capabilities of the weapon systems the United States can
2-13

deploy. In an ever changing world, the dollars saved, or
well invested today, will be the cornerstones of a strong
national defense tomorrow.
2-14

I11. Design Background and Specific Methodology
Background
A specific set of procedures used to develop a
mathematical approach to the problem of quantity versus
quality is presented. The method draws upon the concepts
of traditional cost-effectiveness analysis combining
mission effectiveness, readiness and life cycle cost data
into a quantitative decision tool. In order to appreciate
the selection and application of the techniques used in
this thesis, it is necessary to understand the foundations
and general characteristics of cost-effectiveness
techniques.
A cost effectiveness analysis "is any analytic study
designed to assist a decision maker identify a preferred
choice from among possible alternatives" (23:2). The
general cost effectiveness model, as shown in Figure 1,
displays the basic sub-elements contained in a cost-
effectiveness analysis. The sub-elements of the model are:
i*,4q (23:5)
.1. The Objective - The policy or course of actionthat the organization is attempting to maximize orminimize.
2. The Alternatives - The set of possible solutionsthat can be employed to chieve the desired objective.
3-1l
41,
3. The Costs - The amount of penalty (cost orresource) associated with the choice of a alternative.
4. A Model - The introduction of artificial factorswith the assumption that the factors arerepresentative of the real external environment.
5. The Criterion- The predetermined measurementmethod that will be used to judge the alternatives.
The method that was used for this thesis is very
similar to the analysis structure shown in Figure 1. The
only major difference between this thesis and Figure I is
that system cost will be incorporated into the
effectiveness calculation. All the basic sub-elements are
still present and are presented below.
The Objective
The objective of this research has been defined in
Chapter 1. In essence the objective was to determine the
lowest cost required to meet mission requirements, given
the constraint that aircraft with different capabilities
are to be compared.
The AlternativesThe alternatives evaluated in this research were the
different aircraft available to meet a desired defense
mission. These aircraft 1neet the defense needs with the
use of either high, medium, or low technology. As
mentioned in Chapter II, there are many aesign approaches
and varying technologies that can be employed to achieve
the same mission result. This thesis only looked at a
3-2

4-4.
z N
E-4J
z 0
E44
4- 4-'- %vs '. 4-o r- It
3-3
-- , ., .•-,.• ,•,•',.',', •4' ;. .. , ,- -. z. .. V ,' ".; .,' , , ,., .: •.z • .• • .. ,,,. ,. , V.,., •._

comparison of individual aircraft alternatives. Approaches
that involve technology and aircraft mixes were not
evaluated.
The Costs
The costs of the different alternatives were obtained
from accepted Air Force publications, such as Air Force
Regulation 173-13 (Cost Analysis: US Air Force Cost and
Planning Factors) and the cost library of the Aeronautical
Systems Division of Air Force Systems Command. The costs
examined for the thesis included all facets of a system's
life cycle.
The Criterion
The criterion that was used to evaluate the different
alternatives were the total life cycle costs associated
with the different systems, given a specific effectiveness
level. This thesis evaluated three aircraft systems with
regards to close air support mission requirements. In
addition different levels of aircraft quantities were
considered. Different aiccraft quantities were examined,
because the influence of R&D, O&M, and Production costs
often differ over a range of aircraft numbers.
3-4
MI

The Model
The crux of this thesis involved the development of a
mathematical approach which incorporated mission
effectiveness, readixness, and life cycle cost. The model
that was developed in this thesis demonstrated a
quantitative approach to the problem of comparing systems
which incorporate high technology versus ones which rely on
numbers.
Justification of Techniques
Aircraft Effectiveness. There have been many methods
devised to either objectively or subjectively analyze the
e ffctiveness of aircraft systems. Historically
effectiveness was evaluated by simply exanmining the
positive and negative characteristics of a system. In more
recent times it has become increasingly difficult to
measure effectiveness because of advanced technology and
system complexity. In modern systems the sheer numbers andý
complexity of sub-systems make it physically impossible to
evaluate all the characteristics without some type of
advanced data processing.
A systematic approach to evaluate effectiveness of
systems has been developed by the management science
(operations research) professional discipline and is knownas Multi-Attribute Value (MAV) analysis. This approach
uses a mathematical algorithm which evaluates each
3-5

characteristic, or attribute as it is usually referred to,
from the point of view of its value. Value refers to the
attribute's contribution to the system's ability to meet a
specified mission requirement. The values or attribute
weights are assigned within the algorithm by an individual
.2 or set of individuals known as decision makers. The
decision maker for this thesis was required to be an expert
exceptionally versed in the mission area.
The strength of the MAV analysis is that it allows the
researcher to compare very complex systems by breaking them
down into manageable sub-elements, and to quantitatively
evaluate the sub-elements. Ultimately, the MAV approach
4i provides a logical and decomposable measure of a system's
effectiveness.
The topic area of system effectiveness among close air
support aircraft, using MAV theory, has been researched by
Maj David P. Yonika (23) for a Masters thesis in 1985. The
results of the research conducted by Maj Yonika were used
as a major input to the effectiveness calculations used in
this thesis. Due to different assumptions and research
objectives some additional attributes were added to his
original work.
Readiness. One of the foremost areas of concern within
>1 the Department of Defense is the readiness of its forces.
For the purposes of this thesis, system readiness will be
synonymous with the Fully Mission Capable (FMC) rate.
3-6

Fully mission capable rate is the percent ofpossessed time that a system is capable ofperforming all of its assigned peacetime andwartime missions. (2:A2-2)
In this thesis the percent of aircraft that were fully
mission capable was used in the calculations.
The United States Air Force uses many different methods
to measure the actual operational time and total time
possible for a weapon system; however, the one that will be
used in this thesis will be data from the Weapon System
Management Information System (WSMIS) database. WSMIS is a
database maintained by the Air Force Logistic Command
(AFLC). The data is generated by the commands which
operate and support the different weapon systems.
Life CXcle Costs. The basic elements of a weapon
system's life cycle costs are research and development,
production, operation and maintenance, and disposal costs.-
The combination of all these costs compose the total
systems life cycle cost. In order to adequately compare
systems all of these costs must be addressed. The United
States Air Force has developed a cost analysis regulation
that;
... contains official U.S. Air Force cost and planningfactors that can be used to estimate resourcerequirements and costs associated with Air Forceforce structures, missions, and activities. Inparticular, the regulation is primarily concernedwith operating and support (O&S) cost estimates forAir Force aircraft. (61i)
3-7

This thesis used tLt data available in AFR 173-13 in
order t6 calculate the O&S costs associated with the
different systems to be evaluated. The R&D and production
costs were obtained from historical Air Force cost
archives. Emphasis was placed on cost comparability. For
the purpose of this thesis the disposal costs associated
with the weapon systems were ignored. this was a somewhat
reasonable assumption, because the dollar value associated
with disposal is usually minimal as compared to the other
costs.
pe•ific Methodology
An aircraft effectiveness calculation methodology was
developed by Yonika using a Multi-Attribute Value (MAV)
function. The MAV function is calculated using a computer
program. The program is user friendly and provides a
sensitivity analysis on the data. To demonstrate the
computer program, Yonika evaluated close air support
aircraft using a set of nine attributes. This thesis
employed the computer MAV program and utilized the same
Decision Maker (DM) used by Yonika. Due to the assumptions
and approach taken in this research, the actual attributes
used were examined and augmented as needed.
Attributes. the first step in evaluating the cost
effectiveness of close air support aircraft was to
3-8
V.7j

determine the mission objective that was being sought.
This mission objective is the top element of a hierarchy of
objectives. The sub-objectives were assumed to be
independent of each other. Each individual sub-objective
lead to the determination of a corresponding system
attribute. The specific goal of the hierarchy was to
achieve a logical stepwise breakdown of the mission
objectives to the point where specific attributes
necessary to attain the objectives, could be obtained. The
way the hierarchy works is that the introduction of theattribute performance levels and sub-objective values
Senables the ranking of alternatives with regards to the
main mission objective (18:34-48).
Yonika developed a hierarchy for the close air support
mission. This hierarchy is shown in Figure 2. Because of
the different assumptions and specific scope of Yonika's
research as compared to this research effort, pocslble
additions to the sub-objectL.ves and attribute set were
-xploreu. In light of. currcnt and hLstorical CAS mission
requirements, the Decision maker (WM) ',as requested to
evaluate the 9 attributes (Table I.) and necommend possible
additions. Possible additions included aircraft arname.,es
as an example.
3-9
*IYm ]

Table I
Close Air Support Attributes Considered by Yonika
1. Sustained Turn Rate 6. In-route sustained speed2. Maximum Instant 7. Maximum Speed3. Take-off distance 8. Total Loitering Time4. Landing distance 9. Combat Radius5. Thrust-to-weight ratio
(29)
There were many procedural requirements that must be
followed to insure that the attributes used are valid with
the MAV approach.
It is important in any decision problem that the setof attributes be complete, so that it covers all theimportant aspects of the problem; operational, so theit can be meaningfully used in the analysis;decomposable, so that the aspects of the evaluationprocess can be simplified by breaking it down intoparts; nonredundant, so that double counting ofimpacts can be avoided; and minimal, so that theproblem dimension is kept as small as possible. (18:50)
Considerations of the above requirements have been
observed and are discussed at length in Maj Yonika's
thecis. To save time and to avoid lengthy rework of the
effectiveness portion of this theais, the research done by
Yonika on the MAV computer program, the Pairwise
Preferential Independance (PPL) existence among attributes,
and the additive relationship of the value functions was
considered sufficient for this thesis.
After the attributes were determined by the DM, he was
instructed to rank order the different attributes with
3-10
,.;•

M~aximi:.o CASMission
Mdximii:Sur~vivability
Probability oL ProbaIbility9 01
MinimizeProbability ot
Hit iveriUatection n4I ProbautiiLy Uf
maximize racytt on runevisapon MissUistanc,ý
Max illI .Lr Max oI aizTrurn Perfoxioance Eqess aCapauiltty
Instant and maximum S3peed rXMI) to Vr~l'tSUst. I nod 'V10 ratioI
to rargot tiltlol to rd,~vtt
Optimize Airborne MAIXimiz* Combat Optimize ror~ard Maximize 1unroutl.Alert CapJob~i~ty iRackus Oising apalbLItLty p.
Att-ibU~t*1 Attributet ,,,iuv ~ tiutetLoi.ter Vime CombiAt RidiUS Cwnbi§t L ruitoll unrout.t .-c'Ld
Combat L.ND R~oll
F'ig. 2. ioxample of close Air Support Hierarcny
3-11

regards to their importance to the close air support
mission. This rank ordering of the attributes concluded
the first phase of this thesis.
Determine and Evaluate Respective Aircraft. Phase two
of this thesis involved the determination and evaluation of
the representative aircraft to be used for the comparison.
Within the past few years aircraft technology has grown a
great deal within the aerospace industry. Many attempts
have been made to separate aircraft systems with regards to
the amount of technological sophistication they employ.
Three categories of this technological sophistication are
often referred to as high, medium, and low complexity.
Aircraft that are considered to fit these three categories
respectively are the F-15, F-16, and A-10 airc:aft.
For this thesis the perceived categories of high,
medium, and low complexity represented the ideal of system
quality. The research assumption that is connected with
this consideration is that the lower the "quallty" of the
aircraft the Areater the numbers of aircraft required to
effectively compensate for the lower technology.
The next step in the thesis process involved the
collection ok the phase 1 attribute values for the three
aircraft being evaluated. Because of the general structure
of this thesis, the three aircraft were used only to
demonstrate the value of this cost-effectiveness approach
over a representative range. For purposes of follow on
3-12

work, any number of aircraft can be used and evaluated
using these techniques.
Multi-Attribute Value Function. The MAV function was
used to determine the amount of each aircraft it would take
to have a comparable effectiveness. The first stage of the
MAV function analysis was to find and assign an expert
Decision Maker (DM) from the mission area. For this thesis
the DM was chosen because of his expertise and previous
contribution as a D14 to Major David Yonika's close air
support study.
Individual Attribute Value Curves. The individual
attributes determined in the first step of the research
were broken down into individual value function curves.
These value function curves showed quantitatively what the
marginal value was for additional attribute performance.
The purpose of these curves was to display each attribute,
and its value over a predetermined range. These curves are,
particularly useful when the marginal value of additional
performance is not linear. Because of the non-linearity of
many real world situations, the use of these curves allow
for a more realistic measurement.
The first step in developing the different value
functions required that the individual attribute
performance ranges be determined. This was accomplished by
.. 3-13

reviewing the ranges of the aircraft which were to be
evaluated. These ranges were then plotted over a
normalized value range, with the lowest value being
normalized at 0 and the maximum value being normalized at
1.00
To determine the actual value function curves the
Decision Maker was asked to evaluate the individual
attribute functions using a midvalue splitting technique.
Because of the non-linearity of additional attribute
performance, a midvalue splitting technique was used to
build each value function curve. This technique divides
the normalized values into individual points by halving the
difference between the lower and higher attribute
performance. The splitting or halving of the value
function is accomplished by determining the point where the
upper interval and lower interval are "differentially value
equivalent" (18:120). That is to say, the point were the
change from the lower value to this point is equal to the
change from that point to the higher value. This splitting
process was accomplished three times on each aircraft until
value points are obtained for the 0, .25, .50, .75, 1.0normalized levels. A sample attribute curve is shown in
Figure 3. This process was continued for each attribute
until all value function curves were developed.
The actual value function curves are DM dependant. The
shape of the curves will be different from one DM to
another, depending on their experience and biases.
3-14

.75 -
Normalized .50 -
Value
.2.5
10 17.5 25
Turn Rate, degrees/second
Fig. 3. Example Attribute Value Curve
Attribute Weights. The next step in the process
was to develop the attribute weights. For this portion of
the analysis the attributes needed to be ranked as tu their
importance. This ranking was performed in the first phase
of the thesis process. The actual weighting process is as
follows:
the DM is asked to provide levels of attributesthat would make the two alternatives equivalent orindifferent. The first (attribute] is tested with thesecond, the second with the third and so on. The DMis first given an alternative with all attributes atthe lowest level except one, the 'i'th attribute. Thelevel of the 'i'th attribute is set at a convenientlevel, the .5 value level, for example. The DM is thenpresented with a second alternative, on with all thealternatives (including the 'i'th) set at their lowestlevels. The DM is asked to provide the level of the'i+l' attribute that will make both alternativesequivalent. In this manner n-I simultaneous equationsare determined, this combined with the stipulation thatall of the weights sum to one, the weignts can becalculated. (29:2.22)
3-15
¶..
Squalization Calculations. The major separation
from traditional MAV function analysis occurs at this point
in the research. The effectiveness values that were
developed using the above mentioned techniques were only
ordinal in nature. In order for the different aircraft to
be compared it was necessary to evaluate them in a ratio
fashion. The method that was employed to do this
transformation involved the manipulation of the aircraft
attributes values.
Step one, the aircraft attributes from phase one were
evaluated to determine which of them were influenced by
changes in aircraft numbers. Step two, the curves og thooe
attributes were manipulated until all three aircraft had
the same effectiveness value. The aircraft ratios obtained
from this evaluation were equivalent to the amount of
additional aircraft numbers needed to make the
effectiveness values equal. By following this procedure
and having the effectiveness values equal, the researcher
can infer that the eftectiveness of each aircraft set ia
equal or indifferent in a comparison. For example, if 1.5
.V of aircraft 1 are required to increase its effectiveness
value so that it 1i; equal to aircraft #2, the ratio of
aircraft one to two would be 1.5 to 1.
3-16

Readiness Values. Information from the WSMIS data bank
was obtained on the three weapon systems' Fully Mission
Capable (FMC) rates. This information was in the form of
the percentage of time the aircraft was fully mission
capable for missions during the last 2 years. Care was
taken to avoid the incorporation of other than "steady
state" availability information. For purposes of this
thesis the term steady state refers to the relative
equilibrium of the data. The availability percentage was
the normal expected Average FMC percentage, not positive or
negative extremes.
The availability data was incorporated into the
effectiveness ratio by dividing the eespective
effectiveness ratio number by the percent availability
number. This incorporation of availability data adjusted
the effectiveness ratios to include aircraft readiness.
These adjusted effectiveness ratios represent the number of
each aircraft necessary to meet the same effectiveness
goal. The lower the availability percentage , the gr'iater
the number of aircraft required. For example, an aircraft
system with an availability percentage of .90 and an
individual effectiveness of one, woUld require that 1.11
ai.rcraft be available un the flight line.
Tne adjusted effectiveness ratioa obtained from these
calculations were consideted the Equilization `0E" .atio.
The "E" ratio was used later in the vesearch to develop the
equivalent cot-effectiveneus corves.
3 -17
N -4. t.S A,~jJ~¼.-

Life Cycle Costs Associated w/Aircraft. The next step
in the thesis was to obtain and evaluate the Life Cycle
Costs (LCC) for the F-15, F-16, and A-10 aircraft. This
included the determination of the research & development,
production, and operational costs for each of the aircraft.
The LCC data for all three aircraft systems were obtained
from AFR 173-13, the 3DM Corporations study on Quantity
Versus Quality (3), and the ASO cost library. Emphasis was
placed on confirmation that the information from these
libraries and references contain equivalent and comparable
cost information. A series of aiccraft cost curves were
constructed using the LCC data. The cost curves were built
by first incorporating the R&D costs. These costa included
the development of the first production model aircraft, as
well as R&D costs associated with other more advanced
aircraft models.
The total R&D costs were provided as a baseline to
which the other two costs were added. The Operation and
Support and production costs were then introduced. The
curves were arrannred so that total costs were on the
ordinate and the numbers of aircraft were on the abscissa.
An example of the individual aircraft cost curve is shown
in Figuice 4. Note that the O&S, and Production costs are
actually step functions. 3Iowever 3 over the large range the
curves appear linear.
3-18
•'/ e • 2• • • ••5 2' ' • • • •••2'' ,'•."•"•••''',,••,,,•,i.•.',

Cost-Effectiveness Model Calculations. The values
that were obtained from the previous procedures were
combined in this stage of the research. The internal
manipulations within the MAV function provided the basic
effectivenesa ratio of F-15:F-16:A-10. This ratio was then
combined with the steady-state availability information
obtained from the WSMIS database. This procedure
incorporated the readiness information with the basic
effectiveness ratio. As mentioned
30
20 /* (Production Costs)(8$) *--
1 Costs est. for 20 yrs)
(R&D Costs)
10• 200 300 400 500 600 700 800(Numbers of Aircraft)
Fig. 4. Example Aircraft Cost Curve
earlier, this new ratio was considered the Equalization "E"
ratio. The idea behind the E-factor is that it is an
estimate of how many of each of the three aircraft are
required to pertorm an equivalent mission.
3-19

The "E" factor provided a base from which the cost
comparisons were developed. The development of the "E"
ratio was, in essence the model portion of the Cost-
Effectiveness analysis.
in order to evaluate the comparative cost per aircraft
system the LCC information and "E" ratio were introduced
into the model. The cost per aircraft information was
adjusted to the "E" factor ratio. This incorporation of
LCC to the data obtained from the mission effectiveness and
reliability calculations provided a comparison of the three
systems over a range of different aircraft numbers.
The final step in the thesis was to compare the
different total aircraft costs over various quantities.
The graphical display of this information provided a more
accurate cost-effectiveness association between the
different aircraft systems.
3-20
* 1Z

IV. Calculations and Analysis
This chapter presents the data, calculations, and
analysis found and developed in conjunction with this
thesis. The presentation of the data and calculations will
follow the methodology set forth In chapter 3.
Determination of Attributes
As mentioned in chapter 3, the actual attributes used
for the study are determined through the development of a
Close Air Support (CAS) mission hierarchy. The top element
of that hierarchy is the mission objective. In this case
the mission objective was to maximize Close Air Support
(CAS) effectiveness.
The foundation for the hierarchy used in this thesis
has been shown in Figure 2. Additional research into the
subject of the CAS mission prompted the inclusion of
aircraft armaments into the hierarchy. This required that
one new sub-element be added to the basic hierarchy
developed by Yonika. The added sub-element was to
$maximize the probability of a kill'. This sub-element is
an additional lower tier of 'maximizing the probability of
mission success'. The rational behind this inclusion is
that CAS mission success is more than just arriving at the
target on time. It has to include the probability that the
4-1

- -
N0 .. z*j
Hud z ca M
04~- It' n ý
c) z)n . P440 olq w t.4 t
LI 1AE#qu4 b >U X t
-4.I P 4* 0- ci 4
M 1. inW tU)E m'4 Hh4I ). 04= 14 Z: 4
bý4
Nn z
A 414)
3 0rja fi4 c"
w H 0 rHl
h. a. A4l u D
04 (n 0 0 -
x U3. u) E.t,
V 614- hi HO MU)-2
HN I-4..~.4 r~a N>4 C

*-- enemy can be defeated or contained. The sub-element
'probability of kill' is further defined by its lower tier
element 'maximize firepower'. Maximizing firepower
introduces aircraft armaments into the hierarchy as new
attzibutes. The types of armaments have been
broken into 3 types: smart bombs, dumnb bombs, and
projectile cannons. The new CAS hierarchy is illustrated
in Figura 5,
The enhanced CAS hierarchy contains 12 individual
aircraft attributes that we,. used in the Multi-attribute
Value analysis. Ttie new set of aircraft attributes are
shown in Tablj II.
Table II
Close Air Suipport Attributes Considered for Analysis
1. Sustained Turn Rate* 8. Total loitering time*2. Maximum Instant Turn Rate* 9. Combat radius*3. Take-off distance* 10. "Smart" bomb capacity4. Landing distance* 11. "Dumb" bomb capacity5. Thrust-to-weight ratio* 12. Projectile Cannon 30mmG. In-route sustained speed*7" Maximum speed*
* Attributes obtained from Maj Yonika's Thesis (29).
SRank Ordering of Attributes
In order to assign individual weights to the
attributes, it was necessary to rank them in order of their
importance. To do this the Decision Maker (DM) was given
the attributes as shown in Table II and asked to prioritize
4-3

them with 1 being the most important, 2 the next in line
and so on. In addition to ranking the individual
attrikutes, the DM was asked which of the ay.tributes would
be effected by increased aircraft numbers. The attribute
ranking and the analysis for the impact of increased
numbers, as provided by the DM, is displayed in Table III.
Table III
Ranked Close Air Support Attributes Considered for Analysis
ATTRIBUTES MEASURE IMPACTED BYNUMBERS
1. Sustained Turn Rate Deg/sec NO2. Maximum Instantanious Turn Rate Deg/Sec NO3. Projectile Cannon (30mm) numbers YES4. "Smr4ctl bomb capacity numbers YES5. Thrust-to-weight ratio T/W NO6. Maximum speed Mach NO7. Total Loitering time Hr YES8. "Dumb" bomb capacity numbers YES9. Combat Radius Nm NO
10. In-route sustained speed Nm/hr NO11. Combat Take-off distance (roll) Ft NO12. Combat Landing distance (roll) Ft NO
Determination of Aircraft Pecformance Levels
In order to evaluate the different aircraft with regard
V: to their effectiveness it was necessary to first determine
the individual aircraft performnance levels. The
performance parameterv for each of the three aircraft were
restricted to a typical CAS mission scenario. Despite the
tact that it is difficult to come up with a "typical" CAS
4-4

performance set for each aircraft, the literature and
informed sources suggest that the values displayed in Table
IV are reasonable. (15; 11:1) The four attributes that
were identified by the DM as being impacted by numbers are
shown in brackets.
Table IV
Individual Aircraft Attributes
Aircraft
Acry" A-10 F-16 F-15
STR 12 14.8 13.5MITR 18 22 23.5pc [1] [01 [0]PC [4] [6] [8]
T/W .42 1.1 .95MS .65 1.1 1.1TET [ 1.7 ] [ .5 ] .5 ]B ( 11 2]
CR 250 500 350ISS 3•0 500 540TOD 1450 1500 2700
LD 1300 1500 4500
From the attributa levels in Table IV a set of ranges
for each of the 12 attributes was obtained. The attributes
and their respective ranges are listed in Table V. Note
that the 4 attributes previously idettified as being
effected by increased numbers have ranges in excess of than
any of the individual pecforinance values found in Table IV.
The larger range valuLs were introduced to allow for
multiple aircraft calculations in the equalization 'E'
4-5
equation. The 'E' calculations will be presented later in
this chapter.
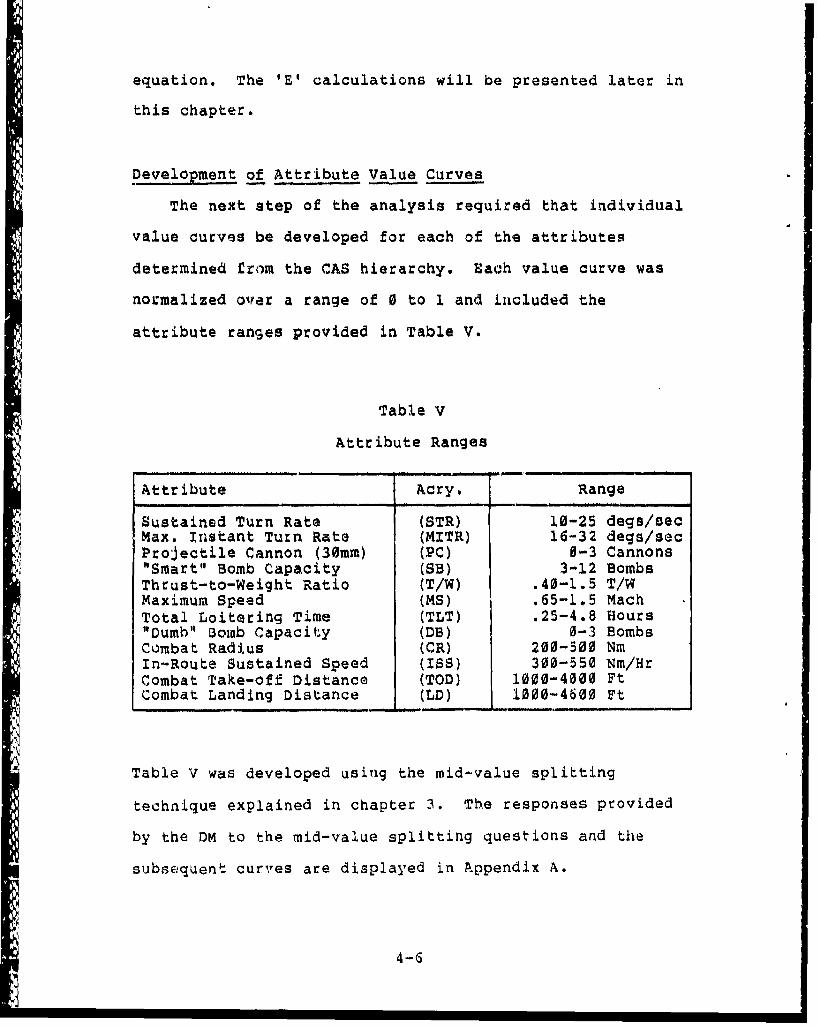
Development of Attribute Value Curves
The next step of the analysis required that individual
value curves be developed for each of the attributes
determined trom the CAS hierarchy. Each value curve was
normalized over a range of 0 to 1 and included the
attribute ranges provided in Table V.
Table V
Attribute Ranges
- •... ...... .. . . .. - - - n
Attribute Acry. Range
Sustained Turn Rate (STR) 10-25 degs/secMax. Instant Turn Rate (MITR) 16-32 degs/secProjectile Cannon (30mm) (PC) 0-3 Cannons"Smart" Bomb Capacity (SB) 3-12 BombsThrust-to-Weight Ratio (T/W) .40-1.5 T/WMaximum Speed (MS) .65-1.5 MachTotal Loitering Time (TLT) .25-4.8 Hours"Dumb" Bomb Capacity (DB) 0-3 BombsCombat Radius (CR) 200-500 NmIn-Route Sustained Speed (ISS) 300-550 Nm/HrCombat Take-off Distance (TOD) 1000-4000 FtCombat Landing Distance (LD) 1000-4600 Ft
Table V was developed using the mid-value splitting
technique explained in chapter 3. The responses provided
by the DM to the mid-value splitting questions and the
subsequent curves are displayed in Appendix A.
4-6

Attribute Weights
The weights of the individual attributes were obtained
from the Multi-attribute Value (MAV) computer program
provided by Yonika. The program was designed to provide a
series of comparative questions about the attributes to the
DM and to collect his respective answers. The questions
were organized in a sequence determined by the priority of
the individual attributes. From the DM's responses a set
of simultanious equations were constructed and solved. The
solutions to the simultanious equations determined the
weighting of the different attributes. The comparative
questions and DM responses are displayed in Appendix B.
The weights obtained from the computer program for the
different attributes are shown in Table VI.
Table VI
Attribute Weights
Attribute Acry. Weight
Sustained Turn Rate (STR) .259Maxo Instantanious Turn Rate (MITR) .240Projectile Cannon (30mm) (PC) .223"Smart" Bomb Capacity (SB) .223Thruat-to-Weight Ratio (T/W) .024MaxL•um Speed (MS) .012Total. Loiteting Time (TLT) .009"Dumb" Bomb Capacity (DB) .002Combat Radius (CR) .002In-Route Sustained Speed (ISS) .002Combat: rake-off Distance (TOD) .002Combat Landing Distance (LD) .002
1.000
4-7
I ! I I ... a-- I KI . .U I Iý
Equalization Calculation
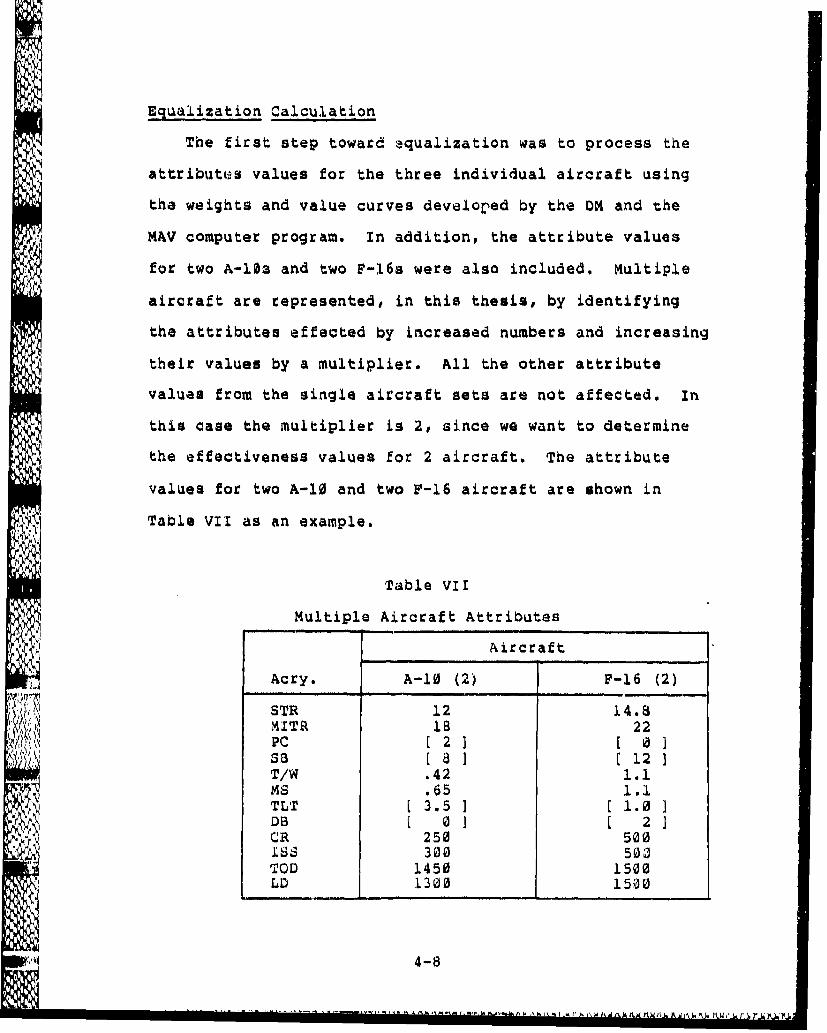
The first step toward .aqualization was to process the
attributes values for the three individual aircraft using
the weights and value curves developed by the DM and the
MAV computer program. In addition, the attribute values
for two A-10s and two F-16s were also included. Multiple
aircraft are represented, in this thesis, by identifying
the attributes effected by increased numbers and increasing
their values by a multiplier. All the other attribute
values from the single aircraft sets are not affected. In
this case the multiplier is 2, since we want to determine
the effectiveness values for 2 aircraft. The attribute
values for two A-10 and two F-16 aircraft are shown in
Table VII as an example.
Table VII
Multiple Aircraft Attributes
Aircraft
Acry. A-10 (2) F-16 (2)
STR 12 14.814TR 18 22
S81 [121T/W .42 1.1MS .65 1.1TLT [ 3.5 1 [ 1.0DB [ [ 21CR 250 500ISS 300 504TOD 1450 1500
S' LD .1300 1500
• 4-8

Note that in Table VII the four attributes that were
flagged as being impacted by increased numbers are now
twice as large as those found in Table IV for the
individual aircraft. The five different aircraft attribute
sets were run using the MAV computer program. The computer
program calculated and displayed the rankings and MAV
values for each of the five attribute sets. These values
and rankings are shown in Table VIII.
Table VIII
Aircraft Ranking
Ranking Alternative Value
1 F-16 (2) .3862 A-10 (2) .3093 F-15 .285
.j 4 F-16 .2365 A-10 .133
Table VIII shows that amongst the three single aircraft
the F-15 is ranked the highest. However, when two F-16s or
two A-10s are introduced, they become more effective. The
next step of the equalization process was to find the exact
numbers of F-16s and A-10s that would make them equal in
rankin9 to one F-15 aircraft. This was accomplished by
iteratively calculating the values of F-16 and A-10
aircraft from partial ot fractional aircraft numbers, *uch
as 1.5, until the value .285 (F-15 value) was achieved.
4-93j,ý .

This process took appcoximately 6 iterations to find the
appropriate values. The number of aircraft, attribute, and
ranking values that were finally determined are shown in
Table IX (15; 11:1).
Table IX shows that the ratio of 1 F-15 to 1.86 A-10s
or 1.33 F-16s is of equal value to the Decision Maker (DM).
In effect the ratio depicts the amount of each aircraft
type necessary to be equally effective in this study of the
CAS mission area.
Table IX
Equalization Calculation
Attribute A-10 F-16 F-15 A-10 F-16Aircraft # (1) (1) (1) (1.86) (1.33)
STR 12 14.8 13.5 12 14.8MITR 18 22 23.5 18 22PC 1 0 0 1.86 0SB 4 6 8 7.44 7.98T/W .42 1.1 .95 .42 1.1MS .65 1.1 .95 .65 1.1TLT 1.7 .5 .5 3.16 .67DB 0 1 2 0 1.33CR 250 500 350 250 50SISS 300 500 540 300 50S12OD 1450 1500 2700 1450 1500LD 1300 1500 4500 1300 1500
Rank Values .132 .235 .285 .285 .285
In order to identify a confidence interval for this
study, a form of sensitivity analysis was run. In addition
to the questions asked of the DM mentioned in appendix B,
4-10

the DM was asked to provide a plus and minus range for each
of his answers. An analysis identical to the one run to
determine the equalization ratios was run using the 'minus'
and another using the 'plus' values. The intent of this
was to provide a sensitivity range for the equalization
ratio values. The results of the two computer runs were an
effectiveness ratio of F-15zA-l0:F-16 of 1 : 1.74 : 1.37
for the minus end of the scale, and 1 : 2.01 : 1.26 for the
plus end of the scale using the P-15 value as the baseline.
The significance of this analysis is that it provides a
range for the numbers provided by this thesis. The
variation in the effectivenass ratio for the A-10 was
determined to be plus or minus 8% and for the F-16 plus or
minus 5%.
Readiness Calculations
The readiness values used for this research were
obtained from the Weapon System Management Information
System (WSMIS) operated and maintained by the Air Force
Logistics Command. As a surrogate for readiness, Fully
Mission Capability (FMC) rates for the three aircraft were
used. The WSMIS data bank provided the FMC rates for the
three aircraft by month for the last two years. The FMC
rates by month were then averaged foe each aircraft. The
monthly FMC values and the iarameters used for the 4SAIS
search are displayed in appendix C.
4-11

The average FMC rates for the three aircraft are as
follows; F-15 (70.39), F-16 (74.07), and A-1i (77.24).
These numbers indicate the average percent of aircraft that
were FMC over the last 2 years. These numbers are combined
into the cost-effectiveness model by dividing the
equalization ratio by the average FMC percent. In essence
if t.i aircraft is not available 100% of the time, moreaircraft must be provided to maintain the same
effectiveness. As an example, consider an aircraft which
is FMC fifty percent of the time. If an effectiveness of 1
plane were required, 1/.50 or 2 planes would be necessary.
This provides an adjusted equalization ratio which takes
into account effectiveness and availability considerations.
The adjusted equalization ratios for the three CAS aircraft
are; F-15 (1.42), F-16 (1.80), and A-10 (2.41). When tne
values are normalized with the F-15 being 1.00 the other
aircraft become 1.27 for the F-16 and 1.69 for the A-14.
The significance of these numbers is that they show how
many of each aircraft are required to provide equal
effectiveness in the CAS mission area. For example, the
numbers suggest that it would require 169 A-I0s or 127 F-
16s to provide the same CAS effectiveness as 100 F-15s.
4-12

Aircraft Cost Curves
The next phase of the thesis was to determine the cost
curves for the individual aircraft. As mentioned in the
methodology section, the costs associated with each
aircraft were broken down into 3 separate cost areas, the
first is Research and Development (R&D), the second is
Operations and Maintenance (O&M), and finally the third is
individual production coats.
The R&D costs for each of the three aircraft, as
determined by a BDM Corporation study, are $3.58 Billion
for the F-15, $1.15 Billion for the P-16 ,and $.70 Billion
for the A-10 aircraft (3;17). These values are in FY 81
dollars.
The O&M costs for each of the three aircraft were
obtained from AFP 173-13, and are eatimates based on a 24
Primary Aircraft Authorization (PAA) squadron and FY 81
dollars. The figures are broken out in Table X. The
annual O&M costs for each of the three aircraft per 24 PAA
are $40.76 M for the F-15, $32.50 M for the F-16 ,and
$24.82 % for the A-10 aircraft (3:21). For purposes of
this thesis the average life of the individual aircraft was
projected to be 20 years.
4-13

Table X
Annual O&S Cost Per 24 PAA Squadron(Millions, FY 81 dollars)
Cost Element F-15 F-16 A-10
1.0 UNIT MISSION PERSONNEL 8.52 7.54 6.742.0 UNIT LEVELi CONSUMPTION
2.1 POL 9.56 6.07 4.492.2 AIRCRAFT MAIN MTLS 2.07 1.50 1.132.3 TRAINING ORDNANCE 0.10 2.30 2.20
3.0 DEPOT MAINTENANCE 7.29 6.83 2.614.0 SUSTAINED INVESTMENT
4.1 REPLENISHMENT SPARES 4.79 2.44 2.974.2 REPLENISHMENT SPT BQPT 1.20 0.65 0.374.3 MODIFICATION KITS 2.48 1.17 0.89
5.0 INSTALLATION SUP SALARIES 1.38 1.09 0.776.0 INDIRECT PER SALARIES 1.20 1.05 0.908.0 ACQUISITION AND TRAINING 1.99 1.86 1.75
TOTAL 40.76 32.50 24.82
(3:21)
The production costs, in 1982 dollars, for each of the
aircraft as provided in the 1982 Selected Acquisition
Report (SAR) were $27.16 M for an P-15, $19.63 M for an F-
16, and $6.80 M for an A-10 aircraft.
By combining the three aforementioned aircraft costs,
and adjusting the values to FY 85 dollars, individual cost
* curves for the three aircraft were determined. Th t~aree
cost curves are displayed in Figures 6 through 8.,
Cost-Effectiveness Curve
The individual cost curves displayed in Figures 6,
7,and a were combined into one single cost-effectiveness
4-14

curve. The combination curve retained the same cost values
on the ordinate, however, the numbers of aircraft on theabscissa are displayed using the adjusted equalization
ratios determined earlier in this chapter. The results of
this combination is displayed in Figure 9. The total cost
lines, for the three aircraft, are shaded to reflect the
confidence ranges associated with the effectiveness ratios.
In order to compare the three aircraft side by side
using the equalization ratios, some of the partial aircraft
numbers had to be rounded up to the nearest whole number.
This rounding process did not significantly effect any of
the cost-effectiveness curves and was ignored.
The significance of the final cost-effectiveness graph
is that it allows the casual observer to compare the three
aircraft with respect to cost and effectiveness. This type
of graphical display allows the reader to compile a series
of 'what ifs' at a glance. An example of a possible
comparison would be the determination of how much it would
cost to have the same effectiveness as 300 F-'5s using F-
16S or A-l0s. This could be done by locating 300 F-15s on
the abscissa and drawing a vertical line, The point on the
ordinate were the vertical line crosses the A-10 or F-16
curve shows the cost associated with equal effectiveness.
Other helpful information that can be obtained from
the curve is the numbers of personnel required to fly the
different aircraft for given effectiveness levels.
4-15

Provided
tion
ions t 85dollara3
Product S
Yrs)50
40
300
2003 30 400br~0Cr00~
6006.A-1 0 90 0
Os-fectivenes uv
4-1

(billions of FY 85 dollars)90 i
80 - R&D CostsO&M Costs (est. for 20 yrs)
70 Production Costs
60
50A (8$)
40
30
20
100
100 200 300 409 500 600 700 800 900 1000(Aircraft Numbers)
Fig. 7. F-16 Cost-Effectiveness Curve
(billions of EY 85 dollars)90 , i 1
80 • R&D Costs..... O&M Costs (est. for 20 yrs)
70 Production Costs
15 i oeeeoeOoee~ooOOe
(B$)40
30
20
10
0
100 200 300 4•,0 500 600 7200 800 900 1000(Aircraft Numbers)
Fig. 8. f-15 Cost-Effectiveness Curve
4-i7
"UAI'J 1 VW

(bi.llions *vf ry 65 doll~ars)
90 i i
80 - Total d-15 CostSTotal F-16 Cost
70 .. Total A-'10 Cost
60
50
40
30
20
K 10
___ 0
ýNl. F-I5 100 200 300 400 500 600 700 800 900 1000P-16 127 254 331 508 635 762 889 1016 1143 1270A-10 169 338 507 675 845 1014 1183 1352 1512 1690
(Aircraft -Liumbors)
Fig. 9. Com~bined Cost-Effectiveness Curve
4-1

V. Summary and Conclusions
Summary of Research
The primary emphasis of this research effort has been
to investigate the quantity versus quality issue and to
design a cost-effectiveness model to aid in evaluating it.
This model incorporates mission effectiveness, readiness,
anc life cycle costs. The cesearch effort was hiaged
around a case study comparison of the F-15, F-16, and A-10
aircraft. These aircraft were chosen because they
represented varying system complexities and were used as
surrogates to high, medium, and low complexity
respectively. The comparisons made in this theaiz were
intended to demonstrate the usefulness of using aide.aft
effectiveness, readiness and cost data in a mathematical
cost-effectiveness model.
The methodology that was followed in this research
involved combining multi-attribute value theory, aircraft
readiness figures, and aircraft life cycle cost
information. The result of this approach was a series of
cost-eftectiveless ratios, and a cost-effectiveness curve
which incorporated the three close air support aircraft.
T he cost-effectiveness curve provided the costs, adjusted
by both effectiveness and readiness values, associaLed with
the three aircraft.
5-I

Conclusions of the Research Effort
The research results indicate that the approach used to
develop a cost-effectiveness model does provide a
"quantitative way to evaluate the problem of quantity versus
quality. The values presented in the combination cost-
effectiveness curve (Figure 9) show that the incorporation
of aircraft effectiveness and readiness does indeed alter
the comparison between the three aircraft. Using 1100 F-
15's as a baseline, the difference in terms of cost between
the A-10 and the F-15 went from $49 Billion in the equal
number comparison to only $25 Billion when the equalized
ratios were used. The difference in terms of aircraft
numbers went from an equal amount to 1000 for the F-15 and
1690 for the F-16. The new equalized figures should allow
defense planners and managers to get a better overall
picture of the differences between the aircraft. In this
case the increased numbers of A-l0s and F-16a required to
equal the performance effectiveness ot the F-15 did not
alter the cost-effectiveness rankings. However, this may
not always be the case. in the situation where the cost
curves cross, the defense planner would have a different
cost-effectiveness ranking depending on how many aircraft
were evaluated.
The amount of information that was required for this
model is considerable. As mentioned in Chapter 1, the
approaches to date to the quantity versus qualty problem
%" 5-2

have only evaluated portions of the necessary information.
The approach taken by this research required that a
Decision Maker (DM) answer a series of questions. These
questions inturn were used to produce a series of weights
and value curves which ultimately determined the
effectiveness ratios of each of the aircraft.
This approach has both advantages and disadvantages.
One of the positive factors of this systematic approach,
was that it helped to eliminate many individual biases
often seen in the quantity versus quality controvecsy.
Biases were lessened by breaking the problem into small
sub-elements. The DM was asked to evaluate many smaller
pieces of information rather than one large piece. This
made it difficult for the DM to bias the study one way or
another.
Another advantage of this method was that it allowed a
large number of variables to be incorporated into the
study. Without this type of approach it is very difficult,
if not impossible, for an individual to process all the
variables needed for the study. The amount of information
that an individual can process is limited. It is commonly
accepted that an average individual can only process around
7 pieces of information at a time. This would surely limit
his ability to evaluate all of the variables in the
quantity versus quality problem.
5-3
.41

Some of the disadvantages of this approach are that the
DM often feels that the information that he has provided is
fed into a form of 'black box'. The DO therefore does not
always feel comfortable with the final weights and values.
This type of reaction may also be present with the defense
planners and managers that are expected to use the
information from the analysis. Many of the planners and
managers may also object to the expert dependent nature of
this approach. The effectiveness numbers are of course
dependent on the experts answers and therefore influenced
by his biases.
Another disadvantage of this method is that come of the
information required to perform the comparisons is
voluminous and not readily available through other programs
or databases. This makes the collection of that data
costly. If this method were to be attempted by a System
Program Office (SPO) activity, the information required
would have to be used for other purposes in order to make
it cost effective. An example of an additional use of the
data can be demonstrated with the attribute value curves.
These curves could be used by the program manager to
identify performance areas to provide Pre-planned Product
Improvement (P31) emphasis.
The key result of this research is that it presents a
quantitative method to combine the many factors that need
to be considered in the quantity versus quality issue.
5-4
P ArJkrAP rJa . )k( r. r. ~4 ' ý w (w rA 0- 41,,1 .A ý, * \

This quantitative method provides a reproducibic and
systematic way to evaluate systems with different
capabilities, readiness, and life cycle costs. The final
aircraft cost-effectiveness curve allows the defense
manager to compare the costs associated with equal
effectiveness as well as other valuable information. The
other information includes the determination of how many
aircraft can be bought for a given price, and estimations
of personnel requirements for equivalent weapon systems.
Recommendations
The methodology developed in this research was designed
to show that this mathematical approach is possible, and
provides valuable information needed for the comparison of
weapon systems with different performance capabilities.
The actual effectiveness calculations were developed from
one expert's inputs, and are not particularly the best or
most unbiased available. Because of this, the actual data
points on the cost-effectiveness curves are valid for that
expert only, and are for demonstration purposes. For an
accurate effectiveness calculation, additional people in
more diverse discipliiw•s are needed to provide input,
Despite the limitations mentioned, the cost and
readiness data provided in this analysis is accurate and
reproducible. The methodology is sound and built an
previously proven methods. The value, to the defense
5-5

decision maker, of the information provided in this thesis
is still to be determined.
Suggestions for Further Research.
This study examined only the Close Air Support mission
area, and involved the F-15, F-16, and A-10 aircraft.
Other mission areas and weapon systems should be evaluated
using this approach.
The same study should be rerun using more decision
makers from more divbrse disciplines. The information for
readiness, and life cycle costs should be obtained from
experts in those fields using more state of the art methods
available today.
The results of this study and methodology should be
presented to the Air Force community to determine how well
accepted the data would be. A study should be designed to
evaluate the strengths and weaknesses of this method over
other conventional cost-effectiveness models.
5-6
INX

Appendix A: Individual Attribute Value Curves
This appendix provides the questions, answers andresulting value curves obtained from the interview withMajor Jack Shafer the DM.
Sustained Turn Rate (STR)
1.00 - _ _ _ _ _ _ _ _ _ _ _ _ _ _ _ _ _ _ _ _ _ _ _
.75 -
.50
.25
0 -
10 17.5 25(Degrees/Second)
FOR (Sustained Turn Rate) AT WHAT POINT IS THE CHANGEFROM (10 deg/sec) TO THIS POINT EQUAL TO THE CHANGE FROMTHAT POINT TO (25 deg/sec). THAT POINT IS ( 20 deg/sec )
FOR (Sustained Turn Rate) AT WHAT POINT IS THE CHANGEFROM (10 deg/sec) TO THIS POINT EQUAL TO THE CHANGE FROMTHAT POINT TO (20 deg/sec). THAT POINT IS ( .7.5 deg/sec).
FOR (Sustained Turn Rate) AT WHAT POINT IS THE CHANGEFROM (20 deg/aec) TO THIS POINT EQUAL TO THE CHANGE FROMTHAT POINT TO (25 deg/sec). THAT POINT IS ( 23.5 deg/sec).
A-i
;§~~~~~~~ 'kLX - NX~~ A,~~~.cZ2~c
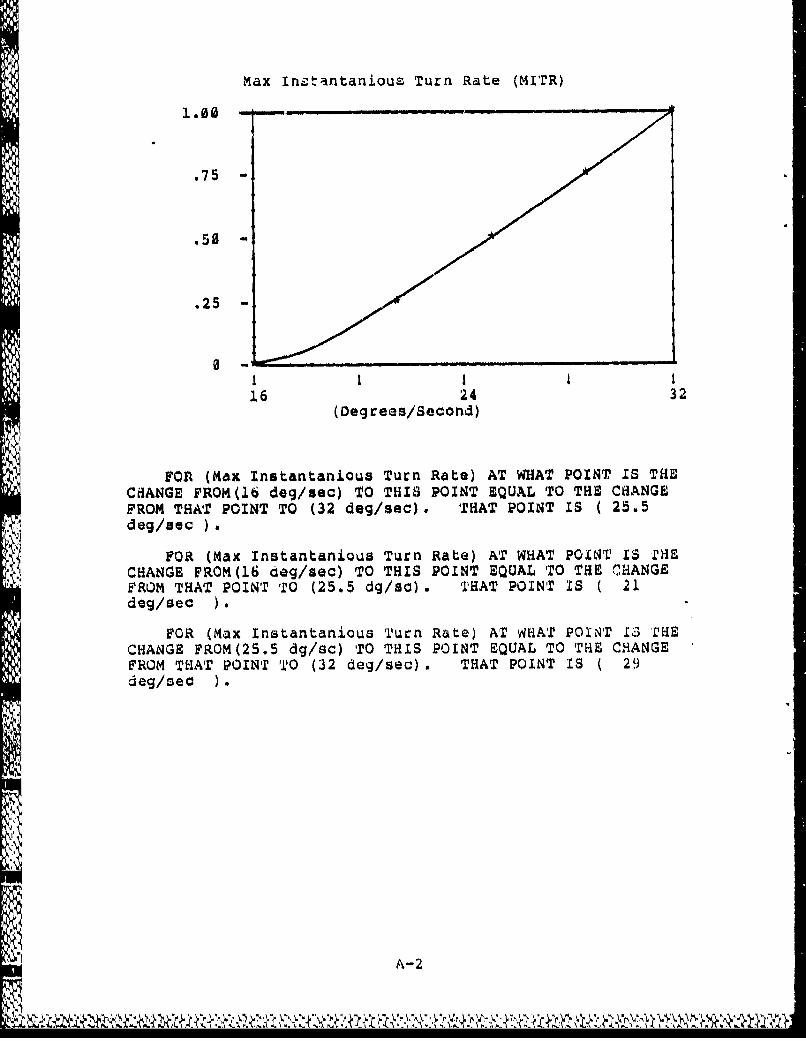
Max Instantanious Turn Rate (MITR)
1.00-
.75
.50
.25
0-
16 24 32(Degrees/Second)
FOn (Max Instantanious Turn Rate) AT WHAT POINT IS THECHANGE FROM(16 deg/sec) TO THIS POINT EQUAL TO THE CHANGEFROM THAT POINT TO (32 deg/sec). THAT POINT IS ( 25.5deg/sec
FOR (Max Instantanious Turn Rate) AT WHAT POINT IS THECHANGE FROM(16 deg/sec) TO THIS POINT EQUAL TO THE CHANGEFROM THAT POINT TO (25.5 dg/sc). THAT POINT IS ( 21deg/sec ).
FOR (Max Instantanious Turn Rate) AT WHAT POINT IS;3 THECHANGE FROM(25.5 dg/sc) TO THIS POINT EQUAL TO THE CHANGEFROM THAT POINT TO (32 deg/sec) . THAT POINT IS ( 29deg/sec ).
A-2

Projectile Cannon (PC)
.75 -
.50
.25 -
0-I I I 1
S1.5 3(Numbers of Cannons)
FOR (Projectile Cannons) AT WHAT POINT IS THE CHANGEFROM (0 Cannons) TO THIe3 POINT EQUAL TO THE C2HANGE FROL4THAT POINT TO (3 cannons). THAT POINT IS ( 1.5 cannons ).
.FOR (Projoetile Cannons) AT WHAT POINT IS THE CHANGEFROM (0 cannons ) TO THIS POINT EQUAL TO THE CHANGE FROMTHAT POINT TO (1.5 cannon). THAT POINT IS ( .75 cannons ).
FOR (Projectile Cannons) AT WHAT POINT IS THE CHANGE['FROM (1.5 cannon) TO THIS POINT 4QUAL TO THE CHANGE FROMTHAT POINT TO (3 cannons ). THAT POINT IS ( 2.25cannons).
N-3

"Smart" Bomb Capacity (SB)
1.00-
.75
.50
.25
3 7.5 12(Number of Bombs)
FOR ("Smart" Bomb Capacity) AT WHAT POINT IS THE CHANGEFROM (3 Bombs) TO THIS POINT EQUAL TO THE CHANGE FROM THATPOINT TO (12 Bombs). THAT POINT IS ( 7.5 bombs
FOR ("Smart" Bomb Capacity) AT WHAT POINT IS THE CHANGEFROM ( 3 bombs ) TO THIS POINT EQUAL TO THE CHANGE FROMTHAT POINT TO (7.5 bombs ) THAT POINT IS ( 5.25 bombs
FOR ("Smart" Bomb Capacity) AT WHAT POINT IS THE CHANGEFROM (7.5 bombs ) TO THIS POINT EQUAL TO THE CHANGE PROMTHAT POINT TO ( 12 bombs ), THAT POINT IS ( 9.75 bombs )
A-4
X,,

Thrust-to-Weight Ratio (T/W)
-. 1.~00
.75
.50 -
.25 -
0
.40 .95 1.5(T/W)
FOR (Thrust/Weight Ratio) AT WHAT POINT IS THE CHANGEFROM (.4 T/W) TO THIS POINT EQUAL TO THE CHANGE FROM THATPOINT TO (1.5 T/W). THAT POINT IS ( .95 T/W
FOR (Thrust/Weight Ratio) AT WHAT POINT IS THE CHANGEFROM ( .4 T/W ) TO THIS POINT EQUAL TO THE CHANGE FROMTHAT POINT TO ( .95 T/W ). THAT POINT IS ( .a T/W ).
FOR (Thrust/Weight Ratio) AT WHAT POINT IS THE CHANGEFROM ( .95 T/W ) TO THIS POINT EQUAL TO THE CHANGE FROMTHAT POINT TO ( 1.5 T/W ). THAT POINT IS ( 1. T/W ).
A-5

Maximum Speed (MS)
".75 -
.50 1
.25 -
ki ! - _ _ _ _ _ _ _ _ _ _
.65 1.1 1.5(Mach)
'I
FOR (Maximum Speed) AT WHAT POINT IS THE CHANGE FROM(.65 Mach) TO THIS POINT EQUAL TO THE CHANGE FROM THAT
POINT TO (1.5 Mach). THAT POINT IS ( .90 Mach
FOR (Maximum Speed) AT WHAT POINT IS THE CHANGE FROM.65 Mach ) TO THIS POINT EQUAL TO THE CHANGE FROM THAT
POINT TO ( .90 Mach ). THAT POINT IS ( .80 Mach
FOR (Maximum Speed) AT WHAT POINT IS THE CHANGE FROM.9h Mach ) TO THIS POINT EQUAL TO THE CHANGE FROM THAT
PO INT TO (1.5 Mach ). THAT POINT IS ( 1.0 Mach
A--
'¢,-b
4. ',4

Total Loitering Time (TLT)
.75
.5f•
.25
.25 2.5 4.8(Hours)
FOR (Total Loitering Time) AT WHAT POINT IS THE CHANGEFROM (.25 Hours) TO THIS POINT EQUAL TO THE CHANGE FROMTHAT POINT TO (4.8 Hours). THAT POINT IS ( 2.5 hrs
FOR (Total Loitering Time) AT WHAT POINT IS THE CHANGEFROM ( .25 hrs ) TO THIS POINT EQUAL TO THE CHANGE FROMTHAT POINT TO ( 2.5 nrs ). THAT POINT IS ( 1.5 irs ).
FOR (Total Loitering Time) AT WHAT POINT IS THE CHANGEFROM ( 2.5 hrs ) TO THIS POINT EQUAL TO THE CHANGE FROMTHAT POINT TO ( 4.8 hrs ). THAT POINT IS ( 3.5 hrs ).
A-7m

"Dumb" Bomb Capacity (OB)
1.00
.75
.50
.25
1 i.5 3(Numbers of Bombs)
FOR ("Dumb" Bomb Capacity) AT WHAT POINT IS THE CHANGEFROOM (0 Bombs) TO TIlS POINT EQUAL TO THE CHANGE FROM THATPOINT TO (3 Bombs). THAT POINT IS ( 1.5 bombs ).
FOR ("Dumb" Bomb Capacity) AT WHAT POINT IS THE CHANGEFROM ( 0 bombs ) TO THIS POINT EQUAL TO THE CHANGE FROMTHAT POINT TO ( 1.5 bombs). THAT POINT IS ( .75 Bombs ).
FOR ("Dumb" Bomb Capacity) AT WHAT POINT IS THE CHANGE.FROM (1.5 bombs ) TO THIS POINT EQUAL TO THE CHANGE FROMTHAT POINT TO ( 3 bombs ). THAT POINT IS ( 2.25 bombs
A-8
•. .

Combat Radius (CR)
.75 -
.50 -
.25 -
01LI I I
200 350 500(Nautical Miles)
FOR (Combat Radius) AT WHAT POINT IS THE CHANGE FROM(200 Nm) TO THIS POINT EQUAL TO THE CHANGE FROM THAT POINTTO (500 Nm). THAT POINT IS ( 375 nm
FOR (Combat Radius) AT WHAT POINT IS THE CHANGE FROM200 nm) TO THIS POINT EQUAL TO THE CHANGE FROM THAT POINT
rO ( 375 nx ). THAT POINT IS ( 350 nm
FOR (Combat Radius) AT WHAT POINT IS THE CHANGE FROM375 nm) TO THIS POINT EQUAL TO THE CHANGE FROM THAT POINT
TO ( 50 nm ). THAT POINT IS ( 425 nm
A-9

Inroute Sustained Speed (ISS)
1.00-
.75 -
.50
.25
0 ---
300 425 550(Nautical Miles/Hour)
FOR (Inroute Sust. Speed) AT WHAT POINT IS THE CHANGEFROM (300 Nm/Hr) TO THIS POINT EQUAL TO THE CHANGE FROMTHAT POINT TO (550 Nm/Hr). THAT POINT IS ( 400 nm/hr ).
FOR (Inroute Sust. Speed) AT WHAT POINT IS THE CHANGEFROM (300 nm/hr ) TO THIS POINT EQUAL TO THE CHANGE FROMTHAr POINT TO (400 nm/hr ). THAT POINT IS ( 410 nm/hr
FOR (Inroute Sust. Speed) AT WHAT POINT IS THE CHANGE
FROM (403 nm/hr ) TO THIS POINT EQUAL TO THE CHANGE FROMTHAT POINT TO (550 nm/hr ). THAT POINT IS ( 475 nm/hr ).
A-lb
S

Combat Take-off Distance (TOD)
.75
.50
.25
!I I
1000 25004000
(Feet)
ý4 FOR (Take-off Distance) AT WHAT POINT IS THE CHANGE
FROM (1000 Ft) TO THIS POINT EQUAL TO THE CHANGE FROM THATPOINT TO (4000 Ft). THAT POINT IS ( 3800 ft
FOR (Take-off Distance) AT WHAT POINT IS THE CHANGEFROM ( 3800 ft ) TO THIS POINT EQUAL TO THE CHANGE FROMTHAT POINT TO ( 4000 ft ). THAT POINT IS ( 3900 ft
FOR (Take-off Distance) AT WHAT POINT IS THE CHANGEFROM ( 1000 ft ) TO THIS POINT EQUAL TO THE CHANGE FROMTHAT POINT TO ( 3800 ft ). THAT POINT IS ( 3700 ft ).
A-il

Combat Landing Distance (LD)
1.00
.75 -
.50 -
.25 -
1000 2800 4600(Feet)
FOR (Landing Distance) AT WHAT POINT IS THE CHANGE FROM(1000 Ft) TO THIS POINT EQUAL TO THE CHANGE FROM THAT POINTTO (4600 Ft). THAT POINT IS ( 3800 ft
FOR (Landing Distance) AT WHAT POINT IS THE CHANGE FROM3800 ft ) TO THIS POINT EQUAL TO THE CHANGE FROM THAT
POINT TO ( 4600 ft ). THAT POINT IS ( 3900 ft
FOR (Landing Distance) AT WHAT POINT IS THt CHANGE FROM1000 ft ) TO THIS POINT EQUAL TO THE CHANGE FROM THAT
POINT TO ( 3800 ft ). THAT POINT IS ( 3700 ft
S~A-12

Appendix B: Attribute Weight Questionaire
This appendix provides the questions, and answersobtained from the interview with Major Jack Shafer the DM.This information was used tO develop the attribute weights.
Aircraft #1 Aircraft #2
10 Sustained Turn Rate Sustained Turn Rate
32 Max Inst Turn Rate -- Max Inst Turn Rate
What value of Sustained Turn Rate would make Aircraft #2
equal to Aitcraft #1, given that all other attributes are
equal between the two aircraft.
Answer 25 confidence +-.5
Aircraft #1 Aircraft 02
16 Max Inst Turn Rate Max Inst Turn Rate3 Projectile Cannons -0- Projectile Cannons
What value of Max Inst Turn Rate would make Aircraft #2
equal to Aircraft #1, given that all other attributes are
equal between the two aircraft.
Answer 32 confidence +-.5
Aircraft #1 Aircraft #2
0 Projectile Cannons Projectile Cannons
12 "Smart" Bombs 3 "Smart" Bombs
What value of Projectile Cannons would make Aircraft #2
equal to Aircraft #1, given that all other attributes are
equal between the two aircraft.
B-1

Aircraft #1 Aircraft #2
3 "Smart" Bombs "Smart" Bombs
1.5 Thrust/Weight .4 Thrust/Weight
What value of "Smart" Bombs would make Aircraft #2 equal
to Aircraft #1, given that all other attributes are equal
between the two aircraft.
Answer 4 confidence +-l
Aircraft #1 Aircraft #2.4 Thrust/Weight, Thrust/Weight
1.5 Maximum Speed .65 Maximum Speed
What value of Thrust to Weight Ratio make Aircraft #2
equal to Aircraft #1, given that all other attributes are
equal between the two aircraft.
Answer 1 confidence +-.05
Aircraft #1 Aircraft #2.65 Maximum Speed Maximum Speed
4.8 Total Loiter Time T25 Total Loiter Time-
What value of Maximum Speed would make Aircraft #2 equal
to Aircraft #1, given that all other attributes are equal
between the two aircraft.
Answer .9 confidence +-.2
4 a-2
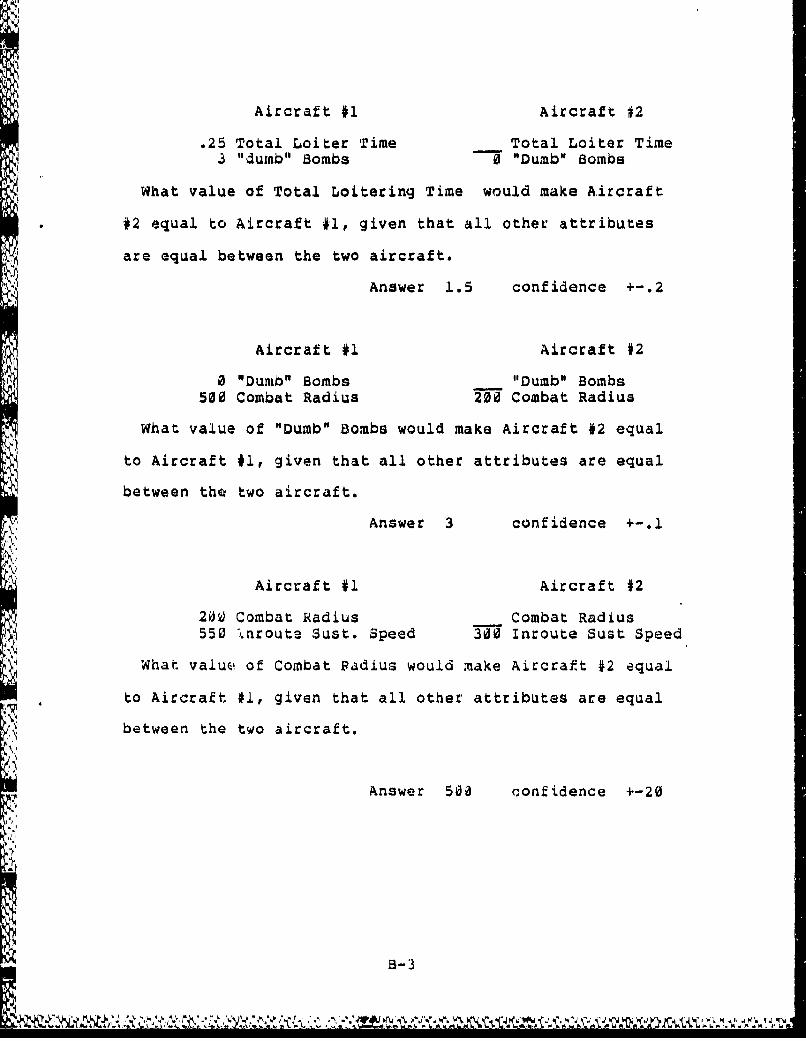
Aircraft #1 Aircraft 42
.25 Total Loiter Time Total Loiter Time"3 "dumb" Bombs 0 "Dumb" Bombs
What value of Total Loitering Time would make Aircraft
42 equal to Aircraft #1, given that all other attributes
are equal between the two aircraft.
Answer 1.5 confidence +-.2
Aircraft #1 Aircraft #2
0 "Dumb" Bombs "Dumb" Bombs500 Combat Radius 200 Combat Radius
What value of "Dumb" Bombs would make Aircraft #2 equal
to Aircraft #I, given that all other attributes are equal
between the two aircraft.
Answer 3 confidence +-.1
Aircraft #1 Aircraft #2
20 Combat Radius Combat Radius
550 %nrouts Sust. Speed 300 Inroute Sust Speed
What valuo of Combat Radius would make Aircraft #2 equal
to Aircraft #i, given that all other attributes are equal
between the two aircraft.
Answer 500 confidence +-20
B-3
Fr.I I
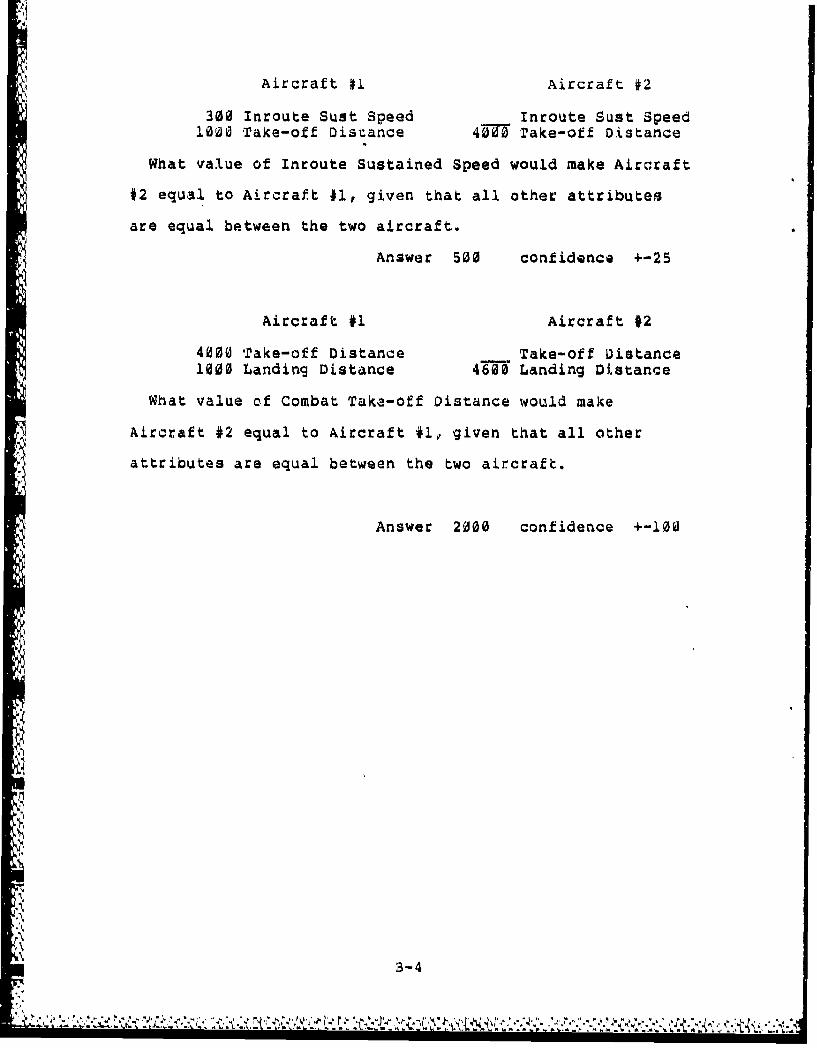
Aircraft #1 Aircraft #2300 Inroute Sust Speed Inroute Sust Speed
1000 Take-off Distance 40-0 rake-off Distance
What value of Inroute Sustained Speed would make Aircraft
#2 equal to Aircraft 01, given that all other attributes
are equal between the two aircraft.
Answer 500 confidence +-25
Aircraft #1 Aircraft #24000 Take-off Distance Take-off Distance1000 Landing Distance 4600 Landing Distance
What value of Combat Take-off Distance would make
Aircraft #2 equal to Aircraft #l1 given that all other
attributes are equal between the two aircraft.
Answer 2000 confidence +-100
13-4
_.4,

Appendix C: Weapon System Management Information SystemI1SMIS) Full Mission Capable (MC)j data for the F-15,
F-16, and A-10 aircraft.
Percent P-15 FMC Status"Month:
83/03 83/04 83/05 83/06 83/07 83/08 33/09 83/1065.1 65.4 60.4 59.6 62.6 61.8 66.2 68.6
Month:
83/11 83/12 84/01 84/02 84/03 84/04 84/05 84/0668.7 67.8 71.8 75.1 71.6 72.8 70.8 71.8
Month:
84/07 84/08 84/09 84/10 84/11 84/12 85/01 85/0273.9 71.8 77.5 76.5 78.2 78.5 77.5 75.7
Average Percent FMC for P-15 (83/03-85/02) : 70.39%
WSMIS F-15 zearch constraints - AVISURS status historysummary trend status hour rate by readiness category for F-15 within all commands at all bases.
Percent F-16 FMC StatusMonth:
83/03 83/04 83/05 83/06 83/07 83/08 83/09 83/10
64.2 64.1 65.5 68.0 69.9 66.1 70.9 71.4
Month:
83/11 83/12 84/01 84/02 84/03 84/04 84/05 84/0672.6 74.8 75.9 75.7 73.3 77.1 76.4 '78.3
Month:
84/07 84/08 34/09 84/10 84/11 84/12 85/01 85/0277.7 77.7 80.2 78.3 77.7 80.9 80.8 80.2
Average Percent FMC for P-16 (83/03-85/02) : 74.07%
WSMIS F-16 search constraints - AVISURS status historysummary trend status hour rate by readiness category for F-16 within 8 commands (AFE, AFR, ANG, ATC, LOG, PAF, SYS,TAC) at all bases.
C-i
I ,--.

Percent A-10 FMC Status
Month:
83/0}3 83/04 83/05 83/06 a3/07 83/08 83/09 S3/i1076.2 74.9 75.9 75.2 75.5 74.6 72.9 72.6
Month:
83/11 83/12 84/01 84/02 84/03 84/04 84/05 84/0675.0 77.2 77.3 76.8 78.2 79.2 78.0 77.3
Month:
84/07 84/08 84/09 84/10 84/11 84/12 85/01 85/0277.8 79.5 81.0 80.2 80.6 80.3 78.9 78.4
Average Percent FMC for A-10 (83/03-85/02) : 77,24%
WSMIS A-10 search constraints - AVISURS status historysummary trend status hour rate by readiness category for A-14 within all commands at all bases.
C-2
* '~{6A

Bibliography
1. Abel, Richard F. "Tactical Aircraft: Is greater
quantity better that Superior Quality?," USAF PolicyLetter for Commanders, Washington DC : U.S. GovernmentPrinting Office, 15 February 1981.
2. Analytic Sciences Corporation, The. Weapon SManagement Information S ystem Readiness Module D087A§ iSubsystem Specification. Contract -33700-83-C-0076. Air Force Logistics Command, Logistics ManagementSystems Center, Wright-Patterson AFB OH, 15 April 1985.
3. BDM Corporation. "An examination of the Affordabilityof Increased Numbers of less Complex, Less capableAircraft," Report No. BDM/W-80-847-TR, 2 January 1981.
4. Berry, Clifton P'. Jr.,"The Revolutionary Evolution OfThe ?-16XL", Air Force Magazine, 66:50-55, (November1983).
5, Blanchard, Benjamin S. Logistics Engineering andManagement (Second Edition). New Jersey: Prentice HallInc. 1981.
6. Department of the Air Force. Cost Analysis: US AirForce Cost and Planning Factors. AFR 173-13.Washington DC : HQ USA?, I February 1984.
7. Department of Defense. Reliability andMaintainability, DoD Directive 5000.40. WashingtonDC : Government Printing Office, 8 July 1980.
8. Deputy For Development Planning, Aeronautical SystemsDivision, Air Force Systems Command. "Austere versusCapable Aircraft , Effectiveness Analysis: InterimBriefing." Wright-Patterson AFB OH, April 1981.
9. Deputy For Development Planning, Aeronautical SystemsDivision, Air Force Systems Command. "Quality VersusQuantity Issues." Wright-Patterson AFB OH, May 1981.
10. Deputy For Tactical Systems, Aeronautical SystemsDivision, Air Force Systems Command. "DerivativeFighter Evaluation Process. "Report to Brig Gen RichardE. Steere, Wright-Patterson AFB OH, 11 March 1982.
BIB-i

11. Ebersole, Douglas C., F-15 Performance Engineer.Personal Interview, ASD/TAEF, Wright-Patterson AFB OH,13 June 1985.
12. Elbridge, Col Eaton P. "Let's Get Serious About TotalLife Cycle Costs," Defense Management Journal, 13: 2-11(January 1977).
13. Fallows, James. "America's High-Tech Weaponry" TheAtlantic Monthly, 247:54-59 (May 1981).
14. Fink, Donald E. and others. "Military StressesMaintainability and Reliability," Aviation Week & SpaceTechnology, 113:42-81 (October 1980).
15. Janes's All the World's Aircraft 1983-1984. JanesPublishing Co. Inc. New York, 1984.
16. Johnson, Maj Herbert W. "Air Force Fighters: Simple orComplex?." Report 82-1285, Air Command and StaffCollege, Air University (ATC), Maxwell AFB AL, February
1982 (AD-B066 932).
17. Johnson, W. L. and R. E. Reel "Maintainability/ Reliability Impact on System Support Costs, "AirForce Flight Dynamics Lab. Report No. AFFDL-TR-73-152.Wright-Patterson AFB OH, December 1973.
18. Keeney, Ralph L. and Howard Raiffa. Decisions withmultiple Objectives: Preferences and value tradeoffs.New York: John Wiley & Sons, 1976.
19. King, Alwyn H. "Technology and the Balance of Power"Military Issues Research Memorandum, Strategic Studies,Institute, US Army War College Carlisle Barracks Penn,15 December 1977. (AD-A049 819)
20. Kniss, James R. "Developing Reliable Systems, FactsVersus Fiction," National Defense, 68: 24-27 (March1984).
21. Lind, William S., "Quantity Versus Quality Is Not TheIssue", Air University Review, 34:86-88 (September1983).
22. Milton, Gen T.R.(USAF Ret.),"Lessons From OurHeritage",Air Force M a~azine, 6L6:100 (August 1933).
BIB-2
*A,

23. Quade, E. S. Cost-Effectiveness: An Introductionand Overview. Rand Report P-3134. The Rand Corporation,Sanata Monica CA, June 1965.
24. Richie, Steven ., "An Eagle For All Arenas," Air ForceMagazine, 66:43-49 (November 1983).
25. Rickett, Maj David E. Air Supericrity Concepts:1S80-2000. MS Thesis, US-Army Command and GeneralStaff College, Fort Levenworth Kansas, June 1981.(AD-B059 635)
26. Shafer, Maj Jack E. Tactical Air Command, CombatAnalysis Branch, Personal Interview, TAC/DOP. LangleyAFB VA, 20 June 1985.
27. Sullivan, Leonard Jr., USAF Consultant."Q3: The Quality/ Quantity Quandary." Briefing given to AeronauticalSystems Division, Air Force Systems Command, Wright-Patterson AFB OH, October 1981.
28. U.S. Congress, House of Representatives, House ArmedServices Committee Report, 99-166, 15 May 1979.
29. Yonika, Maj David P. A Multi-Attribute Value TheoryAq Methodology For Selecting a Follow-On Close Air Support.
Aircraft. MS Thesis, LSSR 15-85. School of Engineering,Air Force Institute of Technology (AU), Wright-Patterson AFB OH, March 1985.
4.B
' , • 4~' t999'• •'%9.'"•"l 9'. * " 4 ' •,9 *fl .. 9 '". ",9,- .s. .. - .r •I;. .• • • • , ... .. • .....* ** * * , ... '. 7, 4 ,,.9 ,, :.i ': '

4L VITA
First Lieutenant David C. Merker was born on 23
September 1959 in Asbury Park, New Jersey. He graduated
from high school in Middletown, New Jersey, in 1977 and
attended Norwich University in Vermont, from which he
received the degree of Bachelor of Science in Chemistry in
May 1981. Upon graduation, he received a commission in the
USA? through the ROTC program. He was employed as a
computer operator for the Intern",tional Flavors and
Fragrances Corporation, Union Beach, New Jersey, until
called to active duty in November 1981. He then served as
a program manager for the National Emergency Airborne
Command Post peogram for the Air Force Plant
Representatives Office, The Boeing Company, Seattle
Washington, until entering the School of Systems and
Logistics, Air Force Institute of Technology, in June 1984.
Permanent address: 17 Walada Avenue
Port Monmouth, New Jersey 07758
* D- 1
I * ~ ~ *4,-. i,*~'1 i~* -, I*~* 4 *~ I i~*' I I

Y ~~UNCLASSIFIED ISPG/1T
SECURITY CLASSIFICATION OF THIS PAGE
REPORT DOCUMENTATION PAGE
'I& RNPORT SECURITY CLAS9SIFICATION 1b. RS•TRICTIVII MARKINGS
2a SECURITY CLASSIFICATION AUTHORITY 3. OISTRIBi3TION/AVAILABILITY OF ARPORT
Approved for public release;Mb. OECLAhIFICATION/OOWNORA01INGCNbIOUIE" distribution uni ml ted.
4, PERFOIRMING ORGANIZATION REPORT NUMUIEN(S) 6. MONITORING ORGANIZATION REPORT NUMuSPI(S)
AFI T/GSM/LSQ/85S-Z3
G& NAME OF PERFORMING ORGANIZATION III. OFISICI SYMBOL , 7& NAME OF MONITORING ORGANIZATION
School of Systems and ar pe)
Logistics AFIT/LSY
G ADDR.ES (Cityy hlate d-" ZIP Coda)
Air Force Institute of TechnologyWright-Patterson AFB, Ohio 45c433
S. NAME OF PUNOING/1PONEORING l& OFFICE SYM1Ol. 9. PROCURNEMNT INSTRUMENT IOKNTIFICAlION NUMBER
ORGANIZATION (, .uaeJ•l)
51. ADORIE tC1e', ,!,tWe end ZIP Coda) 10. SOURCE OF PUNOING NOS.
PROGRAM PROJICT TAIK WORK UNITELEMENT NO. NO. NOý NO.
11. TITLE (InclMde Securty ClIamliffestnj
See Box 1912. PRSRONAL AU.'ONI
David C. Merker, B.S., Ist Lt, USAF3a. TYPI OF RIPORT F13b. 'IM' COVERED ' '14, OATI OF REPORT (Yr,, No., D") 11. PAGE COUNT
MS Thesis IFoM _ TO 1985 September 991s. SUPPLIMINTAR% NOTATION
17, COSATI CO1, 161, SUEJICT TERMS (Continue ws rwvnrm tI;fewar and Ldentify by btlek nufmp)
N O 3ROUP . U... 0. Cost Effectiveness, Quantirty, O.uality, Reliabrl.ttyS14 01 .. Fighter Aircraft, F-15, F-16, A-10
f1. ABSTRACT (Continue an reers it necessery and Idmntfy bY bloak number)
Title: COMPARISON OF QUANTITY VERSUS QUALITY USINnPERFORMANCE, RELIABILITY, AND LIFE CYCLE COST DATA. ,w hble rewe, 1AW.'IP , 1
A CASE STUDY OF THE F-iS, F-16 AND A-10 AIRCRAFT.-wo1A.-N 04= WOLAV)ER a'XI )j i fyI
Dean lot ll.dw.,: h "I'i I t•'mloalna DIVeIIpiIji
Thesis Chal rman: John A. Long, Lt Col , USAF Ai ,.•w hi •i t 0 hHead, Dept of Cost Analysis S Pricing WXI ... l 45•IJ3
20. OISTrIGUTIOIN/AVAILASI|TY OF ABSTRACT 21, ABSTRACT SICUMITY CLASSIFICATION
IUNCLASSIPIED/UNLIMITEO 13 SAME AS %PT. 2 OTIC USE,,RS UNCLASS I F I ED
22s, NAME OF RISPONS3NIISLE INDIVIDUAL 22b. TELEPHONE NUMBER 22c. OFFICE SYMBOLIlnolude .Area Code)
John A. Long, Lt Col, USAF 513-255-6280 AFIT/LS0
D FORM 147O 83 AP TOITON Oi 1 JAN 73 IS OBSOLETI. UNCLASS I MEDTSECURITY CLASSIFICATION OF THIS PAGE

UNCLASSIFIED
SECURITY CLASSIFICATION OF THIS PAGE
The primary emphasis of this research effort has been toinvestigate the quantity versus quality issue and to designa cost-effectiveness model to aid in evaluating it. Thismodel incorporated mission effectiveness, readiness, andlife cycle costs. The research effort was hinged around acase study comparison of the F-15, P-16, and A-1I aircraft.These aircraft were chosen because t1,ey represented varyingsystem complexities and were used as surrogates to high,medium, and low complexity respectively. The comparisonsmade in this thesis were intended to demonstrate theusefulness of using aircraft effectiveness, readiness andcost data in a mathematical cost-effectiveness model.
The methodology that was followed, involved combiningmulti-attribute value theory, aircraft readiness data, andaircraft life cycle cost information. The result of thisapproach was a series of cost-effectiveness ratios, and acost-effectiveness curve which incorporated the three closeair support aircraft. The cost-effectiveness curve providedthe costs, adjusted by both effectiveness and readinessvalues. The results of this research indicate that theapproach used to develop the cost-effectiveness model doesprovide a quantitative way to evaluate the problem ofquantity versus quality.
0MUNCLASSSFlED
SECURITY CLASSIFICATION OF THIS PA-I