Embed Size (px)
Citation preview
1
27 February 2018
Coats Group plc
2017 Full Year results
Coats Group plc (‘Coats’ or the ‘Company’), the world’s leading industrial thread manufacturer, today announces its unaudited preliminary results for the year ended 31 December 2017.
* denotes a KPI
2017 2016 Change CER change 1
Organic change 1
Revenue
$1,510m $1,457m 4% 4% *3%
Adjusted 1
Operating profit $174m $158m 10% 11% *9%
Basic earnings per share 6.4c 4.9c *30%
Free cash flow *$87m $78m 12%
Return on capital employed (ROCE) 2 *35% 35% -
Reported 5
Operating profit $167m $153m 9%
Basic earnings per share 5.8c 4.3c 35%
Net cash generated by operating activities 3
$(232)m $8m n/a
Full year dividend per share 4 1.44c 1.25c 15%
Highlights
• Revenue growth of 4% to $1,510 million; driven by Apparel and Footwear (up 5%) and Performance Materials (up 12%), with some offset due to a weak performance in North America Crafts.
• Adjusted operating profit up 11% to $174 million (reported $167 million, up 9%); Group operating margin up 70bps to 11.5%.
• Adjusted EPS up 30% to 6.4 cents (reported EPS of 5.8 cents, up 35%) as a result of higher operating profits, a further reduction in effective tax rate and a reduction in finance costs.
• Adjusted free cash flow growth of 12% to $87 million; which includes a $10 million year-on-year increase in capital spend predominantly in H2, as anticipated.
• Settlement concluded with all three UK pension schemes and Pension Regulator investigations now ceased with $348 million of parent Group cash paid to the schemes during the year.
• Launch of Connecting for Growth programme supporting the next phase of Coats’ growth; expected to deliver $15 million net annualised operating cost savings.
• Completed the Performance Materials acquisition of Patrick Yarn Mill in December 2017. • Successful $225 million debut US Private Placement issue, alongside refinancing of existing bank debt
facilities, providing diversification of sources and maturity of debt. • Full year dividend per share increase of 15% to 1.44c per share.
2
Commenting on Coats Full Year 2017 results Rajiv Sharma, Group Chief Executive, said: ‘Coats delivered a strong performance in 2017. Momentum in Industrial continued throughout the year in key Apparel and Footwear markets, where we continued to take share, and we saw double-digit growth in hi-tech end-uses in Performance Materials. This was partly offset by North America Crafts where market conditions remained weak. In an environment of rising input costs, we were able to grow our operating margins, through realising price increases, productivity and procurement gains, as well as tight control of our cost base. Following this strong performance in 2017 we have announced a full year dividend per share of 1.44 cents, which represents a 15% year-on-year increase. ‘Through our continued strong financial delivery and investment in growth initiatives we have built a solid base for the future. However, the markets in which we operate are constantly changing. Our customers require an increased emphasis on speed, quality, value, innovation and corporate responsibility. To accelerate our transition from the industrial to the digital age, we launched the Connecting for Growth transformation programme, which will support our next phase of growth. We expect this programme to deliver increased productivity, with targeted net annualised operating cost savings of $15 million by 2020. ‘To further support our strategy delivery, we completed the Performance Materials acquisition of Patrick Yarn Mill, which extends our existing competencies and innovation capabilities. As with our previous acquisitions of Gotex, Fast React and GSD, we look forward to leveraging Coats’ unrivalled geographic footprint, breadth of global customer relationships and strong corporate brand to support Patrick Yarn Mill’s expansion. ‘We enter 2018 in a strong position, with continued momentum in our Apparel and Footwear and hi-tech Performance Materials businesses. Whilst market conditions in our North American Crafts business are expected to remain challenging, our new management team has commenced implementation of a refocused strategy. We expect 2018 adjusted operating profits to benefit from the incremental full year contribution from the Patrick Yarn Mill acquisition, and the anticipated first year benefits from the Connecting for Growth programme. As such, 2018 adjusted operating profits are expected to be slightly ahead of previous management expectations. We will also continue to focus on cash flow generation in order to allow us to continue to reinvest in both organic and inorganic growth opportunities’ 1 Non-statutory measures (Alternative Performance Measures) are reconciled to the nearest corresponding statutory measure in note 14. Organic growth
is on a CER basis excluding contributions from bolt-on acquisitions. Constant exchange rate (CER) figures are 2016 restated at 2017 exchange rates. Revenue figures are an IFRS measure; however CER and Organic growth rates constitute Alternative Performance Measures.
2 ROCE based on adjusted operating profits. With effect from 1 January 2017 capital employed used in the definition of ROCE includes intangible assets in relation to recent acquisitions. ROCE for 2016 has been restated consistent with the current definition.
3 Net cash generated by operating activities includes $373 million payments into the three UK defined benefit schemes in 2017 (2016: $99 million) 4 Dividend growth based on 2016 pro-forma full year dividend of 1.25 cents per share. 5 Reported refers to values contained in the IFRS column of the primary financial statements in either the current or comparative period.
3
Conference call Coats Management will discuss this report in a webcast / conference call with analysts and investors at 0900 GMT today (27 February 2018). The webcast can be accessed via www.coats.com/investors/fy17. The conference call can be accessed by dialling +44 (0)20 3936 2999 and using participant access code ‘29 01 76’. The webcast will also be made available in archive form on www.coats.com. _________________________________________________________________________________________ Enquiry details Investors Rob Mann Coats Group plc +44 (0)20 8210 5175 Media Richard Mountain / Nick Hasell FTI Consulting +44 (0)20 3727 1374 _________________________________________________________________________________________ This announcement contains inside information for the purposes of the Market Abuse Regulation. About Coats Group plc Coats is the world’s leading industrial thread manufacturer and a major player in the Americas textile crafts market. At home in some 50 countries, Coats employs 19,000 people across six continents. Revenues in 2017 were US$1.5bn. Coats’ pioneering history and innovative culture ensure the company continues leading the way around the world, providing complementary and value added products and services to the apparel and footwear industries; applying innovative techniques to develop high technology Performance Materials threads and yarns in areas such as automotive composites and fibre optics; and extending the crafts offer into new markets and online. Headquartered in the UK, Coats is a FTSE 250 listed company on the London Stock Exchange. To find out more about Coats visit www.coats.com.
4
Summary
2017
2016
Inc / (dec)
2016 CER 1
CER 1 inc/(dec)
Organic 4 inc/(dec)
$m $m % $m % %
Revenue 2
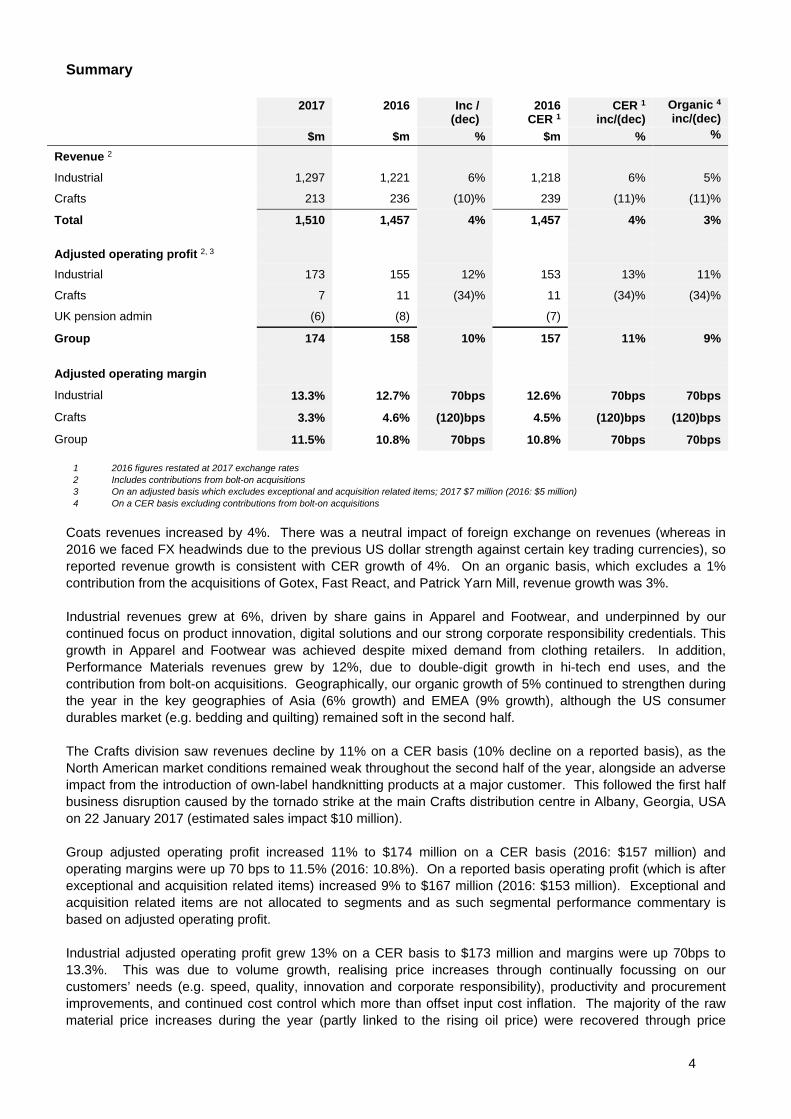
Industrial 1,297 1,221 6% 1,218 6% 5%
Crafts 213 236 (10)% 239 (11)% (11)%
Total 1,510 1,457 4% 1,457 4% 3% Adjusted operating profit 2, 3 Industrial 173 155 12% 153 13% 11%
Crafts 7 11 (34)% 11 (34)% (34)%
UK pension admin (6) (8) (7)
Group 174 158 10% 157 11% 9% Adjusted operating margin
Industrial 13.3% 12.7% 70bps 12.6% 70bps 70bps
Crafts 3.3% 4.6% (120)bps 4.5% (120)bps (120)bps
Group 11.5% 10.8% 70bps 10.8% 70bps 70bps 1 2016 figures restated at 2017 exchange rates 2 Includes contributions from bolt-on acquisitions 3 On an adjusted basis which excludes exceptional and acquisition related items; 2017 $7 million (2016: $5 million) 4 On a CER basis excluding contributions from bolt-on acquisitions
Coats revenues increased by 4%. There was a neutral impact of foreign exchange on revenues (whereas in 2016 we faced FX headwinds due to the previous US dollar strength against certain key trading currencies), so reported revenue growth is consistent with CER growth of 4%. On an organic basis, which excludes a 1% contribution from the acquisitions of Gotex, Fast React, and Patrick Yarn Mill, revenue growth was 3%. Industrial revenues grew at 6%, driven by share gains in Apparel and Footwear, and underpinned by our continued focus on product innovation, digital solutions and our strong corporate responsibility credentials. This growth in Apparel and Footwear was achieved despite mixed demand from clothing retailers. In addition, Performance Materials revenues grew by 12%, due to double-digit growth in hi-tech end uses, and the contribution from bolt-on acquisitions. Geographically, our organic growth of 5% continued to strengthen during the year in the key geographies of Asia (6% growth) and EMEA (9% growth), although the US consumer durables market (e.g. bedding and quilting) remained soft in the second half. The Crafts division saw revenues decline by 11% on a CER basis (10% decline on a reported basis), as the North American market conditions remained weak throughout the second half of the year, alongside an adverse impact from the introduction of own-label handknitting products at a major customer. This followed the first half business disruption caused by the tornado strike at the main Crafts distribution centre in Albany, Georgia, USA on 22 January 2017 (estimated sales impact $10 million). Group adjusted operating profit increased 11% to $174 million on a CER basis (2016: $157 million) and operating margins were up 70 bps to 11.5% (2016: 10.8%). On a reported basis operating profit (which is after exceptional and acquisition related items) increased 9% to $167 million (2016: $153 million). Exceptional and acquisition related items are not allocated to segments and as such segmental performance commentary is based on adjusted operating profit. Industrial adjusted operating profit grew 13% on a CER basis to $173 million and margins were up 70bps to 13.3%. This was due to volume growth, realising price increases through continually focussing on our customers’ needs (e.g. speed, quality, innovation and corporate responsibility), productivity and procurement improvements, and continued cost control which more than offset input cost inflation. The majority of the raw material price increases during the year (partly linked to the rising oil price) were recovered through price
5
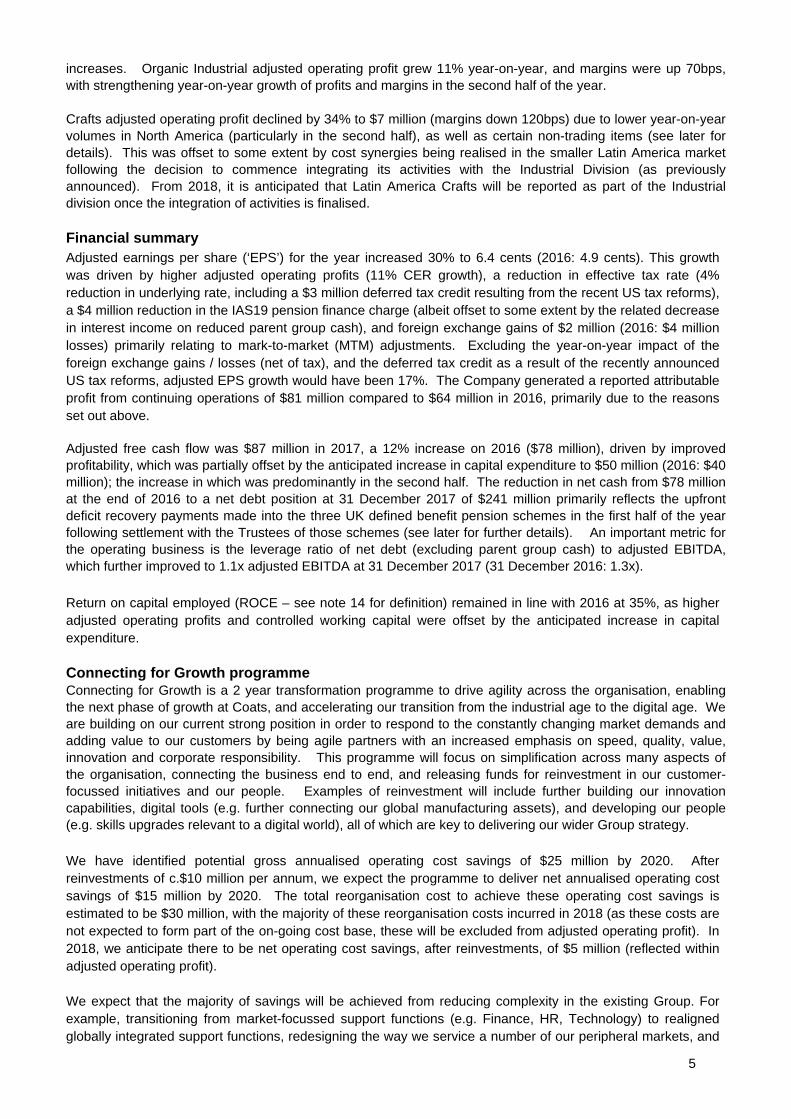
increases. Organic Industrial adjusted operating profit grew 11% year-on-year, and margins were up 70bps, with strengthening year-on-year growth of profits and margins in the second half of the year. Crafts adjusted operating profit declined by 34% to $7 million (margins down 120bps) due to lower year-on-year volumes in North America (particularly in the second half), as well as certain non-trading items (see later for details). This was offset to some extent by cost synergies being realised in the smaller Latin America market following the decision to commence integrating its activities with the Industrial Division (as previously announced). From 2018, it is anticipated that Latin America Crafts will be reported as part of the Industrial division once the integration of activities is finalised. Financial summary Adjusted earnings per share (‘EPS’) for the year increased 30% to 6.4 cents (2016: 4.9 cents). This growth was driven by higher adjusted operating profits (11% CER growth), a reduction in effective tax rate (4% reduction in underlying rate, including a $3 million deferred tax credit resulting from the recent US tax reforms), a $4 million reduction in the IAS19 pension finance charge (albeit offset to some extent by the related decrease in interest income on reduced parent group cash), and foreign exchange gains of $2 million (2016: $4 million losses) primarily relating to mark-to-market (MTM) adjustments. Excluding the year-on-year impact of the foreign exchange gains / losses (net of tax), and the deferred tax credit as a result of the recently announced US tax reforms, adjusted EPS growth would have been 17%. The Company generated a reported attributable profit from continuing operations of $81 million compared to $64 million in 2016, primarily due to the reasons set out above. Adjusted free cash flow was $87 million in 2017, a 12% increase on 2016 ($78 million), driven by improved profitability, which was partially offset by the anticipated increase in capital expenditure to $50 million (2016: $40 million); the increase in which was predominantly in the second half. The reduction in net cash from $78 million at the end of 2016 to a net debt position at 31 December 2017 of $241 million primarily reflects the upfront deficit recovery payments made into the three UK defined benefit pension schemes in the first half of the year following settlement with the Trustees of those schemes (see later for further details). An important metric for the operating business is the leverage ratio of net debt (excluding parent group cash) to adjusted EBITDA, which further improved to 1.1x adjusted EBITDA at 31 December 2017 (31 December 2016: 1.3x). Return on capital employed (ROCE – see note 14 for definition) remained in line with 2016 at 35%, as higher adjusted operating profits and controlled working capital were offset by the anticipated increase in capital expenditure. Connecting for Growth programme Connecting for Growth is a 2 year transformation programme to drive agility across the organisation, enabling the next phase of growth at Coats, and accelerating our transition from the industrial age to the digital age. We are building on our current strong position in order to respond to the constantly changing market demands and adding value to our customers by being agile partners with an increased emphasis on speed, quality, value, innovation and corporate responsibility. This programme will focus on simplification across many aspects of the organisation, connecting the business end to end, and releasing funds for reinvestment in our customer-focussed initiatives and our people. Examples of reinvestment will include further building our innovation capabilities, digital tools (e.g. further connecting our global manufacturing assets), and developing our people (e.g. skills upgrades relevant to a digital world), all of which are key to delivering our wider Group strategy. We have identified potential gross annualised operating cost savings of $25 million by 2020. After reinvestments of c.$10 million per annum, we expect the programme to deliver net annualised operating cost savings of $15 million by 2020. The total reorganisation cost to achieve these operating cost savings is estimated to be $30 million, with the majority of these reorganisation costs incurred in 2018 (as these costs are not expected to form part of the on-going cost base, these will be excluded from adjusted operating profit). In 2018, we anticipate there to be net operating cost savings, after reinvestments, of $5 million (reflected within adjusted operating profit). We expect that the majority of savings will be achieved from reducing complexity in the existing Group. For example, transitioning from market-focussed support functions (e.g. Finance, HR, Technology) to realigned globally integrated support functions, redesigning the way we service a number of our peripheral markets, and
6
moving from a business which is currently operated by individual local management teams into 10 scalable clusters. The programme extends beyond productivity improvements to delivering process excellence, improving customer satisfaction, and creating a wider pool of world class talent, all of which underpin our growth strategy and increase shareholder value. Acquisition of Patrick Yarn Mill Inc. As previously reported, Coats acquired 100% of the share capital of Patrick Yarn Mill in December 2017. Patrick Yarn Mill is a manufacturer of high-performance engineered yarns based in North Carolina, US. It specialises in cut-resistant and flame retardant yarns. It also produces yarns from recycled fibres marketed under its earthspun® trademarks and with its large solar installation promotes its earth friendly yarns as 'Spun by the Sun'. Founded in 1963, Patrick Yarn Mill has 150 employees. Patrick Yarn Mill's unique spinning competencies in engineered performance yarns offer an opportunity to expand Coats' existing Performance Materials portfolio as well as to extend its innovation capability. Coats will support Patrick Yarn Mill's expansion into high-growth markets by leveraging Coats' unrivalled geographic footprint, breadth of global customer relationships and strong corporate brand. The initial consideration is $21 million, with further payments of up to $4 million over a three year period to 2020, contingent on Patrick Yarn Mill achieving certain performance targets. The acquisition will be funded from Coats' operating cash flows and existing debt facilities. In 2017, the business achieved revenues of $42 million, and an adjusted operating profit of $2 million. It is our intention to grow revenues and operating margins going forward through identified revenue and cost synergies as a result of Patrick Yarn Mill being part of the wider Coats group of companies. Refinancing As previously reported, in December, the Group completed a $225 million issue of US Private Placement (USPP) notes. The notes, which represent our debut issue in the USPP market, have a maturity of seven and ten years and have been issued on investment grade terms. Simultaneously, Coats agreed a new $350 million five-year bank facility with a syndicate mainly comprising its existing lenders. The USPP notes and new bank facility replace Coats' $680 million bank facility that was due to mature in March 2020. This refinancing has achieved the Group's aims of diversifying the sources of debt financing and extending their maturity out to 2027. Dividend Coats has a track record of delivering good levels of free cash through profitable sales growth, delivering self-help initiatives and investing in organic growth opportunities. The Board aims to use this free cash flow to fund its pension schemes, self-finance bolt-on acquisitions, and make returns to shareholders. Over time, and as underlying earnings and cash flows increase, the Board intends to pursue a progressive dividend policy. As a result of this established policy, and reflecting the financial performance in 2017, the Board is proposing a final dividend of 1.00c per share which, combined with the interim divided of 0.44c per share, gives a total dividend for the year of 1.44c (pro-forma 2016 full year dividend: 1.25c per share), which represents a 15% increase on the previous year. Subject to approval at the forthcoming AGM, the final dividend will be paid on 29 May 2018 to ordinary shareholders on the register at 4 May 2018, with an ex-dividend date of 3 May 2018. Outlook We enter 2018 in a strong position, with continued momentum in our Apparel and Footwear and hi-tech Performance Materials businesses. Whilst market conditions in our North American Crafts business are expected to remain challenging, our new management team has commenced implementation of a refocused strategy.
7
We expect 2018 adjusted operating profits to benefit from the incremental full year contribution from the Patrick Yarn Mill acquisition, and the anticipated first year benefits from the Connecting for Growth programme. As such, 2018 adjusted operating profits are expected to be slightly ahead of previous management expectations. We will also continue to focus on cash flow generation in order to allow us to continue to reinvest in both organic and inorganic growth opportunities.
8
Operating Review Industrial
2017 2016
Inc /
(dec) 2016
CER 1 CER 1
inc/(dec) Organic 6 inc/(dec)
$m $m % $m % % Revenue 2
By business
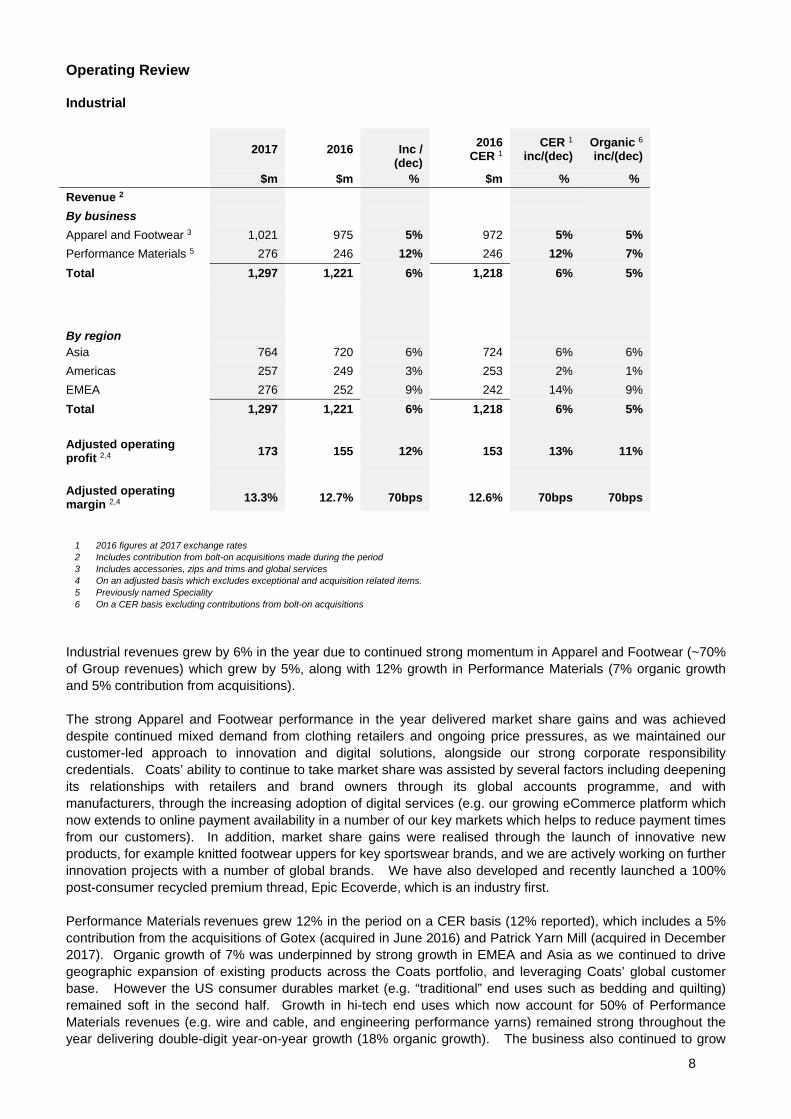
Apparel and Footwear 3 1,021 975 5% 972 5% 5% Performance Materials 5 276 246 12% 246 12% 7% Total 1,297 1,221 6% 1,218 6% 5% By region
Asia 764 720 6% 724 6% 6% Americas 257 249 3% 253 2% 1% EMEA 276 252 9% 242 14% 9% Total 1,297 1,221 6% 1,218 6% 5% Adjusted operating profit 2,4 173 155 12% 153 13% 11%
Adjusted operating margin 2,4 13.3% 12.7% 70bps 12.6% 70bps 70bps
1 2016 figures at 2017 exchange rates 2 Includes contribution from bolt-on acquisitions made during the period 3 Includes accessories, zips and trims and global services 4 On an adjusted basis which excludes exceptional and acquisition related items. 5 Previously named Speciality 6 On a CER basis excluding contributions from bolt-on acquisitions
Industrial revenues grew by 6% in the year due to continued strong momentum in Apparel and Footwear (~70% of Group revenues) which grew by 5%, along with 12% growth in Performance Materials (7% organic growth and 5% contribution from acquisitions). The strong Apparel and Footwear performance in the year delivered market share gains and was achieved despite continued mixed demand from clothing retailers and ongoing price pressures, as we maintained our customer-led approach to innovation and digital solutions, alongside our strong corporate responsibility credentials. Coats’ ability to continue to take market share was assisted by several factors including deepening its relationships with retailers and brand owners through its global accounts programme, and with manufacturers, through the increasing adoption of digital services (e.g. our growing eCommerce platform which now extends to online payment availability in a number of our key markets which helps to reduce payment times from our customers). In addition, market share gains were realised through the launch of innovative new products, for example knitted footwear uppers for key sportswear brands, and we are actively working on further innovation projects with a number of global brands. We have also developed and recently launched a 100% post-consumer recycled premium thread, Epic Ecoverde, which is an industry first. Performance Materials revenues grew 12% in the period on a CER basis (12% reported), which includes a 5% contribution from the acquisitions of Gotex (acquired in June 2016) and Patrick Yarn Mill (acquired in December 2017). Organic growth of 7% was underpinned by strong growth in EMEA and Asia as we continued to drive geographic expansion of existing products across the Coats portfolio, and leveraging Coats’ global customer base. However the US consumer durables market (e.g. “traditional” end uses such as bedding and quilting) remained soft in the second half. Growth in hi-tech end uses which now account for 50% of Performance Materials revenues (e.g. wire and cable, and engineering performance yarns) remained strong throughout the year delivering double-digit year-on-year growth (18% organic growth). The business also continued to grow
9
revenues in new, innovative products, and in 2017 over 20% of our total Performance Materials revenues were in relation to products that did not exist 5 years ago (for example, Coats Synergex). Overall, following the Performance Materials organic growth of 4% in the July-October period which was reported in November 2017, we have seen the organic growth for the second half improve to 6%. By region, revenue in Asia grew by 6% on a CER basis which was ahead of the 4% growth reported in the first half, as momentum in key Apparel and Footwear markets (e.g. Vietnam and Indonesia) gathered pace during the year (7% growth in H2). Thread sales in China for domestic Apparel and Footwear consumption grew strongly by 9% in 2017, supporting our belief that Coats remains well placed in that market to benefit from the macro trend of the expansion of the urban middle class in Asia. Revenues in EMEA rose 14% (9% organic growth) which was a continuation of a strong and improving performance in 2016 (7% organic growth) and the first half of 2017 (organic growth 8%), driven by double-digit growth in certain key A&F markets (e.g. Turkey) and hi-tech Performance Materials end uses (including Gotex). In the Americas there was a return to growth in the year (2% decline in 2016) following strong performance in certain key Latin America Markets, and a marginal year-on-year improvement in the US consumer durables market on 2016 although overall this market remains weak. Industrial adjusted operating profit increased 13% to $173 million on a CER basis (2016: $153 million) and margins increased 70bps to 13.3%. This reflected strong volume growth driving a positive operational gearing impact, realising price increases through continually focussing on our customers’ needs (e.g. speed, quality, innovation and corporate responsibility), ongoing productivity and procurement savings, and a close control of costs. The majority of the raw material price increases seen during the year (partly linked to the rising oil price) were recovered through price increases, and together with these other self-help initiatives were able to more than offset the other structural non-raw material inflation (e.g. wages and energy) that the Group faces across the many countries in which it operates. Year-on-year adjusted operating profit growth in the second half of 2017 improved to 15% and margins increased year-on-year by 100bps. Crafts
2017 2016
Inc /
(dec) 2016
CER 1 CER 1
inc/(dec)
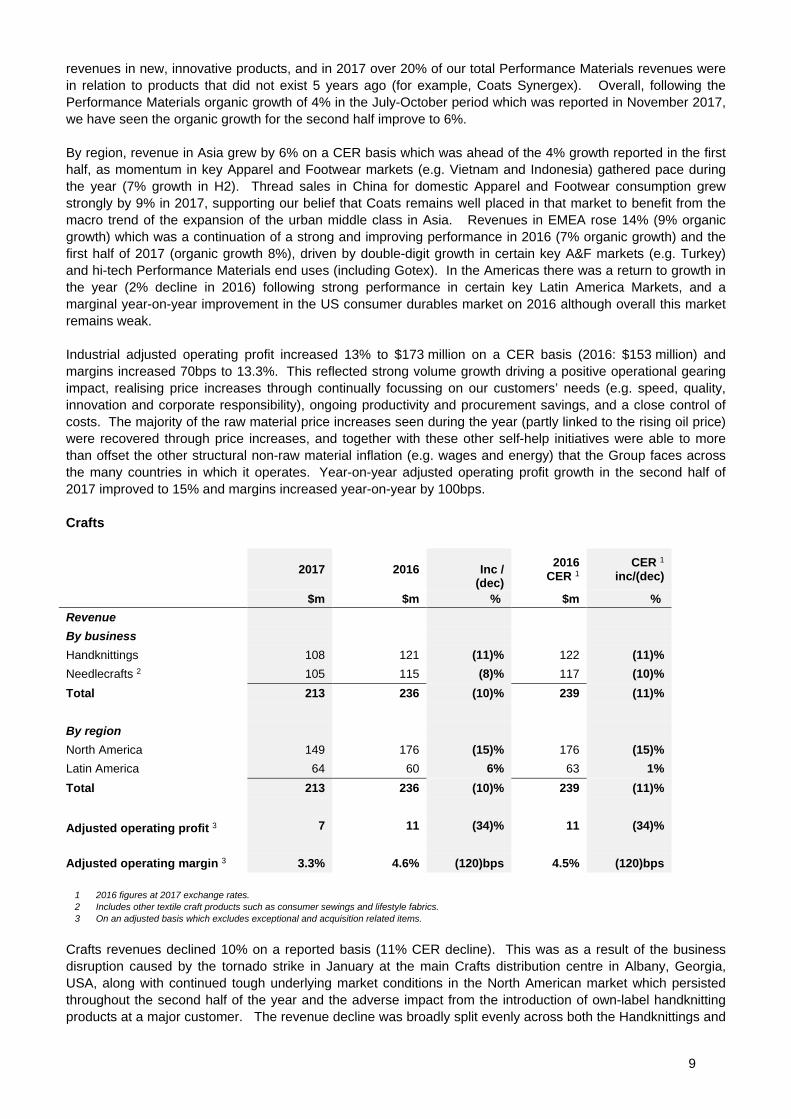
$m $m % $m % Revenue By business Handknittings 108 121 (11)% 122 (11)% Needlecrafts 2 105 115 (8)% 117 (10)% Total 213 236 (10)% 239 (11)% By region North America 149 176 (15)% 176 (15)% Latin America 64 60 6% 63 1% Total 213 236 (10)% 239 (11)% Adjusted operating profit 3 7 11 (34)% 11 (34)% Adjusted operating margin 3 3.3% 4.6% (120)bps 4.5% (120)bps
1 2016 figures at 2017 exchange rates. 2 Includes other textile craft products such as consumer sewings and lifestyle fabrics. 3 On an adjusted basis which excludes exceptional and acquisition related items.
Crafts revenues declined 10% on a reported basis (11% CER decline). This was as a result of the business disruption caused by the tornado strike in January at the main Crafts distribution centre in Albany, Georgia, USA, along with continued tough underlying market conditions in the North American market which persisted throughout the second half of the year and the adverse impact from the introduction of own-label handknitting products at a major customer. The revenue decline was broadly split evenly across both the Handknittings and
10
Needlecrafts categories. Revenues in the smaller Latin America market grew by 1% on a CER basis (6% reported), with growth in the key markets of Brazil and Argentina. Despite the continued difficult trading conditions, the division has continued to make good progress in the areas of enhancing its online offerings and new product launches. New management is now in place in our North American Crafts business who will be delivering a revised and refocused strategy, and the previously announced integration of the Latin American business with the Industrial operations remains on-going. From 2018, it is anticipated that Latin America Crafts will be reported as part of the Industrial division once the integration of activities is finalised. Adjusted operating margins in the Crafts Division reduced to 3.3% (2016: 4.5%) and adjusted operating profits were down 34% to $7 million (2016: $11 million). This margin reduction was mainly due to non-trading items that occurred in the second half. These included reorganisation costs in relation to the North American management team, specific business disruption costs in relation to the Albany tornado, and asset write-downs following the sale of the non-core lifestyle fabrics business (due to complete in H1 2018). Offsetting the above, were the realisation of the initial cost synergies anticipated in the Latin American business ahead of its eventual full integration with the Industrial business. First half adjusted operating margins of 5.3% benefitted partially from the profit insurance cover in relation to lost revenues resulting from the tornado. Financial review Adjusted EPS for the year increased 30% to 6.4 cents (2016: 4.9 cents). This was driven by the higher operating profit, improvements in the underlying tax rate, the deferred tax credit as a result of the recently announced US tax reforms, a lower pension finance charge (offset to some extent by decrease in interest income on reduced parent group cash), and MTM foreign exchange gains (2016: foreign exchange losses). Excluding the year-on-year impact of the MTM foreign exchange gains/losses (net of tax), and the one-off impact of the US tax reforms on deferred tax balances, adjusted EPS growth would have been 17%. Reported EPS of 5.8 cents compares to 4.3 cents in 2016 with the increase predominantly due to the above factors. Non-operating results Net finance costs in the period were $23.0 million, significantly down from $31.6 million in 2016. The key drivers of the reduction in net finance costs in the period were $2 million foreign exchange gains mainly in relation to MTM adjustments for the year ended 31 December 2017 (2016: $4 million losses), and a $4 million reduction in the IAS19 pension finance charge to $9.4 million (2016: $13.6 million). The latter was following the injection of parent group cash into the three UK defined benefit schemes which reduced the net IAS19 liabilities accordingly, although the reduced pension finance charge was offset to some extent by reduced interest income on the lower parent group cash balance. Interest on borrowings was broadly flat year-on-year at $14.5 million (2016 $14.4 million); underlying interest was lower partly due to fixed interest rate swaps coming to an end, as well as lower net debt levels during the year. However, this was offset by a $2 million charge in relation to accelerated amortisation of capitalised facility fees in relation to the previous 2015 refinancing (following the USPP issue and refinancing of existing bank debt in December 2017). The taxation charge for 2017 was $47.8 million (2016: $46.8 million) resulting in a reported tax rate of 33% (2016: 38%). Excluding exceptional and acquisition related items and the impact of IAS19 finance charges, the underlying effective rate on pre-tax profits reduced by 400bps to 30% (2016: 34%). This reduction includes a non-cash tax credit of $3.0 million (200 bps) as a result of the revaluation of the net US deferred tax liabilities following the tax reform measures introduced by the US Government in the Tax Cuts & Jobs Act. The Group’s underlying effective tax rate excluding this one-off impact is 32%, a reduction of 200bps from 2016 which was driven by a reduction in unrelieved losses, together with a change in profit mix for the period. We have reviewed the available detail of the Tax Cuts & Jobs Act but do not expect the changes to have a significant impact on the Group’s future underlying effective tax rate despite the reduction in the headline US Corporate Income Tax rate from 35% to 21% with effect from 1 January 2018. The benefit of the rate reduction is offset by provisions to limit net interest expense to 30% of adjusted taxable income and the loss of the domestic production activities deduction, which our US operations have historically benefitted from. Further
11
detail and guidance is expected to be released in the coming months and we will continue to monitor this. Profit attributable to minority interests was $14.3 million (2016: $11.9 million) and was predominantly related to Coats’ operations in Vietnam and Bangladesh (in which it has controlling interests). Exceptional and acquisition related items Net exceptional and acquisition related items before taxation were $9.1 million in 2017. These are related to the amortisation of intangible assets acquired in the recent acquisitions ($2.1 million), contingent consideration in relation to these acquisitions ($4.0 million), acquisition transaction costs ($0.4 million), and the closure costs of a joint venture entity ($2.6 million). In 2016 net exceptional and acquisition related items before taxation totalled $4.6 million. Lower Passaic River In 2010, the US Environmental Protection Agency (‘EPA’) notified Coats & Clark, Inc. (‘CC’), a subsidiary within the Coats Group, that it was a ‘potentially responsible party’ under the US Superfund law for investigation and remediation costs at the 17 mile Lower Passaic River Study Area (‘LPR’) in New Jersey in respect of alleged operations of a predecessor’s former facilities in that area prior to 1950. CC has concluded that it was not responsible for the contaminants and environmental damage that are the primary focus of the EPA process. In 2015, a provision of $15.8 million was recorded for remediation costs and associated legal and professional costs based on CC’s estimated share of de minimis costs for appropriate remedies, net of insurance reimbursements. In September 2017, in response to comments from various parties that all parties should be included in the same allocation process, EPA expanded the process to include private parties that are alleged to have discharged the relevant contaminants, and asked the allocator to make a determination about the respective shares of all parties. CC has previously indicated to EPA that it is not responsible for the primary risk drivers. The duration and scope of the allocation process have yet to be determined. No additional provision has been recorded during 2017. See note 10 for further details. Investment Capital expenditure in the year, in addition to ongoing maintenance requirements, related to new product development, process improvements, capacity expansion, health and safety, and environmental spend. The latter, include projects such as effluent treatment plants which enable a thread plant to recycle more process water, or even to operate with zero discharges.. These help to ensure that Coats maintains its strong corporate responsibility credentials and ethical reputation in the industry as well as benefitting the local communities that we do business in. Total capital spend for the year amounted to $50 million (1.2x depreciation and amortisation), in line with the previously flagged increase on the 2016 capital spend of $40 million (1.0x depreciation and amortisation). In order to continue to support our growth strategy and reinforce our strong environmental compliance credentials we anticipate capital spend to remain in the $50-60 million range for 2018. Cash flow Adjusted free cash flow was $87 million in 2017, which was a 12% increase on 2016 ($78 million). This was due to increased profitability and lower effective tax rates, which more than offset the anticipated second half increase in capital expenditure ($8 million increase vs H2 2016). This is a key metric for the Group in relation to underlying cash flow generation and is before annual pension recovery payments, acquisitions and dividends, and excludes exceptional items. Adjusted EBITDA (defined as adjusted operating profit before depreciation and amortisation) was $216 million (2016: $199 million). Net working capital has been effectively controlled at 10% of Group sales (2016: 10%), driven by an improvement in days payable outstanding which was offset by an increase in stocks to support service delivery, along with a marginal improvement in days sales outstanding. Interest paid was $14 million, which was in line with 2016. Tax paid was $61 million, a $3 million increase on 2016, where the impact of higher profitability in 2017 was offset by the overall reduction in the Group’s underlying effective tax rate driven by the profit mix.
12
On a non-adjusted basis, free cash outflow was $330 million, compared to $84 million outflow in 2016. The increase was primarily related to $373 million of payments into the three UK defined benefit pension schemes (2016: $99 million) following settlement with their respective trustees (including $348 million of upfront settlement payments out of parent group cash made in the first half), shareholder dividends of $18 million (2016: nil), offset by a lower spend on acquisitions in 2017 of $20 million (2016: $36 million). Balance sheet The Group had a net debt position of $241 million at 31 December 2017 (31 December 2016: net cash $78 million). At 31 December 2016 the net cash position of $78 million included parent group cash of $343 million and operating business net debt of $265 million. Following the settlement of the three UK defined benefit pension schemes in the first half of 2017 the parent group cash has now reduced to $0.5 million, with $348 million (£270 million) up-front settlement payments into those three schemes. The Coats operating business had a net debt position of $242 million at the end 2017. This was below 31 December 2016 ($265 million) primarily due to the adjusted free cash flow in the year ($87 million), offset by on-going pension deficit recovery payments (including administrative expenses) now paid out of the operating business net debt following settlement ($25 million), shareholder dividends ($18 million) and the acquisition of Patrick Yarn Mill ($20 million). An important metric for the operating business is the leverage ratio of net debt (excluding parent group cash) to adjusted EBITDA. Net debt at 31 December 2017 improved to 1.1x adjusted EBITDA of the last twelve months (1.3x at 31 December 2016). Following the binding settlement agreements agreed with the trustees of the three UK pension schemes (see further details below) it was determined that the functional currency of Coats Group plc had changed from Great Britain pounds sterling to the United States dollars, effective 1 March 2017. This change has been accounted for prospectively (in line with accounting standards) and generated exchange differences in the year that reduced share capital by $40 million, reduced the capital reduction reserve by $25 million, and reduced the share premium account by $11 million. Equivalent gains were booked in the translation reserve and as a result distributable reserves have not been impacted by this change. Pensions and other post-employment benefits The net obligation for the Group’s retirement and other post-employment defined benefit liabilities, on an IAS19 financial reporting basis, was $163 million as at 31 December 2017, down from $627 million at 31 December 2016. The deficits in the Group’s UK defined benefit schemes, namely the UK Coats Plan, and Brunel and Staveley schemes, decreased to $106 million (£79 million) from the position at 31 December 2016 ($576 million, £467 million). The decrease in liabilities in the period of $470 million primarily consisted of deficit repair payments of $373 million (which included agreed upfront settlement payments of £270 million ($348 million) made in the first half), actuarial gains of $141 million (mainly related to asset outperformance) offset by the impact of foreign exchange on Sterling liabilities of $31 million.
IAS19 deficit 31 Dec 2017 31 Dec
2016 31 Dec
2017 31 Dec
2016 $m $m £m £m Coats Plan 78 467 58 378 Brunel 30 64 22 52 Staveley (2) 45 (1) 37 UK defined benefit schemes 106 576 79 467 Other Coats net employee benefit obligations
57 51
Total 163 627
Pensions Investigations As previously reported in the announcements of 16 December 2016, 17 February 2017, and 26 June 2017 Coats has signed binding settlement agreements with the Trustees of all three UK pension schemes; the UK Coats Pension Plan, the Brunel Holdings Pension scheme and the Staveley Industries Retirement Benefit
13
Scheme. The settlements with the three schemes were completed in the first half of 2017, and as a result the UK Pension Regulator confirmed that its regulatory action has ceased in relation to the warning notices issued to the Company in 2013 and 2014. The principal commercial terms of the combined three settlements are:
• Financial support on the basis of a combined technical provisions deficit as at April 2015 of £582 million ($786 million) to be repaired by: a) upfront payments totalling £329.5 million ($447 million) from the Company's parent group cash
paid directly into the schemes (inclusive of the agreed Recovery Plan contributions paid to the Brunel and Staveley schemes since 1 January 2016); and
b) annual deficit contributions totalling £17.5 million ($24 million), including estimated administration expenses and levies of £5 million p.a. to be paid until 2028.
• Access to sponsor support from Coats for future funding needs together with a Company guarantee. As a result of the settlements reached with the three schemes, the total cash Recovery Plan contributions in 2017, including estimated administration expenses and levies, were £290 million ($373 million). This comprised £270 million upfront settlement payments (which were paid in H1), and £20 million annual deficit contributions, including estimated administration expenses and levies. These cash payments continue to be excluded from the Group's adjusted Free Cash Flow. Triennial funding valuations The next triennial funding valuations for the Coats UK, Brunel and Staveley schemes have an effective date of 31 March 2018. Although there is a relatively small IAS19 accounting deficit as at 31 December 2017 in comparison to the gross pension liabilities, the pension trustees are required to calculate the funding position on the more prudent technical provisions basis. In addition, real UK interest rates have reduced since the first quarter of 2015 and in aggregate the UK schemes now hedge c.70% of interest rate and inflation linked liabilities. These triennial valuations will determine the Group’s agreed future contribution requirements and the process is expected to be completed in the first half of 2019.
14
Coats Group plc
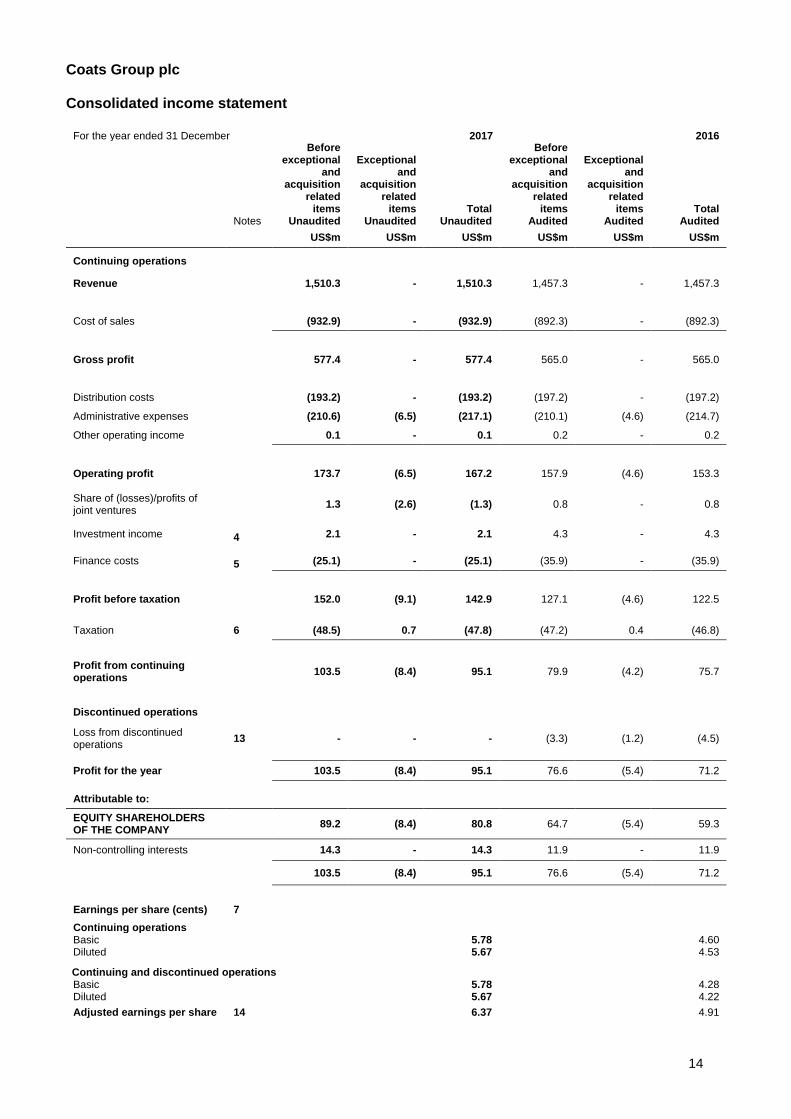
Consolidated income statement
For the year ended 31 December 2017 2016
Notes
Before exceptional
and acquisition
related items
Unaudited
Exceptional and
acquisition related items
Unaudited Total
Unaudited
Before exceptional
and acquisition
related items
Audited
Exceptional and
acquisition related items
Audited Total
Audited
US$m US$m US$m US$m US$m US$m
Continuing operations Revenue 1,510.3 - 1,510.3 1,457.3 - 1,457.3
Cost of sales (932.9) - (932.9) (892.3) - (892.3)
Gross profit 577.4 - 577.4 565.0 - 565.0
Distribution costs (193.2) - (193.2) (197.2) - (197.2)
Administrative expenses (210.6) (6.5) (217.1) (210.1) (4.6) (214.7)
Other operating income 0.1 - 0.1 0.2 - 0.2
Operating profit 173.7 (6.5) 167.2 157.9 (4.6) 153.3
Share of (losses)/profits of joint ventures 1.3 (2.6) (1.3) 0.8 - 0.8
Investment income 4 2.1 - 2.1 4.3 - 4.3
Finance costs 5 (25.1) - (25.1) (35.9) - (35.9)
Profit before taxation 152.0 (9.1) 142.9 127.1 (4.6) 122.5
Taxation 6 (48.5) 0.7 (47.8) (47.2) 0.4 (46.8)
Profit from continuing operations 103.5 (8.4) 95.1 79.9 (4.2) 75.7
Discontinued operations Loss from discontinued operations 13 - - - (3.3) (1.2) (4.5)
Profit for the year 103.5 (8.4) 95.1 76.6 (5.4) 71.2
Attributable to: EQUITY SHAREHOLDERS OF THE COMPANY 89.2 (8.4) 80.8 64.7 (5.4) 59.3
Non-controlling interests 14.3 - 14.3 11.9 - 11.9
103.5 (8.4) 95.1 76.6 (5.4) 71.2
Earnings per share (cents) 7 Continuing operations Basic 5.78 4.60 Diluted 5.67 4.53
Continuing and discontinued operations Basic 5.78 4.28 Diluted 5.67 4.22 Adjusted earnings per share 14 6.37 4.91
15
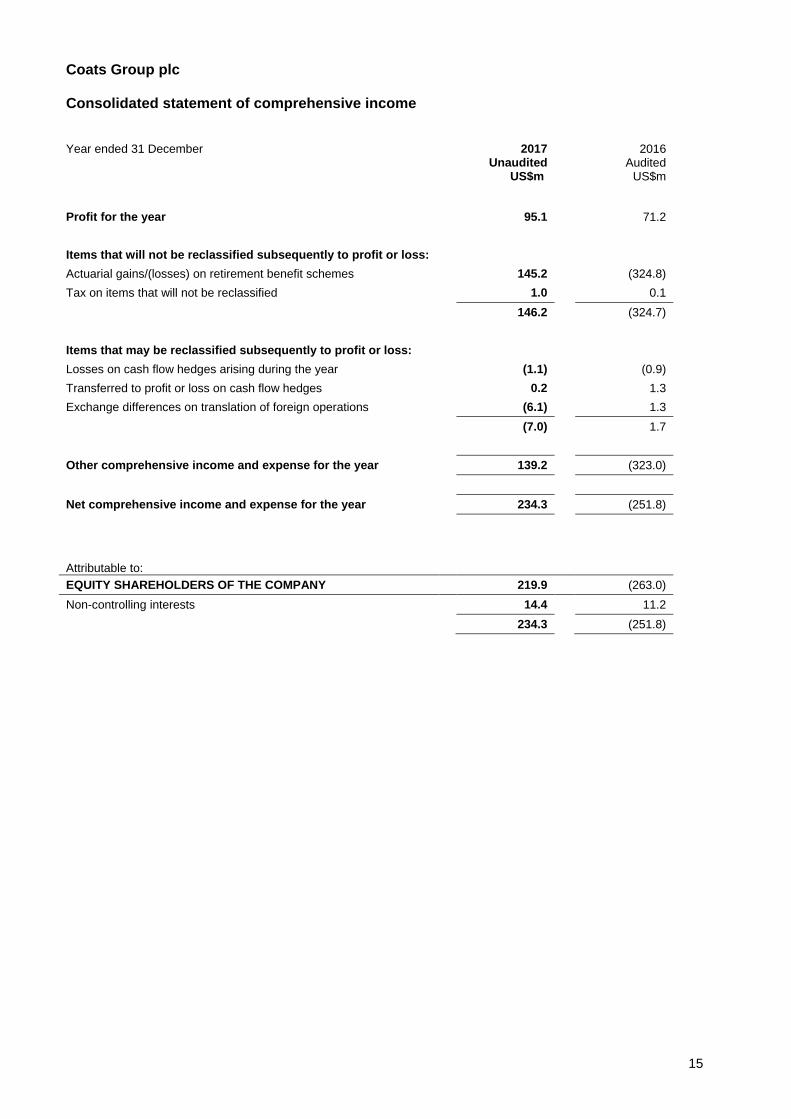
Coats Group plc Consolidated statement of comprehensive income Year ended 31 December 2017
Unaudited 2016
Audited
US$m US$m
Profit for the year 95.1 71.2
Items that will not be reclassified subsequently to profit or loss:
Actuarial gains/(losses) on retirement benefit schemes 145.2 (324.8)
Tax on items that will not be reclassified 1.0 0.1
146.2 (324.7)
Items that may be reclassified subsequently to profit or loss:
Losses on cash flow hedges arising during the year (1.1) (0.9)
Transferred to profit or loss on cash flow hedges 0.2 1.3
Exchange differences on translation of foreign operations (6.1) 1.3
(7.0) 1.7
Other comprehensive income and expense for the year 139.2 (323.0)
Net comprehensive income and expense for the year 234.3 (251.8)
Attributable to:
EQUITY SHAREHOLDERS OF THE COMPANY 219.9 (263.0)
Non-controlling interests 14.4 11.2
234.3 (251.8)
16
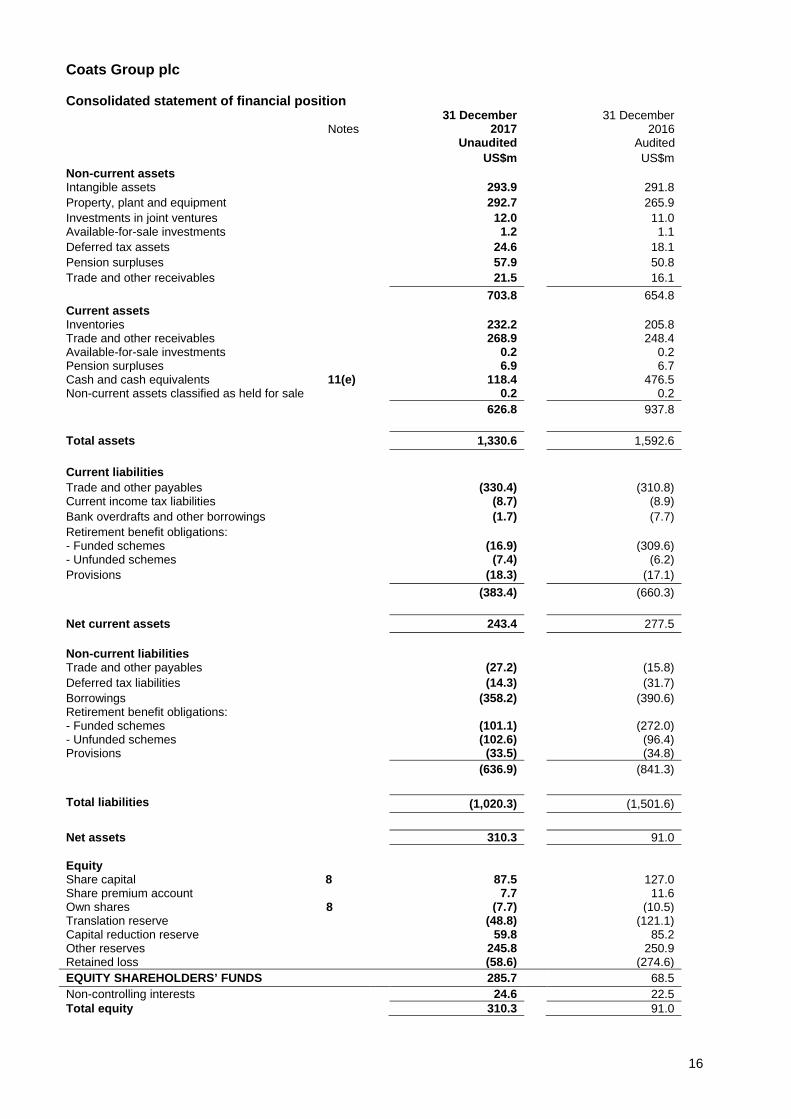
Coats Group plc Consolidated statement of financial position
Notes 31 December
2017 Unaudited
31 December 2016 Audited
US$m US$m Non-current assets Intangible assets 293.9 291.8 Property, plant and equipment 292.7 265.9 Investments in joint ventures 12.0 11.0 Available-for-sale investments 1.2 1.1 Deferred tax assets 24.6 18.1 Pension surpluses 57.9 50.8 Trade and other receivables 21.5 16.1 703.8 654.8 Current assets Inventories 232.2 205.8 Trade and other receivables 268.9 248.4 Available-for-sale investments 0.2 0.2 Pension surpluses 6.9 6.7 Cash and cash equivalents 11(e) 118.4 476.5 Non-current assets classified as held for sale 0.2 0.2 626.8 937.8 Total assets 1,330.6 1,592.6 Current liabilities Trade and other payables (330.4) (310.8) Current income tax liabilities (8.7) (8.9) Bank overdrafts and other borrowings (1.7) (7.7) Retirement benefit obligations: - Funded schemes (16.9) (309.6) - Unfunded schemes (7.4) (6.2) Provisions (18.3) (17.1) (383.4) (660.3) Net current assets 243.4 277.5 Non-current liabilities Trade and other payables (27.2) (15.8) Deferred tax liabilities (14.3) (31.7) Borrowings (358.2) (390.6) Retirement benefit obligations: - Funded schemes (101.1) (272.0) - Unfunded schemes (102.6) (96.4) Provisions (33.5) (34.8) (636.9) (841.3) Total liabilities (1,020.3) (1,501.6) Net assets 310.3 91.0 Equity Share capital 8 87.5 127.0 Share premium account 7.7 11.6 Own shares 8 (7.7) (10.5) Translation reserve (48.8) (121.1) Capital reduction reserve 59.8 85.2 Other reserves 245.8 250.9 Retained loss (58.6) (274.6) EQUITY SHAREHOLDERS’ FUNDS 285.7 68.5 Non-controlling interests 24.6 22.5 Total equity 310.3 91.0
17
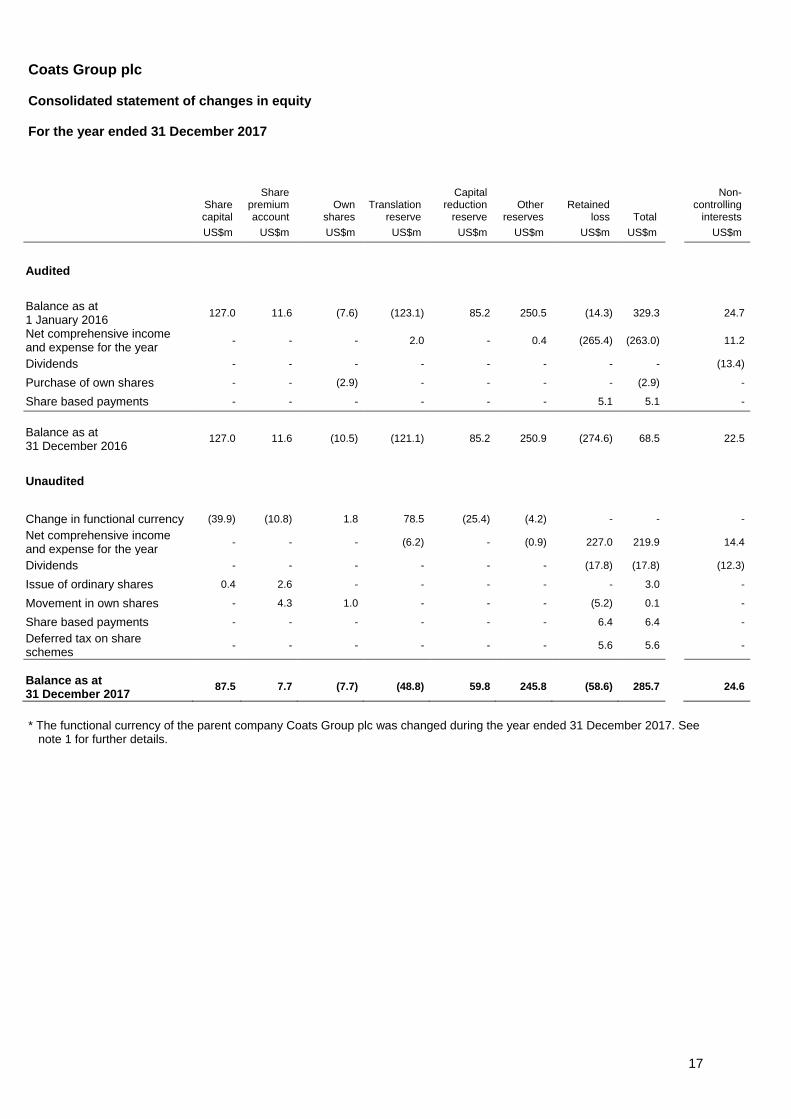
Coats Group plc Consolidated statement of changes in equity For the year ended 31 December 2017
Share capital
Share premium account
Own
shares
Translation
reserve
Capital reduction
reserve
Other
reserves
Retained
loss
Total
Non- controlling
interests US$m US$m US$m US$m US$m US$m US$m US$m US$m
Audited Balance as at 1 January 2016 127.0 11.6 (7.6) (123.1) 85.2 250.5 (14.3) 329.3 24.7
Net comprehensive income and expense for the year - - - 2.0 - 0.4 (265.4) (263.0) 11.2
Dividends - - - - - - - - (13.4)
Purchase of own shares - - (2.9) - - - - (2.9) -
Share based payments - - - - - - 5.1 5.1 - Balance as at 31 December 2016
127.0
11.6
(10.5)
(121.1)
85.2
250.9
(274.6)
68.5
22.5
Unaudited
Change in functional currency (39.9) (10.8) 1.8 78.5 (25.4) (4.2) - - - Net comprehensive income and expense for the year - - - (6.2) - (0.9) 227.0 219.9 14.4
Dividends - - - - - - (17.8) (17.8) (12.3)
Issue of ordinary shares 0.4 2.6 - - - - - 3.0 -
Movement in own shares - 4.3 1.0 - - - (5.2) 0.1 -
Share based payments - - - - - - 6.4 6.4 - Deferred tax on share schemes - - - - - - 5.6 5.6 -
Balance as at 31 December 2017
87.5
7.7
(7.7)
(48.8)
59.8
245.8
(58.6)
285.7
24.6
* The functional currency of the parent company Coats Group plc was changed during the year ended 31 December 2017. See note 1 for further details.
18
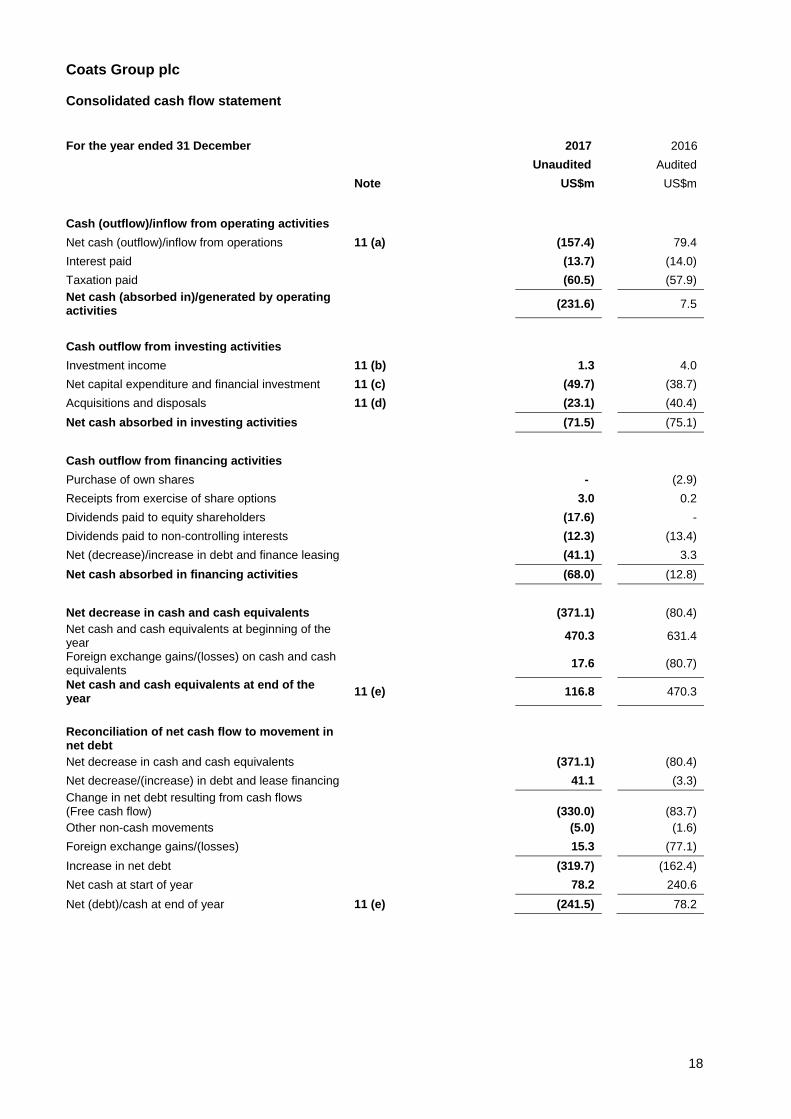
Coats Group plc Consolidated cash flow statement
For the year ended 31 December 2017 2016 Unaudited Audited Note US$m US$m
Cash (outflow)/inflow from operating activities
Net cash (outflow)/inflow from operations 11 (a) (157.4) 79.4
Interest paid (13.7) (14.0)
Taxation paid (60.5) (57.9) Net cash (absorbed in)/generated by operating activities (231.6) 7.5
Cash outflow from investing activities
Investment income 11 (b) 1.3 4.0
Net capital expenditure and financial investment 11 (c) (49.7) (38.7)
Acquisitions and disposals 11 (d) (23.1) (40.4)
Net cash absorbed in investing activities (71.5) (75.1)
Cash outflow from financing activities
Purchase of own shares - (2.9)
Receipts from exercise of share options 3.0 0.2
Dividends paid to equity shareholders (17.6) -
Dividends paid to non-controlling interests (12.3) (13.4)
Net (decrease)/increase in debt and finance leasing (41.1) 3.3
Net cash absorbed in financing activities (68.0) (12.8)
Net decrease in cash and cash equivalents (371.1) (80.4) Net cash and cash equivalents at beginning of the year 470.3 631.4
Foreign exchange gains/(losses) on cash and cash equivalents 17.6 (80.7)
Net cash and cash equivalents at end of the year 11 (e) 116.8 470.3
Reconciliation of net cash flow to movement in net debt
Net decrease in cash and cash equivalents (371.1) (80.4)
Net decrease/(increase) in debt and lease financing 41.1 (3.3) Change in net debt resulting from cash flows (Free cash flow)
(330.0) (83.7)
Other non-cash movements (5.0) (1.6)
Foreign exchange gains/(losses) 15.3 (77.1)
Increase in net debt (319.7) (162.4)
Net cash at start of year 78.2 240.6
Net (debt)/cash at end of year 11 (e) (241.5) 78.2
19
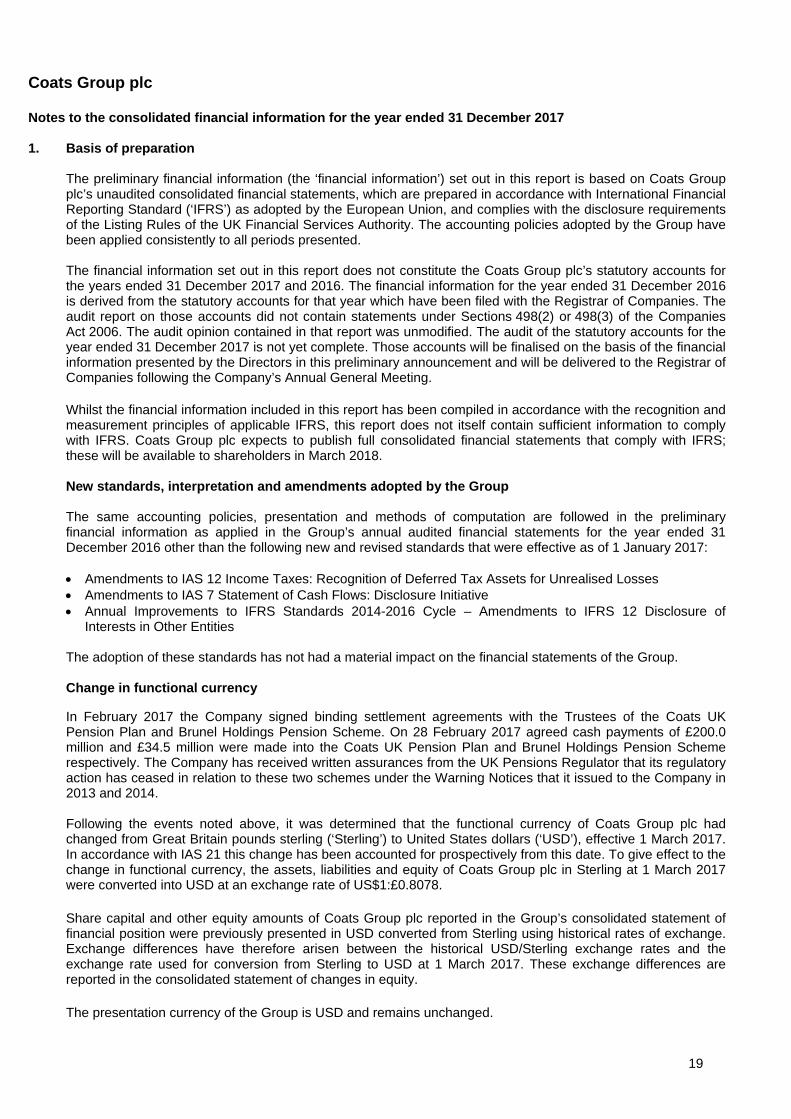
Coats Group plc Notes to the consolidated financial information for the year ended 31 December 2017 1. Basis of preparation
The preliminary financial information (the ‘financial information’) set out in this report is based on Coats Group plc’s unaudited consolidated financial statements, which are prepared in accordance with International Financial Reporting Standard (‘IFRS’) as adopted by the European Union, and complies with the disclosure requirements of the Listing Rules of the UK Financial Services Authority. The accounting policies adopted by the Group have been applied consistently to all periods presented. The financial information set out in this report does not constitute the Coats Group plc’s statutory accounts for the years ended 31 December 2017 and 2016. The financial information for the year ended 31 December 2016 is derived from the statutory accounts for that year which have been filed with the Registrar of Companies. The audit report on those accounts did not contain statements under Sections 498(2) or 498(3) of the Companies Act 2006. The audit opinion contained in that report was unmodified. The audit of the statutory accounts for the year ended 31 December 2017 is not yet complete. Those accounts will be finalised on the basis of the financial information presented by the Directors in this preliminary announcement and will be delivered to the Registrar of Companies following the Company’s Annual General Meeting.
Whilst the financial information included in this report has been compiled in accordance with the recognition and measurement principles of applicable IFRS, this report does not itself contain sufficient information to comply with IFRS. Coats Group plc expects to publish full consolidated financial statements that comply with IFRS; these will be available to shareholders in March 2018. New standards, interpretation and amendments adopted by the Group The same accounting policies, presentation and methods of computation are followed in the preliminary financial information as applied in the Group’s annual audited financial statements for the year ended 31 December 2016 other than the following new and revised standards that were effective as of 1 January 2017: • Amendments to IAS 12 Income Taxes: Recognition of Deferred Tax Assets for Unrealised Losses • Amendments to IAS 7 Statement of Cash Flows: Disclosure Initiative • Annual Improvements to IFRS Standards 2014-2016 Cycle – Amendments to IFRS 12 Disclosure of
Interests in Other Entities The adoption of these standards has not had a material impact on the financial statements of the Group. Change in functional currency In February 2017 the Company signed binding settlement agreements with the Trustees of the Coats UK Pension Plan and Brunel Holdings Pension Scheme. On 28 February 2017 agreed cash payments of £200.0 million and £34.5 million were made into the Coats UK Pension Plan and Brunel Holdings Pension Scheme respectively. The Company has received written assurances from the UK Pensions Regulator that its regulatory action has ceased in relation to these two schemes under the Warning Notices that it issued to the Company in 2013 and 2014. Following the events noted above, it was determined that the functional currency of Coats Group plc had changed from Great Britain pounds sterling (‘Sterling’) to United States dollars (‘USD’), effective 1 March 2017. In accordance with IAS 21 this change has been accounted for prospectively from this date. To give effect to the change in functional currency, the assets, liabilities and equity of Coats Group plc in Sterling at 1 March 2017 were converted into USD at an exchange rate of US$1:£0.8078. Share capital and other equity amounts of Coats Group plc reported in the Group’s consolidated statement of financial position were previously presented in USD converted from Sterling using historical rates of exchange. Exchange differences have therefore arisen between the historical USD/Sterling exchange rates and the exchange rate used for conversion from Sterling to USD at 1 March 2017. These exchange differences are reported in the consolidated statement of changes in equity. The presentation currency of the Group is USD and remains unchanged.
20
Coats Group plc Notes to the consolidated financial information for the year ended 31 December 2017 (continued) 1. Basis of preparation (continued)
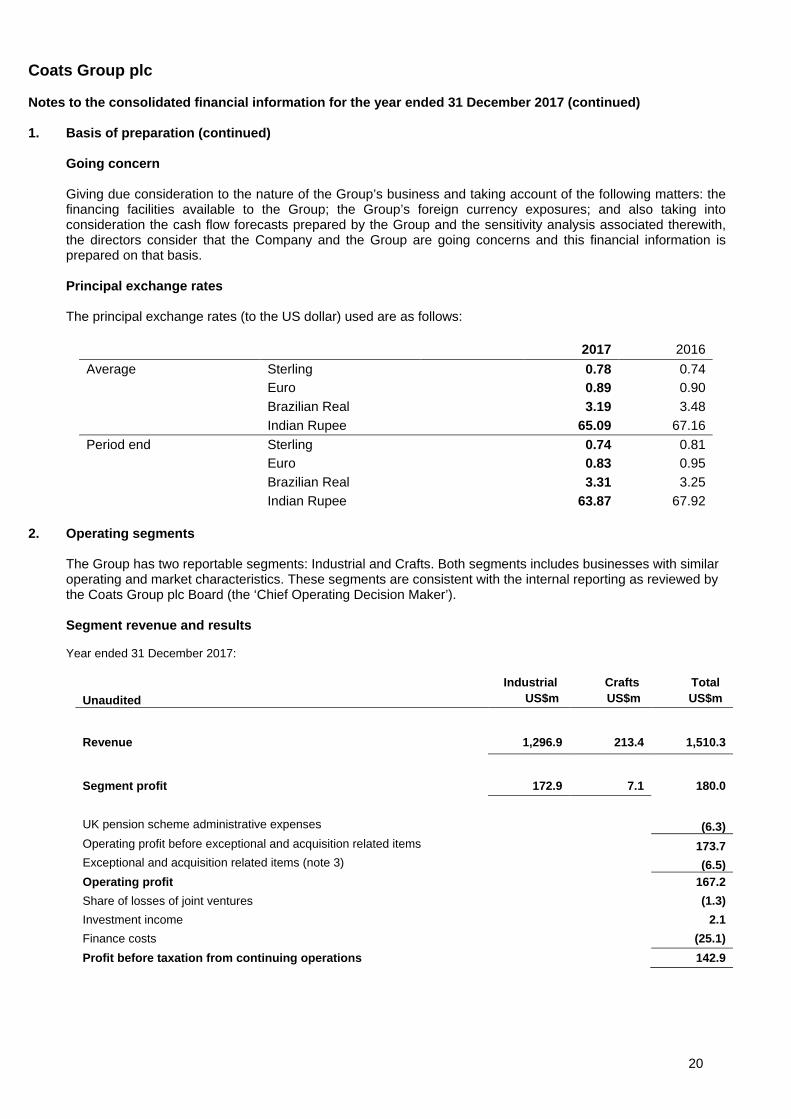
Going concern Giving due consideration to the nature of the Group’s business and taking account of the following matters: the financing facilities available to the Group; the Group’s foreign currency exposures; and also taking into consideration the cash flow forecasts prepared by the Group and the sensitivity analysis associated therewith, the directors consider that the Company and the Group are going concerns and this financial information is prepared on that basis. Principal exchange rates The principal exchange rates (to the US dollar) used are as follows:
2017
2016
Average Sterling 0.78 0.74
Euro 0.89 0.90
Brazilian Real 3.19 3.48
Indian Rupee 65.09 67.16 Period end Sterling 0.74 0.81
Euro 0.83 0.95
Brazilian Real 3.31 3.25
Indian Rupee 63.87 67.92
2. Operating segments The Group has two reportable segments: Industrial and Crafts. Both segments includes businesses with similar operating and market characteristics. These segments are consistent with the internal reporting as reviewed by the Coats Group plc Board (the ‘Chief Operating Decision Maker’). Segment revenue and results Year ended 31 December 2017:
Industrial Crafts Total Unaudited US$m US$m US$m
Revenue 1,296.9 213.4 1,510.3
Segment profit 172.9 7.1 180.0 UK pension scheme administrative expenses (6.3) Operating profit before exceptional and acquisition related items 173.7 Exceptional and acquisition related items (note 3) (6.5) Operating profit 167.2 Share of losses of joint ventures (1.3) Investment income 2.1 Finance costs (25.1) Profit before taxation from continuing operations 142.9
21
Coats Group plc Notes to the consolidated financial information for the year ended 31 December 2017 (continued)
2. Operating segments
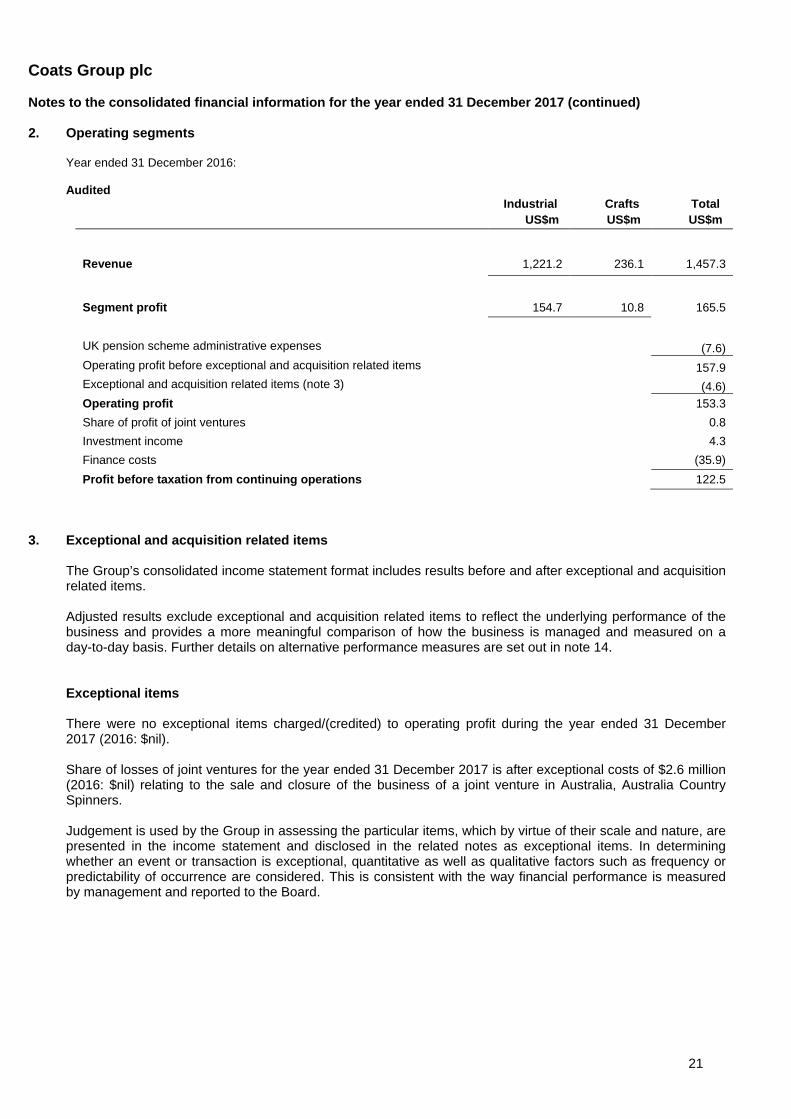
Year ended 31 December 2016: Audited
Industrial Crafts Total US$m US$m US$m
Revenue 1,221.2 236.1 1,457.3
Segment profit 154.7 10.8 165.5 UK pension scheme administrative expenses (7.6) Operating profit before exceptional and acquisition related items 157.9 Exceptional and acquisition related items (note 3) (4.6) Operating profit 153.3 Share of profit of joint ventures 0.8 Investment income 4.3 Finance costs (35.9) Profit before taxation from continuing operations 122.5
3. Exceptional and acquisition related items
The Group’s consolidated income statement format includes results before and after exceptional and acquisition related items. Adjusted results exclude exceptional and acquisition related items to reflect the underlying performance of the business and provides a more meaningful comparison of how the business is managed and measured on a day-to-day basis. Further details on alternative performance measures are set out in note 14. Exceptional items There were no exceptional items charged/(credited) to operating profit during the year ended 31 December 2017 (2016: $nil). Share of losses of joint ventures for the year ended 31 December 2017 is after exceptional costs of $2.6 million (2016: $nil) relating to the sale and closure of the business of a joint venture in Australia, Australia Country Spinners. Judgement is used by the Group in assessing the particular items, which by virtue of their scale and nature, are presented in the income statement and disclosed in the related notes as exceptional items. In determining whether an event or transaction is exceptional, quantitative as well as qualitative factors such as frequency or predictability of occurrence are considered. This is consistent with the way financial performance is measured by management and reported to the Board.
22
Coats Group plc Notes to the consolidated financial information for the year ended 31 December 2017 (continued)
3. Exceptional and acquisition related items (continued)
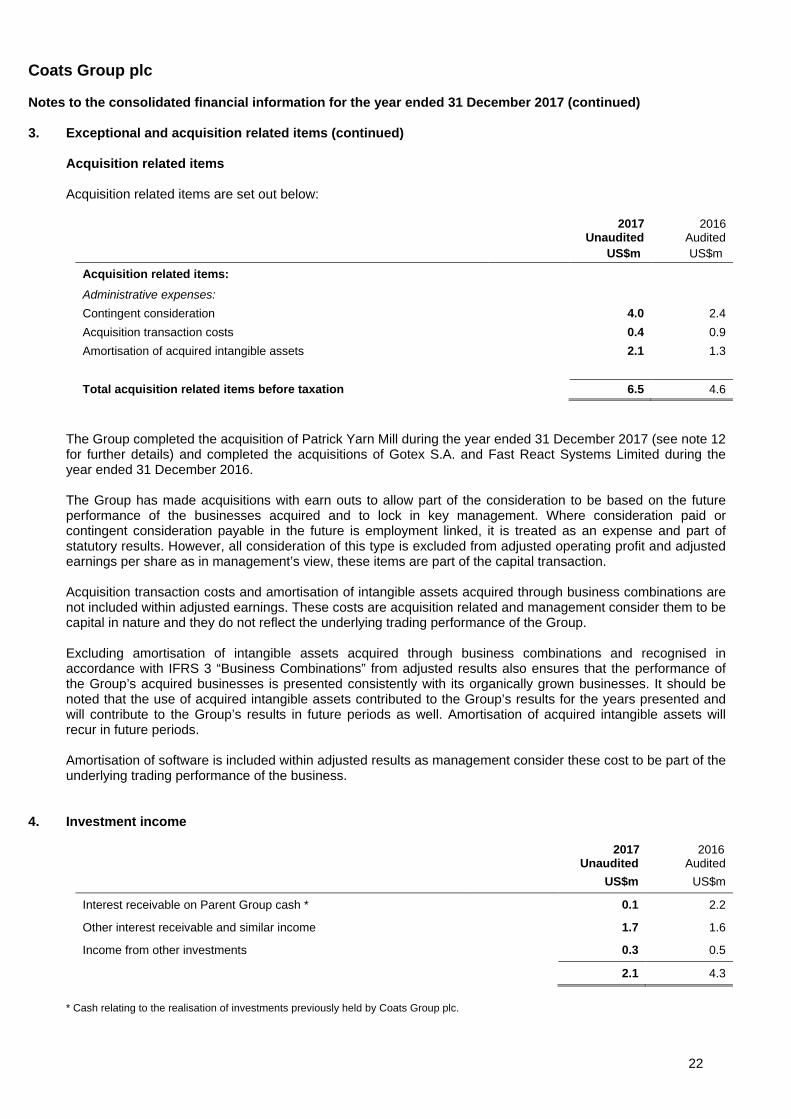
Acquisition related items Acquisition related items are set out below:
2017 2016 Unaudited Audited
US$m US$m
Acquisition related items:
Administrative expenses: Contingent consideration 4.0 2.4 Acquisition transaction costs 0.4 0.9 Amortisation of acquired intangible assets 2.1 1.3 Total acquisition related items before taxation 6.5 4.6
The Group completed the acquisition of Patrick Yarn Mill during the year ended 31 December 2017 (see note 12 for further details) and completed the acquisitions of Gotex S.A. and Fast React Systems Limited during the year ended 31 December 2016. The Group has made acquisitions with earn outs to allow part of the consideration to be based on the future performance of the businesses acquired and to lock in key management. Where consideration paid or contingent consideration payable in the future is employment linked, it is treated as an expense and part of statutory results. However, all consideration of this type is excluded from adjusted operating profit and adjusted earnings per share as in management’s view, these items are part of the capital transaction. Acquisition transaction costs and amortisation of intangible assets acquired through business combinations are not included within adjusted earnings. These costs are acquisition related and management consider them to be capital in nature and they do not reflect the underlying trading performance of the Group. Excluding amortisation of intangible assets acquired through business combinations and recognised in accordance with IFRS 3 “Business Combinations” from adjusted results also ensures that the performance of the Group’s acquired businesses is presented consistently with its organically grown businesses. It should be noted that the use of acquired intangible assets contributed to the Group’s results for the years presented and will contribute to the Group’s results in future periods as well. Amortisation of acquired intangible assets will recur in future periods. Amortisation of software is included within adjusted results as management consider these cost to be part of the underlying trading performance of the business.
4. Investment income
2017 Unaudited
2016
Audited US$m US$m
Interest receivable on Parent Group cash * 0.1 2.2
Other interest receivable and similar income 1.7 1.6
Income from other investments 0.3 0.5
2.1 4.3
* Cash relating to the realisation of investments previously held by Coats Group plc.
23
Coats Group plc Notes to the consolidated financial information for the year ended 31 December 2017 (continued)
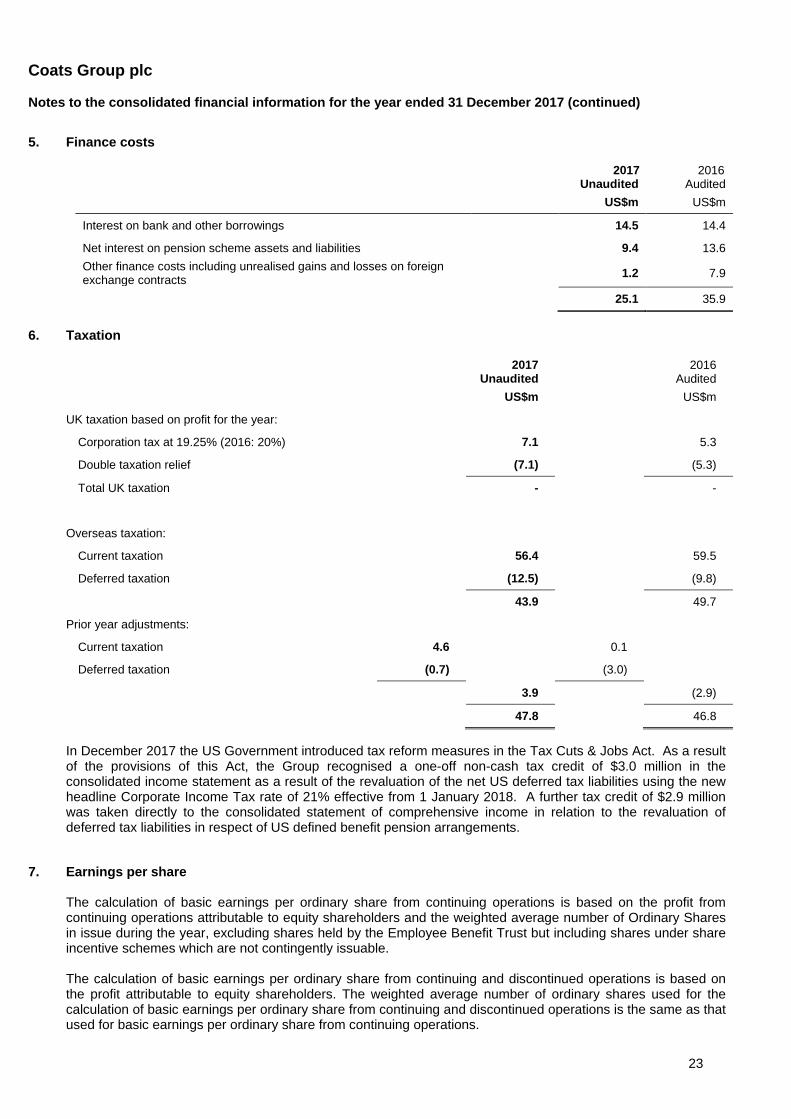
5. Finance costs
2017 Unaudited
2016 Audited
US$m US$m
Interest on bank and other borrowings 14.5 14.4
Net interest on pension scheme assets and liabilities 9.4 13.6 Other finance costs including unrealised gains and losses on foreign exchange contracts 1.2 7.9
25.1 35.9
6. Taxation
2017
Unaudited 2016
Audited US$m US$m
UK taxation based on profit for the year:
Corporation tax at 19.25% (2016: 20%) 7.1 5.3
Double taxation relief (7.1) (5.3)
Total UK taxation - -
Overseas taxation:
Current taxation 56.4 59.5
Deferred taxation (12.5) (9.8)
43.9 49.7
Prior year adjustments:
Current taxation 4.6 0.1
Deferred taxation (0.7) (3.0)
3.9 (2.9)
47.8 46.8 In December 2017 the US Government introduced tax reform measures in the Tax Cuts & Jobs Act. As a result of the provisions of this Act, the Group recognised a one-off non-cash tax credit of $3.0 million in the consolidated income statement as a result of the revaluation of the net US deferred tax liabilities using the new headline Corporate Income Tax rate of 21% effective from 1 January 2018. A further tax credit of $2.9 million was taken directly to the consolidated statement of comprehensive income in relation to the revaluation of deferred tax liabilities in respect of US defined benefit pension arrangements.
7. Earnings per share The calculation of basic earnings per ordinary share from continuing operations is based on the profit from continuing operations attributable to equity shareholders and the weighted average number of Ordinary Shares in issue during the year, excluding shares held by the Employee Benefit Trust but including shares under share incentive schemes which are not contingently issuable. The calculation of basic earnings per ordinary share from continuing and discontinued operations is based on the profit attributable to equity shareholders. The weighted average number of ordinary shares used for the calculation of basic earnings per ordinary share from continuing and discontinued operations is the same as that used for basic earnings per ordinary share from continuing operations.
24
Coats Group plc Notes to the consolidated financial information for the year ended 31 December 2017 (continued)
7. Earnings per share (continued)
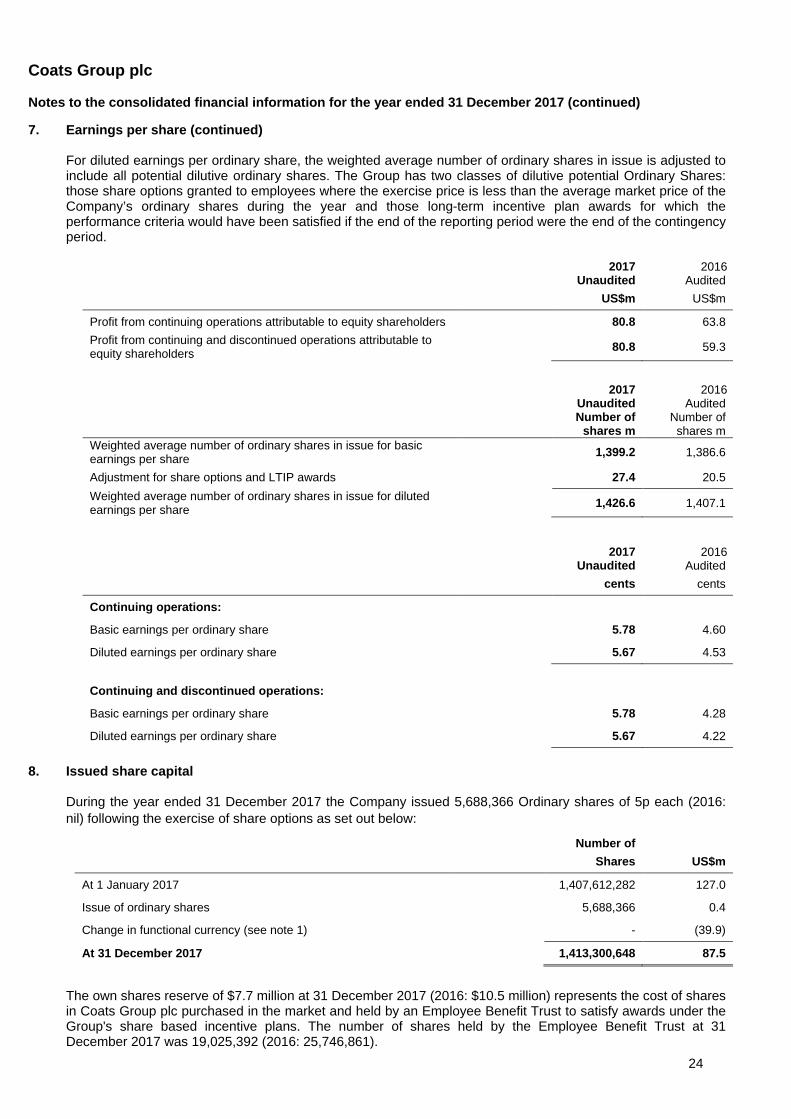
For diluted earnings per ordinary share, the weighted average number of ordinary shares in issue is adjusted to include all potential dilutive ordinary shares. The Group has two classes of dilutive potential Ordinary Shares: those share options granted to employees where the exercise price is less than the average market price of the Company’s ordinary shares during the year and those long-term incentive plan awards for which the performance criteria would have been satisfied if the end of the reporting period were the end of the contingency period.
2017
Unaudited 2016
Audited US$m US$m
Profit from continuing operations attributable to equity shareholders 80.8 63.8 Profit from continuing and discontinued operations attributable to equity shareholders 80.8 59.3
2017 Unaudited
2016 Audited
Number of shares m
Number of shares m
Weighted average number of ordinary shares in issue for basic earnings per share 1,399.2 1,386.6
Adjustment for share options and LTIP awards 27.4 20.5 Weighted average number of ordinary shares in issue for diluted earnings per share 1,426.6 1,407.1
2017
Unaudited 2016
Audited cents cents
Continuing operations:
Basic earnings per ordinary share 5.78 4.60
Diluted earnings per ordinary share 5.67 4.53
Continuing and discontinued operations:
Basic earnings per ordinary share 5.78 4.28
Diluted earnings per ordinary share 5.67 4.22
8. Issued share capital During the year ended 31 December 2017 the Company issued 5,688,366 Ordinary shares of 5p each (2016: nil) following the exercise of share options as set out below:
Number of Shares US$m
At 1 January 2017 1,407,612,282 127.0
Issue of ordinary shares 5,688,366 0.4
Change in functional currency (see note 1) - (39.9)
At 31 December 2017 1,413,300,648 87.5
The own shares reserve of $7.7 million at 31 December 2017 (2016: $10.5 million) represents the cost of shares in Coats Group plc purchased in the market and held by an Employee Benefit Trust to satisfy awards under the Group's share based incentive plans. The number of shares held by the Employee Benefit Trust at 31 December 2017 was 19,025,392 (2016: 25,746,861).
25
Coats Group plc Notes to the consolidated financial information for the year ended 31 December 2017 (continued)
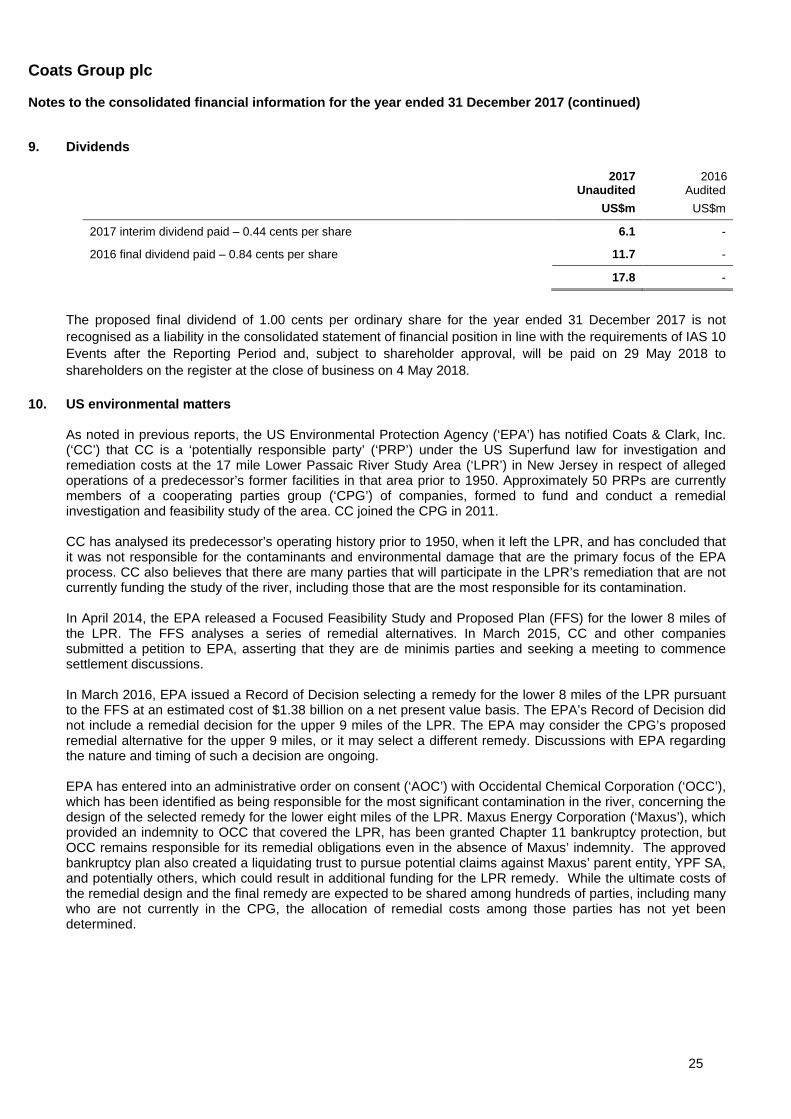
9. Dividends
2017
Unaudited 2016
Audited US$m US$m
2017 interim dividend paid – 0.44 cents per share 6.1 -
2016 final dividend paid – 0.84 cents per share 11.7 -
17.8 -
The proposed final dividend of 1.00 cents per ordinary share for the year ended 31 December 2017 is not recognised as a liability in the consolidated statement of financial position in line with the requirements of IAS 10 Events after the Reporting Period and, subject to shareholder approval, will be paid on 29 May 2018 to shareholders on the register at the close of business on 4 May 2018.
10. US environmental matters As noted in previous reports, the US Environmental Protection Agency (‘EPA’) has notified Coats & Clark, Inc. (‘CC’) that CC is a ‘potentially responsible party’ (‘PRP’) under the US Superfund law for investigation and remediation costs at the 17 mile Lower Passaic River Study Area (‘LPR’) in New Jersey in respect of alleged operations of a predecessor’s former facilities in that area prior to 1950. Approximately 50 PRPs are currently members of a cooperating parties group (‘CPG’) of companies, formed to fund and conduct a remedial investigation and feasibility study of the area. CC joined the CPG in 2011. CC has analysed its predecessor’s operating history prior to 1950, when it left the LPR, and has concluded that it was not responsible for the contaminants and environmental damage that are the primary focus of the EPA process. CC also believes that there are many parties that will participate in the LPR’s remediation that are not currently funding the study of the river, including those that are the most responsible for its contamination. In April 2014, the EPA released a Focused Feasibility Study and Proposed Plan (FFS) for the lower 8 miles of the LPR. The FFS analyses a series of remedial alternatives. In March 2015, CC and other companies submitted a petition to EPA, asserting that they are de minimis parties and seeking a meeting to commence settlement discussions. In March 2016, EPA issued a Record of Decision selecting a remedy for the lower 8 miles of the LPR pursuant to the FFS at an estimated cost of $1.38 billion on a net present value basis. The EPA’s Record of Decision did not include a remedial decision for the upper 9 miles of the LPR. The EPA may consider the CPG’s proposed remedial alternative for the upper 9 miles, or it may select a different remedy. Discussions with EPA regarding the nature and timing of such a decision are ongoing. EPA has entered into an administrative order on consent (‘AOC’) with Occidental Chemical Corporation (‘OCC’), which has been identified as being responsible for the most significant contamination in the river, concerning the design of the selected remedy for the lower eight miles of the LPR. Maxus Energy Corporation (‘Maxus’), which provided an indemnity to OCC that covered the LPR, has been granted Chapter 11 bankruptcy protection, but OCC remains responsible for its remedial obligations even in the absence of Maxus’ indemnity. The approved bankruptcy plan also created a liquidating trust to pursue potential claims against Maxus’ parent entity, YPF SA, and potentially others, which could result in additional funding for the LPR remedy. While the ultimate costs of the remedial design and the final remedy are expected to be shared among hundreds of parties, including many who are not currently in the CPG, the allocation of remedial costs among those parties has not yet been determined.
26
Coats Group plc Notes to the consolidated financial information for the year ended 31 December 2017 (continued) 10. US environmental matters (continued)
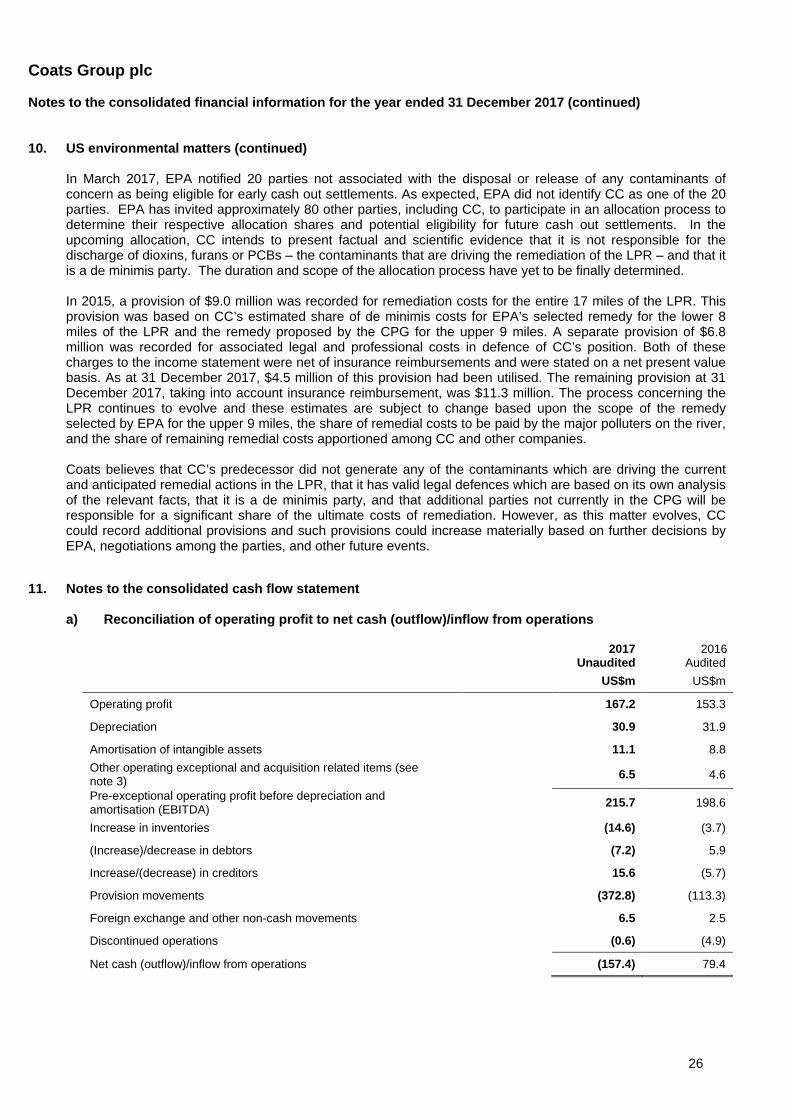
In March 2017, EPA notified 20 parties not associated with the disposal or release of any contaminants of concern as being eligible for early cash out settlements. As expected, EPA did not identify CC as one of the 20 parties. EPA has invited approximately 80 other parties, including CC, to participate in an allocation process to determine their respective allocation shares and potential eligibility for future cash out settlements. In the upcoming allocation, CC intends to present factual and scientific evidence that it is not responsible for the discharge of dioxins, furans or PCBs – the contaminants that are driving the remediation of the LPR – and that it is a de minimis party. The duration and scope of the allocation process have yet to be finally determined. In 2015, a provision of $9.0 million was recorded for remediation costs for the entire 17 miles of the LPR. This provision was based on CC’s estimated share of de minimis costs for EPA’s selected remedy for the lower 8 miles of the LPR and the remedy proposed by the CPG for the upper 9 miles. A separate provision of $6.8 million was recorded for associated legal and professional costs in defence of CC’s position. Both of these charges to the income statement were net of insurance reimbursements and were stated on a net present value basis. As at 31 December 2017, $4.5 million of this provision had been utilised. The remaining provision at 31 December 2017, taking into account insurance reimbursement, was $11.3 million. The process concerning the LPR continues to evolve and these estimates are subject to change based upon the scope of the remedy selected by EPA for the upper 9 miles, the share of remedial costs to be paid by the major polluters on the river, and the share of remaining remedial costs apportioned among CC and other companies. Coats believes that CC’s predecessor did not generate any of the contaminants which are driving the current and anticipated remedial actions in the LPR, that it has valid legal defences which are based on its own analysis of the relevant facts, that it is a de minimis party, and that additional parties not currently in the CPG will be responsible for a significant share of the ultimate costs of remediation. However, as this matter evolves, CC could record additional provisions and such provisions could increase materially based on further decisions by EPA, negotiations among the parties, and other future events.
11. Notes to the consolidated cash flow statement a) Reconciliation of operating profit to net cash (outflow)/inflow from operations
2017
Unaudited 2016
Audited US$m US$m
Operating profit 167.2 153.3
Depreciation 30.9 31.9
Amortisation of intangible assets 11.1 8.8 Other operating exceptional and acquisition related items (see note 3) 6.5 4.6
Pre-exceptional operating profit before depreciation and amortisation (EBITDA) 215.7 198.6
Increase in inventories (14.6) (3.7)
(Increase)/decrease in debtors (7.2) 5.9
Increase/(decrease) in creditors 15.6 (5.7)
Provision movements (372.8) (113.3)
Foreign exchange and other non-cash movements 6.5 2.5
Discontinued operations (0.6) (4.9)
Net cash (outflow)/inflow from operations (157.4) 79.4
27
Coats Group plc Notes to the consolidated financial information for the year ended 31 December 2017 (continued) 11. Notes to the consolidated cash flow statement (continued)
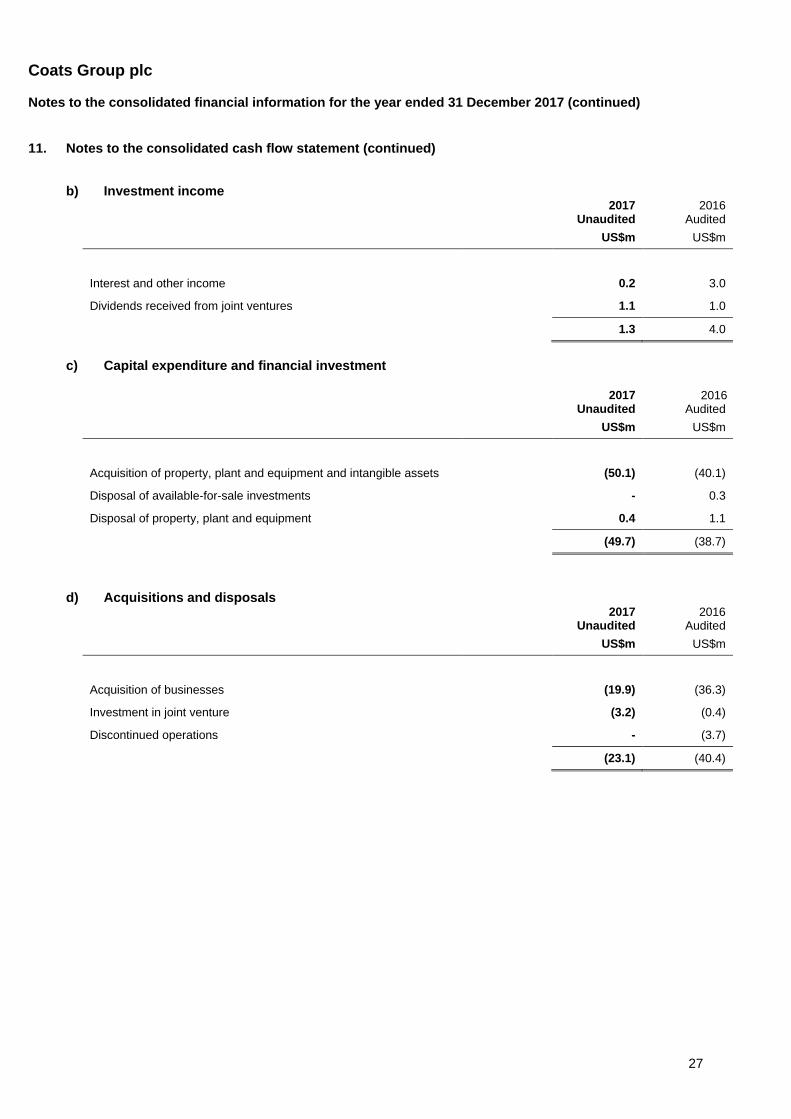
b) Investment income
2017
Unaudited 2016
Audited US$m US$m
Interest and other income 0.2 3.0
Dividends received from joint ventures 1.1 1.0
1.3 4.0
c) Capital expenditure and financial investment
2017
Unaudited 2016
Audited US$m US$m
Acquisition of property, plant and equipment and intangible assets (50.1) (40.1)
Disposal of available-for-sale investments - 0.3
Disposal of property, plant and equipment 0.4 1.1
(49.7) (38.7)
d) Acquisitions and disposals
2017
Unaudited 2016
Audited US$m US$m
Acquisition of businesses (19.9) (36.3)
Investment in joint venture (3.2) (0.4)
Discontinued operations - (3.7)
(23.1) (40.4)
28
Coats Group plc Notes to the financial information for the year ended 31 December 2017 (continued)
11. Notes to the consolidated cash flow statement (continued)
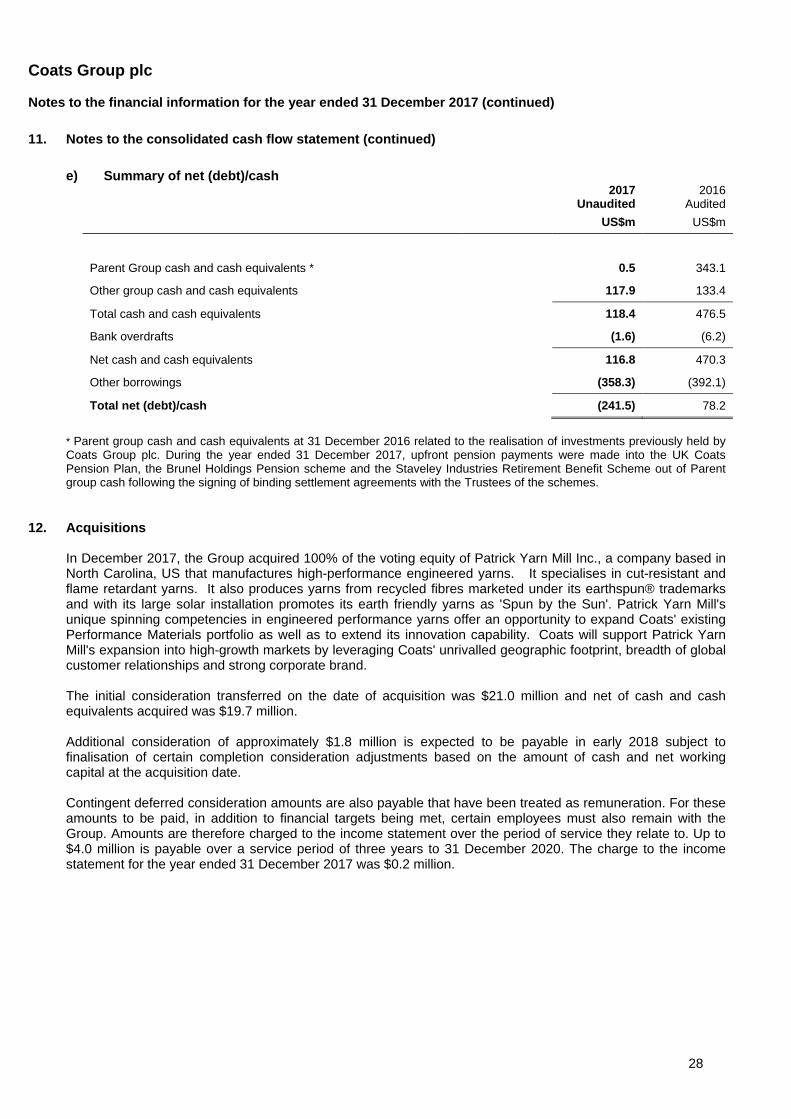
e) Summary of net (debt)/cash
2017
Unaudited 2016
Audited US$m US$m
Parent Group cash and cash equivalents * 0.5 343.1
Other group cash and cash equivalents 117.9 133.4
Total cash and cash equivalents 118.4 476.5
Bank overdrafts (1.6) (6.2)
Net cash and cash equivalents 116.8 470.3
Other borrowings (358.3) (392.1)
Total net (debt)/cash (241.5) 78.2
* Parent group cash and cash equivalents at 31 December 2016 related to the realisation of investments previously held by Coats Group plc. During the year ended 31 December 2017, upfront pension payments were made into the UK Coats Pension Plan, the Brunel Holdings Pension scheme and the Staveley Industries Retirement Benefit Scheme out of Parent group cash following the signing of binding settlement agreements with the Trustees of the schemes.
12. Acquisitions In December 2017, the Group acquired 100% of the voting equity of Patrick Yarn Mill Inc., a company based in North Carolina, US that manufactures high-performance engineered yarns. It specialises in cut-resistant and flame retardant yarns. It also produces yarns from recycled fibres marketed under its earthspun® trademarks and with its large solar installation promotes its earth friendly yarns as 'Spun by the Sun'. Patrick Yarn Mill's unique spinning competencies in engineered performance yarns offer an opportunity to expand Coats' existing Performance Materials portfolio as well as to extend its innovation capability. Coats will support Patrick Yarn Mill's expansion into high-growth markets by leveraging Coats' unrivalled geographic footprint, breadth of global customer relationships and strong corporate brand. The initial consideration transferred on the date of acquisition was $21.0 million and net of cash and cash equivalents acquired was $19.7 million. Additional consideration of approximately $1.8 million is expected to be payable in early 2018 subject to finalisation of certain completion consideration adjustments based on the amount of cash and net working capital at the acquisition date. Contingent deferred consideration amounts are also payable that have been treated as remuneration. For these amounts to be paid, in addition to financial targets being met, certain employees must also remain with the Group. Amounts are therefore charged to the income statement over the period of service they relate to. Up to $4.0 million is payable over a service period of three years to 31 December 2020. The charge to the income statement for the year ended 31 December 2017 was $0.2 million.
29
Coats Group plc Notes to the financial information for the year ended 31 December 2017 (continued)
12. Acquisitions (continued)
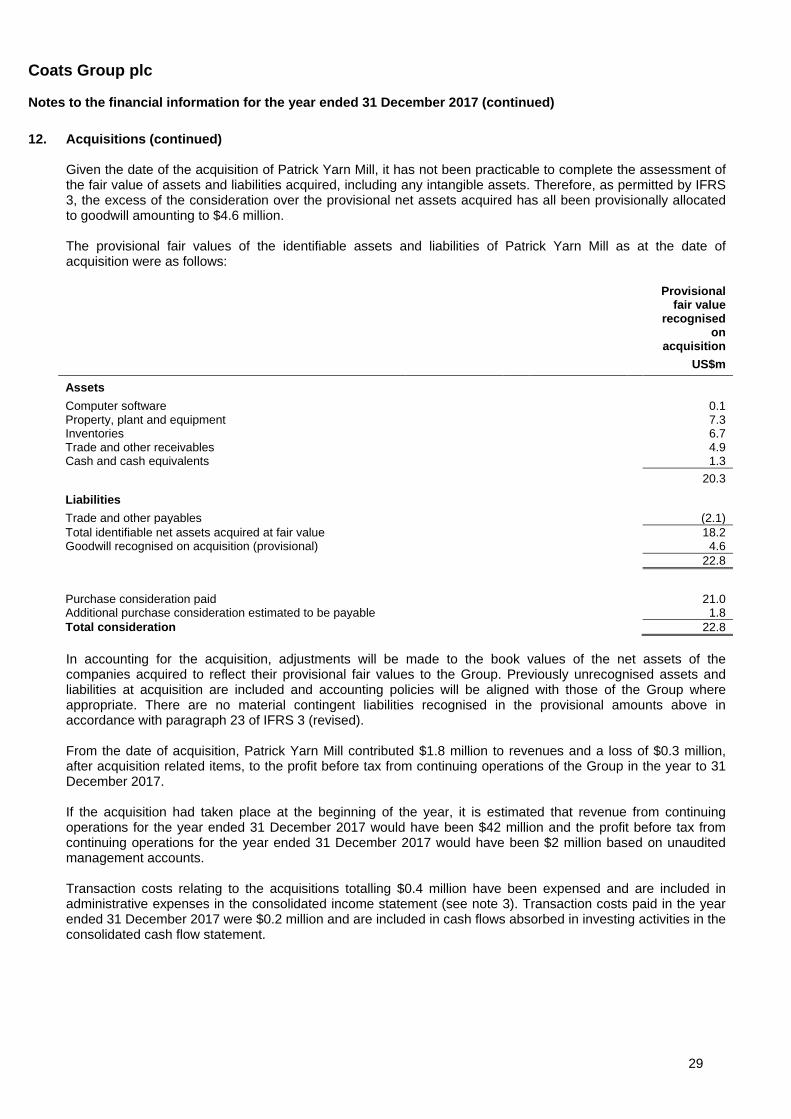
Given the date of the acquisition of Patrick Yarn Mill, it has not been practicable to complete the assessment of the fair value of assets and liabilities acquired, including any intangible assets. Therefore, as permitted by IFRS 3, the excess of the consideration over the provisional net assets acquired has all been provisionally allocated to goodwill amounting to $4.6 million. The provisional fair values of the identifiable assets and liabilities of Patrick Yarn Mill as at the date of acquisition were as follows:
Provisional fair value
recognised on
acquisition US$m
Assets Computer software 0.1 Property, plant and equipment 7.3 Inventories 6.7 Trade and other receivables 4.9 Cash and cash equivalents 1.3 20.3
Liabilities Trade and other payables (2.1) Total identifiable net assets acquired at fair value 18.2 Goodwill recognised on acquisition (provisional) 4.6 22.8 Purchase consideration paid 21.0 Additional purchase consideration estimated to be payable 1.8 Total consideration 22.8 In accounting for the acquisition, adjustments will be made to the book values of the net assets of the companies acquired to reflect their provisional fair values to the Group. Previously unrecognised assets and liabilities at acquisition are included and accounting policies will be aligned with those of the Group where appropriate. There are no material contingent liabilities recognised in the provisional amounts above in accordance with paragraph 23 of IFRS 3 (revised). From the date of acquisition, Patrick Yarn Mill contributed $1.8 million to revenues and a loss of $0.3 million, after acquisition related items, to the profit before tax from continuing operations of the Group in the year to 31 December 2017. If the acquisition had taken place at the beginning of the year, it is estimated that revenue from continuing operations for the year ended 31 December 2017 would have been $42 million and the profit before tax from continuing operations for the year ended 31 December 2017 would have been $2 million based on unaudited management accounts. Transaction costs relating to the acquisitions totalling $0.4 million have been expensed and are included in administrative expenses in the consolidated income statement (see note 3). Transaction costs paid in the year ended 31 December 2017 were $0.2 million and are included in cash flows absorbed in investing activities in the consolidated cash flow statement.
30
Coats Group plc Notes to the financial information for the year ended 31 December 2017 (continued)
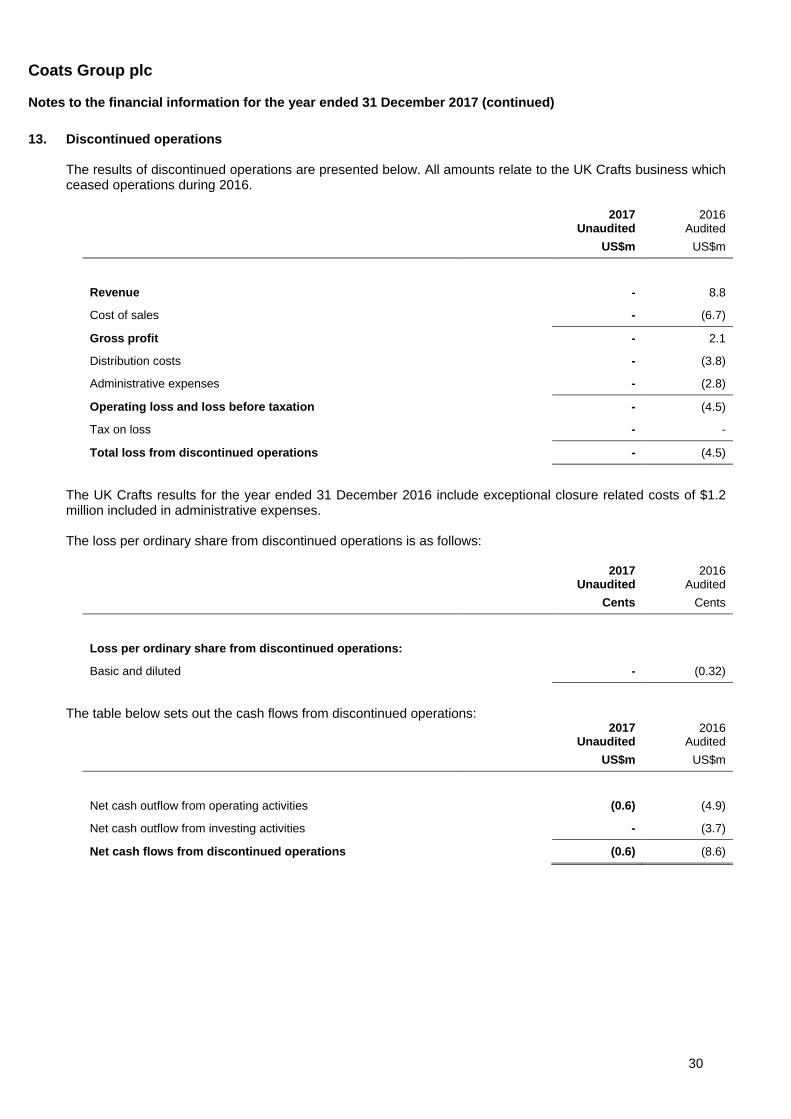
13. Discontinued operations
The results of discontinued operations are presented below. All amounts relate to the UK Crafts business which ceased operations during 2016.
2017
Unaudited 2016
Audited US$m US$m
Revenue - 8.8
Cost of sales - (6.7)
Gross profit - 2.1
Distribution costs - (3.8)
Administrative expenses - (2.8)
Operating loss and loss before taxation - (4.5)
Tax on loss - -
Total loss from discontinued operations - (4.5)
The UK Crafts results for the year ended 31 December 2016 include exceptional closure related costs of $1.2 million included in administrative expenses. The loss per ordinary share from discontinued operations is as follows:
2017
Unaudited 2016
Audited Cents Cents
Loss per ordinary share from discontinued operations:
Basic and diluted - (0.32)
The table below sets out the cash flows from discontinued operations:
2017
Unaudited 2016
Audited US$m US$m
Net cash outflow from operating activities (0.6) (4.9)
Net cash outflow from investing activities - (3.7)
Net cash flows from discontinued operations (0.6) (8.6)
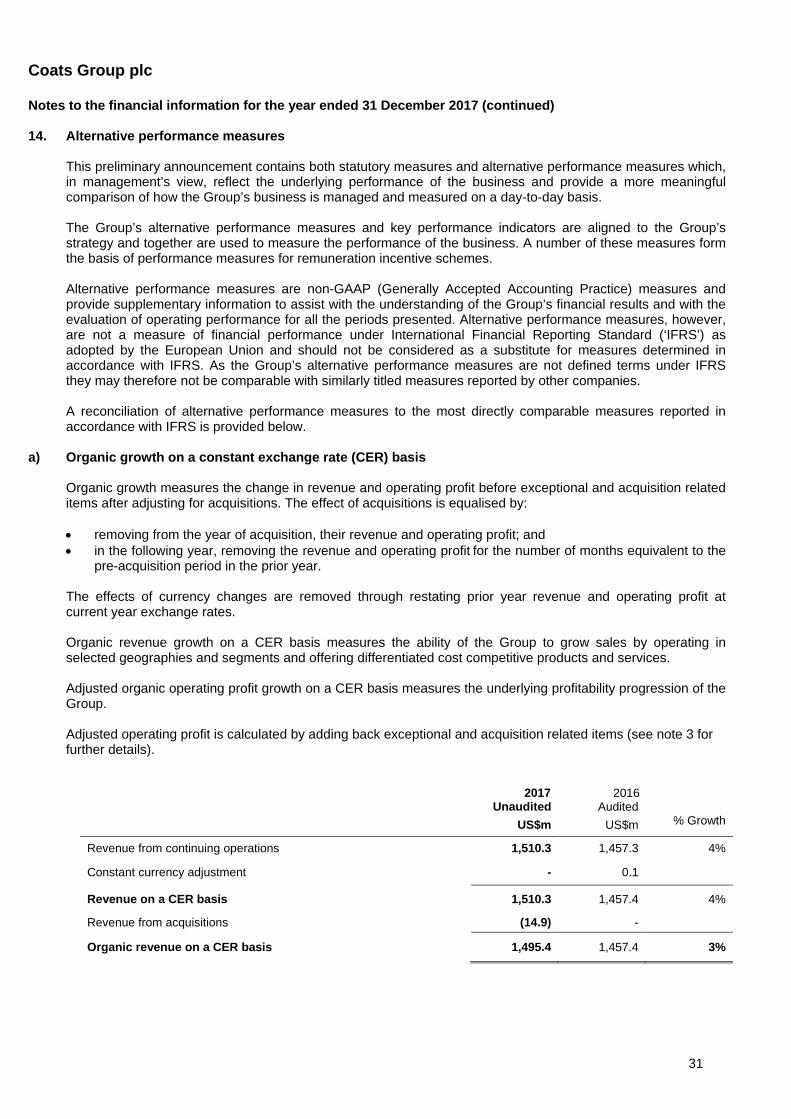
31
Coats Group plc Notes to the financial information for the year ended 31 December 2017 (continued)
14. Alternative performance measures
This preliminary announcement contains both statutory measures and alternative performance measures which, in management’s view, reflect the underlying performance of the business and provide a more meaningful comparison of how the Group’s business is managed and measured on a day-to-day basis. The Group’s alternative performance measures and key performance indicators are aligned to the Group’s strategy and together are used to measure the performance of the business. A number of these measures form the basis of performance measures for remuneration incentive schemes. Alternative performance measures are non-GAAP (Generally Accepted Accounting Practice) measures and provide supplementary information to assist with the understanding of the Group’s financial results and with the evaluation of operating performance for all the periods presented. Alternative performance measures, however, are not a measure of financial performance under International Financial Reporting Standard (‘IFRS’) as adopted by the European Union and should not be considered as a substitute for measures determined in accordance with IFRS. As the Group’s alternative performance measures are not defined terms under IFRS they may therefore not be comparable with similarly titled measures reported by other companies. A reconciliation of alternative performance measures to the most directly comparable measures reported in accordance with IFRS is provided below.
a) Organic growth on a constant exchange rate (CER) basis Organic growth measures the change in revenue and operating profit before exceptional and acquisition related items after adjusting for acquisitions. The effect of acquisitions is equalised by: • removing from the year of acquisition, their revenue and operating profit; and • in the following year, removing the revenue and operating profit for the number of months equivalent to the
pre-acquisition period in the prior year. The effects of currency changes are removed through restating prior year revenue and operating profit at current year exchange rates. Organic revenue growth on a CER basis measures the ability of the Group to grow sales by operating in selected geographies and segments and offering differentiated cost competitive products and services. Adjusted organic operating profit growth on a CER basis measures the underlying profitability progression of the Group. Adjusted operating profit is calculated by adding back exceptional and acquisition related items (see note 3 for further details).
2017 Unaudited
2016 Audited
US$m US$m % Growth
Revenue from continuing operations 1,510.3 1,457.3 4%
Constant currency adjustment - 0.1
Revenue on a CER basis 1,510.3 1,457.4 4%
Revenue from acquisitions (14.9) -
Organic revenue on a CER basis 1,495.4 1,457.4 3%
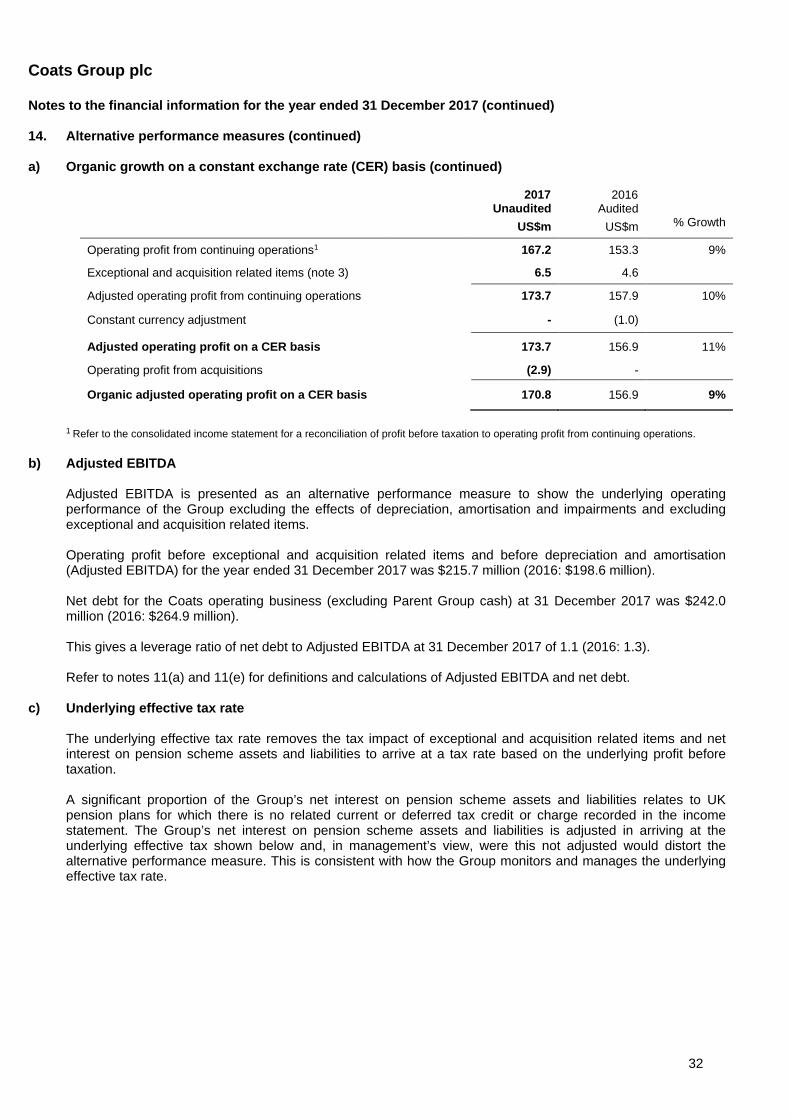
32
Coats Group plc Notes to the financial information for the year ended 31 December 2017 (continued)
14. Alternative performance measures (continued)
a) Organic growth on a constant exchange rate (CER) basis (continued)
2017 Unaudited
2016 Audited
US$m US$m % Growth
Operating profit from continuing operations1 167.2 153.3 9%
Exceptional and acquisition related items (note 3) 6.5 4.6
Adjusted operating profit from continuing operations 173.7 157.9 10%
Constant currency adjustment - (1.0)
Adjusted operating profit on a CER basis 173.7 156.9 11%
Operating profit from acquisitions (2.9) -
Organic adjusted operating profit on a CER basis 170.8 156.9 9%
1 Refer to the consolidated income statement for a reconciliation of profit before taxation to operating profit from continuing operations.
b) Adjusted EBITDA
Adjusted EBITDA is presented as an alternative performance measure to show the underlying operating performance of the Group excluding the effects of depreciation, amortisation and impairments and excluding exceptional and acquisition related items. Operating profit before exceptional and acquisition related items and before depreciation and amortisation (Adjusted EBITDA) for the year ended 31 December 2017 was $215.7 million (2016: $198.6 million). Net debt for the Coats operating business (excluding Parent Group cash) at 31 December 2017 was $242.0 million (2016: $264.9 million). This gives a leverage ratio of net debt to Adjusted EBITDA at 31 December 2017 of 1.1 (2016: 1.3). Refer to notes 11(a) and 11(e) for definitions and calculations of Adjusted EBITDA and net debt.
c) Underlying effective tax rate The underlying effective tax rate removes the tax impact of exceptional and acquisition related items and net interest on pension scheme assets and liabilities to arrive at a tax rate based on the underlying profit before taxation. A significant proportion of the Group’s net interest on pension scheme assets and liabilities relates to UK pension plans for which there is no related current or deferred tax credit or charge recorded in the income statement. The Group’s net interest on pension scheme assets and liabilities is adjusted in arriving at the underlying effective tax shown below and, in management’s view, were this not adjusted would distort the alternative performance measure. This is consistent with how the Group monitors and manages the underlying effective tax rate.
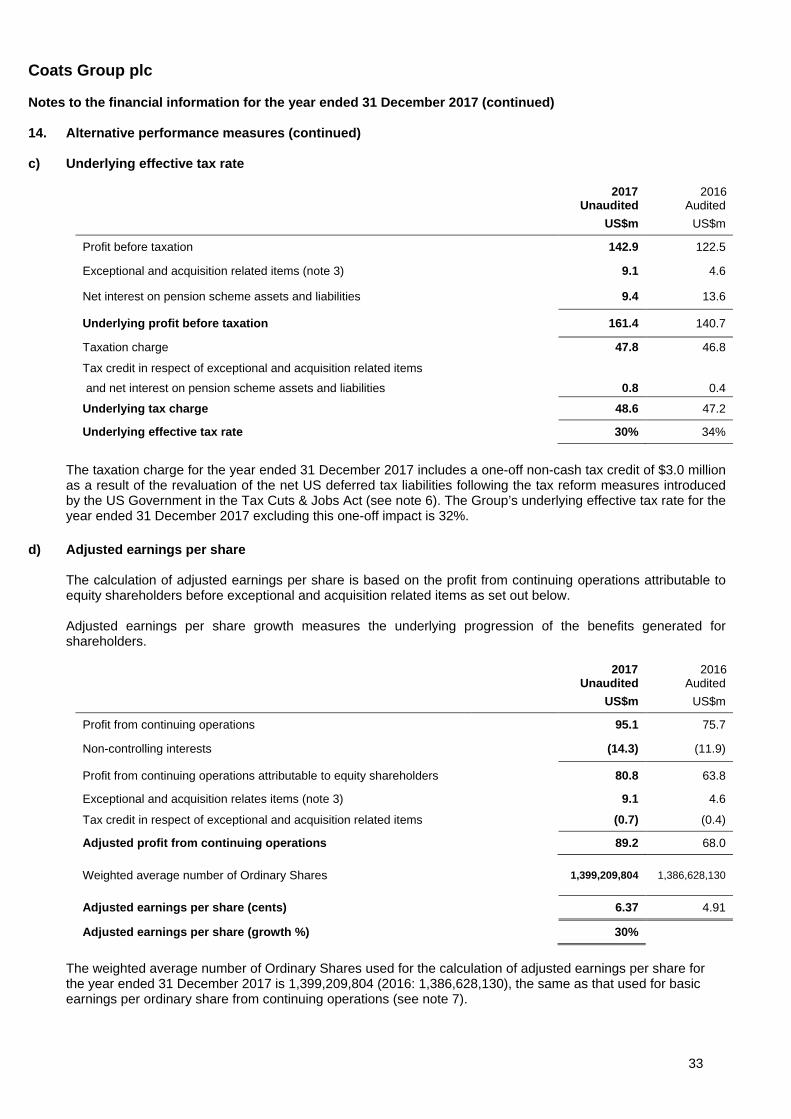
33
Coats Group plc Notes to the financial information for the year ended 31 December 2017 (continued) 14. Alternative performance measures (continued) c) Underlying effective tax rate
2017 Unaudited
2016 Audited
US$m US$m
Profit before taxation 142.9 122.5
Exceptional and acquisition related items (note 3) 9.1 4.6
Net interest on pension scheme assets and liabilities 9.4 13.6
Underlying profit before taxation 161.4 140.7
Taxation charge 47.8 46.8
Tax credit in respect of exceptional and acquisition related items and net interest on pension scheme assets and liabilities 0.8 0.4
Underlying tax charge 48.6 47.2
Underlying effective tax rate 30% 34%
The taxation charge for the year ended 31 December 2017 includes a one-off non-cash tax credit of $3.0 million
as a result of the revaluation of the net US deferred tax liabilities following the tax reform measures introduced by the US Government in the Tax Cuts & Jobs Act (see note 6). The Group’s underlying effective tax rate for the year ended 31 December 2017 excluding this one-off impact is 32%.
d) Adjusted earnings per share
The calculation of adjusted earnings per share is based on the profit from continuing operations attributable to equity shareholders before exceptional and acquisition related items as set out below. Adjusted earnings per share growth measures the underlying progression of the benefits generated for shareholders.
2017 Unaudited
2016 Audited
US$m US$m
Profit from continuing operations 95.1 75.7
Non-controlling interests (14.3) (11.9)
Profit from continuing operations attributable to equity shareholders 80.8 63.8
Exceptional and acquisition relates items (note 3) 9.1 4.6
Tax credit in respect of exceptional and acquisition related items (0.7) (0.4)
Adjusted profit from continuing operations 89.2 68.0
Weighted average number of Ordinary Shares 1,399,209,804 1,386,628,130
Adjusted earnings per share (cents) 6.37 4.91
Adjusted earnings per share (growth %) 30%
The weighted average number of Ordinary Shares used for the calculation of adjusted earnings per share for the year ended 31 December 2017 is 1,399,209,804 (2016: 1,386,628,130), the same as that used for basic earnings per ordinary share from continuing operations (see note 7).
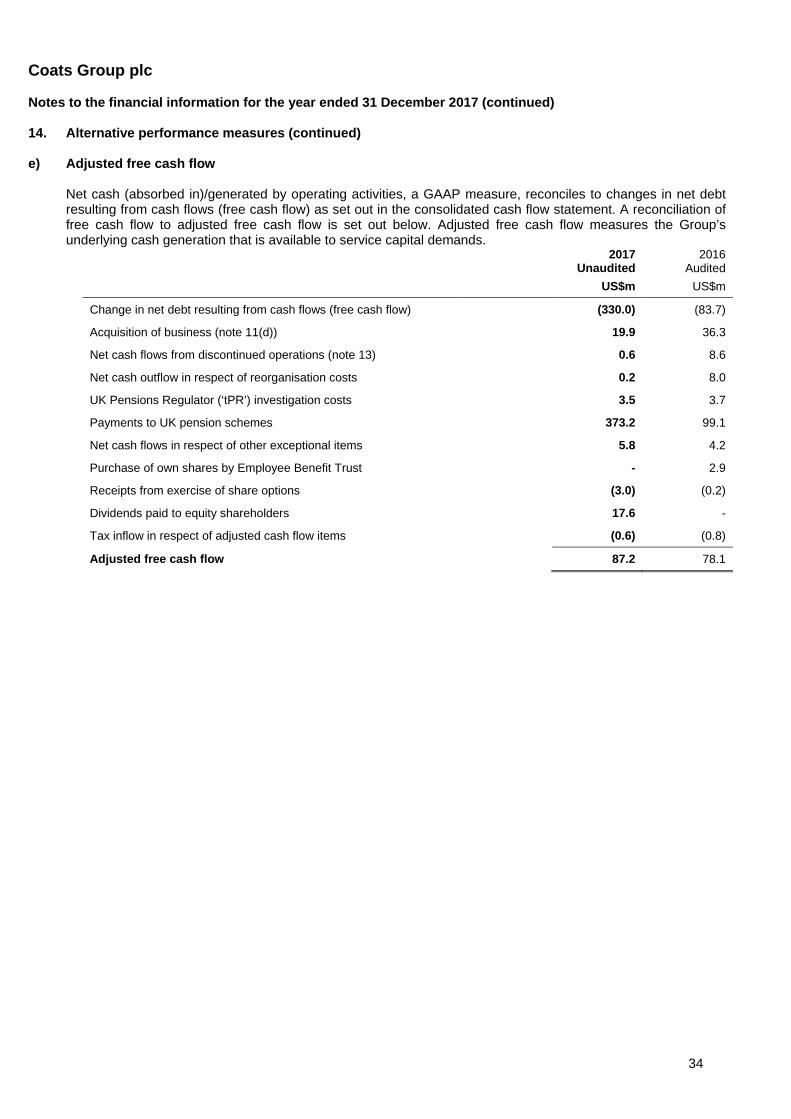
34
Coats Group plc Notes to the financial information for the year ended 31 December 2017 (continued) 14. Alternative performance measures (continued)
e) Adjusted free cash flow
Net cash (absorbed in)/generated by operating activities, a GAAP measure, reconciles to changes in net debt resulting from cash flows (free cash flow) as set out in the consolidated cash flow statement. A reconciliation of free cash flow to adjusted free cash flow is set out below. Adjusted free cash flow measures the Group’s underlying cash generation that is available to service capital demands.
2017
Unaudited 2016
Audited US$m US$m
Change in net debt resulting from cash flows (free cash flow) (330.0) (83.7)
Acquisition of business (note 11(d)) 19.9 36.3
Net cash flows from discontinued operations (note 13) 0.6 8.6
Net cash outflow in respect of reorganisation costs 0.2 8.0
UK Pensions Regulator (‘tPR’) investigation costs 3.5 3.7
Payments to UK pension schemes 373.2 99.1
Net cash flows in respect of other exceptional items 5.8 4.2
Purchase of own shares by Employee Benefit Trust - 2.9
Receipts from exercise of share options (3.0) (0.2)
Dividends paid to equity shareholders 17.6 -
Tax inflow in respect of adjusted cash flow items (0.6) (0.8)
Adjusted free cash flow 87.2 78.1
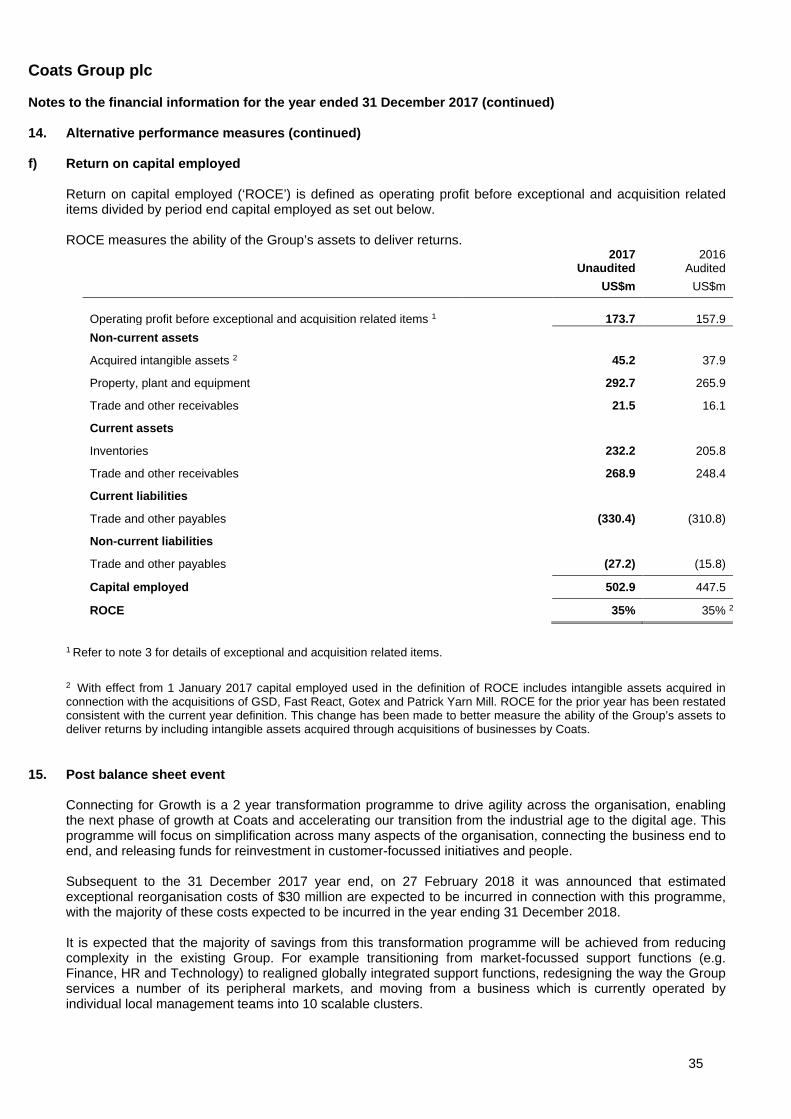
35
Coats Group plc Notes to the financial information for the year ended 31 December 2017 (continued) 14. Alternative performance measures (continued)
f) Return on capital employed
Return on capital employed (‘ROCE’) is defined as operating profit before exceptional and acquisition related items divided by period end capital employed as set out below. ROCE measures the ability of the Group’s assets to deliver returns.
2017
Unaudited 2016
Audited US$m US$m Operating profit before exceptional and acquisition related items 1 173.7 157.9 Non-current assets
Acquired intangible assets 2 45.2 37.9
Property, plant and equipment 292.7 265.9
Trade and other receivables 21.5 16.1
Current assets
Inventories 232.2 205.8
Trade and other receivables 268.9 248.4
Current liabilities
Trade and other payables (330.4) (310.8)
Non-current liabilities
Trade and other payables (27.2) (15.8)
Capital employed 502.9 447.5
ROCE 35% 35% 2
1 Refer to note 3 for details of exceptional and acquisition related items.
2 With effect from 1 January 2017 capital employed used in the definition of ROCE includes intangible assets acquired in connection with the acquisitions of GSD, Fast React, Gotex and Patrick Yarn Mill. ROCE for the prior year has been restated consistent with the current year definition. This change has been made to better measure the ability of the Group’s assets to deliver returns by including intangible assets acquired through acquisitions of businesses by Coats.
15. Post balance sheet event
Connecting for Growth is a 2 year transformation programme to drive agility across the organisation, enabling the next phase of growth at Coats and accelerating our transition from the industrial age to the digital age. This programme will focus on simplification across many aspects of the organisation, connecting the business end to end, and releasing funds for reinvestment in customer-focussed initiatives and people. Subsequent to the 31 December 2017 year end, on 27 February 2018 it was announced that estimated exceptional reorganisation costs of $30 million are expected to be incurred in connection with this programme, with the majority of these costs expected to be incurred in the year ending 31 December 2018. It is expected that the majority of savings from this transformation programme will be achieved from reducing complexity in the existing Group. For example transitioning from market-focussed support functions (e.g. Finance, HR and Technology) to realigned globally integrated support functions, redesigning the way the Group services a number of its peripheral markets, and moving from a business which is currently operated by individual local management teams into 10 scalable clusters.
36
Coats Group plc Notes to the financial information for the year ended 31 December 2017 (continued)
16. Directors
The following persons were, except where noted, directors of Coats Group plc during the whole of the year ended 31 December 2017 and up to the date of this report: M Clasper CBE R Sharma M N Allen R Anderson S Boddie N Bull D Gosnell H Lu (Appointed 1 December 2017) F Philip A Rosling CBE On 8 January 2018 it was announced that A Fahy will join the Board of Coats Group plc as a non-executive director, effective 1 March 2018. On behalf of the Board M. Clasper Chairman 27 February 2018 United Kingdom 1 The Square, Stockley Park, Uxbridge, UB11 1TD Tel: 020 210 5000
Registered in England No. 103548