Embed Size (px)
Citation preview

Printed on recycled paper stock, using soy inks.
E N V I R O N M E N T D E P A R T M E N T P A P E R S
Susta inab le Deve lopment V ice Pres idency
Environment DepartmentT H E W O R L D B A N K
1818 H Street, NWWashington, D.C. 20433 USATelephone: 202-473-3641Facsimile: 202-477-0565Internet: www.worldbank.org/environment
IUCN Washington DC Office
1630 Connecticut Avenue, NWSuite 300Washington, D.C. 20009 USATelephone: 202-518-2056Facsimile: 202-387-4823Internet: www.IUCN.org/USA
PWA-ESA
550 Kearny StreetSuite 900San Francisco, CA 94108-2404 USA Telephone: 415-262-2300Facsimile: 415-262-2303Internet: www.pwa-ltd.com
Paper number 121
Marine Ecosystem Series
Mitigating Climate Change through Restoration and Management of Coastal Wetlands and Near-shore Marine Ecosystems
Challenges and Opportunities
Stephen Crooks, Dorothée Herr, Jerker Tamelander, Dan Laffoley, and Justin Vandever
March 2011

Papers in this series are not formal publications of the World Bank. They are circulated to encourage thought and discussion. The use and citation of this paper should take this into account. The views expressed are those of the authors and should not be attributed to the World Bank. This book is available on-line from the Environment Department of the World Bank at: www.worldbank.org/environment/publications
Mitigating Climate Change through Restoration and Management of Coastal Wetlands and Near-shore Marine EcosystemsChallenges and Opportunities
Stephen Crooks, Dorothée Herr, Jerker Tamelander, Dan Laffoley, and Justin Vandever
The World Bank environmenT deparTmenT
March 2011

© The International Bank for Reconstructionand Development/THE WORLD BANK1818 H Street, N.W.Washington, D.C. 20433, U.S.A.
Manufactured in the United States of AmericaFirst published March 2011
The views expressed in this document are those of the authors and do not necessarily represent views of the World Bank, IUCN or ESA PWA.
Reproduction of this publication for educational or other non-commercial purposes is authorized without prior written permission from the copyright holder provided the source is fully acknowledged. Reproduction of this publication for resale or other commercial purposes is prohibited without prior written permission of the copyright holder.
Citation: Crooks, S., D. Herr, J. Tamelander, D. Laffoley, and J. Vandever. 2011. “Mitigating Climate Change through Restoration and Management of Coastal Wetlands and Near-shore Marine Ecosystems: Challenges and Opportunities.” Environment Department Paper 121, World Bank, Washington, DC.
Design: Jim CantrellCover photo: © Shutterstock LLC. Mangrove tree at low tide, Vilanculos Coastal Wildlife Sanctuary, Mozambique.
iiiMarine Ecosystem Series
Contents
Preface vii
executive Summary 1
Chapter 1
Introduction 5
Chapter 2
GHG Dynamics in Coastal Wetlands and Marine Ecosystems 72.1 Carbon Sequestration by Coastal Wetlands and Near-Shore Marine Ecosystems 7
2.2 Carbon Losses from Degradation of Coastal Wetlands and Near-Shore Marine Ecosystems 8
2.3 Coastal Wetlands as Sources and Sinks of other Greenhouse Gases 9
Chapter 3
Avoiding Emissions and Increasing Carbon Sequestration 113.1 Avoidable Emissions 11
3.2 Creation and Enhancement of Coastal Carbon Stocks 13
3.3 Wetland Project Activities 15
3.4 Co-Benefits of Managing Coastal Wetlands and Marine Ecosystems for Climate Change Mitigation 16
Chapter 4
Status and Trends of Coastal Wetlands and Near-Shore Marine Ecosystems 194.1 Historical Extent of Coastal Wetland and Marine Ecosystems and Loss to Date 19
4.2 Drivers of Coastal Wetland and Marine Ecosystem Loss 20
4.3 Expected Future Loss and Degradation 20
Chapter 5
Policy Reform to Reduce Emissions and Enhance Coastal Carbon Stocks 215.1 Opportunities for Developing Countries 21
5.2 Opportunities for Developed Countries 23
5.3 Expanding UNFCCC Reporting Requirements 25
5.4 IPCC Guidance and Guidelines 26
5.5 Coordinated Action 28

Environment Department Papersiv
Mitigating Climate Change through Restoration and Management of Coastal Wetlands and Near-shore Marine Ecosystems
Chapter 6
Conclusions and Recommendations 29
annexeS
Annex 1: Current Coastal Carbon Activities 31
Annex 2: Derived Estimates of GHG Emissions from Coastal Carbon Sinks 33
referenceS 47
SourceS cited 49
figureS
Figure 1. Estimated CO2 Emissions from Drainage of Wetland Soils in Thirteen Large Deltas 12
Figure 2. Restoring a Vegetated Marsh Takes Time and Sediment 14
tableS
Table 1. Summary of Potential GHG Reductions Due to Soil Building in Coastal Wetlands 2
Table 2. GHG Balance of Coastal Wetlands. Soil Burial of CO2 and CH4 Emissions 15
Table 3. Ecosystem Services of Coastal and Marine Ecosystems 17

vMarine Ecosystem Series
AFOLU Agriculture, Forestry and Other Land UseCDM Clean Development MechanismCH4 MethaneCO2 Carbon DioxideCOP Conference of the PartiesEbA Ecosystem-based AdaptationGHG Greenhouse gasGPG Good Practice GuidanceIPCC Intergovernmental Panel on Climate ChangeKP Kyoto ProtocolLULUCF Land use, land use change and forestryMRV Measuring, Reporting and VerifyingN2O Nitrous OxideNAMA National Appropriate Mitigation ActionNGO Non-governmental organizationREDD Reduced Emissions from Deforestation and forest DegradationRMU Removal unitsSBSTA Subsidiary Body for Scientific and Technological AdviceUNFCCC United Nations Framework Convention on Climate ChangeUSGS U.S. Geological Survey
Glossary

viiMarine Ecosystem Series
Ecosystems in the land-ocean interface are gaining increased attention for the carbon they store in biomass and especially sediments. This makes them potential sources of significant greenhouse
gas (GHG) emissions if disturbed, but also valuable for nature-based approaches to climate change mitigation.
Scientific research into the exchange of GHGs between the atmosphere and these ecosystems (known as flux) has been underway for some time, but it was two reports published in 2009—The Management of Natural Coastal Carbon Sinks1 and Blue Carbon2—that brought this aspect to the attention of climate change practitioners. At the same time, the publication of the World Development Report 2010: Development and Climate Change,3 and Convenient Solutions to an Inconvenient Truth,4 underscored the importance of harnessing natural systems including wetlands, and the carbon storage services they provide, in the fight to reduce carbon emissions.
This report builds on these and other efforts to bring to light the important carbon sequestration potential of coastal wetlands, and the significant and largely unaccounted for GHG emissions resulting from the disturbance, drainage, and conversion of these natural coastal carbon sinks for agriculture, tourism and other coastal development.
Conceived in discussions with the report authors, this study was commissioned and overseen by a team at the World Bank led by Marea Hatziolos (Senior Coastal and Marine Specialist, Environment Department), and peer reviewed by Kieran Kelleher
(Senior Fisheries Specialist, Agriculture and Rural Development Department) and Ian Noble (Lead Climate Change Specialist, Environment Department). ln light of rapidly evolving policy on the eligibility of REDD+ activities under the UNFCC, this activity was designed to inform policymakers and climate change practitioners on the capture and conservation of blue carbon in natural, coastal carbon sinks. The results included a policy brief synthesizing the results of the study, which was circulated at the UNFCCC COP 16 in Cancun,5 and the detailed findings, presented here in this full technical report.
The technical report, prepared by Stephen Crooks, Dorothée Herr, Jerker Tamelander, Dan Laffoley and Justin Vandever, consolidates information from the literature and provides analysis on the climate change mitigation potential of seagrasses and coastal wetlands, including coastal peats, tidal freshwater wetlands, salt marshes and mangroves (see Annex 2). The numbers in this full technical report have been adjusted since the synthesis note, produced while the study was in progress, was released in Cancun. The calculations of emissions are ballpark, but reasonable, and represent an order of magnitude range. They are meant to stimulate additional and focused research, while raising awareness among the science, management and policy communities of the dangers of ignoring these unaccounted for GHG sources and sinks.
Some initial steps are identified to integrate these fragile ecosystems into national and international climate change policy instruments and implementation activities, including market-based approaches.
Preface
Environment Department Papersviii
Mitigating Climate Change through Restoration and Management of Coastal Wetlands and Near-shore Marine Ecosystems
Both the synthesis and this full report are available at www.iucn.org/marine and www.worldbank.org/icm
Although the study focuses primarily on coastal wetlands, it should be seen as part of a broader effort to quantify the contribution of coastal, near-shore marine and oceanic (open-ocean) carbon sinks to the global carbon budget and to build consideration of this into global climate change mitigation actions.

1Marine Ecosystem Series
Coastal wetlands and marine ecosystems hold vast stores of carbon. Occupying only 2% of seabed area, vegetated wetlands represent 50% of carbon transfer from oceans to sediments.6
This carbon can remain stored in buried sediments for millennia. Loss of coastal wetlands and marine ecosystems such as peatlands, forested tidal wetlands, tidal freshwater wetlands, salt marshes, mangroves and seagrass beds leads to decreased carbon sequestration and can also lead to emissions of large amounts of CO2 directly to the atmosphere. Largescale emissions from ecosystem degradation and habitat conversion of these wetlands are ongoing but currently not accounted for in national greenhouse gas inventories, nor are these being mitigated to any degree.
The current climate policy regime contains few incentives for restoration or disincentives to drain or degrade coastal wetlands. Yet, carbon dioxide emissions from drained coastal wetlands are sufficiently large to warrant inclusion in carbon accounting and emission inventories, and in amendments of national and international policy frameworks to reduce emissions from the loss of these ecosystems. Further work is needed to quantify the magnitude of emissions from near-shore marine ecosystems such as seagrass beds. It is, however, clear that improved management of these systems would slow or reverse ongoing loss of carbon sequestration capacity. Sustainable management of coastal wetlands and marine ecosystems also offer a wide range of co-benefits, including shoreline protection, nutrient cycling, water quality maintenance, flood control, habitat for birds, other wildlife
and harvestable resources such as fish, as well as opportunities for recreation.
Coastal wetlands and marine ecosystems sequester Carbon
Coastal wetlands and marine ecosystems sequester carbon within standing biomass, but even more within soils. In many cases these peat-like soils have been continuously building for over 5,000 years, or longer. Wetlands in salinea environments have the added advantage of emitting negligible quantities of methane, a powerful greenhouse gas, whereas methane production in freshwater systems partially or wholly negates short-term carbon sequestration benefits (see Table 1). However, over multi-century time scales all coastal wetlands are net GHG sinks.
Drainage of Coastal wetlands releases large amounts of stored Carbon
Human-caused drainage of coastal wetlands releases carbon from soils, turning them into a strong net source of GHG emissions, irrespective of their GHG balance in the natural state. Soils vary in carbon content across the landscape but a “typical” coastal wetland soil releases 0.1 MtCO2 per square kilometre for every depth meter of soil lost (Annex 2b), though
a Salinities greater than ½ that of sea water.b Data emerging from the analysis outlined in Annex 2 of this report has been developed with the intent of subsequent scientific peer review.
Executive Summary

Environment Department Papers2
Mitigating Climate Change through Restoration and Management of Coastal Wetlands and Near-shore Marine Ecosystems
with a wide range. Averaged over a 50-year period this equates to 2,000 tCO2 km-2 yr-1, though rates of loss are particularly high in the first decade of wetland drainage.
Coastal wetlands are being rapidly converted to agriculture and other land-uses around the world, leading to significant emissions. In the Sacramento – San Joaquin Delta, California, drainage of 1,800 km2 of wetlands has released some 0.9 GtCO2 (Giga tons, or billion tons of carbon dioxide), a mass of about one quarter of the total above ground pool of carbon in Californian forests, over the last century. This carbon was sequestered over four thousand years but released in just over 100 years. Each year, between 5 and 7.5 million tons of CO2 continue to be released from this Delta, equivalent to 1–1.5% of California’s annual GHG emissions. Other large deltas estimated to have each released over one half a Gt CO2 due to land-use change are: the Changjiang (3.4 GtCO2); the Mekong Delta (3.3 GtCO2); the Po (1.5 GtCO2); the Nile (0.8 GtCO2); the Wash-Humber, eastern UK (1.1 GtCO2); and the Indus (0.6 GtCO2).
Between 1980 and 2005, 35,000 km2 of mangroves were cleared and drained.8 We estimate that this area of wetland alone will continue to release 0.07 GtCO2 every year. Loss of the remaining 152,308 km2 of mangroves would release 0.3 GtCO2 over the same time; as well as result in incalculable losses in other ecosystem processes and services. Remaining coastal wetlands with peat-rich soils, which release higher than average amounts of carbon per unit area, are being rapidly converted for oil palm plantations and aquaculture in parts of Southeast Asia.
management of Coastal wetlands and marine ecosystems Can mitigate GHG emissions
Coastal wetlands are under direct and increasing threat from land use change pressures,9 from indirect impacts of upstream disruption to sediment supply, and from development pressures and rising sea level at the coast. Altered sediment supply and delta subsidence exacerbate sea level rise, with local rates commonly twice, and in some locations as much as 10 times, global rates.10 Large areas of coastal wetland have been drained and converted to other uses.
In the last 25 years alone, between 1980 and 2005, about 20% of the total area of mangroves was lost.11 Seagrass beds have declined by 29% since the 19th century, with an upsurge in the recent decades.12 Salt marshes and freshwater tidal marshes have lost more than 50% of their historical global coverage, with the current rate of loss estimated at 1–2% per year.
Centuries to millennia of accumulated carbon is released in a few decades when coastal wetlands are drained or otherwise lost. For organic-rich soils the process of soil deflation may continue for centuries until all resources are depleted. The most effective way to maintain wetland carbon pools and prevent emissions to the atmosphere is avoiding conversion and drainage through protection and sustainable management. Restoration of degraded ecosystems has a twofold benefit: reducing ongoing losses and rebuilding carbon stores. However, sequestration rates during restoration are, in most cases, lower than rates at which
Table 1. Summary of potential GHG reductions due to Soil building in coastal wetlands7
Wetland Type Carbon Sequestration Methane Production Net GHG Sink
Mudflat (saline) Low Very Low Low to Medium
Salt Marsh High Very Low High
Freshwater Tidal Marsh Very High High to Very High Neutral or variable
Estuarine Forest High Low High
Mangrove High Low to High* Low to High*
Sea grass High Low High
*salinity dependent

3Marine Ecosystem Series
Summary
carbon is lost when drained, reducing the mitigation potential in the short-term, but not in the long-term. Further efforts are needed to increase the number and efficiency of restoration activities.
Opportunities to strengthen nature-based mitigation in Coastal areas
There is now adequate knowledge to take policy as well as practical actions towards the inclusion of emissions from sources and removals by sinks in coastal areas in GHG accounts. Stronger incentives to better manage, along with disincentives to drain or otherwise damage, these ecosystems need to be created.
Conservation and management actions focusing on coastal wetlands and near-shore marine ecosystems can already be included in developing countries’ National Appropriate Mitigation Actions (NAMAs). While financial support for mangrove conservation and restoration for mitigation purposes can be obtained through inclusion of these activities in national REDD+ strategies, policies and measures, development of an additional financing mechanism for coastal wetlands and near-shore marine ecosystems that provides financial incentives for soil-based carbon storage and sequestration would be beneficial. However, further detailed analysis of the potential for coastal and near-shore nature-based mitigation is needed, including quantifying the carbon balance in these habitats,
and assessing social and economic impacts as well as environmental and social safeguard risks.
Current IPCC guidelines for accounting GHG emissions by sources and removals by sinks could easily be expanded to also encompass, for example, rewetting and draining of coastal wetlands. National climate change mitigation reporting procedures should be amended accordingly to also include action on the restoration and enhancement of coastal wetlands and nearshore marine ecosystems. However, further research is necessary for development of additional or supplementary methodologies covering other coastal and marine ecosystem types and management activities, including, e.g. baseline data, monitoring and verification approaches, as well as testing and verification of methods through a network of pilot projects.
Land Use, Land Use Change and Forestry (LULUCF), as defined through UNFCCC, should also encompass rewetting and drainage of coastal wetlands in a second commitment period of the Kyoto Protocol. This would enable additional, coastal LULUCF activities under the Clean Development Mechanism (CDM). Harmonizing definitions and categories of activities related to ecological restoration and management of coastal wetlands and marine ecosystems under IPCC and UNFCCC will support these actions.

5Marine Ecosystem Series
1 IntroductionIntroduction
There is overwhelming consensus amongst climate scientists that the Earth’s warming in recent decades has been caused primarily by human activities that have increased the amount of
greenhouse gases (GHGs) in the atmosphere.13 To mitigate the most serious impacts of climate change a range of different strategies to lower carbon dioxide (CO2) concentrations in the atmosphere are required.
Healthy coastal wetlands such as coastal peats, tidal freshwater wetlands, salt marshes, mangroves and seagrass beds store vast amounts of organic carbon in sediments and biomass. This carbon is released as CO2
into the atmosphere when ecosystems are damaged or lost. Ongoing coastal ecosystem conversion and degradation, in many places exceeding the rates of ecosystem loss on land, lead to continuous and significant emissions.
However, while these emissions could be reduced through conservation and sustainable management, and restoration of degraded areas could promote sequestration of additional CO2 from the atmosphere, the potential of coastal wetlands and seagrass beds for climate change mitigation has not yet been fully explored. Consequently, the CO2 emissions and sequestration associated with coastal wetlands and seagrass beds are currently neither accounted for in national greenhouse gas (GHG) inventories, nor do incentives for restoration or disincentives to drain or damage these systems exist in international policy frameworks.
Working with nature to reduce GHG emissions and to enhance carbon sequestration—or ecosystem-
based mitigation—is not a new concept. The United Nation Framework Convention on Climate Change (UNFCCC) as well as the Kyoto Protocol make clear reference to reducing emissions by sources and removals by sinks in natural systems. Development of the REDD+c scheme, as agreed at UNFCCC COP16 in Cancun 2010, has provided a mechanism for financing forest restoration and conservation and management of forests, leading to enhancement of carbon stocks and avoided emissions.
Progress with respect to the inclusion of coastal wetland and seagrass bed management and restoration activities into national and international climate regimes has been held back by a lack of detailed knowledge about their potential for climate change mitigation, and absence of applicable carbon accounting methodologies. This report helps address some of these gaps and uncertainties, while pointing to the need for more quantitative analysis of carbon balance in these systems in temperate and tropical waters, in order to move towards more comprehensive accounting of reduction of emissions by sources and removals by sinks in all natural systems within the climate change regime and enable better-informed mitigation actions.
Building on outcomes and recommendations from various coastal carbon activities (see Annex 1), this report explains the GHG dynamics of coastal wetlands
c Reducing Emissions from Deforestation and Forest Degradation and the role of conservation, sustainable management of forests and enhancement of forest carbon stocks in developing countries.

Environment Department Papers6
Mitigating Climate Change through Restoration and Management of Coastal Wetlands and Near-shore Marine Ecosystems
and marine ecosystems (Chapter 2). The importance of coastal wetland and near-shore marine ecosystem carbon pools for climate change mitigation are described in Chapter 3, with a brief overview of the status of these systems, including drivers of change and implications of degradation of carbon pools, provided in Chapter 4. Chapter 5 gives an overview
of policy opportunities under ongoing UNFCCC negotiations and through revision of Intergovernmental Panel on Climate Change (IPCC) carbon accounting methodologies and eligible mitigation activities for developing as well as developed countries. The main recommendations for action are summarized in Chapter 6.

7Marine Ecosystem Series
GHG Dynamics in Coastal Wetlands and Marine Ecosystems
Coastal areas receive large inputs of organic matter and nutrients from land through sediment runoff via rivers and from ocean upwelling and currents. This makes coastal ecosystems
among the most biologically productive areas of the planet.14 The high productivity of coastal wetlands and seagrass beds supports significant sequestration of carbon in sediment, below ground biomass and within surface and waterborne plants and animals. Notably, the potential for continuous deposition of carbon in sediments that can accrete over millennia—unlike e.g. forests, which tend to reach a steady state within decades to a century—makes these coastal ecosystems valuable tools in mitigation. Further, conserving and restoring coastal wetlands and seagrass beds can also support adaptation measures. This chapter summarizes mechanisms by which coastal wetlands and seagrass beds sequester carbon and support the regulation of global GHG levels.
2.1 Carbon sequestration by Coastal wetlands and near-shore marine ecosystems
Coastal wetlands consist of a mosaic of habitat types that include mudflats, salt marshes, brackish marshes, mangroves, freshwater tidal wetlands, and high intertidal forested and scrub wetlands, and coastal peat lands. Offshore coastal wetlands give way to expansive areas of seagrasses, kelp beds and unvegetated seabed. These ecosystems reflect a progressive transition from the land drained by rivers, through coastal flood lands to the open continental shelf and the ocean beyond.
All coastal wetlands are long term net sinks for atmospheric CO2 through production of standing biomass and burial of primarily root and rhizome organic matter in sediment. The amount of carbon stored can be variable depending upon wetland type and landscape setting. By and large, the productivity of vegetation, be it temperate or tropical, increases from the saline end of estuaries and deltas to the freshwater head of these systems. As such, we commonly find greater carbon accumulation within freshwater vegetation and soils than at the saline margin. Nevertheless, carbon sequestration across the salinity transition is significant.
The preservation of soil carbon is a result of the regular tidal flooding of wetland, fostering saturated soil conditions, where under conditions of low oxygen availability, decay rates of soil organic matter and release of carbon dioxide are greatly reduced. Gradual additions to the carbon pool are made as the soil surface continues to build with rising sea level, and organic material becomes progressively buried beneath saturated soils. Rates of carbon release through microbial decomposition are slow unless the wetland is disturbed. In many coastal settings, accumulations of organic bearing soils have built up dating back to the mid Holocene (around five thousand years old).
Deltas built by enormous accumulations of mineral sediment, sustain extensive areas of vegetated wetlands. These deltas consolidate under their own weight, and through the slow expulsion of water the land subsides. Flooding waters bring replenishing sediments and allow wetlands to keep pace with rising relative
2

Environment Department Papers8
Mitigating Climate Change through Restoration and Management of Coastal Wetlands and Near-shore Marine Ecosystems
sea level,d burying carbon in the process. Typically, undisturbed deltas are resilient to high rates of sea level rise because of the high rates of sediment supply. Expansive and contiguous tidal wetlands are found e.g. in the Amazon, the coast of Venezuela, Ganges-Brahmaputra, Alaska, and Louisiana. In many regions of the world delta wetlands have been heavily diked and drained, particularly in Northern Europe and the United States, and recently throughout Asia, mainly in Southeast Asia.
Extensive coastal wetlands also build up along coasts and on low-lying islands away from terrestrial sources of sediment. In locations such as the island coasts in the Gulf of Mexico, Micronesia and Indonesia deep sequences of organic rich coastal peats have accumulated, largely devoid of mineral sediment, through the gradual accretion of vegetation under conditions of relatively slow rates of sea level rise. These systems store very dense deposits of soil carbon.
The proximity of many mangroves, sea grasses and also coral reefs is recognized to provide particularly high biodiversity and productivity. This is in part because of the diversity of habitat but also because of the complex interactions of food webs and carbon flows between these ecosystems (e.g. Nagelkerken et al., 200015). Seagrass meadows are excluded in areas of high sediment yield, which lowers light attenuation into the water column and smothers vegetation. Where present, certain seagrass beds sequester carbon within soils in a manner very similar to intertidal wetlands, producing deposits of organic rich sediments. Published data on soil carbon deposition of seagrasses is limited both geographically and taxonomically. However, thick beds of organic matter within gradually accumulating sediments are commonly associated with the seagrass species Posidonia oceanica, and a limited number of studies document that sediments below seagrass beds or mattes host a carbon content of up to 40%, reflecting millennia of carbon accumulation.16,17,18,19,20
In areas where rates of mineral sediment supply are high, soil carbon contents may represent less than 5% of soil dry weight, reflecting dilution with non-organic material.21,22,23,24 However, in inner reaches of temperate and tropical deltas, estuaries and lagoons, where mineral sedimentation is low, organic rich soils and peats may form carbon contents of 30%–50% or more, comparable with terrestrial peat soils.25,26,27,28,29,30,31,32,33,34 These carbon rich soils may be many, several to 10 or more, meters deep and hold up to 65,000 tons C (238,000 tC02) per km2 for every meter depth of soil.35
The global distribution of coastal wetland peaty soils is poorly mapped, but likely to be widespread and extensive. Soil descriptions from large coastal deltas such as the Orinoco36 and the Mekong37,38 report organic rich soils covering about 50% of the area. In the freshwater tidal Sacramento-San Joaquin Delta peat soils represented almost the full extent of the once 1,800 km2 delta to a depth of around 10 meters.39,40 Similarly, organic rich soils are found beneath mangroves in Australia, South East Asia,41 Mexico42 and Belize.43
2.2 Carbon losses from Degradation of Coastal wetlands and near-shore marine ecosystems
Processes that destroy vegetation in coastal wetlands and near-shore marine ecosystems effectively halt a significant component of ongoing carbon sequestration. Drainage, the artificial lowering of the soil water table, allows oxygen to enter soils, which then release soil carbon to the atmosphere in the form of carbon dioxide. Drainage of coastal wetlands and conversion to agricultural or other land uses therefore not only halts ongoing carbon sequestration but releases carbon stocks that built up over many centuries, and in peat rich systems, many millennia.44,45
d Relative sea level rise—the combination of global sea level rise and the impacts of local land movement.

9Marine Ecosystem Series
GhG Dynamics in Coastal Wetlands and Marine Ecosystems
The rate at which carbon is released to the atmosphere with wetland drainage is anticipated to be most rapid during the years immediately following wetland conversion and then to subside with time. This process is however poorly documented. Lessons can be drawn from the progressive drainage of terrestrial freshwater wetlands in northeast China. By examining the carbon content on former wetland soils of different ages researchers determined that 60% of near surface carbon was lost within the first 10 years after drainage.46
In settings where wetland soils consist mostly of mineral matter the rate of carbon loss stabilizes over time.47,48 By contrast, in settings where organic matter makes up the bulk of the sediment soil, loss can be continuous, leading to deep depressions in the landscape due to compression following drainage. With drainage, five components to subsidence are recognized:49 1) shrinkage due to desiccation; 2) consolidation with water loss; 3) wind and water erosion; 4) burning; 5) aerobic oxidation of soil carbon. Of these processes aerobic oxidation has been found to be the most significant cause of subsidence in organic soils.50,51
Loss of carbon-rich soils has been documented at rates of between less than 1 cm yr-1 to more than 10 cm yr-1. In the Sacramento – San Joaquin Delta, a basin of more than 3 billion m3 (3 km3), up to 10 meters deep, has been created through the drainage and oxidation of peat soils. Over the past 100 years 1–3 cm of surface soils have been lost each year, equating to a continuous soil carbon loss of approximately 20 tons C ha-1 yr-1 (7,300 tCO2 km-2 yr-1) and a total emission of around 1 GtCO2.
52,53,54 In the Po Delta, Italy, drained peat soils have subsided by 4 meters since 1930.55 In The Wash, U.K., peat soils are lost at a rate of 1–3 cm per year.56 In Florida, drained organic soils continuously subsided by 2.5 cm yr-1 between 1925 and 1978.57 In Malaysia, drained organic rich soils subsided at a rate of 12 cm yr-1 between 1960 and 1974, falling to 6.4 cm yr-1 over the following 14 years and 2 cm yr-1 thereafter,58 hinting at the heightened rates of carbon loss that occur in the years immediately after organic rich soils are drained.
2.3 Coastal wetlands as sources and sinks of other Greenhouse Gases
Some coastal wetlands emit methane (CH₄), a greenhouse gas 25 times more potent that CO2. The formation of methane occurs in low salinity or non-saline environments and requires strictly anaerobic conditions. Methane production is generally intense in brackish and freshwater tidal flats and marshes because of the high organic matter content of the soils at anoxic depths. Methane production decreases by two orders of magnitude, to negligible levels, as salinity increases to roughly ½ that of seawater because of the impact of sulphate on biogeochemical processes.59
In many wetlands some of the methane produced in subsurface soils is oxidized and denatured as it diffuses to the atmosphere through the oxygenated soil surface.60 In freshwater and brackish marshes (vegetated by tule, common reed, and sedge) this pathway is short cut by a route through deep soils and by air passages in the plant to the atmosphere.61 Forested wetlands that are flooded for only parts of the year produce less CH4 than fully tidal marshes because of the periods of prolonged drying and exposure to the atmosphere during lowered water table. Such systems may even be net sinks for CH4.
Another greenhouse gas of concern in coastal environments is nitrous oxide (N2O). N2O is mainly formed as a by-product during nitrification (the breakdown of ammonia to nitrate and nitrite) and as an intermediate during denitrification (conversion of nitrate to nitrous oxide and nitrogen).62 Both nitrification and denitrification are microbial processes that can happen in the water column and in sediments, mediated by bacteria living in low oxygen environments. Ammonia and nitrate are natural constituents in estuarine waters but are now found at heightened levels in wetlands due to agriculture and other anthropogenic sources such as air pollution.
While estuaries overall are very effective systems for the recycling of nitrogen, the capacity of estuaries to
Environment Department Papers10
Mitigating Climate Change through Restoration and Management of Coastal Wetlands and Near-shore Marine Ecosystems
do so has been degraded by the loss of tidal wetlands.63 Denitrification is not confined to intertidal sediment but continues in organic bearing continental shelf sediments beyond the estuary, and in the anoxic waters of nutrient-loading induced dead zones. As a consequence, while restored wetlands do contribute to the production of small amounts of N2O, this compound would be produced elsewhere in the estuarine or on the adjacent continental shelf, even without the presence of the wetland. As a result, the presence of the N2O precursor compounds and their associated emissions would likely remain unchanged regardless of whether the wetlands are there or not.
Overall, tidal wetlands are a net sink for carbon even though they release a percentage of that as CO2 to the atmosphere or in particulate or dissolved form to the estuary. In brackish and freshwater tidal systems, large amounts of CH4 are released from anoxic soil, which, from a GHG mitigation perspective, may exceed their carbon sequestration value. Tidal wetlands also contribute a small amount of N2O production, but this is a function of nitrogen pollution in coastal areas, and these emissions would most likely occur regardless of the presence of the wetland.

11Marine Ecosystem Series
3
There are two primary mechanisms to reduce greenhouse gas emissions in a landscape with ongoing loss of coastal wetlands and near-shore marine ecosystems: 1) conserving historically
sequestered pools of carbon; and 2) restoring and rebuilding degraded carbon pools. The rate at which carbon is lost from disturbed coastal wetlands is typically much greater than the rate at which it can be restored. Therefore, when planning to manage carbon stocks it is more effective to prevent carbon-bearing soils from being disturbed than to begin a process of restoration. However, given the dramatic decline in coastal wetland and near-shore marine ecosystem extent over recent decades (see Chapter 4), restoration activities are critically needed to rebuild carbon sinks and restore coastal and near-shore marine ecosystem health.
3.1 avoidable emissions
Preventing drainage of coastal wetlands is an effective measure to maintain carbon in soils and CO2 out of global circulation. But how effective? To date, no global and few local estimates have been made of the CO2 flux that occurs with drainage of coastal wetland soils, and CO2 emissions are not accounted for in national and international GHG emissions inventories.
In Annex 2 of this report we describe an analysis to estimate the CO2 released from 15 case study deltas and estuaries around the world. These systems reflect a representative range of large deltas and estuaries in tropical (mangrove) and temperate (saltmarsh and freshwater tidal) settings, and include those threatened by human impacts (direct drainage or disrupted
sediment supply) as well as those in relatively pristine condition.
By synthesizing studies that describe the carbon content of coastal wetland soils, and calculating the volume of soil loss (derived using global elevation SRTMe data), we can provide an approximate estimate of the CO2 released since the time of wetland drainage. Soils vary considerably in coastal settings but to simplify the analysis we assume two soil types: organic-bearing soils and organic-poor (mineral) soils with a carbon content of 20% and 6%, respectively.
Within these few deltas and estuaries we identify several systems to have likely lost more than 1 billion tons of CO2. Deltas with large emissions include the Indus Delta (0.6 GtCO2); The Wash-Humber (1.1 GtCO2); the Mekong Delta; (3.3 GtCO2), the Nile (0.8 GtCO2); the Po (1.5 GtCO2); the Changjiang (3.4 GtCO2); and the Sacramento – San Joaquin Delta (>0.9 GtCO2) (Figure 1). We estimate the CO2 loss from these delta soils, per meter depth, at 0.1 Mt / km2.f
Similarly, based upon a reasonable assumption of 2–4 cm of soil being lost each year we estimate that the drainage of 35,000 km2 of mangroves between 1980 and 200564 to release 0.16 MtCO2 km-2 within the first 50 years after land-use conversion, and continuing thereafter. Loss of remaining mangrove areas would
Avoiding Emissions and Increasing Carbon Sequestration
e http://www2.jpl.nasa.gov/srtm/f The range on these estimates is sensitive to assumptions and varies by ecosystem type and geographic setting in the estimated range of 0.025 to 0.38 MtCO2/m depth/km2.

Environment Department Papers12
Mitigating Climate Change through Restoration and Management of Coastal Wetlands and Near-shore Marine Ecosystems
release 24,000 MtCO2 within a few decades of drainage, and would further continue over time.
How much CO2 has been released by the drainage of other wetlands? This is difficult to say. Research is required to document the full extent of drained organic rich wetland soils in coastal settings. To gain a sense of this potential area, a broader indication may be inferred from the mapped widespread occurrence of acid sulphide soils associated with agriculture in coastal lowlands. The formation of such soils is specific to former saline (marine) sediments and requires organic matter bearing soils. Over 170,000 km2 of acid sulphide soils have been mapped globally, particularly from deltaic settings, with major areas occurring in SE Asia (Indonesia, Thailand, Vietnam & Malaysia), Australia, India, Bangladesh, West Africa (Senegal, the Gambia, Guinea Bissau, Sierra Leone & Liberia) and
along the northeast coast of South America (Venezuela & the Guyanas).65 and references therein If this estimated area approximates the distribution of drained organic soils around the world, and each square kilometre of land is emitting 2,000 tCO2 per year, then globally, historically drained coastal wetlands are releasing around 0.35 GtCO2 each year.
The above estimates of emissions give us an indication of the potential implications of wetland conversion. There are approximately 350,000 km2 of coastal mangroves and salt marshes remaining, drainage of which could emit an additional 0.70 GtCO2 per year through soil carbon loss.
Unlike coastal wetlands, the fate of carbon held in seagrass beds disturbed by activities such as dredging and trawling is unknown. Further analysis is required
Figure 1. Estimated cO2 Emissions from drainage of wetland Soils in Thirteen large deltas
This dataset is a small but representative case study subset of global coastal systems, including both temperate and tropical deltas. Almost all coastal systems are subject to wetland conversion and drainage, releasing CO2. Included with the emissions estimates is a description of delta vulnerability to potential flooding associated with present day sea level rise and reduced sediment supply from rivers (derived from Syvitiski et al., 2009). Technical description of analysis is provided in Annex 2.
Source: 2001 NASA MODIS 1km satellite images (Obtained from ESRI Data & Maps DVD, ArcGIS 9.3) ©ESA PWA
Mitigating Climate Change text 4-4-11.indd 12 4/4/11 4:28 PM

13Marine Ecosystem Series
Avoiding Emissions and Increasing Carbon Sequestration
to determine whether these organic sediments are redeposited or a fraction oxidized upon redistribution.
Remaining coastal wetlands and marine ecosystems are under particular pressure in Southeast Asia, (notably Indonesia and Thailand, Borneo and Sumatra), India, Bangladesh and West Africa. The world largest tracts of remaining unbroken wetlands can be found in Northern Brazil (6,516 km2), the Sundarbans (6,502 km2), Southern Papua (5,345 km2), the West African mangrove coast (7,887 km2), the Niger Delta (6,642 km2) and the Orinoco and Gulf of Paria (2,799 km2).66
3.2 Creation and enhancement of Coastal Carbon stocks
Restoration of degraded coastal wetland and near-shore marine ecosystem carbon pools offer potential to reverse GHG emissions, enhance existing carbon stocks and restore co-benefits. There is a time lag following the initiation of restoration and the time at which carbon sequestration in the wetland matches natural reference sites. This is because restoration of wetland requires establishing a surface elevation at which plants will colonize and contribute to soil carbon building processes. This critical colonization elevation varies by ecosystem.
Seagrasses are found in low intertidal and subtidal environments and will reestablish if water quality conditions are appropriate and human disturbance is limited. Mangroves and salt marsh colonize at elevations above mean tide level (specific elevations dependent upon species). Freshwater reeds may grow down to or just below the low tide elevation. Once healthy vegetation has reestablished carbon sequestration rates compare favourably with natural reference conditions.67
The process of coastal wetland restoration is well understood and documented within the scientific literature, with numerous case studies that extend back over several decades, and in the case of unintentional restoration over more than a century. Typically,
restoration of coastal wetlands occurs on lands where vegetated wetlands once existed, but are now behind levees. Diking and drainage of coastal wetlands results in land subsidence, and as such these lands often require raising, usually through natural sedimentation. The time interval until the mudflat builds up to vegetation colonization elevations reflects the depth of subsidence, the availability and rate of accumulation of sediment (Figure 2).
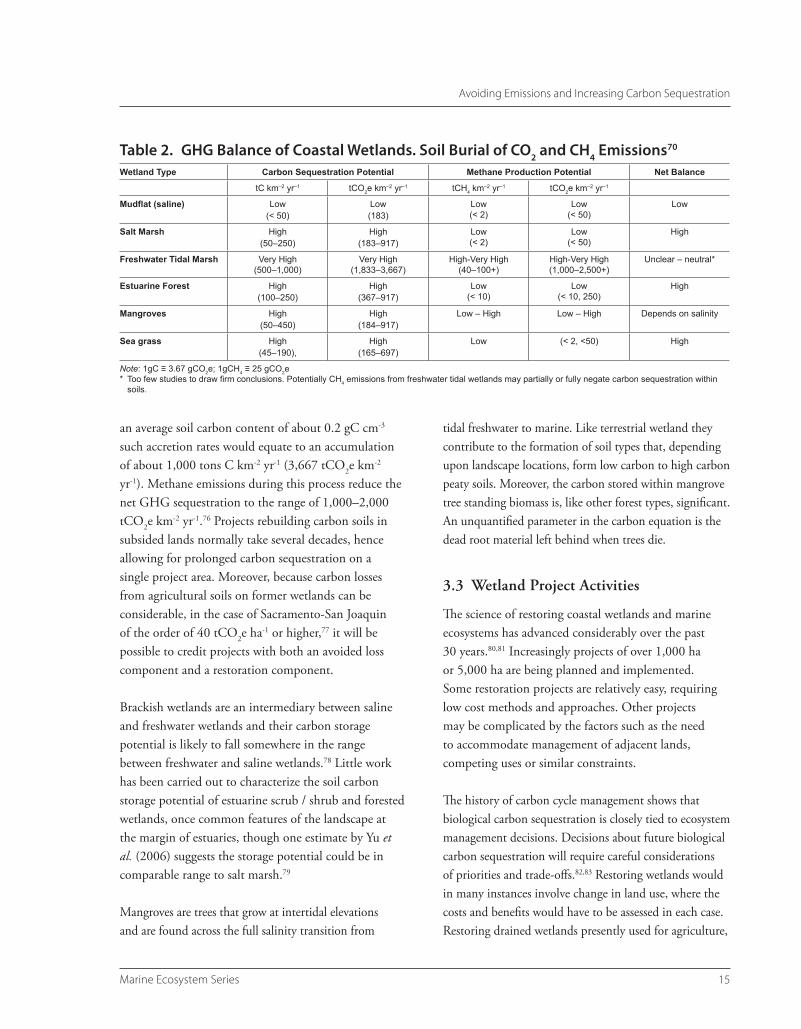
The capacity of coastal wetlands to accumulate carbon has been the focus of several review studies. Gathering together data from 154 marshes, mainly from the United States but also from overseas, Chmura et al. (2003) estimated that salt marshes and mangroves accumulated, on average 150–250 tons C km-2 yr-1 (550–917 g CO2e m-2 yr-1), though the range varied over an order of magnitude.68 In a similar summary assessment, Duarte et al., (2005) reviewed the contribution of vegetated and unvegetated coastal wetlands to carbon sinks in coastal areas and estimated that salt marshes, mangroves and sea grass areas store 151, 139 and 83 tons C km-2 yr-1 (554, 510, 304 tCO2e km-2 yr-1), respectively; while unvegetated areas of estuaries (mudflats) and the open continental shelf accumulate 45 and 17 tons C km-2 yr-1 (165 and 62 tCO2e km-2 yr-1) (Table 2).69
Carbon accumulation estimates range over two orders of magnitude, which reflect interactions between climate, vegetation type, salinity (a primary control of vegetation type), and soil type (capacity to store carbon in soils). Moving from the saline environment to freshwater tidal wetlands there is potential to accumulate over 500 tons C m-2 yr-1 (1,833 tCO2e km-2 yr-1), perhaps over 1000 tC km-2 yr-1 (3,667 tCO2e km-2 yr-1) on long-term restoration projects.71,72 It appears from the literature that organic matter accumulation is limited by salinity and has a maximum threshold;73 freshwater wetlands are able to accrete at rates greater than sea level rise, until an elevation threshold relative to water elevations is reached. Vegetation planting and simple water management can potentially quite rapidly

Environment Department Papers14
Mitigating Climate Change through Restoration and Management of Coastal Wetlands and Near-shore Marine Ecosystems
restore reeds swamps or freshwater tidal marshes on subsided land. For this reason restoring freshwater wetlands, during the interval of enhanced soil building, potentially offers higher capacity to store carbon than restoring saline wetlands, although methane emissions will need to be accounted for. However, coastal wetlands carbon sinks cannot be cost-effectively restored on managed systems behind levees, with the possible exception of rebuilding subsided freshwater tidal marshes by growing reed beds.
Managed freshwater wetlands (built on subsided former marsh areas) have through water management practices demonstrated the capacity to raise marsh surface at rates far in excess of rates of sea level rise. Experimentation by the USGS in the Sacramento – San Joaquin Delta has demonstrated that water management activities can halt ongoing carbon loss in formerly drained organic soils as well as help rebuild soils and their carbon stock. Now in its 13th year, the USGS study has documented marsh surface accumulation of over 4 cm yr-1.74,75 With
Figure 2. restoring a vegetated marsh Takes Time and SedimentThe time taken to restore a vegetated tidal wetland depends upon the degree to which the diked wetland has subsided due to drainage and the availability of mineral sediment to rebuilt mudflats to marsh colonization elevations. An exception to this model is areas where organic soils can be rebuilt using fast growing freshwater reeds. In all cases, with rising sea level the time to restore wetlands increases.
Notes: (a) Ambient sediment concentration of 250 mg/L (a) and (b) Mean monthly tide from Petaluma River Entrance rate of sea level rise = 5.67 mm/yr. Tide range approximately 6.1 ft, MLLW = 0.0 ft NAVD, MHHW = 6.1 ft NAVD. Source: MARSH98 Sedimentation Model, ESA PWA.
2.7 ft–1.3 ft 0.7 ftApproximate elevation of salt marsh vegetation colonization
4.7 ftMHHW
200 mg/L350 mg/L 300 mg/LApproximate elevation of salt marsh vegetation colonization
100 mg/L50 mg/L MHHW
A. Sedimentation curves for range of initial mudflat bed elevations
Time (years)
Elev
atio
n (ft
, NAV
D)
23
01
456
–2–1
87
50403020100
B. Sedimentation curves for range of suspended sediment concentrations
Time (years)
Elev
atio
n (ft
, NAV
D)
2
0
4
6
–4
–2
8
50454035302520151050
15Marine Ecosystem Series
Avoiding Emissions and Increasing Carbon Sequestration
an average soil carbon content of about 0.2 gC cm-3 such accretion rates would equate to an accumulation of about 1,000 tons C km-2 yr-1 (3,667 tCO2e km-2 yr-1). Methane emissions during this process reduce the net GHG sequestration to the range of 1,000–2,000 tCO2e km-2 yr-1.76 Projects rebuilding carbon soils in subsided lands normally take several decades, hence allowing for prolonged carbon sequestration on a single project area. Moreover, because carbon losses from agricultural soils on former wetlands can be considerable, in the case of Sacramento-San Joaquin of the order of 40 tCO2e ha-1 or higher,77 it will be possible to credit projects with both an avoided loss component and a restoration component.
Brackish wetlands are an intermediary between saline and freshwater wetlands and their carbon storage potential is likely to fall somewhere in the range between freshwater and saline wetlands.78 Little work has been carried out to characterize the soil carbon storage potential of estuarine scrub / shrub and forested wetlands, once common features of the landscape at the margin of estuaries, though one estimate by Yu et al. (2006) suggests the storage potential could be in comparable range to salt marsh.79
Mangroves are trees that grow at intertidal elevations and are found across the full salinity transition from
tidal freshwater to marine. Like terrestrial wetland they contribute to the formation of soil types that, depending upon landscape locations, form low carbon to high carbon peaty soils. Moreover, the carbon stored within mangrove tree standing biomass is, like other forest types, significant. An unquantified parameter in the carbon equation is the dead root material left behind when trees die.
3.3 wetland project activities
The science of restoring coastal wetlands and marine ecosystems has advanced considerably over the past 30 years.80,81 Increasingly projects of over 1,000 ha or 5,000 ha are being planned and implemented. Some restoration projects are relatively easy, requiring low cost methods and approaches. Other projects may be complicated by the factors such as the need to accommodate management of adjacent lands, competing uses or similar constraints.
The history of carbon cycle management shows that biological carbon sequestration is closely tied to ecosystem management decisions. Decisions about future biological carbon sequestration will require careful considerations of priorities and trade-offs.82,83 Restoring wetlands would in many instances involve change in land use, where the costs and benefits would have to be assessed in each case. Restoring drained wetlands presently used for agriculture,
Table 2. GHG balance of coastal wetlands. Soil burial of cO2 and cH4 Emissions70
Wetland Type Carbon Sequestration Potential Methane Production Potential Net Balance
tC km–2 yr–1 tCO2e km–2 yr–1 tCH4 km–2 yr–1 tCO2e km–2 yr–1
Mudflat (saline) Low(< 50)
Low(183)
Low (< 2)
Low (< 50)
Low
Salt Marsh High(50–250)
High(183–917)
Low (< 2)
Low (< 50)
High
Freshwater Tidal Marsh Very High (500–1,000)
Very High (1,833–3,667)
High-Very High (40–100+)
High-Very High (1,000–2,500+)
Unclear – neutral*
Estuarine Forest High(100–250)
High(367–917)
Low (< 10)
Low (< 10, 250)
High
Mangroves High(50–450)
High(184–917)
Low – High Low – High Depends on salinity
Sea grass High(45–190),
High(165–697)
Low (< 2, <50) High
Note: 1gC ≡ 3.67 gCO2e; 1gCH4 ≡ 25 gCO2e* Too few studies to draw firm conclusions. Potentially CH4 emissions from freshwater tidal wetlands may partially or fully negate carbon sequestration within
soils.
Environment Department Papers16
Mitigating Climate Change through Restoration and Management of Coastal Wetlands and Near-shore Marine Ecosystems
for example, could lead to reduction of food production. It is clear, however, that there are significant areas of drained wetlands where restoration would lead to an increase in net benefits, in some cases even if the climate benefits would not be counted.
Appropriate planning greatly enhances the potential success of a project. Unexpected failure of projects occurs primarily through inadequate planning (e.g. planting vegetation without understanding why vegetation is not already present or has died, or artificially maintaining inappropriate hydrological conditions). Providing a restoration site with a full tidal exchange offers the best opportunity for drawing in sediment and establishing a healthy vegetation cover. Vegetation vigour, and carbon production in soils will be reduced on sites where tidal hydrology is impaired.84
Human activities that positively influence wetlands and their carbon stocks fall into four potential categoriesg (definitions based upon a position paper by the Society of Wetlands Scientists on Restoration,85 and placed into a context for project activities for a carbon offset by wetland restoration and management context by PWA and SAIC, 2009):
• Avoided Emissions and Wetland Loss – Conserv-ing a wetland that would otherwise be converted to a non-wetland. This includes actions to protect existing coastal wetlands and marine ecosystems, especially primary/intact systems, including those that face no immediate threat from loss and degradation but could in future be subject to land use pressures created by national and international leakage. This is particularly pertinent to high coastal wetland distribution and currently low deforestation/degradation rate countries. See chapter 4.2 on expected future loss and degrada-tion of these areas.
• Wetland Restoration – Actions taken in a converted or degraded natural wetland that result in the reestablishment of ecological processes, functions, and biotic/abiotic linkages and leads to
a persistent resilient system integrated within the landscape. Restoration activities mean landscape-scale restoration that significantly increases and maintains carbon stocks and results in healthy resilient ecosystems that provide the multiple goods and services people need, maintain biodiver-sity and enhance ecological integrity.
• Wetland carbon enhancement – Increasing one or more of the functions performed by an existing wet-land beyond what currently or previously exists/ed in the wetland. This is pertinent to managed wetlands where practices such as adjusted water management can increase carbon pools and or reduce GHG emissions. In natural wetlands actions should not be considered enhancement if they reduce other ecological functions and values (e.g. by introducing non native species or alter natural drainage).
• Wetland Creation – Converting land from another non-wetland to a wetland where there was previously no wetland in existence.
As discussed in more detail in Chapter 5, there seems to be a discrepancy between definitions used by wetland managers and restoration practitioners to describe wetland management activities and those definitions used within the wider context of the climate convention as well as carbon markets. There is a need to address these differences to allow for congruent development of practical management activities linked and driven in part by international policy, accounting and financial mechanisms.
3.4 Co-benefits of managing coastal wetlands and marine ecosystems for Climate Change mitigation
Apart from their role in the carbon cycle, healthy coastal wetlands and marine ecosystems underpin
g The RAE Blue Ribbon Panel identified the need for clarification on project activity definitions and how each related to baseline determination.

17Marine Ecosystem Series
Avoiding Emissions and Increasing Carbon Sequestration
society and economy, livelihoods and food security through the services they provide (Table 3).
Mangroves act as natural barriers, serving as a first defence from storm surges, stabilizing shorelines and reducing risk to coastal communities.86,87,88 Seagrass meadows contribute to reducing shoreline erosion by trapping suspended sediments in their root systems.89 Coastal wetland and marine ecosystems absorb pollutants such as heavy metals as well as nutrients, suspended matter and pathogens, thus helping to maintain water quality and prevent eutrophication and the development of dead zones.90 Their variety of habitat supports high biological diversity and productivity, including nursery, spawning and feeding habitats as well as shelter for numerous commercial species.91 Healthy and well functioning coastal wetlands and marine ecosystems are highly important for around 15% of the world’s population relying on fish as their main or sole source of animal protein92 and in particularly coastal communities in developing countries. Fisheries and related industries provide direct employment to over 38 million people.93 Healthy coastal wetlands and marine ecosystems and also provide a variety of recreational opportunities such as snorkelling, recreational fishing and boating, and coastal ecotourism is one of the fastest growing sectors.
Managing and protecting coastal wetlands and marine ecosystems for their carbon value will generate significant co-benefits by reducing degradation and promoting the restoration and sustainable management of coastal wetlands and marine ecosystems. This reinforces socio-ecological resilience and reduces vulnerability to climate change impacts. Nature-based mitigation in coastal areas thus in many ways contributes to and strengthens Ecosystem-based Adaptation (EbA).94,95
Table 3. Ecosystem Services of coastal and marine EcosystemsEcosystem Services Coastal and Marine Environments
Regulating Coastline protection from natural hazardsSoil and beach erosion regulationLand stabilizationClimate regulation e.g. carbon sequestrationWater quality maintenance
Provisioning Subsistence and commercial fisheriesAquacultureMedicinal productsBuilding materialsFuel woodOrnaments e.g. jewellery, decoration
Cultural TourismRecreationSpiritual i.e. Sacred and heritage sitesAesthetic appreciation
Supporting Nutrient recyclingNursery habitatsBiodiversity
(Modified from UNEP-WCMC, 2006)


19Marine Ecosystem Series
4Status and Trends of Coastal Wetlands and Near-Shore Marine Ecosystems
4.1.2 Seagrass meadows
Seagrass coverage is estimated to exceed 177,000 km2
globally.102 Since the 19th century, the global coverage of seagrass beds has declined by 29%, and the rate of loss is estimated to have increased by an order of magnitude in the past 40 years (Waycott et al 2009).103 In the South China Sea region, Indonesia has lost 30–40% of its seagrass beds, with almost 60% loss in Java. Thailand has lost 20–30% of seagrass areas whereas the Philippines have lost 30–50%.104 In the United States, historical seagrass cover has halved in Tampa Bay and 90% has been lost from Galveston Bay.105 Loss of seagrasses over the last five decades ranges from 20% to 100% for most estuaries in the northern Gulf of Mexico, with only a few areas experiencing increases.106
4.1.3 Salt marshes and freshwater tidal marshes
Salt marshes and freshwater tidal marshes have lost a quarter of their historical global coverage107 with a current rate of loss estimated at 1–2% per year. In southeast Australia, the loss of salt marshes from estuaries is about 30% of their original area.108 In northern Europe over 5,000 km2 of wetlands have been drained.109 The diked coastal floodplain of the United States is about 50,000 km2 in size110, much of which would have been coastal wetlands.111 Rates of wetlands loss in the U.S. and EU slowed dramatically with the establishment of enforced protective legislation. Between 1950 and 1995, 22,000 km2 of salt marshes and mangroves of mangroves were diked in China;112,113 it is unclear what area of wetland remains.
As highlighted in the previous chapter, adequate management strategies for coastal wetlands and near-shore marine ecosystems provide for avoided emissions and increased carbon
sequestration. However many of these ecosystems are disappearing at alarming rates. This chapter provides an overview of current global trends.
4.1 Historical extent of Coastal wetland and marine ecosystems and loss to Date
4.1.1 mangroves
Mangroves, found in 123 countries, currently cover about 150,000 km².96 Available data on historical and current mangrove distribution shows that its worldwide occurrence has been dramatically reduced, at least by a quarter but probably much more.97,98 Between 1980 and 2005 35,000 km² of mangroves, representing one-fifth of the world’s cover, was lost.99
The rate of mangrove decline was the highest during the 1980s, at an average of 1,850 km2 per year. The rate then dropped to 1,185 km2 in the 1990s and from 2000–2005, it was 1,020 km2 per year.100 Although worldwide degradation of mangroves seems to be slowing (see table 4), the rate is still high notably in Asia, which holds a large proportion of the world’s remaining mangroves (e.g. Indonesia has 21% of the global mangrove cover). Overall the rate of loss is high in comparison to other habitats—mangrove forests continue to vanish at a rate 3–4 times higher than forests on land.101

Environment Department Papers20
Mitigating Climate Change through Restoration and Management of Coastal Wetlands and Near-shore Marine Ecosystems
The artificial draining of coastal wetlands leads to an accumulation of sulphuric acid, iron and aluminium and the development of acid sulphate soils.114 This has a number of implications, including causing changes in water quality and increasing the risk of algal blooms, negatively affecting agriculture and aquaculture.
4.2 Drivers of Coastal wetland and marine ecosystem loss
Many factors lead to the loss of coastal wetlands and near-shore marine ecosystems, with anthropogenic causes are the main drivers of change. Having been at the centre of human development for millennia, coastal wetlands are at risk globally from urban, industrial and agricultural expansion and development. Sixty percent of the world’s 39 largest metropolises are located in coastal areas, including 12 cities with populations of more than 10 million people.115 To cope with high population growth and rapid urban development, coastal wetlands are often modified to allow for extended food production and advanced infrastructure development including housing, transportation and industry.116, 117
The loss of coastal wetlands is caused by draining, dredging, landfill as well as sediment diversion and hydraulic alteration. Damming projects, for example, have changed water flows and affected sediment delivery to river mouths and deltas, with recent estimates showing a 30% global reduction of sediment delivery to coastal areas, impacting 47% of a rivers.118,119 Many large deltas are under threat from such disruption of sediment supply, some with almost total sediment starvation, leaving habitats and human infrastructure vulnerable to inundation and rising sea level.120
Other drivers of the degradation and loss of marine ecosystems include the expansion of coastal
aquaculture,121 overfishing and destructive fishing methods122 and, most recently, climate change.123 Most seagrass habitats are lost due to degrading water quality primarily caused by high nutrient runoff and sediment loadings.124 Direct damage from vessels, dredging and trawling also greatly affect many seagrass habitats.125
The loss and degradation of these ecosystems not only contribute to climate change through increased carbon emissions and deterioration of critical carbon sinks, but also leads to an erosion of the many ecosystem services on which society depends.
4.3 expected future loss and Degradation
Models suggest that future coastal wetland loss through sea-level rise will reach 5–20% by 2080s,126 while urban development will continue to pressure wetlands from land. One study predicts that by 2050 91% of the world’s coastlines will have been impacted by development.127 The Global Biodiversity Outlook128 suggests that this ‘coastal squeeze’ may cause coastal wetland systems to be reduced to narrow fringes by 2100, or be entirely lost locally.129,130 This will increasingly put coastal communities and livelihoods at risk from marine hazards.
Southeast Asia (notably Indonesia and Thailand, Borneo and Sumatra), India, Bangladesh and West Africa are of particular concern. With rapid population growth, limited land for agricultural and urban expansion and difficulties in controlling coastal development, the loss of wetlands in this regions is projected to continue at a relatively fast pace, leading to release of centuries to millennia of accumulated carbon in a few decades.

21Marine Ecosystem Series
5Policy Reform to Reduce Emissions and Enhance Coastal Carbon Stocks
financing management and restoration of coastal wetlands and near-shore marine ecosystems for climate change mitigation.
5.1 Opportunities for Developing Countries
The UNFCCC, in Art 4.1(d), calls on all Parties to promote sustainable management, conservation and enhancement of GHG sinks and reservoirs in the oceans as well as coastal and marine ecosystems. The Copenhagen Accord states that mitigation actions of Non-Annex I Parties should be consistent with Art. 4.1 of the Convention.
Taking into account Parties’ common but differentiated responsibilities and their specific national and regional development priorities, objectives and circumstances (Art 4.1), opportunities exist for developing countries to advance and finance sustainable management, conservation and enhancement of GHG sinks and reservoirs in coastal wetlands and marine ecosystems.
5.1.1 Extending REDD+ to coastal Ecosystems
After several years of negotiations Parties agreed at COP16 to a set of policy approaches and positive
The concept of working with nature to reduce GHG emissions—or using ecosystem-based mitigation to progress overall climate change mitigation strategies— is not new within the
climate change convention. The UNFCCC as well as the Kyoto Protocol refer repeatedly to emissions by sources and removals by sinks in natural systems. However, there are few incentives for coastal wetlands and near-shore marine ecosystems restoration or disincentives to drain or damage these systems. Despite providing a provision to take action on coastal and marine ecosystems in Art 4.1(d),h most of the definitions used throughout the Convention and in related reports (e.g. by IPCC) do not appear construed with the coastal and marine realm in mind.
Lessons learned from the forest sector indicate that initial efforts to achieve international action on deforestation within the UNFCCC failed due to weak carbon accounting methodologies available at the time. Similarly, limited knowledge about the potential of coastal wetlands and near-shore marine ecosystems for climate change mitigation and lack of applicable carbon accounting methodologies has hampered progress so far. However, the scientific methods necessary to quantify, measure, and monitor carbon sequestration and GHG flux from coastal wetlands are achievable within existing science.131 The available technology132 needs to be fully deployed in a coherent and programmatic global data gathering and assessment process.
This section reviews opportunities for addressing the current gaps in UNFCCC processes based on the Cancun Agreements and touches on possibilities for
h UNFCCC Article 4.1(d): Promote sustainable management, and promote and cooperate in the conservation and enhancement, as appropriate, of sinks and reservoirs of all greenhouse gases not controlled by the Montreal Protocol, including biomass, forests and oceans as well as other terrestrial, coastal and marine ecosystems.

Environment Department Papers22
Mitigating Climate Change through Restoration and Management of Coastal Wetlands and Near-shore Marine Ecosystems
incentives on issues relating to reducing emissions from deforestation and forest degradation in developing countries; and the role of conservation, sustainable management of forests and enhancement of forest carbon stocks in developing countries; also known as REDD+.133
Developing countries are reporting their emission estimates under REDD+ based on the IPCC guidelines and guidance on Agriculture, Forestry and Other Land Use (AFOLU) (see chapter 5.4). These guidelines and guidance define five carbon pools: aboveground biomass, belowground biomass, dead wood, litter and soil organic matter. However, estimates from soil carbon are mostly not reported on in REDD+ assessments.134
When using IPCC guidelines certain carbon pools may be omitted from reports if countries are able to demonstrate that there are no emissions deriving from these pools. Emissions from soil carbon are however likely to be significant in the case of mangrove loss or degradation. Incomplete REDD+ estimates are currently due to a lack of reliable data and incomplete methodological guidance from the IPCC. Additional methodological guidance from the IPCC on soil carbon is thus needed for countries to undertake complete assessments of all carbon pools and to provide more accurate estimates of the reduction of emissions by avoiding deforestation and forest degradation in mangroves and other forested areas.
Developing countries will, in general, need additional guidance and support in order to make full use of the opportunities of REDD+ in coastal areas. Support could include relevant technical and technological expertise enabling inclusion of mangroves in REDD+ activities as agreed by the COP, such as the development of a national strategy or action plan, a national forest reference level and a robust and transparent national forest monitoring system, and ensuring that the necessary environmental and social safeguards, as lined out in Annex I to the REDD+ agreement, are adhered to.
The UNFCCC Subsidiary Body for Scientific and Technological Advice (SBSTA)135 should also consider including mangroves in its work programme, as outlined in Annex II to the REDD+ agreement. SBSTA could for example identify land use, land-use change and forestry activities that are linked to mangrove deforestation and degradation, identify methodological constraints to and approaches for estimating emissions and removals resulting from these activities. SBSTA could further develop, as necessary, modalities for measuring, reporting and verifying anthropogenic, mangrove forest-related emissions by sources and removals by sinks; and similarly for mangrove forest carbon stock and mangrove forest area changes resulting from the implementation of activities, consistent with any guidance for measuring, reporting and verification of nationally appropriate mitigation actions by developing country Parties.
5.1.2 Development of new financial mechanisms
The largest carbon deposits in coastal wetlands and near-shore marine ecosystems are found in below-ground biomass and sediment. However, existing financing mechanisms (such as REDD+) and the methodological guidance they build upon (IPCC), are currently ill equipped to comprehensively account for the soil organic carbon pool. This is making them inapplicable for most coastal wetlands and near-shore marine ecosystems.
While extending REDD+ to non-forested areas may with time be possible, its structure and procedures could serve as an inspiration or model for development of international and national financing mechanisms that incentivize policy and management measures for reducing GHG emissions from coastal carbon stocks and promote sequestration through conservation and restoration. Any such mechanism should address the drivers of loss and degradation as well as account for displacement of practices that would transfer GHG emissions to outside the project boundary (leakage).

23Marine Ecosystem Series
Policy Reform to Reduce Emissions and Enhance Coastal Carbon Stocks
It should also follow the principle of environmental integrity and ensure that environmental and social safeguards are put in place (e.g. safeguard against restoration of ecosystems with non-native species).
Few studies have been conducted so far on the economic feasibility and viability of introducing coastal wetland management projects into carbon markets. Existing information indicates that current carbon prices could outweigh the opportunity costs of other land-uses, such as low and average income shrimp farming.136,137 While it is clear that carbon emissions from drained coastal wetlands are sufficiently significant as to warrant prioritized actions to bring them into financial offsetting mechanisms, it is unclear whether near-shore marine ecosystems such as seagrass beds will be immediately attractive to financial markets. This is because the magnitude and fate of carbon released from seagrass soils are poorly understood, calling for quantitative assessment of the carbon balance in these habitats and field methods to ground truth CO2 capture at specific sites. Even without this information, however, improved management would slow or reverse ongoing emissions and loss of sequestration capacity.138 Furthermore, there may be some scope for including biodiversity premiums for conservation of these habitats which are critical to charismatic species like sea turtles, manatees, and other fauna, in addition to serving as feeding grounds for commercially and ecologically important fish species.
5.1.3 national Appropriate mitigation Actions
The Bali Action Plan identified National Appropriate Mitigation Actions (NAMAs) as a means for developing countries to enhance GHG emissions reduction required to achieve the main objective of the Convention. The Cancun Agreements now provide an initial framework and guidance for developing countries wishing to implement and seek international financial support for NAMAs.
Developing countries could seize the opportunity to define coastal wetland and seagrass focused avoided
emissions or restoration projects. Such projects could contribute to a country’s mitigation portfolio, while supporting low-carbon economies and sustainable development pathways. Initiating projects as self-financed NAMAs, or as pilot initiatives within research activities, could contribute to the development of more robust accounting methodologies. This would, in the longer-term, help move towards financially supported NAMAs with international monitoring, reporting and verification mechanisms in place, and eventually towards a sector-wide financial mechanism.
5.2 Opportunities for Developed Countries
5.2.1 Accounting for coastal wetlands under LULUcf
The Kyoto Protocol contains provisions for Annex I Parties to adopt national policies and take measures to limit their anthropogenic emissions of GHGs and protect and enhance their GHGs sinks and reservoirs (Art. 2.1(a)). Parties to the Kyoto Protocol have to account for the net changes in GHG emissions by sources and removals by sinks resulting from direct human-induced land-use change and forestry activities, limited to afforestation, reforestation and deforestation (Art. 3.3). Additionally, under Article 3.4, Parties may account for additional human-induced activities related to land use, land-use change and forestry (LULUCF) specifically, forest management, cropland management, grazing land management and revegetation. When LULUCF activities under Articles 3.3 and 3.4 result in a net removal of GHGs, an Annex I Party can issue removal units (RMUs) on the basis of these activities as part of meeting its commitment under Article 3.1. These units may be traded pursuant to the Kyoto’s emissions trading scheme established under Article 17.
GHG emissions by sources and removals by sinks in coastal and near-shore marine ecosystems resulting from human activities were not included in the Protocol’s provisions and mechanisms of the first commitment period. The rules and approaches governing LULUCF

Environment Department Papers24
Mitigating Climate Change through Restoration and Management of Coastal Wetlands and Near-shore Marine Ecosystems
and the inclusion of additional activities eligible in the second commitment period are still being renegotiated under the Bali Action Plan. For the time being “Rewetting and drainage’”is included in brackets in the KP negotiation text.139
“Rewetting and drainage is a system of practices for rewetting and draining on land with organic soil that covers a minimum area of 1 hectare. The activity applies to all lands that have been drained and/or rewetted since 1990 and that are not accounted for under any other activity as defined in this annex, where drainage is the direct human induced lowering of the soil water table and rewetting is the direct human-induced partial or total reversal of drainage”;
This definition is much narrower than definitions of other wetland management activities Parties have discussed during the course of negotiations concerning a second commitment period of the Kyoto Protocol.140 However, “Rewetting and drainage” as described in this definition could apply to drained coastal wetlands, a change from the current definition of LULUCF, which is very terrestrially orientated. Parties are encouraged to accept “rewetting and drainage” as an activity under LULUCF and construe the definition not only towards terrestrial wetlands but also towards the management of coastal wetlands as well.
The current KP draft proposal by the Chair141 refers to revegetation as
“… a direct human-induced activity to increase carbon stocks on sites through the establishment of vegetation that covers a minimum area of 0.05 hectares and does not meet the definitions of afforestation and reforestation contained here. It includes direct human-induced activities related to emissions of greenhouse gas and/or decreases in carbon stocks on sites which have been categorized as revegetation areas and do not meet the definition of deforestation.”
This definition of “revegetation” does not seem to have been developed with the coastal and near-shore marine realm in mind. However, revegetation in coastal and near-shore marine ecosystems through natural recruitment of vegetation or active planting should be eligible under this definition.
Given the potential overlap between “rewetting and drainage” and “revegetation” in a coastal and near-shore marine context, relevant bodies under the UNFCCC (e.g. SBSTA) as well as other relevant technical bodies such as the IPCC could be requested to identify and, as soon as possible, address the issue of overlapping definitions within the Convention. This could also be done with respect to the divergence of definitions related to coastal wetlands, wetland and marine management as used by UNFCCC and other multilateral environmental agreements and the scientific community.i
The above definitions offer an opportunity to work towards more comprehensive accounting under the Kyoto Protocol, also considering ecosystems in the coastal and near-shore marine realms. However, as mentioned above, all in all the Kyoto Protocol presently falls short of providing appropriate incentives to achieve the goal of protecting and enhancing all natural sinks and reservoirs of GHGs. It deals with only a limited range of land—and seascapes and does not fully embrace a variety of natural sinks and reservoirs.
Including new human activities into the LULUCF accounting system under the Kyoto Protocol is, however not without problems. Using LULUCF activities to meet emission reduction obligations is under scrutiny due to accounting loopholes—LULUCF has by some standards become a means for developed countries to undermine the accuracy of reports against emission reduction targets. It is feared that currently proposed revisions of LULUCF
i e.g. RAE Action Plan.

25Marine Ecosystem Series
Policy Reform to Reduce Emissions and Enhance Coastal Carbon Stocks
rules could allow for unaccounted GHG emissions from developed countries. Adding new activities into the LULUCF accounting system thus bears the risk of endangering the integrity of a mitigation system by including further opportunities for miscounting GHG emissions and sinks. LULUCF rules should not lead to a decrease in the level of ambition of Annex I countries to reduce GHG emissions from other sectors and should be as tight as possible to ensure environmental integrity. If, however, strong safeguards e.g. on restoration practices are put in place, LULUCF could become an important means for the protection and enhanced management of coastal wetlands as carbon reservoirs.142 It would therefore be desirable to move towards a more comprehensive accounting system.143,144
To include coastal wetlands and near-shore marine ecosystems more prominently into the LULUCF accounting system it is recommendable that Parties work with the IPCC to revise existing methodologies for estimating anthropogenic GHG emissions by sources and removals by sinks resulting from LULUCF activities, and develop supplementary methodologies as necessary. Broadening the focus and including coastal wetlands and near-shore marine ecosystems in the Kyoto Protocol accounting system would also be beneficial to activities beyond the Annex I framework (e.g. NAMAs).
5.2.2 coastal wetland management as cDm projects
The Clean Development Mechanism (CDM) makes provisions for the implementation of LULUCF project activities by Annex I Parties. CDM allows Annex I countries to invest in GHG reduction projects in developing (non-Annex I) countries and have the credits count toward their emission reduction targets. LULUCF related CDM projects are presently limited to implementation projects involving afforestation and reforestation and do not cover coastal wetlands or near-shore marine ecosystems.
Coastal wetland restoration and maintenance projects, for example, have great potential to promote mitigation while also providing co-benefits such as livelihood support and shoreline protection. Notably, sustainable development is one of the core objectives of the CDM.
The Ad-hoc Working Group on the Kyoto Protocol (AWG-KP) currently considers whether SBSTA should initiate a work programme to consider, develop and recommend modalities and procedures for possible additional LULUCF activities under CDM. LULUCF activities eligible under the CDM are closely linked to LULCUF activities listed under Art. 3.3 and 3.4 of the KP. If ‘rewetting and drainage’ should not be included under Art. 3.4 it is unlikely that SBSTA would include this activity into its work plan. In current and future discussions regarding revision of LULUCF activities under a follow-up agreement to the Kyoto Protocol a broadening of the spectrum of activities to also include the coastal and near-shore marine areas seems warranted.
5.3 expanding UnfCCC reporting requirements
5.3.1 coastal wetlands and national communications
All Parties to the UNFCCC are required to submit national reports on the implementation of the Convention to the Conference of the Parties (COP) (UNFCCC Art. 4.1 and 12). Emissions and removals of GHGs are central in these national communication reports, although reporting requirements differ between Annex I and non-Annex I countries (see reporting requirements Annex I in Chapter 8.3.1).
The current reporting framework does not include a complete or up-to-date assessment of GHG emissions, goals, mitigation actions and their effects.145 Negotiations indicate that current reporting guidelines for national communications are to be revised. Modified national reports could provide a better and

Environment Department Papers26
Mitigating Climate Change through Restoration and Management of Coastal Wetlands and Near-shore Marine Ecosystems
more comprehensive way of assessing national and international progress towards the objectives of the Convention and help to identify where such progress could be strengthened.146
5.3.2 coastal wetlands and national GHG inventories
Annex I Parties to the Convention are required to submit to the UNFCCC secretariat national GHG inventories of anthropogenic emissions by sources and removals by sinks of GHGs not controlled by the Montreal Protocol. These inventories are coupled with requirements and decisions under the Kyoto Protocol and are subject to UNFCCC reporting guidelines.j The methodological elements of the guidelines, based on IPCC Good Practice Guidance (GPG) for Land use, Land-use Change and Forestry (IPCC GPG for LULUCF, 2004)147 are currently under revision by SBSTA,148 to address methodological issues related to reporting on emissions by sources and removals by sinks contained within the 2006 IPCC Guidelines for National Greenhouse Gas Inventories with Volume 4 Agriculture, Forestry and Other Land Use (IPCC GHGI for AFOLU).149 The process may provide an opportunity to also consider coastal wetlands in national GHG reporting.150
5.4 IpCC Guidance and Guidelines
The IPCC provides scientific, technical and methodological advice to the UNFCCC and has prepared guidelines that cover several aspects of GHG accounting. This includes the 2004 IPCC Good Practice Guidance for Land use, Land-use Change and Forestry (IPCC GPG for LULUCF),151 which provides guidance for measurement, estimation, assessment of uncertainties, monitoring and reporting of net carbon stock changes and anthropogenic GHG emissions by sources and removals by sinks in the LULUCF sector.
The 2006 IPCC Guidelines for National Greenhouse Gas Inventories Volume 4 Agriculture, Forestry and Other Land
Use (IPCC GHGI for AFOLU)152 provides technical guidance on estimating and reporting GHG emissions and removals through a Tiered approach, with increasing level of detail and accuracy for each Tier. Tier 1 and 2 methods include soil organic stocks for mineral soils to a default depth of 30cm, with Tier 2 enabling inclusion of greater depths if data are available. Residue/litter carbon stocks are not included; these are measured separately by estimating dead organic matter stocks. Stock changes in organic soils are estimated as annual loss of organic carbon throughout the profile due to drainage. Tier 3 methods can be used to refine estimates of the carbon stock changes in mineral and organic soils and soil inorganic carbon pools. Inventory classifications are based on land use areas that are stratified by climate regions and default soil types (for default classifications see IPCC GHGI for AFOLU Chapter 3, Annex 3A.5).
The complexity of incorporating wetlands management practices in national GHG inventories is recognized in Chapter 7 of the IPCC GHGI for AFOLU. Due to the limited number of published studies, the guidance on estimating and reporting emissions from managed wetlands is focused on a restricted set of terrestrial wetland, specifically peatlands and flooded lands.k Coastal wetlands do include soils that could fall under technical guidance for rewetting of peatland soils, and technical guidance provided in IPCC GHGI for AFOLU may be applied e.g.:
• Technical guidance on accounting for soil carbon change within Generic Methodologies Applicable to Multiple Land-Use Categories (Chapter 2)153
• Technical guidance on reporting loss of soil carbon with land use conversion croplands from wetlands (Chapter 4)154
j “Guidelines for the preparation of national communications by Parties included in Annex I to the Convention, Part I: UNFCCC reporting guidelines on annual inventories”.k Guidelines are also provided for quantifying emissions of crop lands, seasonally flooded agricultural land, managed grasslands, managed forests including drained forest wetlands, and rice cultivation.

27Marine Ecosystem Series
Policy Reform to Reduce Emissions and Enhance Coastal Carbon Stocks
• Technical guidance on reporting GHG emissions from managed wetlands (Chapter 7)155
For example, the guidance in Chapter 2 related to soil organic carbon stock changes of mineral soils and CO2 emissions from organic soils due to enhanced microbial decomposition associated with land use activities enables accounting for the significant GHG emissions to the atmosphere arising from oxidation of soil carbon in drained coastal wetlands.
However, while the technical guidance in principle provides a foundation to account for carbon losses through drainage of wetland soils, including coastal wetlands, this is challenged by limited availability of datasets that would enable analysis at either Tier 1, 2 or 3. Appropriate data collection programmes are required to quantify soil carbon emissions for each wetland type and setting. Further, it should also be noted that the default depth of 30 cm for soil carbon content estimation is not suitable for coastal wetlands, where drainage can occur to a depth of a meter or more, leading to carbon loss to a great depth in the soil profile.l Marine ecosystems such as seagrass meadows are presently not covered by existing IPCC guidance for accounting and reporting.
Revision of current IPCC guidance and guidelines and the development of supplementary methodologies for estimating GHG emissions by sources and removals by sinks resulting from coastal wetland management are highly desirable. This would, however, require clarification and alignment of definitions used to describe types of wetlands as well as management actions and project activities, within the international
climate change policy framework as well as in the science community and among practitioners working on ecological restoration and management of coastal wetlands. Such deliberations should also assess how marine ecosystems such as seagrass meadows and, eventually, other oceanic systems, will fit into IPCC and UNFCCC definitions and categories.
Reliable and accurate quantification and monitoring of carbon sequestration in and GHG emissions from coastal wetlands are achievable within available technology and existing science.156,157 The challenge is to develop scientific approaches and make available protocols and methodologies, the application of which does not incur prohibitive costs. Over recent years, GHG budgets have been quantified in a number of locations and for a variety of coastal wetland types through research (e.g. Chmura, et al., 2003;158 Nelleman et al, 2009;159 Laffoley and Grimsditch, 2009;160 PWA and SAIC, 2009.161 See also Table 2). A Blue Ribbon Panel in the USA has developed a programmatic Action Plan to deliver a GHG offset protocol for tidal wetlands,162 including establishment of working groups to tackle questions related to definitions of project activities, eligibility, quantification, and permanence. A proposal to include a methodology for peat rewetting (applicable in coastal areas) has been released by the Voluntary Carbon Standards.163 A draft methodology for quantifying GHG “Afforestation and reforestation of degraded tidal forest habitats” has been submitted to the CDM board for consideration.
While this provides ample material to draw upon, and the current process for revision and updating of IPCC documents offer an opportunity to address their apparent gaps with respect to coastal wetlands and marine ecosystem, a regular process needs to be established for incorporating the findings from the growing body of scientific and methodological information on carbon pools and flux in coastal wetlands as well as coastal and open-ocean ecosystems. Notably, additional work by the IPCC
l Modeling of soil carbon dynamics within salt marshes is currently underway in the US by the NCEAS Working Group developing a tidal wetlands carbon sequestration and greenhouse gas emissions modeling. Model development is currently in calibration for case studies on the east, west and gulf coast of the United States. This model will be applicable to tidal wetlands internationally, potentially including mangrove soils. http://www.nceas.ucsb.edu/projects/12503.

Environment Department Papers28
Mitigating Climate Change through Restoration and Management of Coastal Wetlands and Near-shore Marine Ecosystems
on supplementary methodology will be beneficial for any nature-based mitigation actions taken under the Convention. It is likely to have spillover effects on how coastal wetlands and marine ecosystems will be dealt with through other mechanisms, e.g. NAMAs and the MRV system.
5.5 Coordinated action
Future action by the IPCC, UNFCCC SBSTA, individual countries and organizations would greatly benefit from a coordinated effort bringing together experts in coastal wetland and marine ecosystem science and management, GHG accounting, carbon offset protocols and markets as well as international climate change policy. Such a grouping could help
develop and review progress towards implementation of an agenda encompassing science, economics and policy. By informing international and national climate change policy processes it would support long-term and far-ranging action on coastal wetlands and marine ecosystems for climate change mitigation. It would also offer a platform for bringing together and discussing findings of relevant ongoing international and national activities, such as the establishment of a GHG offset methodology for rewetting and conserving peat.164 The Restore America’s Estuaries National Blue Ribbon Panel action plan to establish an offsets protocol for temperate tidal wetlands165 is an example of such a coordinated initiative (see Annex 1 for detailed list of current activities).
29Marine Ecosystem Series
6 Conclusions and Recommendations
Coastal wetlands and near-shore marine ecosystems hold vast stores of carbon. Occupying only 2% of seabed area, vegetated wetlands represent 50% of carbon transfer from oceans
to sediments. This carbon can remain stored for millennia. Drainage of coastal peatlands, forested tidal wetlands, tidal freshwater wetlands, salt marsh and mangroves emits large amounts of CO2 directly to the atmosphere, and also leads to decreased carbon sequestration. Ongoing degradation and conversion of coastal ecosystems and associated emissions and lost sequestration are currently not recognized as a significant driver of climate change, nor mitigated.
Carbon emissions from drained coastal wetlands are sufficiently significant to warrant inclusion in carbon accounting and inventories, development of financial incentive mechanisms, and amendment of national and international policy frameworks to reduce loss of these ecosystems. While further work is needed to identify the magnitude of emissions from near-shore marine ecosystems such as seagrass beds, it is clear that improved management of these ecosystems would slow or reverse current loss of carbon sequestration capacity. Sustainable management of coastal wetlands and near-shore marine ecosystems also offer a wide range of co-benefits, including shoreline protection, nutrient cycling, water quality maintenance, flood control, habitat for birds, other wildlife and harvestable resources such as fish. Together, these increase the resilience of coupled ecological and social systems to the impacts of climate change.
Advancing nature-based mitigation using coastal wetlands and marine ecosystems requires a range of priority actions, including:
1. Additional research into and quantification of carbon sequestration and storage in and GHG emissions from key ecosystems, with a focus on poorly researched ecosystems and their mitigation potential (e.g. sea grass beds);
2. Continued development of carbon flux and carbon accounting methodologies (e.g. baseline data, monitoring and verification approaches) for coastal wetlands and near-shore marine ecosystems;
3. Establishment of a network of projects to demon-strate proof-of-concept that coastal wetlands are eligible under GHG mitigation and accounting approaches;
4. Evaluation and development of financial incen-tive mechanisms including carbon offset trade, also addressing issues such as project eligibility, additionally and permanence;
5. Socioeconomic analysis of coastal and near-shore marine carbon projects, including impacts on local communities, livelihoods and industries;
6. Research into how different restoration and management approaches influence carbon flux in coastal and near-shore marine ecosystems;
7. Expansion of scientific understanding of large-scale GHG pathways through oceanic systems, and exploration of policy frameworks to account for GHG regulation functions of ocean systems and incentives for securing these.

Environment Department Papers30
Mitigating Climate Change through Restoration and Management of Coastal Wetlands and Near-shore Marine Ecosystems
However, several opportunities exist to shape policies, develop financial incentives and apply carbon management activities in the coastal realm in the near to medium-term. The following actions should be considered:
8. Include mangrove conservation and restoration activities (including projects, capacity-building etc.) in national REDD+ strategies, policies and measures;
9. Identify conservation and management actions for coastal wetlands and near-shore marine ecosystems as components of developing countries’ National Appropriate Mitigation Actions (NAMAs);
10. Explore opportunities to develop a financial, pos-sibly REDD-like, approach for coastal wetlands and near-shore marine ecosystems that fall outside exist-ing agreements and mechanisms, with a focus on providing financial incentives for soil-based carbon storage and sequestration. This will require thorough economic analysis and feasibility assessment.
11. Define ‘rewetting and drainage ’ as an activity under LULUCF that encompasses both coastal and terrestrial wetlands in a second commitment period of the Kyoto Protocol;
12. Expand the SBSTA work programme to address possible additional LULUCF activities under the CDM, including modalities and procedures for more comprehensive accounting of anthropogenic emissions from sources and removals by sinks in coastal and near-shore marine ecosystems;
13. Harmonize currently used definitions and catego-ries of activities as recognized under IPCC and UNFCCC, as well as used in the science com-munity and in relation to ecological restoration and management of coastal wetlands and marine ecosystems;
14. Revise the national climate change mitigation reporting process to also include action on the restoration and enhancement of coastal wetlands and near-shore marine ecosystems.
15. Where possible, revise and extend current IPCC guidance and guidelines to promote more com-prehensive accounting of emissions by sources and removals by sinks in coastal wetlands and marine ecosystems, e.g. through establishment of Tier 1 definitions and methods for coastal wetlands; and Develop supplementary methodologies for estimating GHG emissions by sources and remov-als by sinks covering additional coastal wetland and marine ecosystem types and management activities.m
m IPCC GHGI for AFOLU have established methodologies for assessing emissions from peatlands, grasslands, rice cultivation. Quantification of emissions from agricultural and other land-uses on sites that will be restored to coastal wetlands provide an established foundation for quantifying pre-project baseline emissions.

31Marine Ecosystem Series
Annex 1 — Current Coastal Carbon Activities
For some time academic research has focused on the significant capacity of coastal marine ecosystems for carbon storage and sequestration. However, it is only very recently that more
attention is given to the development of adequate policy as well as management approaches. Current work on the potential for coastal carbon accounting and development of payment mechanisms includes:
In 2009 several initiatives have shown first results. IUCN produced the report ‘The Management of Natural Coastal Carbon Sinks’, providing the latest evidence of coastal ecosystems’ ability to store carbon and their role in reducing the negative effects of climate change. It offers specific policy guidelines about how to include management of marine carbon sinks in international and national reduction strategies.166 The United Nations Environment Programme (UNEP) produced the ‘Blue Carbon’ report describing carbon sinks in the ocean.167
Philip Williams and Associates (PWA) and Science Applications International Corporation (SAIC) prepared the report ‘Greenhouse Gas Mitigation Typology Issues Paper: Tidal Wetlands Restoration’ for the California Climate Registry. It focused on the potential for tidal wetlands based carbon offsets within the US regulatory system. This report was the first to describe issues related to developing a carbon offsets methodology for wetlands particularly for restoration, avoided loss, and wetlands enhancement, and outlined a suggested framework for developing a carbon offset methodology for tidal wetlands in the USA.
The World Bank has supported research to assess the potential for conservation and restoration of marine systems, including complex marine foodwebs, to enhance the capture and sequestration of CO2. The current study is a product of that ongoing effort.
Based on the output from the California Climate Registry report, the NGO Restore America’s Estuaries (RAE) sponsored a Blue Ribbon expert panel that met in late 2009. RAE is leading an initiative to develop a national greenhouse gas offset protocol for coastal wetlands restoration and recently released an ‘Action Plan to Guide Protocol Development’.168 http://estuaries.org/climate-change.html
A working group based at the National Center for Ecological Analysis and Synthesis (NCEAS) is currently focused on modeling greenhouse-gas exchanges to and from tidal marshlands with the goal of supporting possible development of carbon offsets in these systems. http://www.nceas.ucsb.edu/projects/12503
The Marine Katoomba Group is continuing efforts which began at the Southeast Asia Katoomba Meeting Mangrove Workshop in the larger context of Payment for Ecosystems Services (PES) with a focus on furthering the progress of mangrove carbon methodology development and carbon emission reduction credits.

Environment Department Papers32
Mitigating Climate Change through Restoration and Management of Coastal Wetlands and Near-shore Marine Ecosystems
Conservation International, IUCN and the Intergovernmental Oceanographic Commission, and partners, have established an international Blue Carbon Scientific Working Group as a review and guiding body to improve carbon management in coastal wetlands and seagrass ecosystems. This Working Group first met February 2011 and will be meeting approximately biannually over the next 3 years. http://www.marineclimatechange.com/marineclimatechange/bluecarbon_2.html
A similar effort has been launched with a focus on Asia—the Asia-Pacific Blue Carbon Initiative—with support from UNEP/Grid Arendal.
A team from the Nicholas Institute for Environmental Policy Solutions and the Nicholas School of the Environment, Duke University is currently examining the economics of blue carbon sequestration and avoided emissions. A final report is due March 2011.
These efforts demonstrate a growing interest in accounting for coastal and marine carbon sequestration and in developing mechanisms for carbon offsets, credits and payments in these natural systems. Experts meetings and their summary reports have so far concluded that there is strong potential for utilizing sequestered carbon in the management and sustainable funding of coastal conservation.

33Marine Ecosystem Series
Annex 2 Derived Estimates of GHG Emissions from Coastal Carbon Sinks
This annex describes the methodology, analysis, and results of the technical analyses conducted in support of this report. The data emerging from this analysis has been developed with the intent
of subsequent scientific peer review.
background
Anthropogenic impacts to river and delta systems, such as the diking and draining of wetlands for agriculture, have resulted in significant loss of soil and carbon storage potential in the world’s deltas. Shrinkage due to dewatering, compression of peat soils, oxidation, and other erosional processes (Holman 2009) have resulted in large subsided areas below natural marsh plain elevation in many deltas around the world. The purpose of this analysis is to develop a methodology to quantify the areal extent and depth of delta subsidence, to quantify carbon loss and emissions, and assess the restoration and sequestration potential of tidal wetlands. This was accomplished by analyzing topographic data for 15 representative case study deltas to serve as test cases for the proposed methodology. Deltas were selected to obtain a representative sample over a wide geographic range, areal extent, degree of subsidence, tide range, sediment supply, and sea level rise vulnerability, and to draw on previous work by Coleman et al (2008) and Syvitski et al (2009). The larger dataset of deltas is included in Tables 1 and 2. The results provide a rapid assessment of extent and depth of subsided areas within each delta, estimates of carbon emissions from diked and drained areas, and estimates of carbon stored in existing wetlands.
methods
For each delta, we calculated two curves that characterize subsided area and volume: (1) hypsometric curve and (2) stage-volume curve. The hypsometric curve is a cumulative distribution curve that tabulates elevation versus area. A point on the hypsometric curve represents the area within the delta that lies below the specified elevation. The stage-volume curve tabulates elevation versus storage volume for a given delta. The storage volume is the volume required to fill the subsided area back up to the specified elevation. Together, these two curves provide detailed information about the distribution and depth of subsided areas within a particular delta system.
Topography data were obtained from the NASA Shuttle Radar Topography Mission (SRTM) datasets available through the ESRI Data and Maps DVDs packaged with ArcGIS Version 9.3. Horizontal resolution for the global dataset is 3 arc seconds (approximately 90m) and vertical resolution is 1m. The SRTM vertical datum is mean sea level based on the WGS84 Earth Gravitational Model (EGM 96) geoid.
The SRTM dataset, supplemented by satellite imagery and watershed maps, was used to define the approximate extent of tidal influence for each of the 15 case study deltas. Since the primary areas of interest were in diked and subsided areas that have been reclaimed or separated from tidal action, the SRTM water bodies layer was used to exclude lakes, rivers, and ocean areas within the SRTM coverage area. For each delta, the resulting topography grid was analyzed

Environment Department Papers34
Mitigating Climate Change through Restoration and Management of Coastal Wetlands and Near-shore Marine Ecosystems
in ArcMap to produce hypsometry and stage-volume curves to represent the extent and depth of subsidence within each delta. Curves were calculated in 1m increments from –10m to +10m MSL.
To determine the extent and depth of subsidence relative to natural marsh plain, a literature review was conducted to determine approximate tide ranges for each delta system (Table 3). The typical spring tide level was selected as a proxy for marsh plain elevation and each hypsometry curve was shifted relative to the assumed marsh plain elevation. Points were interpolated from the curves in 1m increments to determine subsided area and volume in 1m bins relative to natural marsh plain elevation (Table 4). The stage-storage curves allow determination of the total subsided volume within the delta below natural marsh plain elevation. These values are shown in Table 4 as the volume below “Marsh plain 0m”.
To derive estimates of green house gas emissions released from coastal carbon sinks due to subsidence and oxidation of soils, the area and volume of each subsided basin was converted to its equivalent carbon storage. For each delta, we assumed that a mix of organic (high carbon content) and mineral (low carbon content) soils existed historically. In general, we assumed a 50/50 soil distribution split between the two soil types in each delta. The high carbon content organic soils were assumed to be representative of highly productive, backwater areas, with high accumulation of organic matter. These soils were assumed to have a 20% soil carbon density (weight to volume). The low carbon content soils were assumed to be representative of wetland areas with higher minerogenic (inorganic) sediment contributions, and lesser organic contributions (6%). These soils were assumed to have lower carbon content. Few studies document the relative spatial distributions of these sediment types in the case study deltas under historic conditions. We selected a 50/50 split based on limited data to obtain first order estimates of soil carbon content. The Po and Sacramento Rivers, where more detailed information was available, were exceptions (Table 5).
Table 5 shows the calculated values for the total subsided volume below marsh plain and the volume within the top 1.5m of subsided areas for each delta. The volume of soil lost for organic (high carbon content) soils was assumed to be the full subsided depth, and was calculated as the full subsided volume multiplied by the fraction of organics soils. This assumption was based on observed patterns of subsidence and oxidation of peat soils, where carbon reserves are continually depleted and soil is lost due to active land use practices and manipulation of the water table. For the inorganic dominant soils (low carbon content), only the top 1.5m was assumed to be lost due to its higher inorganic content. The volume of soil lost for the inorganic soils was calculated as the subsided volume in the top 1.5m multiplied by the percent coverage (typically 50%). The remaining unaccounted for subsided volume is assumed to be volume loss due to dewatering, soil shrinkage, etc., and does not contribute to carbon emissions.
Total carbon loss from subsided soils was calculated using the following formula (adapted from Holman 2009):
C =V x %C x ρ α x
where V = subsided volume, %C = organic carbon content of soil, ρ = bulk density (kg/m3), and α = carbon loss reduction factor equal to 0.5 for inorganic soils. The carbon loss reduction factor accounts for the fact that draining and subsidence of inorganic soils does not result in complete loss/oxidation of soils (i.e., some soil remains). For organic soils, the carbon loss reduction factor was assumed to be equal to 1.0.
restoration potential metrics
Many world deltas are under threat by subsidence due to a combination of land use practices (e.g., diking and draining for agriculture) and a lack of sediment availability due to upstream impoundment by dams. Former wetland areas that have been diked and drained

35Marine Ecosystem Series
Annex 2 — Derived Estimates of GhG Emissions from Coastal Carbon Sinks
could potentially be restored through traditional restoration actions to reverse historical subsidence if sufficient sediment is available to naturally aggrade the ground elevation to levels where wetland vegetation can establish. For deeply subsided areas, or areas impacted by reduction of sediment, restoration through traditional methods may be unfeasible given the magnitude of alterations to the historical landscape. The success of typical natural restoration actions is therefore dependent upon adequate mineral sediment supply relative to the size of the subsided basin. In the absence of mineral sediment supply, historic carbon stocks can be recovered through carbon farming and artificial management of hydrology and vegetation growth. For those deltas that are poor options for recovering natural carbon sinks through traditional restoration actions, carbon farming techniques may provide a method of sequestering large amounts of carbon and rebuilding subsided areas back up to natural marsh plain elevations. This section describes the various metrics developed in this study to quantify the likelihood of success of traditional restoration and carbon-farming techniques to rebuild wetland carbon sinks.
Restoration potential scaling metrics were developed to assess the feasibility of restoring natural coastal wetlands in diked and subsided areas within each delta. The goal of the metrics is to help quantify and integrate characteristics of each delta such as area and volume of subsided areas, sediment supply, and sea level rise migration area to assess the relative restoration feasibility within each delta. Each of the restoration potential metrics is described in detail below. A discussion of how the metric is calculated, what it represents, and examples for particular systems are presented. The results of the index calculations are presented in Table 6 for each delta.
Accommodation Space index
The Accommodation Space Index is determined from the subsided area and volume values presented in Table 4 for each delta. The index is calculated as the ratio of
area below marsh plain divided by volume below marsh plain. The index characterizes the general shape of the subsided portions of each delta (e.g., large shallowly subsided footprint vs. small deeply subsided footprint).
A low value of the index indicates that the subsided volume is large relative to the subsided area. A high value of the index indicates that the subsided volume is small relative to the subsided area. The index has important implications for the restorability of wetlands within each delta. For low index deltas (e.g., Vistula, Wash, Po, and Sacramento), large quantities of sediment would be required to fill subsided basins that would produce relatively small areas of restored wetlands. For high index deltas (e.g., Danube, Parana, and Orinoco), lesser quantities of sediment would be required to fill subsided basins that would produce relatively larger areas of restored wetlands.
Restorable Area index
The Restorable Area Index is determined from the subsided area values presented in Table 4. For each delta, the subsided area that falls between marsh plain and 1m below marsh plain was determined. This area was compared to the total subsided area for each delta. The index was calculated by dividing the subsided area within 1m of marsh plain by the total subsided area. The value of the index represents the fraction of the entire subsided footprint that lies within 1m below marsh plain.
A low value of the index indicates that the majority of the subsided area is relatively deeply subsided and greater than 1m below the natural marsh plain elevation (i.e., low restoration potential). A high value of the index indicates that a large fraction of the total subsided area lies near (within 1m) of the natural marsh plain (i.e., high restoration potential). The index has important implications for the restorability of wetlands within each delta. For low index deltas (e.g., Sacramento, Po, Wash, Vistula, and Humber), the majority of the subsided area is deeply subsided

Environment Department Papers36
Mitigating Climate Change through Restoration and Management of Coastal Wetlands and Near-shore Marine Ecosystems
and well below the natural marsh plain elevation. For high index deltas (e.g., Congo, Orinoco, Danube, and Parana), a large portion of the subsided areas is near marsh plain elevation (within 1m) and could potentially be restored relatively easily given adequate sediment supply. Note that a low value of the index does not preclude restoration, it simply indicates that larger quantities of sediment may be required to build up mudflat elevations to levels where vegetation establishment can occur.
Sediment Supply index
The Sediment Supply Index is determined by comparing the annual sediment delivery to the subsided volume within each delta. The index is calculated from the average annual sediment discharge values in Table 3 and the subsided volume values in Table 4. The index is determined using two values for subsided volume: (1) full subsided volume below marsh plain and (2) subsided volume within 1m of marsh plain. The index is calculated as the annual sediment supply divided by the subsided volume. The index represents the amount of inorganic sediment available to build up subsided areas to marsh plain elevation.
A low value of the index indicates that there is very little sediment relative to the subsided volume within the delta. A high value of the index indicates that there is a higher sediment supply relative to the subsided volume within the delta. For low index deltas (e.g., Sacramento, Po, and Vistula), it is unlikely that there is sufficient sediment supply to naturally build up subsided areas to marsh plain elevation. This could be due either to a greatly reduced sediment supply, or a vast subsided volume. For high index deltas (e.g., Congo, Orinoco, Ganges-Brahmaputra, and Huang He), it is likely that there is adequate sediment supply to build up subsided areas to marsh plain elevation. This could be due either to an overwhelming sediment supply, or a relatively small subsided volume. Note that this index does not take into account the amount of sediment required to maintain the existing delta function.
transitional Area index
The Transitional Area index is determined by comparing the footprint of the area within 1m above existing marsh plain to the footprint of the full subsided area. The index is calculated from the subsided area values in Table 4. The index is calculated as the footprint of the area between marsh plain and 1m above marsh plain divided by the full subsided area footprint below marsh plain. The index represents the area available for upslope migration of wetlands with sea level rise.
A low value of the index indicates that there is poor migration capacity with future sea level rise. A high value of the index indicates that there is good migration capacity. For low index deltas (e.g., Vistula, Po, and Sacramento), already subsided areas will become even deeper with sea level rise and will become more difficult to restore. For high index deltas (e.g., Congo, Orinoco, Ganges-Brahmaputra, and Yangtze), already subsided areas will also become deeper with sea level rise, but additional area will be created near marsh plain elevation (by inundation and displacement of upland habitats). For the low index deltas, restoration of vegetated marshes earlier, rather than later, will help to increase the resiliency of those systems to sea level rise because accumulation of organic material can augment natural sedimentation to help keep pace with sea level rise. For the high index deltas, earlier restoration is still desirable, but the consequences of delayed action (at least in terms of sea level rise resiliency) are less severe.
Carbon sequestration metrics
The metrics discussed above for restoration potential attempted to quantify the feasibility of restoration of subsided areas within each delta. The metrics helped characterize the shape of the subsided basins (broad and shallow vs. narrow and deep), the footprint of restorable subsided areas near marsh plain, and the availability of sediment to build up subsided areas to vegetation colonization elevations. These metrics did not, however, quantify the potential or capacity to sequester carbon
37Marine Ecosystem Series
Annex 2 — Derived Estimates of GhG Emissions from Coastal Carbon Sinks
within the deposited soils and organic material within each restored area. The carbon sequestration metrics presented below are very similar to the restoration metrics; however, they are interpreted differently to identify the sequestration potential of the subsided sinks within each delta. The results of the index calculations are presented in Table 6 for each delta.
Accommodation Space index for carbon Sequestration
The Accommodation Space Index for Carbon Sequestration is determined from the subsided area and volume values presented in Table 4 for each delta. The index is calculated as the ratio of volume below marsh plain divided by area below marsh plain (note: this is the reverse of the accommodation space index presented above for restoration metrics). The index characterizes the general shape of the subsided portions of each delta (e.g., large shallowly subsided footprint vs. small deeply subsided footprint), and can be thought of as the “typical depth” of subsidence below marsh plain.
A low value of the index indicates that a large fraction of the subsided area lies near (within 1m) of the natural marsh plain. A high value of the index indicates that the majority of the subsided area is relatively deeply subsided and not near the natural marsh plain elevation. The index has important implications for the carbon sequestration potential of wetlands within each delta, assuming that managed freshwater restoration (e.g. “tule growth” to build up bed elevations through accumulation of organic matter) could occur within the subsided basins (the feasibility of this approach for each delta is discussed elsewhere). For low index deltas (e.g., Danube, Parana, and Orinoco), the subsided areas are large relative to the volume of organic material that could be accumulated to sequester carbon. This means that large land areas must be acquired for relatively small amounts of carbon sequestration. For high index deltas (Sacramento, Po, and Wash), the subsided volumes are vast and relatively large potential carbon sinks exist, yet are contained within relatively small
footprints. In these systems, if managed freshwater restorations are feasible, large quantities of carbon could be sequestered per unit area of restored wetland due to the deeply subsided nature of the sink.
Subsided Area and Volume indices
The Restorable Area and Volume Indices area determined from the subsided area and volume values presented in Table 4. For each delta, the subsided area (volume) that falls within 1m below marsh plain was determined. This area (volume) was compared to the full subsided area (volume) for each delta. For each delta, the subsided area (volume) within 1m of marsh plain was divided by the full subsided area (volume). This value was subtracted from 1.0 to determine the fraction of the entire subsided footprint (volume) that is deeply subsided (i.e., deeper than 1m below marsh plain).
A low value of the index indicates that a large fraction of the subsided area (volume) lies near (within 1m) of the natural marsh plain. A high value of the index indicates that the majority of the subsided area (volume) is relatively deeply subsided and not near the natural marsh plain elevation. The index has important implications for the feasibility of carbon sequestration within each delta. For low index deltas (e.g., Congo, Orinoco, and Danube), the majority of the subsided area and volume is near marsh plain. This means that were these areas to be managed freshwater restorations, only limited amounts of organic material (and carbon) could be accumulated within the subsided basins before marsh elevations would build up to natural marsh plain elevation. For high index deltas, (e.g., Sacramento, Vistula, and Wash), the majority of the subsided area and volume is much deeper than marsh plain, and vast potential carbon sequestration sinks exist.
slr Vulnerability metrics
Syvitski et al. (2009) analyzed the effects of human activities on delta subsidence, susceptibility to flooding,

Environment Department Papers38
Mitigating Climate Change through Restoration and Management of Coastal Wetlands and Near-shore Marine Ecosystems
and vulnerability to sea level rise. By considering historic and present-day sediment supply, delta aggradation, subsidence, and relative sea level rise, the authors developed a classification scheme to determine whether modern delta plains are keeping pace with sea level. Deltas were classified into the following categories: not at risk, at risk, at greater risk, in peril, and in greater peril. We have adopted this classification scheme as our scaling metric to assess the relative vulnerability of our select deltas to future sea level rise.
results
The results of the area and volume analysis, including estimates of carbon dioxide emitted due to land use changes, are presented in Table 5 and Figure 1. The restoration and carbon sequestration metrics are presented in Table 6. The sea level rise vulnerabilities from Syvitski el al. (2009) are included in Table 2. A summary of carbon stocks for large deltas with remaining wetlands is presented in Table 7.
Discussion
Estimates of carbon content of wetland soils and emissions associated with drainage of wetland soils presented in this study compare well with similar estimates by other investigators (Drexler et al. 2009; Ong 2002; Fujimoto et al. 2001). The numbers provided here may be considered conservative, potentially on the low side. They are based upon an
assumption that organic poor-soils and organic-rich soils contain 6% and 20% carbon per dry weight of soil. We assume that low organic or mineral soils lose only 50% of their carbon with drainage (Crooks, 1996, 1999), but that organic rich soils lose all their carbon with drainage (Rojstaczer and Deverel, 1993; Deverel and Rojstaczer, 1996; Wösten et al., 1997; Holman et al., 2009). We also assume that for a given coastal area high and low carbon content soils occur in a ratio of 1:1. Soil types will vary across the landscape but this simple assumption is likely reasonable to provide a global estimate. In order to refine these estimates, a better understanding of the organic content of wetland soils specific to each region is required. We also made the assumption that natural vegetation colonization elevations equilibrate between mean high water (MHW) and mean higher high water (MHHW), or approximately at the typical spring tide elevation. A more detailed understanding of natural marsh plain elevations specific to each delta would also help further refine this analysis.
The analysis presented here is based on topography data from satellite remote sensing. It should also be noted that SRTM elevation data for areas of dense vegetation cover (e.g. mangrove forests) might show a bias in the topography dataset. In these areas, the areal extent of tidally influenced areas may be under-represented. Elevations in these areas should be ground-truthed to allow further refinement of the estimates presented here.

39Marine Ecosystem Series
Annex 2 — Derived Estimates of GhG Emissions from Coastal Carbon Sinks
Table 1. wetland loss (km2) and Average Annual rate of loss (km2y–1) determined by Time Series Imagery for 14 case Study deltas (coleman et al., 2008)
Delta
Open Water Ag. and Ind. Use* Total Wetlands Area of Delta
Mang.**Net LossAvg. Rate per
Year Net LossAvg. Rate per
Year Net LossAvg. Rate per
Year
Danube 83 6 83 6 3066
Ganges-Brahmaputra 783 65 3507 292 4290 358 5930
Huang He (Yellow) 8 1 727 66 735 67 1960
Indus 960 120 635 79 1595 199 1380
Mahanadi 116 39 22 7 94 31 1440
Mangoky 43 3 90 6 133 9 1449
McKenzie 24 12 24 12 995
Mississippi 252 21 112 9 364 30 1904
Niger 81 5 7 0.5 88 6 1110
Nile 2.4 0.2 12 0.7 14 0.8 872
Shatt el Arab 1610 101 5089 318 6699 419 1340
Volga 100 6 177 10 277 16 1420
Yukon 1100 157 1100 157 4654
Zambezi 24 2 325 23 349 25 2705
Total Loss 5104 10,786 15,845 30,225
Average Rate 41 68 95
* Agricultural and Industrial Use.** Area of Delta Management

Environment Department Papers40
Mitigating Climate Change through Restoration and Management of Coastal Wetlands and Near-shore Marine Ecosystems
Table 2. characterizing delta vulnerability to Sea level rise as a result of reduced Sediment Supply (Syvitski et al., 2009)
Delta Are
a <2
m
abov
e se
a le
vel (
km2 )
Stor
m-S
urge
A
rea
(km
2 )a
Rec
ent A
rea
of
Riv
er F
lood
ing
(km
2 )
Rec
ent A
rea
of in
situ
Fl
oodi
ng (k
m2 )
Sedi
men
t R
educ
tion
(%)
Floo
dpla
in
or D
elta
Flo
w
Div
ersi
on
Dis
trib
utar
y C
hann
el
Red
uctio
n (%
)
Subs
urfa
ce
Wat
er, O
il an
d G
as M
inin
gb
Early
-tw
entie
th-
cent
ury
aggr
adat
ion
rate
(mm
yr–1
)
Twen
ty-
first
-cen
tury
ag
grad
atio
n ra
te (m
myr
–1)
Rel
ativ
e se
a-le
vel r
ise
(mm
yr–1
)
Deltas not at risk: Aggradation rates unchanged, minimal anthropogenic subsidence
Amazon 1,960c 0; LP 0 9,340 0 No 0 0 0.4 0.4 Unkn
Congod 460 0; LP 0 0 20 No 0 0 0.2 0.2 Unkn
Fly 70c 0; MP 140 280 0 No 0 0 5 5 0.5
Orinoco 1,800c 0; MP 3,560 3,600 0 No 0 Unkn 1.3 1.3 0.8–3
Mahaka 300 0; LP 0 370 0 No Unkn 0 0.2 0.2 Unkn
Deltas at risk: Reduction in aggradation, but rates still exceed relative sea-level
Amur 1,250 0; LP 0 0 0 No 0 0 2 1.1 1
Danube 3,670 1,050 2,100 840 63 Yes 0 Minor 3 1 1.2
Han 70 60 60 0 27 No 0 0 3 2 0.6
Limpopo 150 120 200 0 30 No 0 0 7 5 0.3
Deltas at greater risk: Reduction in aggradation where rates no longer exceed relative sea-level
Brahmani 640 1,100 3,380 1,580 50 Yes 0 Major 2 1 1.3
Godavari 170 660 220 1,100 40 Yes 0 Major 7 2 –3
Indus 4,750 3,390 680 1,700 80 Yes 80 Minor 8 1 >1.1
Mahanadi 150 1,480 2,060 1,700 74 Yes 40 Mod 2 0.3 1.3
Parana 3,600 0; LP 5,190 2,600 60 No Unkn Unkn 2 0.5 2–3
Vistula 1,490 0; LP 200 0 20 Yes 75 Unkn 1.1 0 1.8
Deltas at peril: Reduction in aggradation plus accelerated compaction overwhelming rates of global sea-level rise
Gangesd 6,170c 10,500 52,800 42,300 30 Yes 37 Major 3 2 8–18
Irrawaddy 1,100 15,000 7,600 6,100 30 No 20 Mod 2 1.4 3.4–6
Magdalena 790 1,120 750 750 0 Yes 70 Mod 6 3 5.3–6.6
Mekong 20,900 9,800 36,750 17,100 12 No 0 Mod 0.5 0.4 6
Mississippi 7,140c 13,500 0 11,600 48 Yes Unkn Major 2 0.3 5–25
Niger 350c 1,700 2,570 3,400 50 No 30 Major 0.6 0.3 7–32
Tigrisd 9,700 1,730 770 960 50 Yes 38 Major 4 2 4–5
Deltas at greater peril: Virtually no aggradation and/or very high accelerated compaction
Chao Pharya 1,780 800 4,000 1,600 85 Yes 30 Major 0.2 0 13–150
Colorado 700 0; MP 0 0 100 Yes 0 Major 34 0 2–5
Krishna 250 840 1,160 740 94 Yes 0 Major 7 0.4 –3
Nile 9,440 0; LP 0 0 98 Yes 75 Major 1.3 0 4.8
Pearld 3,720 1,040 2,600 520 67 Yes 0 Mod 3 0.5 7.5
Po 630 0; LP 0 320 50 No 40 Major 3 0 4–60
Rhone 1,140 0; LP 920 0 30 No 40 Minor 7 1 2–6
Sao Francisco
80 0; LP 0 0 70 Yes 0 Minor 2 0.2 3–10
Toned 410 220 0 160 30 Yes ≈ Major 4 0 >10
Yangtzed 7,080 6,700 3,330 6,670 70 Yes 0 Major 1.1 0 3–28
Yellowd 3,420 1,430 0 0 90 Yes 80 Major 49 0 8–23a LP: Little Potential; MP: Moderate Potential; SP: Significant Potential.b Unkn: Unknown; Mod: Moderate.c Significant canopy cover renders these SRTM elevation estimates conservatived Alternative names: Congo and Zaire; Ganges and Ganges-Brahmaputra; Pearl and Zhujiang; Tigris and Tigris-Euphrates and Shatt al Arab; Tone and Edo; Yangtze and Changjiang; Yellow and Huanghe.≈ The Tone has long had its flow path engineered, having once flowed into Tokoyo Bay; the number of distributary channels has increased with engineering works.
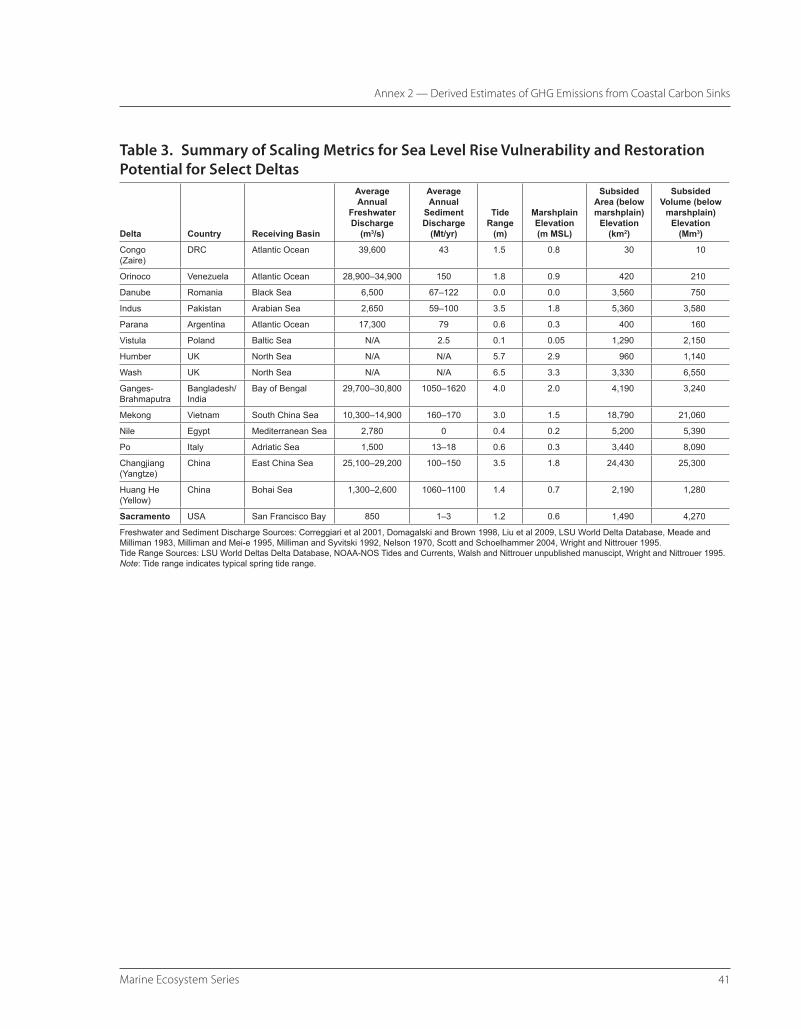
41Marine Ecosystem Series
Annex 2 — Derived Estimates of GhG Emissions from Coastal Carbon Sinks
Table 3. Summary of Scaling metrics for Sea level rise vulnerability and restoration potential for Select deltas
Delta Country Receiving Basin
Average Annual
Freshwater Discharge
(m3/s)
Average Annual
Sediment Discharge
(Mt/yr)
Tide Range
(m)
Marshplain Elevation (m MSL)
Subsided Area (below marshplain)
Elevation (km2)
Subsided Volume (below
marshplain) Elevation
(Mm3)
Congo (Zaire)
DRC Atlantic Ocean 39,600 43 1.5 0.8 30 10
Orinoco Venezuela Atlantic Ocean 28,900–34,900 150 1.8 0.9 420 210
Danube Romania Black Sea 6,500 67–122 0.0 0.0 3,560 750
Indus Pakistan Arabian Sea 2,650 59–100 3.5 1.8 5,360 3,580
Parana Argentina Atlantic Ocean 17,300 79 0.6 0.3 400 160
Vistula Poland Baltic Sea N/A 2.5 0.1 0.05 1,290 2,150
Humber UK North Sea N/A N/A 5.7 2.9 960 1,140
Wash UK North Sea N/A N/A 6.5 3.3 3,330 6,550
Ganges-Brahmaputra
Bangladesh/India
Bay of Bengal 29,700–30,800 1050–1620 4.0 2.0 4,190 3,240
Mekong Vietnam South China Sea 10,300–14,900 160–170 3.0 1.5 18,790 21,060
Nile Egypt Mediterranean Sea 2,780 0 0.4 0.2 5,200 5,390
Po Italy Adriatic Sea 1,500 13–18 0.6 0.3 3,440 8,090
Changjiang (Yangtze)
China East China Sea 25,100–29,200 100–150 3.5 1.8 24,430 25,300
Huang He (Yellow)
China Bohai Sea 1,300–2,600 1060–1100 1.4 0.7 2,190 1,280
Sacramento USA San Francisco Bay 850 1–3 1.2 0.6 1,490 4,270
Freshwater and Sediment Discharge Sources: Correggiari et al 2001, Domagalski and Brown 1998, Liu et al 2009, LSU World Delta Database, Meade and Milliman 1983, Milliman and Mei-e 1995, Milliman and Syvitski 1992, Nelson 1970, Scott and Schoelhammer 2004, Wright and Nittrouer 1995.Tide Range Sources: LSU World Deltas Delta Database, NOAA-NOS Tides and Currents, Walsh and Nittrouer unpublished manuscipt, Wright and Nittrouer 1995.Note: Tide range indicates typical spring tide range.
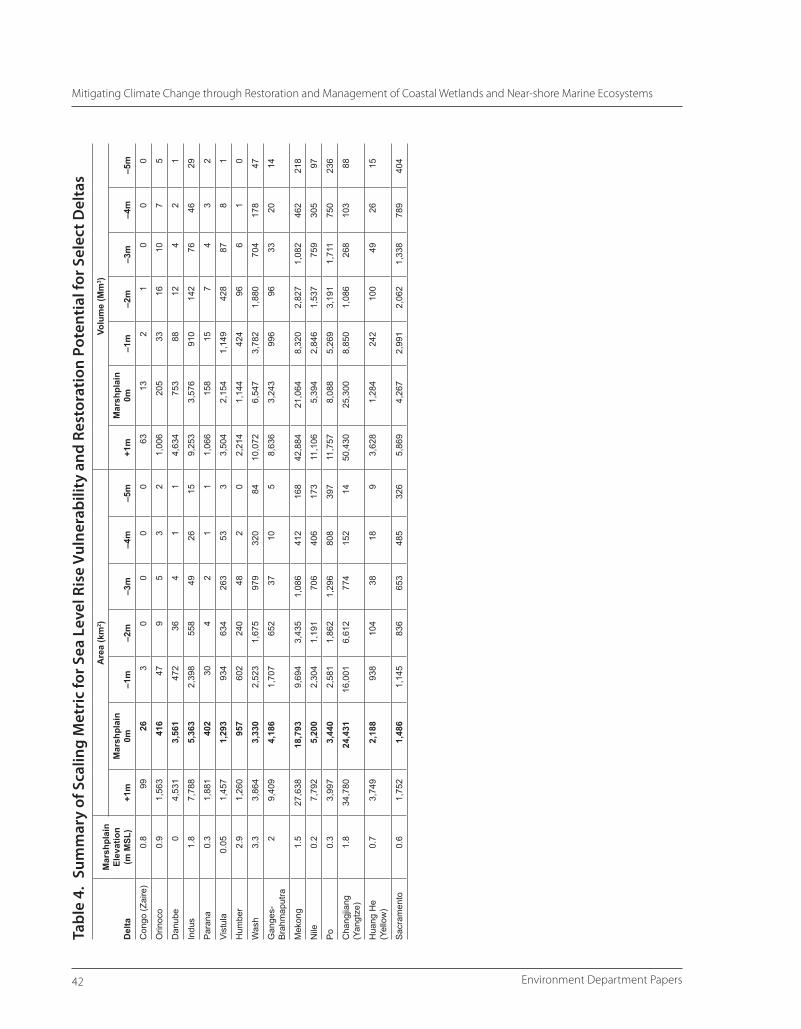
Environment Department Papers42
Mitigating Climate Change through Restoration and Management of Coastal Wetlands and Near-shore Marine EcosystemsTa
ble
4. S
umm
ary
of S
calin
g m
etri
c fo
r Sea
lev
el r
ise
vuln
erab
ility
and
res
tora
tion
pot
enti
al fo
r Sel
ect d
elta
s
Del
ta
Mar
shpl
ain
Elev
atio
n (m
MSL
)
Are
a (k
m2 )
Volu
me
(Mm
3 )
+1m
Mar
shpl
ain
0m–1
m–2
m–3
m–4
m–5
m+1
mM
arsh
plai
n 0m
–1m
–2m
–3m
–4m
–5m
Con
go (Z
aire
)0.
899
263
00
00
6313
21
00
0
Orin
oco
0.9
1,56
341
647
95
32
1,00
620
533
1610
75
Dan
ube
04,
531
3,56
147
236
41
14,
634
753
8812
42
1
Indu
s1.
87,
788
5,36
32,
398
558
4926
159,
253
3,57
691
014
276
4629
Para
na0.
31,
881
402
304
21
11,
066
158
157
43
2
Vist
ula
0.05
1,45
71,
293
934
634
263
533
3,50
42,
154
1,14
942
887
81
Hum
ber
2.9
1,26
095
760
224
048
20
2,21
41,
144
424
966
10
Was
h3.
33,
864
3,33
02,
523
1,67
597
932
084
10,0
726,
547
3,78
21,
880
704
178
47
Gan
ges-
Brah
map
utra
29,
409
4,18
61,
707
652
3710
58,
636
3,24
399
696
3320
14
Mek
ong
1.5
27,6
3818
,793
9,69
43,
435
1,08
641
216
842
,884
21,0
648,
320
2,82
71,
082
462
218
Nile
0.2
7,79
25,
200
2,30
41,
191
706
406
173
11,1
065,
394
2,84
61,
537
759
305
97
Po0.
33,
997
3,44
02,
581
1,86
21,
296
808
397
11,7
578,
088
5,26
93,
191
1,71
175
023
6
Cha
ngjia
ng
(Yan
gtze
)1.
834
,780
24,4
3116
,001
6,61
277
415
214
50,4
3025
,300
8,85
01,
086
268
103
88
Hua
ng H
e (Y
ello
w)
0.7
3,74
92,
188
938
104
3818
93,
628
1,28
424
210
049
2615
Sacr
amen
to0.
61,
752
1,48
61,
145
836
653
485
326
5,86
94,
267
2,99
12,
062
1,33
878
940
4

43Marine Ecosystem Series
Annex 2 — Derived Estimates of GhG Emissions from Coastal Carbon Sinks
Tabl
e 5.
Sum
mar
y of
car
bon
lost
from
wor
ld d
elta
s
Soil
Dis
trib
utio
nC
ontr
ibut
ing
Volu
me
to
Car
bon
Loss
Car
bon
loss
Car
bon
Dio
xide
Em
itted
Del
ta
Tota
l Su
bsid
ed
Volu
me
(Mm
3 )
Subs
ided
Vo
l. in
top
1.5m
(Mm
3 )M
arsh
plai
n A
rea
(km
2 )
Frac
tiona
l Vo
lum
e Lo
ss to
O
ther
Fac
tors
Org
anic
Inor
gani
cO
rgan
ic
(Mm
3 )In
orga
nic
(M
m3 )
Org
anic
(M
t C)
Inor
gani
c
(Mt C
)To
tal
(Mt C
)O
rgan
ic
(Mt C
O2)
Inor
gani
c
(Mt C
O2)
Tota
l (M
t CO
2)
Del
tas
not a
t ris
k
Tabl
e 4.
Su
mm
ary
of
scal
ing
1312
264%
50%
50%
66
0.4
0.1
0.6
11
2
Orin
oco
205
181
416
6%50
%50
%10
390
63
923
1234
Del
tas
at ri
sk
Dan
ube
753
703
3,56
13%
50%
50%
377
352
2313
3583
4612
9
Del
tas
at g
reat
er ri
sk
Indu
s3,
576
3,05
05,
363
7%50
%50
%1,
788
1,52
510
755
162
393
201
594
Para
na15
814
740
23%
50%
50%
7974
53
717
1027
Vist
ula
2,15
41,
365
1,29
318
%50
%50
%1,
077
683
6525
8923
690
326
Hum
ber
1,14
488
495
711
%50
%50
%57
244
234
1650
126
5818
4
Was
h6,
547
3,71
63,
330
22%
50%
50%
3,27
41,
858
196
6726
371
924
596
4
Del
tas
in p
eril
Gan
ges-
Brah
map
utra
3,24
32,
697
4,18
68%
50%
50%
1,66
21,
349
9749
146
356
178
534
Mek
ong
21,0
6415
,490
18,7
9313
%50
%50
%10
,532
7,74
563
227
991
12,
313
1,02
13,
333
Del
tas
in g
reat
er p
eril
Nile
5,39
43,
203
5,20
020
%50
%50
%2,
697
1,60
216
258
219
592
211
803
Po8,
088
3,85
93,
440
13%
75%
25%
6,06
696
536
435
399
1,33
212
71,
459
Cha
ngjia
ng
(Yan
gtze
)25
,300
20,3
3224
,431
15%
75%
6,32
515
,249
380
549
928
1,38
92,
009
3,39
8
Hua
ng H
e (Y
ello
w)
1,28
41,
113
2,18
810
%25
%75
%32
183
519
3049
7011
018
0
Sacr
amen
to4,
267
1,74
11,
486
0%10
0%0%
4,26
70
256
025
693
70
937
Tota
l83
,192
58,4
9475
,071
39,1
0632
,773
2,34
61,
180
3,52
68,
588
4,31
812
,906
Not
es:
1. V
olum
e an
d m
ass
units
are
as
follo
ws.
Mm
3 = m
illion
cub
ic m
eter
s, M
t C =
millo
n m
etric
tonn
es o
f car
bon.
2. C
ontri
butin
g vo
lum
e fo
r car
bon
loss
det
erm
ined
as
follo
ws.
For
org
anic
soi
l are
as, t
he fu
ll su
bsid
ed v
olum
e is
ass
umed
to c
ontri
bute
to c
arbo
n lo
ss.
For i
norg
anic
soi
l are
as, o
nly
half
of th
e to
p 1.
5m o
f sub
side
d vo
lum
e is
ass
umed
to c
ontri
bute
to c
arbo
n lo
ss.
3. S
oil c
arbo
n de
nsity
for o
rgan
ic a
nd in
orga
nic
soils
ass
umed
to b
e 20
% a
nd 6
% re
spec
tivel
y, w
eigh
t to
volu
me.
4. B
ulk
dens
ity a
ssum
ed to
be
200
kg/m
3 for
org
anic
and
120
0 kg
/m3 f
or in
orga
nic
soils
.5.
CO
2 em
issi
ons
calc
ulat
ed b
y m
ultip
lyin
g kg
C b
y a
fact
or o
f 3.6
6.6.
Fra
ctio
nal v
olum
e lo
ss to
oth
er fa
ctor
s in
clud
es s
hrin
kage
due
to d
ewat
erin
g, c
ompr
essi
on a
nd c
ompa
ctio
n, e
tc.

Environment Department Papers44
Mitigating Climate Change through Restoration and Management of Coastal Wetlands and Near-shore Marine EcosystemsTa
ble
6. S
umm
ary
of S
calin
g m
etri
cs fo
r Sea
lev
el r
ise
vuln
erab
ility
and
res
tora
tion
for S
elec
t del
tas
Res
tora
tion
Met
rics
Res
tora
tion
Ass
essm
ent
Car
bon
Farm
Met
rics
Car
bon
Farm
Ass
essm
ent
Accommodation Space Index
Restorable Area Index
Sediment Supply Index (Whole Delta)
Sediment Supply (Shallow Delta)
SLR Transitional Area Index
Accommodation Space Index
Restorable Area Index
Sediment Supply Index (Whole Delta)
Sediment Supply (Shallow Delta)
SLR Transitional Area Index
Total
Accommodation Space Index
Subsided Area Index
Subsided Volume Index
Accommodation Space Index
Subsided Area Index
Subsided Volume Index
Total
Del
tas
not a
t ris
k
Con
go (Z
aire
)2.
060.
893.
383.
852.
770
11
11
40.
490.
110.
12–1
–1–1
–3
Orin
oco
2.03
0.89
0.73
0.87
2.75
11
11
15
0.49
0.11
0.16
–1–1
–1–3
Del
tas
at ri
sk
Dan
ube
4.73
0.87
0.12
60.
143
0.27
11
00
–11
0.21
0.13
0.12
–1–1
–1–3
Del
tas
at g
reat
er ri
sk
Indu
s1.
500.
550.
022
0.03
00.
450
00
0–1
–10.
670.
450.
25–1
0–1
–2
Para
na2.
540.
930.
500.
553.
681
10
00
20.
390.
070.
10–1
–1–1
–3
Vist
ula
0.60
0.28
0.00
10.
002
0.13
–1–1
–1–1
–1–5
1.67
0.72
0.53
01
01
Hum
ber
0.84
0.37
N/A
N/A
0.32
–1–1
11
–1–1
1.20
0.63
0.37
00
–1–1
Was
h0.
510.
24N
/AN
/A0.
16–1
–10
0–1
–31.
970.
760.
580
10
1
Del
tas
in p
eril
Gan
ges-
Brah
map
utra
1.29
0.59
0.34
0.49
1.25
00
11
13
0.77
0.41
0.31
–10
–1–2
Mek
ong
0.89
0.48
0.00
80.
013
0.47
–10
–10
–1–3
1.12
0.52
0.39
00
–1–1
Del
tas
at g
reat
er p
eril
Nile
0.96
0.56
0.00
00.
000
0.50
–10
–1–1
–1–4
1.04
0.44
0.53
00
00
Po0.
430.
250.
002
0.00
60.
16–1
–1–1
–1–1
–52.
350.
750.
651
10
2
Cha
ngjia
ng (Y
angt
ze)
0.97
0.35
0.00
50.
008
0.42
00
00
11
1.04
0.65
0.35
–10
–1–2
Hua
ng H
e (Y
ello
w)
1.70
0.57
0.84
1.04
0.71
00
11
–11
0.59
0.43
0.19
–10
–1–2
Sacr
amen
to
0.35
0.23
0.00
050.
0016
0.18
–1–1
–1–1
–1–5
2.87
0.77
0.70
11
02
Not
e: S
LR v
ulne
rabi
lity
inte
grat
es im
pact
of g
loba
l sea
leve
l ris
e, d
elta
sub
side
nce,
and
sed
imen
t sup
ply
(Syv
itski
et a
l 200
9).

45Marine Ecosystem Series
Annex 2 — Derived Estimates of GhG Emissions from Coastal Carbon Sinks
Table 7. Summary of carbon Stocks for large deltas with remaining wetlands
DeltaMarshplain Area (km2)
Stored Carbon (Plants)
Stored Carbon (Soils)
Stored Carbon (Soils + Plants)
Inorganic (Mt C)
Inorganic (Mt CO2)
Organic (Mt C)
Inorganic (Mt C)
Organic (Mt CO2)
Inorganic (Mt CO2)
Total Carbon (Mt C)
Total CO2 (Mt CO2)
Table 4. Summary of scaling metrics for sea level rise vulnerability and restoration potential for select deltas
Congo (Zaire) 25–95 0–1 1–3 2–7 1–3 6–25 2–9 2–9 9–40
Orinoco 370–1,515 3–10 10–45 30–110 10–40 95–400 40–150 40–145 145–595
Deltas at greater risk
Indus 2,965–5,390 25–45 90–160 215–390 80–150 780–1,420 295–535 320–1,120 1,160–2,110
Parana 370–1,850 3–15 10–55 30–135 10–50 100–490 40–185 40–150 145–725
Deltas in peril
Ganges-Brahmaputra
2,480–7,700 20–60 70–225 180–225 70–120 655–2,030 245–760 265–960 970–3,020
Total 6,210–16,550 50–130 180–490 460–1,200 170–450 1,635–4,365 620–1,640 670–2,385 2,430–6,490
Notes: 1. Mass units are as follows: Mt C = Million metric tons of Carbon, Mt CO2 = Million metric tons of Carbon dioxide.2. Future subsided volume calculated assuming approximately 1 in/yr subsidence rate over 50-year period to yield approximately 1.5 m year of subsidence.3. CO2 emissions calculated by multiplying kg C by a factor of 3.66.4. Lower estimate of marshplain area taken as area between marshplain and 1m below marshplain. Upper estimate taken as area between +/– 1m marshplain.


47Marine Ecosystem Series
Coleman, J. M., & Wright, L. D. (1971) Analysis of major River Systems and Their Deltas: Procedures and Rationale, with Two Examples. 125p. Baton Rouge: Louisiana State University, Coastal Studies Institute.
Coleman, J. M., Huh, O. K., & Braud, D. J. (2008) Wetland Loss in World Deltas. Journal of Costal Research, 24 (1A), 1–14.
Correggiari, A., Trincardi, F., Langone, L., Roveri, M., (2001) Styles of failure in late Holocene high stand prodelta wedges on the Adriatic shelf. Journal of Sedimentary Research 71, 218–236.
Crooks, S. (1996) Sedimentological Controls on the Geotechnical Properties of Intertidal Saltmarsh and Mudflat Deposits. PhD Thesis, University of Reading, U.K.
Crooks, S., (1999) A mechanism for the formation of overconsolidated horizons within estuarine floodplain alluvium: implications for the interpretation of Holocene sea level curves. In: S.B. Marriott and J. Alexander (eds.) Floodplains: Interdisciplinary Approaches. Geological Society Special Publication No. 163.
Deverel, S. J., & Rojstaczer, S. (1996) Subsidence of Agricultural Lands in the Sacramento-San Joaquin Delta, California: Role of Aqueous and Gaseous Carbon Fluxes. Water Resources Research, 32 (8), 2359–2367.
Domagalski, J.L., and Brown, L.R., (1998) National Water-Quality Assessment Program—The Sacramento River Basin: U.S. Geological Survey Fact Sheet FS 94–029, 2 p.
Drexler, J.Z., de Fontaine, C.S., and Deverel, S. (2009) The legacy of wetland drainage on the remaining peat in the Sacramento-San Joaquin Delta, CA, USA. Wetlands 29(1), pp. 372–386.
Fujimoto, K., Imaya, A., Tabuchi, R., Kuramoto, S., Utsugi, H. & Murofushi, T. (2001) Below ground carbon storage of Micronesian mangrove forests. Ecological Research, 14, 409–413.
Hart, G. F., & Coleman, J. The World Deltas Database Framework. Retrieved 2010, from Louisiana State University: www.geol.lsu.edu/WDD
Holman, I. (2009) An Estimate of Peat Reserves and Loss in the East Anglian Fens Commissioned by the RSPB. Cranfield University.
Liu, J.P., Xue, Z., Ross, K., Wang, J., Yang, Z.S., Li, A.C., Gao, S. (2009) Fate of sediments delivered to the sea by Asian large rivers: Long-distance transport and formation of remote alongshore clinothems. The Sedimentary Record. Volume 7, No. 4. December 2009. pp. 4–10.
Milliman, J. D., & Meade, R. H. (1983) World-Wide Delivery of River Sediment to the Oceans. The Journal of Geology, 91 (1), 1–20.
References

Environment Department Papers48
Mitigating Climate Change through Restoration and Management of Coastal Wetlands and Near-shore Marine Ecosystems
Milliman, J. D., & Mei-e, R. (1995) River Flux to the Sea: Impact of Hman Intervention on River Systems and Adjacent Coastal Areas. In Climate Change: Impact on Coastal Habitation (pp. 57–83). CRC Press, Inc.
Milliman, J. D., & Syvitski, J. P. (1992) Geomorphic/Tectonic Control of Sediment Discharge to the Ocean: The Importance of Small Mountainous Rivers. The Journal of Geology, 100, 525–544.
Nelson, B. W. (1970) Hydrography, Sediment Dispersal, and Recent Historical Development of the Po River Delta, Italy. In J. P. Morgan, & R. H. Shaver, Deltaic Sedimentation, Modern and Ancient (Vol. 15, pp. 152–184). The Society of Economic Paleontologists and Mineralogists.
Ong, J.E. (2002) The hidden costs of mangrove services: use of mangroves for shrimp aquaculture. International Science Roundtable for the Media. Bali, Indonesia. June 4, 2002.
Rojstaczer, S., & Deverel, S. J. (1993) Time Dependence in Atmospheric Carbon Inputs from Drainage of Organic Soils. Geophysical Research Letters, 20 (13), 1383–1386.
Syvitski, J. P., Kettner, A. J., Overeem, I., Hutton, E. W., Hannon, M. T., Brakenridge, G. R., et al. (2009) Sinking Deltas Due to Human Activities. Nature Geoscience, 2, 681–686.
Wösten, J.H.M., Ismail, A.B., and Van Wijk, A.L.M. (1997) Peat subsidence and its practical implications: a case study in Malaysia. Geoderma 78, pp. 25–36.
Wright, L. D., & Nittrouer, C. A. (1995) Dispersal of River Sediments in Coastal Seas: Six Contrasting Cases. Estuaries, 18 (3), 494–508.
Wright, S.A. and Schoellhamer, D.H. (2004) Trends in the Sediment Yield of the Sacramento River, California, 1957–2001. San Francisco Estuary & Watershed Science [online]. Vol. 2, Issue 2 (May 2004), Article 2.

49Marine Ecosystem Series
1 Laffoley, D. & Grimsdicth, G. (Eds.) 2009. The Management of Natural Coastal Carbon Sinks. IUCN, Gland, Switzerland, 53pp. http://cmsdata.iucn.org/downloads/carbon_managment_report_final_printed_version.pdf
2 Nellemann, C., Corcoran, E., Duarte, C. M., Valdés, L., De Young, C., Fonseca, L., Grimsditch, G. (Eds). 2009. Blue Carbon. A Rapid Response Assessment. United Nations Environment Programme, GRID-Arendal,http://www.grida.no/publications/rr/blue-carbon/
3 The World Bank, 2010a. World Development Report 2010: Development and Climate Change. The International Bank for Reconstruction and Development: Washington, D.C.
4 The World Bank 2010b. Convenient Solutions to an Inconvenient Truth: Ecosystem-Based Approaches to Climate Change. The International Bank for Reconstruction and Development: Washington, D.C.
5 Capturing and conserving natural coastal carbon: building mitigation, advancing adaptation. The World Bank, ICUN, EXA PWA, 2010. http://cmsdata.iucn.org/downloads/capturing_and_conserving_natural_coastal_carbon___building_mitigation___advancing_ada.pdf
6 Duarte, C.M., Middelburg, J.J., Caraco, N. (2005) Major Role of Marine Vegetation on the Oceanic Carbon Cycle. Biogeosciences 2:1–8.
7 Philips Williams & Associates (PWA), Ltd & Science Applications International Corporation (SAIC) (2009) Greenhouse Gas Mitigation Typology Issues Paper Tidal Wetlands Restoration. Prepared for California Climate Action Registry. http://www.climateactionreserve.org/wp-content/uploads/2009/03/future-protocol-development_tidal-wetlands.pdf
8 Spalding, M., Kainuma, M., Collins, L. (2010) World atlas of mangroves. ITTO, ISME, FAO, UNEP-WCMC, UNESCO-MAB and UNU-INWEH. Earthscan UK, USA.
9 Coleman, J.M., Huh, O.K., Braud Jr., D. (2008) Wetland loss in world deltas. Journal of Coastal Research. 24(1A), 1–14
10 Syvitski, J.P.M., Kettner, A. J., Overeem, I., Hutton, E. W., Hannon, M. T., Brakenridge, G. R., Day, J., Vörösmarty, C., Saito, Y., Giosan, L.,and Nicholls, R.J. (2009) Sinking deltas due to human activities. Nature Geoscience. 2, 681–686.
11 Spalding, M., Kainuma, M., Collins, L. (2010) World atlas of mangroves. ITTO, ISME, FAO, UNEP-WCMC, UNESCO-MAB and UNU-INWEH. Earthscan UK, USA.
12 Waycott, M., Duarte, C. M., Carruthers, T. J. B., Orth, R. J., Dennison, W. C., Olyarnik, S., Calladine, A. Fourgqurean, J. W., Heck, Jr., K. L., Hughes, A., R., Kendrick, G. A., Kenworthy, W. J., Short, F. T., and Williams, S. L. (2009) Accelerating loss of seagrasses across
Sources Cited

Environment Department Papers50
Mitigating Climate Change through Restoration and Management of Coastal Wetlands and Near-shore Marine Ecosystems
the globe threatens coastal ecosystems. Proceedings of the National Academy of Sciences, 106 (doi:10.1073.pnas.0905620106)
13 IPCC (2007) Climate Change 2007: Synthesis Report. Contribution of Working Groups I, II and III to the Fourth Assessment Report of the Intergovernmental Panel on Climate Change [Core Writing Team, Pachauri, R.K and Reisinger, A. (eds.)]. IPCC, Geneva, Switzerland, 104 pp.
14 Chen, C.-T.A. and Borges, A.V. (2009) Reconciling opposing views on carbon cycling in the coastal ocean: Continental shelves as sinks and near-shore ecosystems as sources of atmospheric CO2. Deep Sea Research II, 56, 578–590.
15 Nagelkerken, I., van der Velde, G., Gorissen, M.W., Meijer, G.J., van’t Hof, T. and den Hartog, C. (2000) Importance of mangroves, seagrass beds and the shallow coral reef as a nursery for important coral reef fishes, using visual census techniques. Estuarine, Coastal and Shelf Science., 51, 31–44.
16 Pergent, G., Romero, J., Pergent-Martini, C., Mateo, M.A. & Boudouresque, C-F. (1994) Primary Production, stocks, and fluxes in the Mediterranean seagrass Posidonia oceanica, Marine Ecology Progress Series. 106, 139–146.
17 Romero, J, Perez, M., Mateo, M.A., & C-F. (1994) The belowground organs of the Mediterranean seagrass Posidonia oceanic as a biogeochemical sink. Aquatic Botany., 47, 13–19.
18 Mateo, M.A., Romero, J., Perez, M., Littler, M.M. & Littler, D.S. (1997) Dynamics of Millenary Organic Deposits resulting from the growth of the Mediterranean seagrass Posidonia oceanica. Estuarine, Coastal and Shelf Science, 44, 103–110.
19 Mateo, M.A., Cebrian, J., Dunton, K. & Mutchler, T. (2006) Carbon Fluxes in Seagrass Ecosystems.
In W.D. Larkum, R.J. Orth & C.M. Duarte (eds.) Seagrasses: Biology, Ecology and Conservation. Springer 567–593.
20 Duarte, C. M., and J. Cebrián. 1996. The fate of marine autotrophic production. Limnology and Oceanography. 41, no. 8: 1758–66;
21 Crooks, S. (1996) Sedimentological Controls on the Geotechnical Properties of Intertidal Saltmarsh and Mudflat Deposits. PhD Thesis, University of Reading, U.K.
22 Crooks, S. (1999) A mechanism for the formation of overconsolidated horizons within estuarine floodplain alluvium: implications for the interpretation of Holocene sea level curves. In: S.B. Marriott and J. Alexander (eds.) Floodplains: Interdisciplinary Approaches. Geological Society Special Publication No. 163.
23 Andrews, J. E., Samways, G., Dennis, P.F. & Maher, B.A. (2000) Origin, abundance and storage of organic carbon and sulphur in the Holocene Humber Estuary: emphasizing human impacts on storage change. Geological Society, London Special Issue. 2000. 166,145–170.
24 Craft, C. (2007) Freshwater input structures soil properties, vertical accretion, and nutrient accumulation of Georgia and U.S. tidal marshes. Limnology and Oceanography, 52,1220–1230.
25 Atwater, B.F., Belknap, D.F. (1980) Tidal-wetland deposits of the Sacramento-San Joaquin Delta, California. In: Field ME, Bouma AH, Colburn IP, Douglas RG and Ingle JC, editors. Quaternary depositional environments of the Pacific Coast. Pacific Coast Paleogeography Symposium 4. Proceedings of the Society of Economic Paleontologists and Mineralogists. Los Angeles (CA): Society of Economic Paleontologists and Mineralogists. p 89–103.

51Marine Ecosystem Series
Sources Cited
26 Twilley, R.R., Chen, R.H. and Hargis, T. (1992) Carbon sinks in mangroves and their implications to carbon budget tropical coastal ecosystems. Water, Air and Soil Pollution. 64, 265–288.
27 Rojstazcer, S.A. and Deverel, S.J. (1995) Land subsidence in drained histosols and highly organic mineral soils of California. Soil Science Society of America. 59, 1162–1167.
28 Lallier-Verges, E., Perrussel, B.P., Disnar, J-P and Baltzer, F. (1998) Relationship between environmental conditions and the diagentic evolution of organic matter derived from higher plants in a modern mangrove swamp system (Guadeloupe, French West Indies). Organic Geochemistry. 29, 1663–1686.
29 Fujimoto, K., Imaya, A., Tabuchi, R., Kuramoto, S., Utsugi, H. & Murofushi, T. (2001) Below ground carbon storage of Micronesian mangrove forests. Ecological Research, 14, 409–413.
30 Warne, A.G., Meade, R.H., White, W.A., Guevara, E.H., Gibeaut, J., Smyth, R.C., Aslan, A. & Tremblay T. (2002) Regional Controls on geomorphology, hydrology and ecosystem integrity of the Orinoco Delta, Venezuela. Geomorphology, 44, 273–307.
31 Lovelock, C.E., Feller, I.C., KcKee, K.L., and Thompson, R. (2005). Variation in Mangrove Forest Structure and Sediment Characteristics in Bocas del Toro, Panama. Caribbean Journal of Science, 41, 456–464.
32 Craft, C.B. and Richardson, C.J. (2008) Soil Characteristics of the Everglades Peatland. In: Richardson C.J. (ed.) The Everglades Experiments: Lessons for Ecosystem Restoration. Springer-Verlag, New York. 59–72.
33 McKee, K.L., and Vervaeke, W.C. (2009) Impacts of human disturbance on soil erosion potential and habitat stability of mangrove-dominated islands in
the Pelican Cays and Twin Cays ranges, Belize, in Lang, M.A., Macintyre, I.G., and Rützler, K., eds., Proceedings of the Smithsonian Marine Science Symposium: Smithsonian Contributions to the Marine Sciences, no. 38, p. 415–427
34 Middleton B., Devlin, D., Proffitt, E., McKee, K. & Cretini, K.F. (2008) Characteristics of mangrove swamps managed for mosquito control in eastern Florida. Marine Ecology Progress Series. 371, 117–129
35 Fujimoto, K., Imaya, A., Tabuchi, R., Kuramoto, S., Utsugi, H. & Murofushi, T. (2001) Below ground carbon storage of Micronesian mangrove forests. Ecological Research, 14, 409–413.
36 Warne, A.G., Meade, R.H., White, W.A., Guevara, E.H., Gibeaut, J., Smyth, R.C., Aslan, A. & Tremblay T. (2002) Regional Controls on geomorphology, hydrology and ecosystem integrity of the Orinoco Delta, Venezuela. Geomorphology, 44, 273–307.
37 Takaya, Y. (1974) A physiographic classification of rice land in the Mekong Delta. Southeast Asian Studies. 12, 135–142.
38 Nguyen, H.C. (1993) Pedological Study of the Mekong Delta. Southeast Asian Studies., 31, 158–186.
39 Atwater, B.F., Belknap, D.F. (1980) Tidal-wetland deposits of the Sacramento-San Joaquin Delta, California. In: Field ME, Bouma AH, Colburn IP, Douglas RG and Ingle JC, editors. Quaternary depositional environments of the Pacific Coast. Pacific Coast Paleogeography Symposium 4. Proceedings of the Society of Economic Paleontologists and Mineralogists. Los Angeles (CA): Society of Economic Paleontologists and Mineralogists. p 89–103.
40 Drexler, J.Z., de Fontaine, C.S. & Deverel, S.J. (2009) The legacy of wetland drainage of the remaining peat in the Sacramento – San Joaquin Delta, California, USA. Wetlands, 29, 372–386.

Environment Department Papers52
Mitigating Climate Change through Restoration and Management of Coastal Wetlands and Near-shore Marine Ecosystems
41 Delft Hydraulics (2006) PEAT-CO2: Assessment of CO2 Emissions form Drained Peatlands in SE Asia. Report R&D Projects Q3943/Q3684/Q4142.
42 Giani, L., Bashan, Y., Holguin, G. & Strangmann, A. (1996) Characteristics and methanogensis of the Balandra lagoon mangrove soils, Baja California Sur, Mexico. Geoderma. 73, 149–160.
43 McKee, K.L., and Vervaeke, W.C. (2009) Impacts of human disturbance on soil erosion potential and habitat stability of mangrove-dominated islands in the Pelican Cays and Twin Cays ranges, Belize, in Lang, M.A., Macintyre, I.G., and Rützler, K., eds., Proceedings of the Smithsonian Marine Science Symposium: Smithsonian Contributions to the Marine Sciences, no. 38, p. 415–427
44 Andrews, J. E., Samways, G., Dennis, P.F. & Maher, B.A. (2000) Origin, abundance and storage of organic carbon and sulphur in the Holocene Humber Estuary: emphasizing human impacts on storage change. Geological Society, London Special Issue. 2000. 166,145–170.
45 Drexler, J.Z., de Fontaine, C.S. & Deverel, S.J. (2009) The legacy of wetland drainage of the remaining peat in the Sacramento – San Joaquin Delta, California, USA. Wetlands, 29, 372–386.
46 Huang, Y., Sun, W., Zhang, W., Yu, Y., Su, Y. and Song, C. (2009) Marshland conversion to cropland in northeast China from 1950 to 2000 reduced the greenhouse effect. Global Change Biology, doi: 10.1111/j.1365–2486.2009.01976.x
47 Andrews, J. E., Samways, G., Dennis, P.F. & Maher, B.A. (2000) Origin, abundance and storage of organic carbon and sulphur in the Holocene Humber Estuary: emphasizing human impacts on storage change. Geological Society, London Special Issue. 2000. 166,145–170.
48 Crooks, S. (1996) Sedimentological Controls on the Geotechnical Properties of Intertidal Saltmarsh and Mudflat Deposits. PhD Thesis, University of Reading, U.K.
49 Stephens, J.C., Allen, L.H. & Chen, E. (1984) Organic Soil Subsidence. In: T.L. Holzer (Ed.) Man-induced Land Subsidence. Reviews in Engineering Geology. 6, 107–122.
50 Rojstazcer, S.A. and Deverel, S.J. (1993) Time dependence in atmospheric carbon inputs from drainage of organic soils. Geophysical Research Letters 20, 1383–1386.
51 Holman, I.P. 2009. An Estimate of reserves and loss in the East Anglian Fens. Report Commissioned by the RSPB. http://www.rspb.org.uk/Images/Fenlandpeatassessment_tcm9–236041.pdf
52 Rojstazcer, S.A. and Deverel, S.J. (1993) Time dependence in atmospheric carbon inputs from drainage of organic soils. Geophysical Research Letters 20, 1383–1386.
53 Rojstazcer, S.A. and Deverel, S.J., (1995) Land subsidence in drained histosols and highly organic mineral soils of California. Soil Science Society of America. 59, 1162–1167.,
54 Deverel, S.J. and Leighton, D.A. (2010). Historic, Recent and Future Subsidence, Sacramento – San Joaquin Delta, California, USA. San Francisco Estuary and Watershed Science, 8–1–23.
55 Fornasiero, A., Gambolati, G., Putti, M., Teatini, P., Ferraris, S., Pitacco, A., Rizzetto., F., Tosi, L. Bonardi, M. & Gatti, P. (2002) Subsidence Due To Peat Soil Loss in the Zennare Basin (Italy: Design and Set-up of the Field Experiment. In: P. Campostrini (ed.) Scientific Research and Safeguarding of Venice. Instituto Veneto di Scienze Lettere ed Arti 201–215. Venezia.

53Marine Ecosystem Series
Sources Cited
56 Holman, I.P. 2009. An Estimate of reserves and loss in the East Anglian Fens. Report Commissioned by the RSPB. http://www.rspb.org.uk/Images/Fenlandpeatassessment_tcm9–236041.pdf
57 Ingebritsen, S.E., McVoy, C., Glaz, B. & park, W. (1999) Florida Everglades: Subsidence threatens agriculture and complicates ecosystem restoration. In. D. Galloway et al. (Eds.) Land Subsidence in the United States. U.S. Geological Survey Circular 1182, 95–106.
58 Wösten, J.H.M., Ismail, A.B. and Van Wijk, A.L.M. (1997) Peat subsidence and its practical implications: a case study in Malaysia. Geoderma 78, pp. 25–36.
59 Poffenbarger, H., B Needelman, JP Megonigal (in review). Methane emissions from tidal marshes. Wetlands.
60 Megonigal, JP., Schlesinger, WH. (2002) Methane-limited methanotrophy in tidal freshwater swamps. Global Biogeochemical Cycles 16(4).
61 Van Der Nat, F.J., Middelburg, J.J. (2000) Methane emission from tidal freshwater marshes. Biogeochemistry: 49, 103–121.
62 Bange, H.W. (2006) Nitrous oxide and methane in European coastal waters. Estuarine Coastal and Shelf Science 70:361–374.
63 Jickells, T. (1998) Nutrient Biogeochemistry of the Coastal Zone. Science 271(5374):217–222.
64 Spalding, M., Kainuma, M., Collins, L. (2010) World atlas of mangroves. ITTO, ISME, FAO, UNEP-WCMC, UNESCO-MAB and UNU-INWEH. Earthscan UK, USA.
65 Andriesse, W. & van Mensvoort, M.E.F., (2006). Acid Sulfate Soils: Distribution and Extent. p. 14–19.
In R Lal (ed) Encyclopedia of soil science: Volume 1, 2nd ed CRC Press, Boca Raton, FL.
66 Spalding, M., Kainuma, M., Collins, L. (2010) World atlas of mangroves. ITTO, ISME, FAO, UNEP-WCMC, UNESCO-MAB and UNU-INWEH. Earthscan UK, USA.
67 Craft, C., Megonigal, P., Broome, S., Stevenson, J., Freeze, R,, Cornell, J., Zheng, L., and Sacco, J. (2003). The pace of ecosystem development of constructed Spartina alterniflora marshes. Ecological Applications, 13., 1417–1432.
68 Chmura, G.L., Anisfield, S.C., Cahoon, D.R., Lynch, J.C. (2003) Global carbon sequestration in tidal, saline wetland soils. Global Biogeochemical Cycles: 1111, doi:10.1029/2002GB001917.
69 Duarte, C.M., Middelburg, J.J., Caraco, N. (2005) Major Role of Marine Vegetation on the Oceanic Carbon Cycle. Biogeosciences 2:1–8.
70 Philips Williams & Associates (PWA), Ltd & Science Applications International Corporation (SAIC) (2009) Greenhouse Gas Mitigation Typology Issues Paper Tidal Wetlands Restoration. Prepared for California Climate Action Registry. http://www.climateactionreserve.org/wp-content/uploads/2009/03/future-protocol-development_tidal-wetlands.pdf
71 Feijtel, T.C., Delaune, R.D., Patrick, W.H. (1985) Carbon Flow in Coastal Louisiana. Marine Ecology-Progress Series 24(3):255–260.
72 Miller, R., Fram, M., Fujii, R., Wheeler, G. (2008) Subsidence reversal in a re-established wetland in the Sacremento-San Joaquin Delta, California, USA. San Francisco Estuary & Watersheed Science. Available from: http://repositories.cdlib.org/jmie/sfews/vol6/iss3/art1.

Environment Department Papers54
Mitigating Climate Change through Restoration and Management of Coastal Wetlands and Near-shore Marine Ecosystems
73 Poffenbarger, H., B Needelman, JP Megonigal (in review). Methane emissions from tidal marshes. Wetlands.
74 Miller R, Fram M, Fujii R, Wheeler G. (2008) Subsidence reversal in a re-established wetland in the Sacremento-San Joaquin Delta, California, USA. San Francisco Estuary & Watersheed Science.: http://repositories.cdlib.org/jmie/sfews/vol6/iss3/art1.
75 Ibid
76 Personal Communication: Robin Miller.
77 Deverel, S.J. and Leighton, D.A. (2010) Historic, Recent and Future Subsidence, Sacramento – San Joaquin Delta, California, USA. San Francisco Estuary and Watershed Science, 8–1–23.
78 Craft, C. (2007) Freshwater input structures soil properties, vertical accretion and nutrient accumulation of Georgia and U.S. tidal marshes.
79 Yu, KW., Faulkner, SP., Patrick, WH. (2006) Redox potential characterization and soil greenhouse gas concentration across a hydrological gradient in a Gulf coast forest. Chemosphere 62(6):905–914.
80 Simenstad, C., Reed, D., and Ford, M., (2006) When is restoration not? Incorporating landscape-scale processes to restore self-sustaining ecosystems in coastal wetlands. Ecological Engineering. 26, 27–39.
81 Crooks, S. and Sharpe J. (2007) California Dreamin’ – Lessons in Coastal Marsh Restoration from San Francisco Bay. Proceedings of the DEFRA Flood and Coastal Erosion Risk Management Conference, York, UK.
82 Sundquist, E.T., Ackerman, K.V., Parker, L. & Huntzinger, D.N. (2009) An introduction to global carbon cycle management. In: Carbon Sequestration
and Its Role in the Global Carbon Cycle. Geophysical Monograph Series, 183, 1–23.
83 Godfrey, H.C.J., Beddington, J.R., Crute, I.R., Haddad, L., Lawrence, D., Muir, J.F., Pretty, J., Robinson, S., Thomas, S.M. & Toulmin, C. (2010) Food Security: The Challenge of Feeding 9 Billion People. Science 327, 812–817.
84 Harris, R.J., Milbrandt, E.C., Everham III, E.M. & Bovard, B.D. (2010) the effects of reduced tidal flushing on Mangrove structure and function across a disturbance gradient. Estuaries and Coasts. DOI 10.1007/s12237-010-9293-2.
85 www.sws.org/wetland_concerns/docs/restoration.pdf
86 Barbier, E.B. (2007) Valuing ecosystem services as productive inputs. Economic Policy 22(01):179–229 pp.
87 Das, S. and Vincent, J.R. 2009. Mangroves protected villages and reduce death toll during Indian super cyclone. Proceedings of the National Academy of Science 106, 7357–7360.
88 UNEP-WCMC (2006) In the front line: shoreline protection and other ecosystem services from mangroves and coral reefs. UNEP-WCMC, Cambridge, UK 33 pp.
89 Barbier, E.B. (2007) Valuing ecosystem services as productive inputs. Economic Policy 22(01):179–229 pp.
90 UNEP-WCMC (2006) In the front line: shoreline protection and other ecosystem services from mangroves and coral reefs. UNEP-WCMC, Cambridge, UK 33 pp.
91 Barbier, E.B. (2007) Valuing ecosystem services as productive inputs. Economic Policy 22(01):179–229 pp.
55Marine Ecosystem Series
Sources Cited
92 UNEP (2006) Marine and coastal ecosystems and human well-being: A synthesis report based on the findings of the Millennium Ecosystem Assessment. UNEP. 76 pp.
93 FAO (2004) The State of World Fisheries.
94 Hale, L. et al. (2009) Ecosystem-based Adaptation in Marine and Coastal Ecosystems. Renewable Resources Journal 21, 25 (4)
95 Convention on Biological Diversity (CBD) (2009) Connecting Biodiversity and Climate Change. Mitigation and Adaptation – Report of the Second Ad Hoc Technical Expert Group on Biodiversity and Climate Change under the Convention on Biological Diversity. Montreal, Technical Series No. 41, 126 pages. https://www.cbd.int/doc/publications/cbd-ts-41-en.pdf
96 Spalding, M., Kainuma, M., Collins, L. (2010) World atlas of mangroves. ITTO, ISME, FAO, UNEP-WCMC, UNESCO-MAB and UNU-INWEH. Earthscan UK, USA.
97 Curke, L., Kura, Y., Kassem, K., Revenga, C., Spalding, M. and McAllister, D. (2001) Pilot analysis of global ecosystems: coastal ecosystems. World Resources Institute. 77 pp.
98 Dudley, N., Stolton, S., Belokurov, A., Krueger, L., Lopokhine, N., MacKinnon, K., Sandwith, T. and Sekhran, N. [eds] (2010) Natural solutions: protected areas helping people cope with climate change. IUCN-WCPA, TNA, UNDP, WCS, The World Bank and WWF. Gland, Switzerland, Washington DC and New York USA. 126 pp.
99 Secretariat of the Convention on Biological Diversity (2010) Global Biodiversity Outlook 3. Montreal. 94 pp.
100 FAO (2007) The world’s mangroves 1980–2005. FAO Forestry Paper 153, Rome.
101 Spalding, M., Kainuma, M., Collins, L. (2010) World atlas of mangroves. ITTO, ISME, FAO, UNEP-WCMC, UNESCO-MAB and UNU-INWEH. Earthscan UK, USA.
102 Green, E.P. and Short, F.T. (2003) World atlas of seagrasses. University of California Press, Los Angeles. 298 pp.
103 Waycott, M et al. (2009) Accelerating loss of seagrass across the globe threatens coastal ecosystems. PNAS. 106 (30).
104 UNEP (2004) Seagrass in the South China Sea. UNEP/GEF/SCS Technical Publication No. 3
105 Curke, L., Kura, Y., Kassem, K., Revenga, C., Spalding, M. and McAllister, D. (2001) Pilot analysis of global ecosystems: coastal ecosystems. World Resources Institute. 77 pp.
106 Heileman and Rabalais 2009. Gulf of Mexico LME. In: Sherman, K. and Hempel, G. (Editors) 2009. The UNEP Large Marine Ecosystem Report: A perspective on changing conditions in LMEs of the world’s Regional Seas. UNEP Regional Seas Report and Studies No. 182. United Nations Environment Programme. Nairobi, Kenya.
107 Secretariat of the Convention on Biological Diversity (2010) Global Biodiversity Outlook 3. Montreal. 94 pp.
108 Saintilan, N. and Rogers, K. (2009) Coastal saltmarsh vulnerability to climate change in SE Australia.
109 Gaden, K.B., Silliman, B.R., and Bertness, M.D. (2009) Centuries of human-driven change in salt marsh ecosystems. Annual Review Marine Science. 1, 117–141.

Environment Department Papers56
Mitigating Climate Change through Restoration and Management of Coastal Wetlands and Near-shore Marine Ecosystems
110 FEMA (1991) Projected Impact of Relative Sea Level Rise on the National Flood Insurance Program.
Published by Federal Emergency Management Agency, Federal Insurance Adminstration.
111 Philip William and Associates, Ltd. and Science Applications International Corporation (2009) Greenhouse Gas Mitigation Typology Issues Paper Tidal Wetlands Restoration, prepared for the California Climate Action Registry.
112 Yang, S-L and Chen J-Y. (1995) Coastal salt marsh and mangrove swamps in China. Chinese Journal of Oceanology and Limnology. 13, 318–324
113 An, S., Li, H., Guan, B., Zhou, C., Wang, Z., Deng, Z., Zhi, Y., Xu, C., fang, S., Jiang, J. and Li., H. (2007) China’s natural wetlands: past problems, current status, and future challenges. Ambio 36, 335–342.
114 Department of Environmental Water and Rivers Commission (2002) Draft DEWCP and EPA guidance on managing acid sulfate soils. Retrieved from: http://www.wicc.southcoastwa.org.au/reports/ass7/ass7.html [Date accessed: 19th August, 2010]
115 UNFPA (2009) State of the World’s Population 2009. Facing a changing world: women, population and climate. United Nations Population Fund. 104 pp.
116 Coleman, J.M., Huh, O.K., Braud Jr., D. (2008) Wetland loss in world deltas. Journal of Coastal Research. 24(1A), 1–14.
117 Crooks. S. and Turner, R.K., (1999) Integrated coastal management: sustaining estuarine natural resources. Advances in Ecological Research. 29, 241–289.
118 Syvitski, J.P.M., Vörösmarty, C.J., Kettner, A.J. and Green, P. (2005) Impact of Humans on the Flux
of Terrestrial Sediment to the Global Ocean. Science 308:376–380
119 UNEP (2006) Marine and coastal ecosystems and human well-being: A synthesis report based on the findings of the Millennium Ecosystem Assessment. UNEP. 76 pp.
120 Syvitski, J.P.M., Kettner, A. J., Overeem, I., Hutton, E. W., Hannon, M. T., Brakenridge, G. R., Day, J., Vörösmarty, C., Saito, Y., Giosan, L.,and Nicholls, R.J. (2009) Sinking deltas due to human activities. Nature Geoscience. 2, 681–686
121 Valiela, I., Bowen J.L., and York J.K. (2001) Mangrove forests: one of the world’s threatened major tropical environments. Bioscience. 51: 807–815.
122 Barbier, E.B. (2007) Valuing ecosystem services as productive inputs. University of Wyoming. Pp. 179–229.
123 UNEP (2006) Marine and coastal ecosystems and human well-being: A synthesis report based on the findings of the Millennium Ecosystem Assessment. UNEP. 76 pp.
124 Curke, L., Kura, Y., Kassem, K., Revenga, C., Spalding, M. and McAllister, D. (2001) Pilot analysis of global ecosystems: coastal ecosystems. World Resources Institute. 77 pp.
125 Bjork, M., Short, F., Mcleod, E. and Beer, S. (2008) Managing segrasses for resilience to climate change. IUCN, Gland, Switzerland. 56 pp.
126 Nicholls, R.J. (2004) Coastal flooding and wetland loss in the 21st century: changes under the SRES climate and socio-economic scenarios. Global Environmental Change 14(1):69–86.
127 Sale, P.F., M.J. Butler IV, A.J. Hooten, J.P. Kritzer, K.C. Lindeman, Y. J. Sadovy de Mitcheson,

57Marine Ecosystem Series
Sources Cited
R.S. Steneck, and H. van Lavieren (2008) Stemming Decline of the Coastal Ocean: Rethinking Environmental Management, UNU-INWEH, Hamilton, Canada.
128 Secretariat of the Convention on Biological Diversity (2010) Global Biodiversity Outlook 3. Montreal. 94 pp.
129 Pethick, J.S., 2001. Coastal management and sea level rise. Catena, 42, 307–322.
130 Crooks, S., The effect of sea level rise on coastal geomorphology. Ibis, 146(suppl.1),18–20.
131 Crooks, S., Emmett-Mattox, S. & Findsen, F. (2010) Findings of the National Blue Ribbon Panel on the Development of a Greenhouse Gas Offset Protocol for Coastal Wetlands Restoration and Management: Action Plan. Restore America’s Estuaries, Philip Williams & Associates, Ltd. and Science Applications International Corporation. August, 2010.
https://www.estuaries.org/images/stories/rae-action-plan-tidal-wetlandsghg-offset-protocol-aug-2010.pdf
132 See for example Philips Williams & Associates (PWA), Ltd & Science Applications International Corporation (SAIC) (2009) Greenhouse Gas Mitigation Typology Issues Paper Tidal Wetlands Restoration. Prepared for California Climate Action Registry. http://www.climateactionreserve.org/wp-content/uploads/2009/03/future-protocol-development_tidal-wetlands.pdf
133 http://unfccc.int/files/meetings/cop_16/application/pdf/cop16_lca.pdf
134 Zambia (2010) UN-REDD Programme – Zambia Quick Start Initiative. UN Collaborative Programme on Reducing Emissions from deforestation and forest degradation in developing countries national joint programme document. http://www.un-redd.org/
UNREDDProgramme/CountryActions/zambia/tabid/1029/language/en-US/Default.aspx
135 http://unfccc.int/resource/docs/2010/awglca12/eng/14.pdf (Page 52)
136 Yee, M.E. (2010) REDD and BLUE Carbon: Carbon Payments for Mangroves Conservation. MAS Marine Biodiversity and Conservation, Capstone Project.
137 Murray, B.C., Pendleton, L., Jenkins, A., Sifleet, S. with Contributions by Craft, C., Crooks, S., Donato., D., Fourqurean, J., Kauffmann, B., Marba, N., Megonigal, P. and Pidgeon E., (2011). Green Payments for Blue carbon: Economic Incentives for Protecting Threatened Coastal Habitats. Report to the Linden Trust for Conservation. 47pp.
138 Under examination by the Nichols School of the Environment at Duke University, Funded by the Linden Trust Foundation.
139 http://unfccc.int/resource/docs/2010/awg15/eng/crp04r04.pdf
140 FCCC/KP/AWG/2009/17 – “Wetlands” includes land that is covered or saturated by water for all or part of the year, such as peatland, and which does not fall under the forest land, cropland, grassland or settlement categories.
141 http://unfccc.int/resource/docs/2010/awg15/eng/crp04r04.pdf
142 http://www.ecosystemsclimate.org/NewsEvents/Pressreleases/tabid/1617/articleType/ArticleView/articleId/2024/Default.aspx
143 EDF Forestry and Land Use Policy Basics (LULUCF) June 2010 – Summary
144 EDF Fixing forest and land accounting rules June 2010 – Recommendations

Environment Department Papers58
Mitigating Climate Change through Restoration and Management of Coastal Wetlands and Near-shore Marine Ecosystems
145 Ellis, J., Moarif, S. & Briner, G (2010) Core Elements of national reports. OECD, IEA. http://www.oecd.org/dataoecd/28/32/45409866.pdf
146 Ellis, J., Moarif, S. & Briner, G (2010) Core Elements of national reports. OECD, IEA. http://www.oecd.org/dataoecd/28/32/45409866.pdf
147 http://www.ipcc-nggip.iges.or.jp/public/gpglulucf/gpglulucf_contents.html
148 Revision of the UNFCCC reporting guidelines on annual inventories for Parties included in Annex I to the Convention. Draft conclusions proposed by the (SBSTA) Chair http://unfccc.int/resource/docs/2010/sbsta/eng/l12.pdf
149 http://www.ipcc-nggip.iges.or.jp/public/2006gl/pdf/4_Volume4/V4_07_Ch7_Wetlands.pdf
150 Views on issues relating to the 2006 IPCC Guidelines and the revision of the UNFCCC Annex I reporting guidelines Submissions from Parties (March 2010) http://unfccc.int/resource/docs/2010/sbsta/eng/misc01.pdf
151 http://www.ipcc-nggip.iges.or.jp/public/gpglulucf/gpglulucf_contents.html
152 http://www.ipcc-nggip.iges.or.jp/public/2006gl/pdf/4_Volume4/V4_07_Ch7_Wetlands.pdf
153 http://www.ipcc-nggip.iges.or.jp/public/2006gl/pdf/4_Volume4/V4_02_Ch2_Generic.pdf
154 http://www.ipcc-nggip.iges.or.jp/public/2006gl/pdf/4_Volume4/V4_05_Ch5_Cropland.pdf
155 http://www.ipcc-nggip.iges.or.jp/public/2006gl/pdf/4_Volume4/V4_07_Ch7_Wetlands.pdf
156 Crooks, S., Emmett-Mattox, S. & Findsen, F. 2010. Findings of the National Blue Ribbon Panel on
the Development of a Greenhouse Gas Offset Protocol for Coastal Wetlands Restoration and Management: Action Plan. Restore America’s Estuaries, Philip Williams & Associates, Ltd. and Science Applications International Corporation. August, 2010.
157 Philips Williams & Associates (PWA), Ltd & Science Applications International Corporation (SAIC) (2009) Greenhouse Gas Mitigation Typology Issues Paper Tidal Wetlands Restoration. Prepared for California Climate Action Registry. http://www.climateactionreserve.org/wp-content/uploads/2009/03/future-protocol-development_tidal-wetlands.pdf
158 Chmura, G.L., Anisfield, S.C., Cahoon, D.R., Lynch, J.C. (2003) Global carbon sequestration in tidal, saline wetland soils. Global Biogeochemical Cycles: 1111, doi:10.1029/2002GB001917.
159 Nellemann, C., Corcoran, E., Duarte, C.M., Valdes, L., DeYoung, C., Fonseca, L., Grimsditch. G. (Eds) (2009) Blue Carbon. A Rapid Response Assessment. UNEP, Grid-Arendal, www.grida.no
160 Laffoley, D. & Grimsditch, G. (eds) (2009) The management of natural coastal carbon sinks. IUCN, Gland, Switzerland. 53pp.
161 Philips Williams & Associates (PWA), Ltd & Science Applications International Corporation (SAIC) (2009) Greenhouse Gas Mitigation Typology Issues Paper Tidal Wetlands Restoration. Prepared for California Climate Action Registry. http://www.climateactionreserve.org/wp-content/uploads/2009/03/future-protocol-development_tidal-wetlands.pdf
162 Crooks, S., Emmett-Mattox, S. & Findsen, F. 2010. Findings of the National Blue Ribbon Panel on the Development of a Greenhouse Gas Offset Protocol for Coastal Wetlands Restoration and Management: Action Plan. Restore America’s Estuaries, Philip Williams & Associates, Ltd. and Science Applications International Corporation. August, 2010.

59Marine Ecosystem Series
Sources Cited
163 http://www.v-c-s.org/docs/VCS-Program-PRC-Public-Consultation-Document.pdf
164 VCS (2010) VCS Consultation Document: Proposal for Inclusion of Peatland Rewetting and Conservation (PRC) under VCS Agriculture, Forestry and Other Land Use (AFOLU) Program. Voluntary Carbon Standards. 19 may, 2010.
165 Crooks, S., Emmett-Mattox, S. & Findsen, F. (2010) Findings of the National Blue Ribbon Panel on the Development of a Greenhouse Gas Offset Protocol
for Coastal Wetlands Restoration and Management: Action Plan. Restore America’s Estuaries, Philip Williams & Associates, Ltd. and Science Applications International Corporation. August, 2010.
166 http://cmsdata.iucn.org/downloads/carbon_managment_report_final_printed_version.pdf
167 http://www.grida.no/publications/rr/blue-carbon/
168 https://www.estuaries.org/climate-change.html

Printed on recycled paper stock, using soy inks.
E N V I R O N M E N T D E P A R T M E N T P A P E R S
Susta inab le Deve lopment V ice Pres idency
Environment DepartmentT H E W O R L D B A N K
1818 H Street, NWWashington, D.C. 20433 USATelephone: 202-473-3641Facsimile: 202-477-0565Internet: www.worldbank.org/environment
IUCN Washington DC Office
1630 Connecticut Avenue, NWSuite 300Washington, D.C. 20009 USATelephone: 202-518-2056Facsimile: 202-387-4823Internet: www.IUCN.org/USA
PWA-ESA
550 Kearny StreetSuite 900San Francisco, CA 94108-2404 USA Telephone: 415-262-2300Facsimile: 415-262-2303Internet: www.pwa-ltd.com
Paper number 121
Marine Ecosystem Series
Mitigating Climate Change through Restoration and Management of Coastal Wetlands and Near-shore Marine Ecosystems
Challenges and Opportunities
Stephen Crooks, Dorothée Herr, Jerker Tamelander, Dan Laffoley, and Justin Vandever
March 2011