Embed Size (px)
Citation preview
MISCELLANEOUS PAPER CERC-92-2
COASTAL RESPONSE TO A DUAL JETTYSYSTEM AT LITTLE RIVER INLET,
A...2.8 739. NORTH AND SOUTH CAROLINAAD-A248 739flhIiM by
Monica A. Chasten
Coastal Engineering Research Center
DEPARTMENT OF THE ARMYWaterways Experiment Station, Corps of Engineers
3909 Halls Ferry Road, Vicksburg, Mississippi 39180-6199
DTICf ELECTE
APR 211992
March 1992Final Report
Approved For Public Release; Distribution Is Unlimited
9 2-10034
Prepared for US Army Engineer District, CharlestonCharleston, South Carolina 29402-0919
92 4 90 026
Destroy this report when no longer needed. Do not returnit to the originator.
The findings in this report are not to be-construed as an officialDepartment of the Army position unless so designated
by other authorized documents.
The contents of this report are not to be used foradvertising, publication, or promotional purposes.Citation of trade names does not constitute anofficial endorsement or approval of the use of
such commercial products.
II
Form A~WO eREPORT DOCUMENTATION PAGE OMB No. 70o18
auh .vn~qrden for thK odC~400 of rnformalt~on '1 est d to arerag I hour evhp oie Mnulgte tune for reviewngstucfi.erdnentgda ore.gathwrmn and maontasnmfi the daita needad., and € OenlOI~mf and fevb~wm9i the cofeCts~o nOfl'a . laNd comet rfqaningl tis budn animate or an y othe ieatofti
cOfIKlmOn of ortnOM n. i nclud'ong tu gm t s for rducng ths buren, to Wfthwqw Iafeedbrtern Sersces. Dietorae for Informaton Operatmon, an fepoM 12IS JefferSf i
OavunHghway. Suite IM04. ArlingtOn. V& 22202-4302. and to the Offie of Monageient aW Budget. Paprort Reduction Prtoect (07M4-013M). We 9ngton0. DC 20503
1. AGENCY USE ONLY (Leave ank) 2. REPORT DATE 3. REPORT TYPE AND DATES COVEREDI March 1992 Final report
4. TITLE AND SUBTITLE S. FUNDING NUMBERS
Coastal Response to a Dual Jetty systim at LittleRiver Inlet, North and South Carolina
6. AUTHOR(S)Monica A. Chasten
7. PNORMING ONIRNAGON NAME(S) AND ADRESS(ES) 8. PORMING OGANIAIONUSAE Waterways Experiment Station, Coastal REPORT NUMER
Engineering Research Center, 3909 Halls Ferry Miscellaneous PaperRoad, Vicksburg, MS 39180-6199 CERC-92-2
9. SPONSORING / MONITORING AGENCY NAME(S) AND ADDRESS(ES) 10. SPONSORING / MONITORING
AGENCY REPORT NUMBER
US Army Engineer District, CharlestonPO Box 919, Charleston, SC 29402-0919
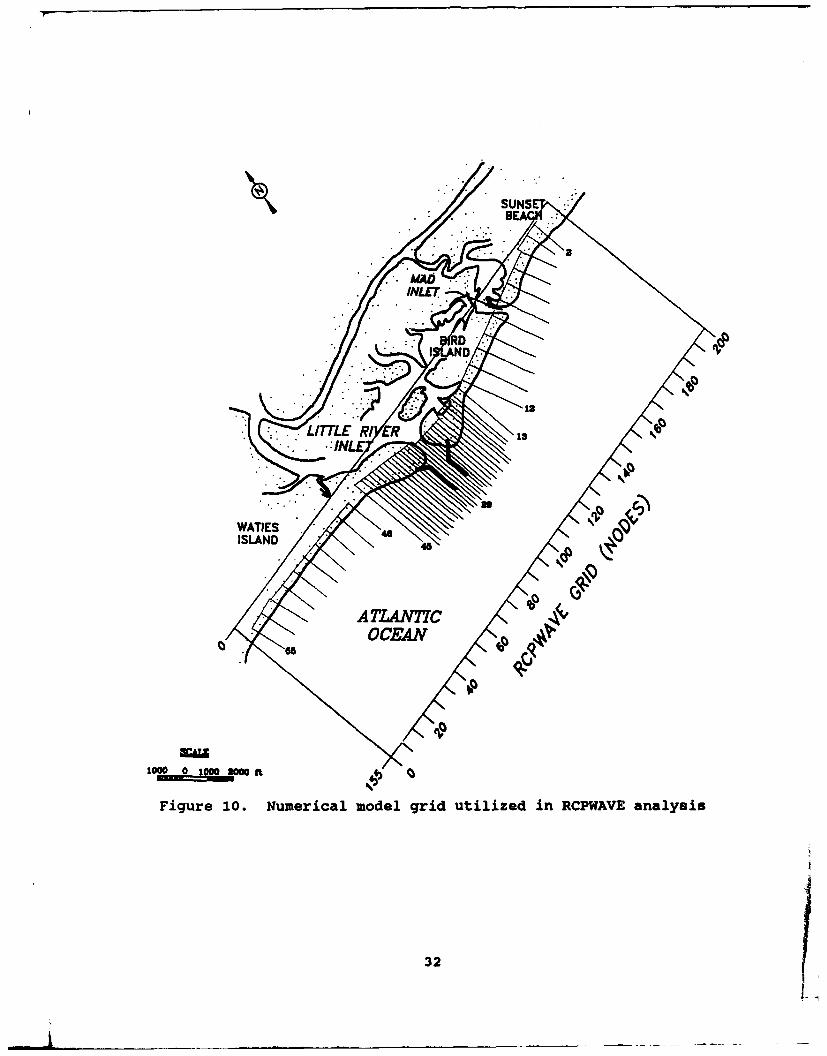
11. SUPPLEMENTARY NOTES
Available from National Technical Information Service, 5285 Port Royal Road,Springfield, VA 22161.
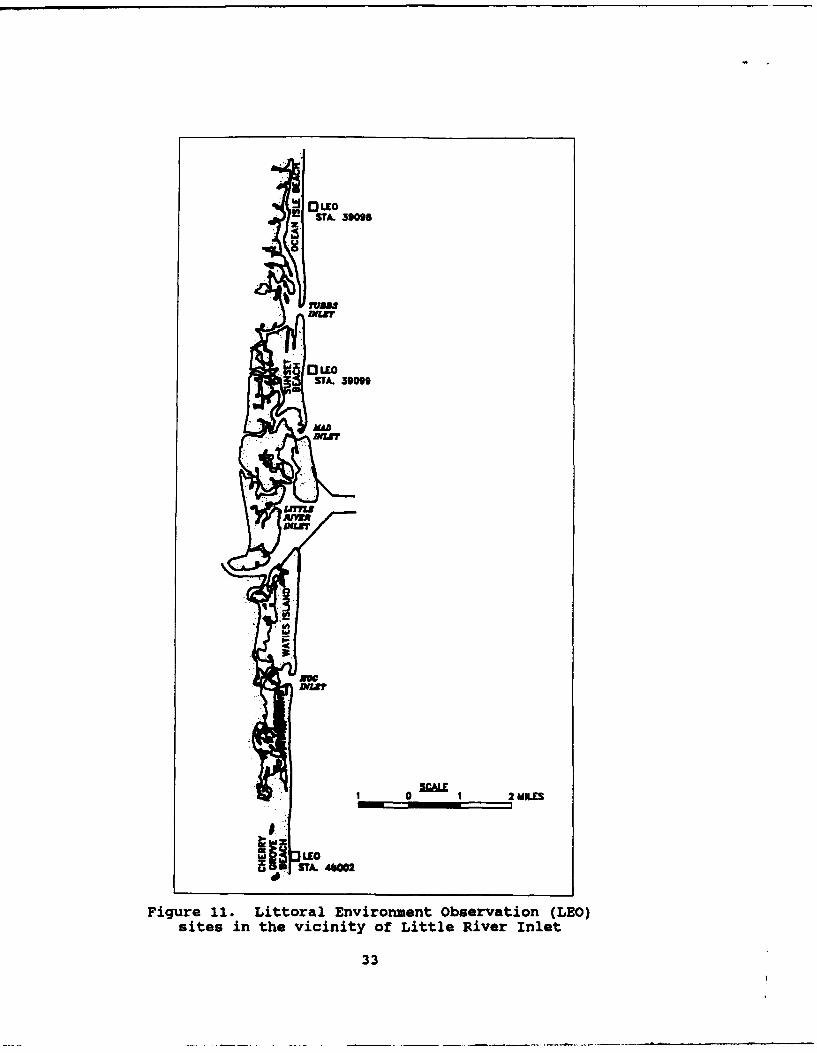
12a. DISTRIB&JTION/AVAILABILITY STATEMENT 12b. DISTRIBUTION CODE
Approved for public release; distribution is unlimited
13. ABSTRACT (Maximum 200 word)
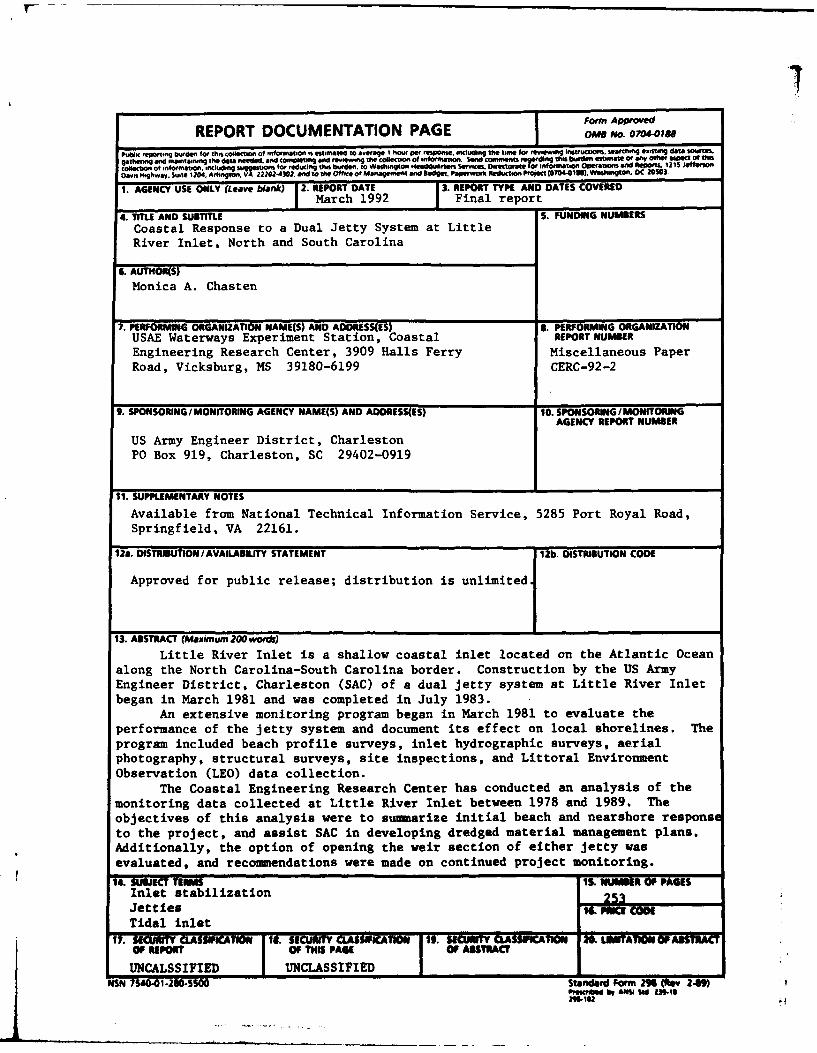
Little River Inlet is a shallow coastal inlet located on the Atlantic Oceanalong the North Carolina-South Carolina border. Construction by the US ArmyEngineer District, Charleston (SAC) of a dual Jetty system at Little River Inletbegan in March 1981 and was completed in July 1983.
An extensive monitoring program began in March 1981 to evaluate theperformance of the jetty system and document its effect on local shorelines. Theprogram included beach profile surveys, inlet hydrographic surveys, aerialphotography, structural surveys, site inspections, and Littoral EnvironmentObservation (LEO) data collection.
The Coastal Engineering Research Center has conducted an analysis of themonitoring data collected at Little River Inlet between 1978 and 1989. Theobjectives of this analysis were to stunarize initial beach and nearshore responseto the project, and assist SAC in developing dredged material management plans.Additionally, the option of opening the weir section of either Jetty wasevaluated, and recommendations were made on continued project monitoring.
14. SUBJECT TERMS IS. NUMER OF PAGESInlet stabilizationJetties is PI CmTidal inlet
17.S10WY LASICAN SCLO CLSSIICTM It 510511 CLASSIFICA X UONTOF REPORT OF TNIS PAGE OF ABSTRACT
UNCALSSIFIED [UNCLASSIFIED INSN 7S40-01.210-SSOO Standard Form M (ROv ,4)J~~~ ~ ~~~~~m* O7. SE"RT SSWIAO MISECRTYOASWC
PREFACE
The investigation summarized in this report was conducted bythe US Army Engineer Waterways Experiment Station's (WES's)Coastal Engineering Research Center (CERC) through a reimbursablestudy for the US Army Engineer District, Charleston (SAC).Messrs. James Joslin and Millard Dowd were the SAC representa-tives involved in this study. Funds were provided by SAC.
Work was performed at WES under the general supervision ofDr. Yen-hsi Chu, Chief, Engineering Applications Unit (EAU),Coastal Structures and Evaluation Branch (CSEB), CERC; Ms. JoanPope, Chief, CSEB; Mr. Thomas W. Richardson, Chief, EngineeringDevelopment Division (EDD); Mr. Charles C. Calhoun, Jr.,Assistant Chief, CERC; and Dr. James R. Houston, Chief, CERC.
This report was prepared by the Principal Investigator (PI)of the reimbursable study, Ms. Monica A. Chasten, EAU, CSEB.Mr. Don Ward, Wave Dynamics Division, conducted the RCPWAVE andlongshore transport analyses. Technical assistance with the dataanalysis was provided by Mr. Bill Birkemeier, Chief, FieldResearch Facility; Mses. Kelly Lanier and Karen Pitchford andMessrs. Joseph Curro, III and Darryl Bishop, all of CSEB.Ms. Lanier, Mr. Bishop, and Ms. Janie Daughtry providedassistance in preparing the manuscript and figures. Technicalreviewers of the report were Dr. Yen-hsi Chu and Dr. Douglas R.Levin, Assistant Professor of Science, Bryant College, formerlyof CERC. The assistance of Mr. Millard Dowd, SAC, throughout thestudy is greatly appreciated.
A special acknowledgement is extended to Mr. Perry Reed,Civil Engineering Technician, EAU, CSEB who performed much of thebathymetry analysis. Mr. Reed passed away on 4 January 1991.
Dr. Robert W. Whalin was Director of WES. COL Leonard G.Hassell, EN, was Commander and Deputy Director.
1
-i,-..---.-_- .. - -
CONTENTS
PREFACE ................................................... 1
CONVERSION FACTORS, NON-SI TO SI (METRIC)
UNITS OF MEASUREMENT ............................. ........ 3PART 1: INTRODUCTION. . . ... .. ....................... 5
Purpose .............................. 5Background ............................ .......... 5Physical Setting . .............................. 6Project Description ................... .......... 8Construction and Dredging History ............... 10Monitoring Program................................ 11
PART II: DATA ANALYSIS METHODS AND RESULTS ............... 12Beach Profile and Inlet Hydrographic Data ....... 12Historical Shoreline Change Maps ................. 14Aerial Photography ................................ 18Wave Refraction Analysis .......................... 18LEO Data ........................................ 31
PART III: SUMMARY OF RESULTS AND DISCUSSION ............... 35
Longshore Transport Trends ........................ 35Shoreline Response ................................ 38Shoal and Fillet Volumes ........................ 47Jetty Scour and Channel Migration ............... 48
PART IV: RECOMMENDATIONS ................................. 51
Dredged Material Disposal Options ............... 51Continued Monitoring Efforts .................... 52Continued Analysis .............................. 53
REFERENCES ................................................ 54
APPENDIX A: BEACH PROFILES ............................... Al
APPENDIX B: POST-HUGO BEACH PROFILES ..................... BiAPPENDIX C: CUMULATIVE SHORELINE CHANGE .................. Cl
APPENDIX D: ABOVE-DATUMVOLUME CHANGE .................... Dl
APPENDIX E: BATHYMETRIC CONTOUR MAPS ..................... El
APPENDIX F: NUMERICAL MODEL METHODOLOGY ANDLONGSHORE TRANSPORT PLOTS .................... F1
APPENDIX G: LITTORAL ENVIRONMENT OBSERVATIONS ............ Gi
2
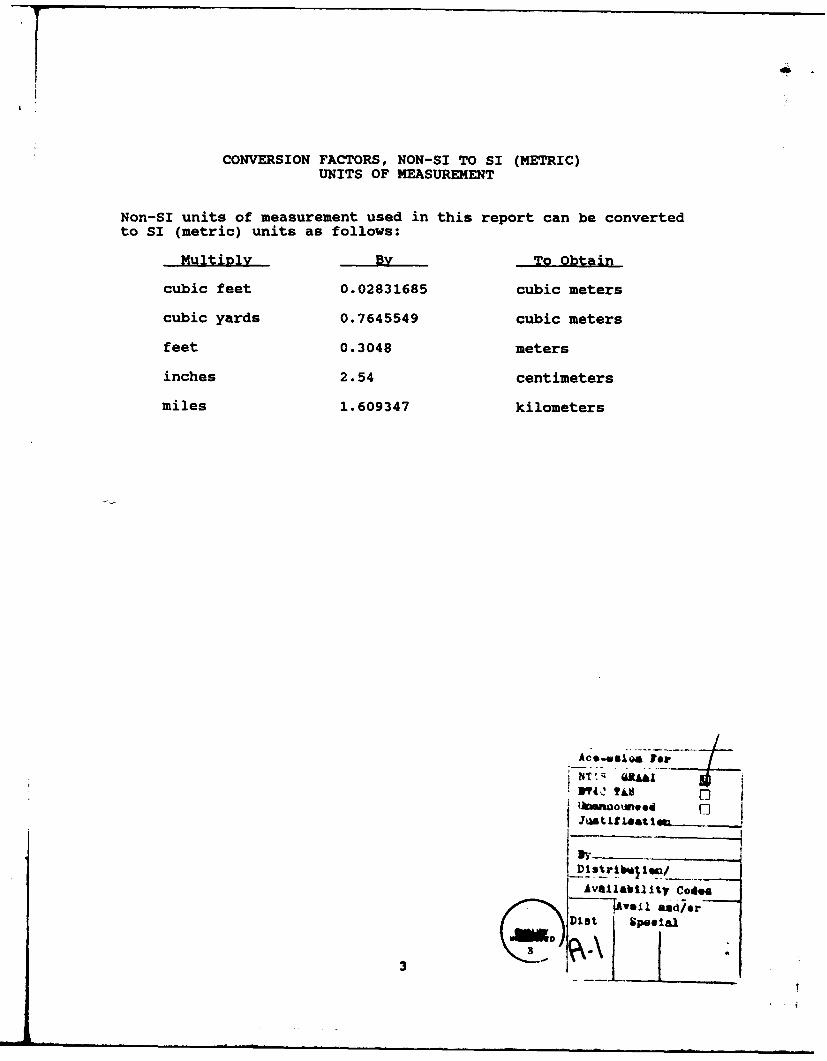
CONVERSION FACTORS, NON-SI TO SI (METRIC)UNITS OF MEASUREMENT
Non-SI units of measurement used in this report can be converted
to SI (metric) units as follows:
Multi]lY By To Obtain
cubic feet 0.02831685 cubic meters
cubic yards 0.7645549 cubic meters
feet 0.3048 meters
inches 2.54 centimeters
miles 1.609347 kilometers
K /
Ivfllabl ity Cod..
AVail and/orDlst speeial
3
tNORME CABOWI&
SOUTH irCAR0M
HOCLA INLETa
Figure~~ ~~~ 1. Suyae lcto a
LITL
COASTAL RESPONSE TO A DUAL JETTY SYSTEM AT LITTLE RIVER INLET.NORTH AND SOUTH CAROLINA
PART I: INTRODUCTION
Purpose
1. The Waterways Experiment Station's (WES) CoastalEngineering Research Center (CERC) conducted an analysis for theU.S. Army Engineer District, Charleston (SAC) of the monitoring
data collected at Little River Inlet, North and South Carolina
from 1979 to 1989. The objectives of this analysis were tosummarize initial beach and nearshore response to the Little
River Inlet navigation project, and essist SAC in developing
dredged material management plans. Additionally, the option ofopening the weir section of either jetty was evaluated, and
recommendations made on continued project monitoring.
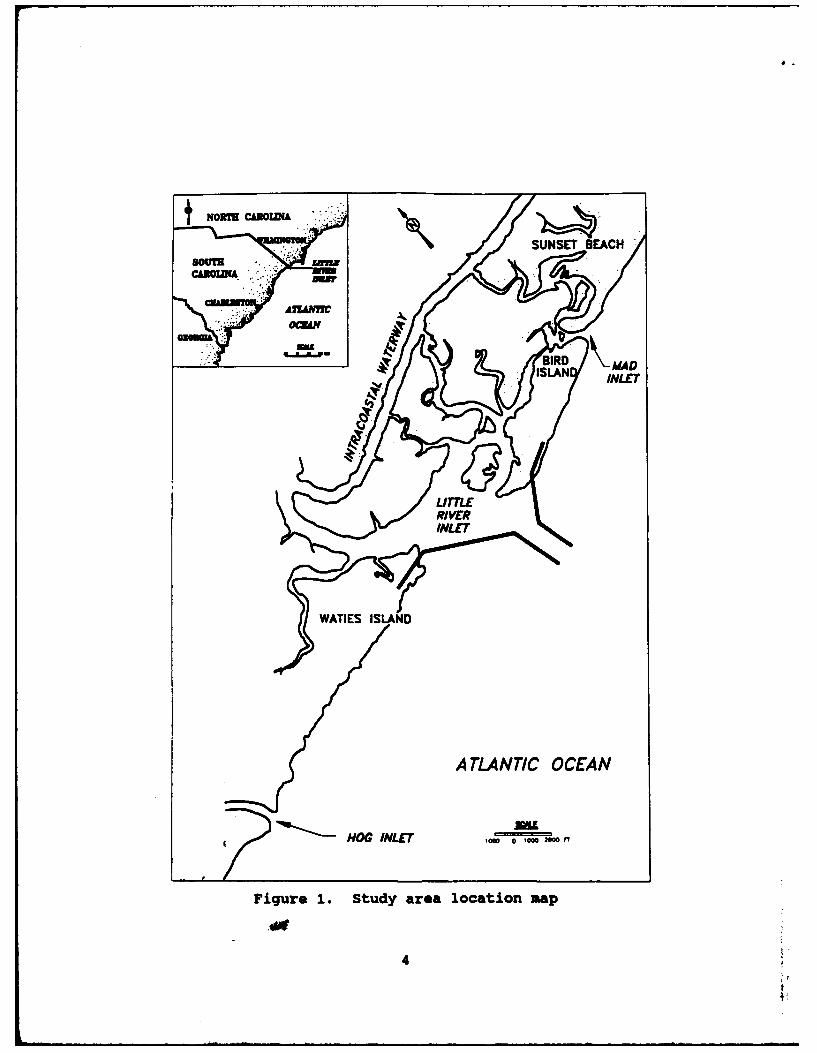
2. Little River Inlet is located on the Atlantic Ocean
along the North Carolina-South Carolina border, approximately
23 miles" northeast of Myrtle Beach, South Carolina (Figure 1).
The inlet is the ocean entrance to the towns of Little River and
Calabash, the Atlantic Intracoastal Waterway (AIWW), and several
tidal streams. The back bay serves as a safe coastal harbor for
many private, recreational, and commercial fishing boats (US Army
Corps of Engineers 1977). Little River Inlet is the only oceanoutlet from the AIWW between Shallotte Inlet, NC and Georgetown,
SC, a distance of 68 miles.
'A table of factors for converting non-SI units of measurement toSI (metric) units is presented on page 3.
5
3. The inlet is part of the "Grand Strand," an area along
South Carolina's northeastern shore consisting of 60 miles of
resort beaches. Bird Island, an undeveloped privately-owned area
lies to the northeast of the inlet. To the southwest is Waties
Island, also privately owned and undeveloped.
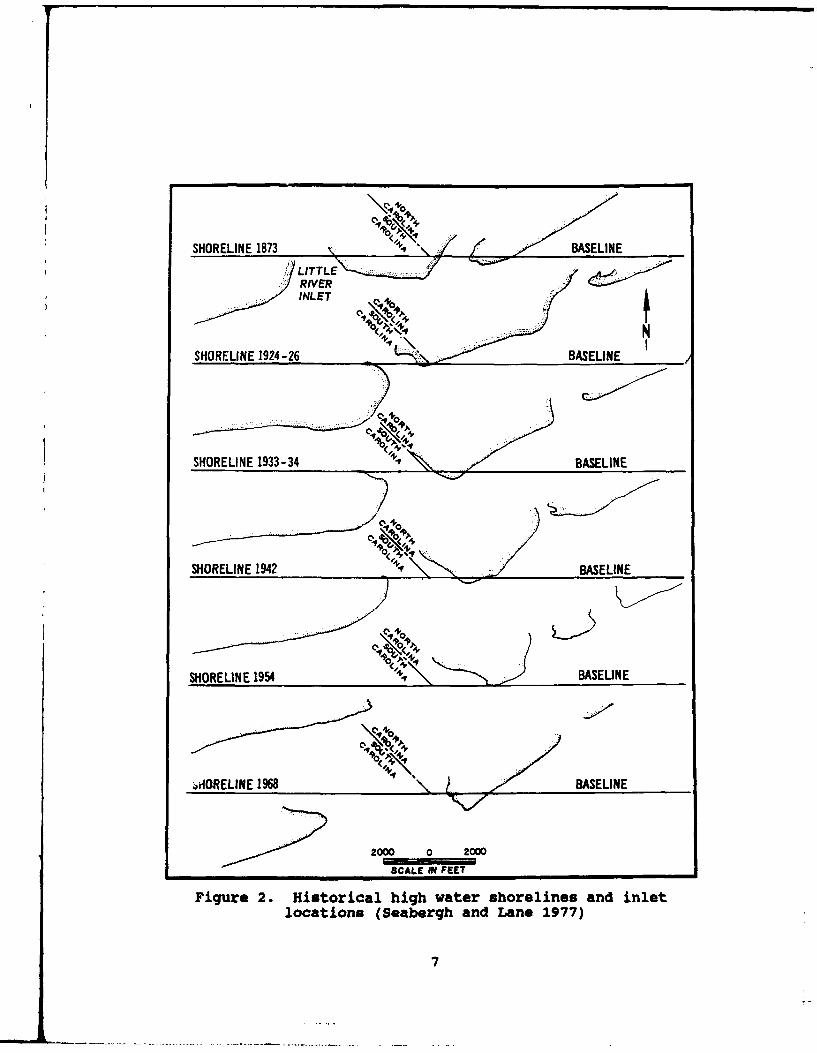
4. Historical reviews of Little River Inlet are provided in
Seabergh and Lane (1977) and Anders et al. (1990). The first
survey of the area in 1735 noted that the inlet was just inside
the South Carolina State line (U.S. Army Engineer District,
Charleston 1971). Figure 2 indicates that the inlet remained
relatively close to the State border (Seabergh and Lane 1977).
The farthest known distance from the border was almost one mile
west in 1873 (Figure 2). Subsequent shoreline configurations
show an easterly migration of the inlet, and a post-1942 widening
of the inlet. This increase in width may be due to a larger ebb
tidal prism caused by the opening of the AIWW in the late 1930's
(Seabergh and Lane 1977). Dynamic changes in the position of the
main ebb channel and inlet shoals were historically experienced
within the inlet opening. Frequent shifting and migration of the
barred channel and extensive sand shoals made the inlet extremely
dangerous for navigation. At times, controlling depth in the
inlet was 3 ft or less at Mean Low Water (MLW). Due to the
instability of the channel, sidecast dredge operations proved
ineffective in providing safe navigation through the inlet.
5. Under Section 201 of the Flood Control Act of 1965, a
project for the improvement and stabilization of Little River
Inlet was authorized by Congress in 1972. Preconstruction
planning began in 1974, and final plans and specifications were
completed in 1980. Construction of a dual jetty system at the
inlet began in March 1981 and was completed in July 1983.
Physical Settina
6. Little River Inlet is located within a geomorphic
coastal zone termed the arcuate strand (Brown 1977). Landward,
6
INLET
SHORELINE 1924-26 BASELINE
SHORELINE 19534 BASELINE
WdRELINE 1968 BASELINE
2000 0 2000
SCALE IN FEET
Figure 2. Historical high water shorelines and inletlocations (Seabergh and Lane 1977)
7
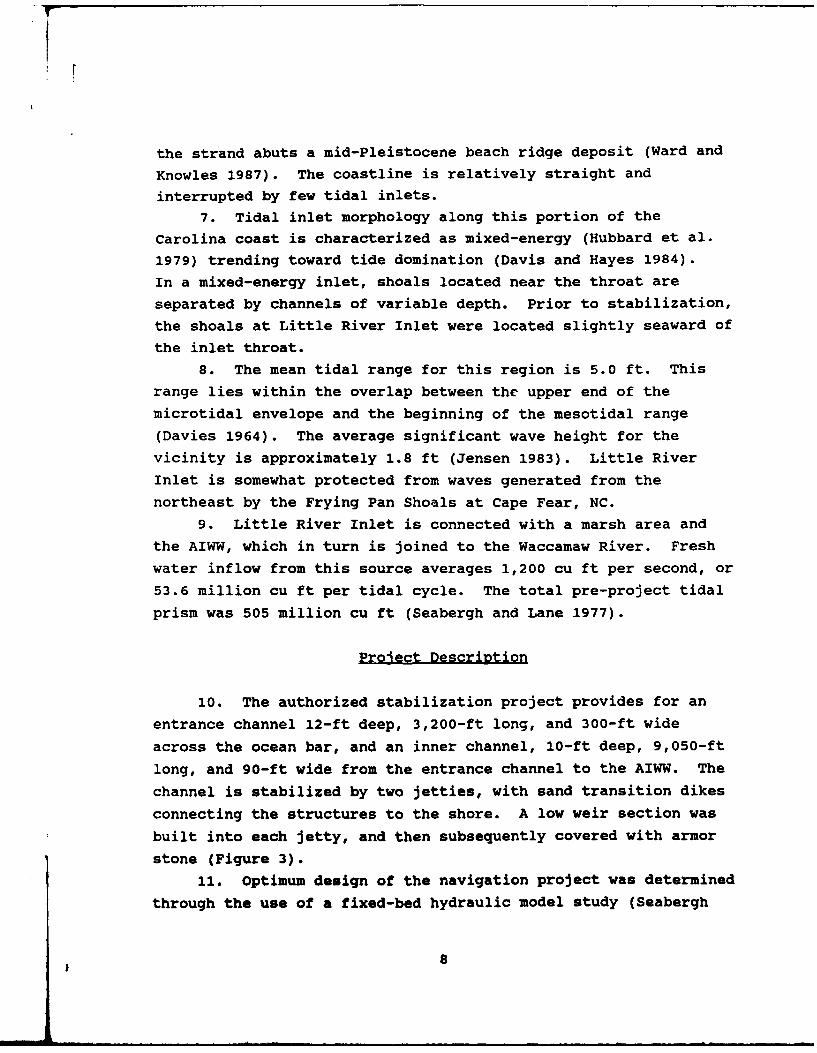
the strand abuts a mid-Pleistocene beach ridge deposit (Ward and
Knowles 1987). The coastline is relatively straight and
interrupted by few tidal inlets.
7. Tidal inlet morphology along this portion of the
Carolina coast is characterized as mixed-energy (Hubbard et al.
1979) trending toward tide domination (Davis and Hayes 1984).
In a mixed-energy inlet, shoals located near the throat are
separated by channels of variable depth. Prior to stabilization,
the shoals at Little River Inlet were located slightly seaward of
the inlet throat.
8. The mean tidal range for this region is 5.0 ft. Thisrange lies within the overlap between the upper end of the
microtidal envelope and the beginning of the mesotidal range
(Davies 1964). The average significant wave height for the
vicinity is approximately 1.8 ft (Jensen 1983). Little River
Inlet is somewhat protected from waves generated from the
northeast by the Frying Pan Shoals at Cape Fear, NC.
9. Little River Inlet is connected with a marsh area and
the AIWW, which in turn is joined to the Waccamaw River. Fresh
water inflow from this source averages 1,200 cu ft per second, or
53.6 million cu ft per tidal cycle. The total pre-project tidal
prism was 505 million cu ft (Seabergh and Lane 1977).
Project Description
10. The authorized stabilization project provides for an
entrance channel 12-ft deep, 3,200-ft long, and 300-ft wide
across the ocean bar, and an inner channel, 10-ft deep, 9,050-ft
long, and 90-ft wide from the entrance channel to the AIWW. The
channel is stabilized by two jetties, with sand transition dikes
connecting the structures to the shore. A low weir section was
built into each jetty, and then subsequently covered with armor
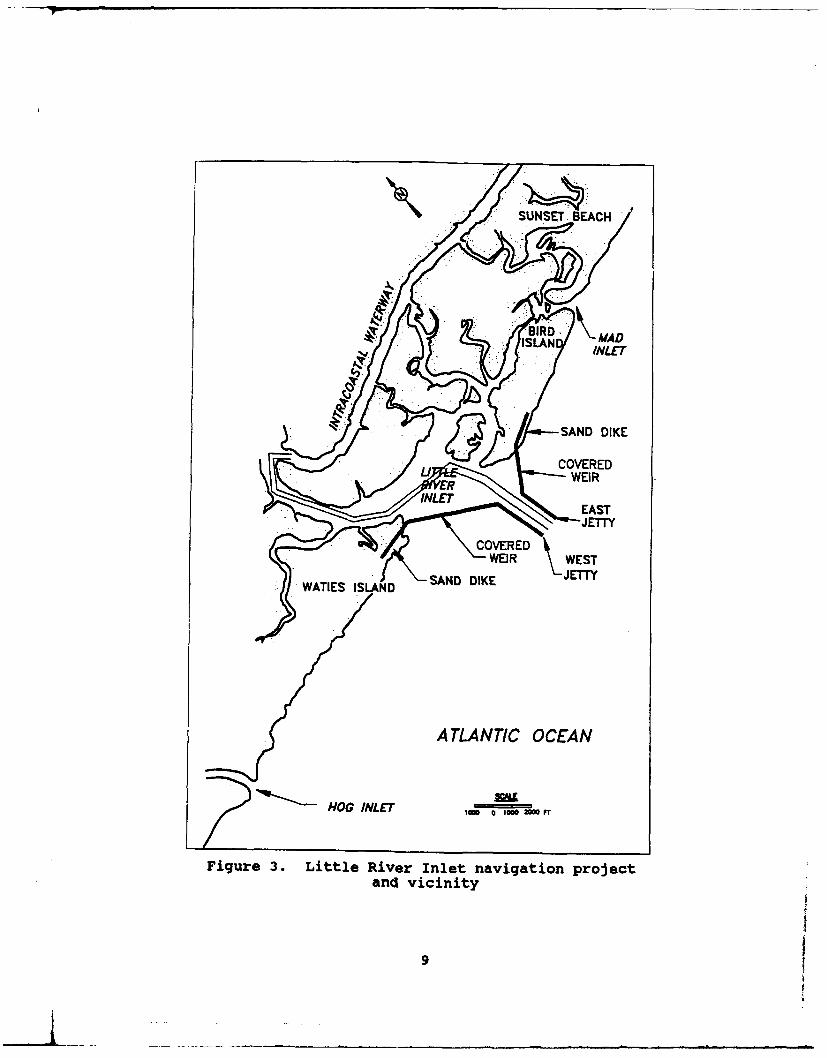
stone (Figure 3).
11. Optimum design of the navigation project was determined
through the use of a fixed-bed hydraulic model study (Seabergh
8
SUNSET. BEACH
BIRD.ISLAN INLET
SAND DIKE
COVEREDLI WEIR
INLETEAST
JETTY
COVERED \ S
SAND IKE ETTY
A TLANTIC OCEAN
HOG INLET lw a o 2=rI
Figure 3. Little River Inlet navigation projectand vicinity
9
and Lane 1977). This study examined alignment, length and
spacing of the jetties, weir sections, current patterns and
magnitudes, sediment movement patterns, effects on the tidal
prism, and effects on bay salinities.
12. The two jetties are of typical quarrystone, rubble-
mound construction. Seven various sizes of stone weighing
between 2.5 pounds and 8 tons were used to construct the jetties.
The east jetty is approximately 3,300-ft long, and the west jetty
is approximately 3,800-ft long. Both jetties include a sand dike
to anchor the structure to the shore, a weir, and a sand-tight
section joining the weir to the sand dike.
13. The hydraulic model study determined that a 1,300-ft
weir section at elevation +2.4 ft MLW backed by deposition basins
would be the most feasible plan for both jetties. As
constructed, this 1,300-ft section was divided into a 650-ft
sand-tight section connected to the shore and a 650-ft weir, in
order to provide more control of sand overtopping the weir.
However, the weirs were subsequently covered with armor units to
an elevation of +8 ft MLW. The deposition basins were never
dredged.
Construction and Dredging History
14. The first stone was placed on the east jetty 28 July
1981 and the last one was set on 8 June 1982. Initial dredging
of the entrance channel to a 300-ft width and 12-ft depth was
performed between June and July 1982. This dredging effort
removed 513,000 cu yds of material from the channel, which was
subsequently used to construct the west sand dike. Upon
completion of the east jetty, construction equipment was
mobilized to Waties Island. Stone placement for the west jetty
began in June 1982 and finished in early June 1983.
15. Little River Inlet has been dredged only one time since
the initial dredging of the channel. This dredging effort was
accomplished between December 1983 and February 1984. The total
volume removed from the entrance and inner channels was
10
264,000 cu yds. Most of this material was placed adjacent to theinner side of the west jetty due to migration of the channeltowards the jetty.
Monitoring Program
16. The SAC began collecting pre-project baseline data atthe Little River Inlet project in 1979. A formal monitoringprogram was initiated by SAC and CERC in 1981. The primaryobjectives of this program were to evaluate the performance ofthe jetty system and document its effects on adjacent shorelines.
17. The first phase of the formal monitoring program beganin March 1981 and continued through February 1986. A reducedmonitoring effort will continue through 1991. The two phases are
summarized below.
Phase I18. Phase I of the monitoring program consisted of:
A. Beach profiles (quarterly, 58 lines through October1983, then 48 lines)
b. Inlet hydrographic surveys (quarterly)-. Aerial photography of shoreline (monthly during and
one year after construction, then quarterly)d. Structural surveys (quarterly)
e. Site inspections (annual, by SAC/CERC personnel)f. Littoral Environment Observations (LEO) (three
sites daily)Phase II
19. The reduced monitoring program consisted of:A. Beach profiles (semi-annual, 48 lines)b. Inlet hydrographic surveys (semi-annual)c. Aerial photography of shoreline (semi-annual)
!. Structural surveys (annual)
_. Site inspections (annual, SAC/CERC personnel)
. Littoral Environment Observations (LEO) (threesites daily)
11
PART II: DATA ANALYSIS METHODS AND RESULTS
20. The CERC has analyzed monitoring data collected at
Little River Inlet between 1979 and 1989. This chapter briefly
describes the data and the analysis methods used in this
investigation. Due to the large volume of data, most results are
presented in separate appendices. Limitations of the data and
results are discussed in each of the respective appendices.
Beach Profile and Inlet Hydrographic Data
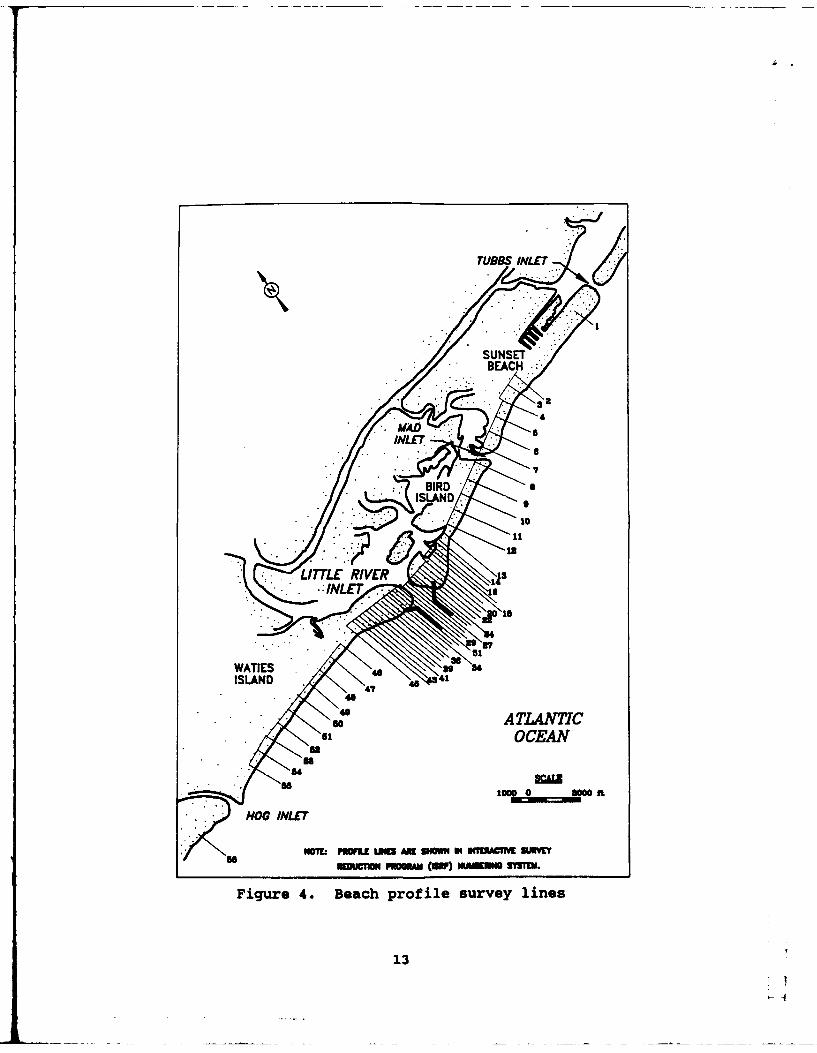
21. Beach surveys were taken along 58 profile lines until
October 1983, and 48 lines for the remainder of the program. The
profile lines are spaced at 200-ft intervals to approximately
3500 ft from the channel centerline on either side of the inlet
(Figure 4). From there, profiles are spaced at 500-ft intervals
for a short distance, and then 1000-ft intervals to a distance of
about 2.6 miles from the channel centerline. Coverage continues
with 5000-ft spacing east to Tubbs Inlet, and west across Hog
Inlet to North Myrtle Beach. Starting locations and alignments
of the profile lines are provided in Appendix A (Table A-l).
22. Profile data was obtained from SAC and entered into the
Interactive Survey Reduction Program (ISRP) (Birkemeier 1984). A
description of ISRP, the techniques used to analyze the data, and
the plotted results are presented in Appendix A.
23. Hurricane Hugo made landfall on September 21, 1989,
just north of Charleston, SC. Post-Hugo profile data (December
1989) at Little River Inlet was plotted separately since the data
represents profile changes during an extreme event. Comparison
plots were made using surveys from 1988 (Appendix B).
24. Also computed from the profile data were estimations of
MLW and Mean High Water (MHW) shoreline change (Appendix C) and
calculations of above datum volume changes (Appendix D).
25. The ISRP beach profile and inlet hydrographic survey
data for specified dates were input into Radian Corporation's
12
TUBBS INLET
SUNSETBEACH
ATLANTI
131
Contour Plotting System (CPS-3). Bathymetric contour maps were
then generated for annual spring/summer surveys between April 1981
and July 1988 (Appendix E).
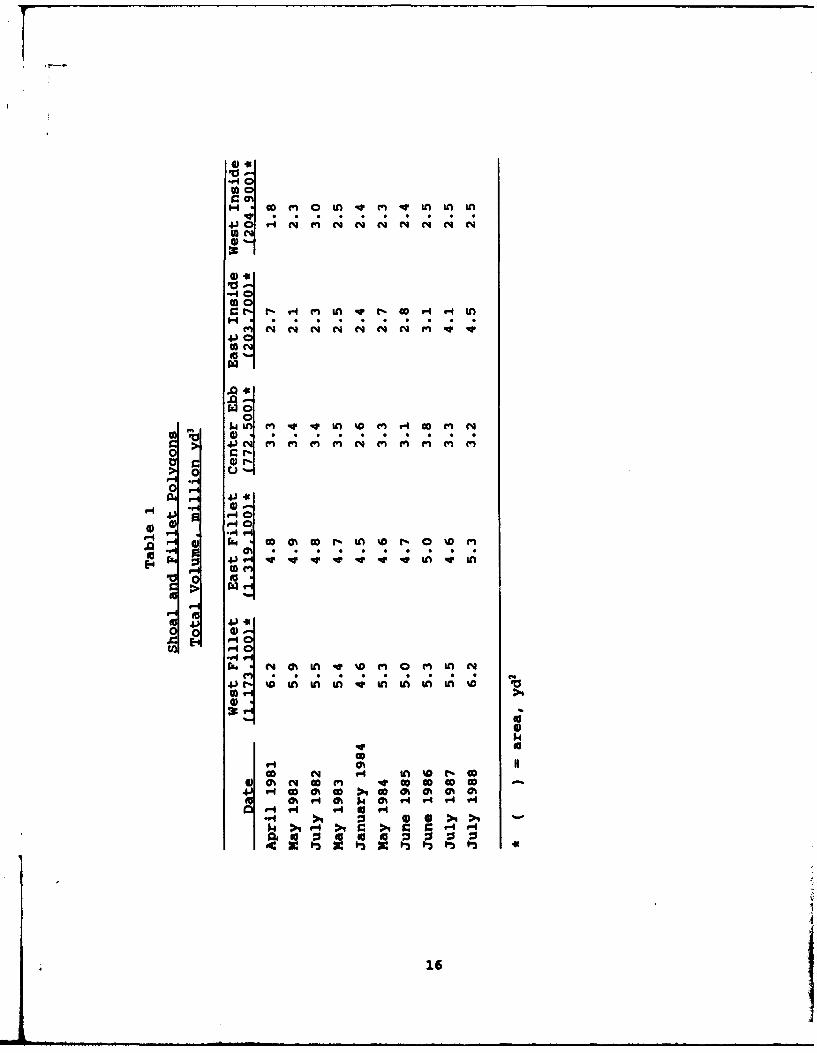
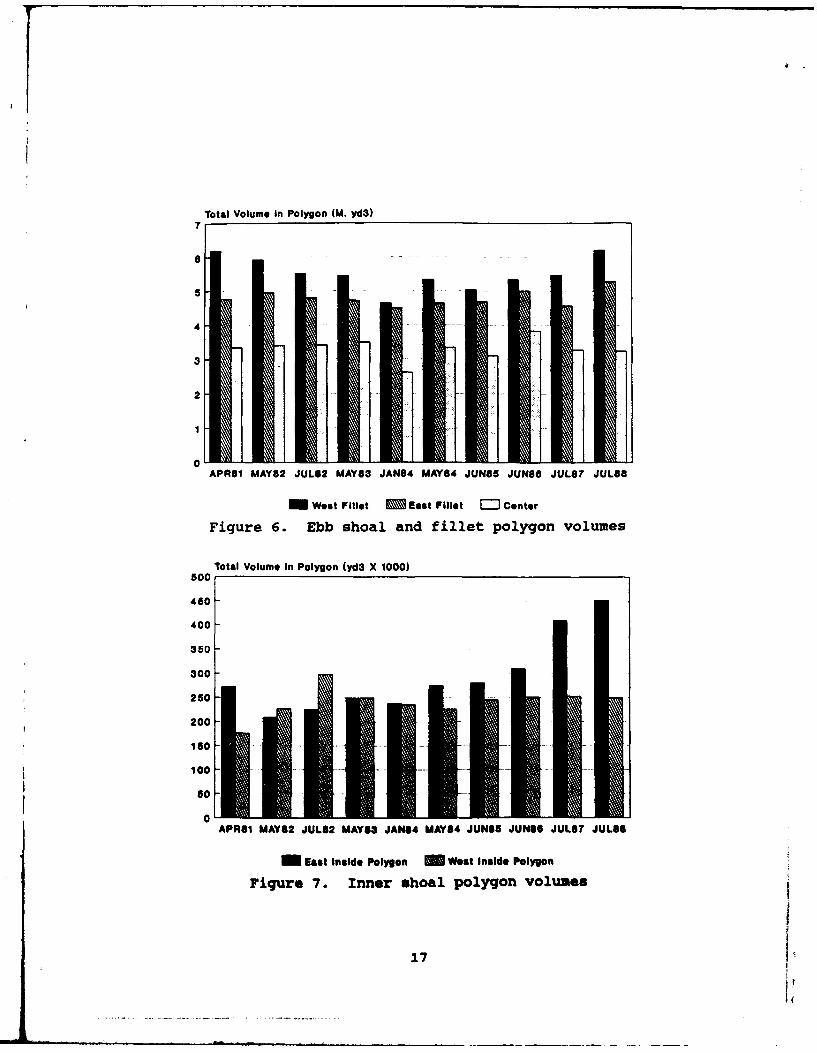
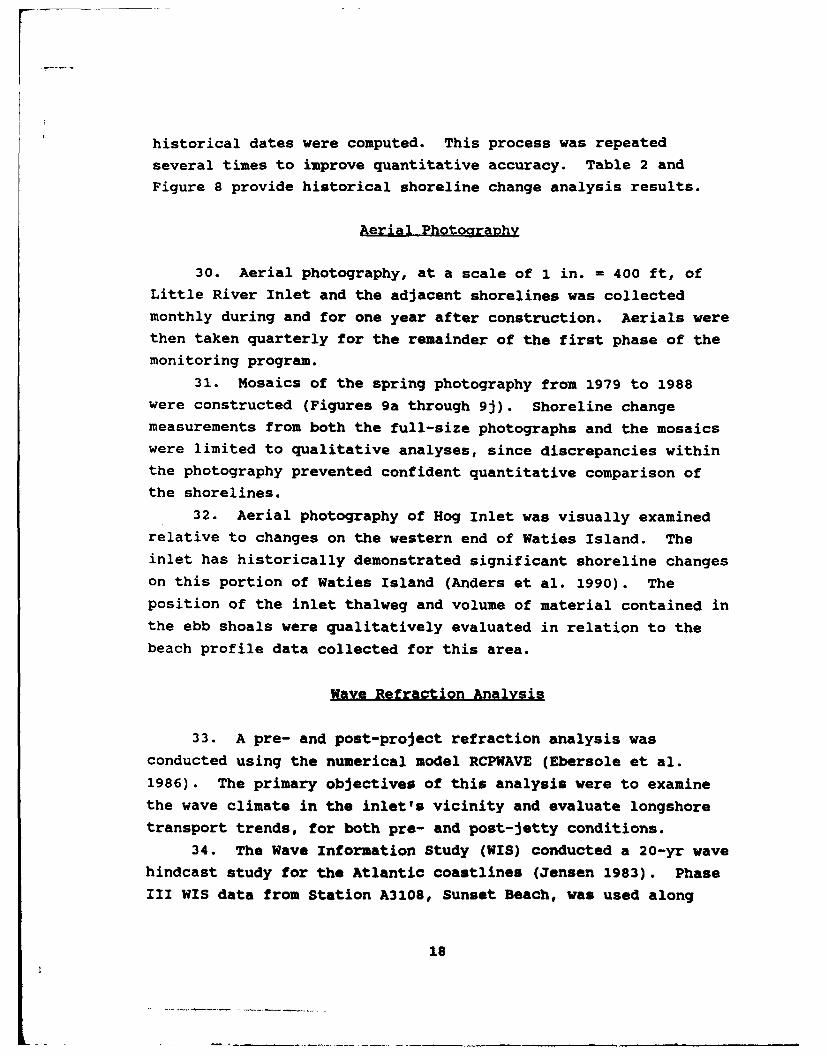
26. Shoal and fillet volumes were then computed from the
bathymetric maps using CPS-3. Five volume polygons were designated
covering the fillets to the west and east of the jetties, a central
ebb shoal area, and the shoal areas on the inner side of each jetty
(Figure 5). Table 1 and Figures 6 and 7 show the results for each
volumetric determination. Additional volume computations were made
for the shoal on the inner side of the east jetty (polygon denoted
East Inside) to determine potential sources of the shoal's growth.
Temporal changes in the shoal size were correlated to changes in
other inlet sand bodies that may be sources of sediment supply.
Historical Shoreline ChanQe Maps
27. Maps delineating the shoreline at various points in
time (1873, 1924/26, 1933, 1962/63, 1969/70, and 1983) were
prepared by the National Oceanic and Atmospheric Administration
(NOAA), National Ocean Service (NOS), and the South Carolina
Division of Research and Statistical Services (DRSS). These maps
were then used by Anders et. al (1990) to analyze changes in
shoreline position along the South Carolina coast over the past
150 years.
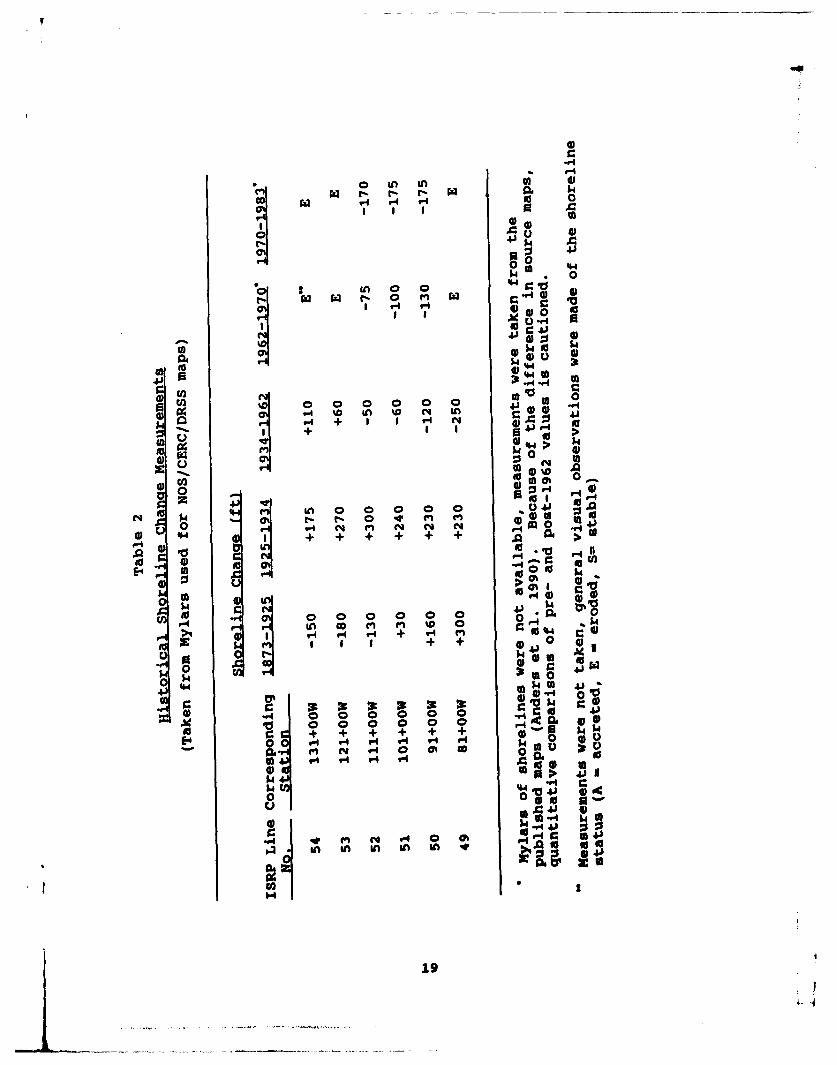
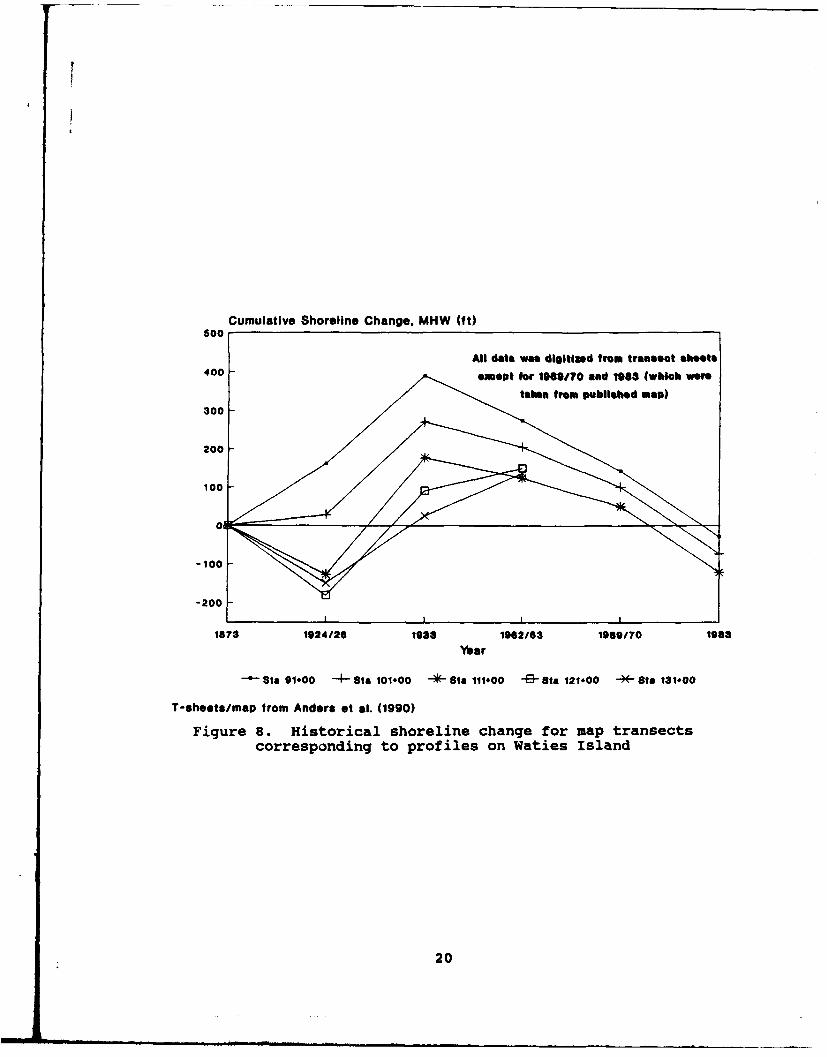
28. A brief review was made of relative historical
information found in Anders et al. (1990). Shoreline change
measurements were made for map transects corresponding to ISRP
Lines 49 through 53 (see Figure 4), a suspected erosional area on
the western end of Waties Island. These ISRP profile lines
correspond to survey Stations 81+00W to Stations 121+00W,
respectively. In order to avoid potential scale distortions,
measurements were made on the original mylars, and not on the
maps published with Anders, et al. (1990).
29. Shoreline positions along the transects were digitized
using a CALCOMP 9000 system, and shoreline changes between
14
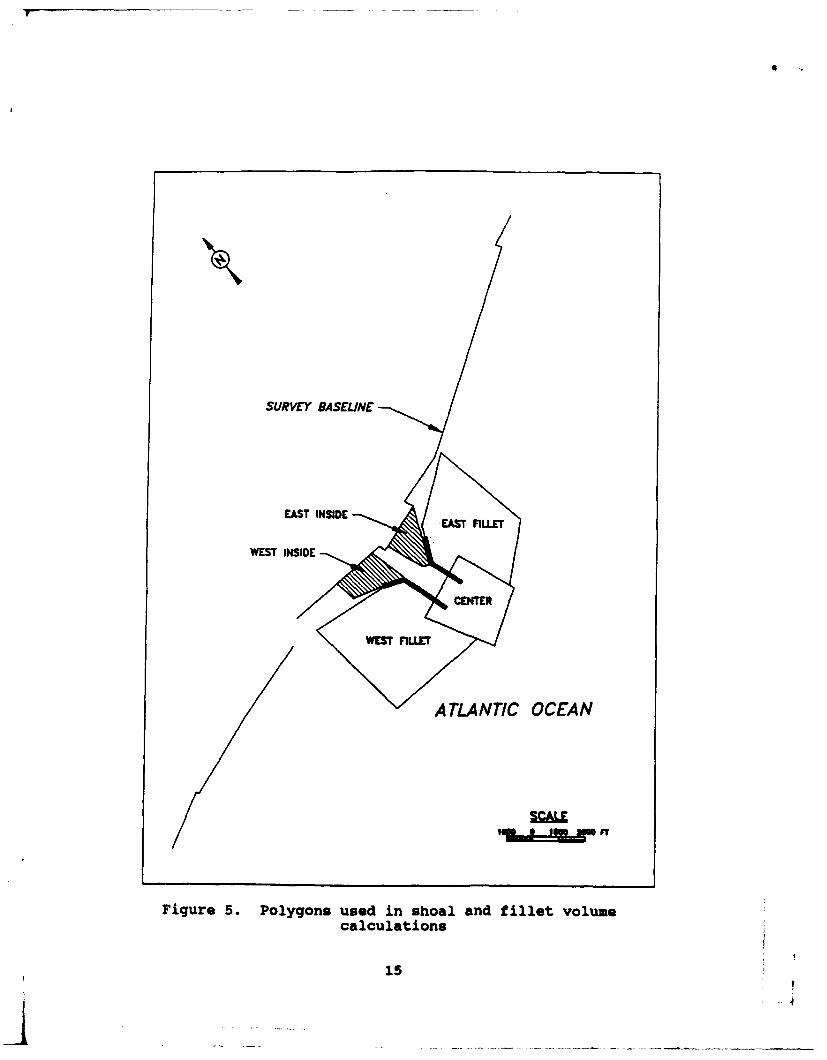
SURVEY BASELINE
A TLANTIC OCEAN
Figure 5. Polygons used in shoal and fillet volumecalculations
15
H 0 C M 0 Ln~ -W m in Mn LO
0-01
~r- r- r4 en in -w r- O I f4 in
N N N N N4 4 IA4
410
00
C-40
r4 .0 q
41 0
-0
co N 14 In W tC
4 r%-I V4 1-4 a V4'D
110
Total Volume In Polygon (M. yd3)
7
8
5 -
4
3
2
0APR61 MAY82 JUL.62 MAY63 JAN64 MAY64 JUN65 JUN66 JUL67 JUL68
MWest Fillet EM East Fillet = Center
Figure 6. Ebb shoal and fillet polygon volumes
Total Volume In Polygon (yd3 X 1000)
500
400
350
300
250
200
150
100 -.......
50
0 1APR61 MAY62 JUL62 MAY613 JAN84 MAY64 JUN615 JUN66 JUL67 JUL66
East Inside Polygon MWest Inside Polygon
Figure 7. inner shoal polygon volumes
17
historical dates were computed. This process was repeated
several times to improve quantitative accuracy. Table 2 andFigure 8 provide historical shoreline change analysis results.
Aerial Photography
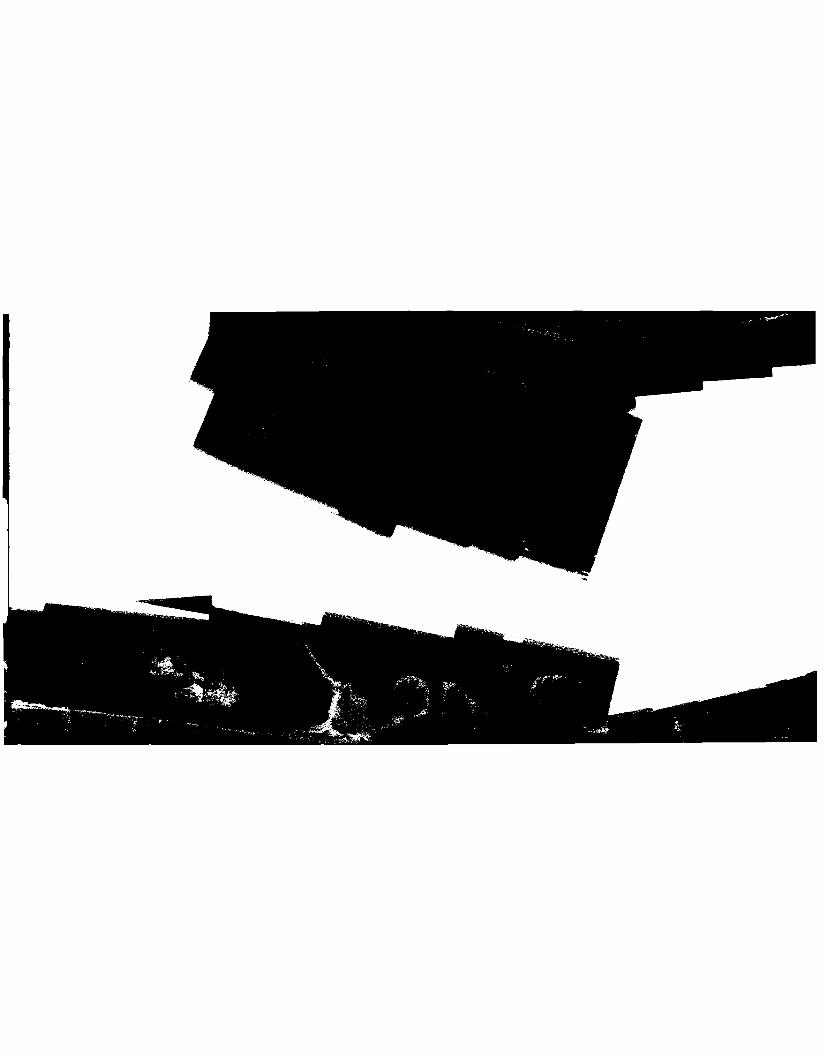
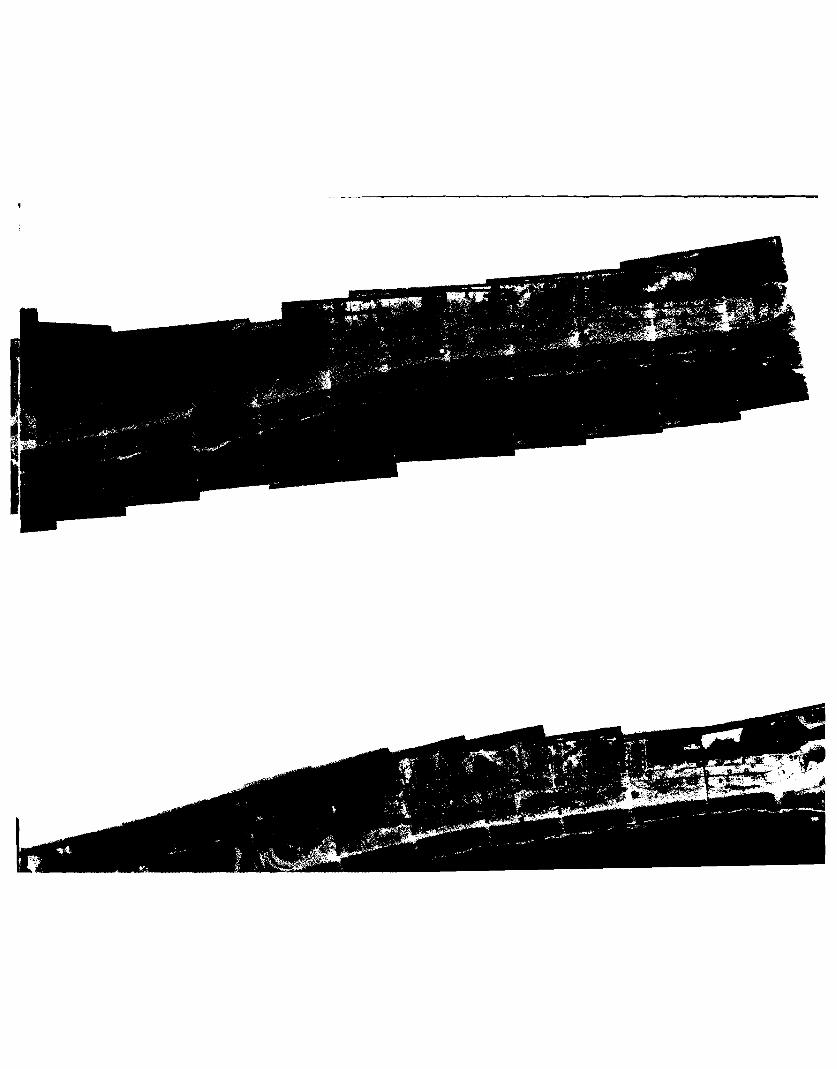
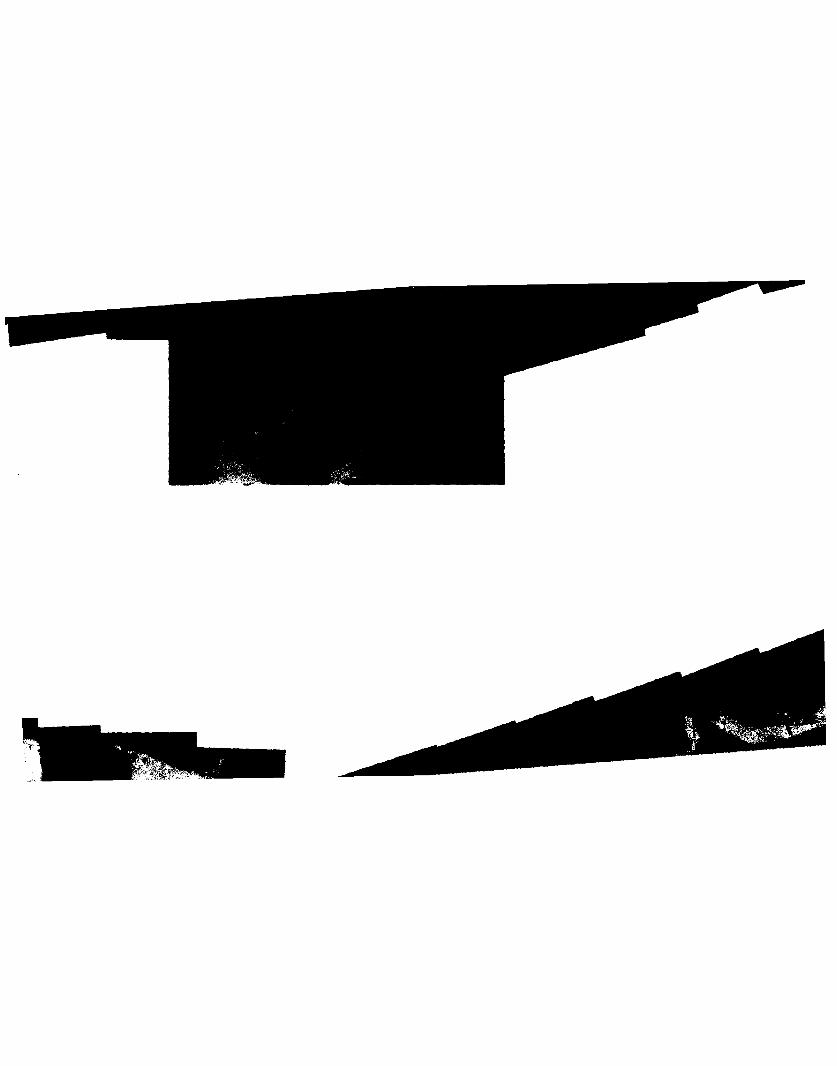
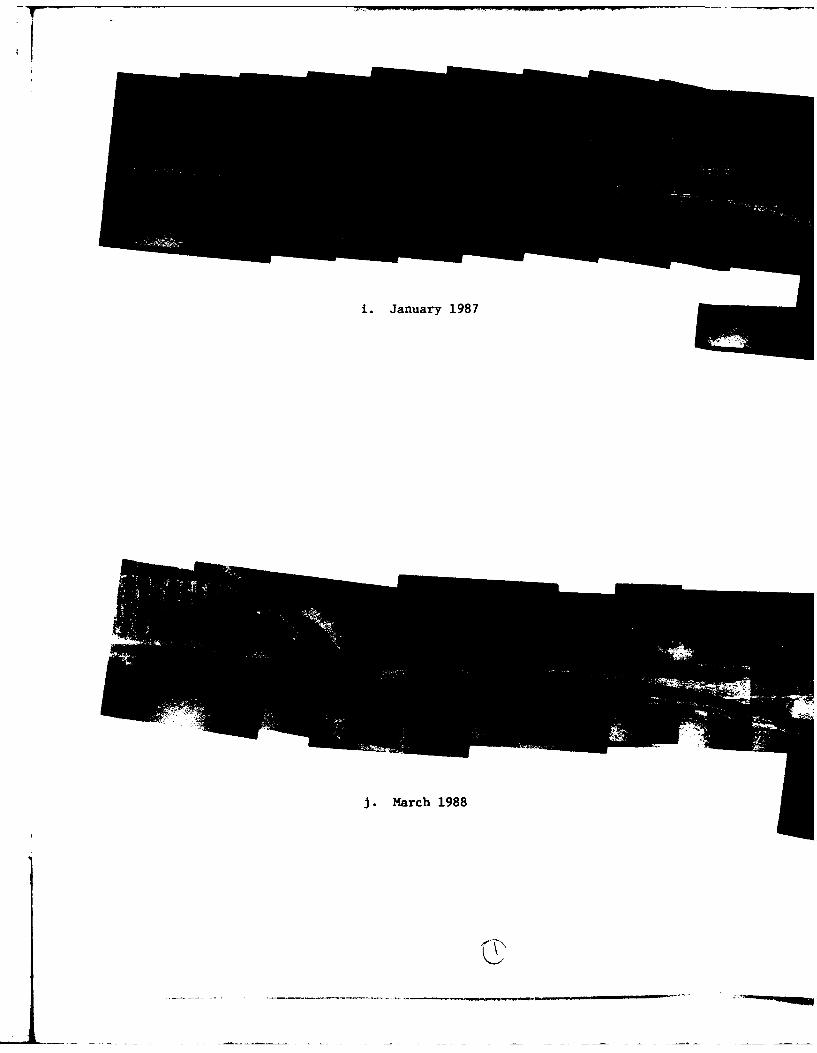
30. Aerial photography, at a scale of 1 in. = 400 ft, ofLittle River Inlet and the adjacent shorelines was collectedmonthly during and for one year after construction. Aerials werethen taken quarterly for the remainder of the first phase of themonitoring program.
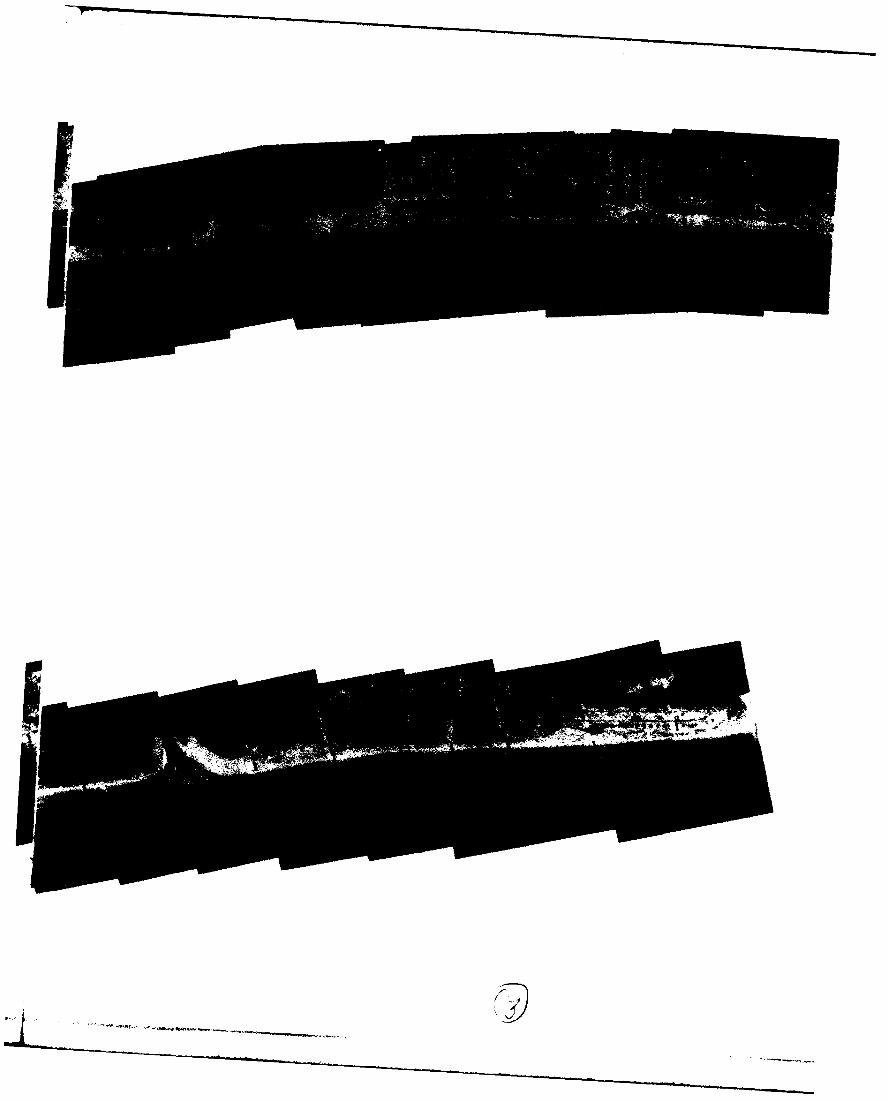
31. Mosaics of the spring photography from 1979 to 1988were constructed (Figures 9a through 9j). Shoreline changemeasurements from both the full-size photographs and the mosaicswere limited to qualitative analyses, since discrepancies withinthe photography prevented confident quantitative comparison ofthe shorelines.
32. Aerial photography of Hog Inlet was visually examinedrelative to changes on the western end of Waties Island. Theinlet has historically demonstrated significant shoreline changeson this portion of Waties Island (Anders et al. 1990). Theposition of the inlet thalweg and volume of material contained inthe ebb shoals were qualitatively evaluated in relation to thebeach profile data collected for this area.
Wave Refraction Analysis
33. A pre- and post-project refraction analysis wasconducted using the numerical model RCPWAVE (Ebersole et al.1986). The primary objectives of this analysis were to examinethe wave climate in the inlet's vicinity and evaluate longshoretransport trends, for both pre- and post-jetty conditions.
34. The Wave Information Study (WIS) conducted a 20-yr wavehindcast study for the Atlantic coastlines (Jensen 1983). PhaseIII WIS data from Station A3108, Sunset Beach, was used along
1s
II
-4)
* 4
i-I v4 $4 0
1 0 0 0
0 0
14 0 04
.a IV~o
+ >
4J0 4
0
oI =1 I
001 Nn N N 04 0m 0 44
E4 0 v-I$
0 ~ 10
ri H- H- . + '.4 (' 0%n ~II+ + 6
4J
* 4)
04 go 0
0 '4 V.4 P4 '.4 r
0 o 41U MA U
~~4g~~ W' 4 ~4 14)
~4 in in in in in q A
19
Cumulative Shoreline Change. MHW 00tS00
All data was digitlind from transact aheets400 - wmept for 1969170 and 1983 (which were
-100
-200
0ia
B100 910 4 t 0.0--Sa110 9Sa110 *Sa110
T-shests/map from Anders et al. (1990)
Figure 8. Historical shoreline change for map transectscorresponding to profiles on Waties Island
20

a. March 1979
b. March 1980


ieet IOf 5)

~Aa~11982
Ik
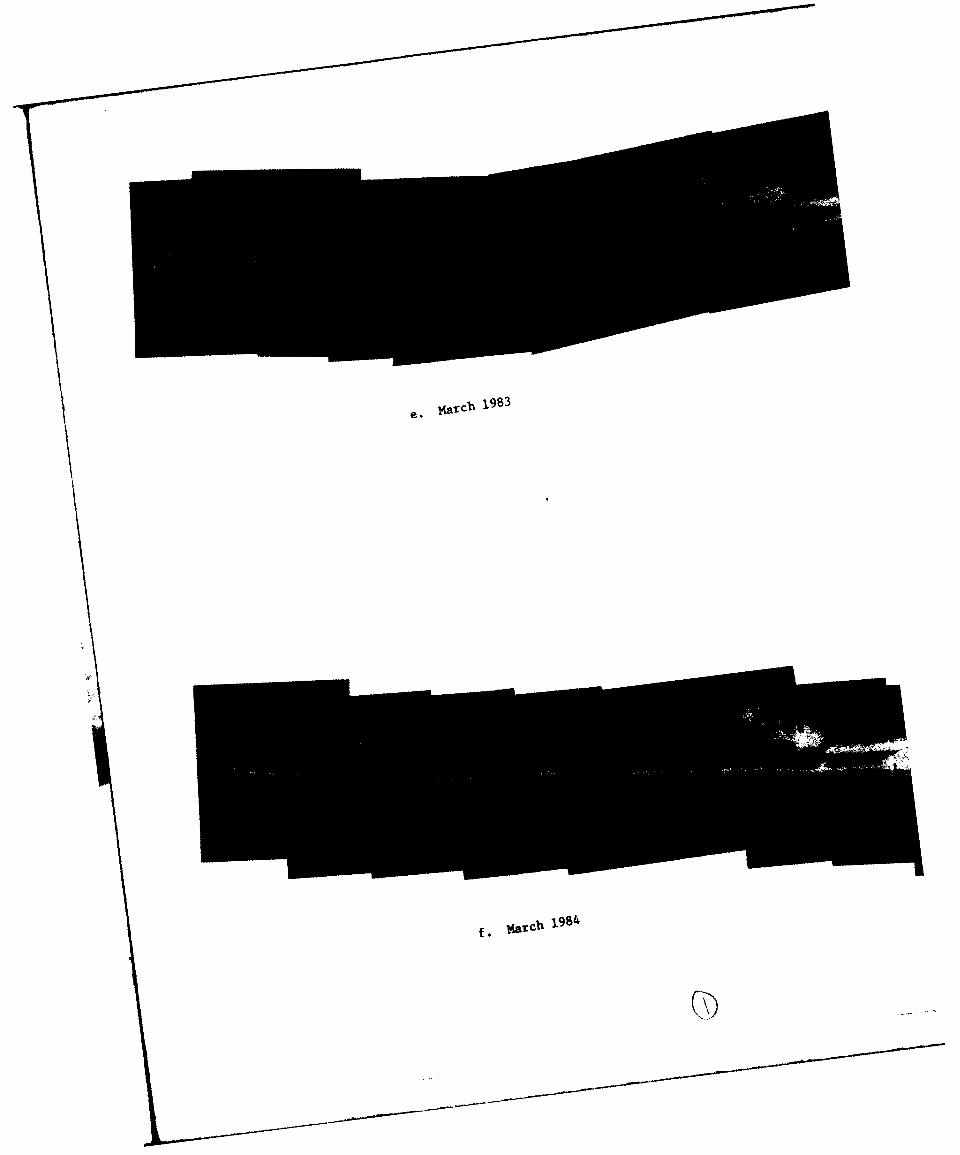
e. ~aIl~1983
f* 4arch 1984
* -* *~-. a,~
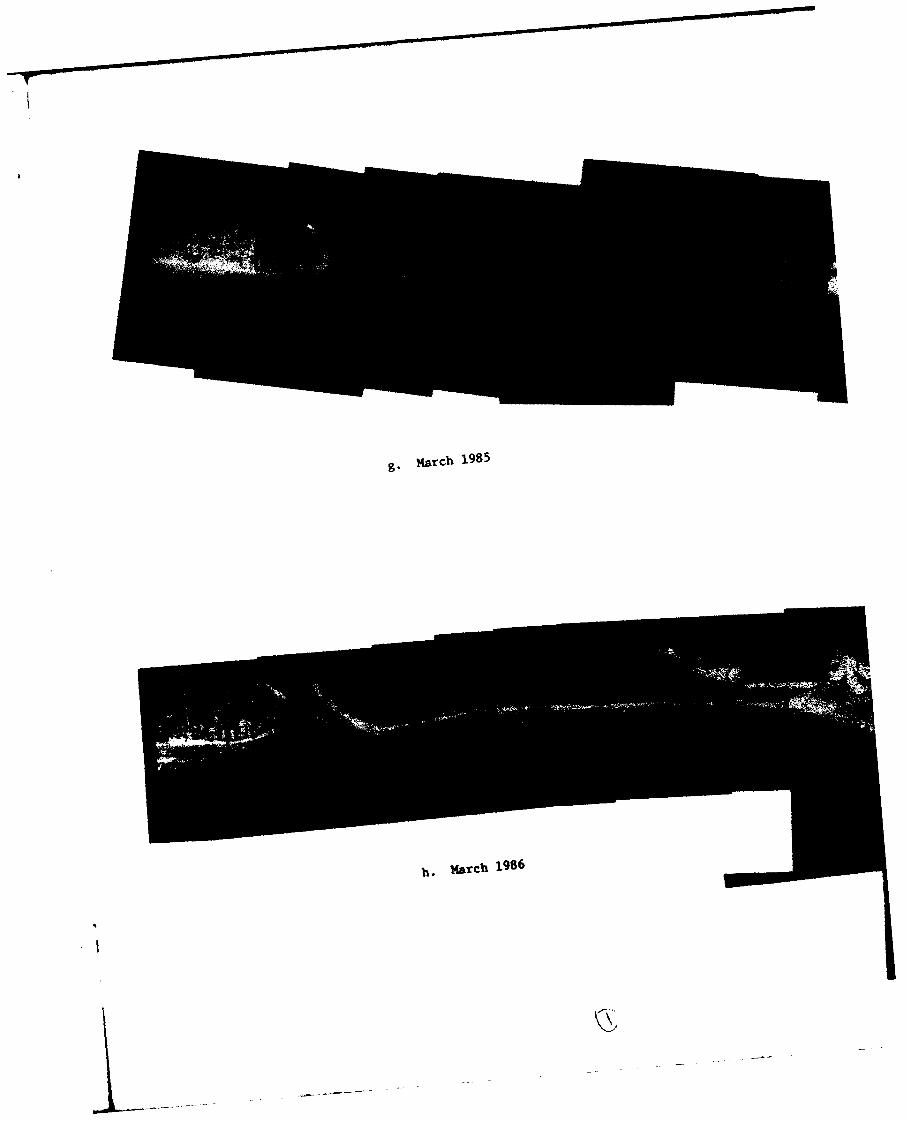
g. Mrch1985
h. 1arch 1986
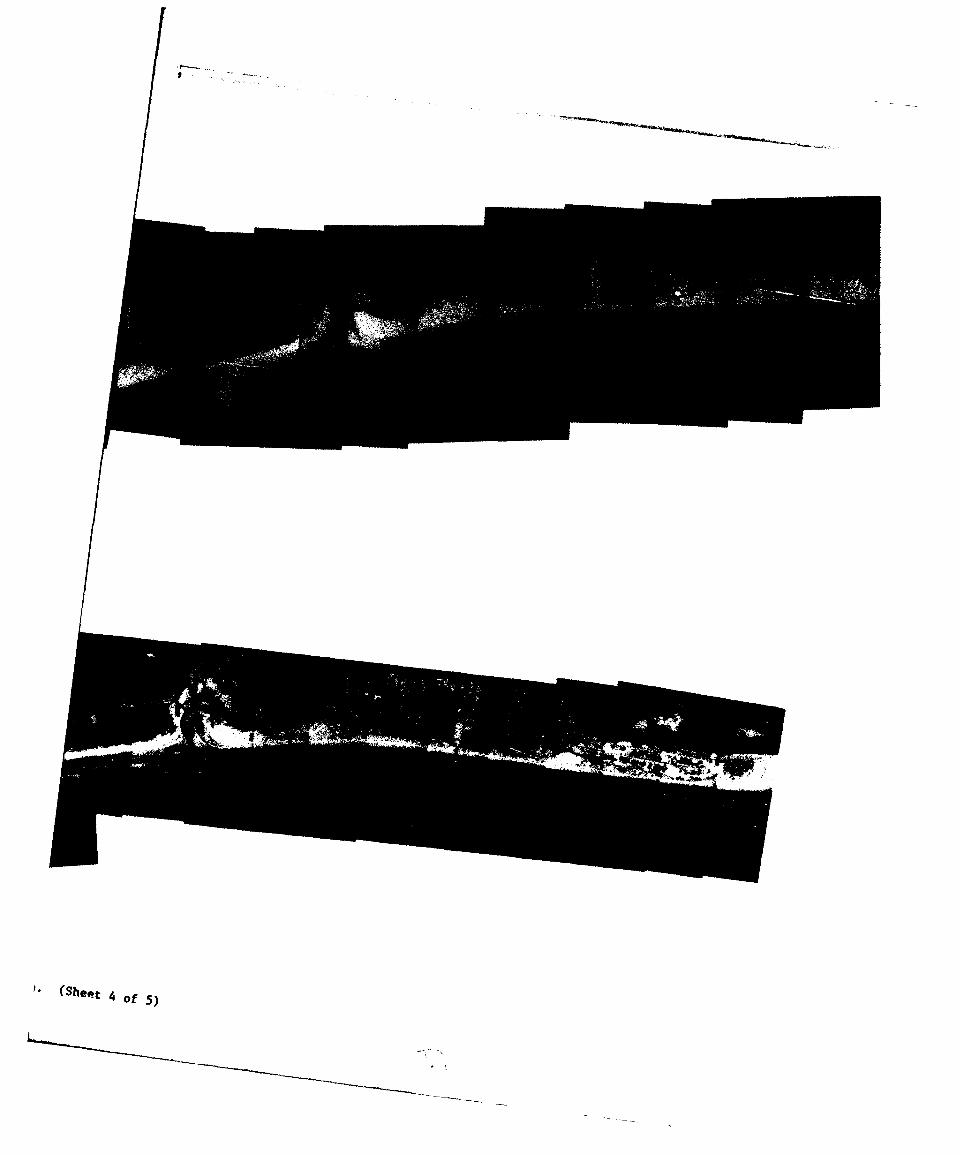
~,(Shta, 4 of 5)
e fi. January 1987
. arch 1988
A /
t 5 of 5)
7 >1-'
............................................-.~-~------- -~----
with bathymetric data from 1981 (pre-project), 1985, and 1988. A
summary of the methods used to run RCPWAVE is given in
Appendix F. Potential longshore transport computations were then
based on equations found in the Shore Protection Manual (1984).The methodology used to calculate sediment transport, along with
plots of annual and monthly sediment transport trends for 1981,1985, and 1988, are also located in Appendix F.
35. The grid used for Little River Inlet covers an area 5.7miles alongshore and 1.2 miles offshore (Figure 10). The grid isdimensioned into 200 cells (150 ft wide) along the coast (gridlines i=1 to 201, numbered from west to east) by 154 cells (75 ftwide) (grid lines j=1 to 155, numbered from shore seaward). Thejetties are located approximately between grid nodes i=94 and
i=102.
36. The procedure used to calculate longshore transport inthis analysis is considered more qualitative than quantitative.
Due to the assumptions and limitations of the numerical model andmethods used, results should be examined as a transport potential
or trend over a range of cells. The jetties and local bathymetryin the vicinity of the inlets are not well interpreted by themodel. Transport values in the immediate vicinity of these areas
should be disregarded.
LEO Data
37. The LEO program was established by CERC to provide ameans of daily monitoring of wave climate in a particular coastal
region (Schneider 1981). Visual observations recorded for
parameters such as breaking wave height, angle of wave approach,wave period, current direction and speed, and wind information.
38. LEO data was recorded almost daily by observers atthree locations; Ocean Isle Beach, NC, Sunset Beach, NC, and
Cherry Grove Beach, SC (Figure 11). Since access to both
adjacent shorelines is difficult or restrictive, it was
31
32 112
STA. 33095
LEOSTA. 39039
AfM
"am
' }-...
1 0 I 2ML.S
U 0STA. 46002
Figure 11. Littoral Environment Observation (LEO)
sites in the vicinity of Little River Inlet
33
impossible to establish a LEO site in the immediate vicinity of
the inlet.
39. The CERC utilizes specially developed computer programsto analyze LEO data and compute statistics of various coastalparameters. LEO data summaries for the stations in the vicinity
of Little River Inlet are presented in Appendix G. Included in
these summaries are calculations of longshore transport using twodifferent methods; however, these values are considered onlyqualitative estimates of transport trends at the LEO site
(Schneider and Weggel 1980). The LEO data analyzed in this
report were examined comparatively to support other data results.
34
PART III: SUMMARY OF RESULTS AND DISCUSSION
Lonashore Transgort Trends
40. Historically, the direction of longshore transport in
the vicinity of Little River Inlet has been highly variable
making it difficult to define a dominant trend. Sediment
transport rates and directions appear to vary both spatially and
temporally in the vicinity of Little River Inlet. Local
bathymetry and shoreline angle controlled drift reversals are
common along the South Carolina coast; especially in the vicinity
of tidal inlets.
41. A pre-project survey report (US Army Corps of Engineers
1977) estimated a gross transport rate of 300,000 cu yd/yr with
both northeastward and southwestward moving drift balanced at
150,000 cu yd/yr. This estimation was based on maintenance
dredging records at sites such as Georgetown Harbor, SC and
Masonboro Inlet, NC.
42. Longshore transport estimations made during project
design concluded a gross transport rate of 300,000 cu yd/yr with
a net transport of 100,000 cu yd/yr to the west (US Army Corps of
Engineers 1977). This estimate was based on the geomorphology
and historical evolution of the inlet, and on calculations made
using wave data and visual observations at Holden Beach, NC, a
site located approximately 15 miles to the northeast of Little
River Inlet. Although this was the best available data at the
time, these calculations are based on limited assumptions. In
addition, Mad, Tubbs, and Shallotte Inlets are located between
Holden Beach and Little River Inlet, and probably affect the
local calculated longshore transport rates significantly.
43. Pre-project longshore transport analyses for Little
River Inlet were also conducted in 1979 and 1980 at the Waterways
Experiment Station for the US Army Engineer Division, South
Atlantic. Based on hindcast wave climatology for three years
(US Army Engineer Waterways Experiment Station, unpublished) and
35
I'
preliminary Wave Information Study data (Corson and Resio,
unpublished), both analyses showed this to be an area with
extremely variable transport; but, with a slight net transport to
the northeast. An additional analysis conducted by CERC in 1984
(Pope, unpublished) using WIS data (Jensen 1983), also concluded
a net northeasterly transport for Phase III stations A3108
(Sunset Beach, NC), A3109 (Crescent Beach, SC), and A3110 (Myrtle
Beach, SC).
44. Due to inconsistent longshore transport information,
the RCPWAVE analysis presented in Appendix F was conducted to
specifically examine transport trends for the pre- and post-
project conditions. Determination of longshore transport trends
assisted with the examination of beach and nearshore response to
the project, and in the evaluation of the weirs of both jetties.
45. Pre-project RCPWAVE results show an overall dominanceof longshore sediment transport to the northeast on Waties Island
and a slightly less dominant transport to the northeast on Bird
Island. Transport on Bird Island is sometimes variable and
appears, on occasion, to be opposite to the dominant trends.
These reversals tend to occur in the vicinity of Mad and Tubbs
Inlets, and are not considered representative of the regional
trend of longshore sediment transport.
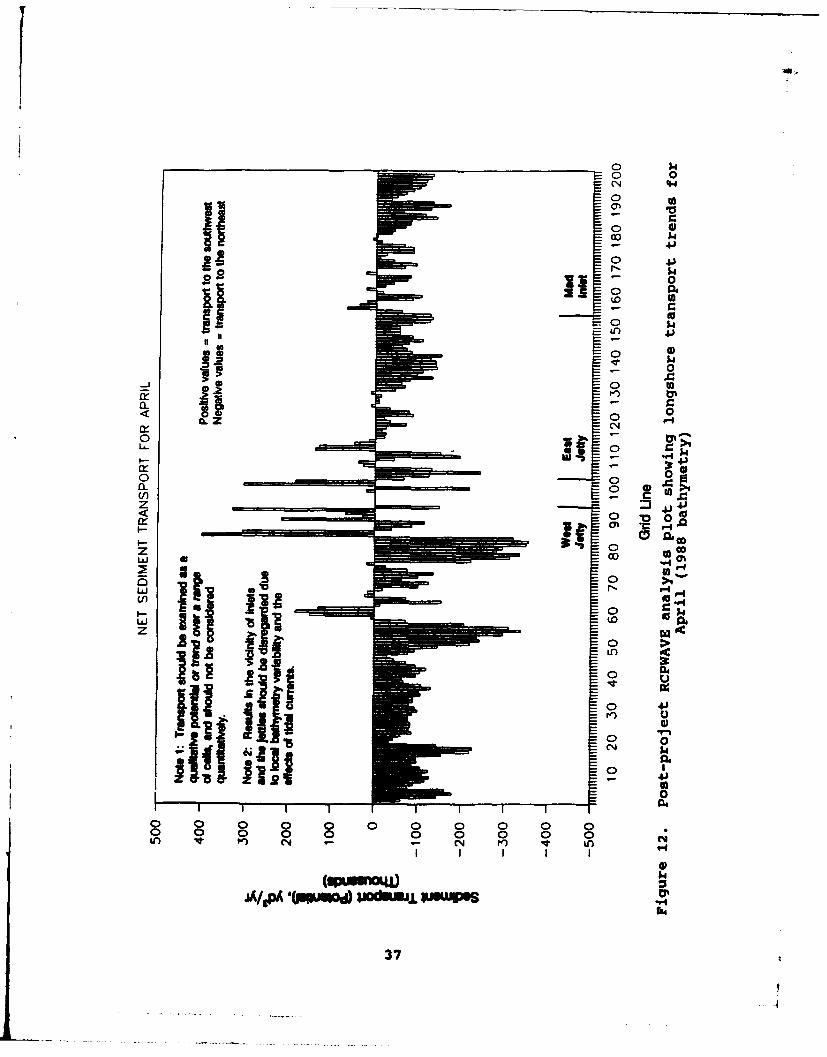
46. Post-project RCPWAVE analysis results continue to show
a general northeasterly longshore transport trend. Figure 12 is
a typical plot showing this northeasterly transport trend.
Again, transport values should be examined as a qualitative
potential or trend over a range of cells. Analysis results also
indicate that minor seasonal (September-November) reversals tothe southwest may occur on occasion. These reversals may be
caused by seasonal waves encountering different shoreline
orientations caused by the growth of the west fillet on Waties
Island. Geographical variations such as a bulge in the shoreline
or change in shoreline angle can cause localized transport
reversals by transforming the incoming waves.
36
o 0CN %4
00
0
L&.0
o 0CL Z
- v,
_ _ _ _ _ L. p
z :3 4-
< 0
0
o 4
'J~ ~~~ >
C-N.94
JA/,A I~dJ aodamjj~1su~4J370
If 1-4
I
47. Methodologies used to quantify longshore sediment
transport have been inconclusive. From the RCPWAVE results,
fillet volumes, LEO summaries, and other pre-jetty analyses of
littoral transport conducted by WES in 1979, 1980 and 1984, there
is strong evidence that longshore transport is variable; but,
slightly dominant to the northeast. The collection of inshore,
directional wave gauge data would improve longshore transport
information.
Shoreline Response
48. Beach response to the Little River Inlet jetties was
examined through the analysis of beach profiles, bathymetric
contour maps, and aerial photography. Due to the large amount of
data, overall trends were examined initially. Specific areas
were then examined to define trends in more detail.
49. It should be noted that the study area was examined
with a data set of beach profiles spanning over an 8 year period.
In addition to the construction of a navigation project within
this 8 year period, the presence of 4 tidal inlets within less
than 7 miles of shoreline (Tubbs, Mad, Little River and Hog
Inlets), makes this study area especially vulnerable to cyclic
trends and short-term fluctuations. An estimate of the long-
term, equilibrium shoreline and rates of change at this point
would most likely be premature, and is difficult to separate from
the short-term "noise" and initial responses due to jetty
construction. Therefore, overall trends and coastal responses to
the jetties are examined, without quantitative rates of change or
future extrapolations.
50. The Bird Island shoreline between the east jetty and
Mad Inlet exhibited an overall accretion of between 50 and 100
ft, and the profiles appear to have steepened slightly since
jetty construction. This section of shoreline accreted steadily
38
until middle to late 1984, and then either remained relatively
stable or eroded slightly. This initial accretion could be due
to the attachment of a portion of the pre-jetty ebb delta,
onshore migration of the offshore bar due to wave sheltering by
the jetties, and/or stabilization of the east sand dike area.
The relative stability of this shoreline may also be attributed
to wave sheltering by the jetties and the variability of littoral
transport in the Bird Island vicinity.
51. The portion of shoreline between Mad and Tubbs Inlets
appears also to have accreted slightly, but is more variable due
to its proximity to both inlets. It should be noted that ISRP
Profile Line 9 lies immediately to the west and Profile Line 8
immediately to the east of Mad Inlet, accounting for the often
dramatic changes seen on these lines.
Waties Island
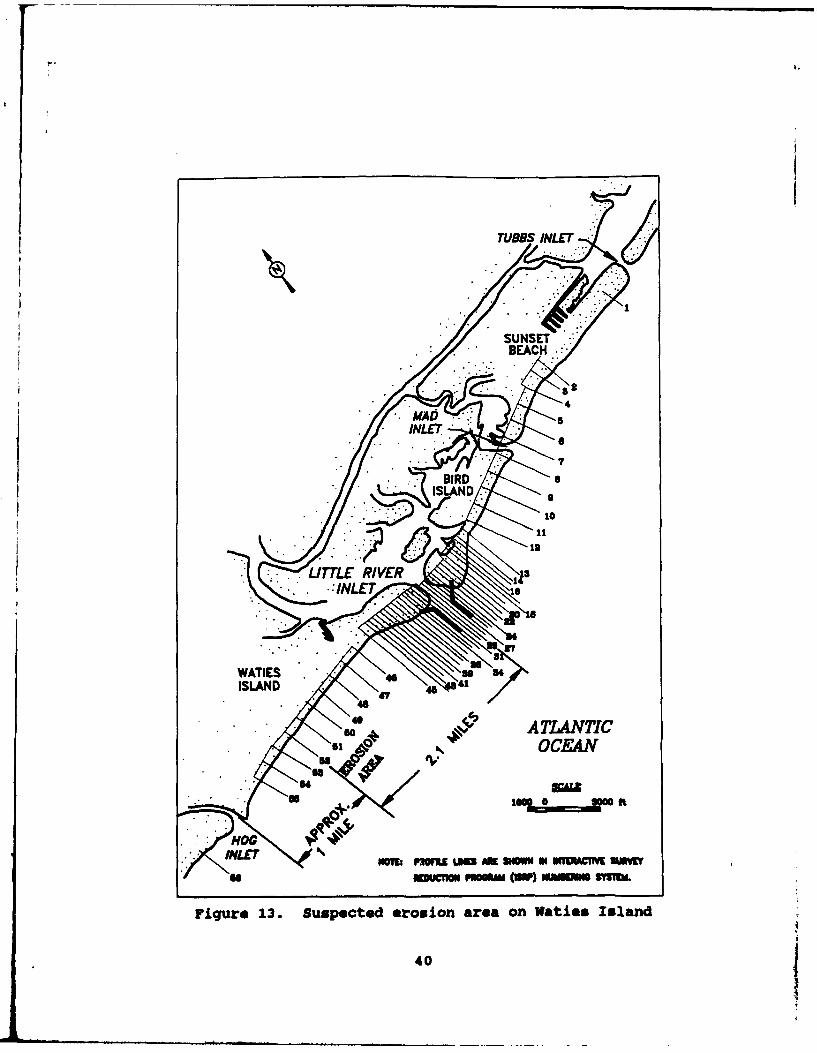
52. The shoreline to the west of the jetties in the
vicinity of ISRP profile lines 49 through 53 has previously been
identified as a potential area of project-related erosion (Figure
13), with profile line 52 experiencing the worst recession. This
area was examined in detail.
53. Historical shoreline change measurements taken along
map transects corresponding to ISRP lines 49 through 54 (Survey
Stations 81+00W through 131+00W) show that the western end of
Waties Island has naturally been unstable. Along these profile
lines, the shoreline has exhibited an overall erosional trend
since 1934 (Table 2 and Figure 8). According to Anders et al.
(1990), the northeast side of Hog Inlet (western end of
Waties Island) experienced 1,970 ft of accretion from 1873 to
1933/34, over 1,380 ft of erosion through 1969/70, and then
accreted 200 ft from 1969/70 through 1983. This area has been
historically dynamic in nature, experiencing alternating periods
of erosion and accretion, and has exhibited periodic trapping and
bypassing of significant quantities of material via Hog Inlet.
394
TUBBS INLET
LITTLEURIVE
NO~ eu SID K NN USEEWC CH
Figur 23. uspecedMeOioaraoWtisIln
40E7
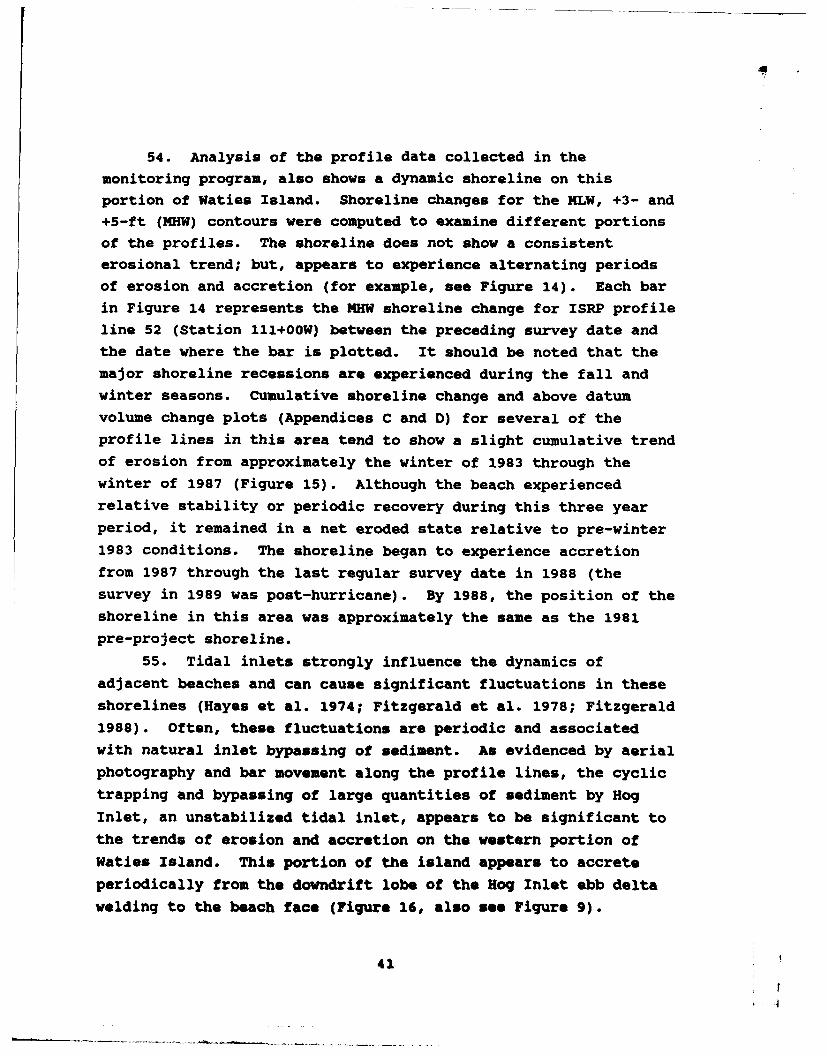
54. Analysis of the profile data collected in themonitoring program, also shows a dynamic shoreline on thisportion of Waties Island. Shoreline changes for the MLW, +3- and+5-ft (MHW) contours were computed to examine different portions
of the profiles. The shoreline does not show a consistenterosional trend; but, appears to experience alternating periodsof erosion and accretion (for example, see Figure 14). Each bar
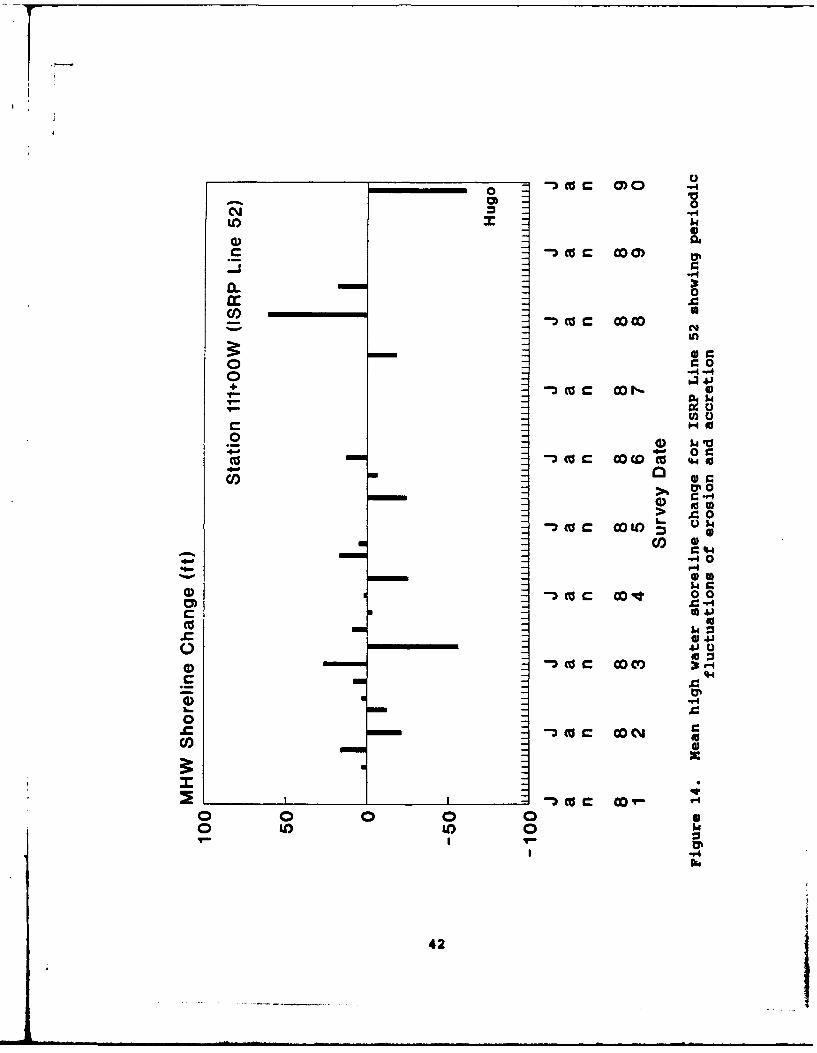
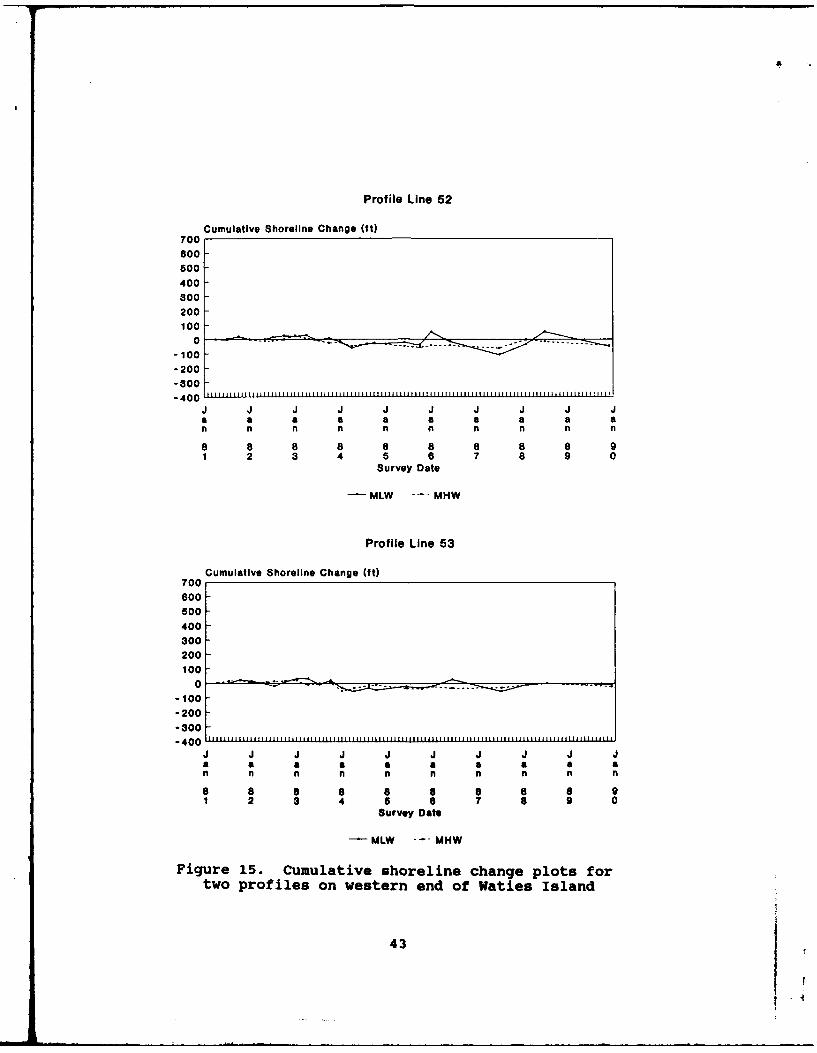
in Figure 14 represents the MHW shoreline change for ISRP profileline 52 (Station 111+00W) between the preceding survey date andthe date where the bar is plotted. It should be noted that themajor shoreline recessions are experienced during the fall andwinter seasons. Cumulative shoreline change and above datumvolume change plots (Appendices C and D) for several of theprofile lines in this area tend to show a slight cumulative trendof erosion from approximately the winter of 1983 through thewinter of 1987 (Figure 15). Although the beach experienced
relative stability or periodic recovery during this three yearperiod, it remained in a net eroded state relative to pre-winter
1983 conditions. The shoreline began to experience accretionfrom 1987 through the last regular survey date in 1988 (thesurvey in 1989 was post-hurricane). By 1988, the position of the
shoreline in this area was approximately the same as the 1981pre-project shoreline.
55. Tidal inlets strongly influence the dynamics of
adjacent beaches and can cause significant fluctuations in theseshorelines (Hayes et al. 1974; Fitzgerald et al. 1978; Fitzgerald1988). Often, these fluctuations are periodic and associatedwith natural inlet bypassing of sediment. As evidenced by aerialphotography and bar movement along the profile lines, the cyclic
trapping and bypassing of large quantities of sediment by Hog
Inlet, an unstabilized tidal inlet, appears to be significant tothe trends of erosion and accretion on the western portion of
Waties Island. This portion of the island appears to accrete
periodically from the downdrift lobe of the Hog Inlet ebb deltawelding to the beach face (Figure 16, also see Figure 9).
41
.4
a-.0
0c0
II
z "'4
- 0 r
N0
i o
0 4
0- 0 Id4
C,))0V 0
Co
-4
OS
c 1* 0 0
Ct 0
0 0 0
0 tO U) 0
0%
4
429
Profile Line 52
Cumulative Shoreline Change (ft)700600500
400300
200100
0-100-200-300
J J J J J J J J J Je a a a a a a a a a
n n n n n fl n n n
8 8 8 8 8 8 8 8 8 91 2 8 4 5 7 8 9 0
Survey Date
MLW --- MHW
Profile Line 53
Cumulative Shoreline Change (ft)700600500400300
200100
0 ... -- -
-100
-200-800-400
J J J J J~ J J J J Ja a a a a a a a a an n n n n n n n n n
8 8 8 a a a 8 8 a 91 2 3 4 6 a 7 8 9 0
Survey Date
-MLW -- MHW
Figure 15. Cumulative shoreline change plots fortwo profiles on western end of Waties Island
43
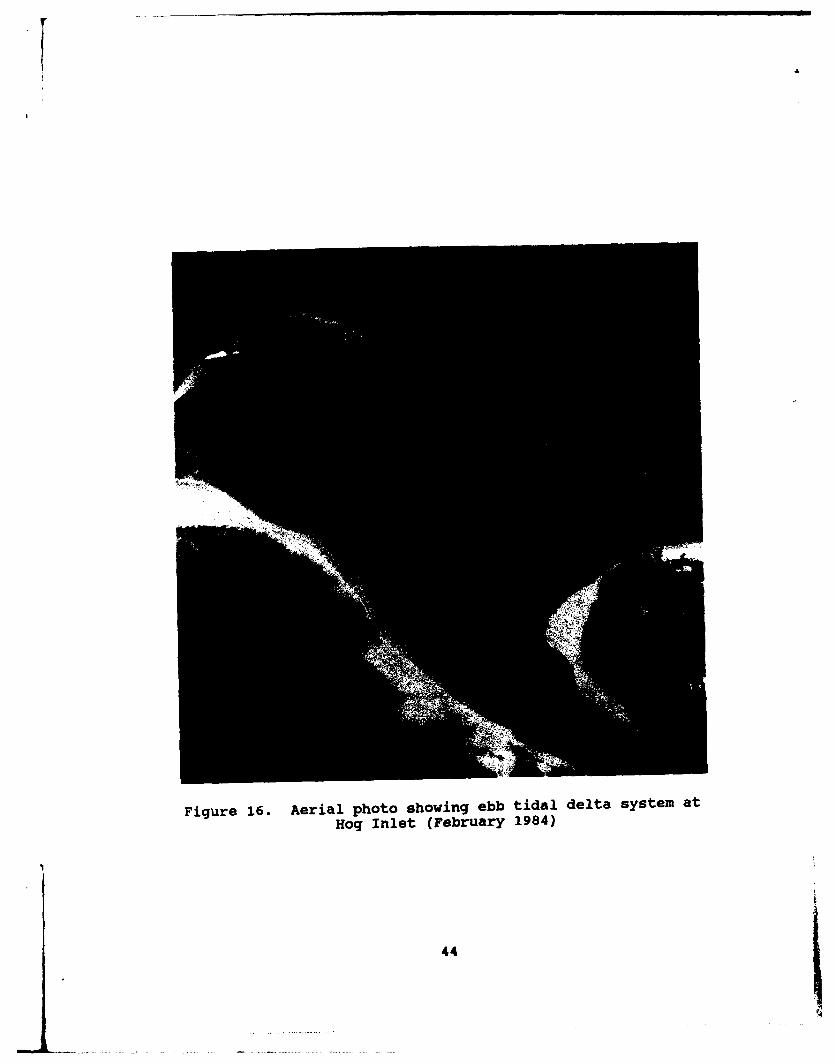
Figure 16. Aerial photo showing ebb tidal delta system at
Hog Inlet (February 1984)
441
Ebb tidal deltas represent a large sand reservoir, and slight
changes in the size of the ebb delta can greatly affect the sand
supply to nearby beaches (Fitzgerald 1988). From visual
observations of aerial photography, wave transformations around
the Hog Inlet shoals appear significant, and may also be a factor
in the periodic erosion on Waties Island. Wave transformations
due to the ebb shoal morphology may create a divergent nodal zone
downdrift of Hog Inlet on the western end of Waties Island
(possibly in the vicinity of ISRP profile line 52). Nodal zones
downdrift of inlets have been observed to be regions of beach
erosion (Ashley 1987; Farrell and Sinton 1983; Douglass 1991).
56. Based on an examination of profile data, aerial
photography, longshore transport trends, and historical data from
Anders et al. (1990), the periodic erosion occurring in this area
is more likely due to the dynamic morphology of Hog Inlet and
seasonal fluctuations, than due to effects caused by the
construction of the Little River Inlet jetties. In most cases,
the greatest beach recession is observed after the winter
seasons, with periodic recoveries of the beach inbetween.
Additionally, there has not been a significant increase in
sediment in the updrift fillet on Bird Island. If the jetties
were acting as a barrier to sediment supplying the western end of
Waties Island, a larger accretion in the east fillet would be
observed.57. The shoreline reach closest to the west jetty (ISRP
Lines 33 through 46) accreted dramatically since jetty
construction. Most of this accretion is due to the onshore
migration and welding of the abandoned (pre-jetty) ebb tidal
delta. An additional sediment source for this area was the
stabilization of the west sand dike area. These are discussed in
the following section on shoal and fillet volumes.
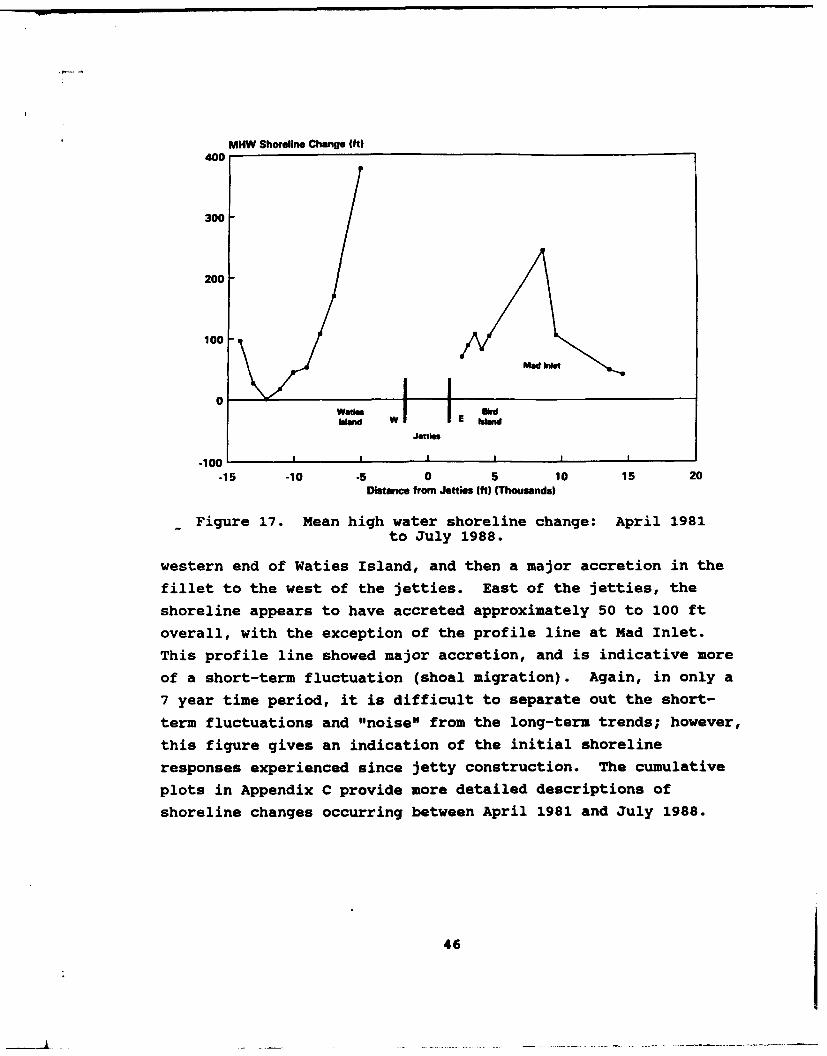
58. Summarizing shoreline change over the study area,
Figure 17 shows the net shoreline changes calculated between
April 1981 (pre-jetty) through July 1988. Moving from left to
right on Figure 17, the plot shows accretion immediately adjacent
to Hog Inlet, relatively the same shoreline position on the
45
MHW Shoreline Change Ift)
400
300
200
100 /MdN
0Wad= .kdksan W E island
-100 I I I I I
-15 -10 -5 0 5 10 15 20Distance ftr Jetties (ft) (Thousands)
- Figure 17. Mean high water shoreline change: April 1981to July 1988.
western end of Waties Island, and then a major accretion in the
fillet to the west of the jetties. East of the jetties, the
shoreline appears to have accreted approximately 50 to 100 ft
overall, with the exception of the profile line at Mad Inlet.
This profile line showed major accretion, and is indicative more
of a short-term fluctuation (shoal migration). Again, in only a
7 year time period, it is difficult to separate out the short-
term fluctuations and "noise" from the long-term trends; however,
this figure gives an indication of the initial shoreline
responses experienced since jetty construction. The cumulative
plots in Appendix C provide more detailed descriptions of
shoreline changes occurring between April 1981 and July 1988.
46

Shoal and Fillet Volumes
59. Total volumes of material in the fillets and shoals
were computed utilizing the Contour Plotting System. Two areas
showing the most accretion were the fillet to the west of the
jetties (Figure 6) and the inside jetty shoreline of Bird Island,
labeled East Flood (Figure 7).
60. The landward migration of the relict ebb tidal delta
and stabilization of the downcoast sand dike are the causes of a
major portion of the accretion in the west fillet (see Figure 9d
through 9j). Because ebb tidal deltas form due to a balance of
tidal and wave forces, confinement of flow between the jetties
causes wave dominance of the adjacent pre-jetty ebb tidal delta.
Landward bar migration occurs due to wave induced sediment
transport. This response of the ebb tidal delta has been
observed at other southeast inlets, and is discussed in Hansen
and Knowles (1988) and Pope (1991).
61. By 1985, a portion of the abandoned ebb delta which had
been trapped between the jetties during construction, had welded
onto the western portion of Bird Island inside of the jetties
(polygon denoted East Inside). This extent of this sand shoal
began to significantly increase from 1987 to 1989. This shoal is
probably receiving some sediment deposits from the channel
eroding material off of the centrally located flood delta.
Additionally, although the jetties have been sand-tightened, a
small portion of this increase may be due to sediment passing
through or over the jetties. Supplementary volumes were computed
for this area in an attempt to determine the sources of this
growth, and show that the major volumetric increase is due to the
attachment and molding by waves of the old ebb shoal onto this
portion of Bird Island. During a field investigation in May
1991, this shoal had developed a significant scarp and appeared
to be experiencing erosion due to currents and tidal flow.
62. The dominant direction of littoral drift is to the
northeast. With the frequent drift reversals, there still does
not appear to be a significant building up the east fillet. If
47
the jetties were acting as a barrier to sediment supplying the
western end of Waties Island, a larger accretion in the east
fillet and along would be observed. Aerial photography and
supplementary volume calculations indicate that the buildup of
the inner shoal within the jetties is mostly due to migration and
attachment of a portion of the abandoned ebb shoal. Some of this
accretion may be due to wind-blown sand or sand passing from the
east fillet through the east jetty; however, this amount is not
significant enough to be the major source of sediment for the
inside shoal.
63. Examination of volume calculations and hydrographicsurveys shows that the ebb tidal delta appears to be slowly re-
building off of the tip of the east jetty. This shoal is not
yet apparent in the aerial photography, and ranges in depth
between 8- to 12-ft below MLW.
Jetty Scour and Channel Migration
64. Sinfa the jetties were constructed, the channel has
meandered and migrated relative to the constructed project
channel. Scour holes have formed along the west jetty and at the
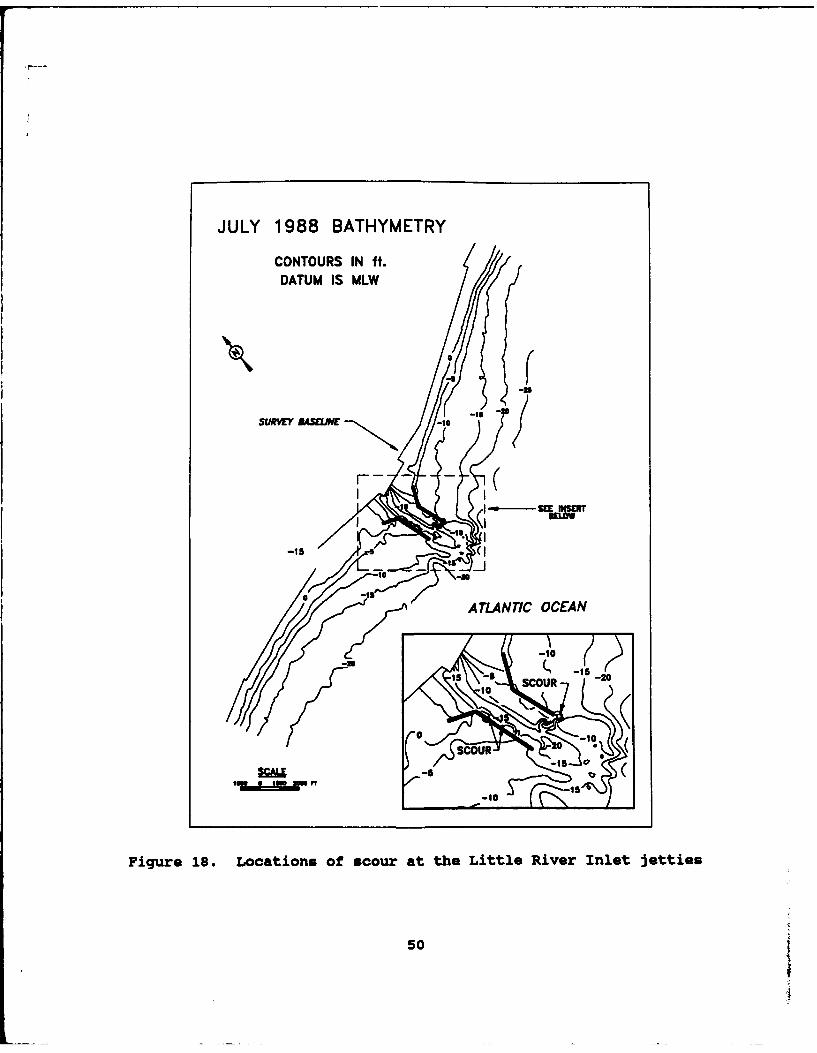
east jetty tip (Figure 18), possibly due to the migrating
channel. The scour hole along the west jetty has been documented
to run within 50 ft of the toe of the structure to a depth of
25 ft MLW for approximately 2,000 ft (US Army Engineer District,
Charleston 1990). The scour hole at the tip of the east jetty is
also approximately 20 to 25 ft deep. Comparison of bathymetric
contour maps (Appendix E) shows that these scour holes began to
develop just after construction was completed. A deep area on
the order of 25 to 30 ft also exists further back in the inlet
throat near the shoal on the inner side of the east jetty. This
scour could possibly be the relict inlet gorge or due to the
confluence of the two bifurcating channels that feed the inlet
(Kjerve et al. 1979).
65. The SAC is monitoring the erosion and slope steepening
at these scour locations in order to evaluate the condition of
48
and potential risk to the structures. A stability analysis was
completed for the west jetty in February 1990. The results
indicated an average existing slope of 1 vertical on 2.5
horizontal, with a computed factor of safety of 1.7. The
required factor of safety is 1.5; corresponding to a minimum
acceptable slope of 1 vertical on 2 horizontal. If increased
erosion towards the jetty occurs, remedial measures will be
required to insure the integrity of the jetty structures (US Army
Corps of Engineers 1990).
49
JULY 1988 BATHYMETRY
CONTOURS IN ft.DATUM IS MLW
-1-u
0)
is- SCURf2
F-- - 0
-u1
Figure 18. Locations of scour at the Little River Inlet jetties
50
PART IV: RECOMMENDATIONS
Dredaed Material Disnosal ontions
66. The primary objectives of this analysis were tosummarize beach and nearshore response to the Little River Inlet
navigation project and assist SAC in developing disposal plansfor maintenance material to be dredged from Little River Inlet.
67. From the most recent channel surveys, adequate
navigable depths exist in the inlet; however the channel hasmigrated significantly. Based on depth alone, there does notappear to be a critical need for dredging operations within theinlet. If dredging of the inlet does proceed, several
alternatives are available for disposal of the dredged material.
A. Beach nourishment for western Dortion of WatiesIsland (ISRP Lines 49 to 53 corresondina to surveystations 81+00 to 121+00 West). This analysisdetermined that the periodic erosion occurring atthis section of shoreline was primarily caused byfrequent trapping and bypassing of material by HogInlet and seasonal fluctuations. Placement ofdredged material in this area is not an efficientmethod for disposal. Due to the dynamic nature ofthe area, the longevity and stability of thenourishment is at high risk. Due to the dominantnortheasterly transport trend, this material mayshift downdrift into the west fillet and mayultimately reenter the Little River Inlet channel.Also, dredging costs would be excessive since thisarea is approximately 2 miles to the west of thechannel.
J. Placement of material directly to the east of theietties on Bird Island. Although the direction oflongshore transport in the study area is variable,it is slightly dominant to the northeast. However,the east fillet section of the Bird Islandshoreline has in fact showed a net accretion overthe entire monitoring period, therefore bypassingof the material or disposal of dredged material inthis area does not appear to be necessary.Additionally, adding a significant quantity ofmaterial to this section of shoreline may effectthe natural processes at Mad Inlet.
g. Placement of material in the scour hole at the eastiettv ti and alona the inner side of thewestJetty, The SAC performed a similar operation after
51-. ,
the December 1983 dredging of the Little RiverInlet channel; however, the material did not remainin the scour hole for very long. This option wouldbe a temporary solution to the scour hole problem;but, would not have great longevity and could causeproblems with shoaling in the channel.
. A redirection or modulation of flow throuah thechannel. The deep area that exists adjacent to theinside Jetty shoreline of Bird Island couldpossibly be a factor in the channel meandering inthat direction, and then swinging back along thewest jetty. Several alternatives may exist forusing the dredged material in an attempt toredirect the channel and alleviate scour along thewest jetty. Measurement of currents within theinlet system was conducted in May 1991, andanalysis of this data would be required before thisalternative could be fully defined. Inlethydrodynamics may be used to evaluate a more stableposition for the channel.
q. Stockgilina of the material. The dredged materialcan be stored in the sand dike areas for futureuse.
68. Stockpiling the material inside the jetties on the westside of the inlet (in the sand dike area) is the recommendeddisposal alternative. This analysis has concluded that there isno immediate need for beach nourishment due to project-relatederosion. Since a hydraulic pipeline dredge will be used for thisoperation, material can easily be pumped into this area andstored for future use if it should ever be required. Thepotential effects of a dredging operation on the inlet system'sstability is further justification to stockpile the sand andcontinue monitoring the project. This aspect is under additionalinvestigation in Phase II of this analysis.
Continued Monitorina Efforts
69. Additionally, this analysis examined if any actionshould be taken to open the weir sections of either Jetty. Dueto the relative balance in the fillet and shoal system, there donot appear to be any apparent benefits from uncovering either ofthe weirs at this time.
52
I
70. Continued monitoring of the project at a minimum level
is recommended to better define the long-term equilibrium
response to the jetty construction. Monitoring should include
annual beach profiles, annual aerial photography coinciding with
the beach surveys, and periodic structural inspections and
hydrographic surveys of the inlet. Continuation of the LEO
program at the three sites in the vicinity of Little River Inlet
is not recommended. Ten years of LEO data have already been
collected, providing an adequate database for this type of
information.
71. In addition to routine project monitoring, the
collection of wave gage data would improve the accuracy of
longshore transport information. Tidal current monitoring and
delineation of the inlet hydrodynamics will aid in defining the
dynamics of the channel migration and scour problem.
Continued Analysis
72. Subsequent discussions between SAC, CERC, and U.S. Army
Engineer, South Atlantic Division representatives have indicated
that the channel migration and jetty scour problems are important
project concerns relative to dredging and nourishment operations.
Additional analyses of the post-jetty thalweg evolution and
stability, relative inlet hydrodynamics, and jetty scour have
been recommended and approved by SAC.
73. Phase II of this analysis is to perform a
reconnaissance level review of the inlet thalweg stability, and
develop recommendations for an inlet maintenance and/or
monitoring plan which will assist with the proposed dredging of
Little River Inlet. These recommendations will attempt to
minimize dredging requirements and maximize inlet stability, in
order to reduce or prevent scour-induced damage to the jetties
due to natural thalweg migration. The field investigation of
tidal currents at Little River Inlet and a side-scan sonar surveywere conducted in May 1991. Results of these analyses will be
available in a subsequent report.
53
REFERENCES
Anders, F. J., Reed D. W., and Neisburger, E. P. 1990."Shoreline Movements: Tybee Island, Georgia, to Cape Fear, NorthCarolina, 1851-1983," Technical Report CERC-83-1, Report 2, UsArmy Engineer Waterways Experiment Station, Vicksburg, MS.
Birkemeier, W. 1984. "A User's Guide to ISRP: The InteractiveSurvey Reduction Program," Instruction Report CERC-84-1, US ArmyEngineer Waterways Experiment Station, Vicksburg, MS.
Brown, P. J. 1977. "Variations in South Carolina CoastalMorphology" in Beaches and Barriers of the central South CarolinaCoast. D. Nummedal (ed).
Corson, W. D., and Resio, D. T. 1980. "Yearly LittoralTransport Statistics for Murrells Inlet and Little River Inlet,"US Army Engineer Waterways Experiment Station, Vicksburg, MS.
Davies, J. L. 1964. "A Norphogenic Approach to WorldShorelines," Zeit. fur GeomorDh., Vol. 8, pp. 127-142.
Davis, R. A. Jr., and Hayes, M. 0. 1984. "What is a WaveDominated Coast?" In: Hydrodynamics and Sedimentation in WaveDominated Coastal Environments, B. Greenwood and R. A. Davis,eds., Vol 60.
Douglass, S. L. 1991. "Simple Conceptual Explanation of Down-drift Offset Inlets," Journal of Waterway. Port. Coastal. andOcean Enaineerina. American Society of Civil Engineers, Vol. 117,No. 2.
Ebersole, B. A., Cialone, N. A., and Prater, M. D. 1986."Regional Coastal Processes Numerical Modeling System: RCPWAVE-ALinear Wave Propagation Model for Engineering Use," TechnicalReport CERC-86-4, US Army Engineer Waterways Experiment Station,Vicksburg, MS.
Farrell, S. C., and Sinton, J. W. 1983. "Post-Storm Managementand Planning in Avalon, New Jersey,* Proceedinas. Coastal Zone
Fitzgerald, D. N. 1988. "Shoreline Erosional-DepositionalProcesses Associated with Tidal Inlets," in Hydrgdyn= ics andSediment Dynamics of Tidal Inlets, ed. D. G. Aubrey and L.Weisher, Springer Verlag.
Fitzgerald, D. N., Hubbard, D. K., and Nummdal, D. 1978."Shoreline Changes Associated with Tidal Inlets Along the SouthCarolina Coast," Prceedinas. Coastal Zone '78, American Societyof Civil Engineers, San Francisco, CA.
54
Hanson, M. and Knowles, S. C., 1988. 'Ebb-Tidal Delta Responseto Jetty Construction at Three South Carolina Inlets,' inHydrodynamics and Sediment Dynamics of Tidal Inlets, ed. D. G.Aubrey and L. Weisher, Springer Verlag.
Hayes, M. 0., Hulmes, L. J., and Wilson, S. J. 1974."Importance of Tidal Deltas in Erosion and Depositional Historyof Barrier Islands," Abstracts with Programs. 1974 AnnualMeetina. Geological Society of America. Miami, FL.
Hubbard, D. K., Oertel, G., and Nummedal, D. 1979. "The Role ofWaves and Tidal Currents in the Development of Tidal InletSedimentary Structures and Sand Body Geometry: Examples for NorthCarolina, South Carolina, and Georgia," Journal of SedimentaryPejtrolM . Vol 49, pp 1073-1092.
Jensen, R. E. 1983. "Atlantic Coast Hindcast, Shallow Water,Significant Wave Information,' WIS Report 9, US Army EngineerWaterways Experiment Station, Vicksburg, MS.
Kjerve, B., Shao, C. C., and Staper, F. W. Jr. 1979. "Formationof Deep Scour Holes at the Junction of Tidal Creeks: AnHypothesis," Marine GeoloMv. Vol. 33.
Pope, J. unpublished. "Longshore Transport Trends in theVicinity of Little River Inlet, South Carolina," US ArmyEngineer Waterways Experiment Station, Vicksburg, MS.
Pope, J.. 1991. "Ebb Delta and Shoreline Stabilization -Examples from the Southeast Atlantic Coast," Proceedings.Coastal Zone. '91. American Society of Civil Engineers, LongBeach, CA.
Schneider, C. 1981. "Littoral Environment Observation 'LEO'Data Collection Program," CERC Coastal Engineering Technical Aid81-S, US Army Engineer Waterways Experiment Station, Vicksburg,MS.
Schneider, C., and Weggel, J.R. 1980. "Visually Observed WaveData at Pt. Mugu, California," Proceedinas. 17th InternationalCoastal Enaineerina Conference. American Society of CivilEngineers, Sydney, Australia.
Seabergh, W. C., and Lane, E. F. 1977. "Improvements for LittleRiver Inlet, South Carolina,' Technical Report H-77-21, US ArmyEngineer Waterways Experiment Station, Vicksburg, MS.
US Army Engineer District, Charleston. 1971. Little River InletBrunswick County. North Carolina and Horr County. SouthCarolina. Survey Report on Naviaation. Charleston, SC.
55 V,
US Army Engineer District, Charleston. 1977. Little River InletNorth Carolina and South Carolina Naviaation project.GeneralDesian Memorandum. Charleston, Sc.
1990. Little River Inlet Navigation Project. LittleRiver Inlet. North and South Carolina. Letter Report of Post-HugoDamaae Assessment". March, Charleston, SC.
US Army Engineer Waterways Experiment Station. unpublished."Littoral Transport Rates at Murrells and Little River Inlet,"Transmittal letter to South Atlantic Division, Vicksburg, MS.
Ward, D. L., and Knowles, S. C. 1987. "Coastal Response to WeirJetty Construction at Little River Inlet, North and SouthCarolina," Coastal Sediments '87. American Society of civilEngineers.
56
APPENDIX A:
BEACH PROFILES
S
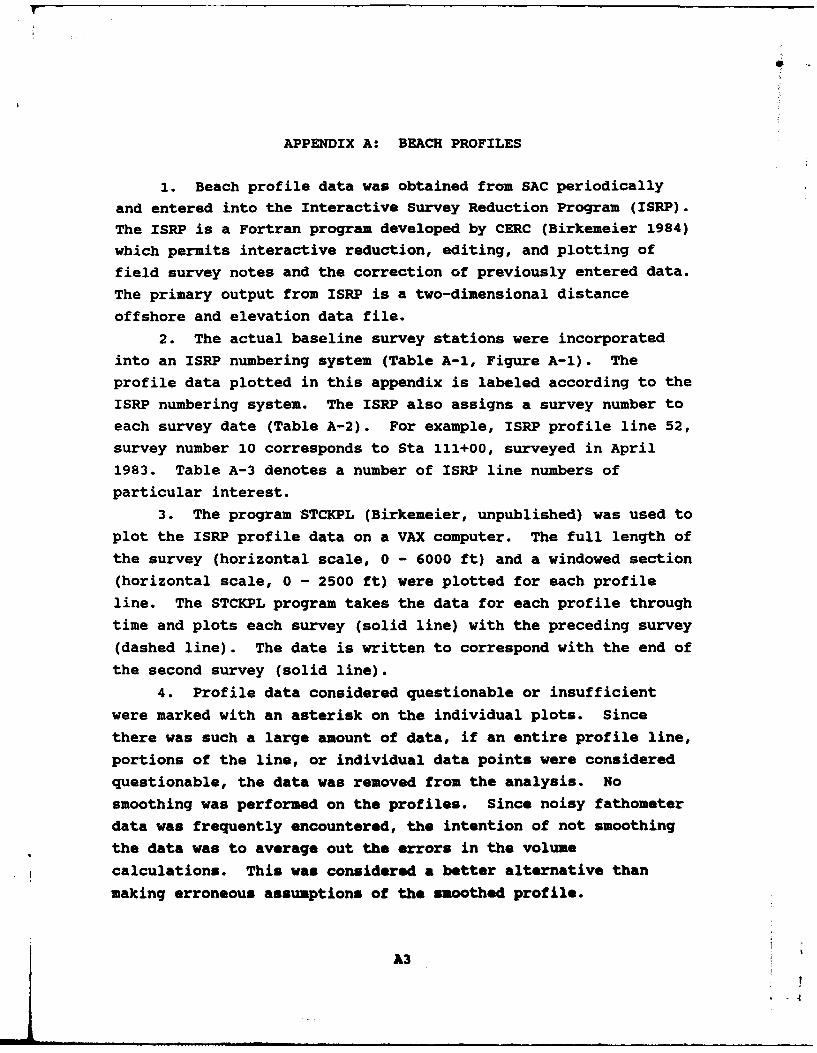
APPENDIX A: BEACH PROFILES
1. Beach profile data was obtained from SAC periodically
and entered into the Interactive Survey Reduction Program (ISRP).
The ISRP is a Fortran program developed by CERC (Birkemeier 1984)
which permits interactive reduction, editing, and plotting of
field survey notes and the correction of previously entered data.
The primary output from ISRP is a two-dimensional distance
offshore and elevation data file.
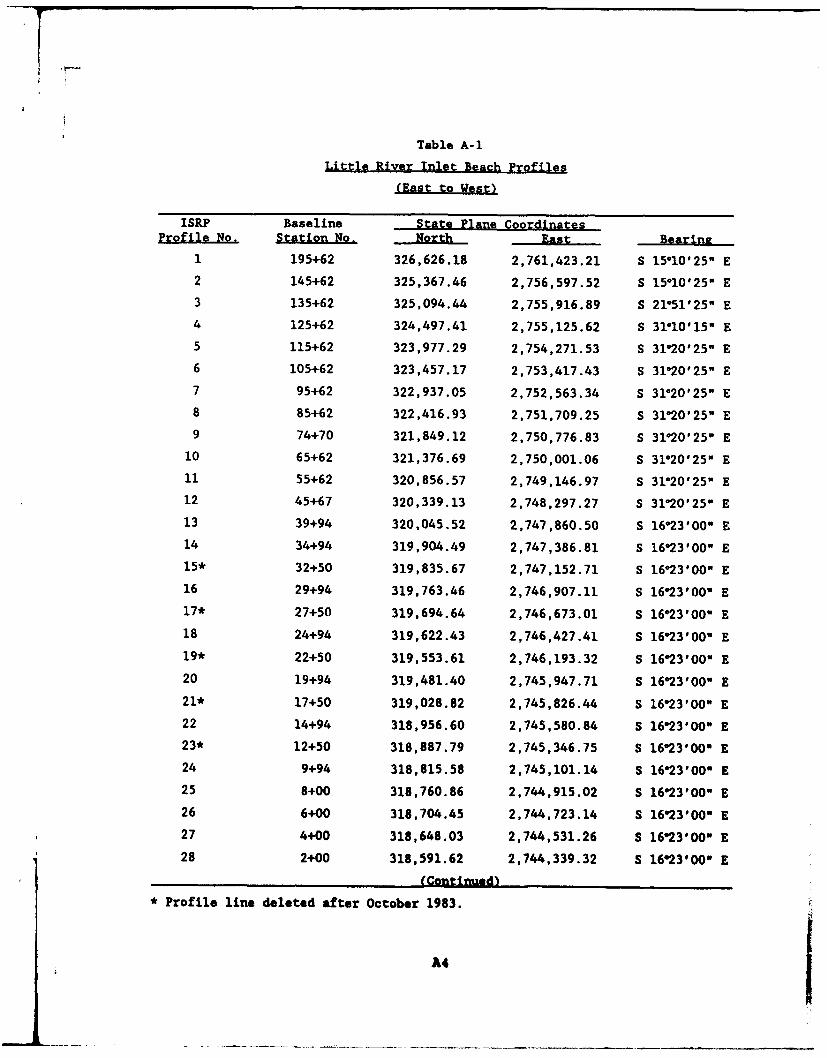
2. The actual baseline survey stations were incorporated
into an ISRP numbering system (Table A-i, Figure A-i). Theprofile data plotted in this appendix is labeled according to the
ISRP numbering system. The ISRP also assigns a survey number toeach survey date (Table A-2). For example, ISRP profile line 52,
survey number 10 corresponds to Sta 111+00, surveyed in April
1983. Table A-3 denotes a number of ISRP line numbers ofparticular interest.
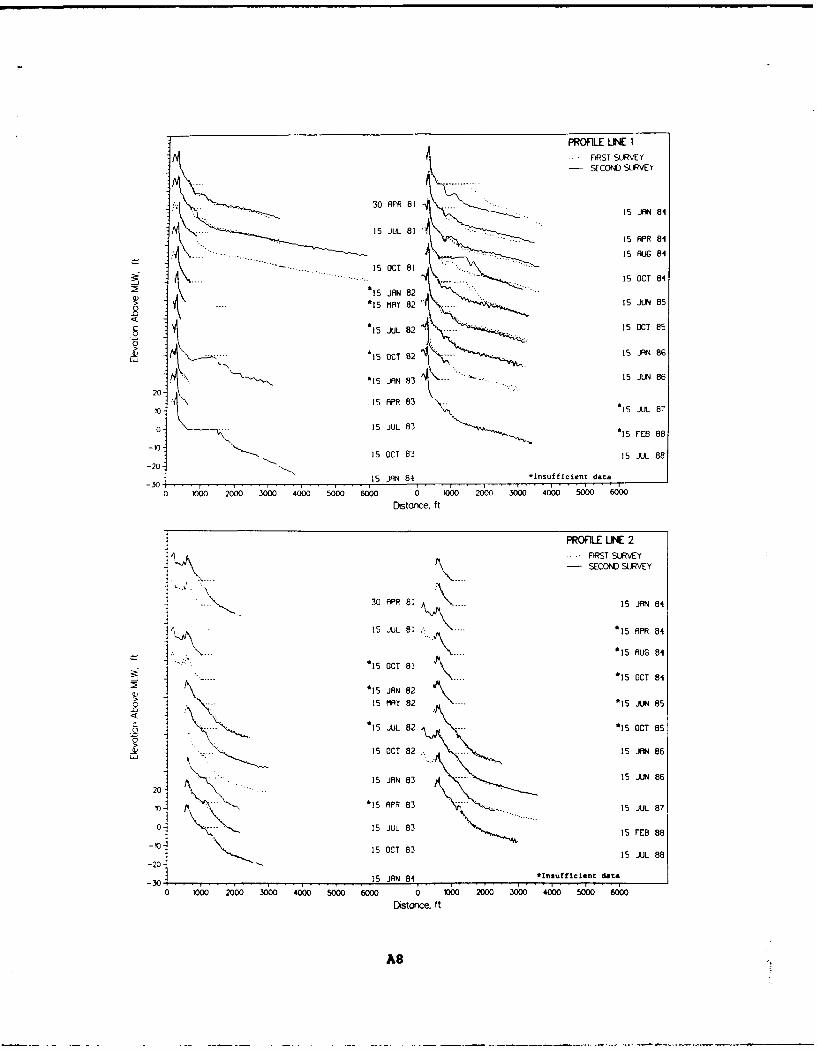
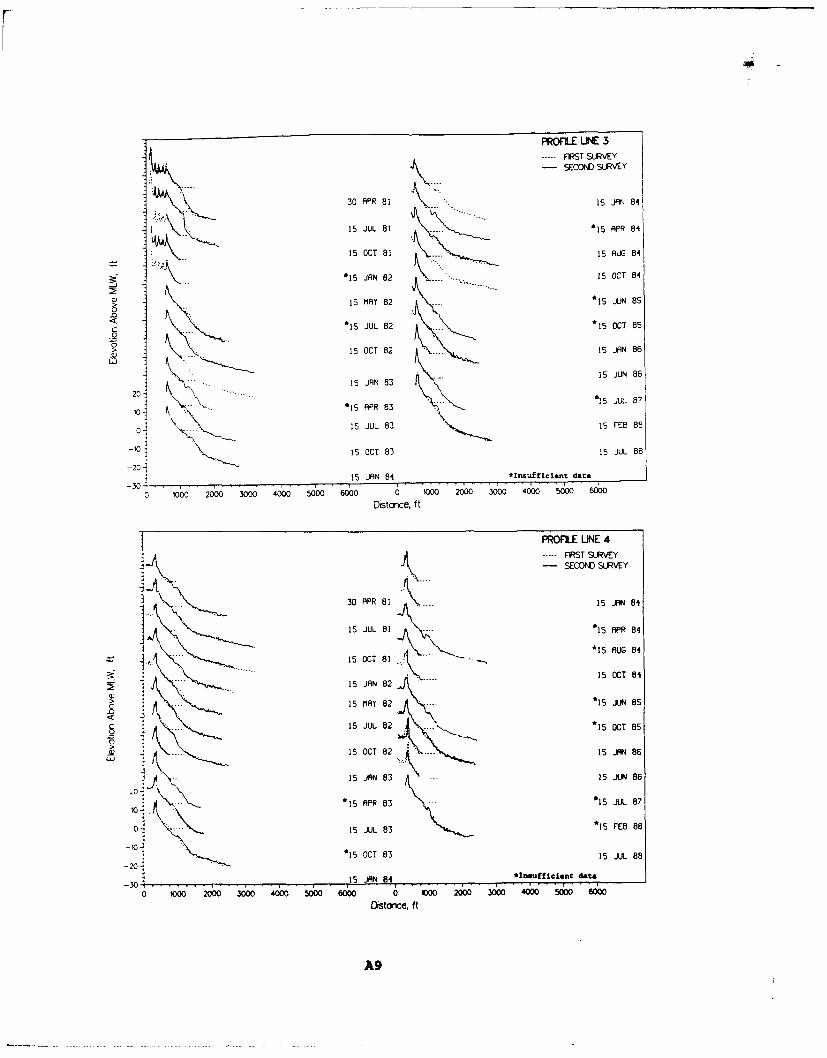
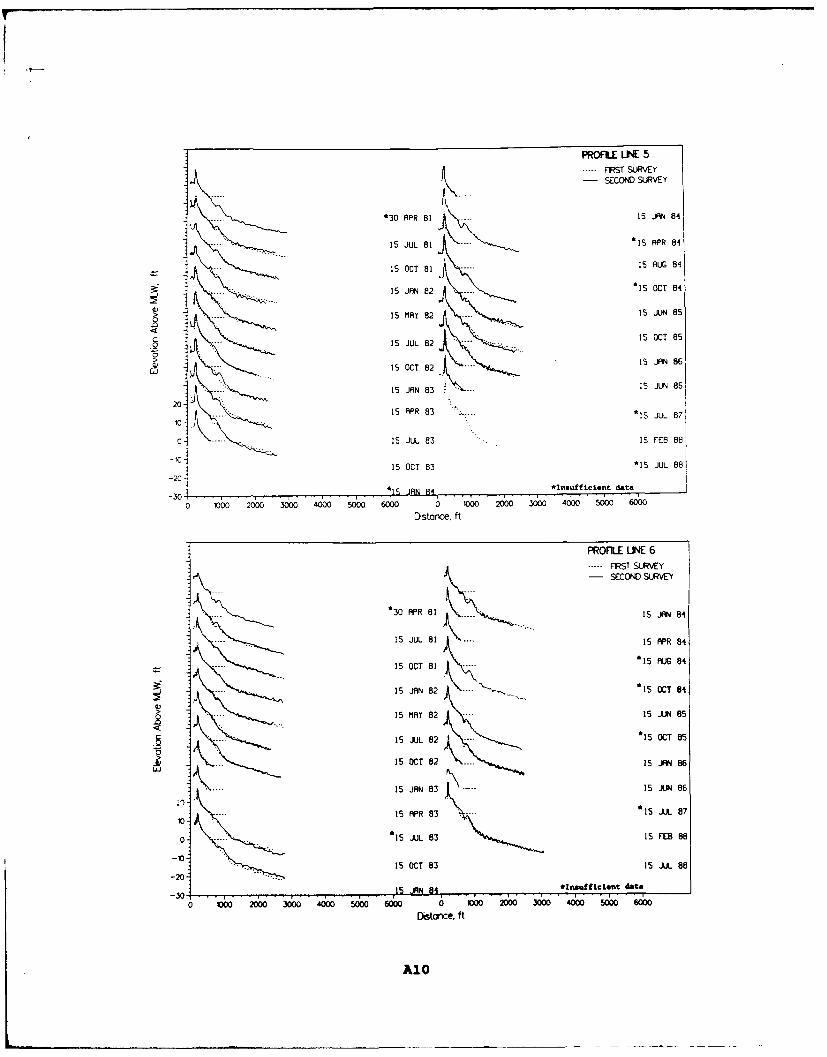
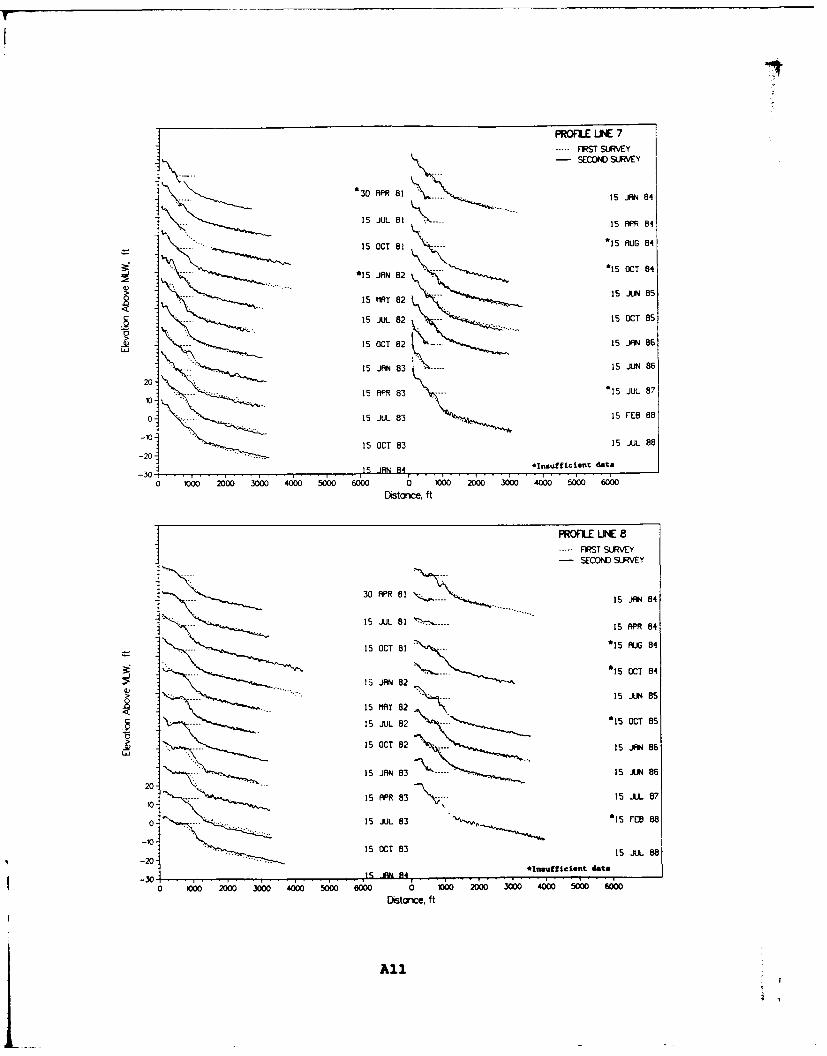
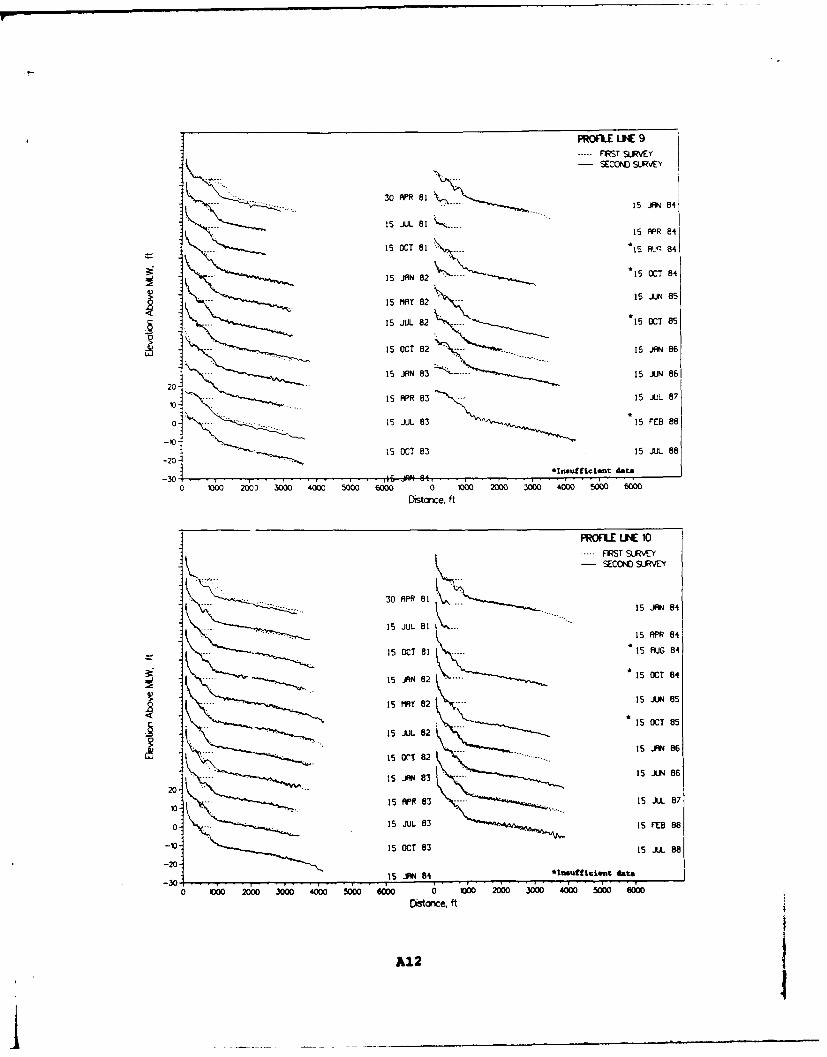
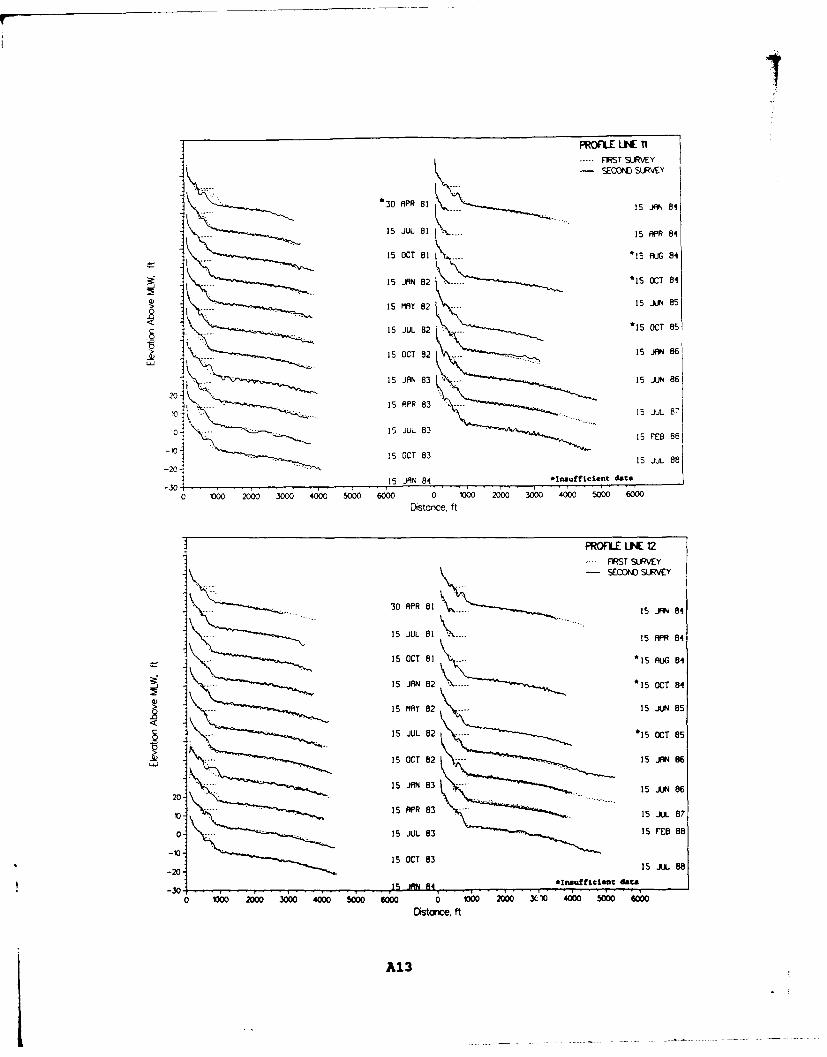
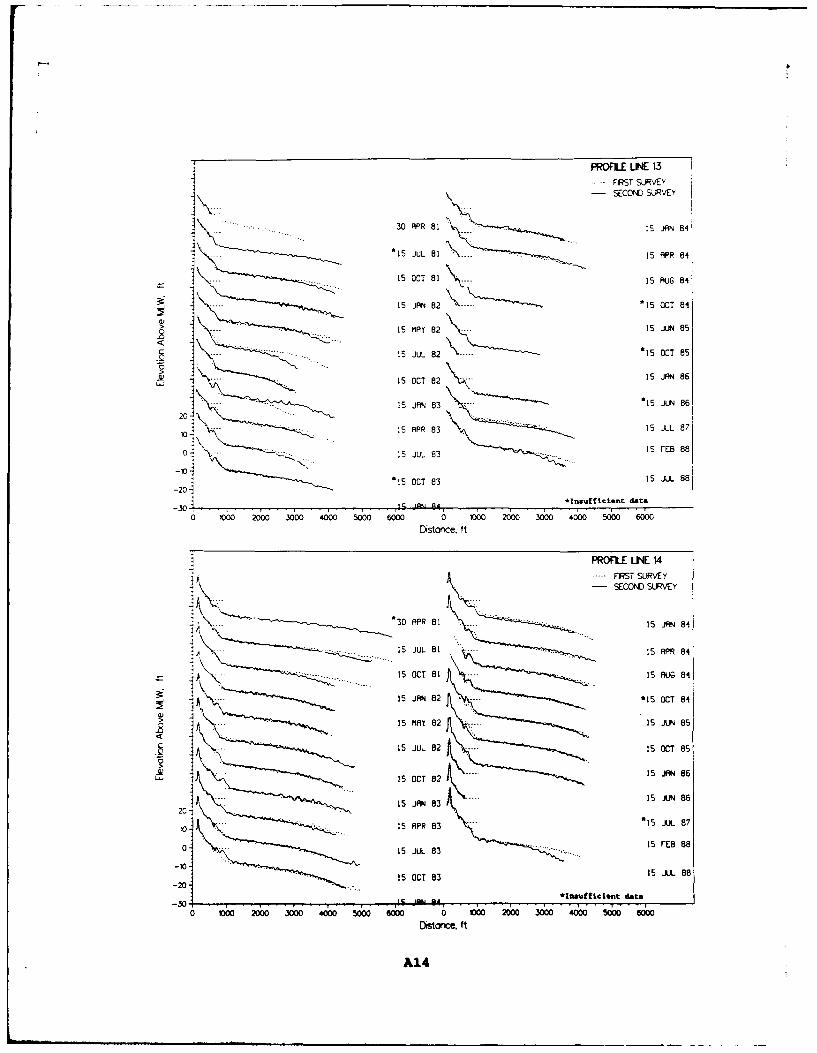
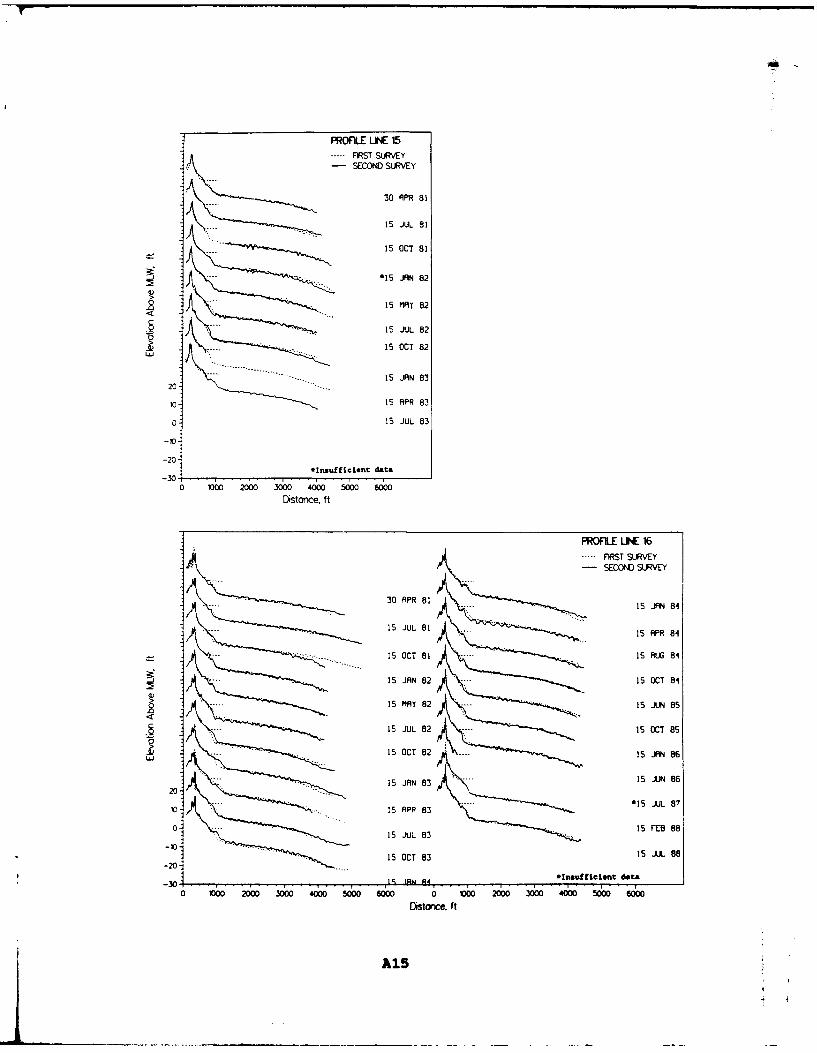
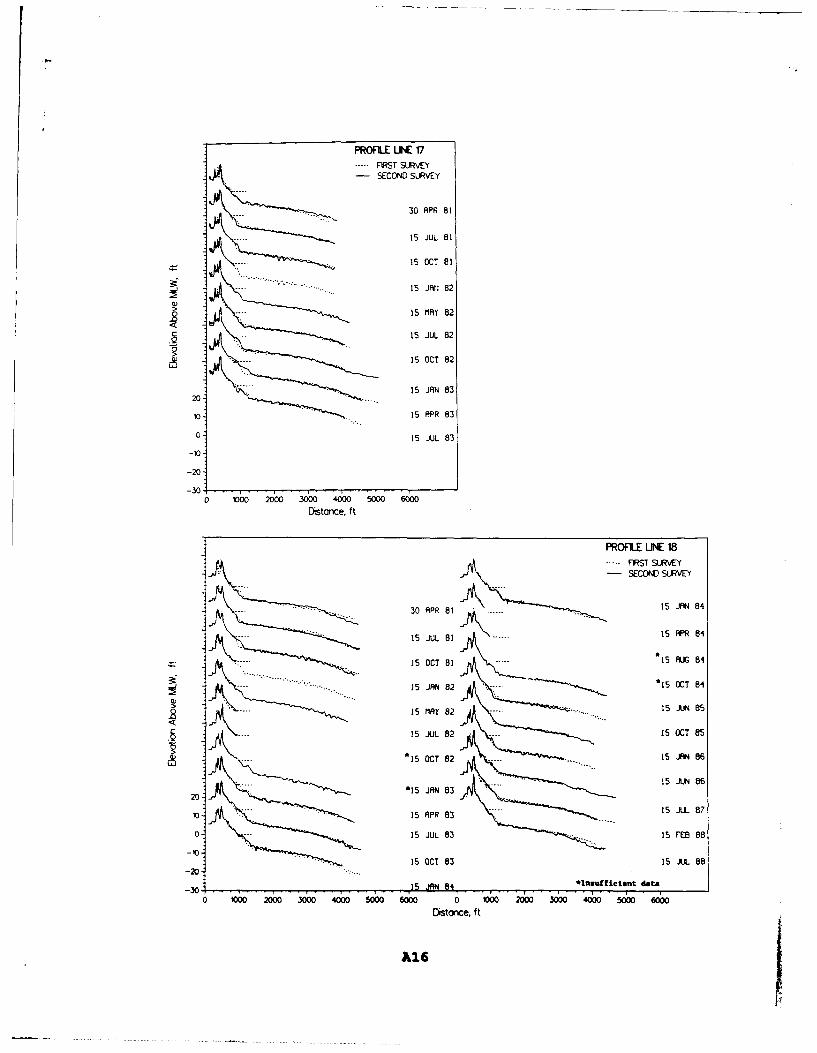
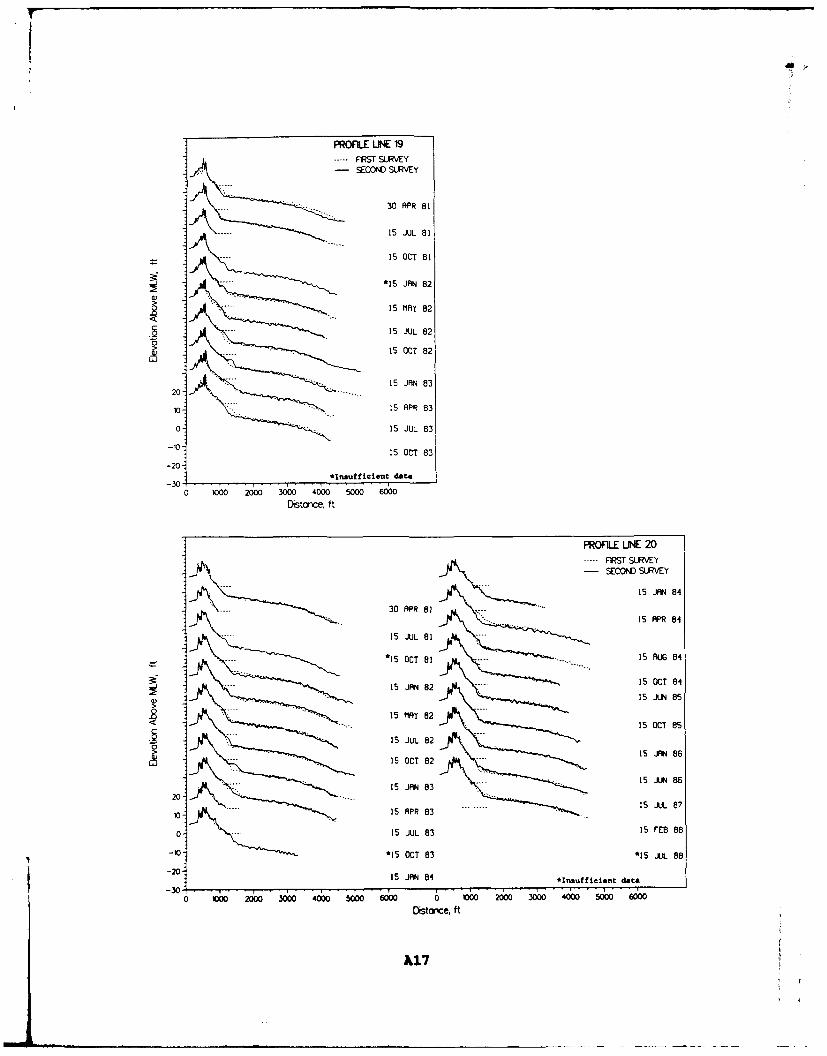
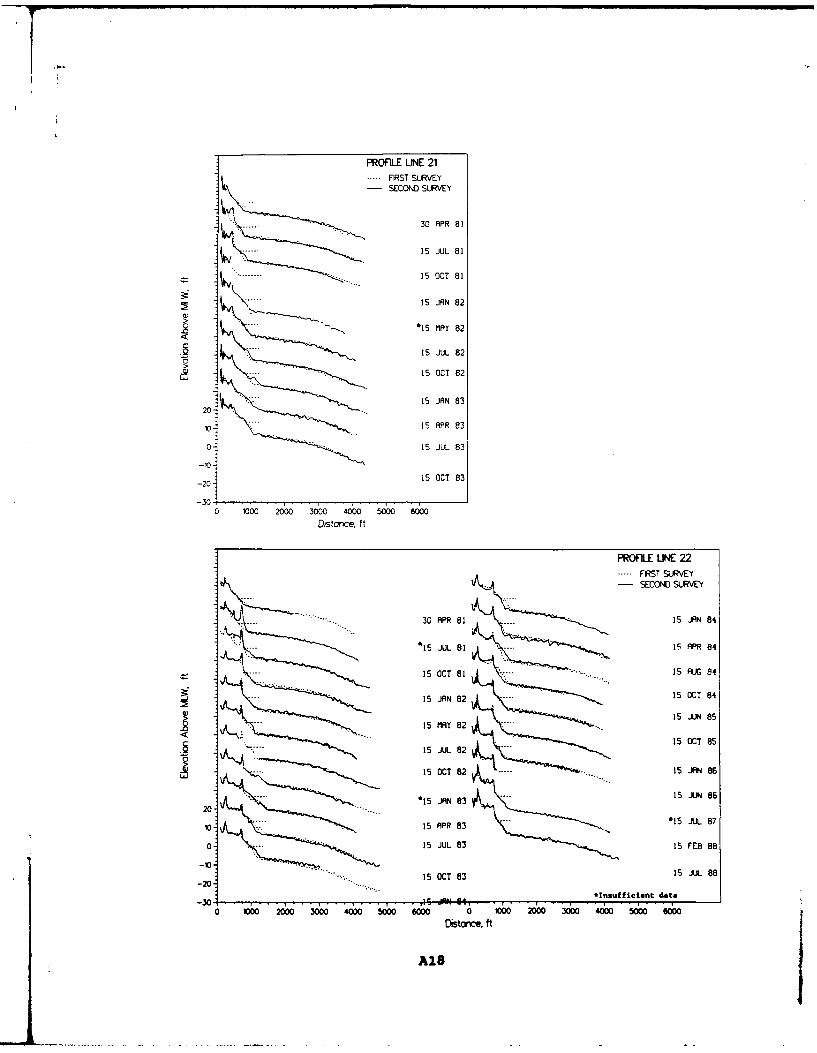
3. The program STCKPL (Birkemeier, unpublished) was used to
plot the ISRP profile data on a VAX computer. The full length of
the survey (horizontal scale, 0 - 6000 ft) and a windowed section
(horizontal scale, 0 - 2500 ft) were plotted for each profile
line. The STCKPL program takes the data for each profile throughtime and plots each survey (solid line) with the preceding survey
(dashed line). The date is written to correspond with the end of
the second survey (solid line).
4. Profile data considered questionable or insufficient
were marked with an asterisk on the individual plots. Since
there was such a large amount of data, if an entire profile line,
portions of the line, or individual data points were considered
questionable, the data was removed from the analysis. No
smoothing was performed on the profiles. Since noisy fathometer
data was frequently encountered, the intention of not smoothingthe data was to average out the errors in the volume
calculations. This was considered a better alternative than
making erroneous assumptions of the smoothed profile.
A3
~7 i
Table A-1
Little River Inlet Beach Profiles
(East to West)
ISRP Baseline State Plane CoordinatesProfile No. t.t . Norh EastBearn
1 195+62 326,626.18 2,761,423.21 S 15010'25" E
2 145+62 325,367.46 2,756,597.52 S 15010'25" E
3 135+62 325,094.44 2,755,916.89 S 21051'25" E
4 125+62 324,497.41 2,755,125.62 S 31°10'15" E
5 115+62 323,977.29 2,754,271.53 S 3100'25" E
6 105+62 323,457.17 2,753,417.43 S 3120'25" E
7 95+62 322,937.05 2,752,563.34 S 31020'25" E
8 85+62 322,416.93 2,751,709.25 S 3100'25" E9 74+70 321,849.12 2,750,776.83 S 31020'25" E
10 65+62 321,376.69 2,750,001.06 S 31020'25N E
11 55+62 320,856.57 2,749,146.97 S 31020'25" E
12 45+67 320,339.13 2,748,297.27 S 31020'25" E
13 39+94 320,045.52 2,747,860.50 S 16023'00" E
14 34+94 319,904.49 2,747,386.81 S 16023'00" E
15* 32+50 319,835.67 2,747,152.71 S 16023'00" E
16 29+94 319,763.46 2,746,907.11 S 16023'00" E
17* 27+50 319,694.64 2,746,673.01 S 16023'00" E
18 24+94 319,622.43 2,746,427.41 S 16023'00" E
19* 22+50 319,553.61 2,746,193.32 S 1623'00u E
20 19+94 319,481.40 2,745,947.71 S 1603'00" E
21* 17+50 319,028.82 2,745,826.44 S 16023'00 E
22 14+94 318,956.60 2,745,580.84 S 1623'00" E
23* 12+50 318,887.79 2,745,346.75 S 16023'00" E
24 9+94 318,815.58 2,745,101.14 S 16023'000 E
25 8+00 318,760.86 2,744,915.02 S 16023'00" E
26 6+00 318,704.45 2,744,723.14 S 16023'00* E
27 4+00 318,648.03 2,744,531.26 S 16,23'00" E
28 2+00 318,591.62 2,744,339.32 S 16023'000 E
(Continued)
* Profile line deleted after October 1983.
A4
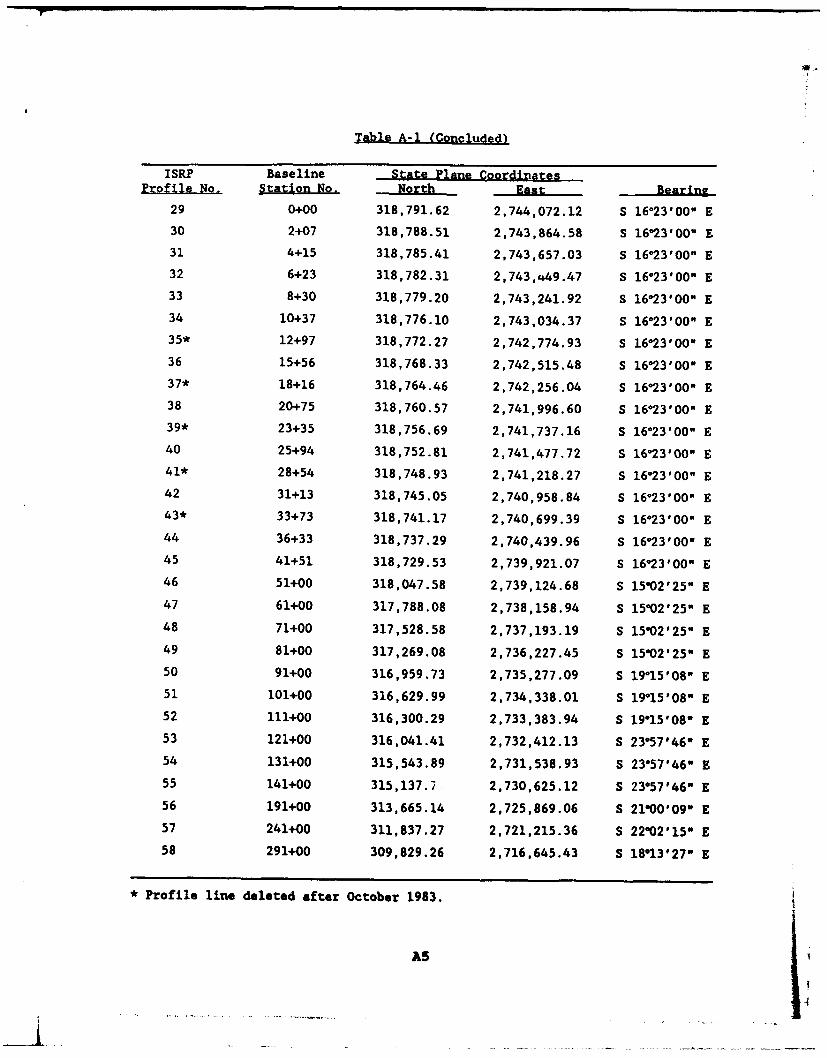
Table A-1 (Concluded)
ISRP Baseline State Plane CoordinatesilStation No. Nrth East
29 0+00 318,791.62 2,744,072.12 S 16023'00" E30 2+07 318,788.51 2,743,864.58 S 16023900" E31 4+15 318,785.41 2,743,657.03 S 1603'00" E32 6+23 318,782.31 2,743,449.47 S 16023'00" E33 8+30 318,779.20 2,743,241.92 S 16023'00" E
34 10+37 318,776.10 2,743,034.37 S 16023'00" E35* 12+97 318,772.27 2,742,774.93 S 16023'00" E
36 15+56 318,768.33 2,742,515.48 S 16023'00" E37* 18+16 318,764.46 2,742,256.04 S 16023'00K E
38 20+75 318,760.57 2,741,996.60 S 1603'00" E39* 23+35 318,756.69 2,741,737.16 S 16023'00" E
40 25+94 318,752.81 2,741,477.72 S 16023'00" E41* 28+54 318,748.93 2,741,218.27 S 16023'00" E42 31+13 318,745.05 2,740,958.84 S 16023'00" E43* 33+73 318,741.17 2,740,699.39 S 16023'00K E
44 36+33 318,737.29 2,740,439.96 S 16023'00" E45 41+51 318,729.53 2,739,921.07 S 16023'00" E
46 51+00 318,047.58 2,739,124.68 S 15002'25" E47 61+00 317,788.08 2,738,158.94 S 15002'25" E
48 71+00 317,528.58 2,737,193.19 S 15002'25" E49 81+00 317,269.08 2,736,227.45 S 15002'25" E
50 91+00 316,959.73 2,735,277.09 S 19015'08" E51 101+00 316,629.99 2,734,338.01 S 19015'08K E52 111+00 316,300.29 2,733,383.94 S 19015'080 E53 121+00 316,041.41 2,732,412.13 S 23057'46" E54 131+00 315,543.89 2,731,538.93 S 23057'46" E55 141+00 315,137.7 2,730,625.12 S 23057'46" E
56 191+00 313,665.14 2,725,869.06 S 21000'09N E57 241+00 311,837.27 2,721,215.36 S 22002'15" E
58 291+00 309,829.26 2,716,645.43 S 18013'27" E
* Profile line deleted after October 1983.
AS
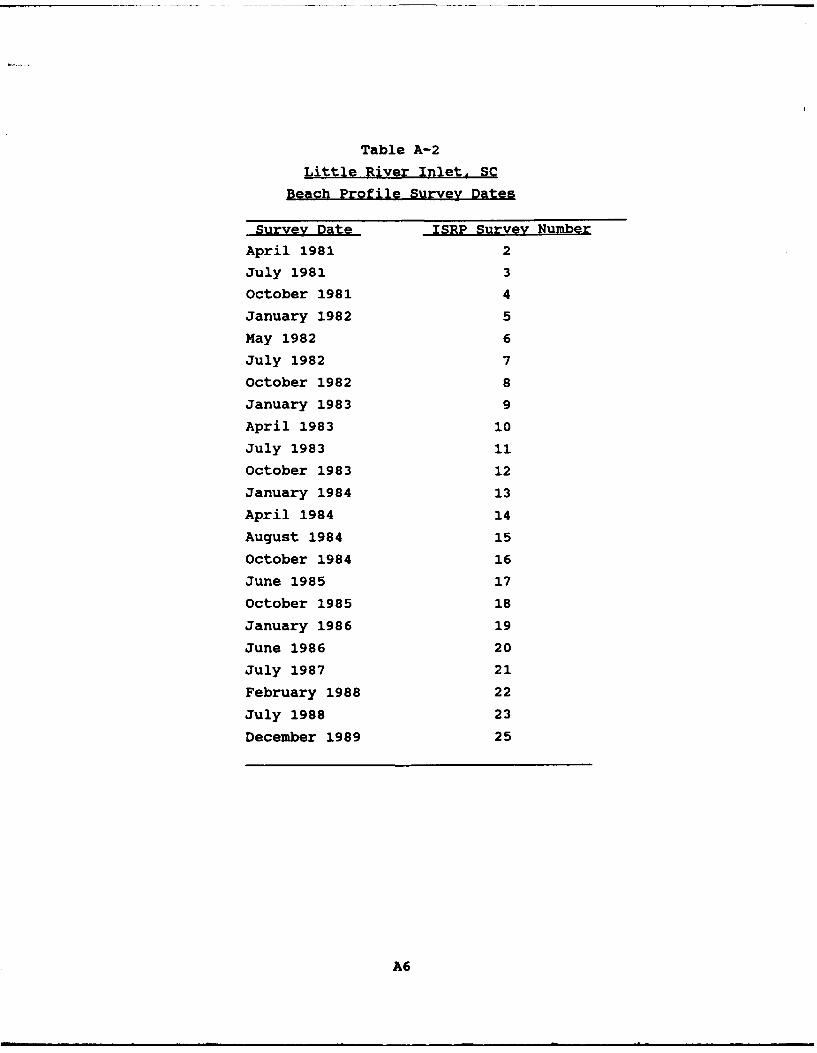
Table A-2
Little River Inlet. SC
Beach Profile Survey Dates
Survey Date ISRP Survey Number
April 1981 2
July 1981 3
October 1981 4
January 1982 5
May 1982 6
July 1982 7
October 1982 8
January 1983 9
April 1983 10
July 1983 11
October 1983 12
January 1984 13
April 1984 14
August 1984 15
October 1984 16
June 1985 17
October 1985 18
January 1986 19
June 1986 20
July 1987 21
February 1988 22
July 1988 23
December 1989 25
A6
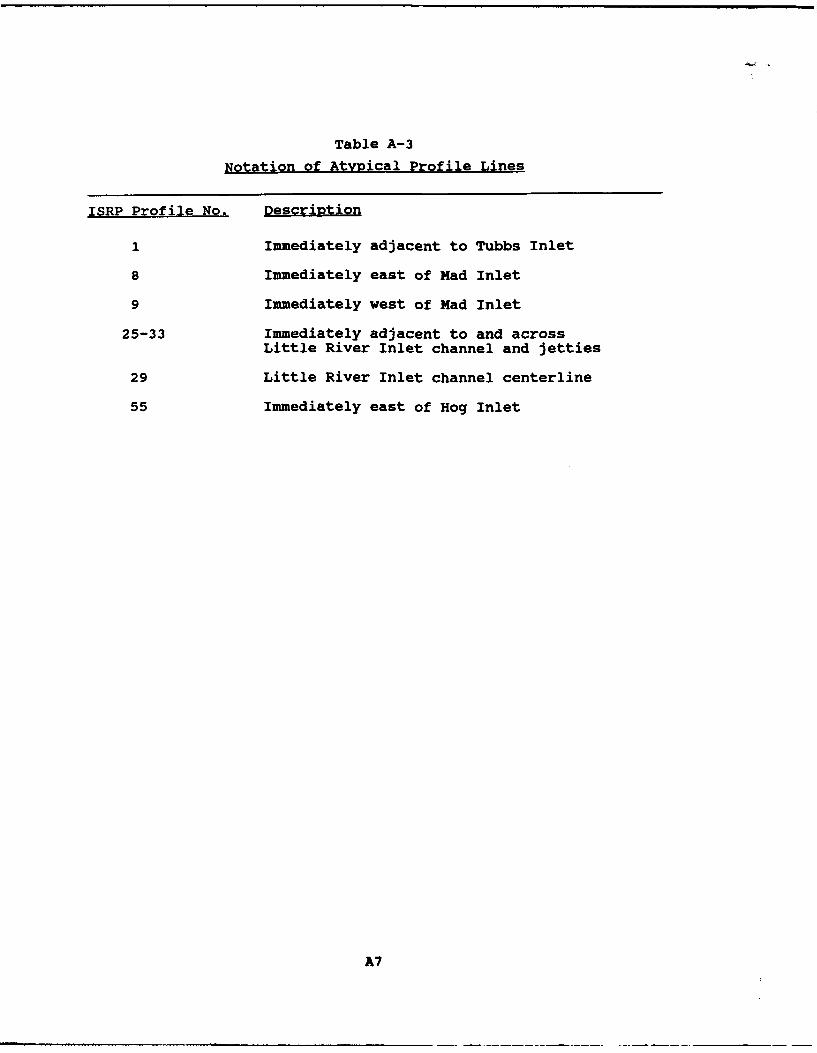
Table A-3
Notation of Atypical Profile Lines
ISRP Profile No. Descrition
1 Immediately adjacent to Tubbs Inlet
8 Immediately east of Mad Inlet
9 Immediately west of Mad Inlet
25-33 Immediately adjacent to and acrossLittle River Inlet channel and jetties
29 Little River Inlet channel centerline
55 Immediately east of Hog Inlet
A7
PROFILE LINE 1FIRST SURVEYSECOND SURVEY
30 APR 8115 JAN 84
15 JUL 81 . -
.. ..... 15 APR 84
.... . ...... IS AUG 84.......... 15 OCT 81
.... .......... 15 OCT 81
Q) 15JAN 82
> -- *15 MAY 82 ... 5JN8
.0 15 JUL 82 .. 15 OCT8B5
15 OCT 8215JN8
*15 JAN 83 15 JUN 86
20-
1015JL8
0 15~ I JUL 83
-E15 OCT 83 15 JUL 88
-20
-31........15 JAN 84 *Insufficient data
0 100 2000 3000 4000 5000 6000 0 1000 2000 3000 4000 5000 6000
Distance, ft
PROFILE LINE 2.............................. FIRST SURVEY
-SECOND SURVEY
-~3 .. APR 8. ~ 15 JAN 84
15 JUL801 .. 15 APR 84
---- *15 AUG 84
3i 15 CT 61*15 OCT 84
*15 JAN 82
15 MAT 82 \. *15 JUN 85
.*15 JUL 82 --- *15 OCT 85
- ... 15 OCT 82 .... 15 JAN 86
2 15 JAN 83 ... 15 JUN 86
0,*15 APR 83 --- 15 JUL 87
015 JUL 83 1s FEB 88
1 15 OCT 83 15 JUL 88
2015 JAN 84 *Insufficient data
0A W 20 0) 46 0O 6 1000 2000 3600 40100 50MZ 6000c. t1zz
A8
PROF1LE U?'E 3---FRST SUR~VEY-SECOND3 SURVEY
30 APR681 i5 JAN 841
15 JUL 8115 APR 84K15 OCT 81 15 AUG 84
*15 JAN862 .. 15 OCT 84
0 15 MAY 82 ... 1 JUN 85.0
C *15 JUL 82 ---- 15 OCT 85
> 15 OCT862 ~.... 15 JAN 86
u- 1JA8315 JUN 86
20.. *15 JUL 87'iS APR 63
15I JUL 63 15 FEB 88
-15 I OCT 83 15 JUL 88
-2 15 JAN 84 *Ins~ufficient data-30-1.
0 1000 2000 30400 5006 600 ;0 0 1000 2000 3000 4000 5000 6000
Distance. ft
PROFILE LINE 4
A FRST SU.RVEY-SECONDI SURVEY
30RPR 81 15 JA 84
415 JUL 81 ---- ~15 APR804
*15 AUG 84
15 OCT 81..
.. 5JN8 .... 15 OCT 84
>..15 MAY 82 . .. 15 JUN 85
15 JUL 82 ....A. .. 15SOCT 8S
- k . iS OT82 15 JAN 8615SJAN 83 -- 15 .JUN 86
'15 APR 83 --- *15 J 87
15 JUL 83 ~SFE8-o1
*15 OCT 83 is JUL 88-20
3015I JAN 84 *Insufficient data
0 2000= 3000 4000 5000 6000 0 1000 200 W00 4000 5000 6000
Distance, ft
A9
ROfILE LiNE 5---FIRST SURVEY
S ECOND SURVEY
*30 APR 81 .. 15 JAN 84
15~~*1 OCT8 s U 8415 \Ni 8215 APR 8W- .... 15 MAY 82 1sJUN 85
15 JUL 82 15 OCT865
15>8 15 JAN 86
..... 15 JAN 83 15 JUN 85
2015 APR 83 *5JL8
0 - 15 JUL 83 1S FEB 88 ,
210 15 OCT 83 *15 JUL 88-2 0J A 4 * I n u f f c i e n t d a t a
-30 iI A 4
0 1000 2000 3000 4000 5000 6000 0 100 2000 3000 4000 50 00 6000
PRORiLE LiNE 6............. FIRST SRVEY
* 30 APR 81K--S0 SVE
15 ANR 84
7.15 JUL 81 ... 15 APR 84
7: ~~~15 OCT 81 ... 1 m 8
15 JAN 8215 OCT 84
>15 MA Y 8 2 .. .1 5 J UN85
415 JUL 82 15S OCT85
i .. . 15OCTN82 15 i N . 86
.... ~1 5 86 810- 15P8 15 JUL 87
0 .... 15 JU L 83 15 FEB 88
15 OCT 83 1 UL8
-20-
-30 15 JAN 8,*Insufficien~t date
0 000 2000 3000 40 00 0 O 0 IO 0 4 0 5 00 6000
A10
PROFLE NE 7..... FIRST SURVEY
SEOND SURVEY
30 APR 81 15 JfN 84
15 JUL 81 15 APR 84
15 OCT 81 ... 15AUG04
*15 JAN 82 _'15OCT84
15 JUN 8
SR 15 MAY 82
. -. 15 JUL 82 ... 15 OCT 85
... 15 OCT 82 15 .JAN 86
15 JAN 83 15 JUN 86
201 15 APR 83 ---- *15 JUL 87
10-
0- 15 JUL 83 15 FES 8
-1015 OCT 83 15 JUL 88
15 JAN 84 *Inufficient data
0 1000 2000 3000 4000 5000 6000 0 1000 200 3000 4000 500o 6o
Distonce. ft
PROFL.E UNE 8FIRT..... ST SURVEYSECOND SURVEY
30 APR 81 15 JAN 84
15 JUL 81 ..... 15 APR 84
15 OCT 81 *15. ' AUG 84
-: '15 OCT 8415 JAN 82
15 JUN 85
15 MAY 8215JUL82 '15 OCT 85
15oct82 1 5T 86-W ... . _ 1s JAN 86i .
15 JAN 83 .. 15.JUN8620
-.... . 15 APR 83 --- " 15 JUL 87
0- 15 JUL 83 '15 FE8 88
-10.-20- 15 OCT 83 IS JUL 88
-30 'IS [AN R4 , ns. , , enN d40 1000 2000 40 W 00X 20 300 4 ,000 WW OO
D)Istonce, ft
All
I
PROFILE LINE 9. FRST SURVEY
-SECONDg SURVEY
30PR81
5 J..8. . .15 J N 81515 R 8415 OCT 81 11 AP5R 84
15 JAN 82 *15 OCT 84
15 MAY82 15 IJUN 85
--- 15 JUL 82 -15-- sOCT 85
15 OCT 82 15 JAN 86
15 JAN 83 15 JUN 86
20-
10 . .... 15 APR 83 15 JUL 87
o 15 JUL 83 15 FEB 88
~2j15 OCT 83 15 JUL 88_-
301 8 I*Insufficieft dgt6
0 1o= 200) 3000 4000 500 6000 0 1000 20o 3000 4000 5OO 6000
Distance, ft
PROFIL LIN 10---- FRT SURVEY
- SECON SURVEY
30 APR 81..... 15 ,JAN 84
15JU-815 JUL 81
15 APR 84
.-- ~i---", 1OCT 81 --- 15 AUG84
.. * 15 OCT 84
15 JAN82
is MAY e2 15 JUN~ 85- 15 OCT 85
15 JUL 82
15 OT 82 15 JN 86
15 JAN 83 15 JN 86
20
10 15 APR 83 15 JUL 87
0 15 JUL 83 15 rEB 88
-10 ' 15 OCT 83 15 JUL 88
-2030 Jist 84 *lwmPAfftciait data
0 1000 2000 3000 4000 WO0 6000 6 000 2 000 4000 O OO
Distance, ft
A12
tI
PROFRL LK( 11... FIRST SURVEY
-SECOND SURVEY
~30 APR 81 15 JAN 84
15 JUL 8 1 ... 15 APR 84
15 OCT 81 --- 15 AUG 84
... 15 JAN 82 -*---15 OCT 84
> ... 15 MAY 82 ... 5JUJN 05
<15 JUL 82 *15OCT 85
> ~15 JAN86A? 15 OCT 82 ..
15 JAN 83 ..*.... 15 JUN 86
201 15 APR 83
10,1 15 JUL 87
0 15 JUL 8315 FEB 88~A1 15 OCT 8315JL0
-20 0 15 JAN 84 *insufficent data
0 100 2000 3000 4000 50 600 0 W00 2000 31000 400 50 00 6000
Distance, f t
PROFRL UNE12..................... ...FIRST SURVEY
-SECOND SRVEY
30 APR 81 15 -Mt 84
15 JUL 81.......................15 APR 84
:5 OCT 8 5.W8
15JFAN82 t' a15 OCT 84
15 MAY 82 ---. 15 JUN 85
15 JUL 82....................*15OCT 85
15OCT 82 .... . 15 JAN86
15 JAN 83 ---- i48
20 ..........
10- 15 APR 83 15JU 8
0 15 . I JUL 83 15 FEB 88
-20
IS JN 84*Insufficilent date
0 1100 2000 35000 4000 W000 W000 0 000 2000 X 10 4000 5000 &i000
Distance, ft
A13
PROFLE LINE 13FIRST SURVEY
15JU81 .... .~ - SECOW. SRVEY
30 APR 81 .S 1JAN 84!
15 OCT 81 15I AUG 841
15 JAN 82 *15 OCT 84
>15 MAY 82 5-- JUN*85
15 JUL 82 15 OCT 85
15 OCT 82 15 JAN 86
20 1 5JAN 83 ~ 15 JUN 06
10 -15 APR 83 .-- .. 15 JUL 87
0 \15 JUL 83 1......8
-201 -. 15 OCT 83 15 JUL 88
-30 1 84, *Insufficient data
0 1000 2000 3000 4000 5000 6000 0 1000 2000 3000 4000 5000 6000
Distance. ft
4 PROFiLE UNE 14...FRST SURVEY- SECOND* SURVEY
30 APR8 B..... 15 JAN 84
15 JUL 8 . .. 15 R8
15JA 8 *15 OT8
>15 MAY 82 1.. .. IJUN8515 jUf\ 5 CT8LA 15 OCT 82 15 JAN 86
20~.1JAN8 15 JUN 86
15AR8 1IS JUL 87
15 JUL 8315E8
-2-15 OCT 83 1S JUL 88
115 84, *1.nsufficient data
PROLE UNE 15--- FIRST SURVEY
- SECOND SURVEY
30 APR 81
15 JUL 81
'-.. ' 15 OCT 81
*15 JAN802
15 MAY 82
•- .. 15 JUL 82
15 OCT 82
15 JAN 83
20 ..
10 1 5 APR 83
0 15 JUL 83
SIrsufficient data
O 1000 2000 300 400 50 z:00Distance, ft
PROFLE UNE 16... FIST SURVEY
*1*- ~... - SECOND SURVEY
30 APR 81 15 84
15 JUL 81 15 APR864
15 OCT 81 .15 AUG 84
1 .JAN82 .... 15OCT4
...... 15 MAY 82 .15 JN85
IS JUL 82 15OCT85
.W 15 OCT 82
15JO8 15 JAN86
... " ..., 15 JAN 83 ... 15 JUN 8620
10 15 APR 83
0 15 JUL 83 88
15 OCT 83 15 JUL. 88
-3 lq IA R4 I 1 1
1060 2000 36oo 4o00 5o o0 0 o= 2000 3000 4000 WOO OODistorce, ft
A15
PROF1LE LNE T7
FRST SURVEY- SECOND SURVEY
30 APR 81
15 JUL 81
..... 15 OCT 81
----........ 15 JANl 82
-S 15 MIAY 82
15 JUL 82
" 15.. i OCT 82
.15 JAN 83
20.
10 15A PR 83
0- 15 JUL 83
-10
-20-
-30 -1000 2000 3000 4000 5000 6000
Distance. ft
PROFE UNE 18
SECOND SURVEY
.0P8 ...... 15 JAN~ 84
15 JUL 81 - --- 15 APR804
15 OCT 81 .15 AUG 84
. . . JAN 82 15 OCTB4
.-....... 15.MAY"82 ---. ,,, . 15 AT 85
15 JUL 82 15 OCT 85
15 OCT 82 ..... . ......... 15 JON 86
15 AN 86
20- .15 JAN 8315 JlL 87
10 .. 15 APR 83
07 15 JUL 83 15 FEB 88
-10- S15 OCT 83 15 JUL 88
-208
-30 .... 15 JAN 84. *Insufficient data
0 000 2000 3000 4000 5o00 6000 0 looo 300 400 0Distance, ft
A16 j
PROFLE UNE 19..... FIRST SRVEY
- SECOND SURVEY
... 30 APR 81
*15 JAN 62
15 MAY 82
15 JUL 82
15 OCT82
15 JAN 8320
10 .15 APR 83
0 15 JUL 83
-10 15 OCT 83
-20-
*Insufficient data
1000 2000 3000 4000 5000 6000
Distonce, ft
PROFILE UNE 20..... FRST SURVEY
-SECOND SURVEY
15 JAN 84\.... 30 APR 81 ..
':- ... As PR 04
15 JUL 81
"15 OCT 81 .... 15AUG84
15 JAN 82 --- 15 OCT 84.15 JUN 85
. ~15 MAY 8215Or8
.15 O1T U5
•"15 JUL 82
15 OCT 82
15 JUN1 8615 JAN 83
20- -....
10, 15 APR 83 -.
0 15 JUL 83 15 FES 88
-10 *15 OCT 83 *15 JUL 88
-20 15 JAN 84 *Insufficient doat
-30 II0 1000 2000 3000 4000 W00 W000 0 100 2000 3=0 4000 5000 600
Distonce, ft
A17
PROF1E LINE 21.*. FRST SURVEY
SECOND SURVEY
...... 30 APR 81
15 JUL 81
.... 15 OCT 81
---- 15 JAN 82
.3 .... *15 MAY 82
15 JUL 82
U .... 15 OCT 82
15 JAN 83
20-
10 15 APR803
01 .. 15 JUL863
-20 15 OCT 83
300 1000 2000 3000 4000 5000 600
Distance, ft
PROFiLE UWN 22......................... FST SURVEY
-SECONDI SURVEY
... 30 APR 81 ... 15-4N 84
~15 JUL 81 15- PPR 84
15 OCT 81 is AG 8
15 JAN 82 ... 15 OCT 84
15 JUN8515 MAY 82
15 OCT 0s
W .. 15 OCT 82 ... ....... 15 JAN 86
. ~ ~ 1 2JAN e3 .*- 18
20- ..
0 .. 15UL8 JU 1F878
-10. 83 11 8
..-.. 15OCTL83isrBe
-20-
30- '6 ow 84,*Insgufficienlt dat a
0 OW0 2000 3000 4000 W00 6000 0 EICO 200 3000 400 W00 6000Distance, ft
A18
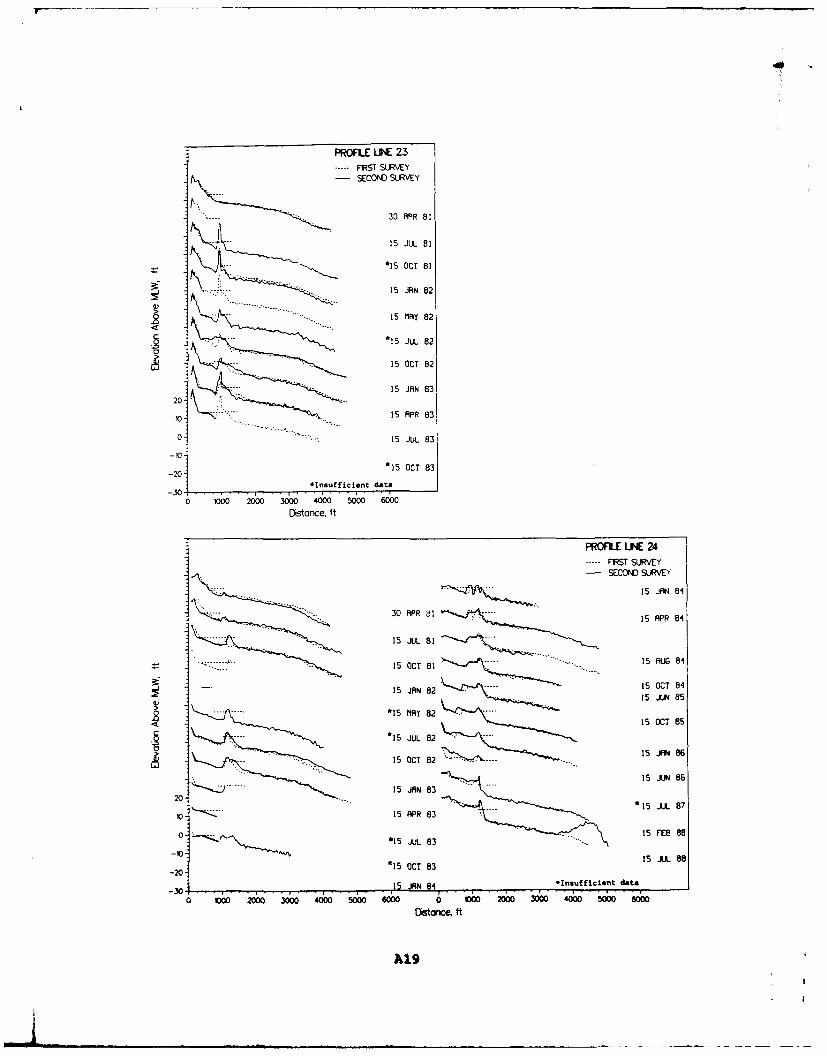
PROFILE UNE 23
---FIRST SURVEY-SECOND SURVEY
p..30RPR 81
15 JUL 81
*15 OCT 81
15 JAN 82
.2 **.15 MAY 82
0 *15 JUL 82
u-i .. 15 OCT 82
15 JAN86320.
10 . 15 APR 83
0 .. 15 JUL 83
-20- *15 OC0 8
-30 *Inlsufficient data0 000 2000 3000 4000 500 6000
Distanice. ft
PROFLE LWN 24...FIRST SURVEY
-SECOD SURVEY
30 AR BI15 JAN 84
..... 15 JUL 81
... .- 15 OCT 81 15 AUG 84
15 JAN 82 15 OCT 84
is itwl 85
...2. *15 MAY 8215 OCT 85
15SJUL 82
1S OCT 82' - 15 .. V 86.....
... .15 JUN 86
-- ------ 15 JAN 8320-
10. ... 15 APR 83 *15 JUL 87
0 15 JUL 83 15 JUI 88
-20 *15 OCT 83 1 L8
.3015 JAN 84 *Insufficienlt data
0 OW0 2000 3000 4000 5000 6000 0 %00 2000 3000 4000 500 600
Distance, ft
A1.9
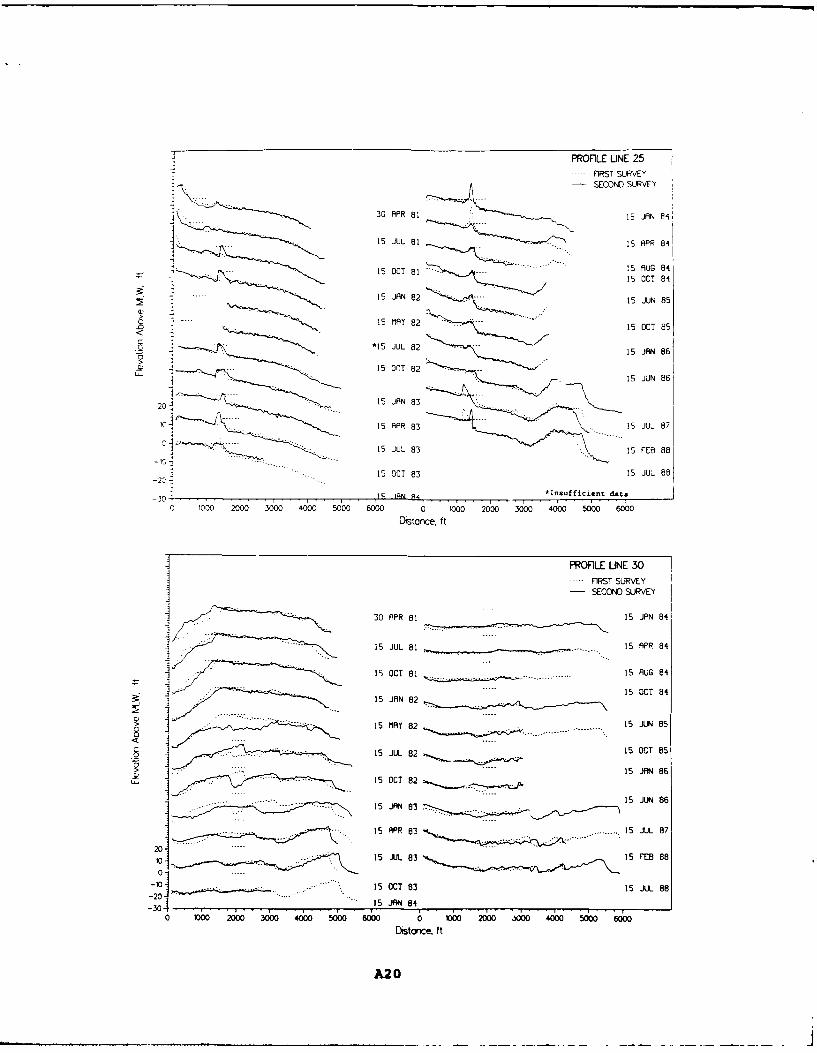
{ PROFILE LINE 25-] --- FIRST SURVEy
-SECOND SURVEY
30 APR 81 15 JAN 84:
4j.1 JL8 15 APR 841
--- S1 OCT 8 1 ....... 5..I AUG 84'15 OCT 84
15 I JAN 82 ... 15JUN 85
--- 15 MAy82 -- 15OCT85
<1 U8 15 OCT 85~
~ 315 OrT 8215 JUN 86
20 15 JAN 83
10~''- <-15 APR 83 K 15 JUL 87
15 JUL 83 .. 15 FEB 88
-2 15 OCT 83 15 JUL 88
30 1 S IFIN R4 *Insufficient data
0 00 00 00 00 00 00 0 1000 2000 3000 4000 5000 8000astonce, ft
PROFILE UNE 30
----------------------------FIRST SURVEY
I .30 APR 81 15 JAN 84
- 15 JUL 81 5. I APR 81
I - - 15 OCT81i 15 AUG 84
15 OCT 8415 JAN 82
8 .-- 15 MAY 82 15 JUN -5
.3 ............1..JUL82
..... is. JULOC 8215OT 5
JP15 JAN83I JI 86
1l JUL 83 .15 JUL 86
.5.A.. . . .15.C.83.15 JUL 88
Dito-ce ft
A20
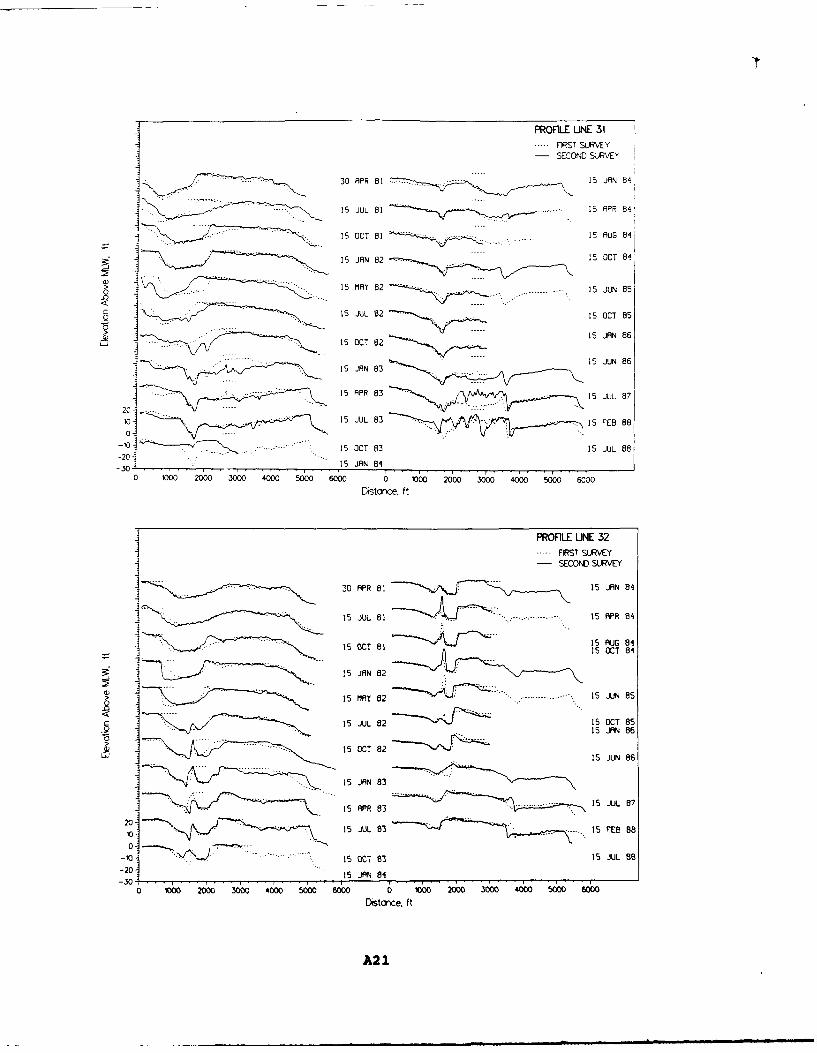
PROFILE LINE 31..... FRST SURVEY
-SECOND SURVEY~
130 APR 81 15 JAN 8i
15I JUL 81 15 APR 64'
I. 15 OCT 81 15 AUG 84
15 JAN82- 15lOCT 84'
.015 M Y82 ............ 15OCTN85
15OCTL82 5OT8
15 OC 825 JN 86
15 JAN863
---- 15 APR 83 15 JUL 87
115 JUL 83*...*- 15E8
-10 ........ 15 OCT 83 15 JUL 8-20. .... 15 JN 8-30I 150 JAN0 840 ft.1 1. 1000 2000 3000 4000 jfl EI3 88
I3D APR 81 15I JAN 84
15 JUL 81 15 APR 84
15 AUG 8415 OC 811I OCT 64
7 L, 15 JAN 82
15 MAY 82 .. 15 JUN 85
< .....-- --.15 JUL 82 15OCT 85
15 JAN 86
........ 1 OCT 82LU 15 JUN 86
15 JAN 83
15 APR 83- . . . 1JU8
20-10..., .. ... 15 FEB 88
-10-' 15 OCT 83 Is JUL88e
-20- 15 JAN 84-3 0 1060 2000 3000 4000 5000 600& 0 00 3000 4000 5000 0
Distarxe, ft
A21
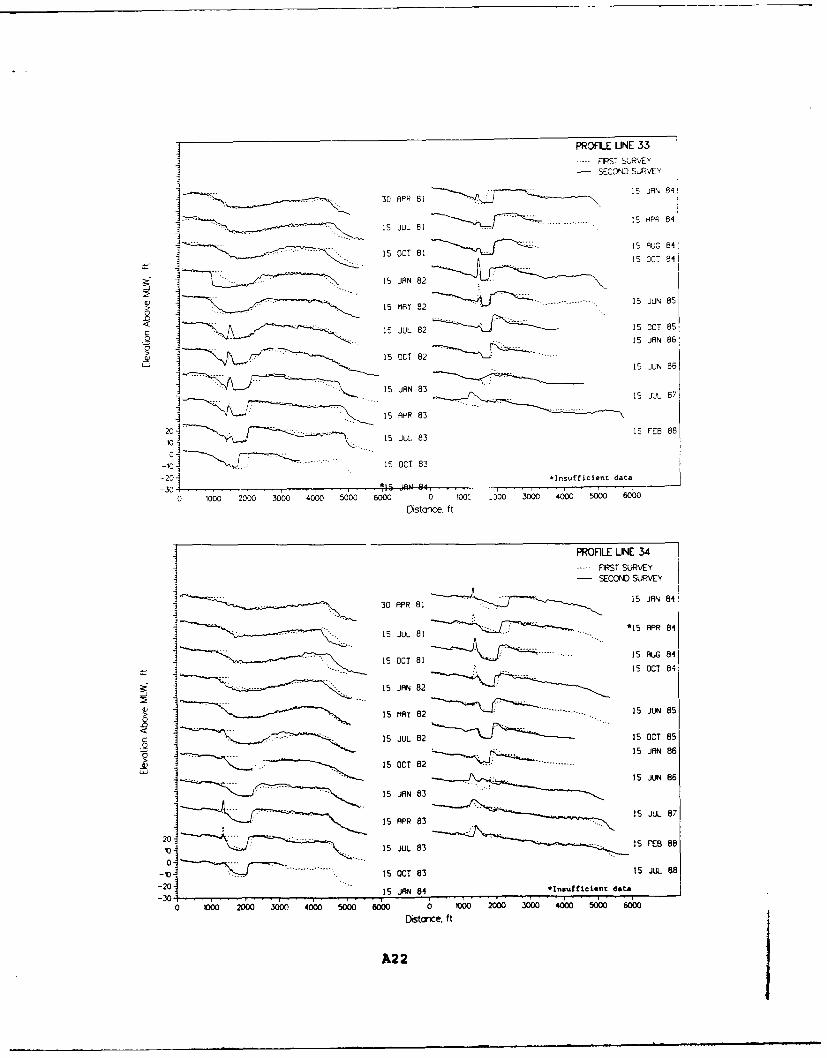
PROFILE LINE 33---- RST SURVEYI - SECOND SURVEY
30 APR 81 15 JA' 84!
15 JU 81 ..-. I1 APR 811
.... 15 OCT 81 1 u 4
--- ..... ........ ...... 15 OCT 61...i U841
15 JAN 82 1 C
IV15 MAY 82 15 JUN85
C: 15 JUL 82 15 OCT 85
1 15 JUN 86
15 JAN 83-~ . .15 JUL 87
20 -iI ~15 APR 83
20i 15 JUL83 15 FEB 8
-jr 15 OCT 83
-20JS 1 *Insufficient data
0 1000 200 04000 5000 6000 0 l00( -000 3000 4000 5000 600
Distance. ft
I ~PROFILE LINE 34
FiRST SURVEYI - SECOND SURVEY
30 APR 81 .15JN8
~ . ... *15 APR 84IS JUL 81
15 OCT 81 . 5U815 OCT 84
i3-I.. ~15JAN ~ 15J28
15 MA 82 .1....JUL82. 5 N8
15 OCT 82 1
~ 1.. -. .. 15 JUN 86
I ... 15 JAN 8315 JUL 87
20 ~ 15 APR 83
101 15 JUL 83 - .. 5E8
-10 ....... 15 OCT 83 1s JUL. 882015 JAN 84 *Insufficienit d&t&
0 1000 2000 3000 406 5f0 60 0 1000 2000 3000 4000 5000 6000Distance. ft
A22
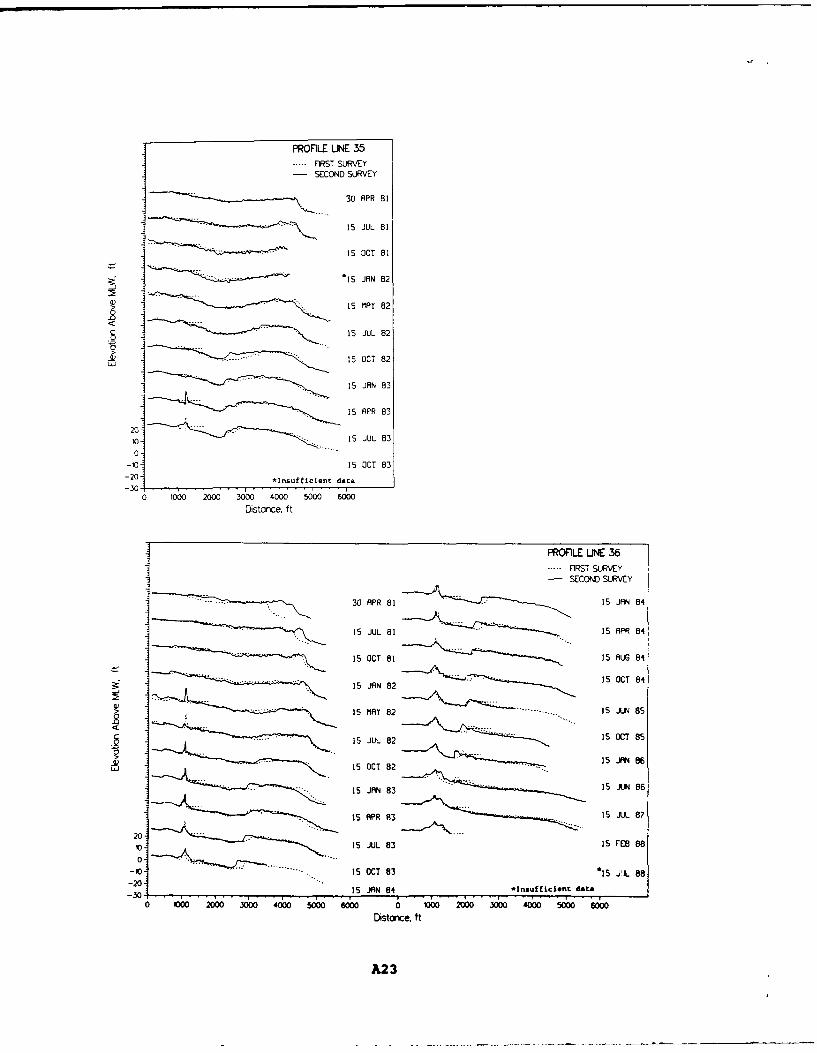
PROFILE UINE 35... FIRST SURVEY
-SECOND SURVEY
30 APR 81
15 JUL 81
15 OCT 81
-15 JAN 82
> 15MAY 82
- 15 JUL 82
-V.. ...... 15 OCT 82
- 15 JAN 83
-15 APR 83
20 - - 15 JUL 83
-10- 15 OCT 83-20- *Insu~fficient data-30. II
0 1000 2000 3000 4000 5000 6000
Distonc-e, ft
PROFILE LINE 36j.. FIRST SURVEY-SECOND SURVEY
*,30 APR 81 .. 15 JAN 84
-15 JL81 15. SAPR 84
*. 15 OCT 81 15 AUG 84
..... 15 OCT 84
............. . 15 JAN 82
.. .. . ..... 5 AY 82 ----- N ---...... 5 JN 85
15 JUL 82 15 OT 85
...... 15 OCT 82 15 JAN 86
15 JAN 83 15 JUN86
15 APR893 15 lJUL87
20 .......
1015 JUL8:3 15 FEB 88
0.
-0.....15 OCT83 "1 5 jL 88
-20- 15 JAN 84 *Insufficienit data
0 1000 2000 300 4000 5000 6000 0WO 30 4000D 00 600
Distom,e ft
A23
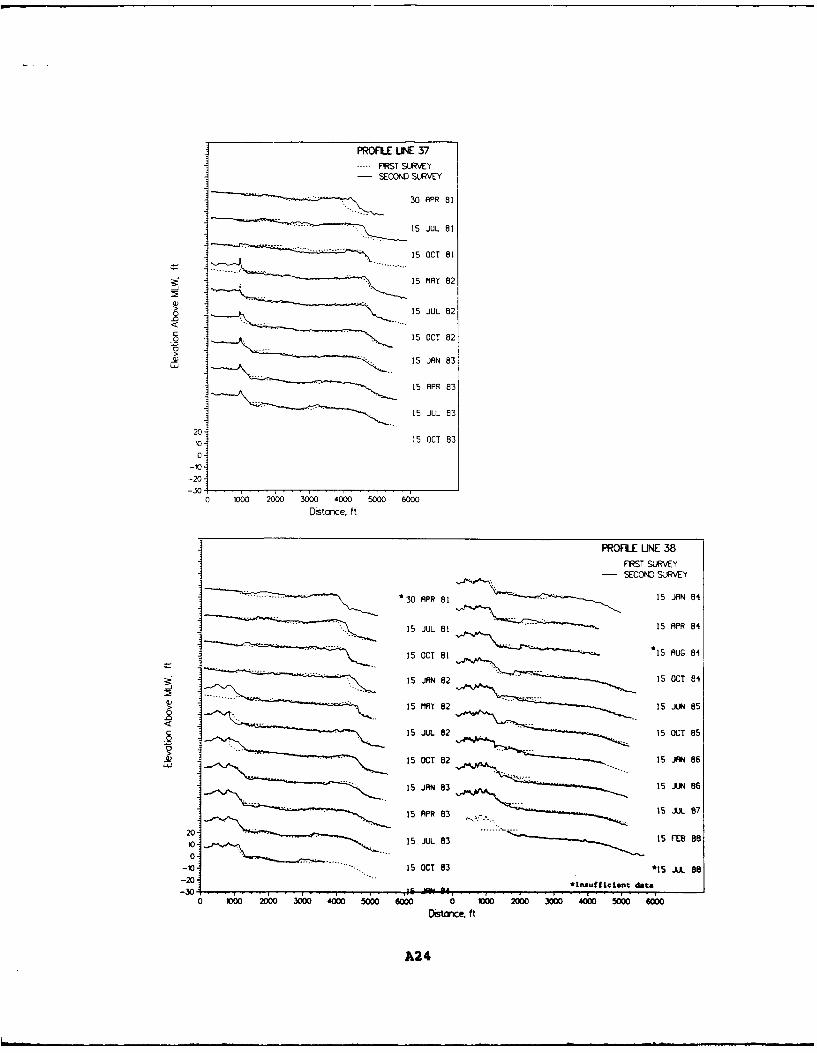
PROFILE LINE 37... FRST SURVEY
-SECOND SURVEY
30 APR 81
* 15 JUL 81
15 OCT 81
15 MAY 82
>8.. 15 JUL862
Q 15 OCT 82
.6)15 JAN 83
15 APR 83
15 JUL 83
20-10- 15 OCT 83
-0-
-20--30
0 1000 2000 3000 4000 5000 6000EDstonce, f t
PROFILE LIN 38.......FRST SURVEYSECOND SURVEY
'30 APR 81 .....- 1S JAN 84
- 15I JUL 81 .15 APR 84
15 OCT 81 * 15UG 84
3.15 JAN 82 15 OCT 84
>15 MAY 82 15 JJ'N 85
15 JUL 82 15 OCT 85
-- 15 OCT 82 15 .ftN 86
- 15 JAN 83 15 JUN 86
15 APR83 15 .JL 87
20. .5JL8 .15...0
101 U 3 5FB8
0. -
-U - 15 OCT 83 'is JUL 88
230 .' .A 4 Insufficient data
0 1000 2000 300 4000 W00 6000 0 0 2000 3000 400 5000 6000,Distance. ft
A24
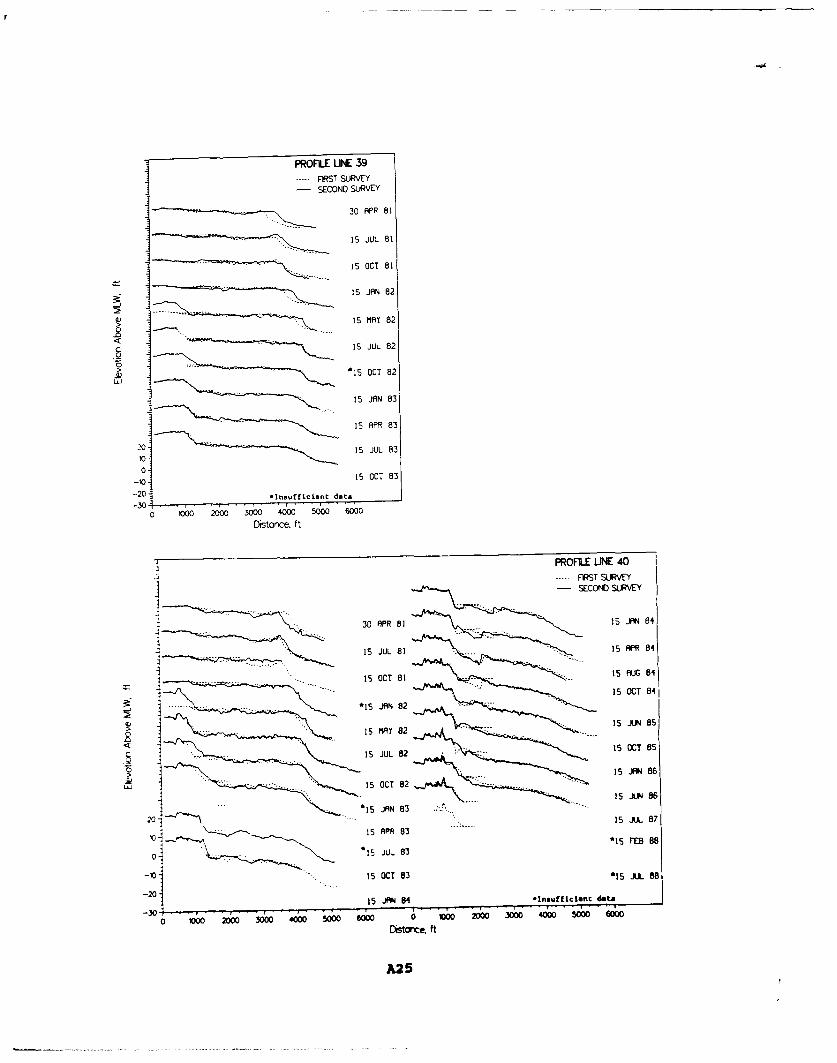
PROFiLE UNE 39--FIRST SURVEY
SECOND SURVEY
-. -30 APR 81
15 JUL 81
15 OCT681
15 JAN 82
15 MAY 82
< ~15JUL 82
> 15 OCT 82
15 JAN 83
15 APR 83
20 15 JUL 8310
-0 is OCT 83
-20 *Insufficient dt
-300 100 2000 3000 4000 5000 6000
Distance, ft
PROFLE UNE 40.......................... FRST SURVEY3 - SECONDJ. SURVEY
3APR 81 15 JAN 84
15 JUL 81 ..... 1. 5PR 84
1581*... 15 AUG 84
15 OCT 84
... ... '15 JAN 8215 JN85
15 MAY 82 ...
15 JUL682 15 OCT805
15 JWWN 86
Uj.............. . is OCT 83
*15 JAN 83 1 J.8
-20 5 JA 84 Insufficient "ato
0 1000 2000 3000 400000
Distonce ft
A2 5
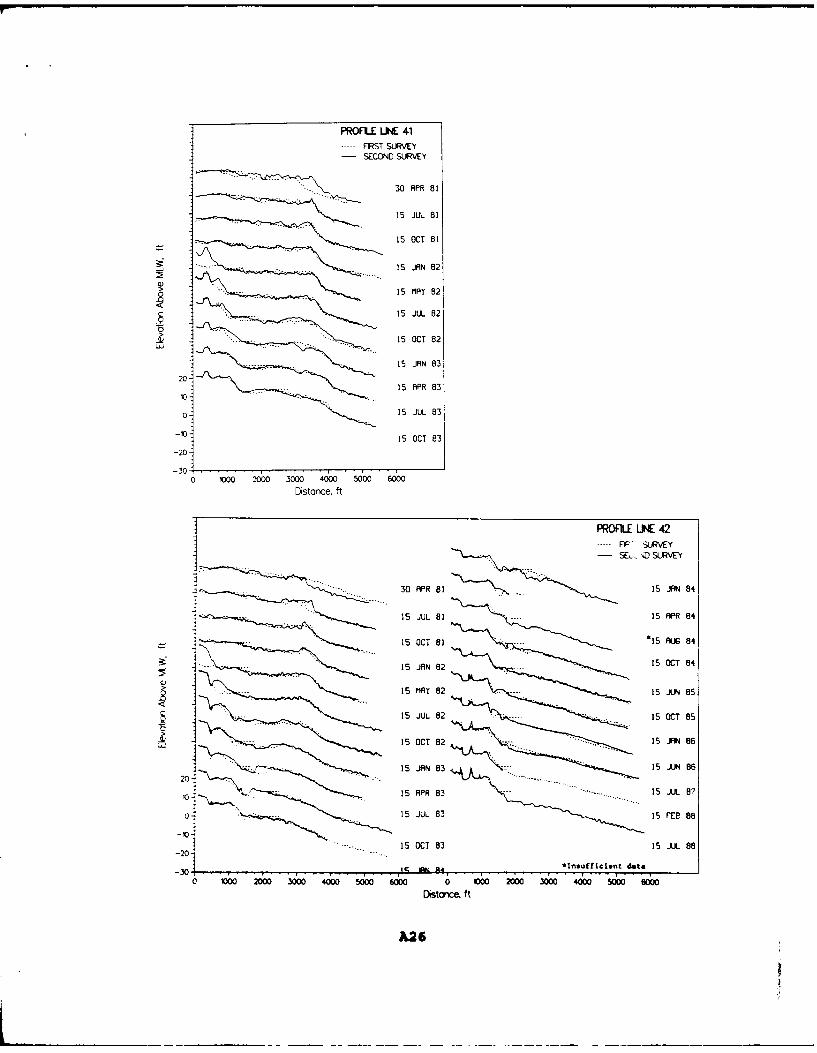
PROFiLE LiNE 41
---FIRST SURAVEY
SECOND SURVEY
-. ...- 30 APR 81
15 JUL 81
15 OCT 81
15 JAN 82
15 MAY 82
15 JUL 82
..- .*15 OCT 82
20-i ... 15 JAN 83
101 . 15 APR 83
0 15 JUL 83
-10. 15 OCT 83
-20-
-300 1000 2000
30 sto
40t 560 6000
PROFUL LK 42
---FF- SUVYi - SE-Z SULRVEY
.. 30 APR 81 15 JAN84
15 JUL 81 -.... 15 APR 84
I .15 OCT 81 15. AU~G 84
15 JAN 82 .... 5C8
15 MAY 82 .15 JUN 8S
15 JUL 82 .15 OCT 85
w -, 15 OCT802 1s JAN 06
I. .15 JAN803 15 JUN86
20 ...... .. . ...
105I APR 83 ........... 15 JUL. 87
01 . 15 JUL 8315F88
-10-15 OCT 83 15 JUL 88
-20- ....
I % A F14*Insufficient data,
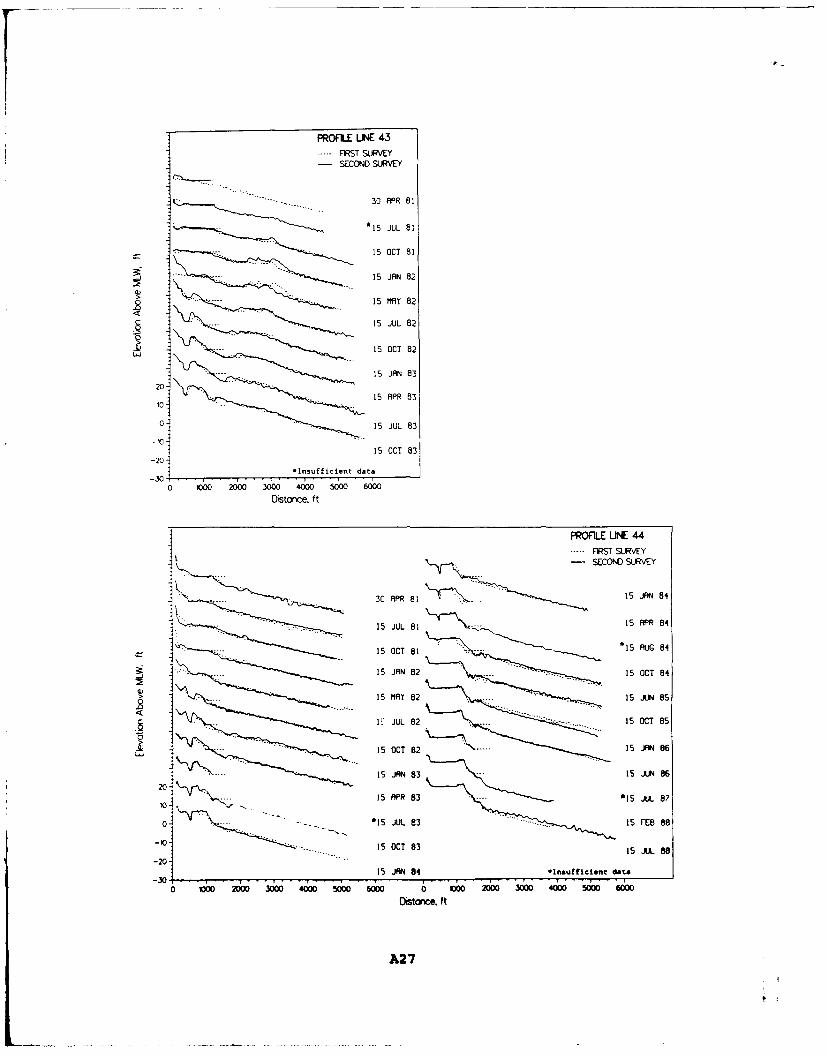
PROFLE UNE 43... FIRST SURAVEY-SECOND SURAVEY
30 APR 81
-- *15 JUL 8 1
- .. 15 OCT 81
15 JAN 82
..... .... SMAY 82
15 JUL 82
.... 15 OCT 82
15 JAN 83
20 .. ... ,15 APR 83
01 15 JUL 83
15 OCT 83
-20 1*insu~fficient data
0 000 2000 3000 4000 5000 6000
EDstonce. f t
PRORiLE LINE 44
.... FIS SURAVEY
-SECOND SURAVEY
.. .... 30 APR 81 ,.. .15 JAN 84
.... 15 JUL 81 15 APR 84
*15 AUG 84
3: ~ 15C8JAN 82 . . . ... 15 OCT 84
>15 MAY 82 15 JUN85
I JUL 82 ............. 15OCT 85
0 .... ....UL8 15 JAN8810 ~15 OCT 832 L8
20
15 JAN 84 *nufcetdata-30 I. - T
0 0 0 MO WO 4000 O WO 0 X Z00 W6000 2000 6000
A27
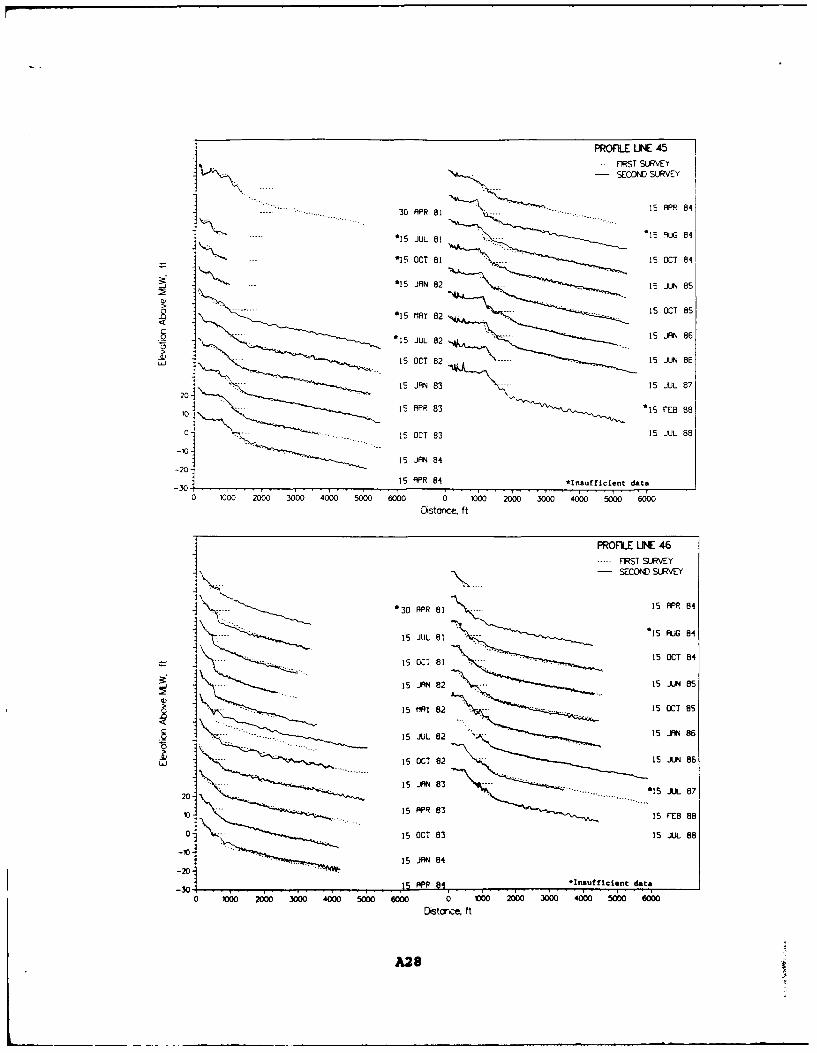
PROMlE UNEA5---FRSr SUR~VEY-SECOND SURVEYp
......... 30 APR 81 .... .. 15 APR 84
*15 JUL 81 *-..15 RUG 84
-- *150OCT 81 ... 15 OCT 84
*15 JAN 82 *..15 JUN 85
*1 MA 82-.. 15 OCT 85
I 15 JUL 82 15 JAN 86
-15 JUL82
LLJ5OT2 . 15 JUN86I
20115 JAN 83 -- 15 JUL 87
10- 15 APR 83 i1s EB 88115-OCT-8 15 JUL 88
-2 15 JAN 84
-3115 APR 84 *Insufficient data
0 1000 200 3000 4000 5000 600 0 D0 2000 3000 4000 5000 6000
EDstance, ft
PROFLE UNE 46...FRST SURVEY
-30 15ANR82 1 15 APR 85
1I 00, 821 . .~ .. * 15 OCT 84
... 1JUL 82 V~15 AM85
15OCTY82 15 OCT 85
bi15APRL83 15 JAN 88
15 OCT 83 15 JUL886
1 . 5 JAN 84 ..
-201..
31i APR 84 Insufficienit data
-0 106 26 ~ ~ -: ~ o200 300 4000 5MW 0 00m -1 000 6000
A28
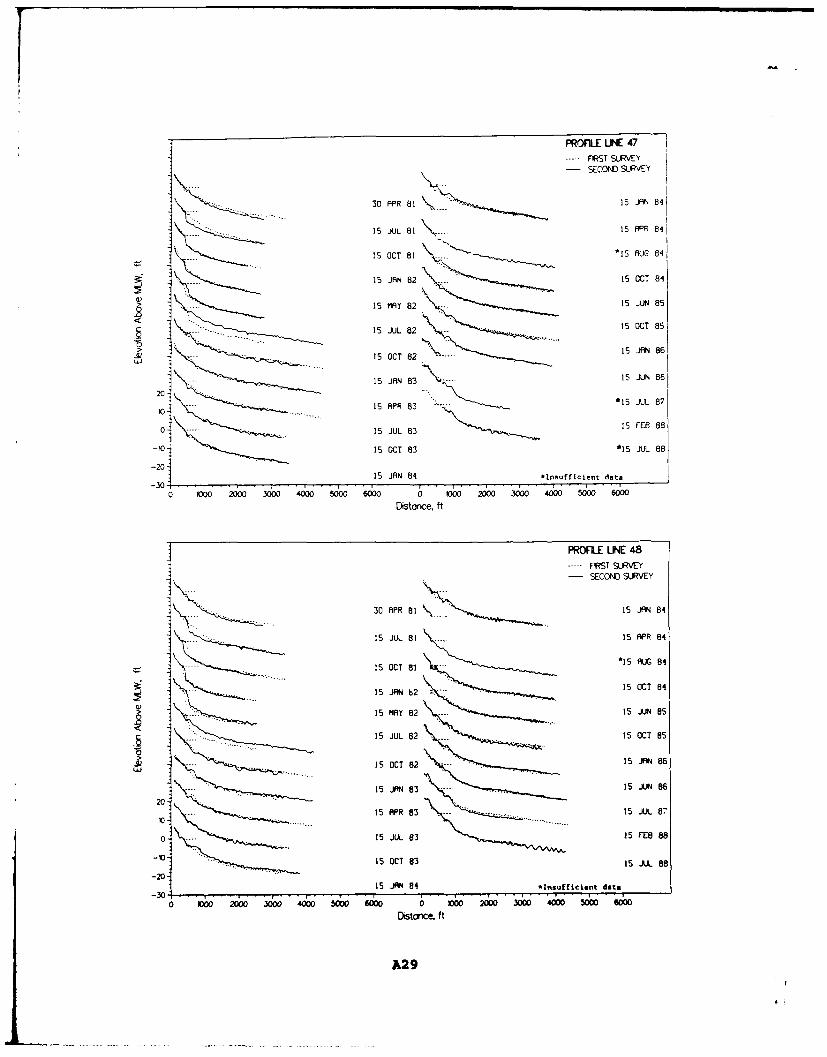
PROFILE LJNE 47----- FRST SURVEY
-SECONDE SURVEY
....... 30 APR681 - .15 JAN l. .. .15 JUL 81 \...15 APR 84 i
15 OCT 81 ... 5A08
15 JAN682 iS. 1OCT684
isAY 82 15 JUN685
.... 1........5 JUL 82 15 OCT 65
15 OCT682 "---- 15 JAN6
15 JAN 83\.- 15 JUN 86
101.... 15 APR 83 15 JUL 87
0- 15 JUL 815 FEE 66
-1-15 OCT 83 *1 5 JUL 88
30:15 JAN 84 *Insufficient data
0 200 ~:~Z3 1~ ~ 3 *C'~ Dstace, ft ~5060
-SECOND SURVEY
30 APR 81 \15 JAN 84I ...... 15 JUL 81 .. 15 APR864
*15 RUG8415 OCT 81
15 OCT 84- ..- 15 JAN b2
> 5 MAY 82 .... 15JJN805
15 JUL 82 ... .15 OCT 85
15 OCT 82 . 15 JAN 06
15 JAN 83 15 IJUN 86
20
10 15 APR 83 15.. .. IJ.L 87
0 Is 5JUL863 15 FEB 88
-20-15 OCT 84 isafic~i Jdata
-20
0 W E3 00 3000 4000 5000 6000 0 WOO 200 30 400 5000 6W00Distci'. ft
A29
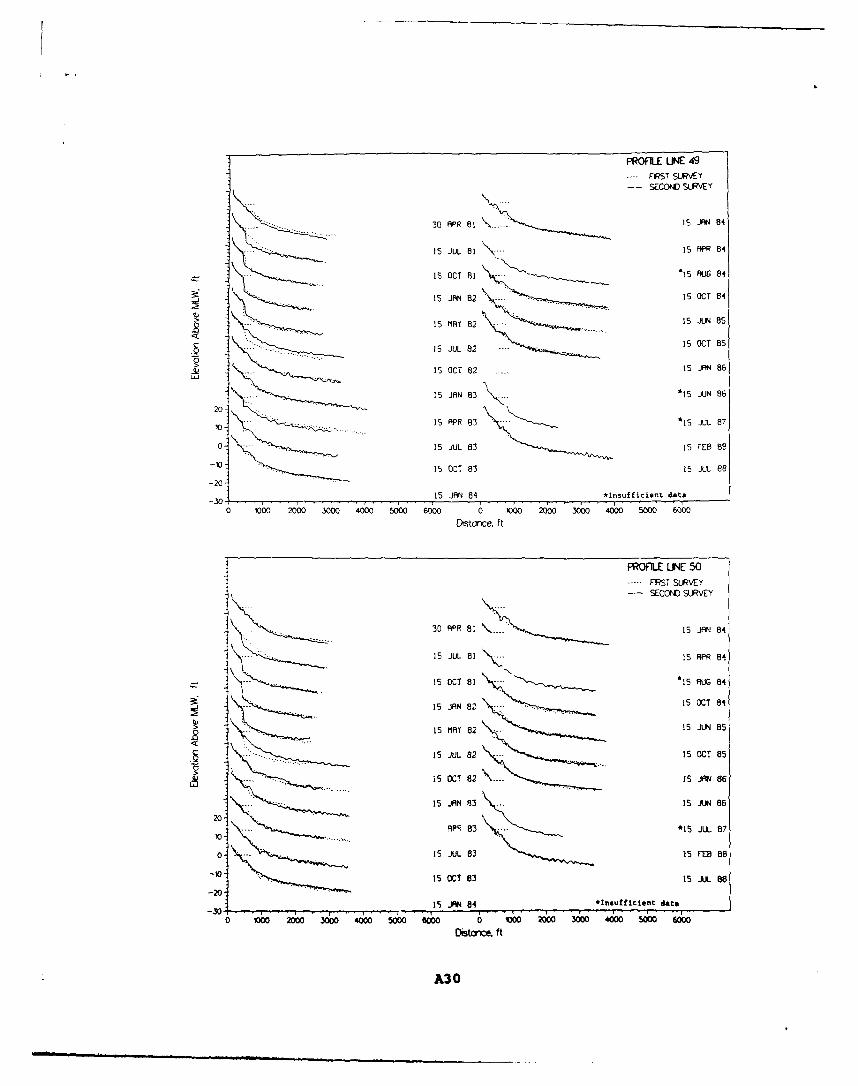
PROFILE UNE 49FIRST SURVEY
- SECOND SURVEY
30 APR al 15 JAN 84
J....U. . 3 JL . 15 APR 84
15 OCT 81 --- " 15 AUG 84
15 JAN 82~ ---- 15 OCT 84
15 MAY 82 -. JUN85
. 15 JUL 82 15OCT85
... 15 OCT 82 ... 15 JAN 86
15 JAN 83 *15 JUN 86
20-
10. 15 APR 83 *15 JUL 87
0- 15 JUL 83 15 FES 88
15 OCT 83 15JUL 68
-20:
15 JAN 84 -insufficient data
0 1000 2o0o 3o00 4000 5000 6000 0 1000 20o 3000 4000 5000 6000
Distance. ft
.1 PROFILE LINE 50. .....FRT SURVEy
- SECOND* SURVEY
30 APR 81 15JAN 84
- 15 JUL81 s- 1APR84
15 OCT 81 s R15UG 84
15 JAN 15 OCT 84
A. 15 MAY 82 --- 15 JUN 85
15 JUL 82 ---- 15 OCT 85
iSJ !5CT 82 V _ Is 1JAN866
15 JAN 83 15 J.N 86
20APR 83 .... *15 JUL 87
10-
0. -* 15 JUL803 is FES 88
-10- 15 OCT 83 15 JUL 8
-20-
-30 15 JAN 84 *Insufficient date
0 000 2000 3000 4000 50 6000 0 o O00 3000 40O 00 o0Dstoncm ft
A30

PROFILE LINE 51... FRST SURVEY
-SECOND SURVEY
30 APR 15 JAN 84
15 JUL 81 15 APR 84
15 OC 81 .-. 15 AUG 84
15 JAN82 . -15 OCT 84
>15 MAY8B2 --- 15 JLPN 85
C 15 JUL 82 ... 15 OCT 85
.... T15\OCT.82 15 JAN806
15 JAN 83 .... 15 JUN 86
20- 15 APR 83 .-. *15 JUL 87lo-.
015 JUL 83 15 FEB 88510 *15 OCT 83 15 JUL 8815 JAN 84 *Insufficient data
0 1000 2000 3000 4000 5000 6000 0 1000 200 3000 4000 5000 6000
Distance. f t
PROFILE UNE 52.........................FRST SU.RVEY
-SECOND SURVEY
30 APR 81 15 JAN 84
15 --- i JUL 81 .. 15 APR 84
15 OCT8 *15 AUG 84
1. I JAN 82~ --- a15OCT804
is5MAY 82 51R8
15 JUL 82 .. 15 OCT 85
15 OCT 82' 5.48
15 JAN 83 15 JLRN 86
20-
10 ... 15 APR 83 a 15 JL 7
0- *15 JUL 83 15 FE8 88
-10- ~15 OCT 8315JL 8-20
-015 JAN 84 *Insgufficient data
O X)00 MO0O -000 40 00 5000 6000 0 1000 2000 3000 40M 5000 6000DiStrce ft
A31
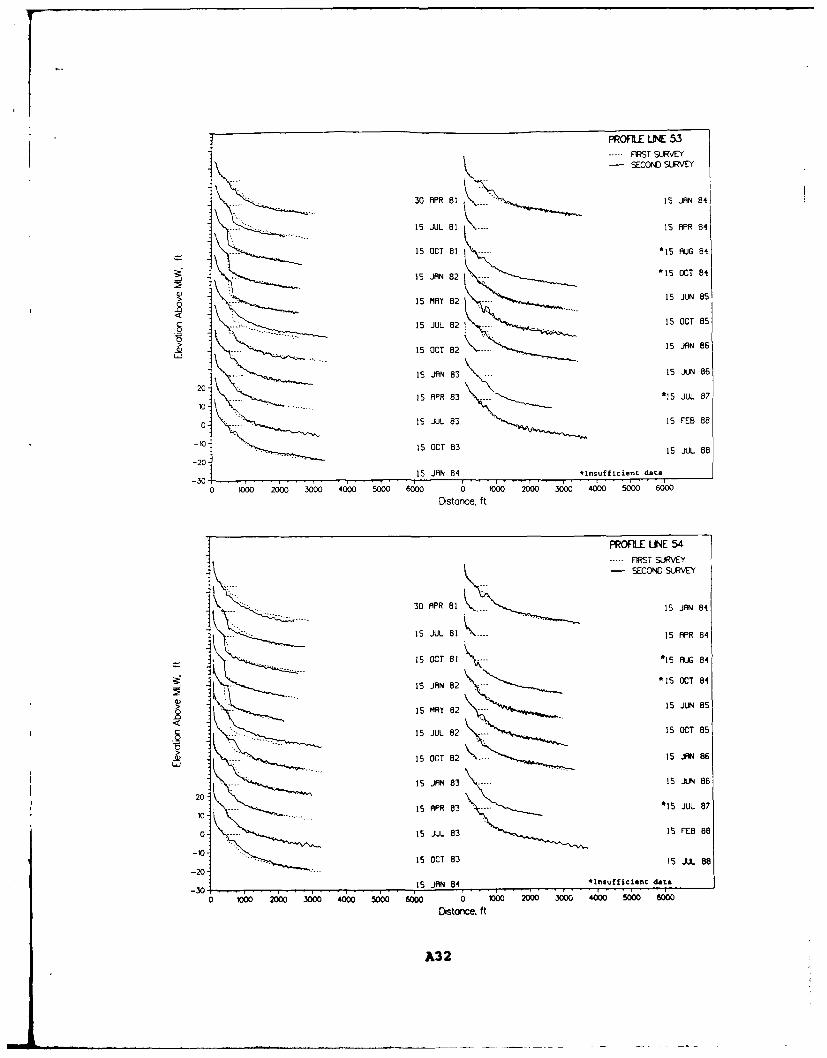
PROfiE LIE 53FPST SURVEY
-SECOND SURVEY
30 APR 81 \ -. 15 JAN 84
... .. 15 JUL 61 ---- 15 APR 84
15 OCT 81 --- *15 AUG 84
15 JAN 82 *15SOCT 84
>SA8 15 JUN 85
1 5JL2 . 15 OCT 85
15 OCT 82\- 15 JAN 86
5 JAN 03 . 15 JUN 86
20
1015 APR 83 .. *15 JUL 87
o -. . . . . . 15 JUL 83 15 FEB 88
15 OCTB83 15 JUL 88
-20-
3015 JAN 84 -ins ufficient data
0 I000 2000 3000 4000 5000 6000 0 1000 2000 31000 4000 5000 6000
Dstonce. ft
PROfiLE LINE 54
.. . . . . . . . ..FRST SURVEY
-SECONDE SURVEY
30 APR 81 K..15 JAN 84
15 JUL 81~\ 15 APR 84
.1......5sOCT861 *1S AUJG84
15 JAN 82 *15 OCT 84
>15 MAY 82 1..5I JUN 85
1 5JUL 82 5OCT 85
-- 15 OCT 82 IS JA 86
5 JAN 83 ---- 15 .JN 86
20
0 . .... 15 APR803 -....... .... 15 JUL 87
O .. 15 JUL 83 IS FEB 88
20 .... 15 OCT 83 15 JUL 88
-3015 JAN 84 *Inlsufficienlt data
0 1=0 2000 3000 4000 5000 6000 0 1000 200 300 4000 W00 600
Distonce. ft
A32
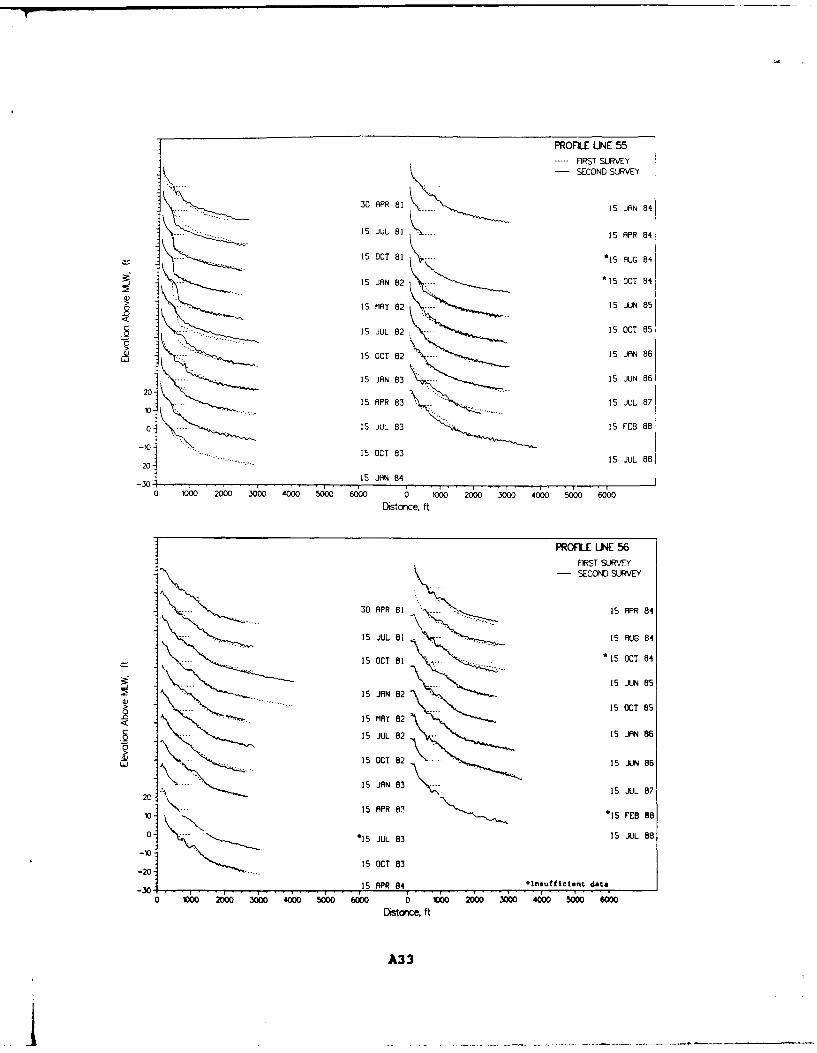
PROFILE UNE 55..... FIRS SURVEY
-SECOND SURVEY
30 APR 81 15 JAN 84
... .... 1 JUL 81 .- - - - - - 15 APR 84
15 OCT 81 *15 AUG 84
15 JAN 82 --- "15 OCT 84
15 AY 82 15 JUN 85
15 JUL 82 15 OCT 85
ISJ15OCT 82 .... 15 JAN 86
- .-. 15 JAN 83 15 JUN 8620
.. 15 APR 83 15 JUL 87
0l 15 jUL 83 15 FEB 88
15 OCT 83-20 . ....... 15 JUL 88
15 JAN 84o 1000 200 300 4600 500 6000 o 6 206 3oDo 400 , 50 6o0o
Distonce, ft
PROFILE LINE 56
-- SECOND SUVE
I 30 APR 81.. 15 APR 84
15 JUL 81 .. " 15A UG 84
15 OCT 81 15 OCT 84
15 JUN 8515 JAN 82 -.
>........... 15 OCT 85.< 15 MAY 82
15JUL 82 15 JAN 86
15 OCT 82 '1 8J" ....... 15 JUN 86
15 JAN 83 --21 JA 3 15 JUL 87
015 APR 83 *15 FEB 88
0- *15 JUL 83 15 JUL 88-10-
15 OCT 83
IS APR 84 *Insufficient data
o ,oo0 20 0 4000 5000 8000 0 Vo 20 300 400 500' 6060Distance, ft
A33
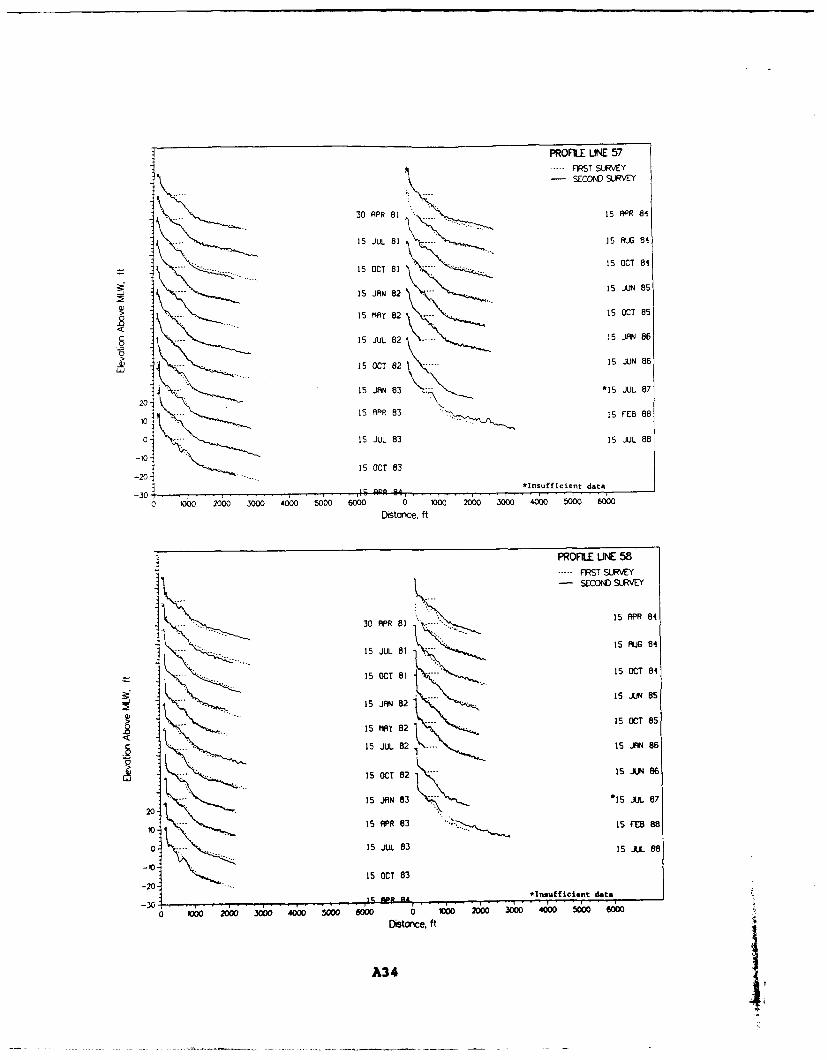
*1 PROFILE LINE 57FRST SURVEY
-SECOND SURVEY
j.-30 APR 81 15 APR 84
--- 15 JUL 81 --. 15 AUG 84
I15 OCT 81isOT8--- 15 JAN 82 --- 15 JUN805
> . 15AY 82 -. 15 OCT 85
o0 . 15 JUL 8215A80
W. 15 OCT 82 15 JUN 86
15 JAN 83 .. "*15 JUL 87
201
i15 APR 83 is. F5 EB 88
015 JUL 83 15 JUL 88
-20 15 OCT 83
I *-Insufficient data
-304i 19 APR 84, 110 20 0 4
0 1000 2000 3000 4000 5000 6000 0 10 200 30 400 5000 6000Distorce, ft
PRoniLE LINE 58............................FVST SURVEY
-SECONDO SURVEY
15 AUG 84
15 JUL 81isRG8
15 OCT81 ... 15 OCT804
-C ~15 JUN8515 JAN 82
15 MAY 821 5C8
-15 JUL 82>~. 15JN8
Li15 OCT8:2 --- 5 JUN86
15 JAN83 Is j.L e7
20
10 15 APR 83 15 FEB 88
0. 15 JUL 8315J 8
-10-15 OCT 83
-20--30 APR i A *Insufficient data
0 1000 MOO0 3000 4000 500 m00 0 WO0 2000 3000 4000 500 00
i~Sto~ce. ft
A34
APPENDIX B:
POST-HUGO BEACH PROFILES
APPENDIX B: POST-HUGO BEACH PROFILES
1. The post-Hugo survey data (December 1989) was plottedseparately since the survey data was collected after an extremeevent, as opposed to a representative survey of beach response tothe jetties.
2. Similar to the data in Appendix A, the post-Hugo profiledata was entered into the Interactive Survey Reduction Program.After correction of suspected erroneous points, the data wasplotted using a Turbo-Pascal program. Comparison plots were madeusing the February 1988 survey; except for ISRP Profile Lines 1,8, 9, 25-28, 45, and 56 which were compared with the July 1988survey (due to insufficient data in the February 1988 surveys).Profile Line 46 was dropped because of questionable data on thepost-Hugo survey.
B3
4 -
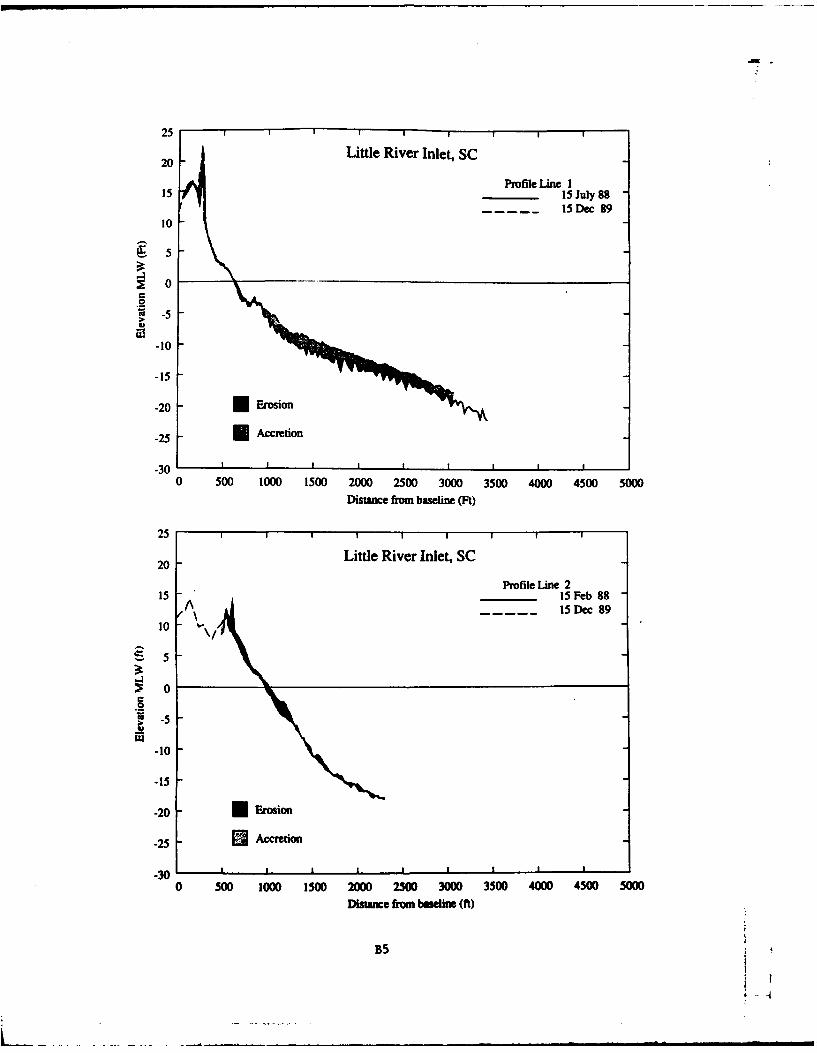
25 I
20 JLittle River Inlet, SC
Profile Line I15 15 July 88
15 Dec 8910
5
-5
-10
-15
-20 - Erosion
-25 - Accretion
-30 n 1 1 i0 500 1000 1500 2000 2500 3000 3500 4000 4500 5000
Distance from baseline (Ft)
25 1 1 ,
20 Little River Inlet, SCProfile Line 2
15 - 15 Feb 88A 15Dec 89
10
IS 5
-IO
0
-5
-10
-15
-20 Erosion
-25 Accretion
30 II I I I
0 500 1000 1500 2000 250 3000 3500 4000 4500 5000
Distance from baseline (ft)
B5
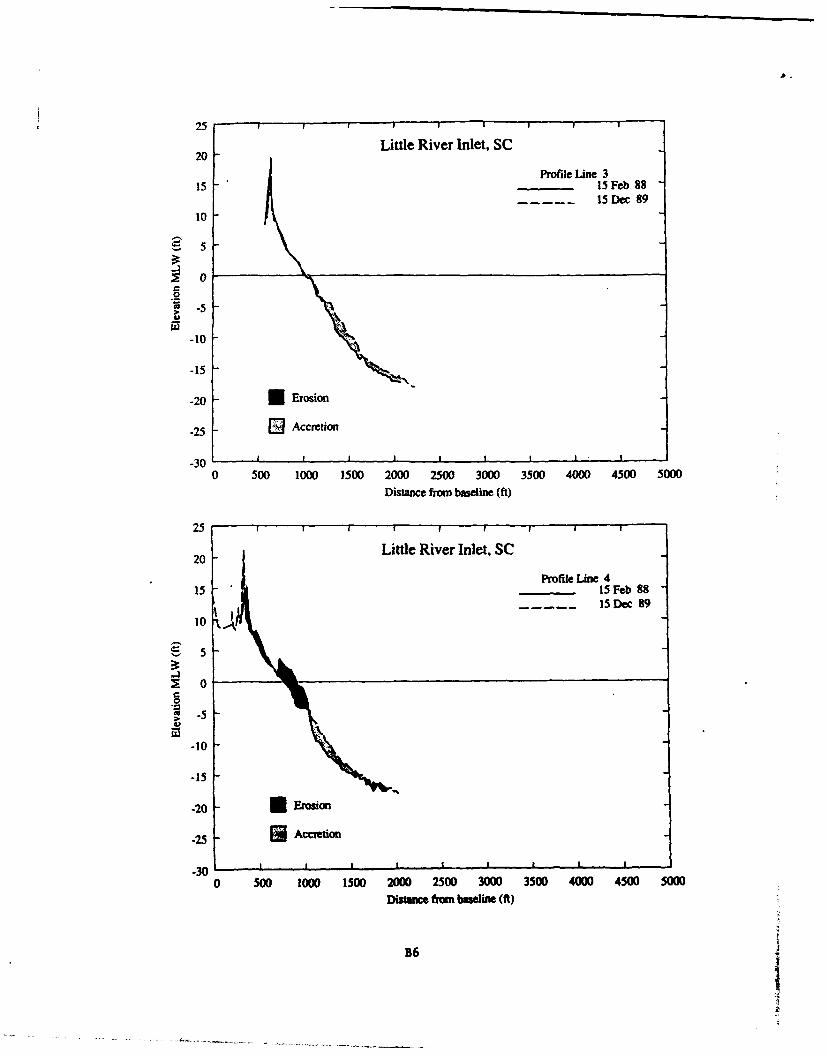
25
Little River Inlet, SC20
Profile Line 315 - 15 Feb 88
15 Dec 8910
" 5
0
-5U
-10
-15
-20 U Erosion
-25 9 Accretion
-3 0 .t I I - I
0 500 1000 1500 2000 2500 3000 3500 4000 4500 5000
Distance from baseline (ft)
25 f f I I I I
20 Little River Inlet, SC
Profile Line 415 15 Feb 88
15Dec 89
510 .t
-10
-50
-1 -
-20 - Erosion
25 - E Accretion
-30
-30 I m , f , 1 , I ' ' I
0 500 1000 1500 2000 2500 3000 3500 4000 4500 5000
Dimnce from bseline (ft)
B6
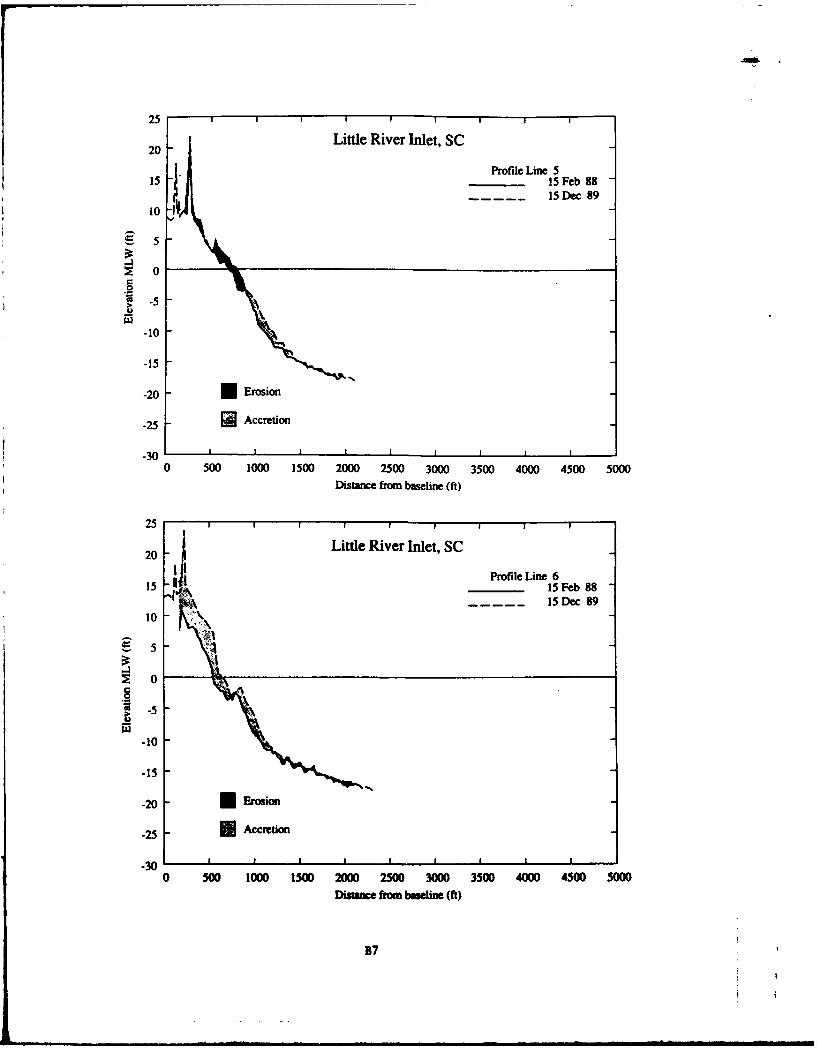
25
20 - Little River Inlet, SC
Profile Line 515 -15 Feb 88
10 I.15 Dec 89
S5
S 0
S-5
-10
-15
-30 I
0 500 1000 1500 2000 2500 3000 3500 4000 4500 5000Distance from baseline (ft)
25
20 Little River Inlet, SC
Profile Line 615____ 15 Feb 88
15 Dec 89
10
S0
0
-15
-300 500 1000 1500 2000 2500 3000 3500 4000 4500 5000
Distance from bineine (ft)
B7
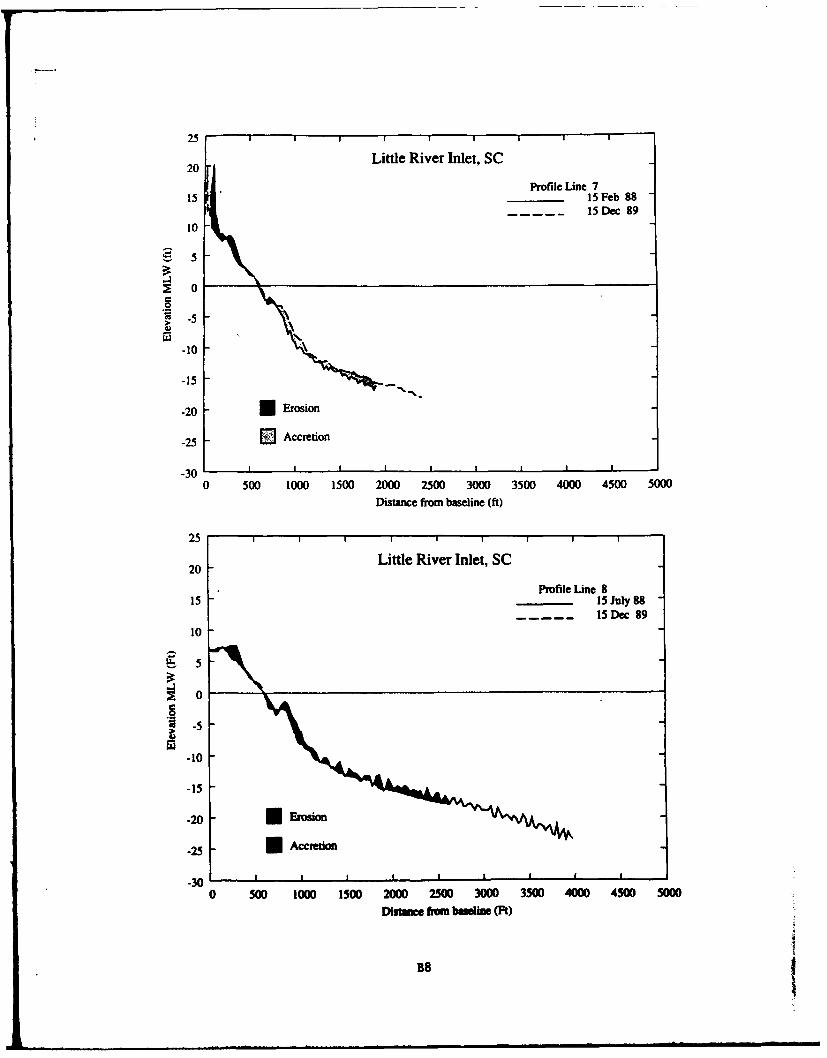
25
20 Little River Inlet, SC
Profile U~ne 715 _____ 15 Feb 88
15 Dec 8910
S 5
-5
0
-15
-20 -Erosion
-25 - QE Accretion
-30 1 1 1 1 I
0 500 1000 1500 2000 2500 3000 3500 4000 4500 5000Distance from baseline (11)
25 1
20 ~Little River Inlet, SC
Profile Line 915 _____ 15 July 8
15 Dec 89
10
-5
-0
-5
-30 I
0 500 1000 1500 2000 2500 3000 3500 4000 4500 5000
Distanc hin bein (Ft)
B8
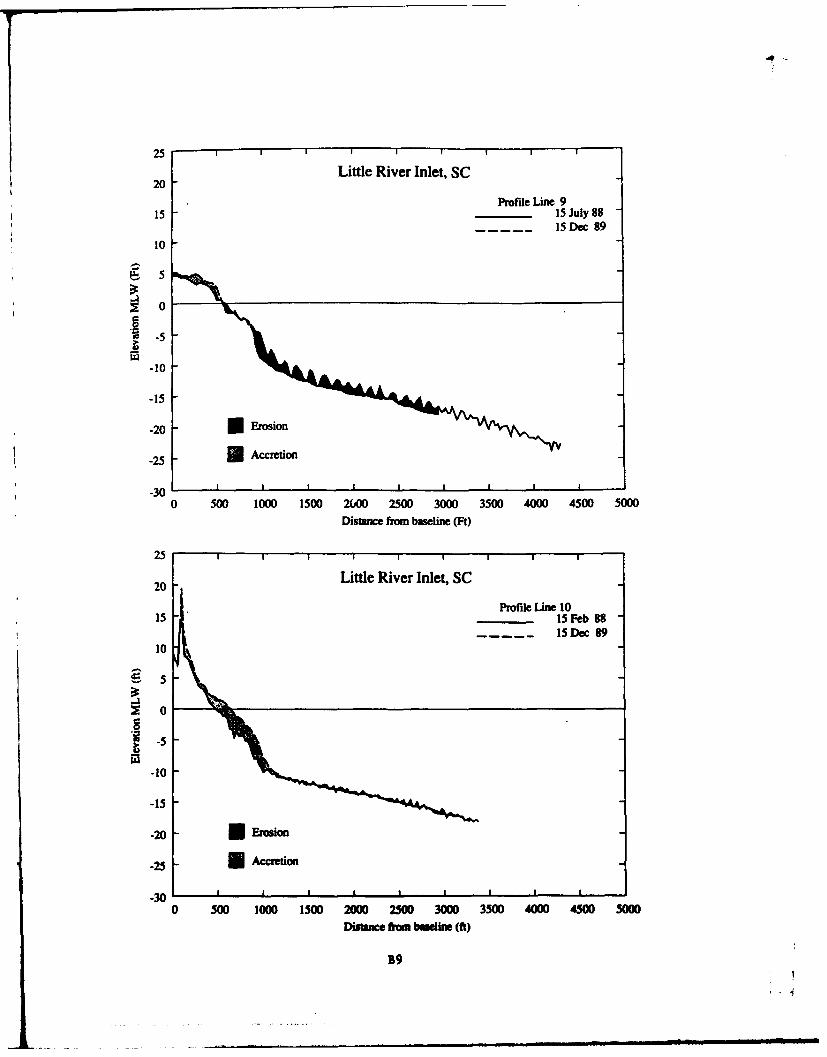
20 - Little River Inlet, SC
Profile Line 915 -15 July 88
15 Doc 9910
I~-5
-10
-15
-30 7EMI Io
300 500 1000 1500 2600 2500 3000 3500 4000 4500 5000Distane fnom baseline (Ft)
251 1111
20 Little River Inlet, SCProfile Line 10
15 15 Feb 8 -15 Dec 89
10
-50
-10
-15
-25 -Accretion
0 500 1000 1500 2000 2500 3000 3500 4000 4500 500Distance foe baseline (ft)
B9
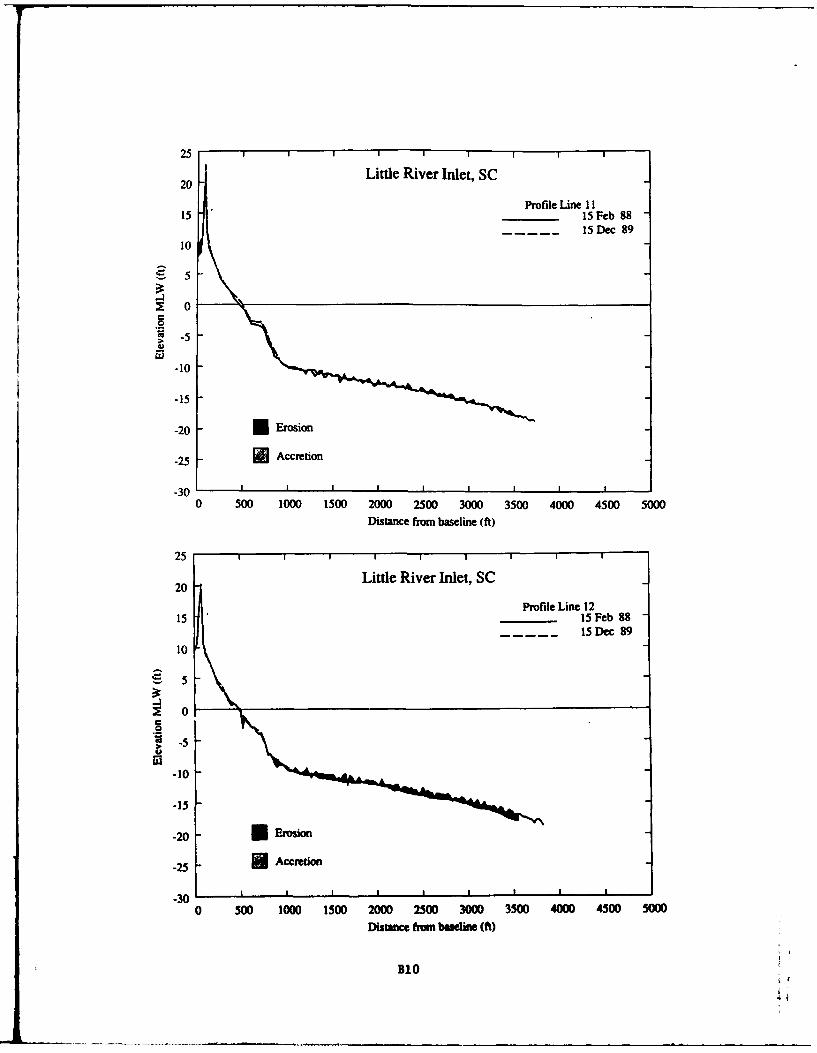
25 , , ,
20 Little River Inlet, SC
Profile Line 1115 15 Feb 88
15 Dec 8910
0
.5
-10
-15
-20 - Erosion
-25 - Accretion
-30 1 i 1 t 1 I i 1
0 500 1000 1500 2000 2500 3000 3500 4000 4500 5000Distance from baseline (fi)
25 i 1 1 i i 1
20 Little River Inlet, SC
Profile Line 1215 15 Feb 88
15Dec 89
10
-5-0
-20 - Erosion
-25 * Accretion
-30 -I - - I - II
0 500 1000 1500 2000 2500 3000 3500 4000 4500 5000Distance from baseline (ft)
B1O
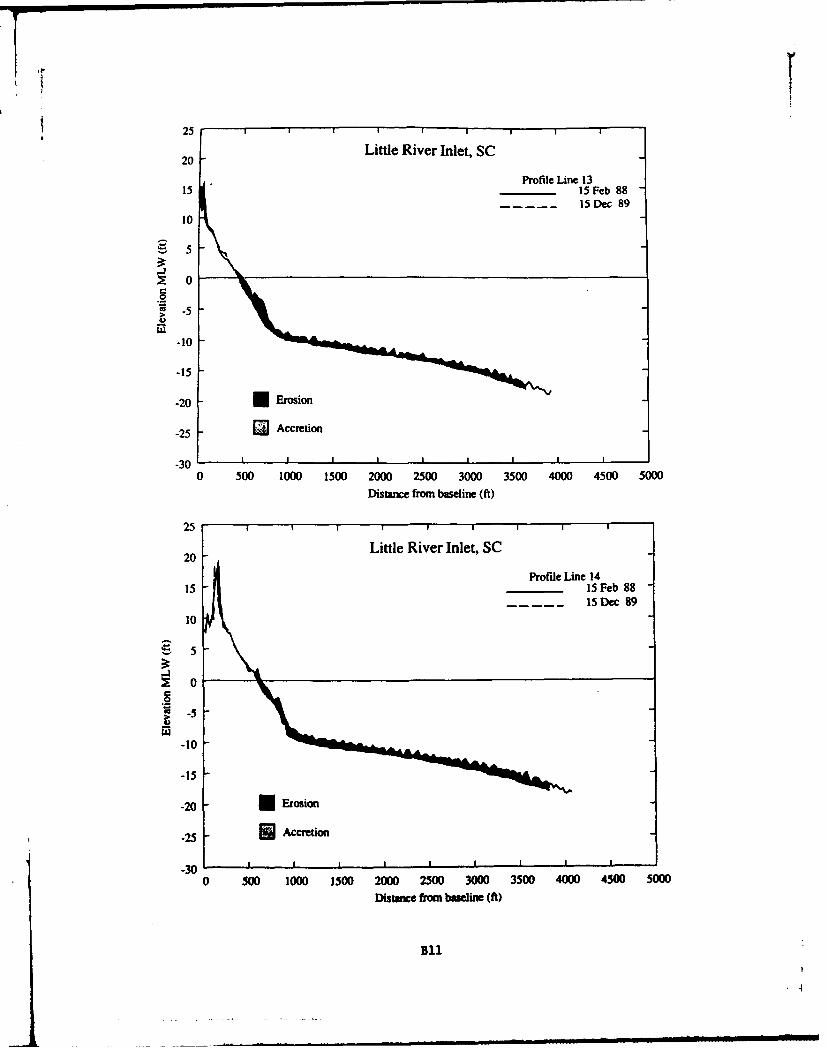
25Little River Inlet, SC
20
Profile Line 1315 15 Feb 88
15 Dec 8910
0
-5
-20 * Erosion
-25 Accretion
-30 1 - i j - I I I I0 500 1000 1500 2000 2500 3000 3500 4000 4500 5000
Distance from baseline (ft)
25 I
20 Little River Inlet, SC
Profile Line 1415 15 Feb 88
15Dec 89
10
5
-5
-10
-15
-20 Erosion
25 Accretion
-30 I I I I I I - --
0 500 1000 1500 2000 2500 3000 3500 4000 4500 500
Distance from baseline (fit)
BIl
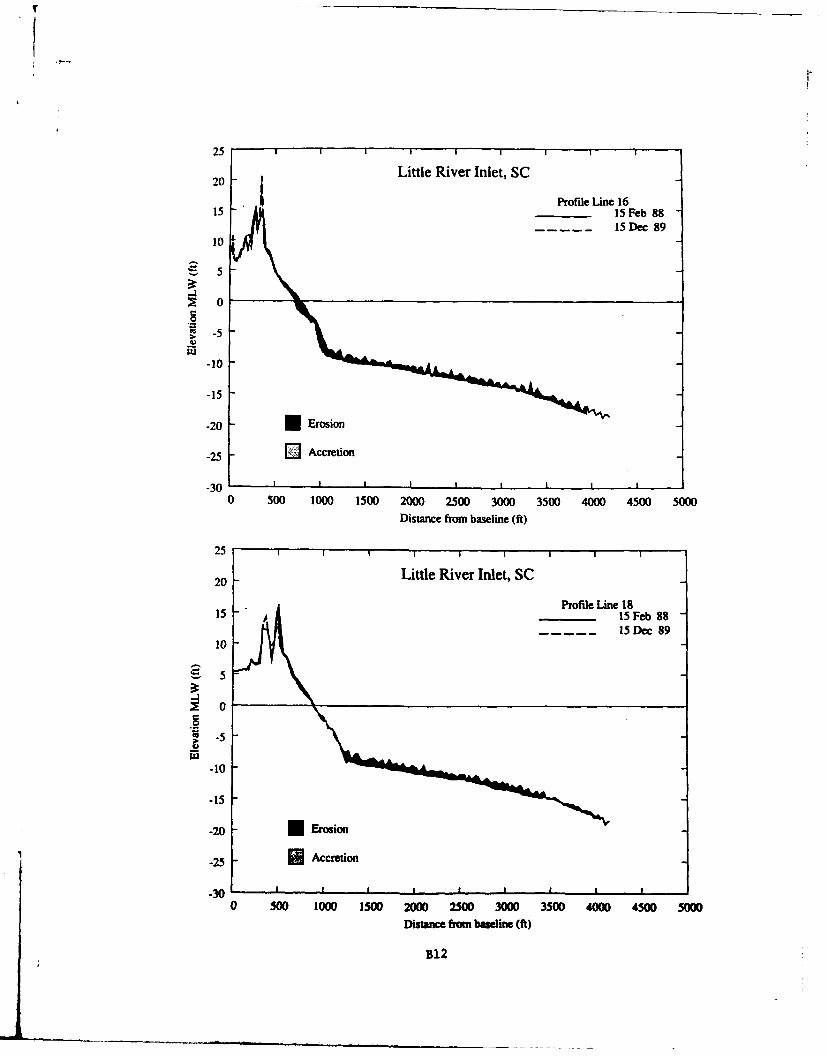
25
20 - Little River Inlet, SC
Profile Line 1615 -15 Feb 8815 Dec 89
10
5
-10
-15
-20 - Erosion
-25 - E Accretion
-30 I I I I I ,0 500 1000 1500 2000 2500 3000 3500 4000 4500 5000
Distance from baseline (ft)
25 1 1 1
20 Little River Inlet, SCProfile Line 18
15 15 Feb 88
15 Dec 8910
5
2 0
-5
-10
-15
-20 - Erosion
-25 - Accretion
-30 I I
0 500 1000 1500 2000 2500 3000 3500 4000 4500 5000
Distance from baeline (ft)
B12
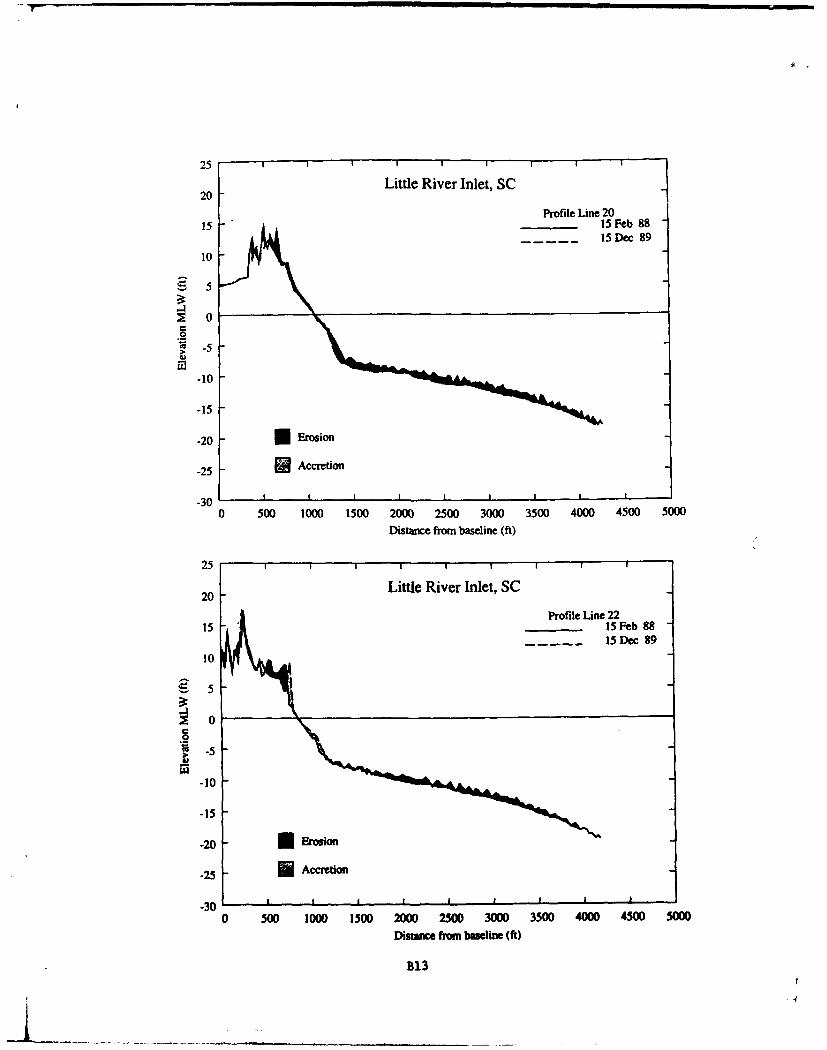
25 -T F
20 Little River Inlet, SC
Profile Line 2015___ 15 Feb 88
15 Dec 8910
5
0
-15
-25 - Accretion
-30 1 1 1 I
0 500 1000 1500 2000 2500 3000 3500 4000 4500 5000
Distance from baseline (ft)
25
20 Little River Inlet, SC
Profile Line 2215 ____ 15 Feb 8
15 Dec 89
10
-5
-0
-5
-30 1 1 1 - I
0 300 1000 1500 2000 2500 3000 3500) 4000 4500 500Distance from baseline (ft)
B13
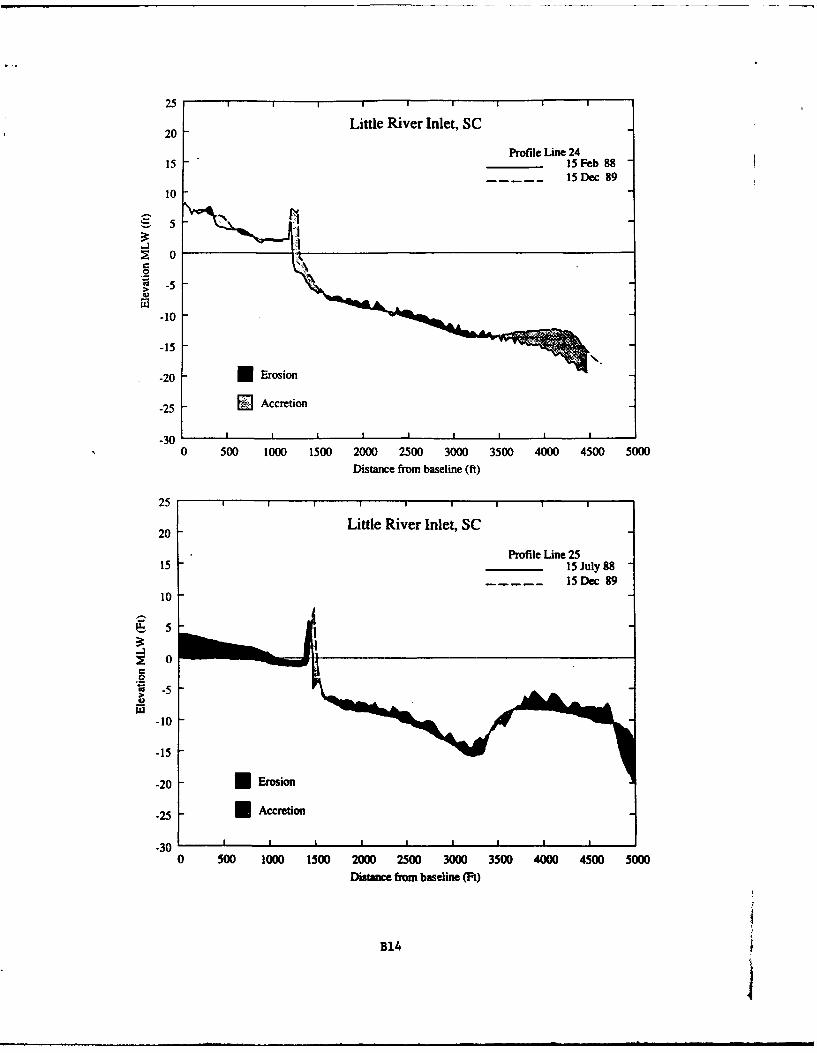
25
20 -Little River Inlet, SC
Profile Line 2415 -____ 15 Feb 88
15 Dec 8910
S 5
0
;~-5
-10
-15
-20 -Erosion
-25 - E] Accretion
-30 1 1 1 1 1 I
0 500 1000 1500 2000 2500 3000 3500 4000 4500 5000Distance from baseline (ft)
25 1 1 1
20 Little River Inlet, SCProfile Line 25
15 15 July 815 Dec 89
10
-5
-10
-15
-25 -Accretion
-30 1 1 1 1 1 I
o 500 1000 1500 2000 2500 3000 3500 4000 4500 500Distance from baseline (Pt)
B14
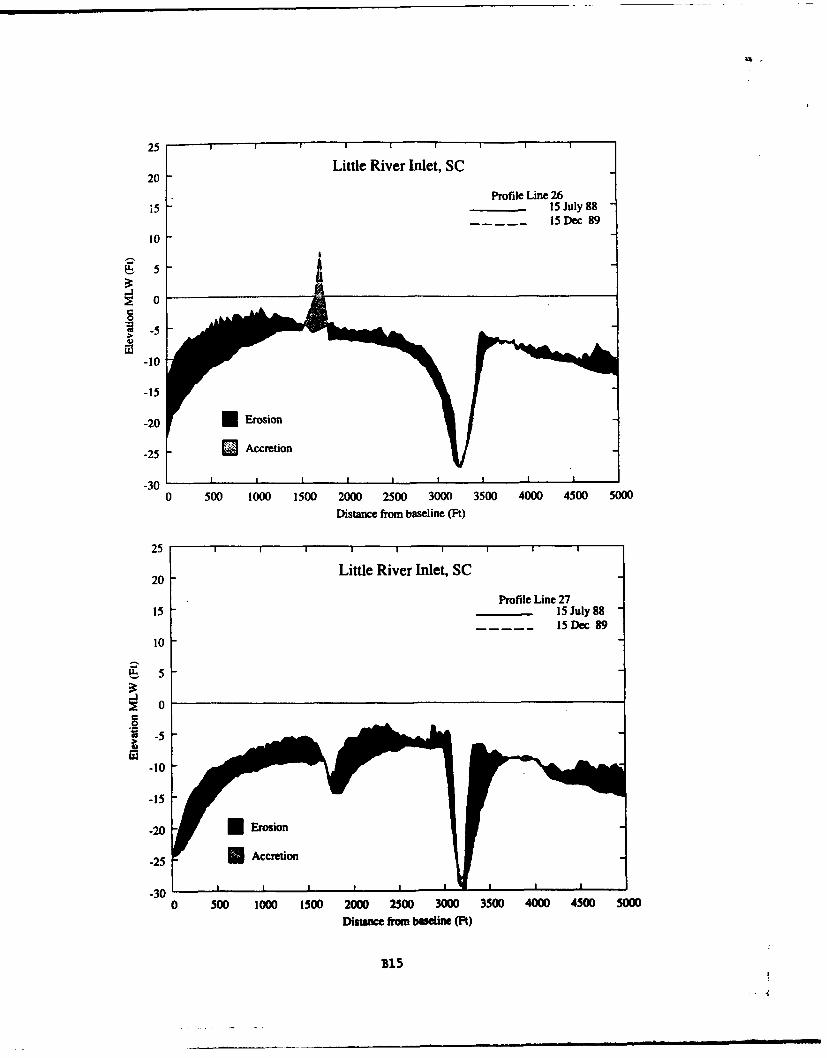
25Little River Inlet, SC
20Profile Line 26
15 ~15 July 8815 Dec 89
10
S 0
0
-15
-20 Erosion
-25 Accretion
-30 I
0 500 1000 1500 2000 2500 3000 3500 4000 4500 5000Distance from baiseline (Ft)
25 1 1
20 Little River Inlet, SIC
Profile Line 27150____ 15 July 88
15 Dec 8910
5
0
S-5
10
-15
-25 - M Accretion
.30 ' - I III I II0 500 1000 1500 2000 2500 3000 3500 4000 4500 5000
Distance fnxm bawlans (Pt)
3154
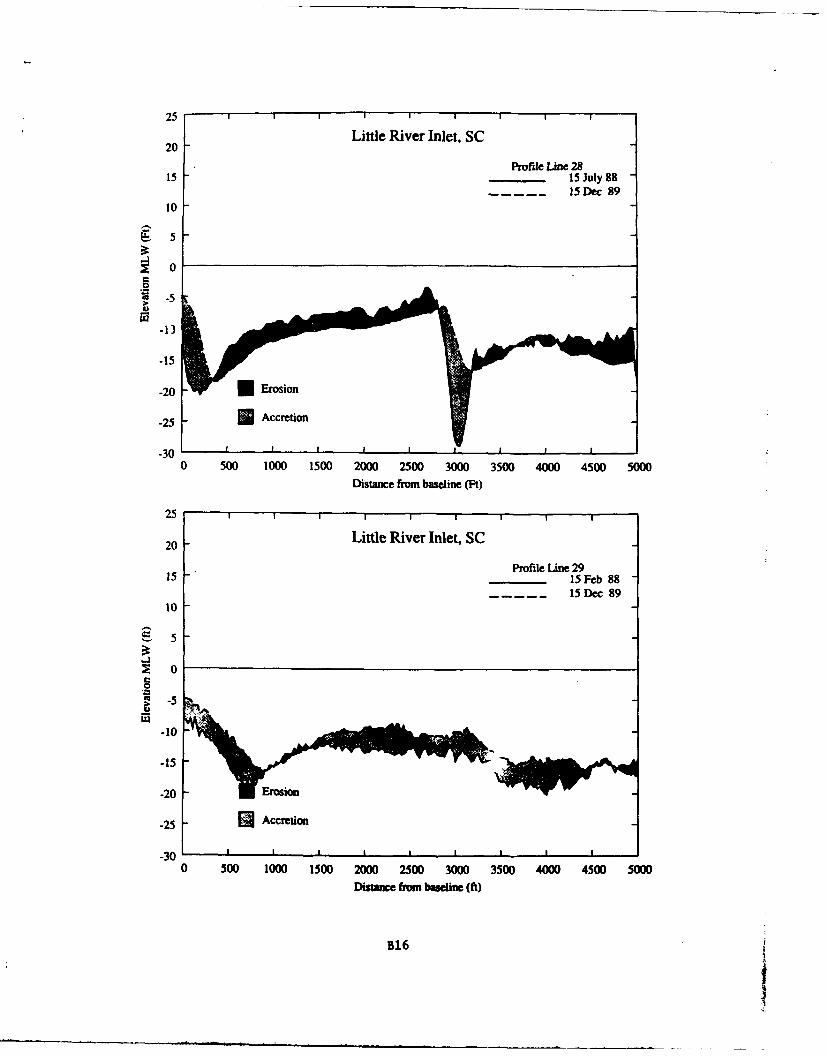
25
20 - Little River Inlet, SC
Profile Line 2815 -15 July 88
15 Dec 89
10
-5
-25 Accretion
-300 500 1000 1500 2000 2500 3000 3500 4000 4500 500
Distance ftrm baseline (Ft)
25
20 Little River Inlet, SC
Profile Line 2915 15 Feb 88
15 Dec 8910
S 5
0
-10
-15MWM6-dib
-20 kroionW W
-3 I - II II
0 500 1000 1500 2000 2500 3000 3500 4000 4500 5000Distance from baseline (ft)
B16
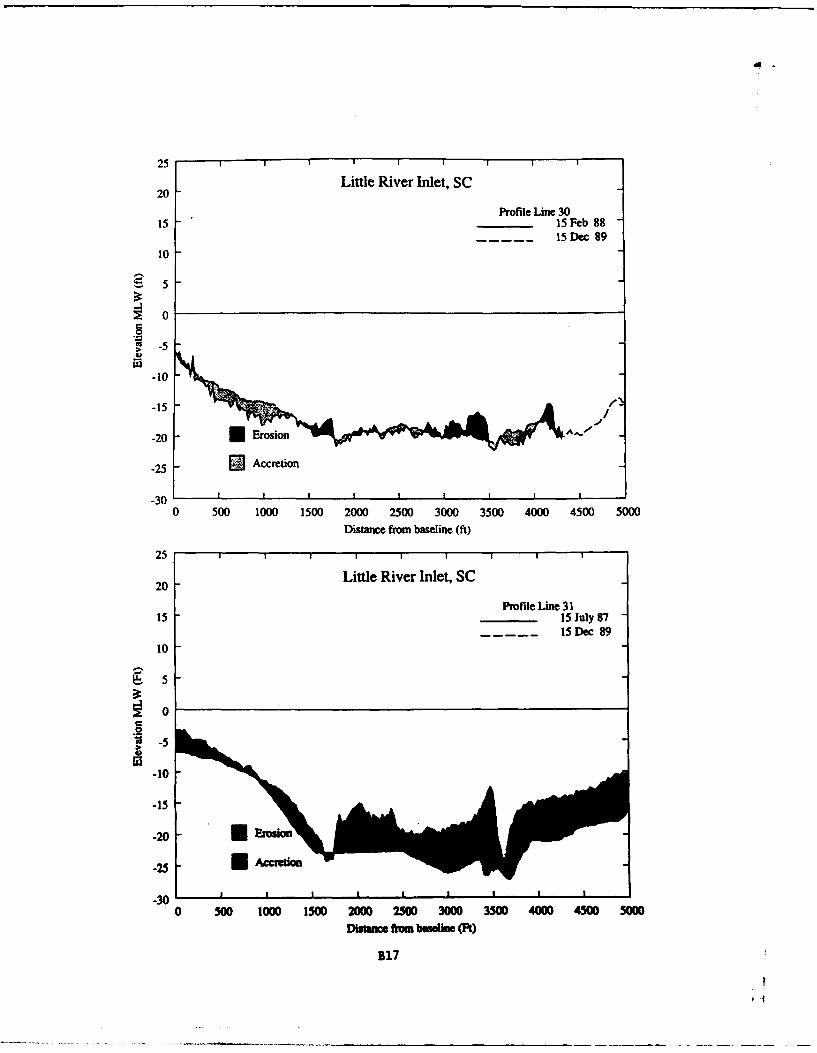
25
20 - Little River Inlet, SC
Profile Line 3015- 15 Feb 88
15 Dec89
to 0
0
-5
-10
-15
-25 -Accretion
30 'I I I I I I I
0 500 1000 1500 2000 2500 3000 3500 4000 4500 5000Distance from baseline (ft)
25 1
20 Little River Inlet, SC
Profile Line 3115 ______ 15 July 87
15 Dec 8910
0
-5
-10
-15
-301 I I I - I I I
0 500 1000 1500 2000 2500 3000 3500 4M0 4500 50WDim=nc ftc. bueline (Pt)
B17
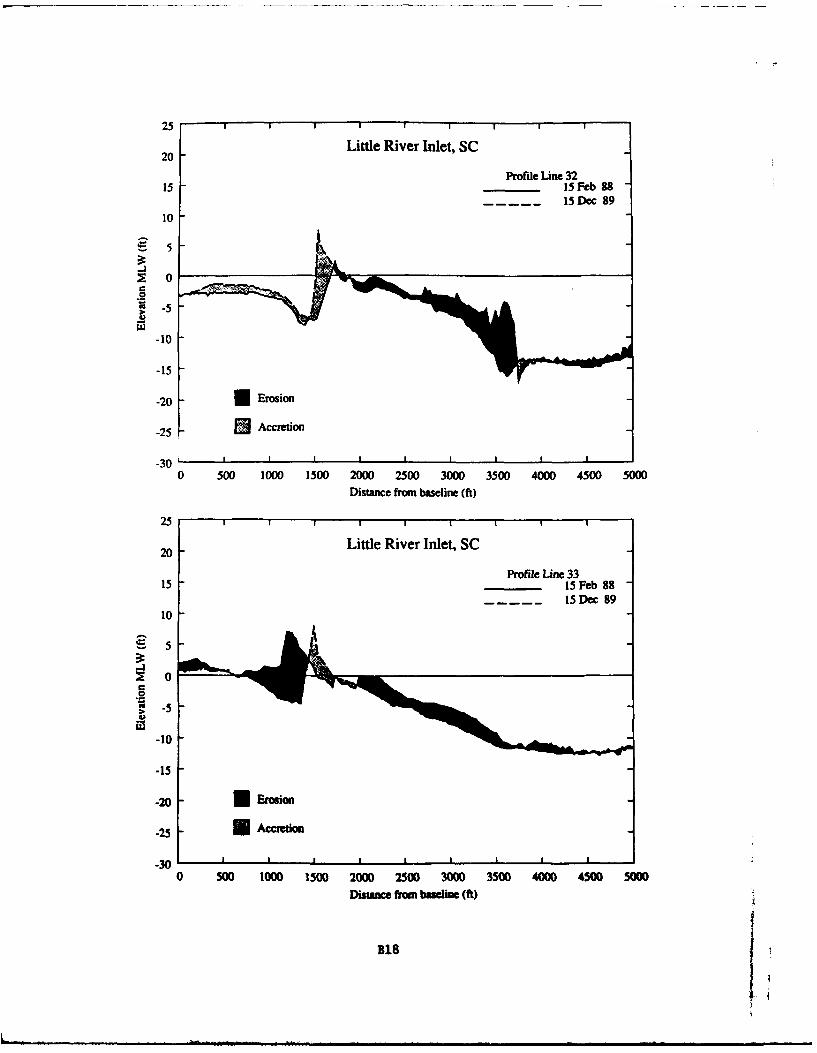
25
20 Little River Inlet, SC
Profile Line 3215 -15 Feb 88
15 Dec 8910
5- -
0
S-5
-10
-15
-30 I
0 500 1000 1500 2000 2500 3000 3500 4000 4500 5000Distane from baseline (ft)
25 1
20Little River Inlet, SCProfile Lime 33
15 15 Feb 8815 Dec 89
10
S-5
-10
-15
-30 - I I - L - ---
0 500 1000 1500 2000 2500 3000 3500 4000 4500 50MDistane from bmlie (ft)
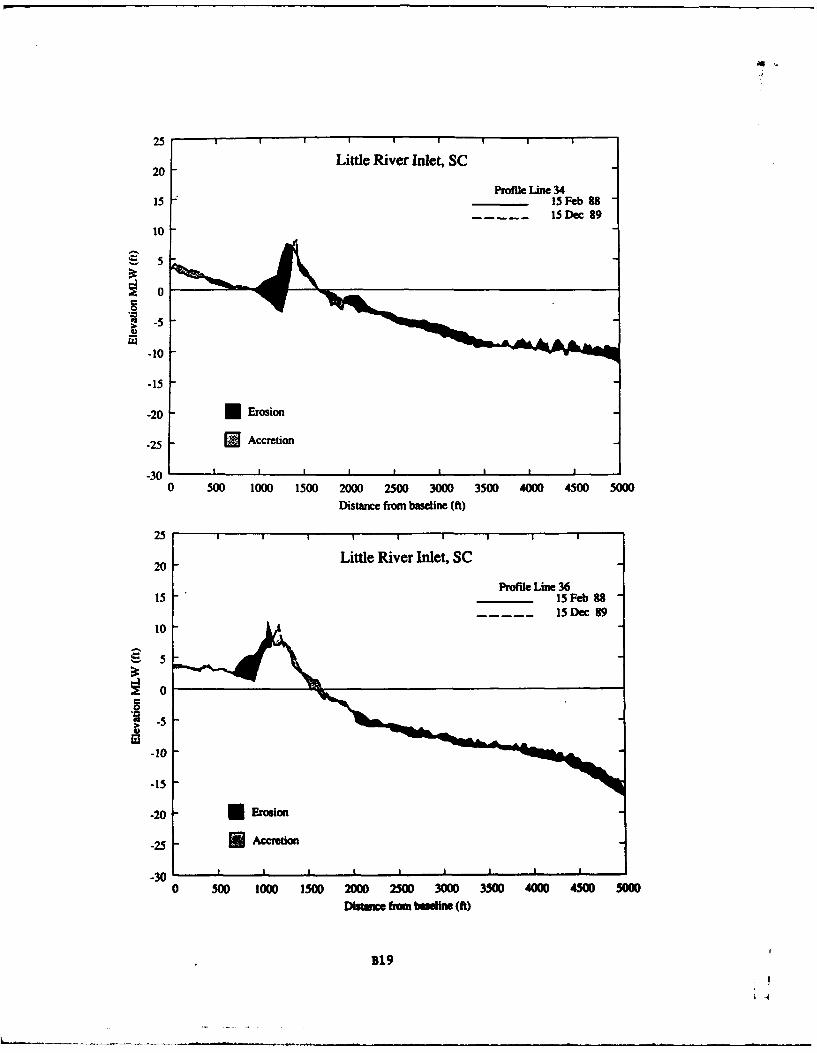
25 -------
Little River Inlet, SC20
Profile Line 345 11 Feb 88
15 Dec 89
10
50
-15
-20 - Erosion
-25 - Accretion
-30 ' I I I I0 500 1000 1500 2000 2500 3000 3500 4000 4500 5000
Distance from baseline (fl)
25 I 1 I I I I
20 Little River Inlet, SC [
Profile Line 365 15 Feb 88
15Dec 8910
45- 5
0
1-50
-15
-20 1 Erosion
-23 Accretion
-300 500 1000 1500 2000 2500 3000 3500 4000 4500 00
DUie from bueine (ft)
B19
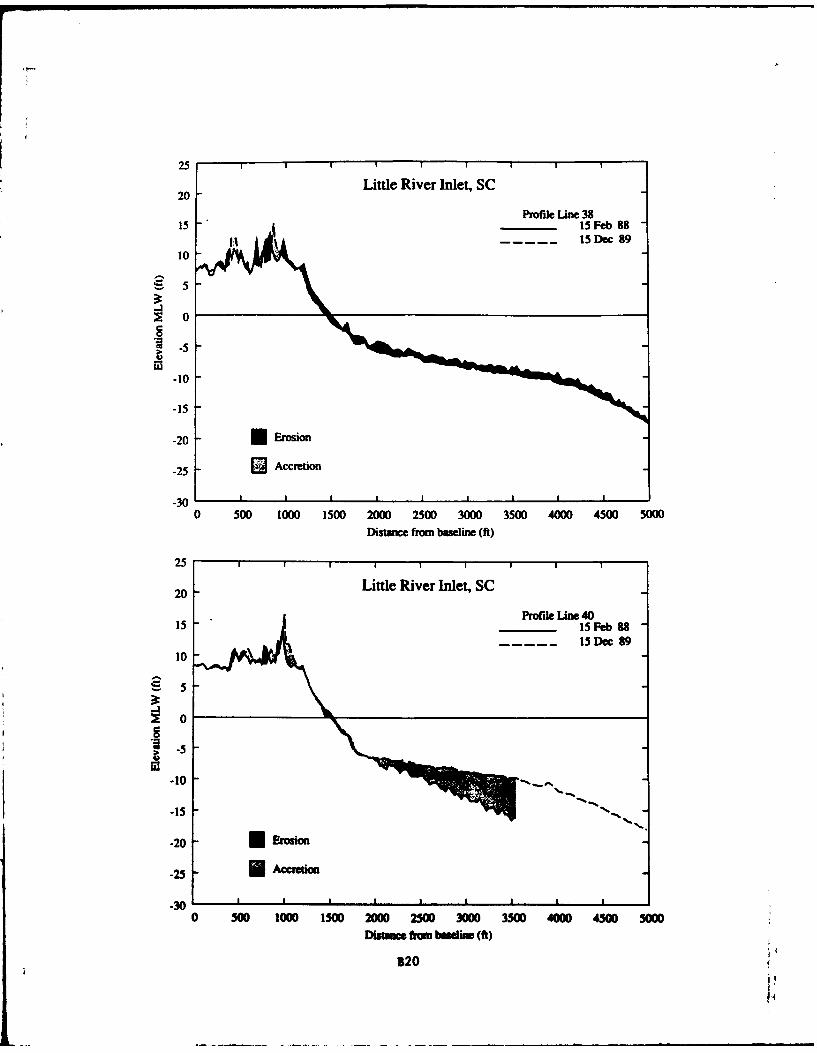
25
20 - Little River Inlet, SC
Profile Line 38015 15 Feb889
15 Dec 89
10
0
-5
-10
-15
-20 -Eosion
-25 -Accretion
-30 1 I I I II
0 500 1000 1500 2000 2500 3000 3500 4000 4500 5000Distance from baseline (11)
25 1 1
20 Little River Inlet, SC
Profie Line 4015 ____ 15 Feb8
15 Dec 8910
5
-5
-10
-15 -
-20 - Efosi
-25 -Arto
0 500 1000 1I00 2000 2500 3000 3500 400D 4500 50WDistanc frmm bmlin (ft)
320
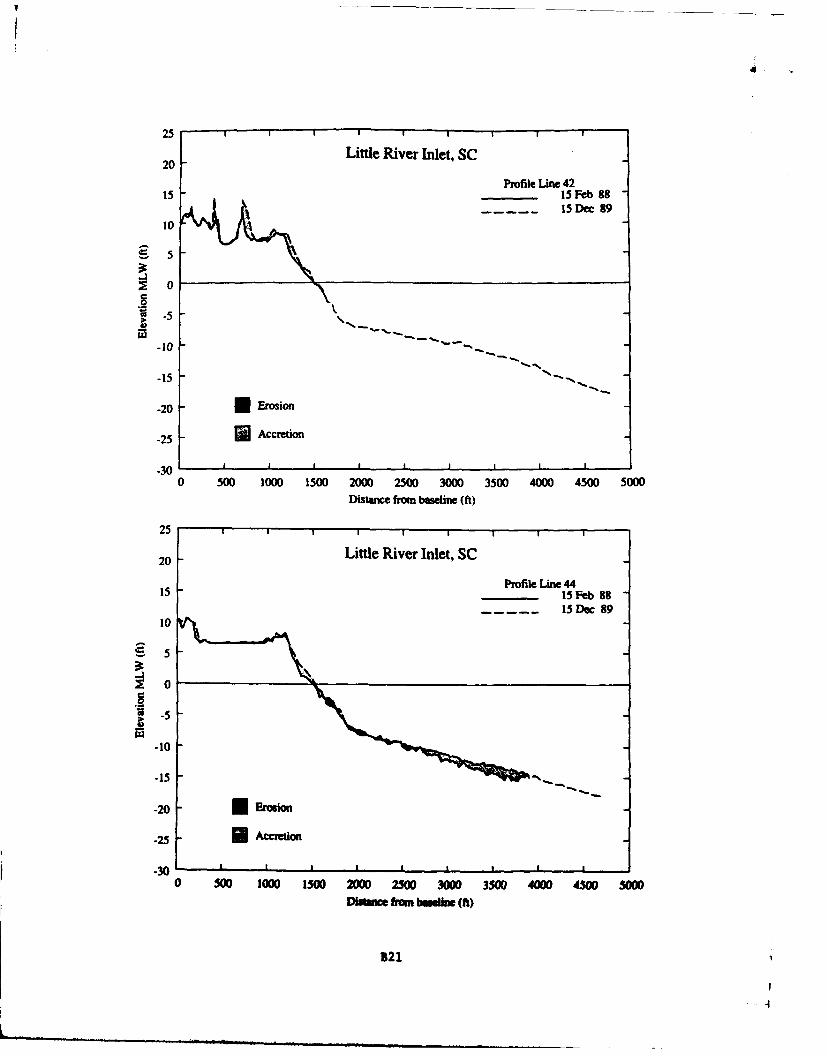
25
Little River Inlet, SC20
Profile Line 4215 15 Feb 88
15 Dec 89
05
-10 -- S
" -5 -s
-15
-20 n Erosion
-25 Accretion
-30 1 -i i i I0 500 1000 1500 2000 2500 3000 3500 4000 4500 5000
Distance from baseline (ft)
25 1 , , , , 1
20 Little River Inlet, SC
Profile Line 4415 15 Feb 8815 Dec 89
10
-5
0
-10
-15 " ,
-20 mE wasion
.25 IIAccreton
-30 I I I I0 500 1000 1500 2000 2500 3000 3500 4O0 40 5000
Disomee fiun baseine (ft)
B21
.4
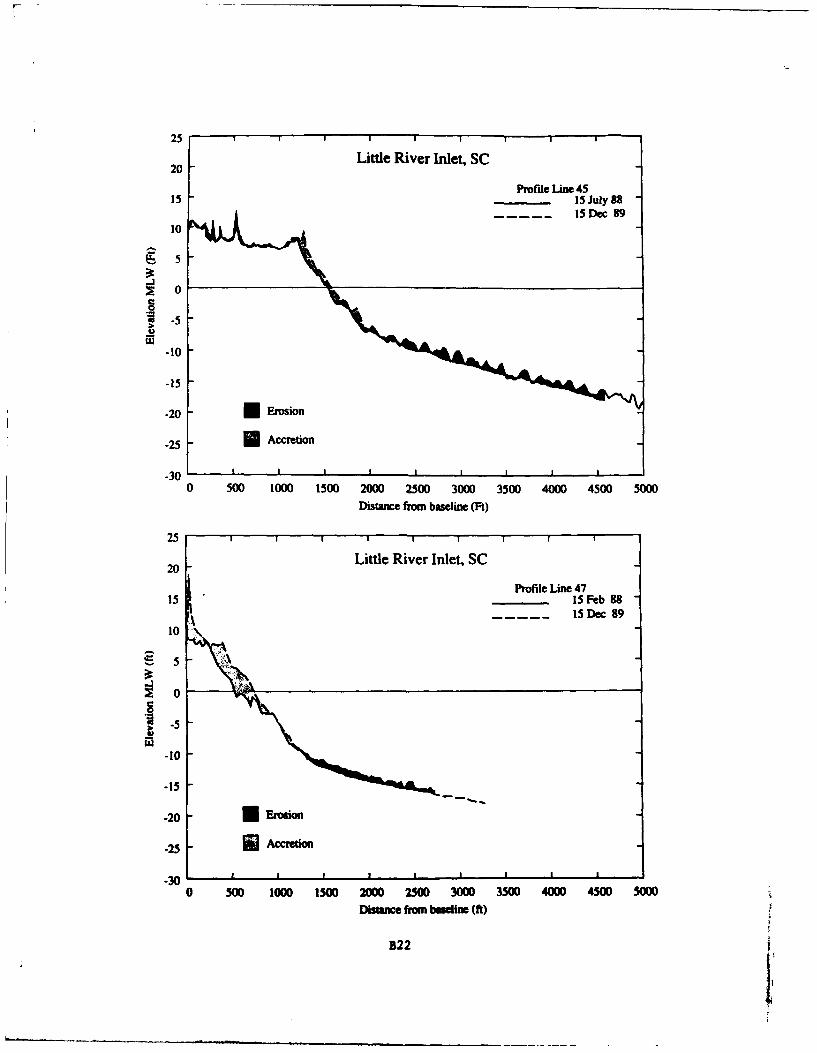
25Little River Inlet, SC
20
Profile Line 4515 15 July 88
15 Doc 9910
S0
1-5
-10
-15
0 500 1000 1500 2000 2500 3000 3500 4000 4500 5000Distane from baseline (Ft)
251 1
20Little River Inlet, SC
Profile Line 4715 ________ 15 Feb 815 ~15 Dec 89
10
-5
-10
-15
-25 Accretion
-30 -- -- I
0 500 1woo 1500 2000 2500 3000 3500 4000 4500 50Distnce from buedine (ft)
B22
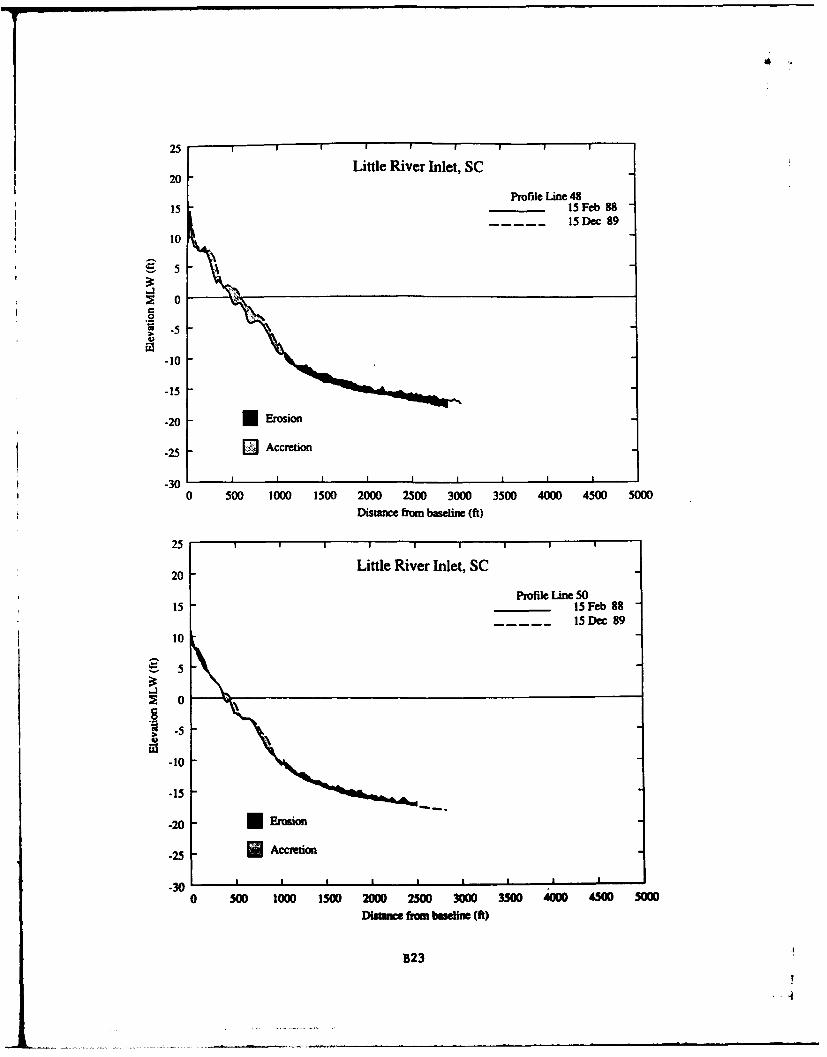
25 I I # I
Little River Inlet, SC20
Profile Line 48- 15 Feb 881 15Dec 8910
5
-10
-20 - Erosion
-25 - Accretion
-300 500 1000 1500 2000 2500 3000 3500 4000 4500 5000
Distance from baseline (ft)
25
20 -Little River Inlet, SCProfile Line 50
15 - 15 Feb 8815Dec 89
10
0
" -5
-10
-15
-20 - Erosion
-2 Accretion
-30 I I I I I I
0 500 1000 1500 2000 250 3000 3500 4000 4500 50Disime frmn ballne (ft)
B23
!4
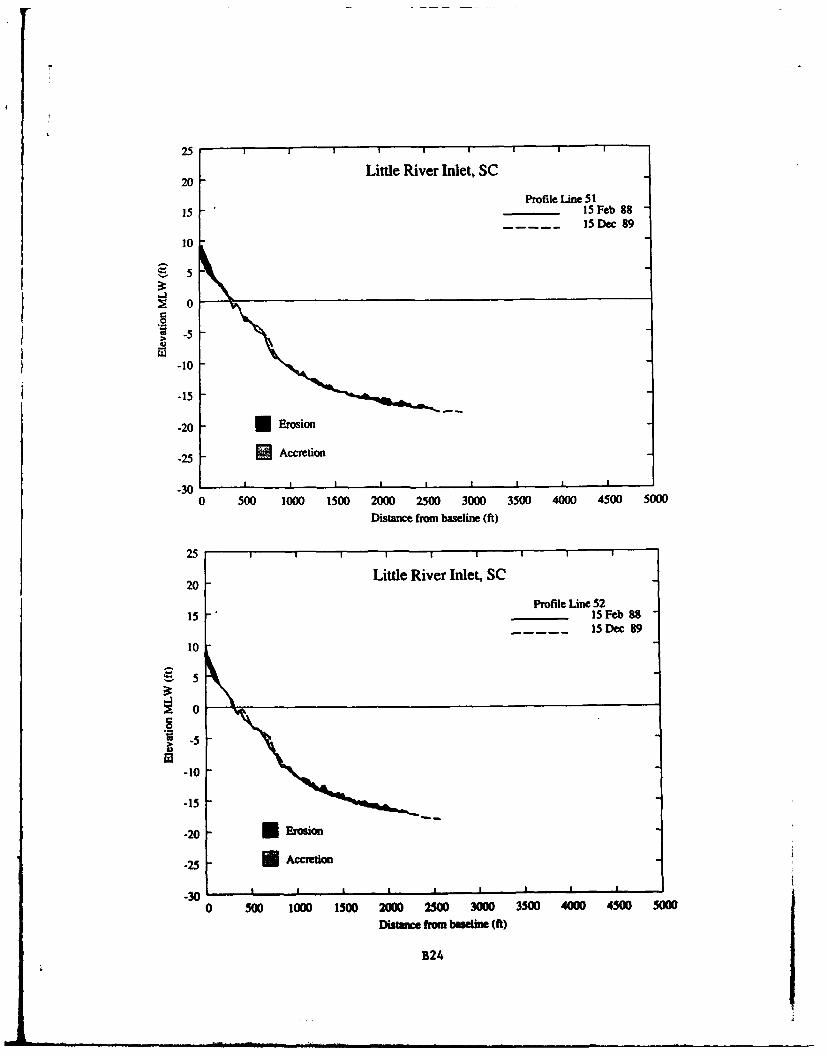
25
Little River Inlet, SC20
Profile Line 5115 -___ 15Feb 88
15 Dec 8910
S 0
;i -5
-10
-15
-20 - Erosion
-25 - Accretion
0 500 1000 1500 2000 2500 3000 3500 4000 4500 5000Distance from baseline (ft)
251 1
20 ~Little River Inlet, SC
Profie Line 52i15___ 15 Feb 88
15 Dec 910
5
-0
-5
-30
0 Soo 10OW 1500 2000 2500 3000 3500 4000 4500 5000Distuwm trai baseline (ft)
B24
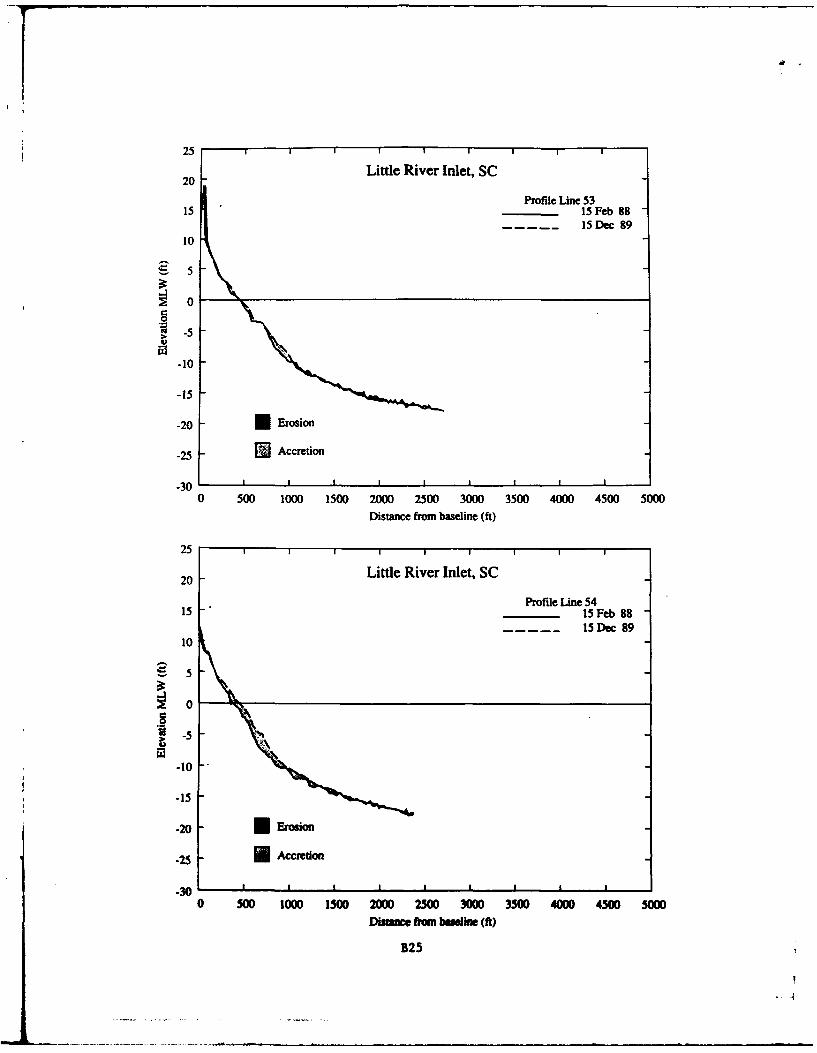
25
Little River Inlet, SC20
Profile Line 5315 15 Feb 88
15 Dec 8910
0
-5
-10
-15
-20 I Erosion
-25 - Accretion
-30 I I I I I I
0 500 1000 1500 2000 2500 3000 3500 4000 4500 5000
Distance from baseline (ft)
25 1 1 1 1 1 1
20 Little River Inlet, SCProfile Line 54
15 15 Feb 8815 Dec 89
10
-5
-10 "
-15
-20 Erosion
-25 Accretion
-30 - I I I I I I I I
0 500 1000 1500 2000 2500 3000 3500 4000 4500 5000
Dktc from bseline (f)
B25
-1
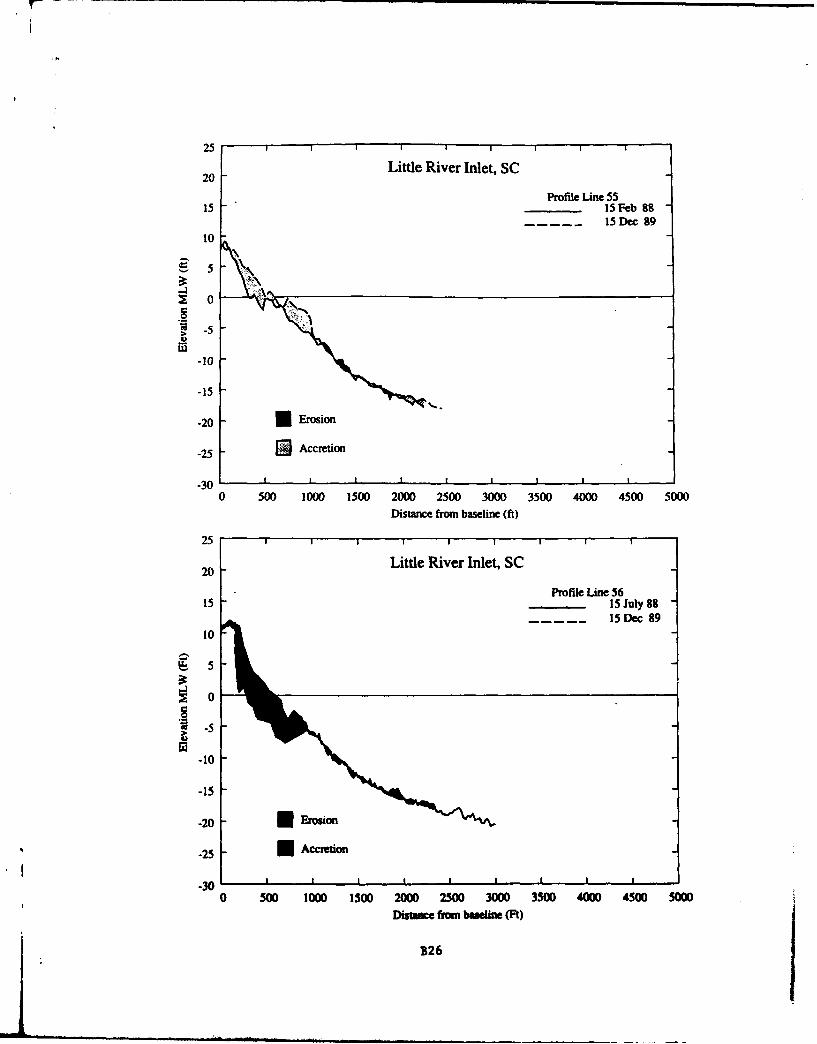
25 ,Little River Inlet, SC
20Profile Line 55
15 15 Feb 8815Dec 89
10
S 0.2 .-5
-10
-15
-20 - Erosion
-25 Ei Accretion
-30 I I I I I I0 500 1000 1500 2000 2500 3000 3500 4000 4500 5000
Distance from baseline (ft)
25 1 1 1
Little River Inlet, SC20
Profile Line 5615 15 July 88
15 Dec 8910
".2-0 "-5
-10
-15-20 - Erosion
-25 -Accretion
-30 1 1 - I I i i0 500 1000 1500 2000 2500 3000 3500 4000 4500 5000
Distance from baseline (Ft)
B26
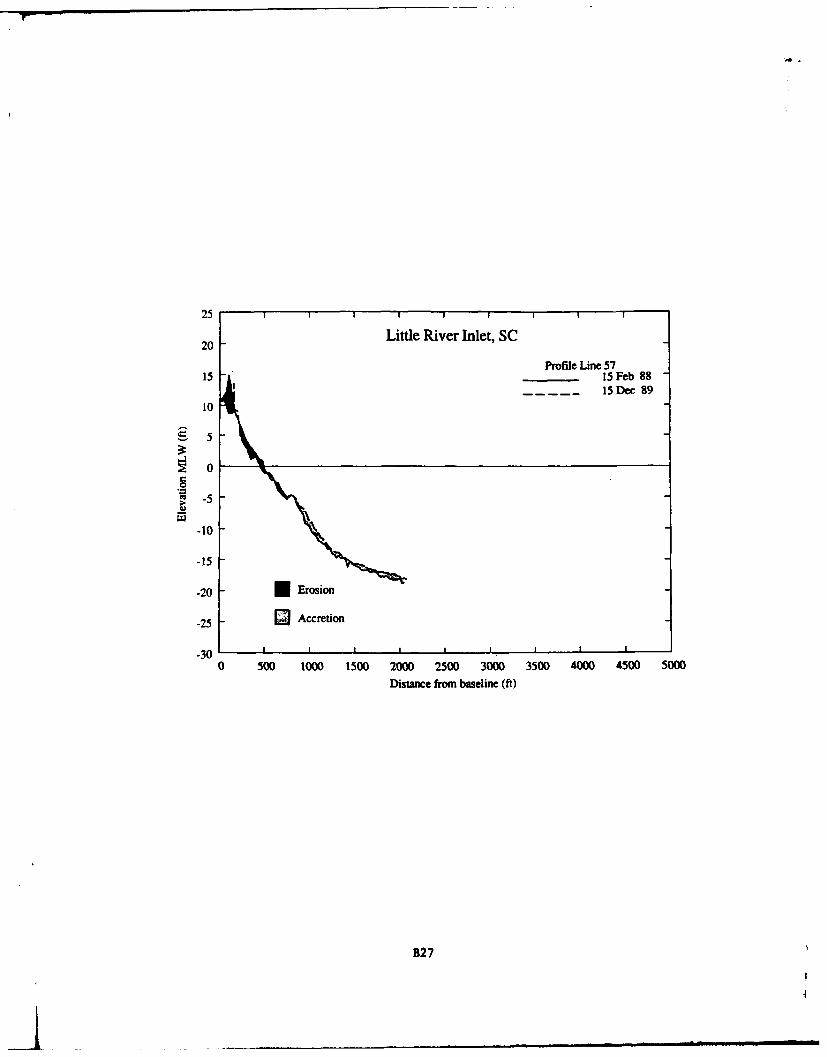
25
20 -Little River Inlet, SCProfile Line 57
15 ______ 15 Feb 8815 Dec 89
10
5
0
> -5
-15
-20 - Erosion
-25 -Accretion
-30 I
0 500 1000 1500 2000 2500 3000 3500 4000 4500 5000Distance from baseline (ft)
B2 7
APPENDIX C:
CUMULATIVE SHORELINE CHANGE
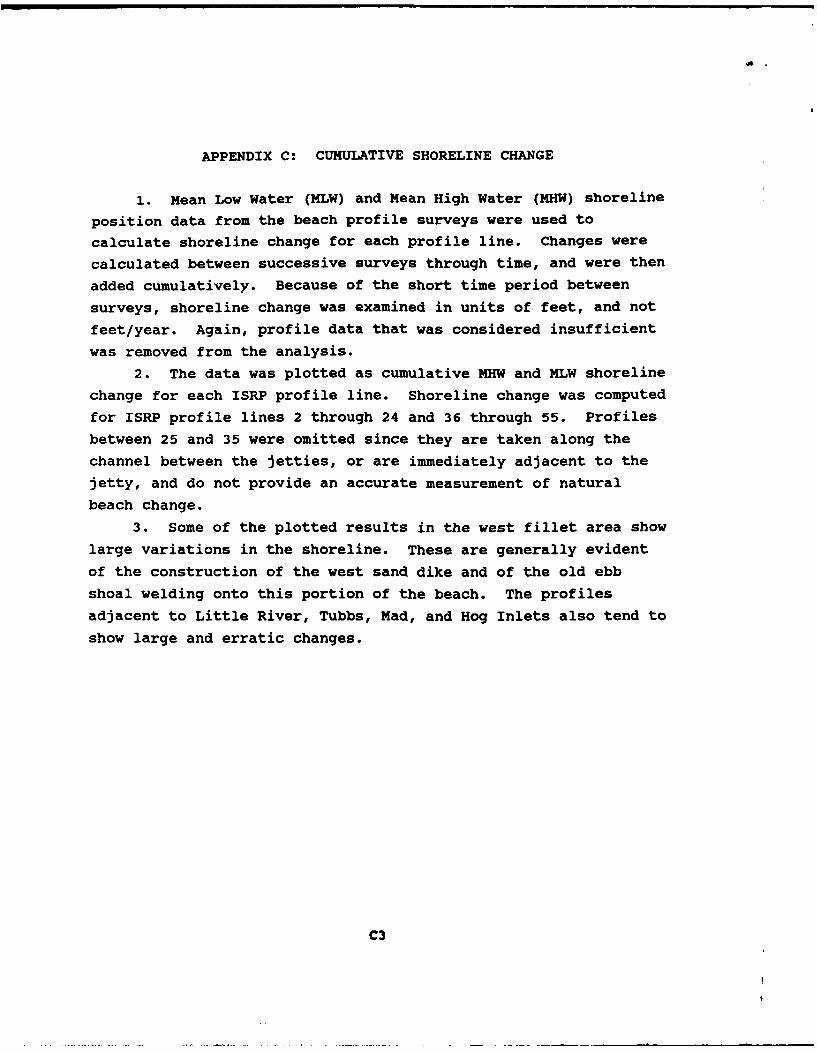
APPENDIX C: CUMULATIVE SHORELINE CHANGE
1. Mean Low Water (MLW) and Mean High Water (MHW) shoreline
position data from the beach profile surveys were used to
calculate shoreline change for each profile line. Changes were
calculated between successive surveys through time, and were then
added cumulatively. Because of the short time period between
surveys, shoreline change was examined in units of feet, and not
feet/year. Again, profile data that was considered insufficient
was removed from the analysis.
2. The data was plotted as cumulative MHW and MLW shoreline
change for each ISRP profile line. Shoreline change was computed
for ISRP profile lines 2 through 24 and 36 through 55. Profiles
between 25 and 35 were omitted since they are taken along the
channel between the jetties, or are immediately adjacent to the
jetty, and do not provide an accurate measurement of natural
beach change.
3. Some of the plotted results in the west fillet area show
large variations in the shoreline. These are generally evident
of the construction of the west sand dike and of the old ebb
shoal welding onto this portion of the beach. The profiles
adjacent to Little River, Tubbs, Mad, and Hog Inlets also tend to
show large and erratic changes.
C3
-!
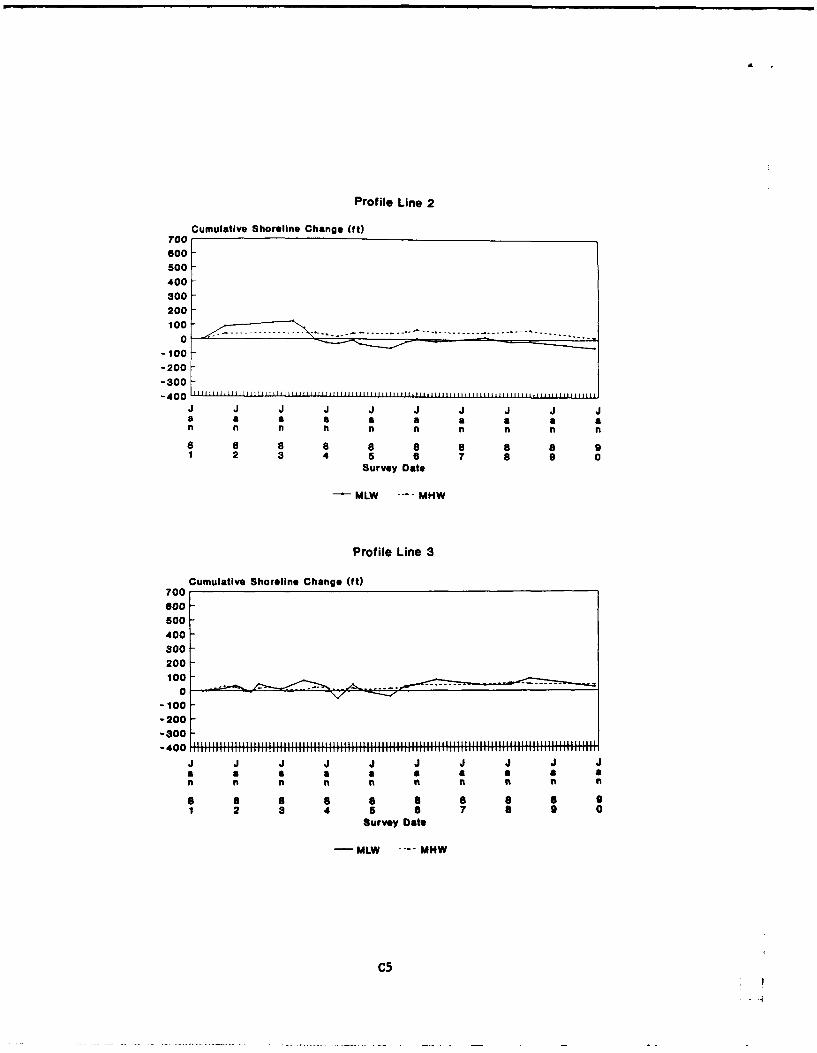
Profile Line 2
Cumulative Shoreline Change (ft)700
400300200100
0-100 - '
-200-300
J 400 J J
a a a a a a a a a a
8 8 8 a 8 a 8 a 91 2 3 4 5 a 7 a 9 0
Survey Date
-MLW --- MHW
Profile Line 3
Cumulative Shoreline Change (ft)700So00500400300-200100
0-100-200-300
a a a a a a a a an n n n n nl nn
a a a a a a a a 91 2 3 4 5 6 7 a 9 0
survey Date
-- MLW ---- MHW
C5
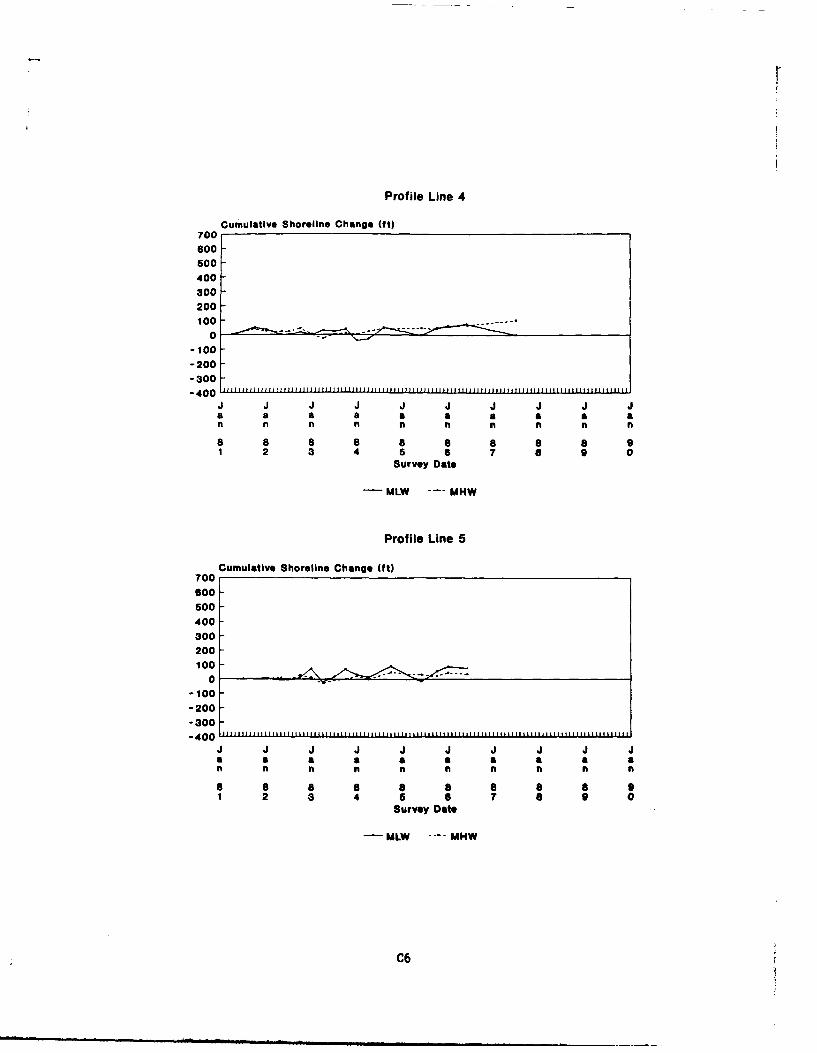
r
Profile Line 4
Cumulative Shoreline Change (ft)700600So0
400300200100
00
-200-300
J J J J J Ji J J J Ja a a a a a a a a an n n n n n n n n
8 a 8 a 8 8 8 a 91 2 3 4 5 6 7 a 0 0
Survey Date
MLW --- MHW
Profile Line 5
Cumulative Shoreline Change (ft)700600500400300200
0 e
-100-200-300-400 it,,, i i i i t u tlt iii 11 i~ i~i l i l|ut111 i llilt|lit, It til llti|liil 111
J J J J J J J J J Ja a a a a a a a a an n n n n n nn
a a 8 8 a 8 a 8 a 91 2 3 4 6 6 7 8 9 0
Survey Date
-MLW --- MHW
C6
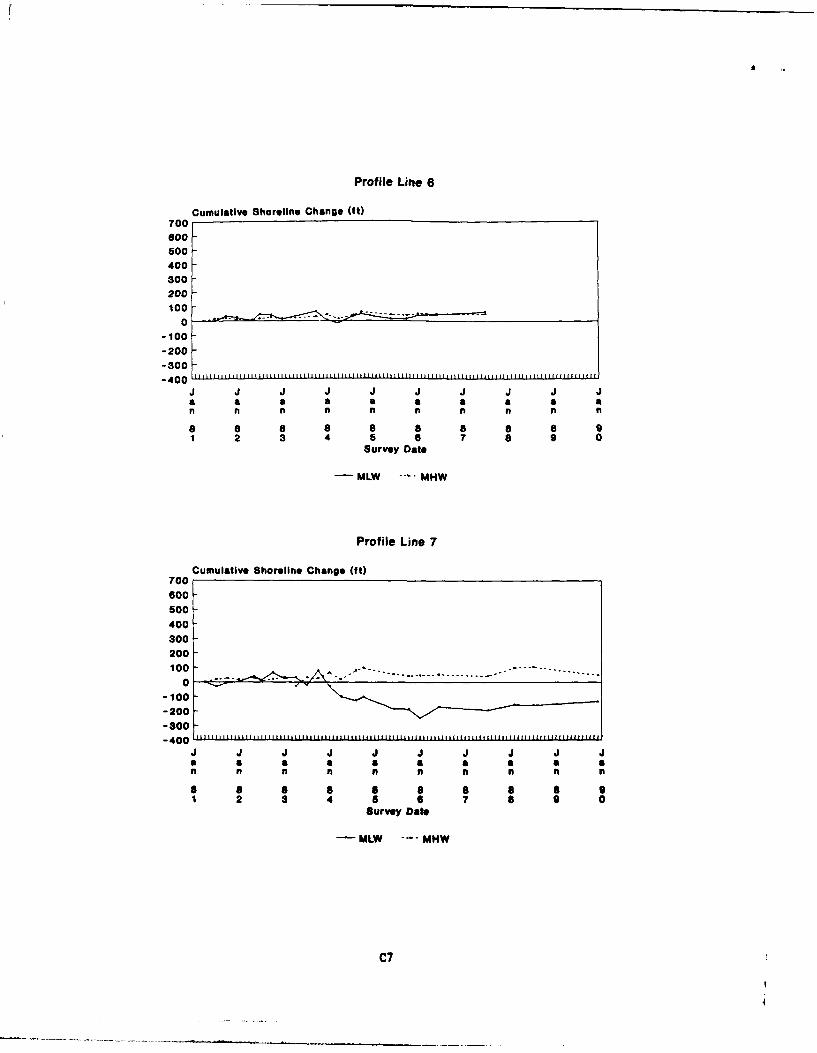
Profile Line 6
Cumulative Shoreline Change (t)700Soo-!Soo -500
400300200 -
100 -
-100-200-300-400 IIIIIlllllllllllllllllllllllllllllllllllll 11111111111 111111111 111 II j Ig, IIIIIIIIIII11111111IIII[I I
J J J J J J J J J J1
a a a a a a a a a an n n n n n f n n n
a a 8 a 8 8 8 8 a 91 2 3 4 5 6 7 8 9 0
Survey Date
-MLW .... MHW
Profile Line 7
Cumulative Shoreline Change (ft)700600
500400300200100 .. . . . . . . . .
1 0 - - .- -.. - - - ---- - - - - - --- ~ -
-100-200
• 400-400 112111111 lLIIIll 11111 i1111111111111l111111111 iji ii LIlii 11111lili i 11111 ill 1111f t t qul/ ip p pg pl
J J J J 4 J J J J Ja a a a a a a an fl n n n ft n
8 8 a a 8 91 2 3 4 5 6 7 a 9 0
Survey Date
-MLW "--MHW
C7
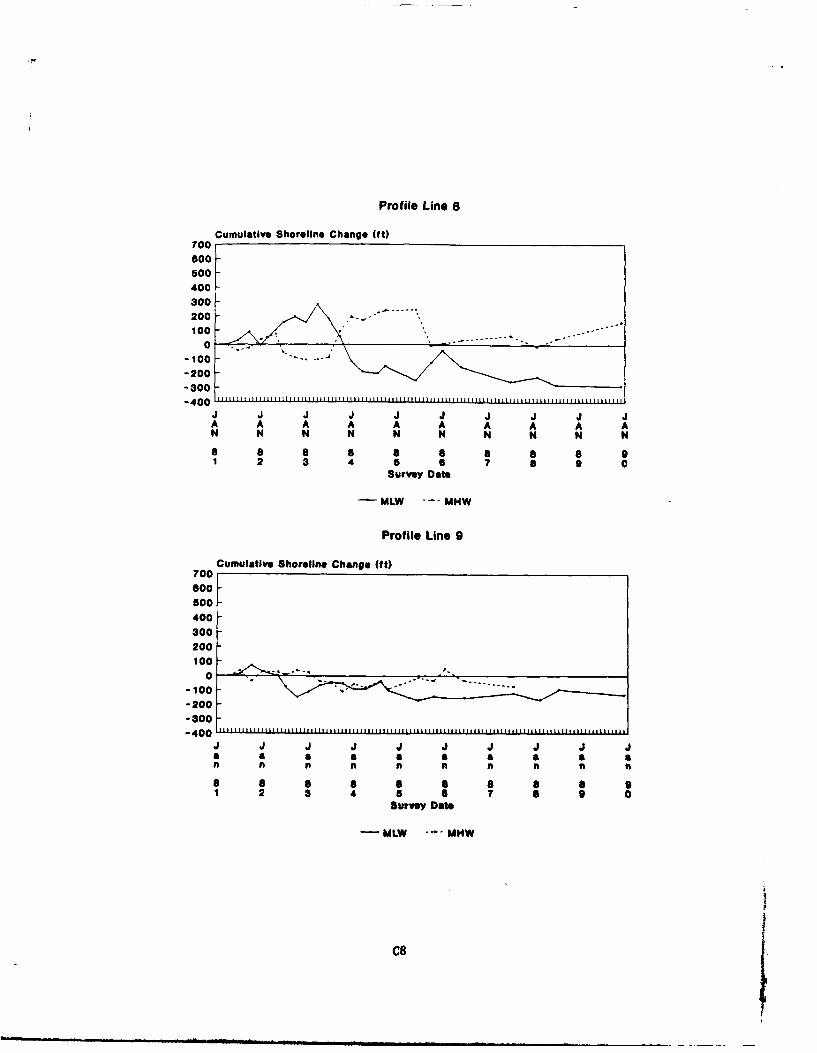
Profile Line 8
Cumulative Shoreline Change (t)TOO
600 -
500
400
200-200 -1 0 0 " "0 ", . . , ~ ~-- -------- o .o -- " ° "
-100 -" . .." ,- 2001
-300-400 '1
J J J J J J J J J JA A A A A A A A A AN N N N N N N N N N
a a a a a a a a a 91 2 3 4 5 6 7 a 9 0Survey Date
-MLW --- MHW
Profile Line 9
Cumulative Shoreline Change (ft)700600500
400300
200100
- 100 " " P'" ""... ......
-100 -
-200-300-400 111i111111 II 111111 1111 I11 111111111 111 Illilll|~l~l| lllll||lll 1111111 ||L|||l111111111 11|1 |||l ||| I|*
J1 J J J1 J J1 J J J Ja a a a a a a a a an n n n n n n n n n
8 a 8 8 a a a 91 2 3 4 5 a 7 5 9 0
survey Date
-MLW --- MHW
C8
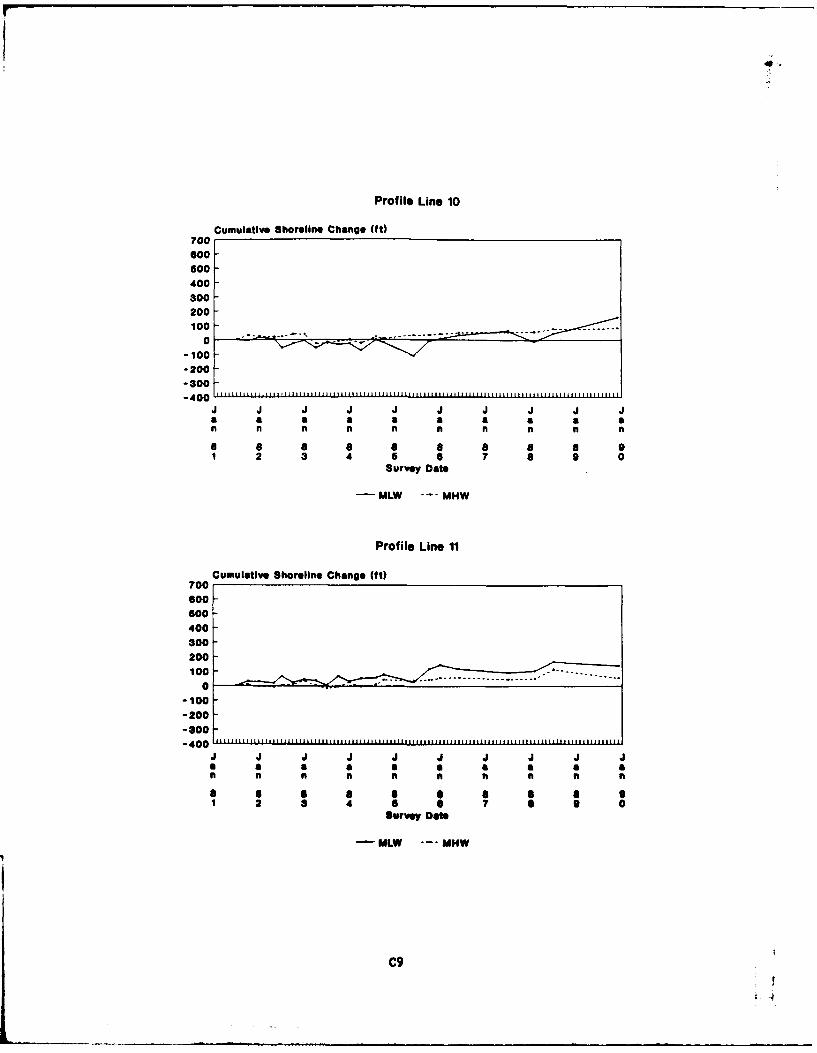
Profilie Line 10
Cumulative Shoreline Chang* (It)700600-500-400-300200100
-100-200
-800
a a a a a a a a a afn n ntf t f t f n
1 2 3 4 5 6 7 a 9 0Survey Date
-MLW --- MHW
Profile Line 11
Cumulative Shoreline Change 00t700Go00500400300-200100 ------- -
-100-200--800-
a a a a a a an ii n nt t nt n nft
II a a a a a 4 a 91 2 3 4 5 0 7 6 3 0
Survey Date
MLW --- MHW
19
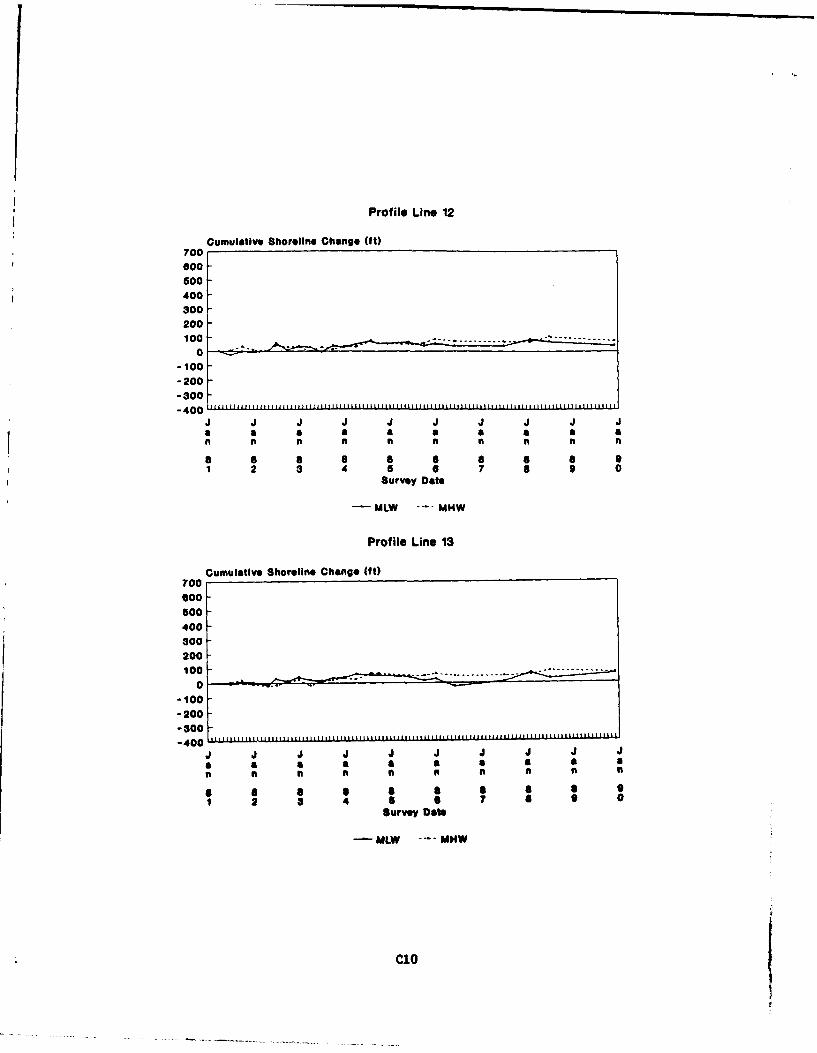
Profile Line 12
Cumulative Shoreline Change It)700
500400300200
0
-100-200-300
ii n n n n ni v i i v
1 2 3 4 5 a 7 a 9 0survey Date
-MLW -- MHW
Profile Line 13
Cumulative Shoreline Change (ft1)
To
400300200
0210 5
-200 W
-300dF
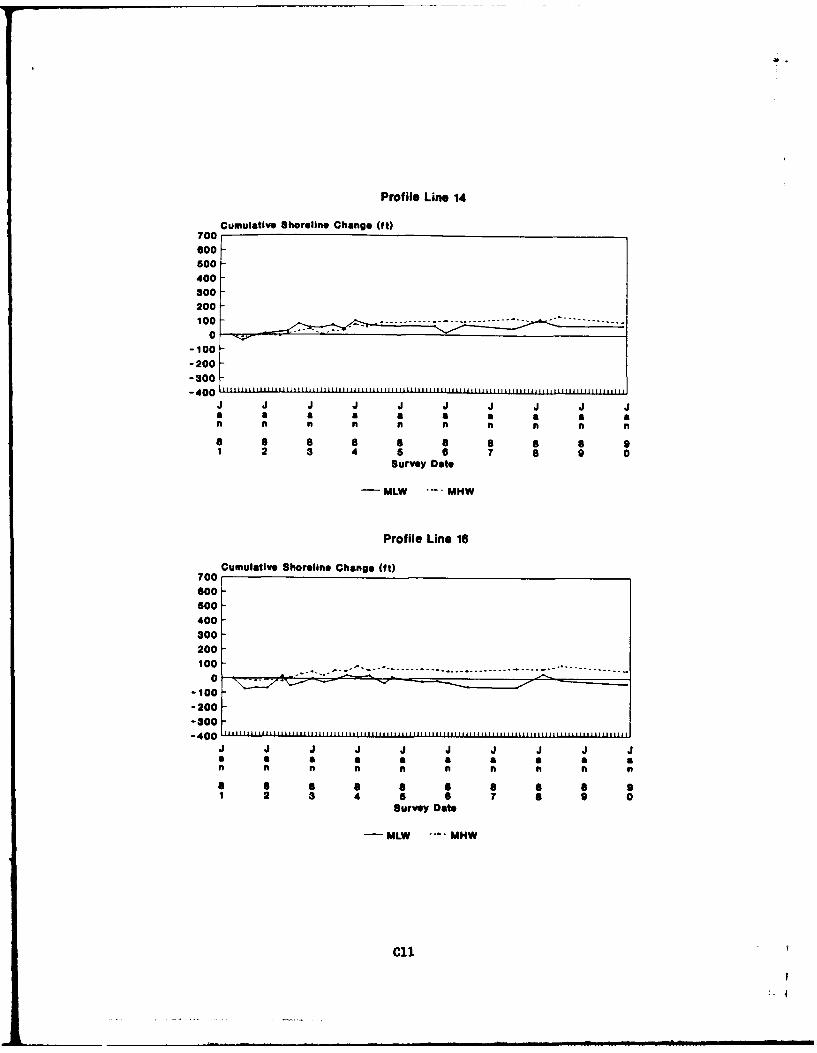
Prof Ile Line 14
Cumulative Shoreline Change (ft)700G00500400300200[
10
-100-200-300-400
a a a a a a a a a an n n n n n n n no a a a a a a 81 2 3 4 5 6 7 a 0 0
Survey Date
MLW -- MHW
Profile Line 16
Cumulative Shoreline Change (ft)700Goo-500400300200
10 -
-100-200-300F
a a a a a a a a a an n n n n n n ni
a a a a a a a a a 91 2 3 4 5 6 7 a 9 0
Survey Date
MLW --- MHW
cil
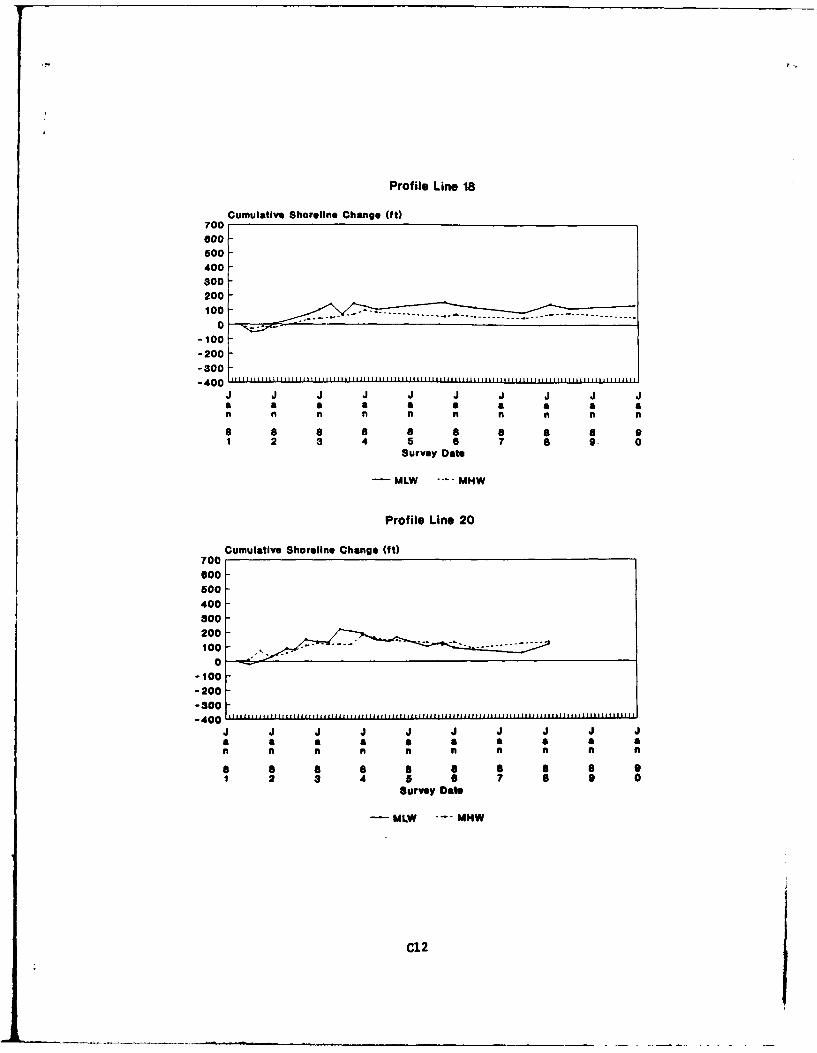
Profile Line 18
Cumulative Shoreline Change (ft)7006S00
500
400300
200
100
-100-200-300
J J J J J J J J J J
a a a a a a a a a an n n f n n n
a 8 8 8 8 8 91 2 3 4 5 6 7 a 9 0
Survey Date
MLW --- MHW
Profile Line 20
Cumulative Shoreline Change (ft)700600500400300200100 - -- --------------
0
-o100-200-300-400 ..................
gait] 1uu1 puulupuhh~lllhhll~hh hu~l
J J J J J J J J J J
a a a a a a a a a an n n ni n nI n n n
a 8 a a a a a a 91 2 3 4 5 0 7 S 9 0
Survey Date
-MLW "-" MHW
C12
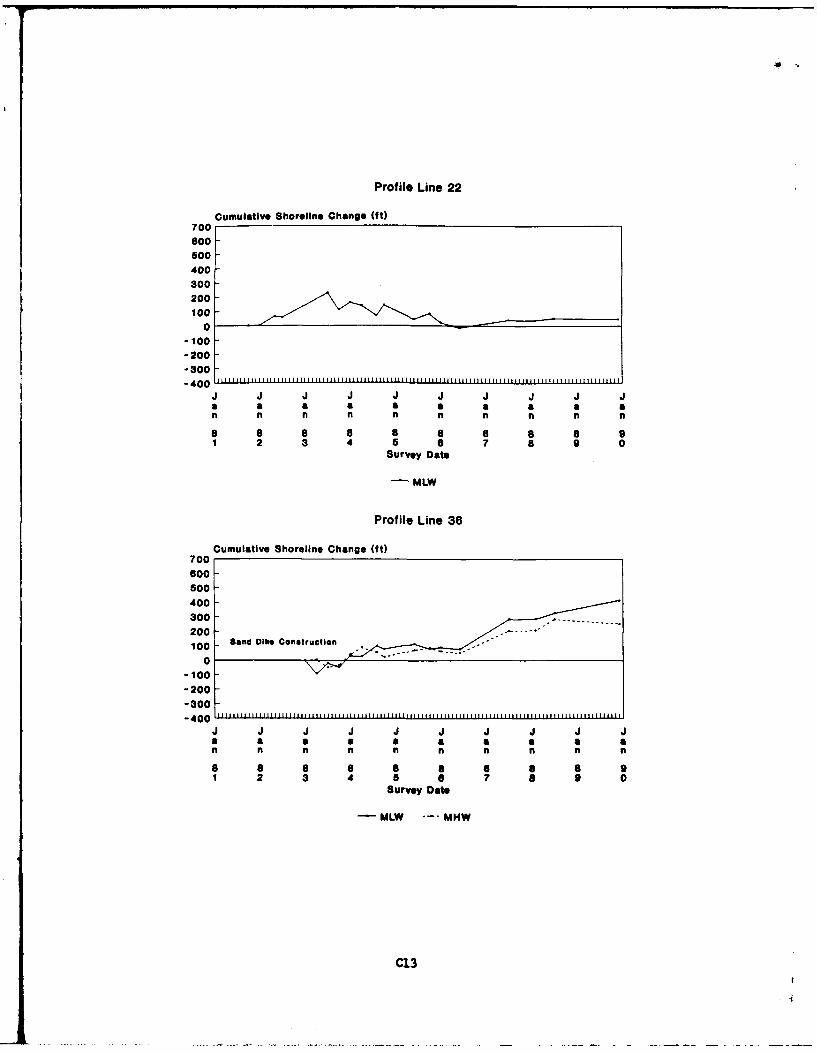
Profile Line 22
Cumulative Shoreline Change 0t)700800-500400300200100
0-100-200-300-400
a a a a a a a a a an n n n n n n n n n
6 a a a a a a a a 91 2 3 4 5 6 7 a 9 0
Survey Date
- MLW
Profile Line 36
Cumulative Shoreline Change (ft)700600500400300 -
100 Se11nd Dike Consatruction --- --
0-100-200-300-400
a a a a a a a a a an n n n n n n n n n
a a a a a a 6 a a 91 2 3 4 a a 7 8 9 0
Survey Date
-MLW --- MHW
C13
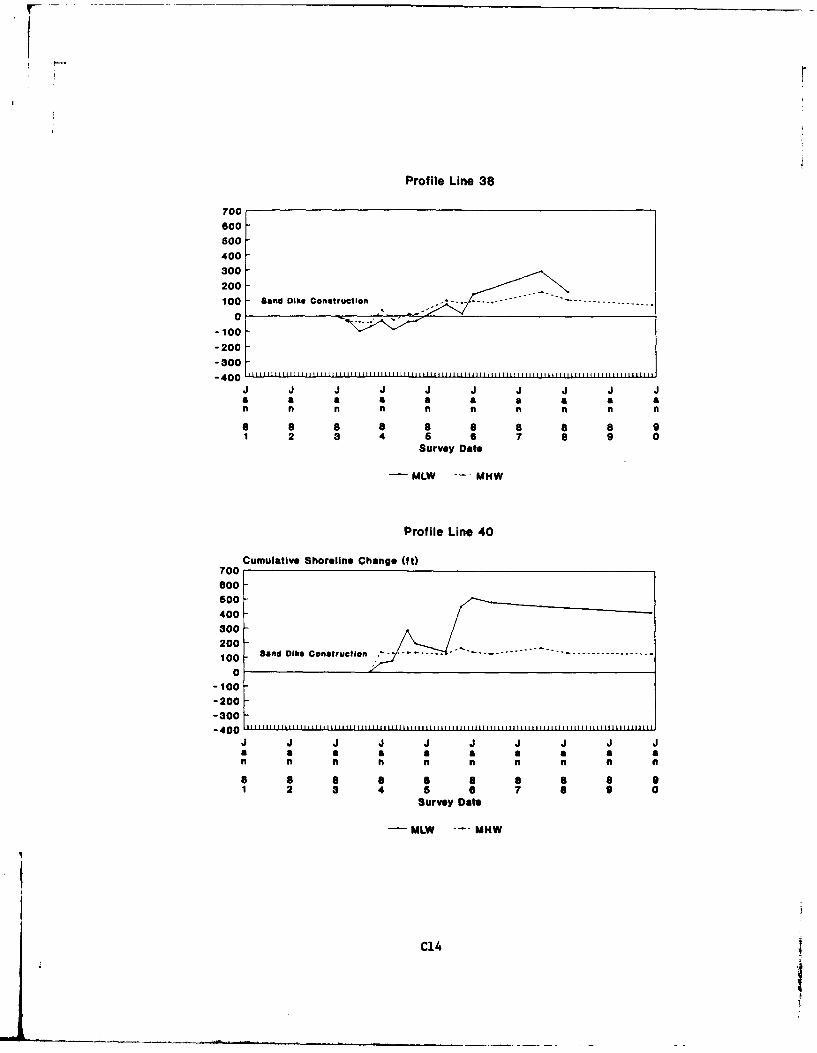
Profile Line 38
700
600500
400
300 -
200100 Sand Dike Construction ---. ----- ------
0-100-200-300
J J J J J J J J J Ja a a a a a a a a an n n n n l n n n n
a S 8 a 6 8 8 a 91 2 3 4 5 6 7 8 0
Survey Date
MLW --- MHW
Profile Line 40
Cumulative Shoreline Change (ft)700600
500 -400300200 -and Dike Con-t-u---n .. . ..------------------- -----
0-100-200-300-400 .1iiiili11 111111 ill ltiii i 1111 l ll ll llllllhlillillllllllll i ii 11111 IIitl ttli tlil 111lii lll
J J J J1 J J J J J Ja a a a a a a 'a a an n n n f n n n n8 a a1 2 3 4 5 6 7 a 9 0
Survey Date
-MLW --- MHW
C14
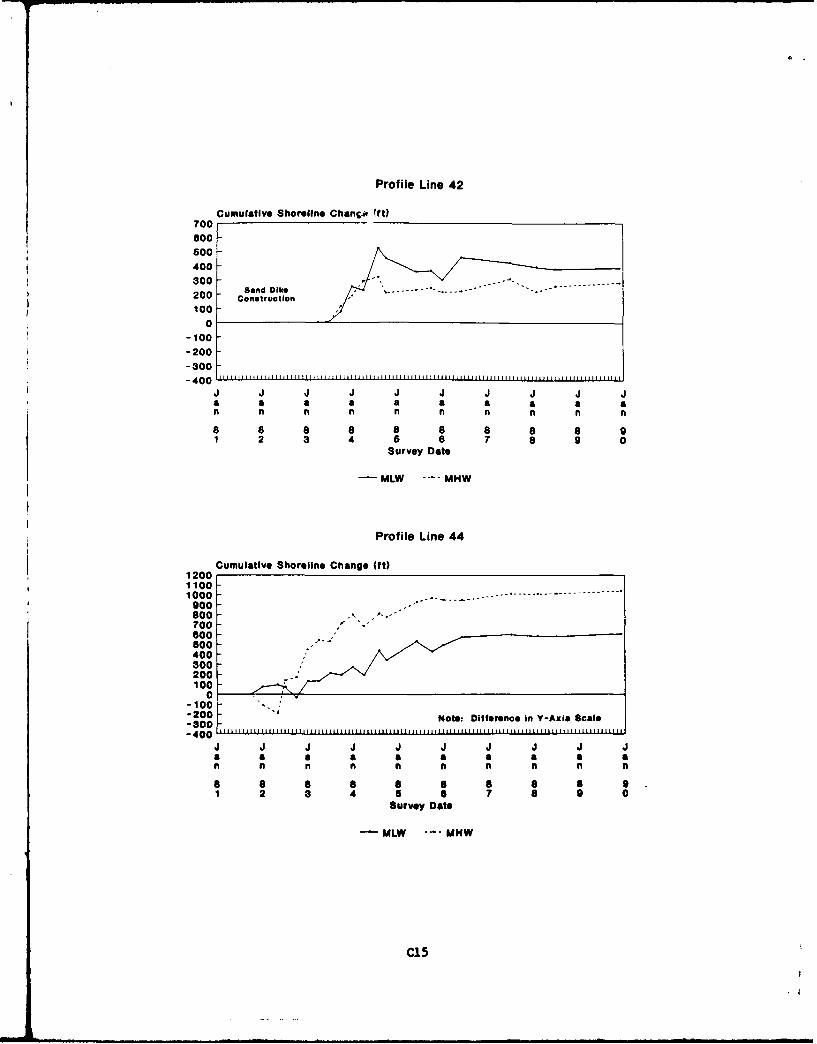
Prof ile Line 42
Cumulative Shoreline ChancA* ftt)700600500400300200 -Construction100
0-100-200-3800
a a a a a a a a a an n n n n n n n n n
8 8 a 8 8 8 8 8 a 91 2 8 4 5 6 7 a 9 0
Survey Date
MLW -- MHW
Profile Line 44
120Cumulative Shoreline Change (ft)
11001000 - - - ----------
900800 - -.
700600S00 -- --
400800200100
0-100 *
-200 NotS. Difference in YAi cl
-800 ...
n n n n n t i n n n
a a a S a 9 S a a 9.1 2 3 4 6 6 7 a 9 0
Survey Date
-MLW --- MHW
C15
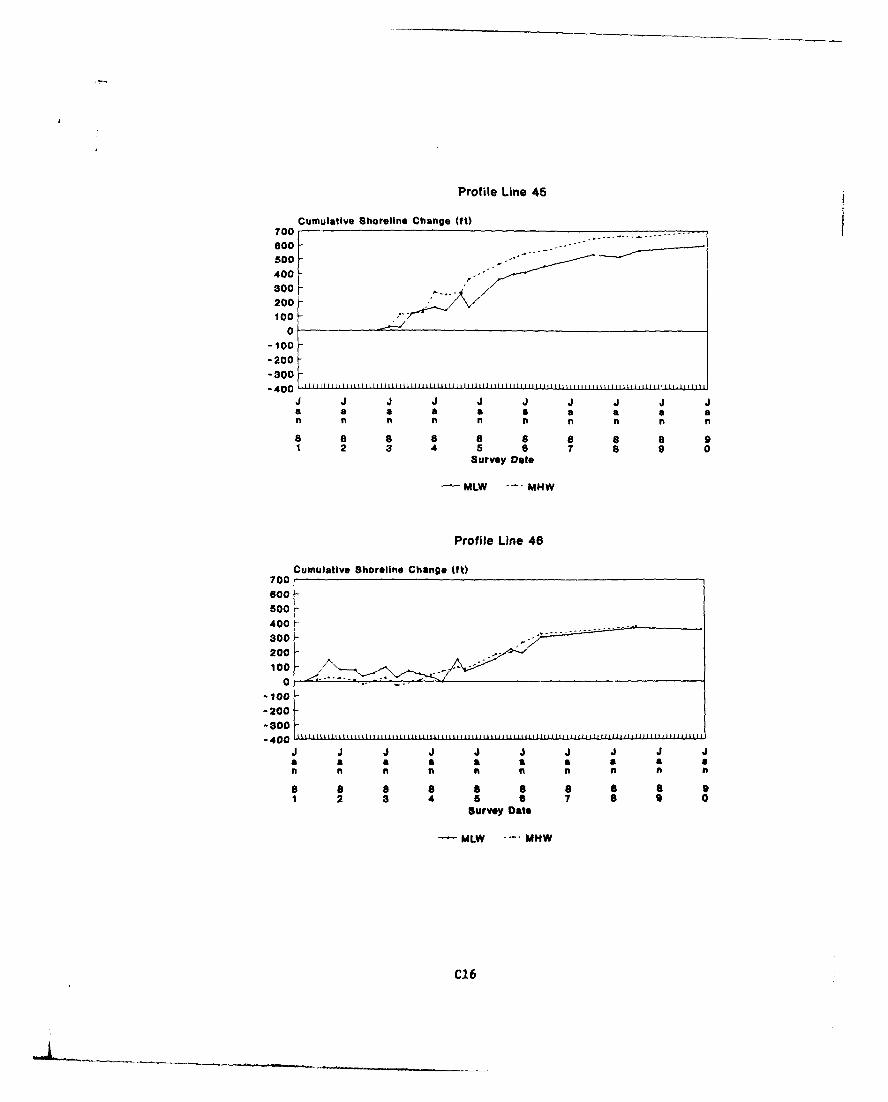
Profile Line 45
Cumulative Shoreline Change (ft)700
200300
100
0-100 F- 100
-200
-300
-400 .....I MiUiI Il1 I iift i ll1 t Mlili t tlll1l111 1 t till llt iL1I11I1 lI1L1I1
J J J J J J J J J Ja a a a a a a a a
1 -1 - n n n
a 8 8 8 a 8 92 3 4 5 6 7 8 9 0
Survey Date
- MLW --- MHW
Profile Line 46
Cumulative Shoreline Change (tt)
700
600
500
400
300 ,
200
-100
-200
-300
J J J J J1 . J .1 Ja a a a a a a
n n n n n I n
8 8 8 a a a a a1 2 3 4 5 6 7 a 9 0
Survey Date
MLW --- MHW
C16
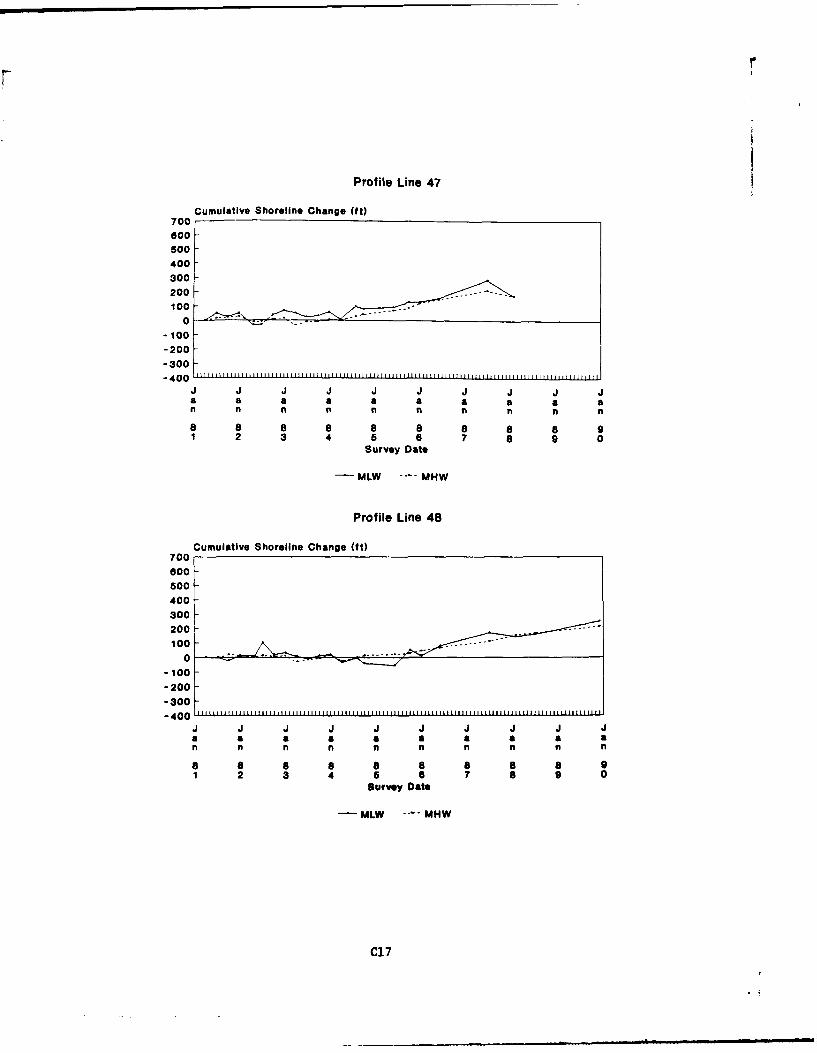
r
Profile Line 47
Cumulative Shoreline Change (ft)
70060
500
400
300200-
1 0 ....- -.-- - -
-100
-200
-300
-400 .. .......... 111............ .....ii ......1ii 1
J J J J J J J J J Jn n n n n n n n n
a 8 8 8 8 8 8 8 8 91 2 3 4 5 6 7 8 9 0
Survey Date
MLW - MHW
Profile Line 48
Cumulative Shoreline Change (ft)700
800500
400
300200
10 -~ ------~-100
-200
-300-400 [iittllJ it [t ll li uu u tutlii i tilll l I ittJlJItu it upi tttupll ii iltlilil~11Jl
J J J J J9 J9 J9 J J J
8 8 8 8 8 91 2 3 4 5 6 7 a 9 0
Survey Date
MLW --- MHW
C17
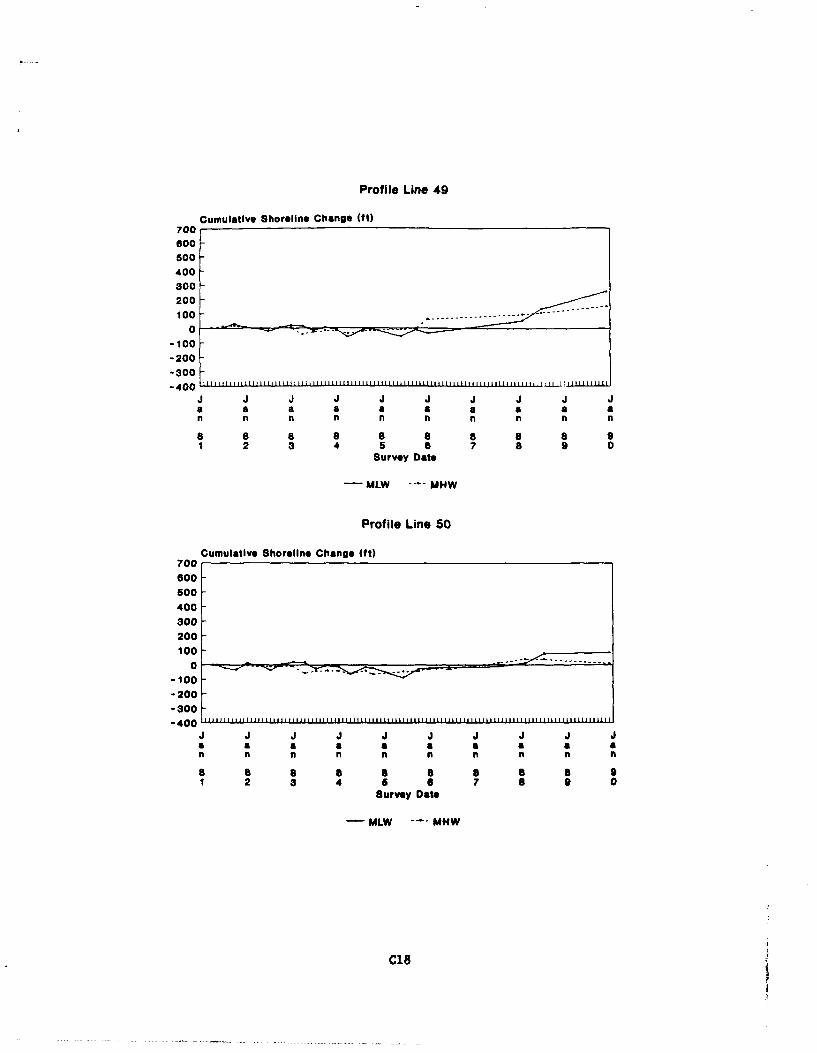
Profile Line 49
Cumulative Shoreline Change (ft)700600500
400300200
-----------------------------------100
-100-200-300
J J J1 J J .1 J J Ja a a a a a a a a a
fl n n fl n n n I
8 8 8 8 8 8 8 8 8 91 2 3 4 5 8 7 8 9 0
Survey Date
- MLW -. MHW
Profile Line 50
Cumulative Shoreline Change (ft)700600
600
400300200100
-100-200-300
J J J J J J J J J1 J
a a a a a a a a a an n n n n n n n n
8 8 8 8 S 8 8 S 8 9
1 2 3 4 a 0 7 0Survey Date
MLW --- MHW
C18
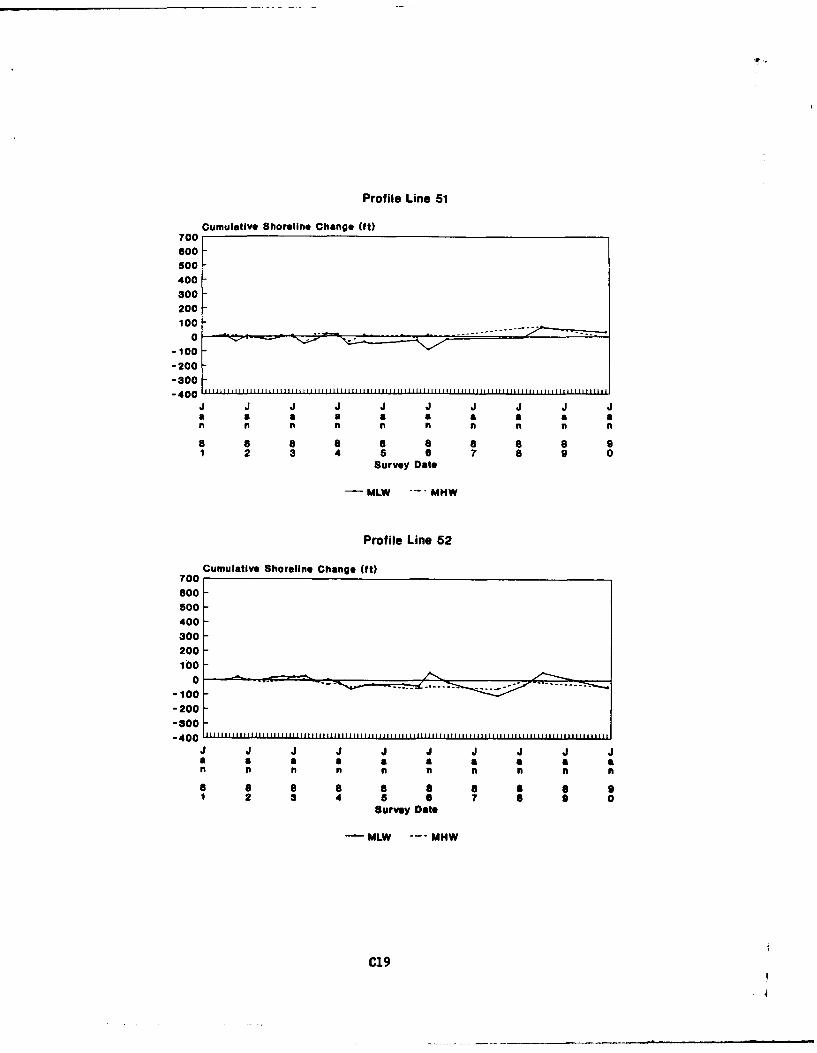
Profile Line 51
Cumulative Shoreline Change (ft)700
00500
400
300
200100 .
-O0
- 400J J J J J J1 J J J J
a a a a a a a a a an n 1 n n n n n n
8 8 8 8 6 8 91 2 3 4 5 6 7 a 9 0
Survey Date
-MLW .... MHW
Profile Line 52
Cumulative Shoreline Change (ft)700600500400300200
0-100-200-300
J J J J J J1 J J1 J Ja a a a a a a a a a
n n n n n n n n i
8 a a a a a a a 6 91 2 3 4 5 6 7 a 9 0
Survey Date
MLW -- "MHW
C19
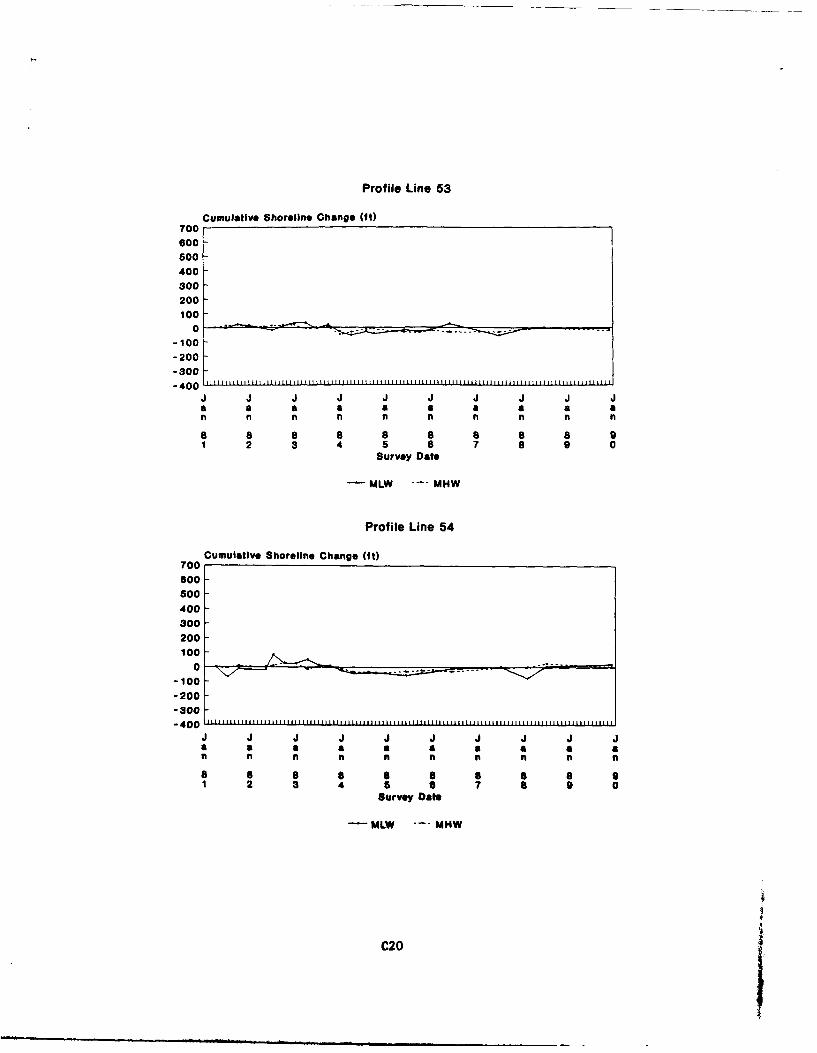
Profile Line 53
Cumulative Shoreline Change (ft)700600
500400300200100
0--100-200-300- 4 0 0 ........... ...........
J J J J1 J J J J J .a a a a a a a a a a
n n n n n n n n n I
8 a 8 8 8 8 8 8 91 2 3 4 5 6 7 8 9 0
Survey Date
MLW .... MHW
Profile Line 54
Cumulative Shoreline Change (ft)700600 I
500
400300200100
0 ~ z -------~ -- -
-100-200-300
I40 I~i | I Hia111 1111i1i Ii I Ill I I i II~ it ll t 111|iii11111iiii 1111i1 |li 1i1il1l 1l11i1 li11111 | ll t 1i~
-400 F ...............J J J J J J J J J Ja a a a 1 a a a a a
n n n h n n n n n
8 8 8 8 a a a a a 91 2 3 4 5 6 7 S 9 0
Survey Date
MLW --- MHW
C20
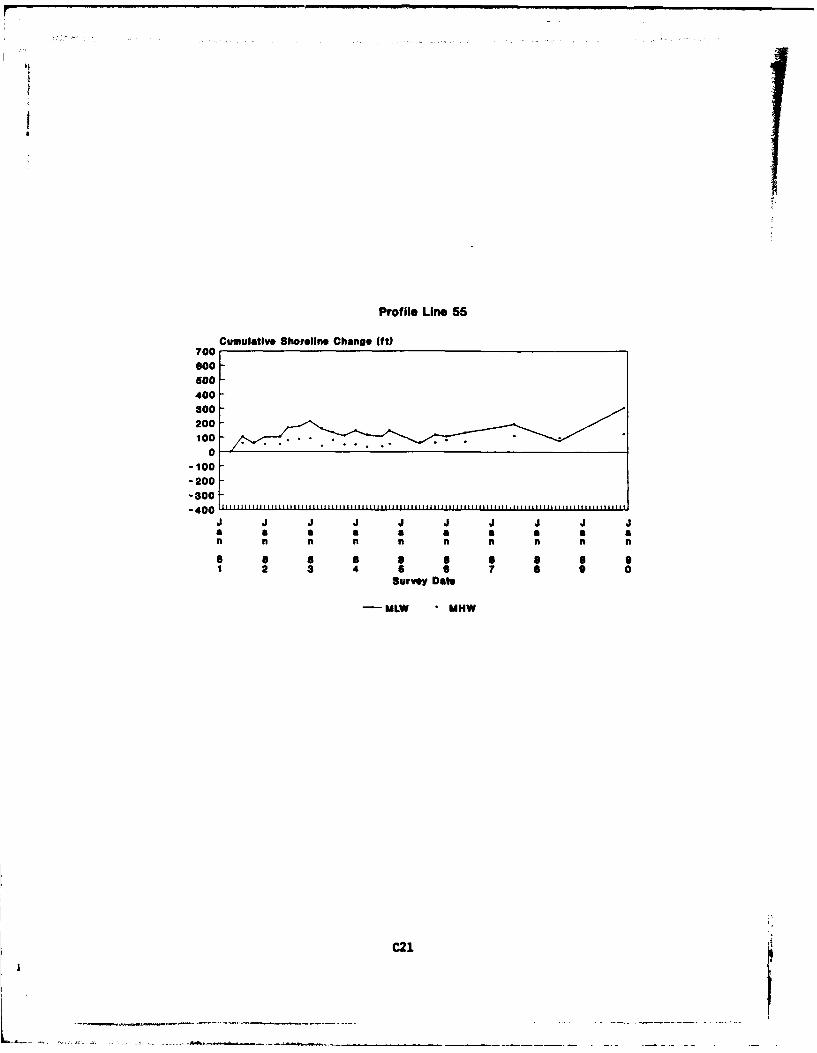
Profile Line 55
Cumulative Shoreline Change (it)700
600-400-300200
0-100-200-300
J 400 J Ja a a a a a a a a a
n n n n n n n n n n
8 a a a a a 8 a 91 2 3 4 6 6 7 a 9 0
Survey Date
MIW MHW
C21
APPENDIX D:
ABOVE-DATUM VOLUME CHANGE
APPENDIX D: ABOVE-DATUM VOLUME CHANGE
1. The program VOLUME-PC was used to calculate above- and
below-datum volume changes along each profile line. VOLUME-PC is
a program for processing beach and nearshore survey data on an
IBM compatible microcomputer, and is a complementary program to
ISRP-PC and ISRPSORT.
2. The "shoreline" is defined as the horizontal intercept
of the profile data with the datum (in this case, MLW). Although
the program actually computes changes in cross-sectional area,
changes are presented as volumes based on a uniform length of
beach (yd3/ft). These volumes were then linearly interpolated by
multiplying over a normalized distance interval of 250 ft to
produce a volume in y& over that "cell."
3. Similar to the shoreline change plots, volume changes
were calculated between successive surveys for each profile line
through time. Plots were made for cumulative above datum volume
changes. Below datum volume changes were computed; however, due
to insufficient offshore data on a large number of profile lines,
these results were not considered in the final analysis.
4. Again, some of the plotted results in the west fillet
area show dramatic increases in volume, which are generally
evident of the construction of the west sand dike and of the old
ebb shoal welding onto this portion of the beach. The profiles
adjacent to Little River, Tubbs, Mad, and Hog Inlets also tend to
show large and erratic volume changes due to dynamic inlet
morphologies.
D3
L ___ _
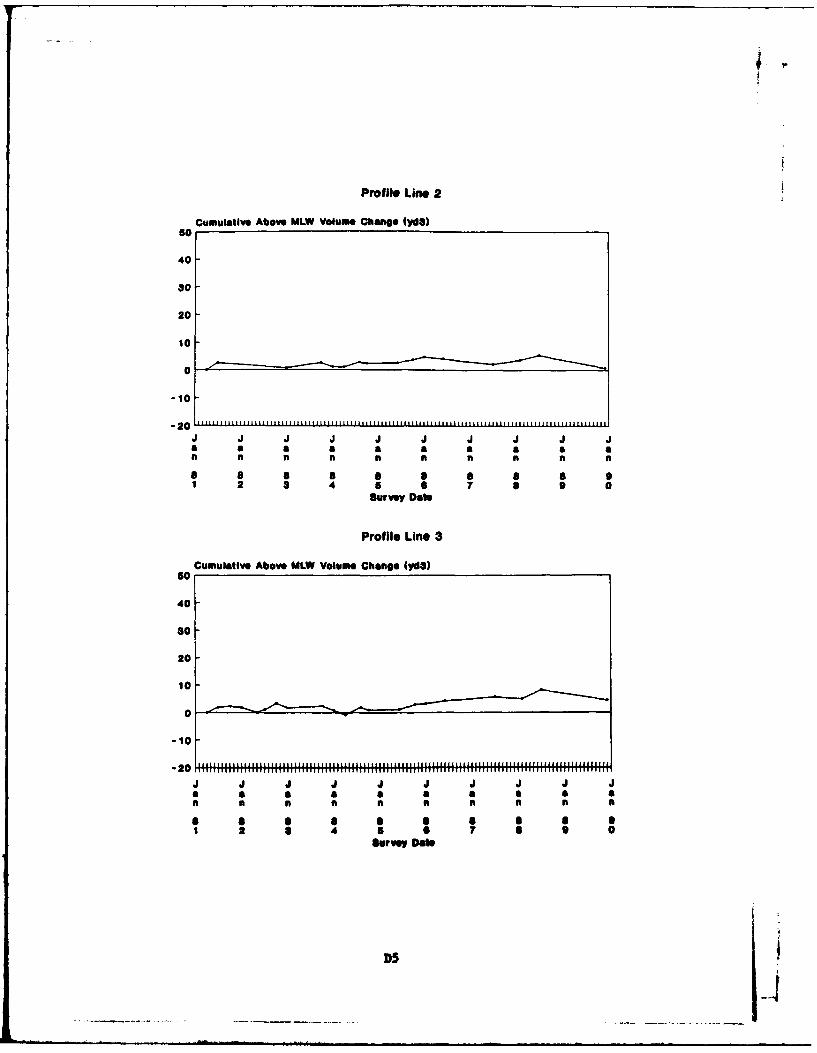
Profile Lie 2
Cumulative Above MLW Volumbe Change (Ya3)s0
40-
30-
20
10
0
-10
a aa a a a a a a a
1 2 3 4 5 6 7 S 9 0Survey Data
Profile Line 3
Cumulative Above MLW Volum Change (yd3)50
40
30-
20
10
0
-10
-20 1 H ! IIII IIIIIIH H H H H H
a a a aa a an a 'nai 8 8 a 0 a 9
1 2 3 4 5 0 7 4 SSurvey Dabe
Ds
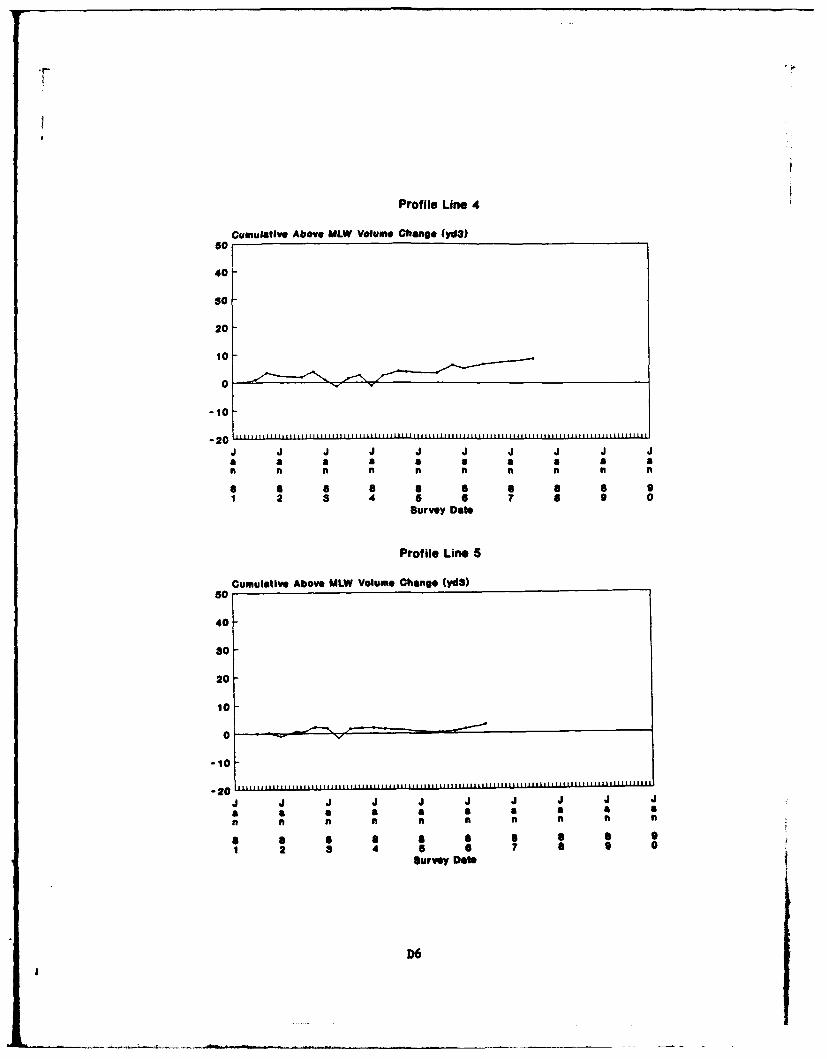
Profile Line 4
Cumulative Above MLW Volume Chang* (yd3)60
40
20
20
-10
-20
I n I I n t It It I
a a a a a a a a a 91 2 3 4 5 a 7 a 9 0
Survey Date
Profilie Line 5
50Cumulative Above MLW Volume Change yd3)
40
30
20
10
-10
-20J J J . J
nt n a ii pi nt nt
a a a a a a a a B
1 2 3 4 5 7 S 9 0Survey Data
D36
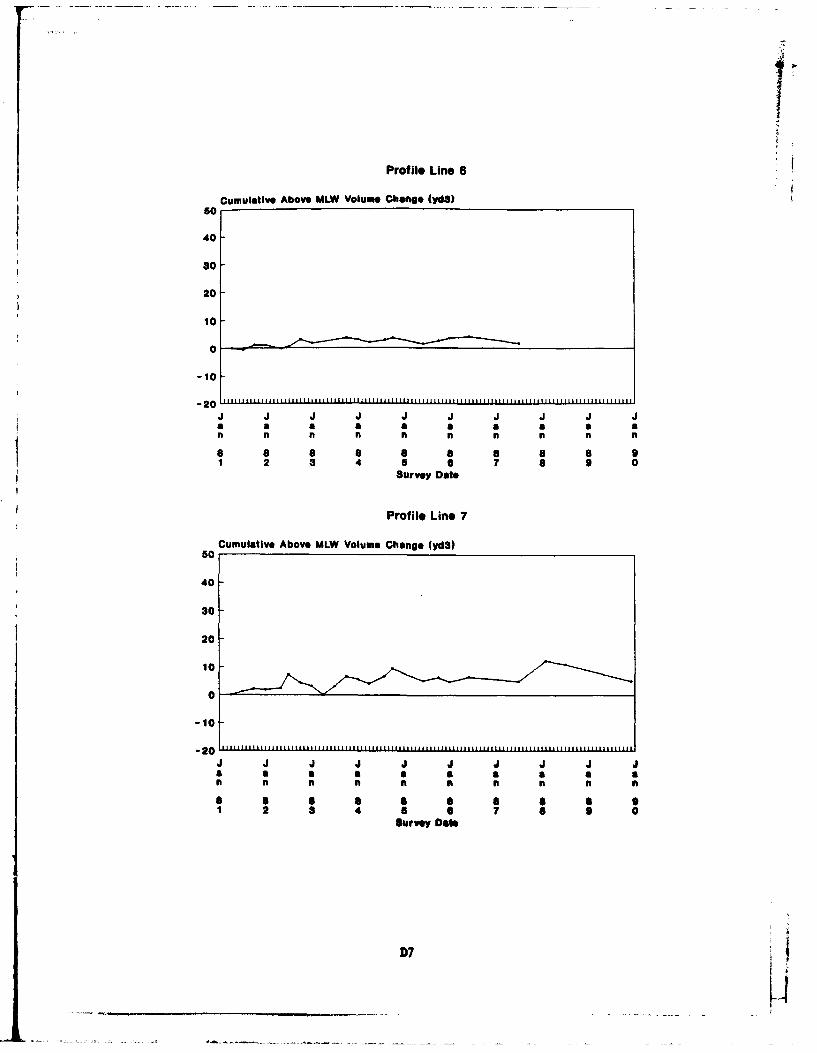
Profile Line 6
cumulative Above MLW Volume Change (Yd3)50
40
30
20
10
0
-10
-20
n a, a a a a a n
S a a a a a a 8 91 2 3 4 5 a 7 6 9 0Survey Date
Profilie Line 7
Cumulative Above MLW Volume Change (yd3)50
40
30
20
10 -......
0
-10
a a 11 a a S a a a 9
1 2 a 4 a e 7 a 9 0survey Date
D7
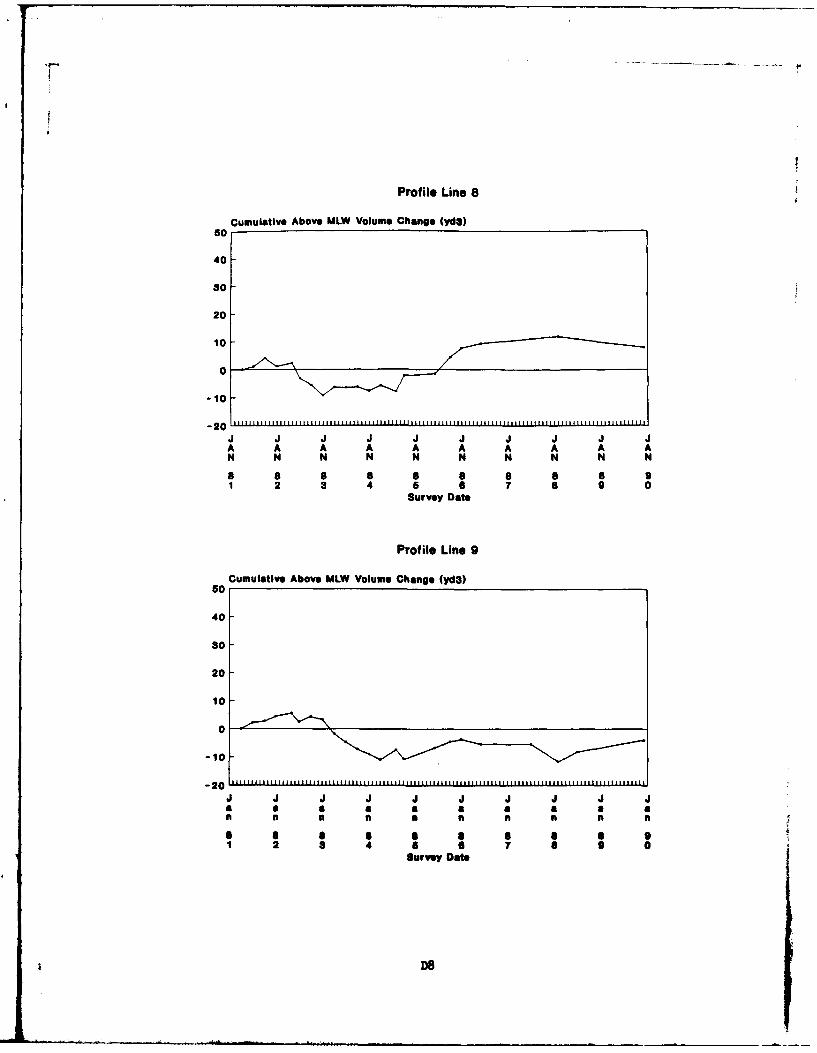
Profile0 Line 8Cumulative Above MLW Volume Change (yd3)
50
40
30
20
10
0
-10
J 20J JA A A A A A A A A AN N N N N N N N N N
8 8 8 8 6 6 a a a 91 2 3 4 5 S 7 6 9 0
Survey Date
Profile Line 9
sCumulative Above MLW Volume Change (yd)
40
30
20
10
0
a a a a 'a 'a a a an n ii n n ni n n n n
S I U S 6 91 2 3 4 a 6 7 a 9 0Survey Date
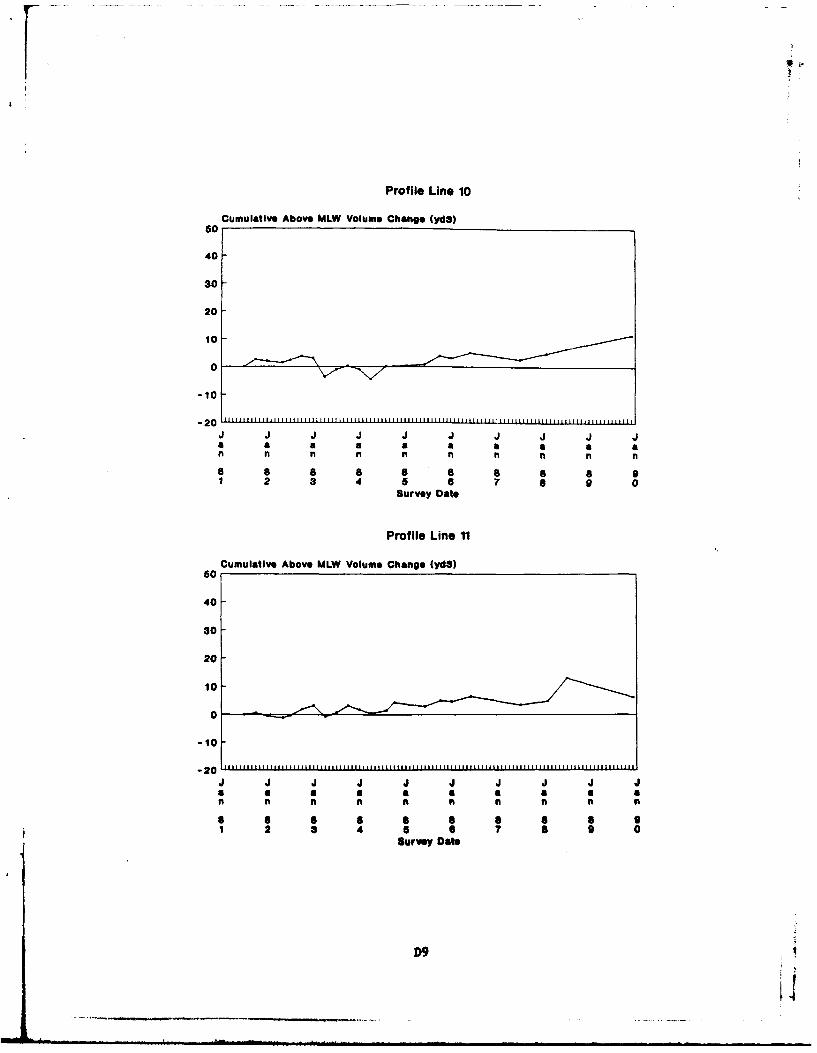
Profile Line 10
Cumulative Above MLW Volume Change (ydS)60
40-
30o
20
10-
0
-20
a a a a a a a a a a
8 a 8 a 6 8 8 a 91 2 3 4 5 6 6 9 0
Survey Date
Profile Line 11
Cumulative Above MLW Volume Change (yd3)s0
40
20-
20
S a a a a 4 a a a 9
2 3 4 5 6 7 8 S 0survey Date
D9
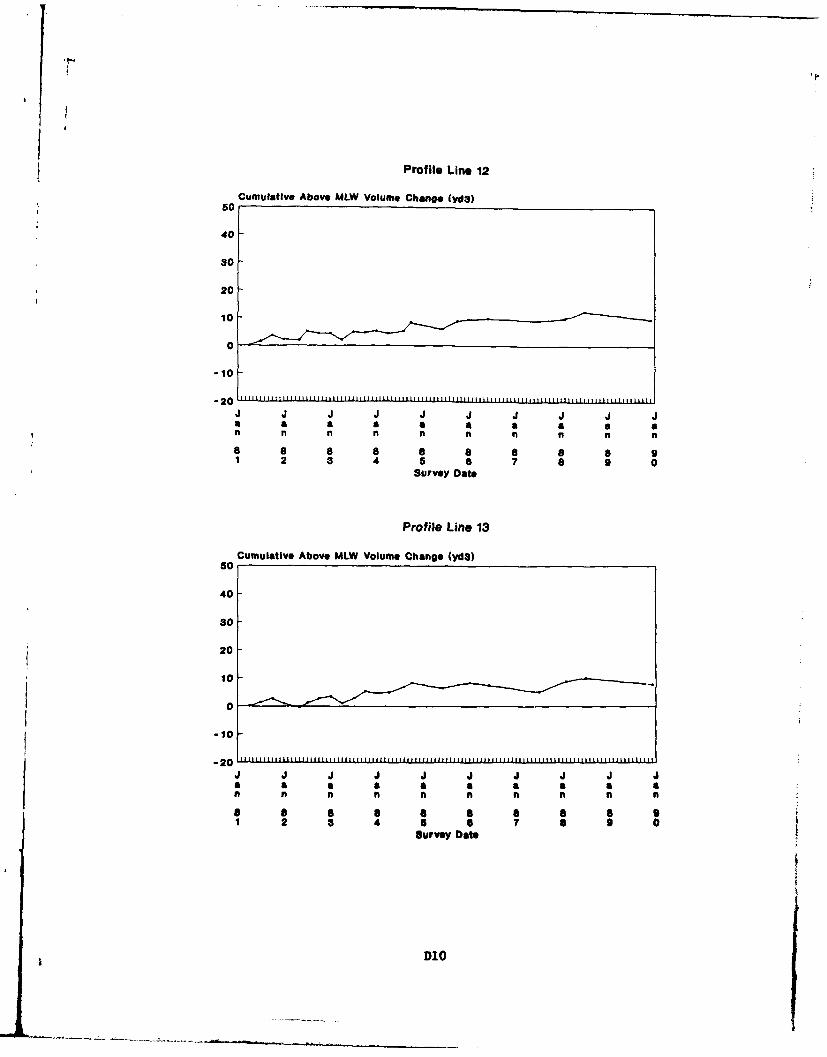
Profile Line 12
Cumulative Above MLW Volume Change (Yd)50
40-
30
20
10
0
-10
S a a a a a a aI I I I n n .
8 8 a 8 a a a a a 91 2 3 4 5 6 7 a 9 0Survey Date
Profile Line 13
Cumulative Above MLW Volume Change (ydS)50
40
30-
20
10
0
-10
n n ii n n n n
8 S S a a a a 91 2 3 4 5 6 9 0Survey Date
D10
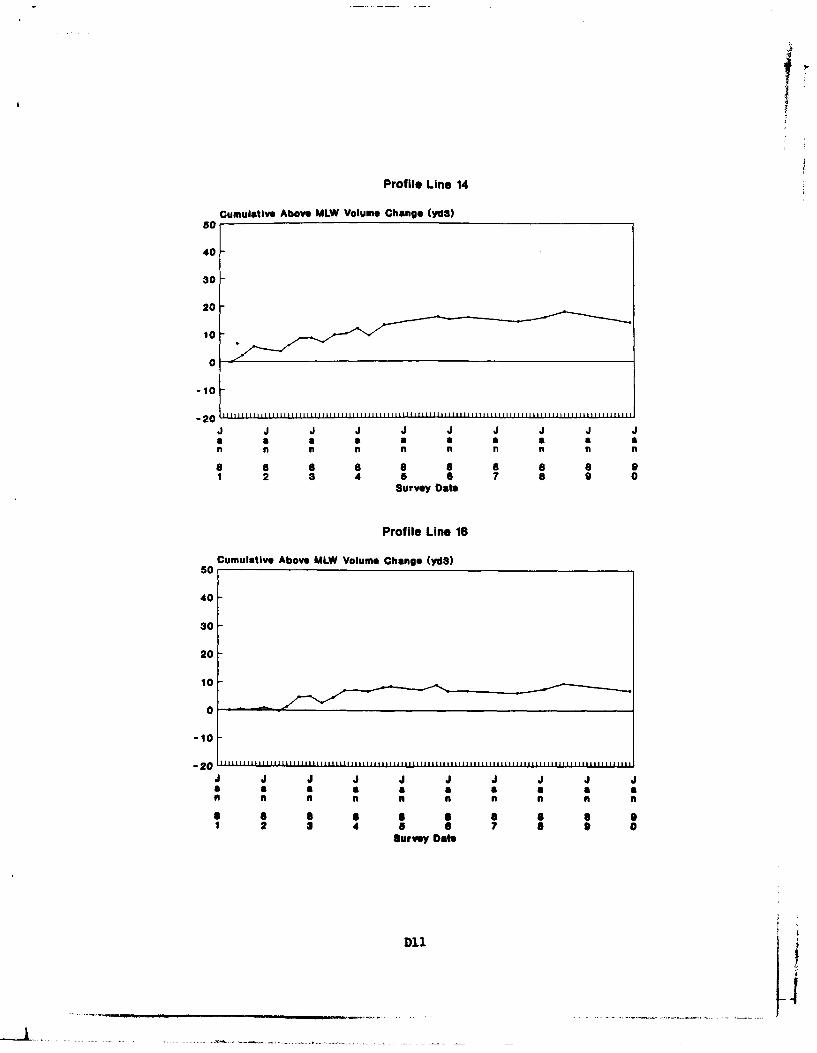
Prof Ile Line 14
cumulative Above MLJW Volume Change (ydS)50
40-
30-
20
10
0
-10
aa a a a a a a a afi n n i n n ni
1 2 3 4 5 6 7 8 9 0Survey Date
Prof ile Line 16
5Cumulative Above MLW Volume Change (ydl)
40
30
20
10
0
-10
a a a a II a a a a 9
1 2 3 4 a a a 8 0Survey Date
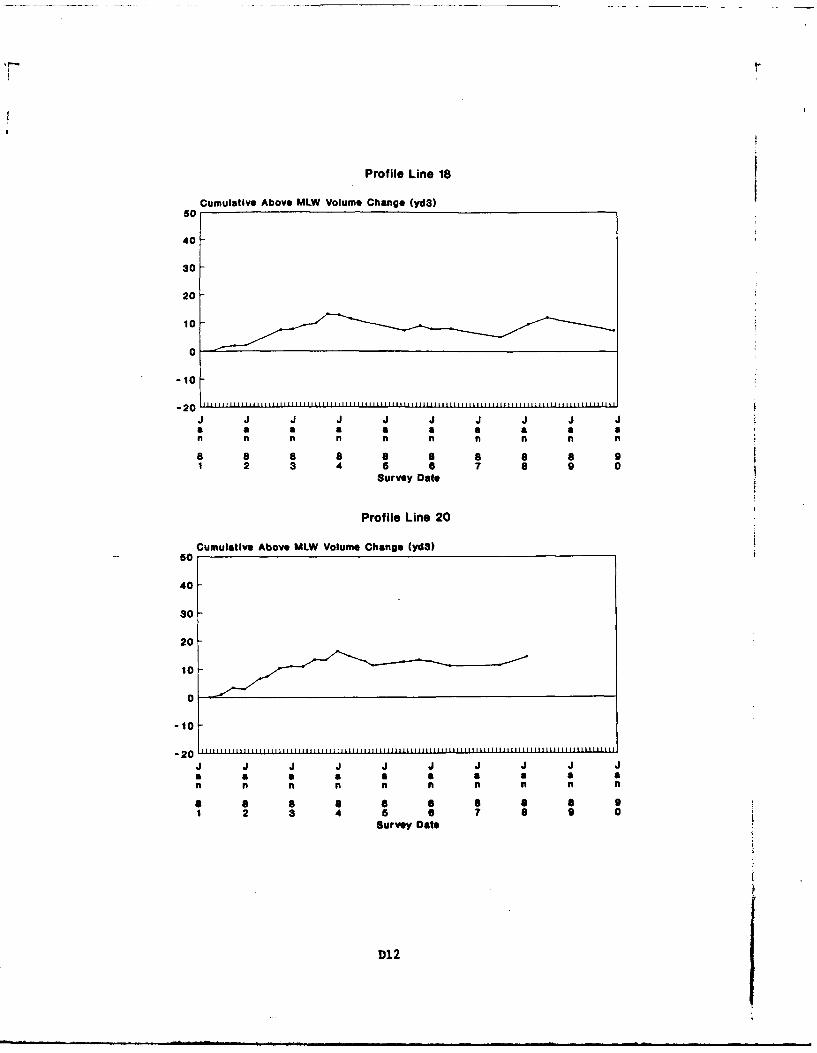
Profile Line 18
sCumulative Above MLW Volume Change (yda)
40
30
20
10
0
-10
a a a a a a a a a an n n n f n n n n
a 8 a a 8 8a 91 2 3 4 5 6 7 a 9 0
Survey Date
Profile Line 20
Cumulative Above MLW Volume Change (yd3)50
40
30
20
10
0
-10
a a a a a a a a a 9
1 2 3 4 5 6 7 S 9 0Survey Date
D12
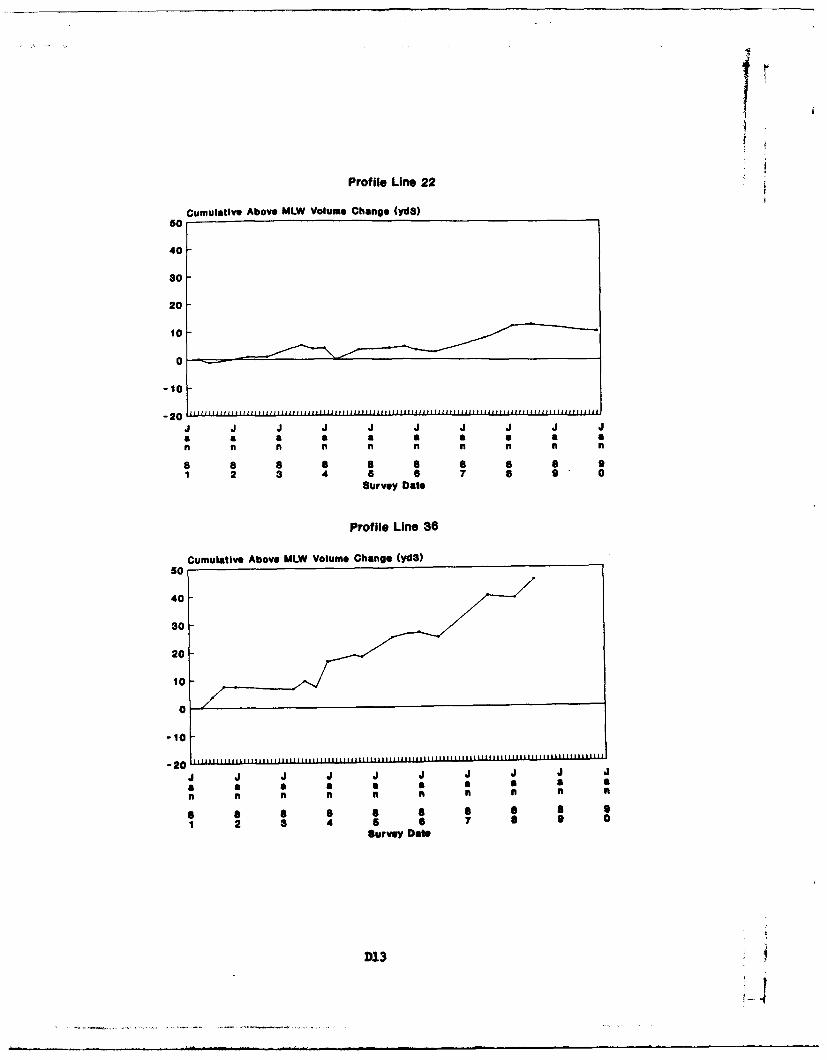
Prof Ile Line 22
Cumulative Above MIW Volume Change (Yda)
50
40-
30
20
10
o
-10
a a a a a a a a a an ii n n n n n n n
a a a a a a a 9 a 91 2 8 4 a 6 7 6 9 0
Survey Date
Profile Line 36
Cumulative Above MLW Volume Change (yd3)s0
40
30
20
10
0
-10
-20
a a a a a a a a a an n n n n n n IN IN ft
a a S 6 8 a a a1 2 3 4 5 S 7 a 9 0
Survey Date
D13
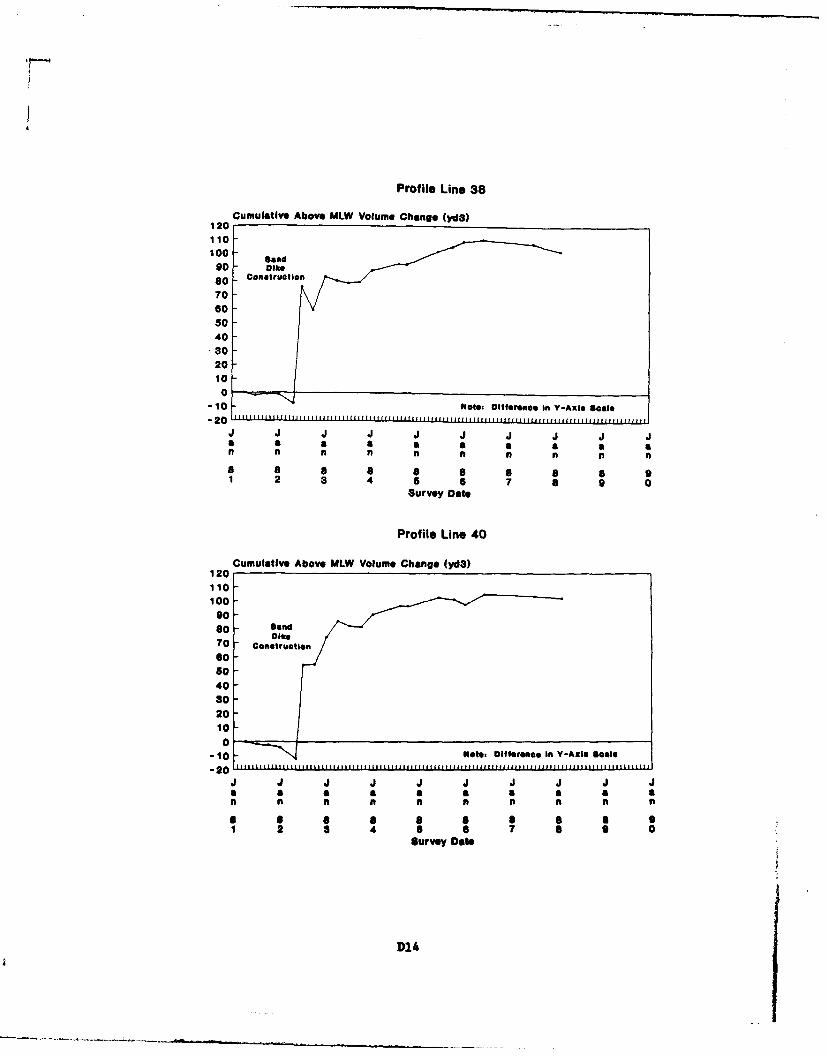
Profile Line 38
Cumulative Above MLW Volume Change fyda)120110100 S and90 - Dk
so-Construcetion70s050403020100 -r
-10 Note- Oitwano. In Y-Ax~s Seale-20
a a a a a a a a a an fi i n~ It fl n n n na 8 a a 8 a a a a 91 2 3 4 5 6 7 a 9 0
Survey Date
Profile Line 40
10Cumulative Above MLW Volume Chang* (0y3)
110100
90so - and70 -Construction
so-
2010
0-10 Note. Difference to Y-Axia seats
-20
a a a a a a a a a an n is n n is n is ns
1 2 3 4 S 0 7 8 9 0Survey Date
D14.
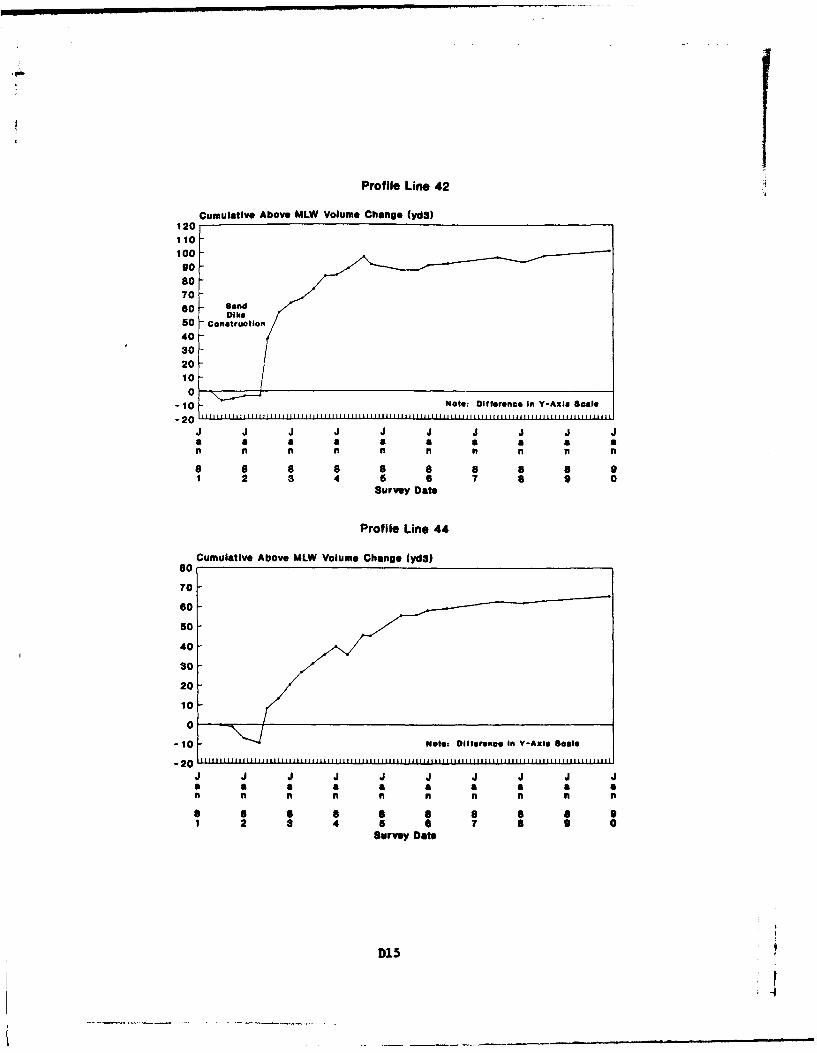
Profile Line 42
Cumulative Above MLW Volume Change (yda)120110;100
70so Sand50 Construction
40
3020100
-10 Note: Dllerence In Y-AxzI Scale
-20J J J J J J J J J Ja ai a a a a a a a an n fn n n i n n n
a 8 8 8 8 a 8 92 3 4 5 6 7 8 9 0
Survey Date
Profile Line 44
Cumulative Above MLW Volume Change (yd3)
s0
70
6o
50
40
s0
20
10
0"
-10 Nota- Dilfferenoe In Y-AxIs Scale
-20 ii I11$II ljl | ||i liii 1111111 11111111 $1.1 I Ill l i 111111i II I| lhll|ll 11111111i|111111i£11i111
J J J J J J J J J Ja a a a a a a a a an n n n n n If n n
a aO 8 a a 91 2 3 4 5 6 7 a 9 0
Survey Date
D15
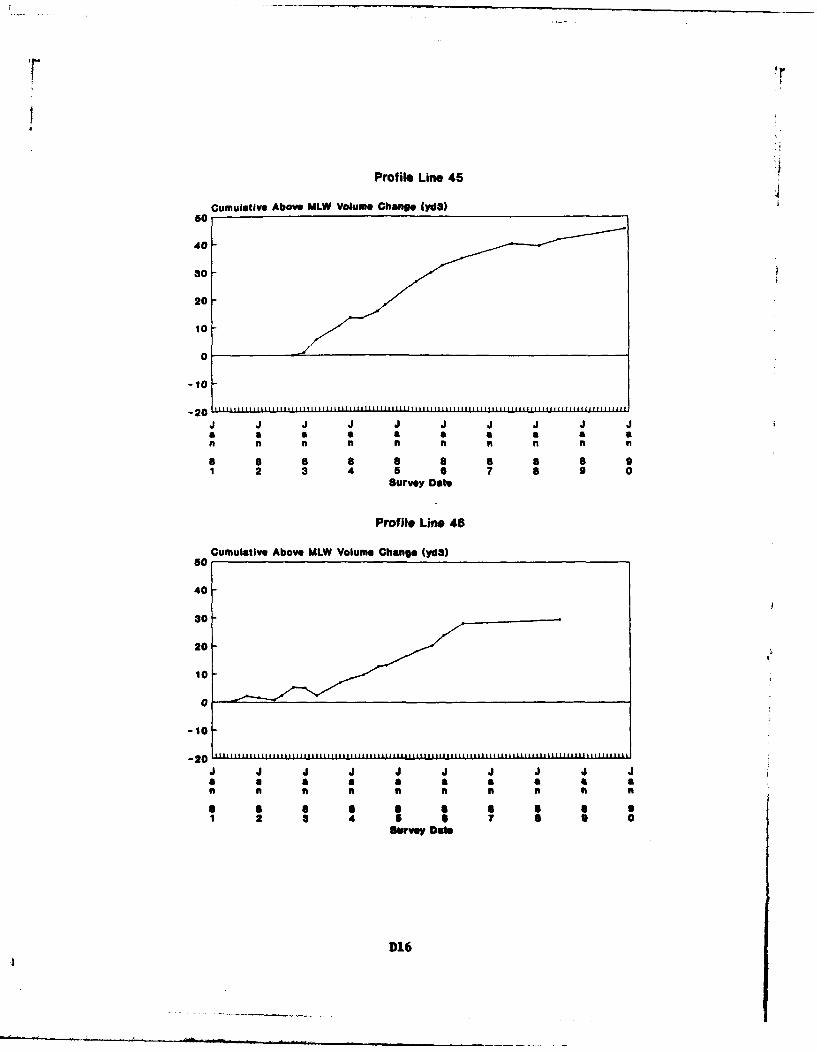
Ir'I
Profile Line 45 1!
Cumulative Above MLW Volume Change (da)50
40
80
20
10
0
-10
20 liii 11111111.1 t t111 1| Illltllltlllll 1l11 i111 1lllll11111111111111 tI illi f 1111£I111 hihhhhhhh li l##
J J J J J J J J1 J Ja a a a a a a a a an n ii n n n n n
S 8 8 8 a 8 8 8 8 91 2 $ 4 5 6 7 8 9 0
Survey Date
Profile Line 46
Cumulative Above MLW Volume Chane (ydS)50
40
80
20
10
0
-10
J J J J J J J J J J
n a n n a a n n4 aa ai a a a 6 6 11 4 a
1 2 a 4 S 6 7 a 0 0Survey DOe
D16
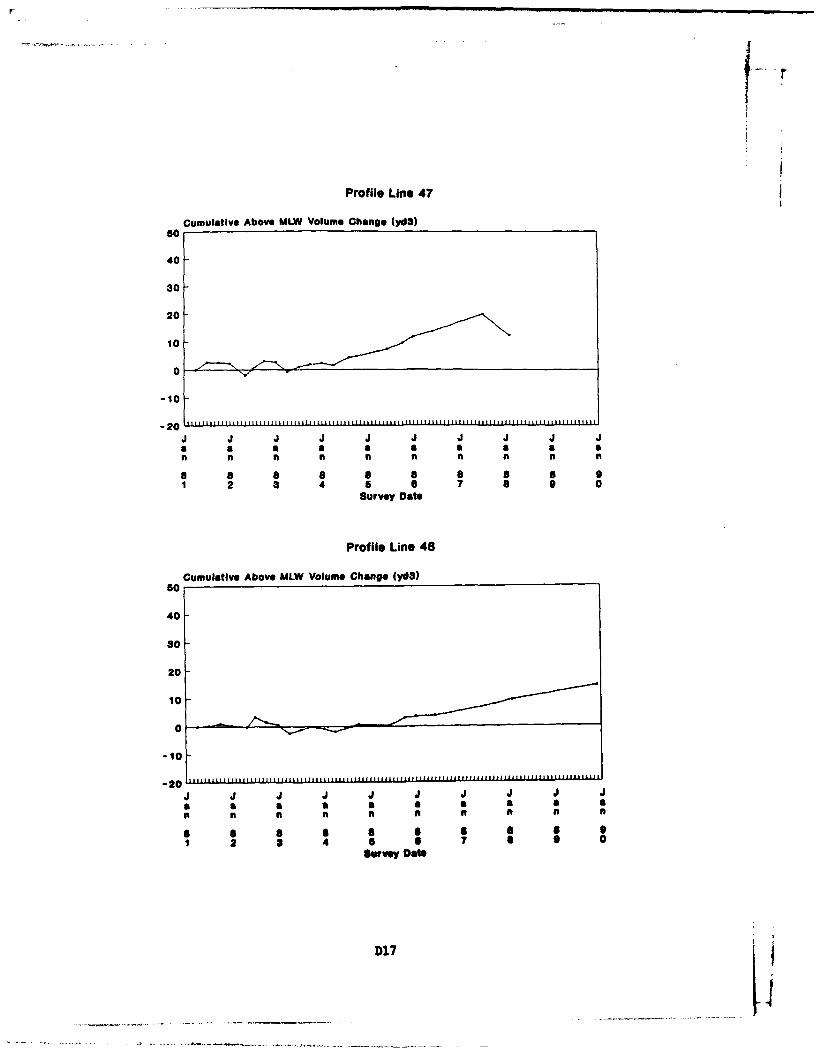
Profile Line 47
Cumulative Above MLW Volume Change (yd3)
40-
80-
20
0 Z -
-10
-20 .......... .
a a a a a a a a a an ft n nt ft nt t nt f n
8 a a a 8 a a a 6 91 2 3 4 5 a 7 a 9 0
Survey Date
Profile Line 48
sCumulative Above MLW Volume Change (yd3)
40
30-
20
10
0
a a a a a, n on an1 2 3 4 7 9 0
survey Dows
D17
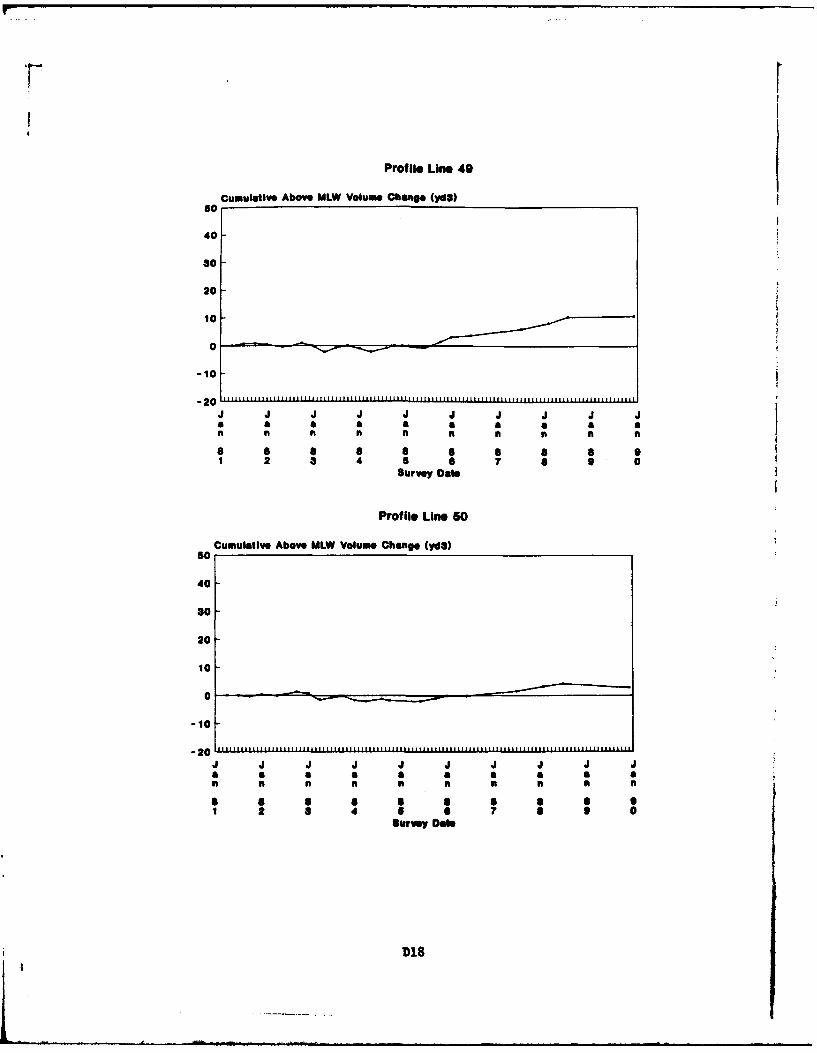
Prof Ile Line 49
sCumulative Above MLW Volume Change (yd3)
40-
20
-10
-20
a a a a a a a a a a
1 2 a 4 5 0 7 a 9 0Survey Date
Profile Line 50
Cumulative Above MLW Volume Change (yda)50
40-
20
10
0
-10
a a . a a a a 9
1 2 3 4 S 4 7 a 9 0Survey Dale
D18
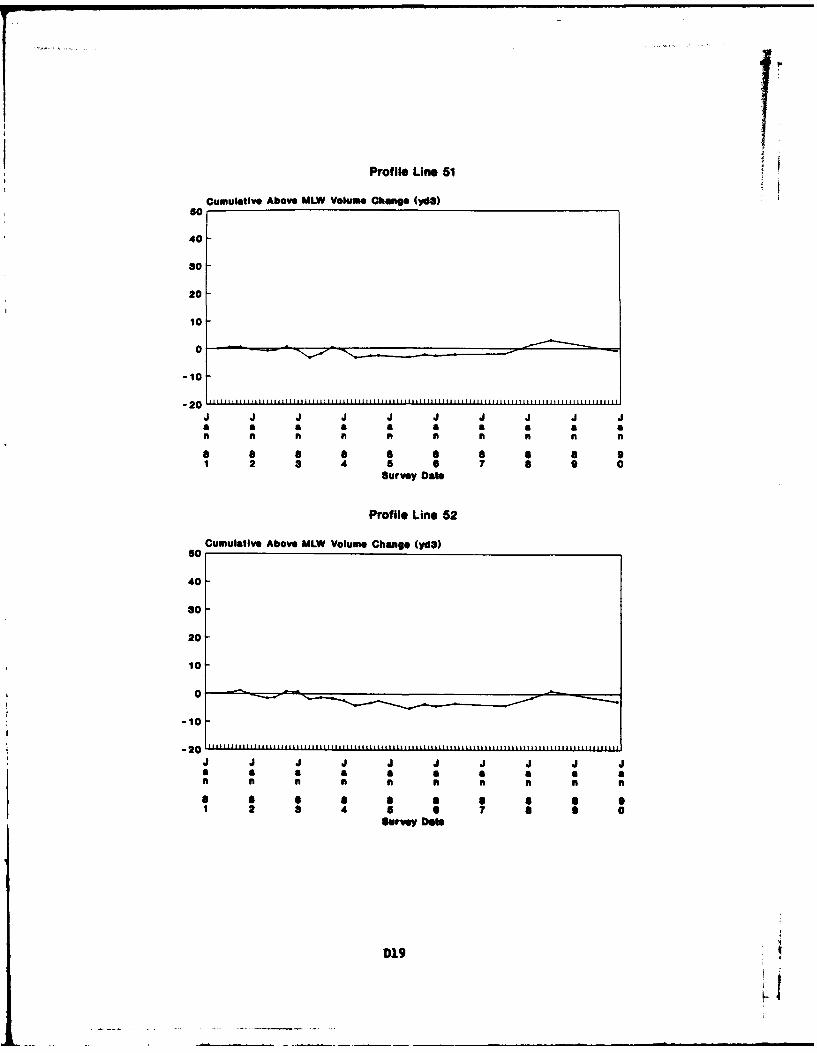
Profile Line 51Cumulative Above MLW Volume Change (yd3)
5o
40
30
20
10
0-
-10
-20 Iiii ii l tilll IIll l llill 111iiliii l iii IIIIII1111 l l li llt 1111 ll 11llllllit1lll1
d1 J J J1 d J J J J Ja a a a a a a a a a
n I n n n It n n n n
S a a a a 8 a a 9
1 2 3 4 5 7 a 9 0Survey Date
Profile Line 52
Cumulative Above MLW Volume Change (yd)50
40
30
20
10
0 --10
-2l0 |II Ill ll 11 illlt llll lill I ll l li ltl tt |t|tllii LtltitTitL|i gi i iiit||iiggg gg g~iEl|g~l
J J J J J J J J J Jn a a n a n a a a aa aI a a a n 4 a a 91 2 3 4 5 0 7 a 9 0
Survey Date
D19
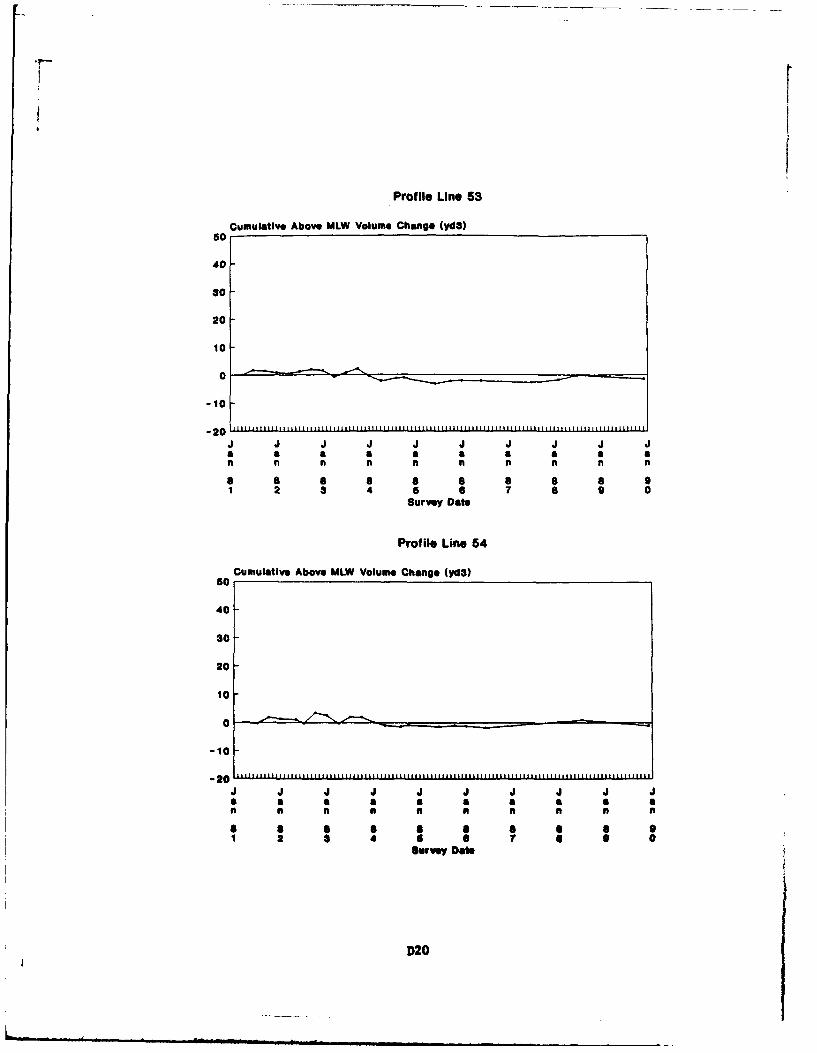
Profile Line 53
Cumulative Above MLW Volume Change (yd3)50
40
30
20
10
0 -
-10
-20 1i111i11 ll tllil 111111111111.11 I l ii 1l 11111 l IIlllillll~ Illilhll ||11ltliil~lll ll 111111
J J J J J J J J J1 Ja a a a a a a a a aI fn n n n ni
a8 8 a82 3 4 5 a 7 a 9 0
Survey Date
Profile Line 54
Cumulative Above MLW Volume Change (ydt)s0
40
30
20
"10
-20
J J J J J J J J J Ja a a a a a a a a an in fi ii n n n i A
1 2 a 4 9 5 7 a 0 0Survey Date
D20
-- -- m mmm, ia~il El lilll mm ml r~a.. mlmlmmm Iii
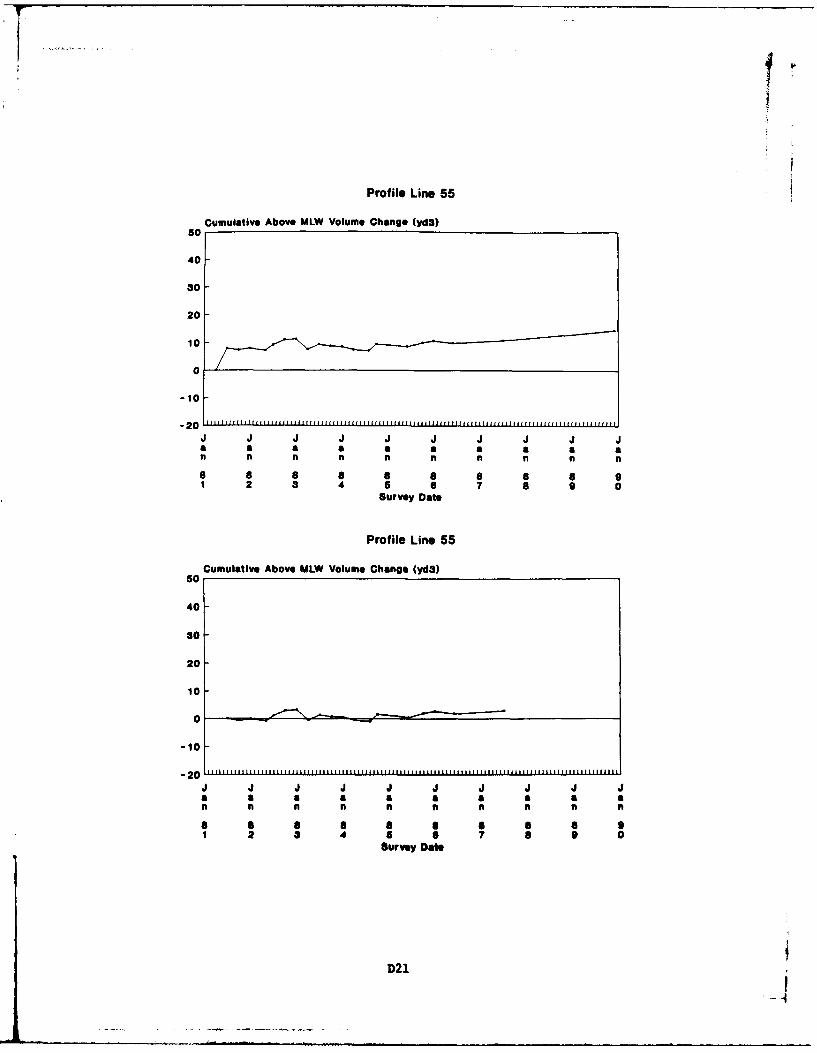
Profile Line 55
Cumulative Above MLW Volume Change (yda)50
40
30
20
10
0
-10
a a a a a a a a a a
n n n n n n n n n
a 6 S 8 a a a 6 91 2 3 4 5 a 7 6 9 0
Survey Date
Profile Line 55
5Cumulative Above MLW Volume Change (yda)
40-
30-
20
10
-10
-20 LWAILWU
a a a a a a a an n n ni ni ni ni n n
a 4 6 a a a a a a 91 2 S 4 5 e 7 a 9 0
Survey Date
D21
APPENDIX E:
BATHYMETRIC CONTOUR MAPS
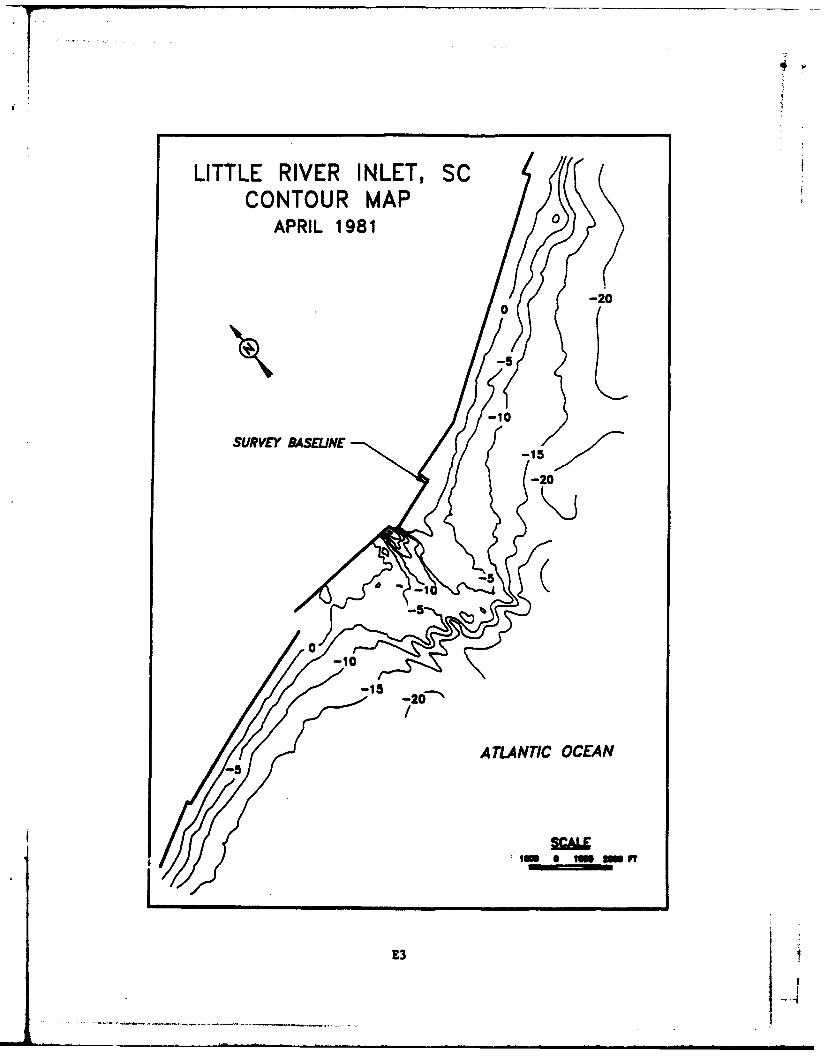
LITTLE RIVER INLET, SCCONTOUR MAP
APRIL 1981 0
-200
-5
-10
SURVEY ASELINE
-15
-- 2
ATLANTIC OCEAN
E3
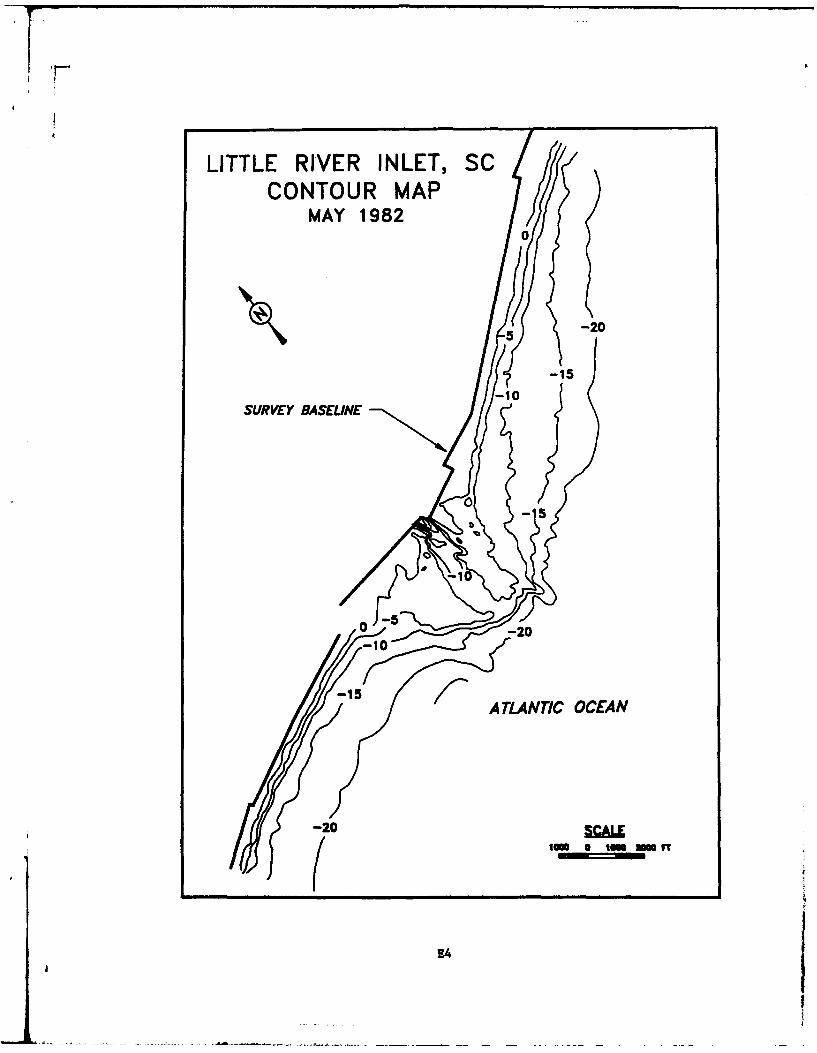
LITTLE RIVER INLET, SCCONTOUR MAP
MAY 19820
5 -20
-15-10
SURVEY BASELINE
05
-10
0 -20-10
ATLANTIC OCEAN
(20
E4
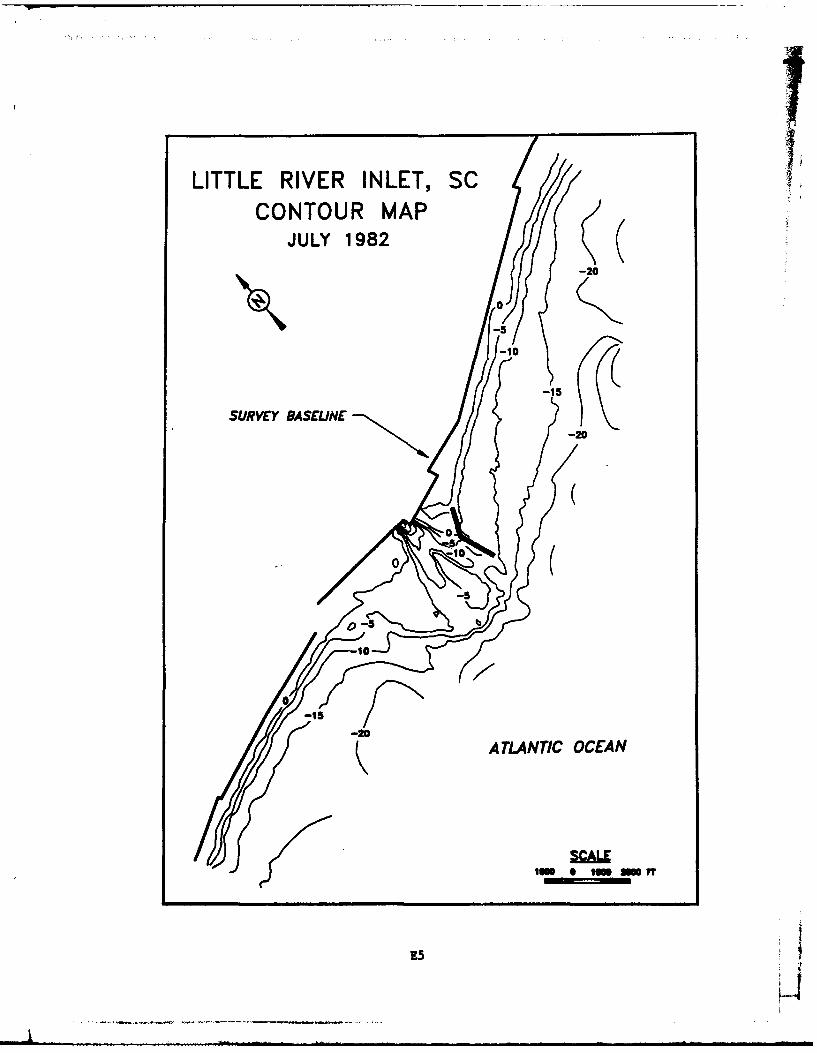
LITTLE RIVER INLET, SCCONTOUR MAP
JULY 1982
-20
-5
-106
-15
SURVEY BASELINE 0
-2
10(
ATLANTIC OCEAN
SCAr
lown * Im ,
---------
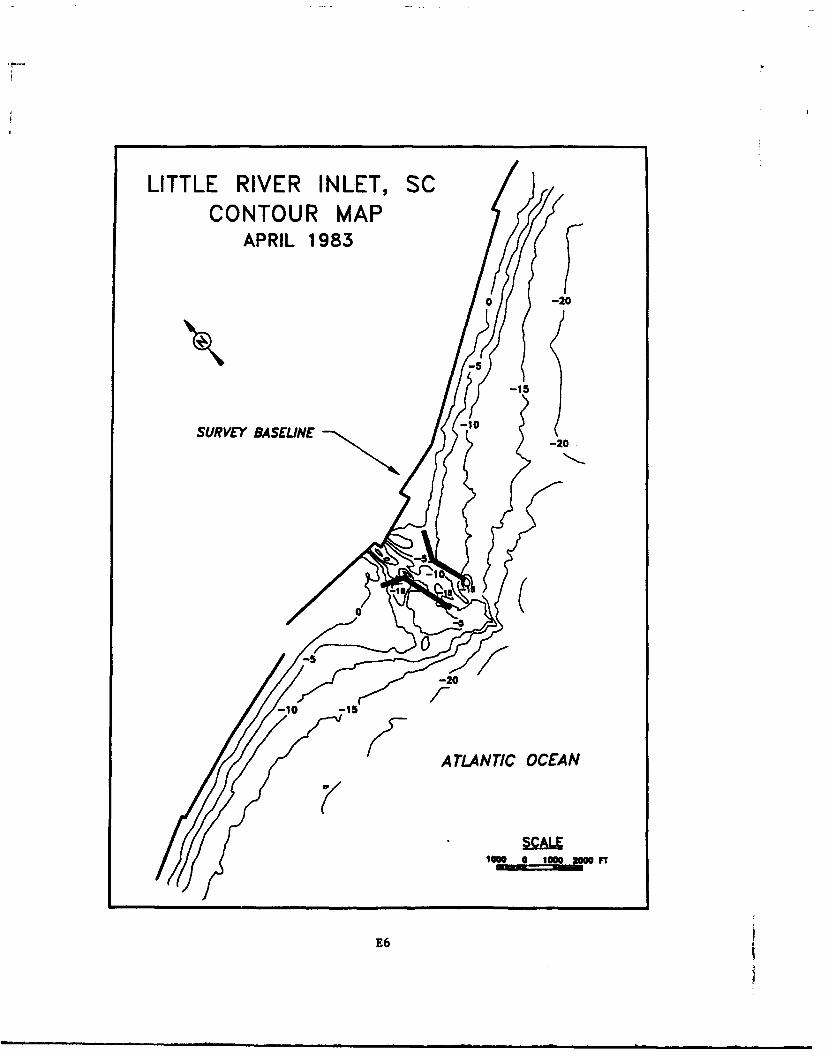
LITTLE RIVER INLET, SCCONTOUR MAP
APRIL 1983
0 -20
-5
1
-15
SURVEY BASELINE -- 20
-55
-0
-10 -15
ATLANTIC OCEAN
E6
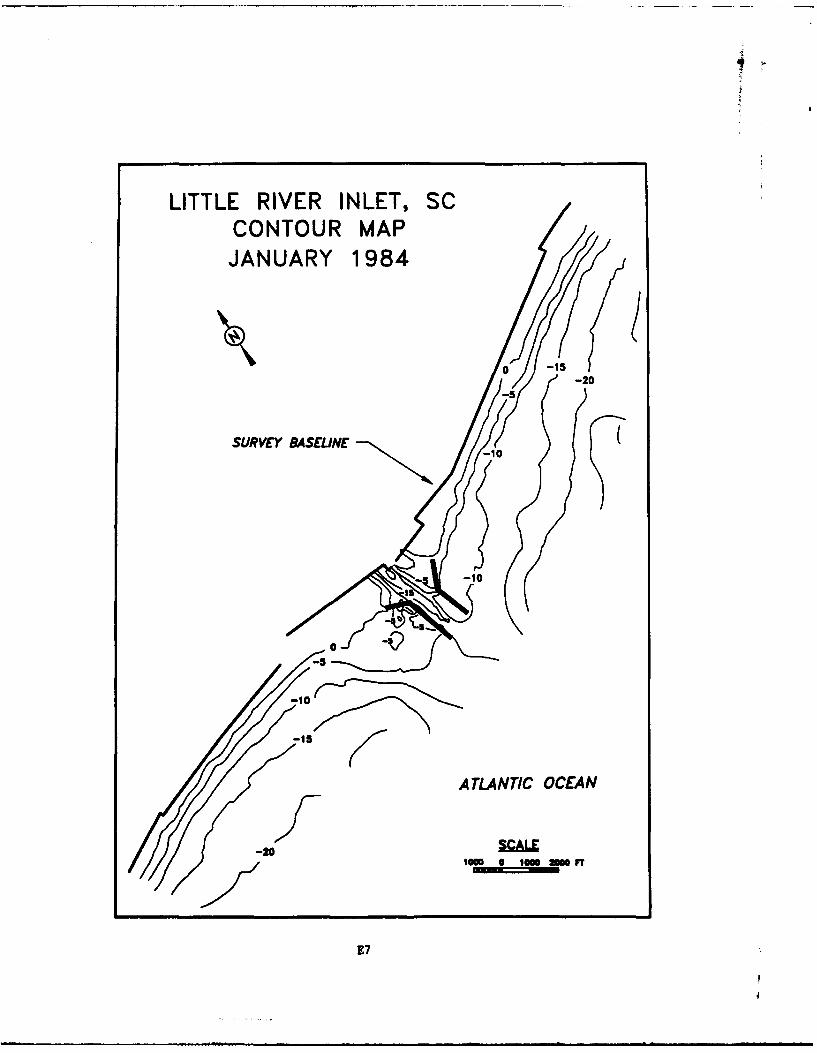
LITTLE RIVER INLET, SCCONTOUR MAPJANUARY 1984
0 -1-20
-5
SURVEY BASELINE _1
-10
0 1
-5
-10
-15
ATLANTIC OCEAN
-20 SCALlow ie low am"
E7
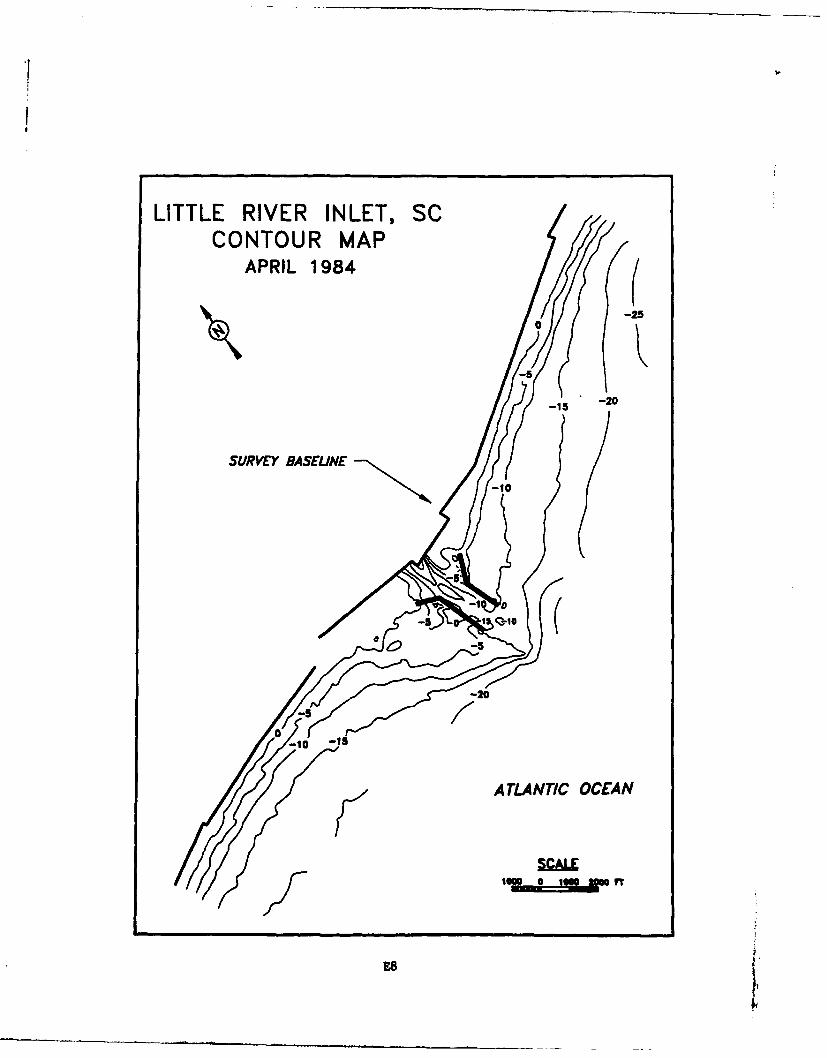
LITTLE RIVER INLET, SCCONTOUR MAP
APRIL 1984(
-5-25
-5 -20
SURVEY DASEUNE
-5.
ATLANTIC OCEAN
E8
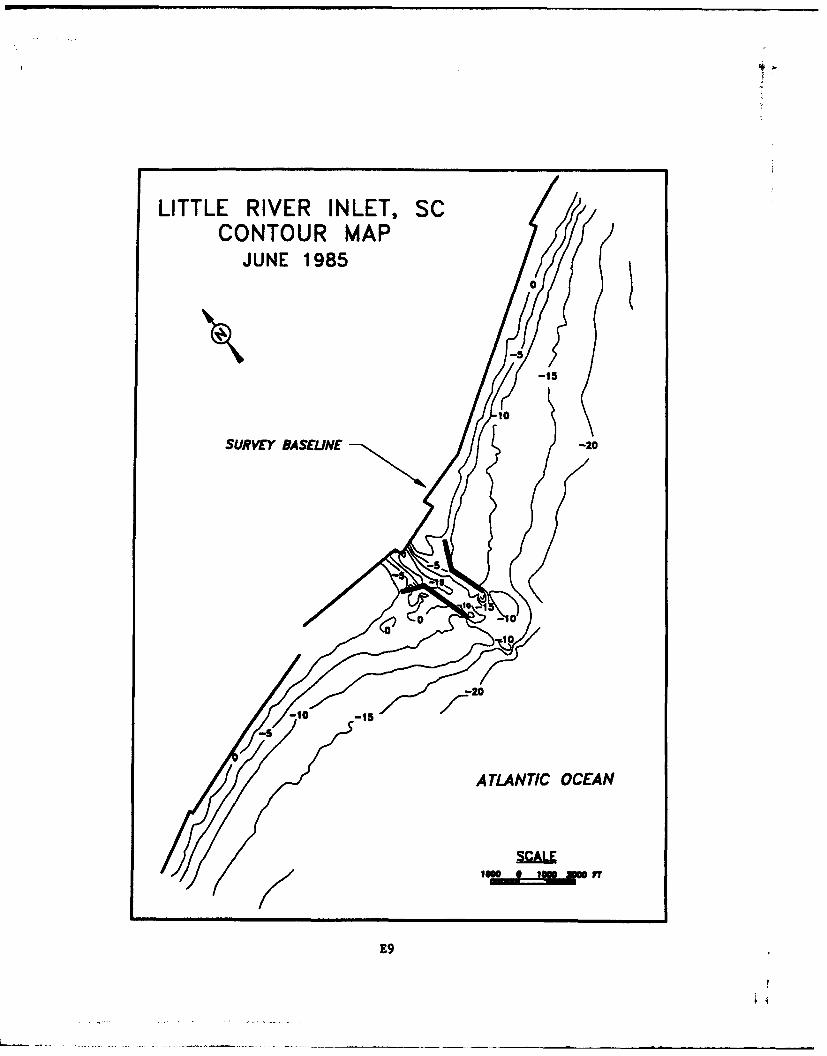
LITTLE RIVER INLET, SCCONTOUR MAP
JUNE 1985 0
-15
10
SURVEY BASEUNE -20
-5 -0 ,5
ATLANTIC OCEAN
E9
. ..... ..... ........
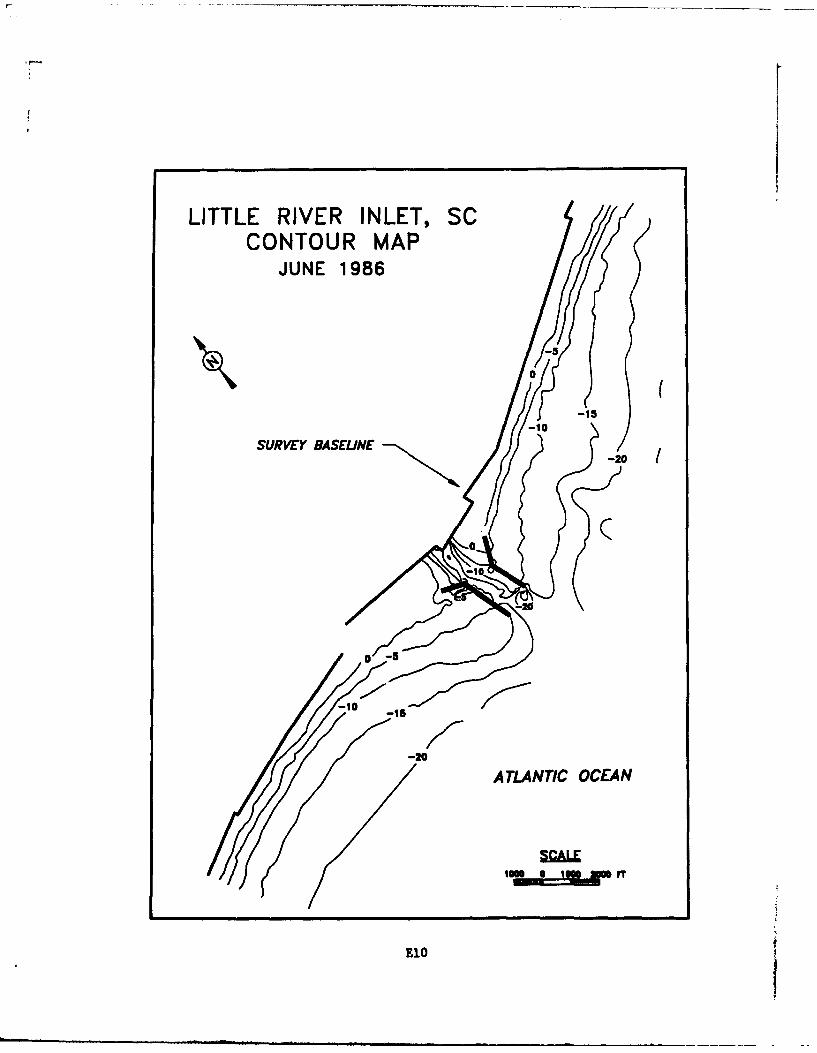
LITTLE RIVER INLET, SCCONTOUR MAP
JUNE 1986
-15
01
0 --5
-- 10
-- 20
ATLANTIC OCEAN
E10L
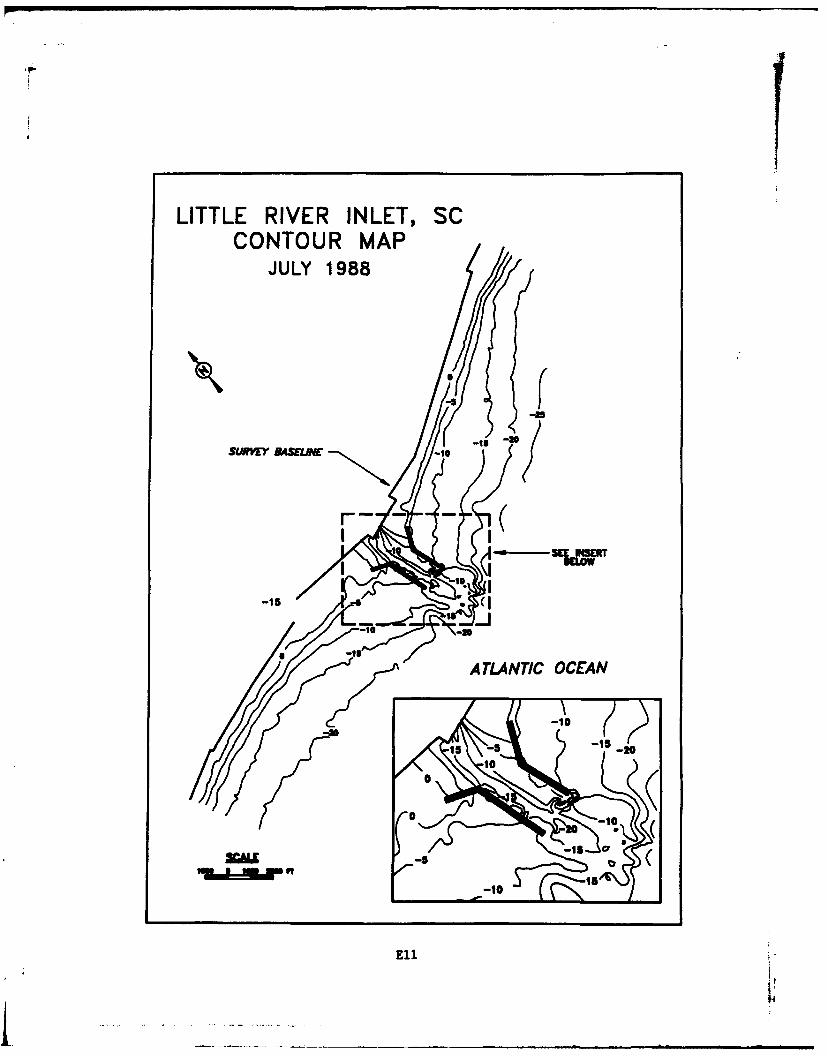
LITTLE RIVER INLET, SCCONTOUR MAP
JULY 1988
-15u
-1ii
15VE BAELN -i5 /2
Ell
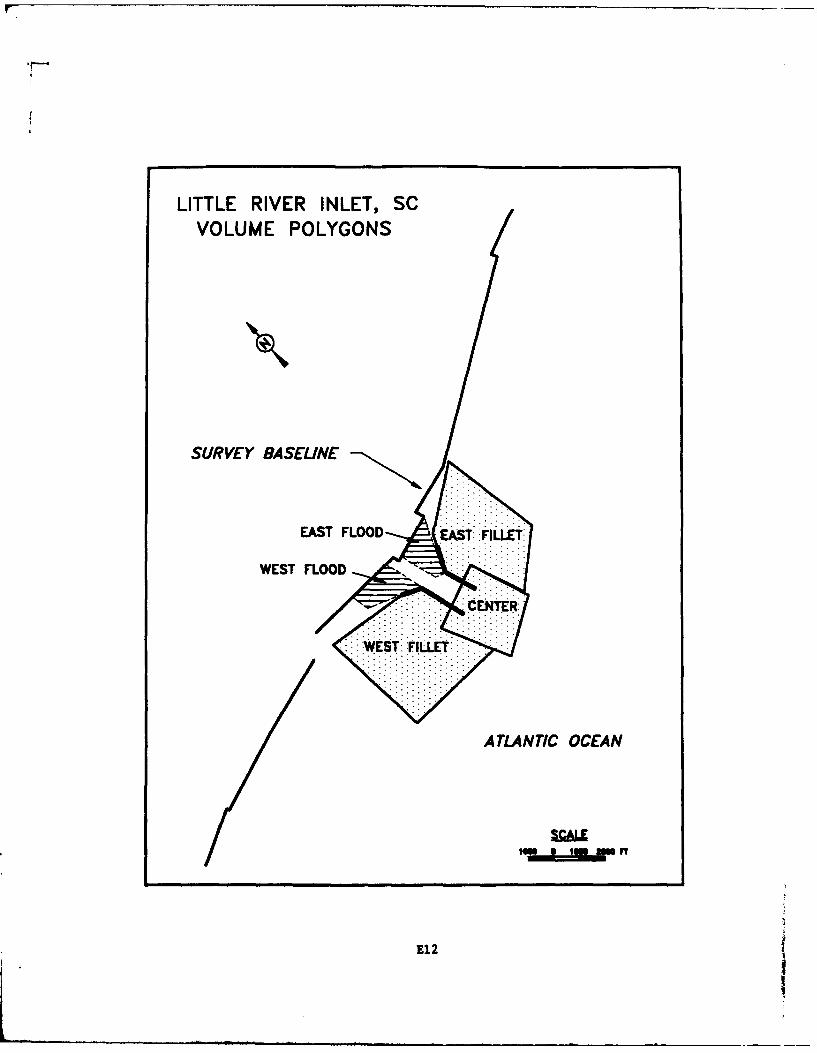
LITTLE RIVER INLET, SCVOLUME POLYGONS
SURVEY RASEUNE
EAST FLOOD .:~TFIL
WEST FLOOD
AETLATIR OEA
. . . . .. . . .
.... .. ..
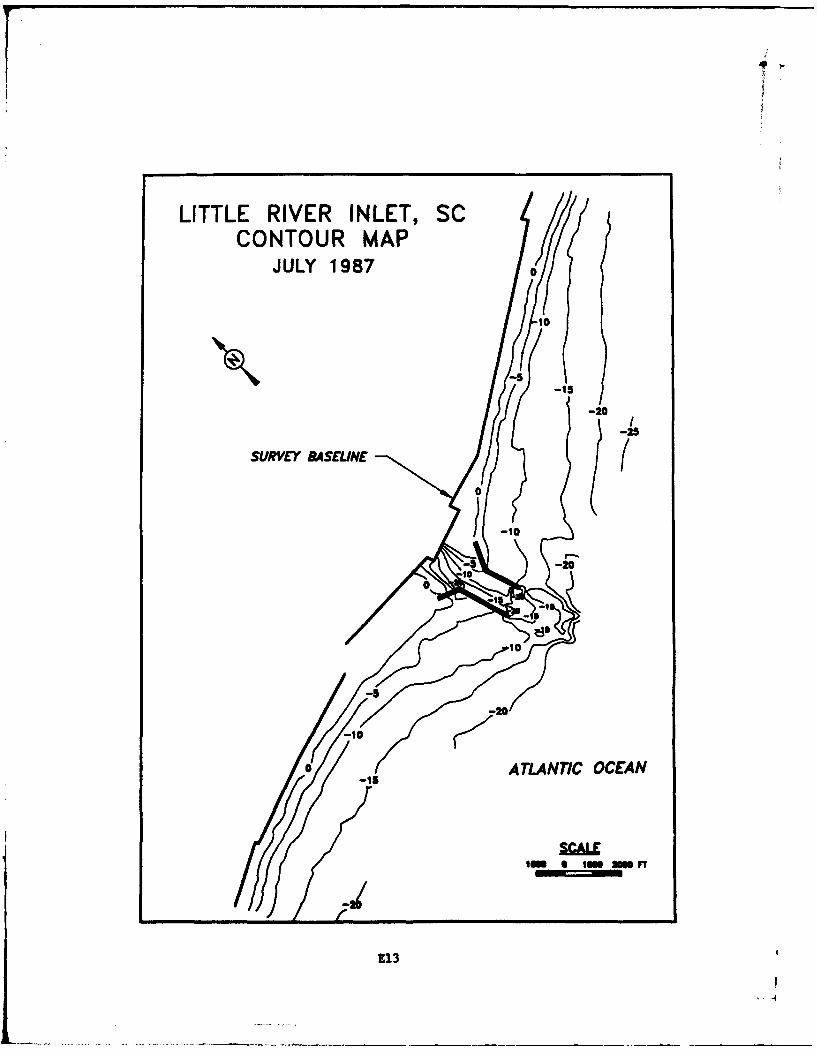
LITTLE RIVER INLET, SCCONTOUR MAP
JULY 19870
10
-55
-20
SURVEY ASELINE
0
--10 r~-5
-20
-10
-1 ATLANTIC OCEAN
E13
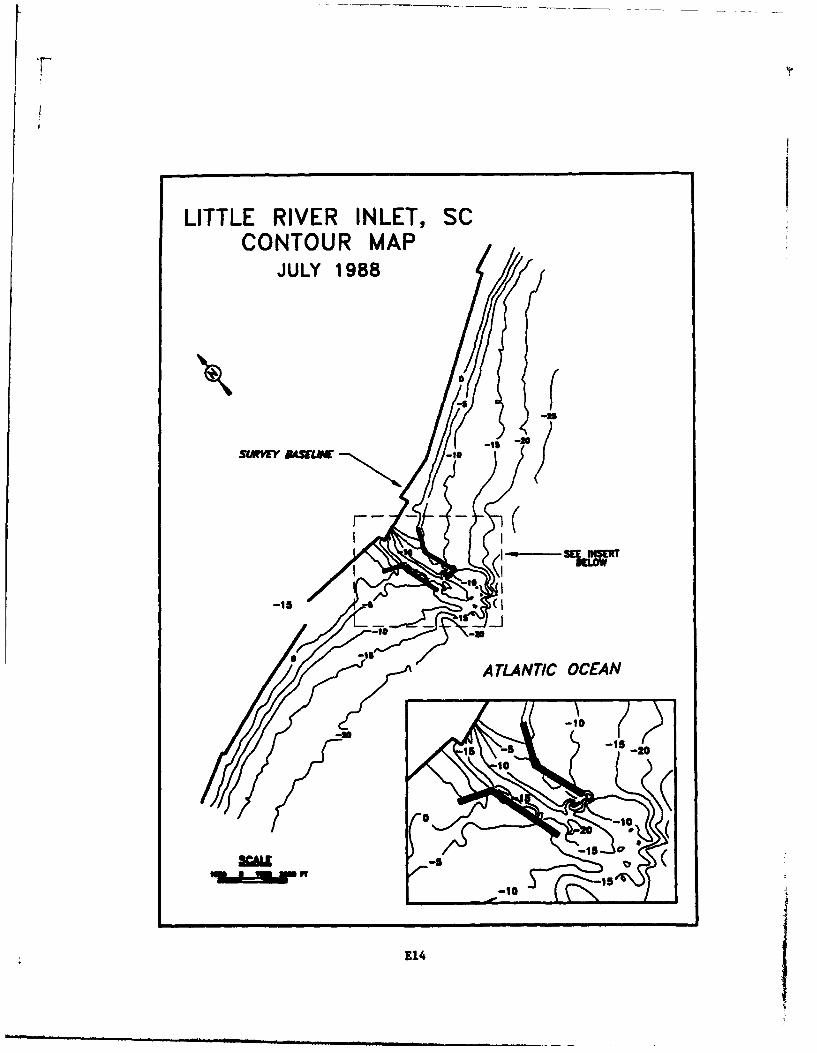
LITTLE RIVER INLET, SCCONTOUR MAP
JULY 1988
-Su
SL*V~IV E4S5 E- I
SEB5ERT
E140
APPENDIX F:
NUMERICAL MODEL METHODOLOGY AND LONGSHORE TRANSPORT PLOTS
(Pages F12-F23 represent pre-project longshore transport plots,
1981 bathymetry; pages F24-F36 represent post-project longshore
transport plots, 1985 bathymetry; pages F37-F49 represent post-
project longshore transport plots, 1988 bathymetry.)
APPENDIX F: NUMERICAL MODEL METHODOLOGY AND LONGSHORETRANSPORT PLOTS
Selection of Wave Inputs to RCPWAVE Model
1. Selection of wave height, period, and incident angle to
define the wave climate in the numerical model RCPWAVE is crucial
to obtaining satisfactory results from the program. This
appendix describes the rationale used in this study for selection
of these criteria.
2. A wave hindcast study has been conducted for the US
coastlines through the Wave Information Study (WIS) for the 20-yr
period from 1956 to 1975 (Jensen 1983). Using barometric
information, the program determined both seas and swells at
three-hour intervals at several deepwater locations, then brought
the waves shoreward to the a depth of 10 m (32.81 ft). Aseparate nearshore station was determined for each 10-mi stretch
of shoreline along the Atlantic coast. Station A3108 is the
Atlantic coast nearshore station for Sunset Beach on the
northeast side of Little River Inlet (Figure F-i); inputs to
RCPWAVE were determined from WIS data for station A3108.
3. At each 3-hr interval, WIS provides the significant wave
height, period, and incident angle relative to the shore of both
the seas and the swell. Thus, for the 20 years of the study
there are 58,480 wave conditions for seas, plus 58,480 wave
conditions for swell, for a total of 116,960 wave conditions.
Because time and cost considerations dictate that only a limited
number of wave cases could be run through RCPWAVE, it was
necessary to select wave conditions that would produce
representative results.
4. A common means of selecting representative wave
conditions is to group the data into bands of wave height,
period, and angle, determine the percent occurrence of waves
falling within the bands, and select the midpoint of the band as
representative of those waves. For example, for WIS station
F3
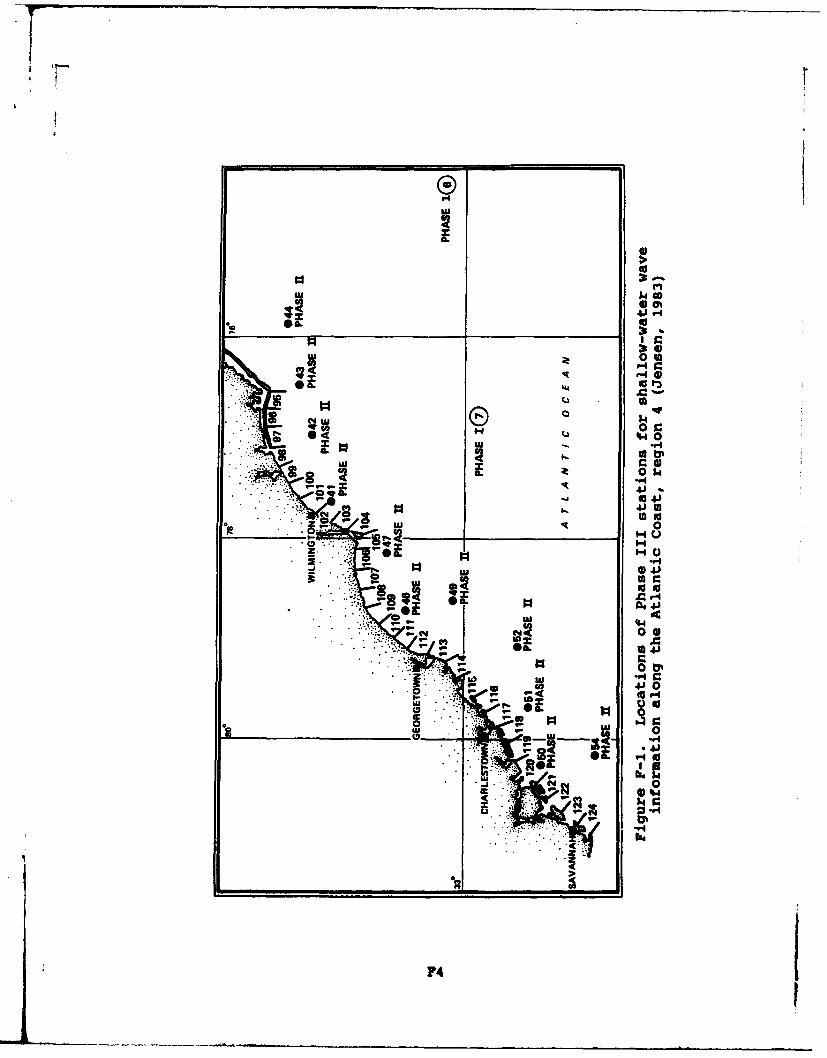
LLr
0nuj C0
Mi 1eatV0
0 c
0, 0
4J tU
w .. 4
in
0 0%
-J4w 0
00
08 0*a L .4
P4.
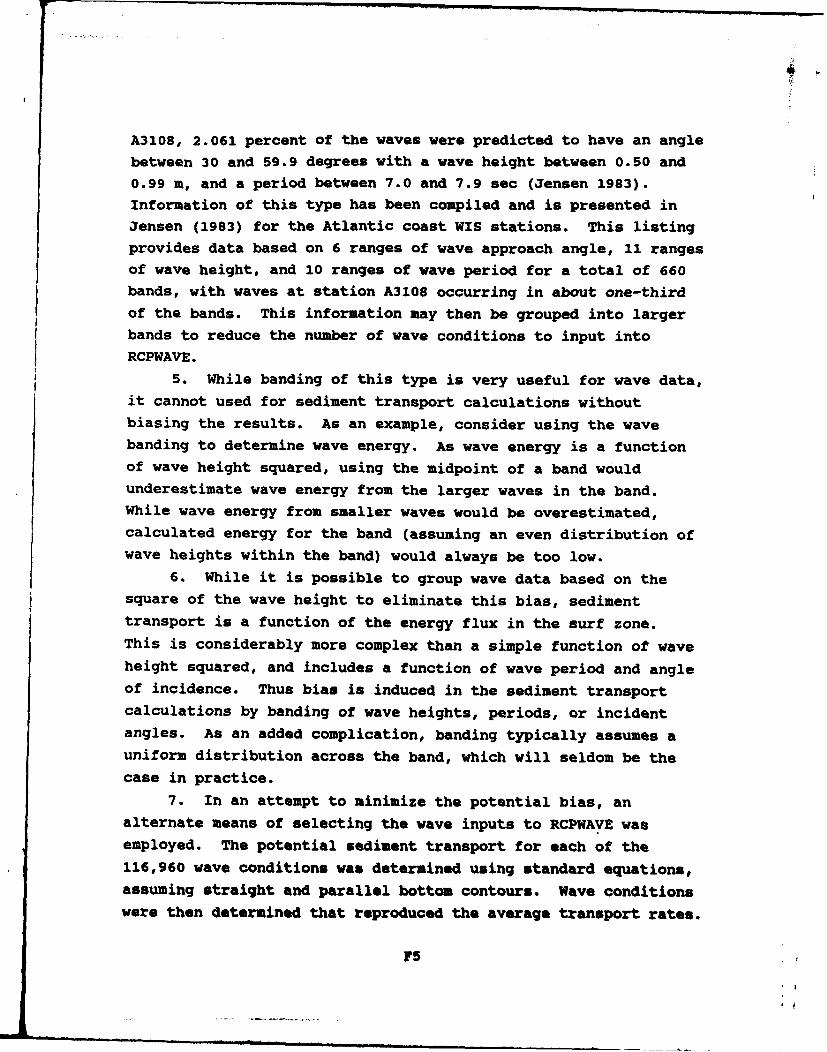
A3108, 2.061 percent of the waves were predicted to have an anglebetween 30 and 59.9 degrees with a wave height between 0.50 and
0.99 m, and a period between 7.0 and 7.9 sec (Jensen 1983).
Information of this type has been compiled and is presented inJensen (1983) for the Atlantic coast WIS stations. This listingprovides data based on 6 ranges of wave approach angle, 11 rangesof wave height, and 10 ranges of wave period for a total of 660bands, with waves at station A3108 occurring in about one-thirdof the bands. This information may then be grouped into largerbands to reduce the number of wave conditions to input intoRCPWAVE.
5. While banding of this type is very useful for wave data,it cannot used for sediment transport calculations withoutbiasing the results. As an example, consider using the wavebanding to determine wave energy. As wave energy is a functionof wave height squared, using the midpoint of a band wouldunderestimate wave energy from the larger waves in the band.While wave energy from smaller waves would be overestimated,calculated energy for the band (assuming an even distribution ofwave heights within the band) would always be too low.
6. While it is possible to group wave data based on thesquare of the wave height to eliminate this bias, sedimenttransport is a function of the energy flux in the surf zone.This is considerably more complex than a simple function of waveheight squared, and includes a function of wave period and angleof incidence. Thus bias is induced in the sediment transportcalculations by banding of wave heights, periods, or incidentangles. As an added complication, banding typically assumes auniform distribution across the band, which will seldom be thecase in practice.
7. In an attempt to minimize the potential bias, analternate means of selecting the wave inputs to RCPWAVE wasemployed. The potential sediment transport for each of the116,960 wave conditions was determined using standard equations,assuming straight and parallel bottom contours. Wave conditionswere then determined that reproduced the average transport rates.
F5
Wave information was then grouped based on potential sediment
transport rather than wave height, period or angle. Selected
wave conditions were then entered into RCPWAVE to determine the
effects of the actual bathymetry in the area. In this manner a
reasonable number of inputs for RCPWAVE were determined while
minimizing any inherent bias.
a. The first step was to determine the potential sediment
transport for each of the 116,960 wave conditions using equations
in the Automated Coastal Engineering System (ACES) (Leenknecht
and Szuwalski 1990) and in the Shore Protection Manual (1984).
These equations solve for the energy flux factor at the surf zone
based on known breaking or deepwater significant wave conditions,
then determine the longshore transport rate based on an empirical
equation with the energy flux factor. Derivation of the
equations may be found in either of these references and will not
be repeated here, but the equations themselves are written below
for reference.
a. Energy flux factor based on breaking wave
conditions:
Pjw= (pg/16)Hb2Cgsin(2ab) (1)
b. Energy flux factor based on deepwater wave
conditions:
Pb - (pg/16)L]Cbsin(2ao) (2)
c. Longshore sediment transport rate:
Q - K Ph (3)
where P. is the energy flux factor, p is the mass density of
water, g is the acceleration of gravity, H. is the
significant breaking wave height, CO is wave group celerity at
breaking, a, is the angle of wave advance at breaking, H, is
the significant deepwater wave height, a. is the angle of
F6
deepwater wave advance, Q is the potential sediment transport
rate, and K is an empirical coefficient. In non-SSI units, K
is equal to 7500 (yd3-sec)/(lb-yr), P, is calculated in units
of (ft-lb)/(ft-sec), yielding potential sediment transport in
terms of yd3/yr.
9. Because WIS information is presented at a depth of 32.81
ft, equations 2 and 3 were used to estimate potential sediment
transport based on deepwater wave conditions. Snell's Law was
used to refract the wave conditions from 32.81 ft to deepwater
conditions, and the potential sediment transport rate was
determined for each of the 116,960 wave conditions.
10. To minimize bias which may be induced by the
bathymetry, seas and swell conditions were stored separately, and
wave conditions causing sediment transport to the left was stored
separately from wave conditions causing sediment transport to the
right. This created four main groups of data: seas left, seas
right, swell left, and swell right.
11. To reduce the number of RCPWAVE inputs to a reasonable
number, it was then decided to average the 20-yrs of sediment
transport information by month. As no banding of wave conditions
had been employed, the transport rates could be grouped or
averaged in any manner, but it was hoped that averaging by month
would provide seasonal information. Each month therefore
included wave conditions for that month from each of the 20 yrs
of data. Thus the WIS information was separated into 48 groups
(12 months times 4 main groups).
12. For each group of waves, a single wave condition was
sought to input into RCPWAVE. This was determined by finding the
average potential sediment transport rate for all wave conditions
in a group, then selecting a wave condition that reproduced the
average rate. The average potential transport rate was
calculated only from those wave conditions that produced sediment
transport. Wave conditions with a perpendicular angle of
incidence at breaking or with a wave height or period of zero
were excluded from the calculations.
F7
13. Rather than randomly select a set of wave conditions to
reproduce the average transport rate, it was preferable to select
a wave closely represented the actual wave conditions in each
group. Therefore, wave conditions in each group were averaged
for all wave conditions that produced a potential sediment
transport rate within ten percent of the average transport rate.
This "average wave" did not reproduce the average transport rate
for the same reasons that banding the wave data will bias the
transport rates. However, given the average wave period and
angle of incidence it was possible to adjust the wave height to
determine a "representative wave" that reproduced the average
potential sediment transport rate and closely reflected actual
wave conditions in the group.
14. Inputs to RCPWAVE were thus reduced to 48 wave
conditions, one for each of the 48 groups. Sediment transport
was then recalculated with output from RCPWAVE, at which time the
frequency of occurrence of wave conditions in each group was
taken into account.
15. For the simplified case of uniform sediment
characteristics, no currents, and no aeolian transport, sediment
transport will be affected by the deepwater wave height, period,
and incident angle, and by the bathymetry. Using the equations
given above for each wave condition minimized bias from wave
height, period, and incident angle. Processing seas and swell
information separately, and transport to the east separately from
transport to the west, was done to minimize bias caused by
bathymetry.
Calculation of Sediment TransDort Based on RCPWAVE OutDut
16. Output at each nodal point from the numerical model
RCPWAVE includes water depth, wave angle, wave height, wave
period, and an indicator of whether or not the wave has broken.
This appendix describes the process used to determine sediment
transport at Little River Inlet based on this information and the
input bathymetry. The grid used at Little River Inlet was
F8
200 cells 150 ft wide along the coast (grid lines i=1 to 201,
numbered from west to east) by 154 cells 75 ft wide (grid lines
j=l to 155, numbered from shore seaward), and thus included
30,800 cells covering 5.7 miles along the coast and 1.2 miles in
the offshore direction.
17. Shoreline location was determined by reading the
bathymetry input file shoreward along each grid line from theoffshore edge of the grid. The shoreline was defined as the
first location where the zero datum was reached. For the input
bathymetry used here, the zero datum was mean low water. Linear
interpolation was used to determine the location of the zero
crossing between nodal points. Note that depths at each nodal
point were determined from the input grid to RCPWAVE rather than
from the output. RCPWAVE defaults to a depth of one foot for all
depths less than a foot and all positive elevations. This
default is reflected in the output, thus no shoreline is
indicated in the output file.
18. Shoreline angle was determined by averaging the angle
between the shoreline location along a grid line and the
shoreline location al-,ng both adjacent grid lines. This gave the
angle of the shoreline relative to the grid at each grid line.
19. Location of the wave at breaking was determined byfirst reading the RCPWAVE output file shoreward along each grid
line until the first breaker index was encountered. Wave height,
period, and angle were then determined at the grid point previousto the one with the breaker index, that is, the next grid point
seaward of the one with the breaker index. The wave was then
"marched" shoreward in small increments through the cell to more
accurately determine the breaking point.
20. The marching algorithm began by determining the bottom
slope from the depth at the starting cell (one cell seaward of
the breaker index) and the depth at, and distance to, either the
next cell shoreward along the grid line or either of the cells
adjacent to the next cell shoreward, depending on the incident
angle of the wave. That is, the depth was determined for cell
(i,j) then, depending on the angle of the wave at the cell, the
F9
* -
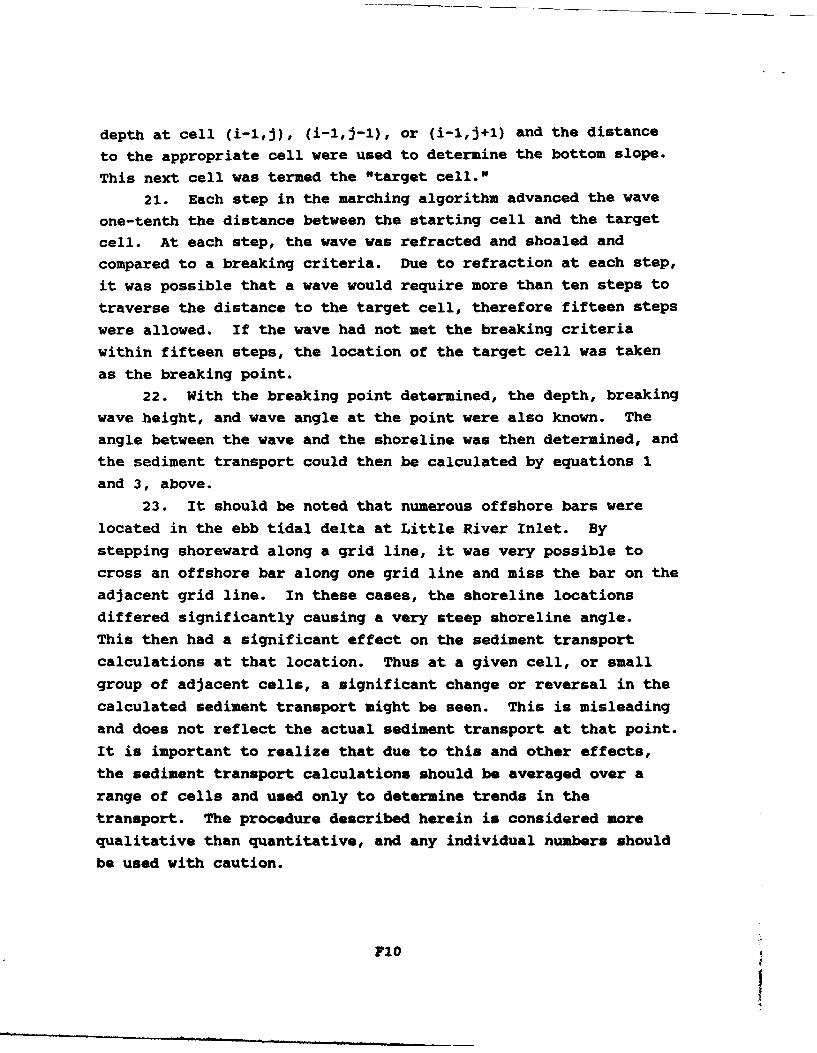
depth at cell (i-l,J), (i-lJ-1), or (i-l,j+l) and the distance
to the appropriate cell were used to determine the bottom slope.
This next cell was termed the "target cell."
21. Each step in the marching algorithm advanced the wave
one-tenth the distance between the starting cell and the target
cell. At each step, the wave was refracted and shoaled and
compared to a breaking criteria. Due to refraction at each step,
it was possible that a wave would require more than ten steps to
traverse the distance to the target cell, therefore fifteen steps
were allowed. If the wave had not met the breaking criteria
within fifteen steps, the location of the target cell was taken
as the breaking point.
22. With the breaking point determined, the depth, breaking
wave height, and wave angle at the point were also known. The
angle between the wave and the shoreline was then determined, and
the sediment transport could then be calculated by equations 1
and 3, above.
23. It should be noted that numerous offshore bars were
located in the ebb tidal delta at Little River Inlet. By
stepping shoreward along a grid line, it was very possible to
cross an offshore bar along one grid line and miss the bar on the
adjacent grid line. In these cases, the shoreline locations
differed significantly causing a very steep shoreline angle.
This then had a significant effect on the sediment transport
calculations at that location. Thus at a given cell, or small
group of adjacent cells, a significant change or reversal in the
calculated sediment transport might be seen. This is misleading
and does not reflect the actual sediment transport at that point.
It is important to realize that due to this and other effects,
the sediment transport calculations should be averaged over a
range of cells and used only to determine trends in the
transport. The procedure described herein is considered more
qualitative than quantitative, and any individual numbers should
be used with caution.
FlO I
Jensen, R. E. 1983. "Atlantic Coast Hindcast, ShallowWater, Significant Wave Information," WIS Report 9, US ArmyEngineer Waterways Experiment Station, Vicksburg, MS.
Leenknecht, D. A., and A. Szuwalski. 1990. "AutomatedCoastal Engineering System, Technical Reference, Version 1.05,"US Army Engineer Waterways Experiment Station, Vicksburg, MS.
Shore Protection Manual. 1984. 4th ed., 2 vols. US ArmyEngineer Waterways Experiment Station, Vicksburg, MS.
FIL
LT
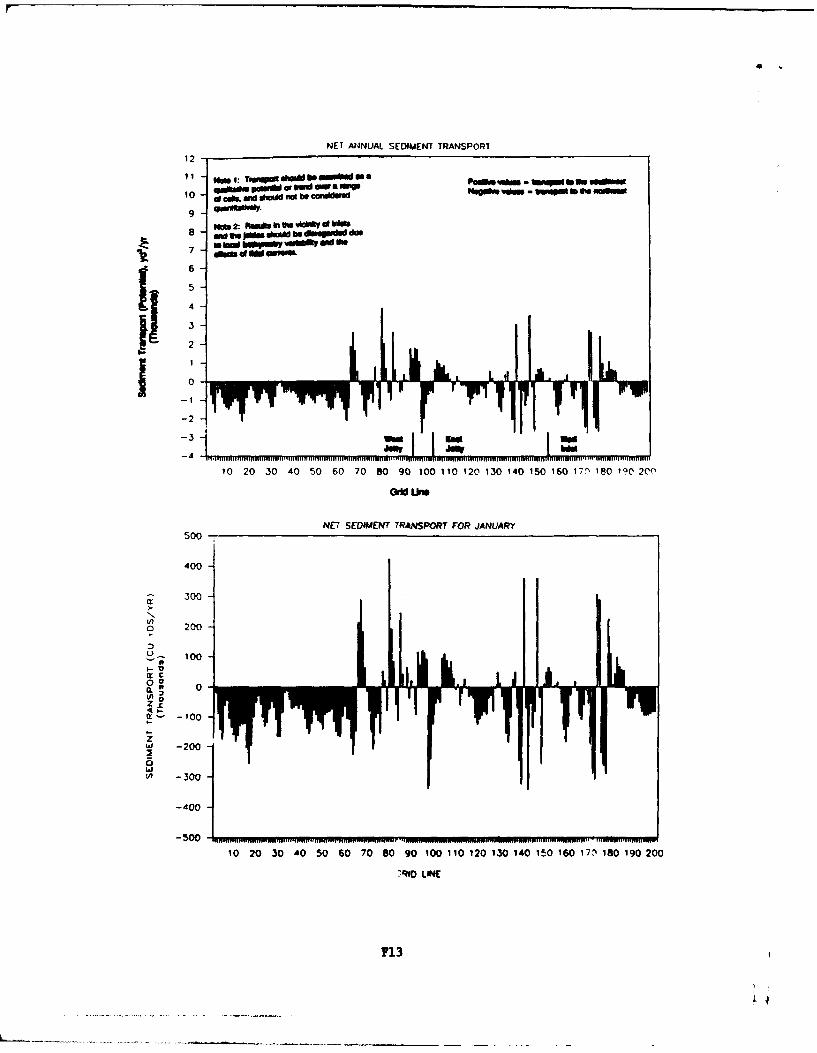
NET AN4NUAL SEDIMENT TRANSPORT12
c1 ogf SM 31 -" t I b - ma -o
8 NM 2: Rsimud In lbS vib*b CO"
Gme d s mf
-3
-
500 -IT
400TNI
-300om M
is 200
Soo
400
3:--00
W 200
00
I.C
-300
10 20 30 40 50 60 70 80 90 100 110 120 130 140 150 160 17? 180 190 200
7f0 LINE
F13
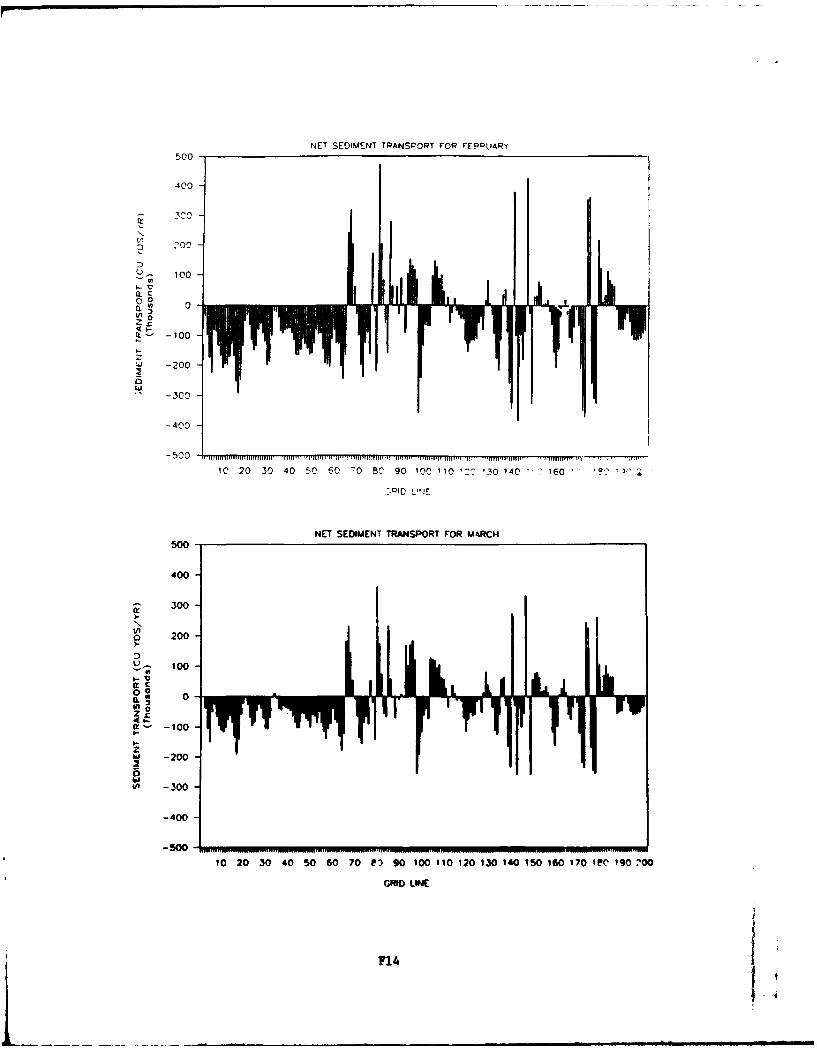
NET SEDIMENT TRANSPORT FOR FE90LIARY500
400
200
0
0
'd -300
-400
1C 2 0 3 0 4 0 50 C 0 _O 80 9 0O 0 ' 30 14 C 16 0
NET SEDIMENT TRANSPORT FOR MARCH500
400
300
20-
It
0.
I-
hi -200
In -300
-400
10 20 30 40 50 60 70 Lul 90 100110 120 130140 150 160170 eC' 190 700
GRID LINE
F14
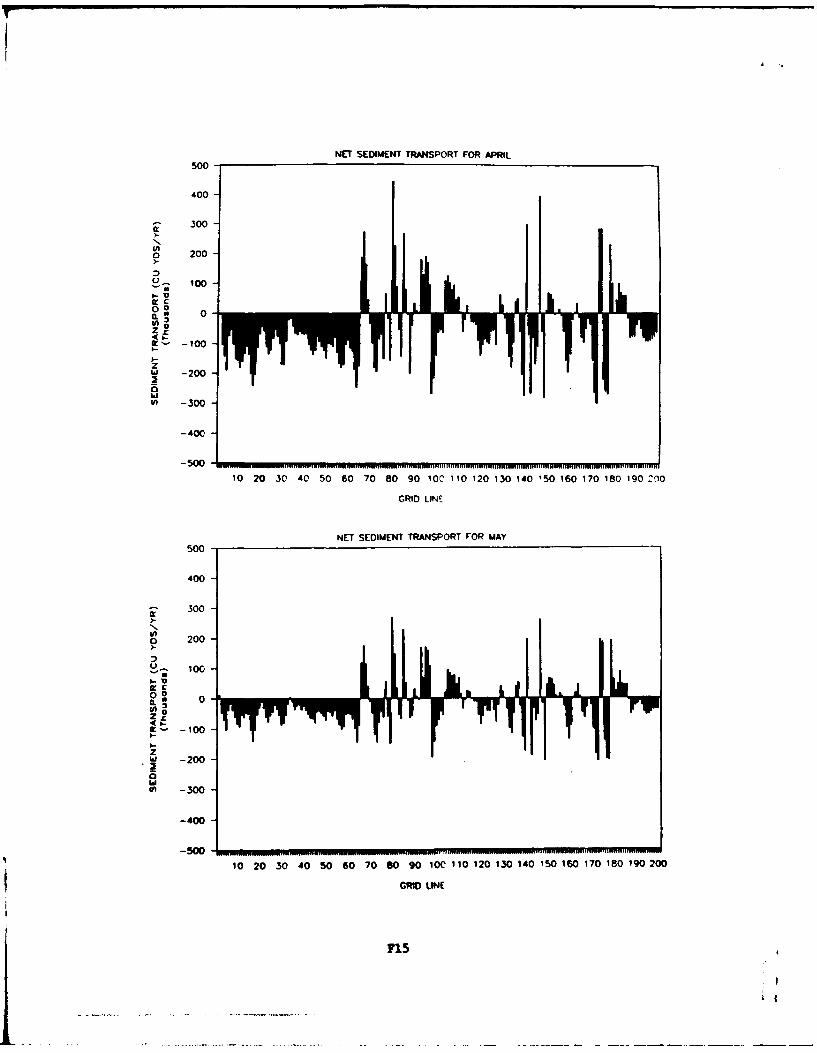
NET SEDIMENT TRANSPORT FOR APRIL500
400
. 300
ino 200
100
00IL 0
in 03zZOr<'.-It' - 100
zhi -2002in -300
-500MOI.....
10 20 30 4C 50 60 70 80 90 100I 110 120 130 140 '50 160 170 180 190 200
GRID LINE
NET SEDIMENT TRANSPORT FOR MAY500
400
-~300
o 200
00 o0a
000
zhi -200
In -300
-400
10 20 30 40 50 60 70 80 90 100 110 120 130 140 150 160 170 180 190 200
GRID LINE
715
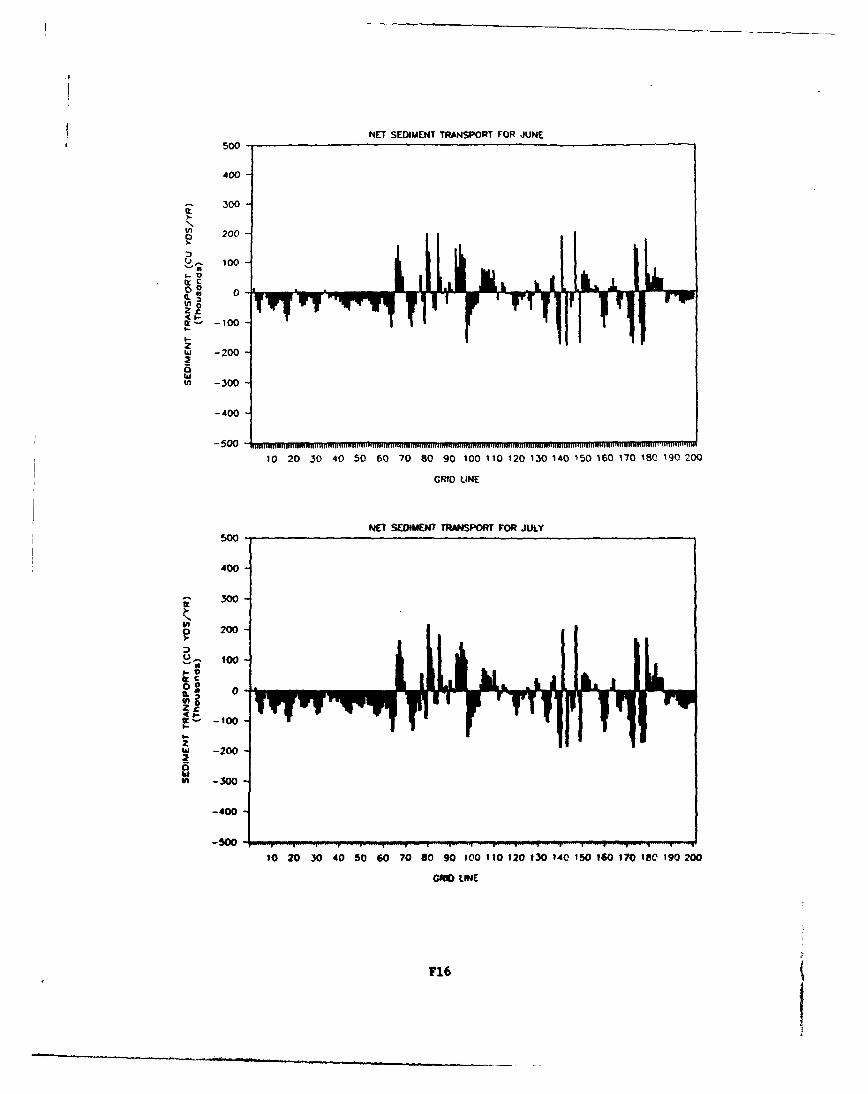
NET SEDIMENT TRANSPORT FOR JUNE500
400
-~300
o 200-
100IDV
I 0 T-- 100
zhJ -200
In -300
-400
-500-
10 20 30 40 50 60 '70 80 90 100 110 120 130 140 150 160 170 180 190 200
GRID LINE
NET SEDIMENT TRANSPORT FOR JULY500
400
-~300
a 200
U~ 100-
00
I4,-
a: -100
zwi -200
ml -300
-400
So 20 30 40 So 60 70 80 g0 IM 110 120 130 140 150 160 170 180 190 200
GRID LIE
716
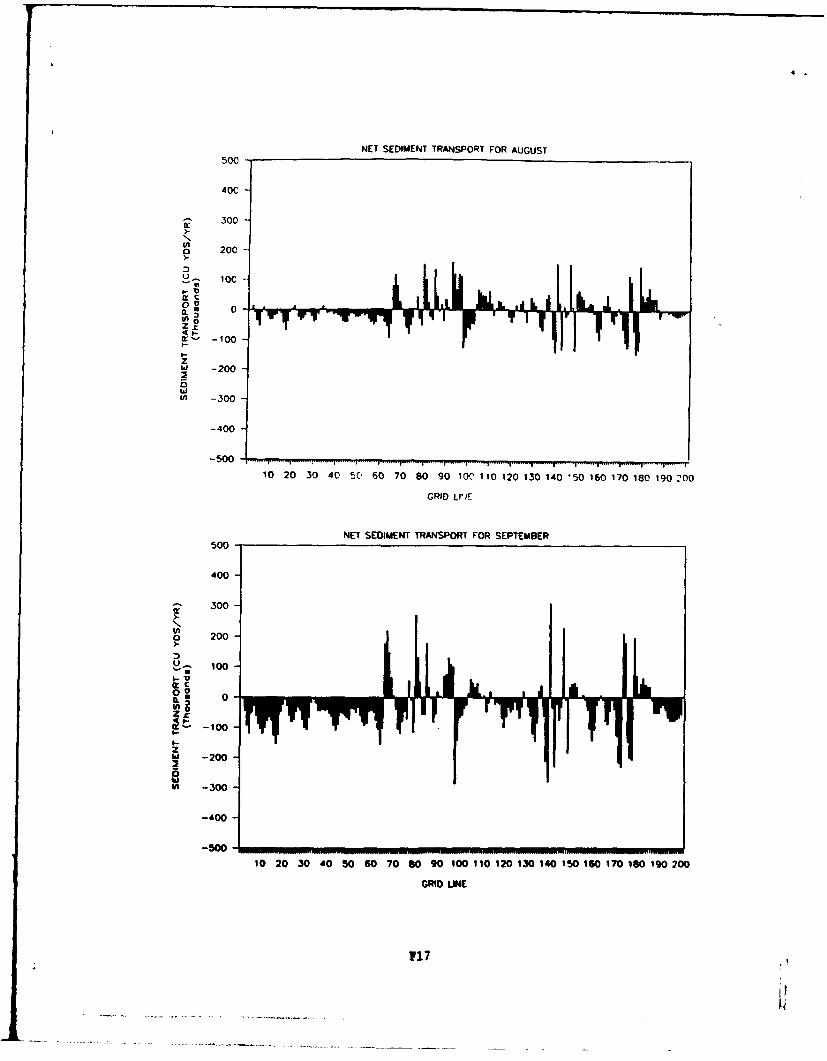
NET SEDIMENT TRANSPORT FOR AUGUST
40C
-~300
o 20C
I-
w- -100
u -200
-400
10 20 30 40 SC' 60 70 80 90 10C 110 120 130 140 '50 160 170 180 190 200
GRID LrIJE_
NET SEDIMENT TRANSPORT FOR SEPTEMBER
50
too
-200
-300
-400
~-5 00
10 20 30 40 5)0 60 70 80 90 100 110 120 130 140 '50 160 170 180 190 200
4000
30-
0a -200
000
-040-
-00
10 20 30 40 50 60 70 W0 90 100 110 120 130 140 150 160 170 180 190 200
CRM LINE
F17
.~- ~ -. ~. ~ -
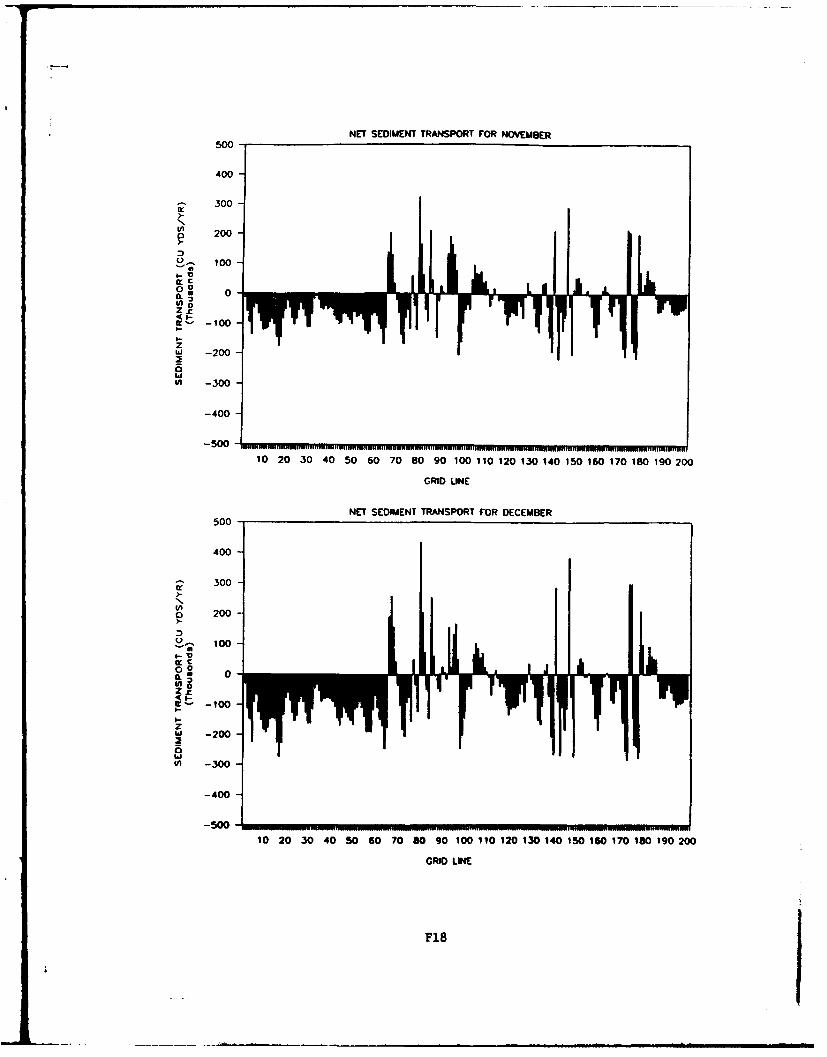
NET SEDIMENT TRANSPORT FOR NOVEMBER500
400
-~300
o 200
-' 100c
0.-
a- -100
zhi -200
tn -300
-400
-0- 10 20 30 40 50 60 70 80 90 100 110 120 130 140 150 160 170 180 190 200
GRID UNE
NET SEDIMENT TRANSPORT FOR DECEMBER500
400
300
o 200
000
A -20020
01 -300
-400
-50010 20 30 40 50 60 70 80 90 100 110 120 130 140 150 160 170 180 190 200
GRID LINE
F18
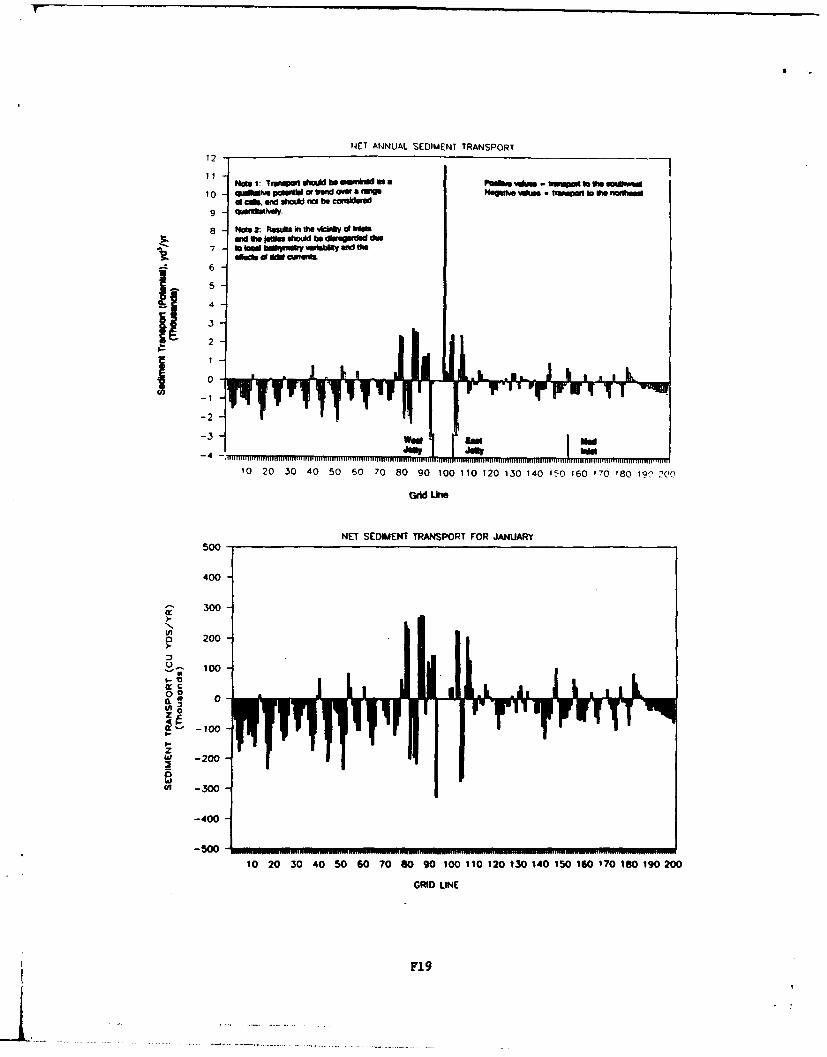
NlET ANNUAL SEDIMENT TRANSPORT12-
NMI : T moo," dimid be umilibed ma Values - IF~p - 0o ie umgw10 quE pWut 0 M ui U.W orIroama Negut. vause twno IDU ow am ~l
of d o sftid not be conaW.reg qualtovely.
No te2: Rmpsi 4cliny d bisNo f uwa - , , be tuwuIde i.d
7 10 10 bolln P mU~ 00Vv u" d Illsseef of d" canird
6
4
2
-2
-3 W t
10 20 30 40 50 60 70 S0 90 1 00 11 0 120 130 140 150 160 170 180 101 :7(1 1
NET SEDIMENT TRANSPORT FOR JANUARY
400
300
o 200
100
00
va
-00
"'-200
w'4 -300
-400
-50010 20 30 40 50 60 70 80 90 100 110 120 130 140 150 160 170 180 190 200
GRID LINE
719
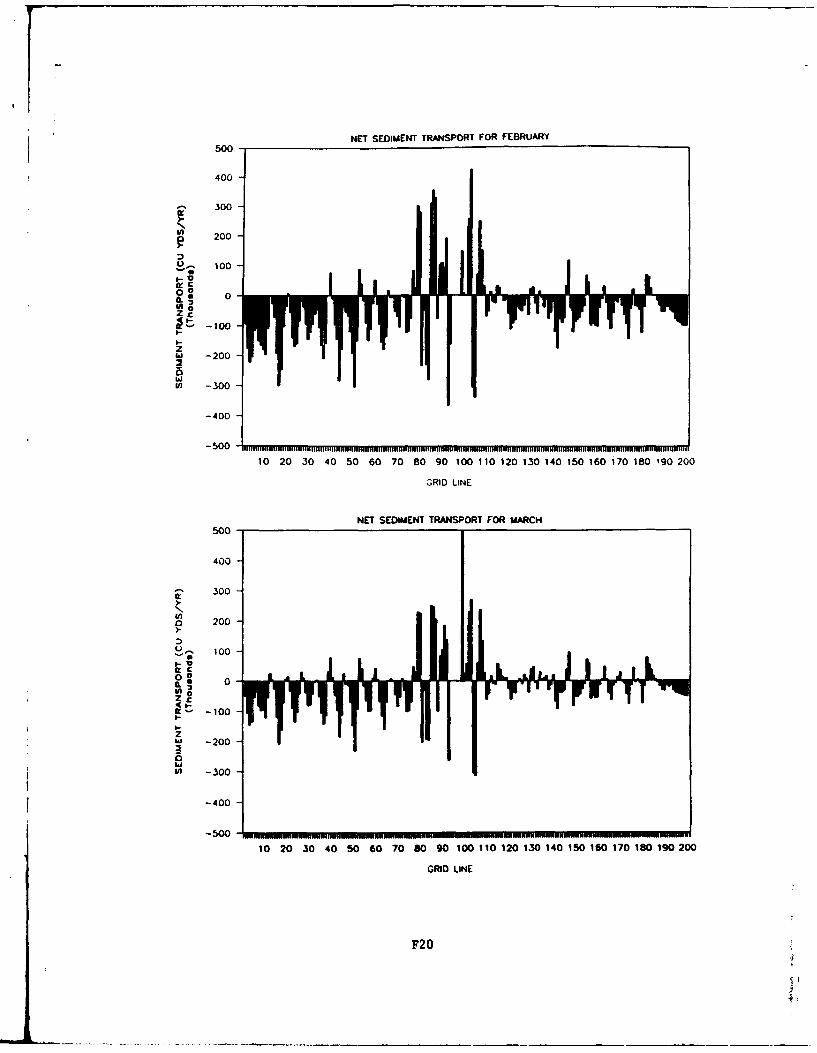
NET SEDIMAENT TRANSPORT FOR FEBRUARY
400
- 300
200
S 100
00 0
I-
zIhii -200
-50
-400
- -500 -......
5 00
4 00
000
loo -10
W0
IG -30
-400
-500110 20 30 40 50 60 70 80 90 100 110 120 130 140 150 160 170 180 190 200
GRID LINE
F20
4.
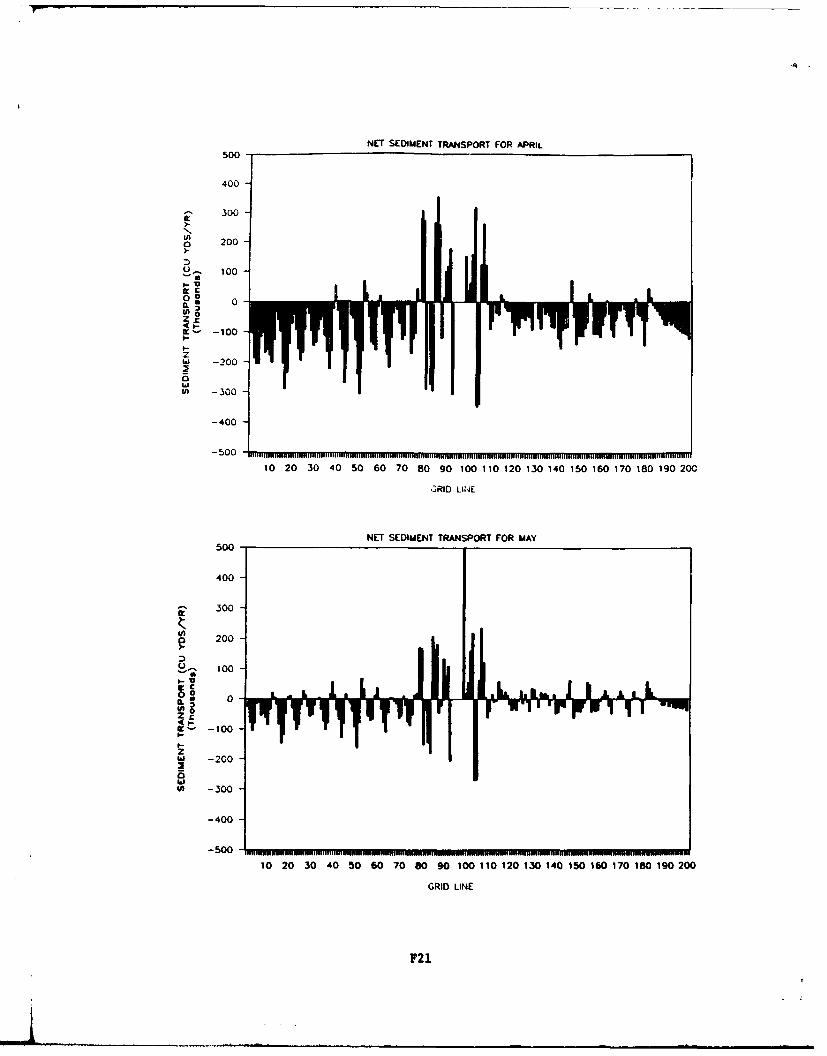
NET SEDIMENT TRANSPORT FOR APRIL500
400
300
o 200
00aLL& 0 0In 0
--
zhi -200
Liin-300
-400
-50010 20 30 40 50 60 70 80 90 100 110 120 130 140 150 160 170 180 190 200
G3RID LINE
NET SEDIMENT TRANSPORT FOR MAY500
400
L 300
S 200
0)0 100 ALIn 0
00-30
4-40
t - 5-00
F2
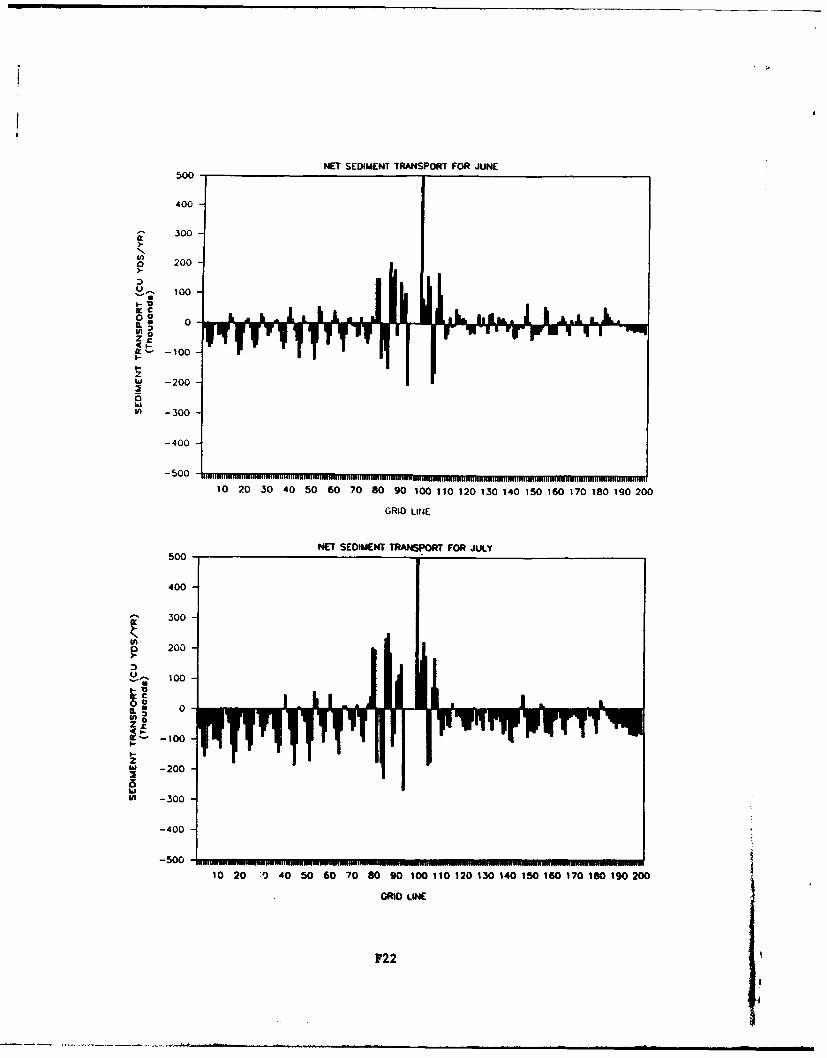
NET SEDIMENT TRANSPORT FOR JUNE
500
400
-~300
a 200
D
- 100
in0
-400
-400
3500 1......
500
400
-100
IG-
00 -20
10
'~-300
-400
10 20 .'O 40 50 60 70 80 90 100 110 120 130 140 150 160 170 180 190 200
GRID LINE
F22
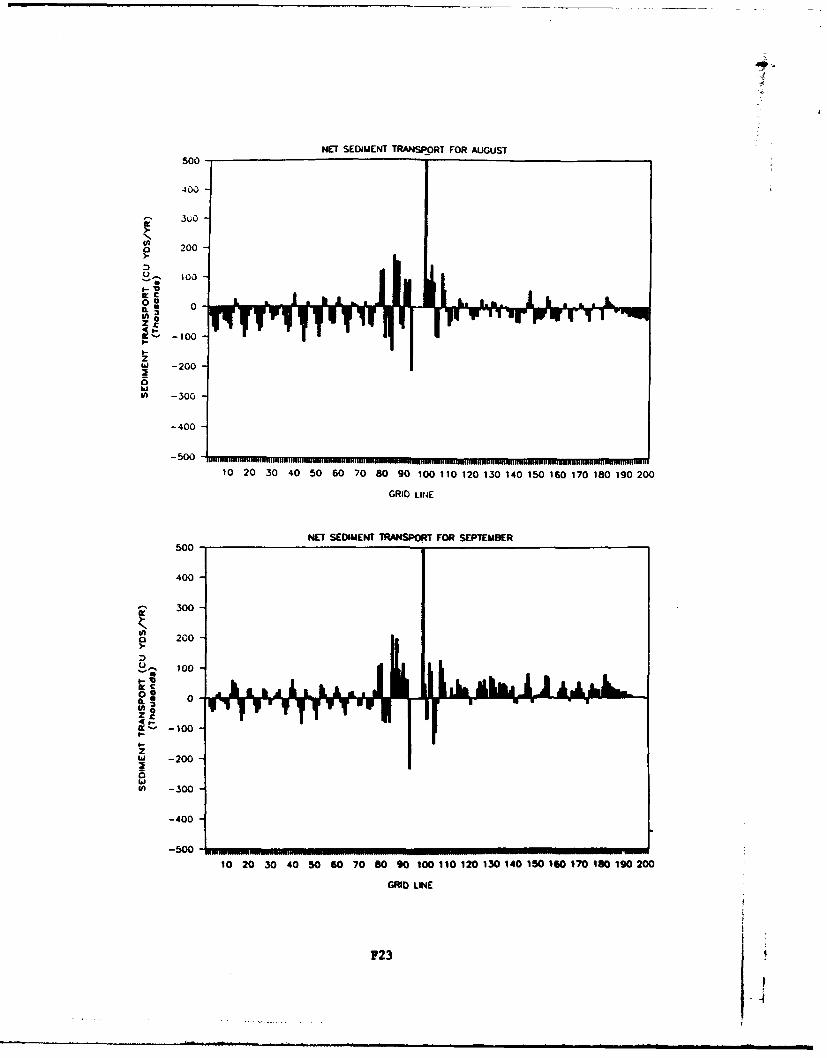
NET SEDIMENT TRANSPORT FOR AUGUST5500
400
o 200
00-
zhi -200
0
il -300
-400
-500 -1 ...... . ..a ... REM_________________________
10 20 30 40 50 60 70 80 90 100 110 120 130 140 150 160 170 180 190 200
GRID LINE
NET SEDIMENT TRANSPORT FOR SEPTEMBER500 - ______________ __
400
300
o 200
lo -10
-400
102 04 06 08 0101010101010101010100
-200 LIN
72 [
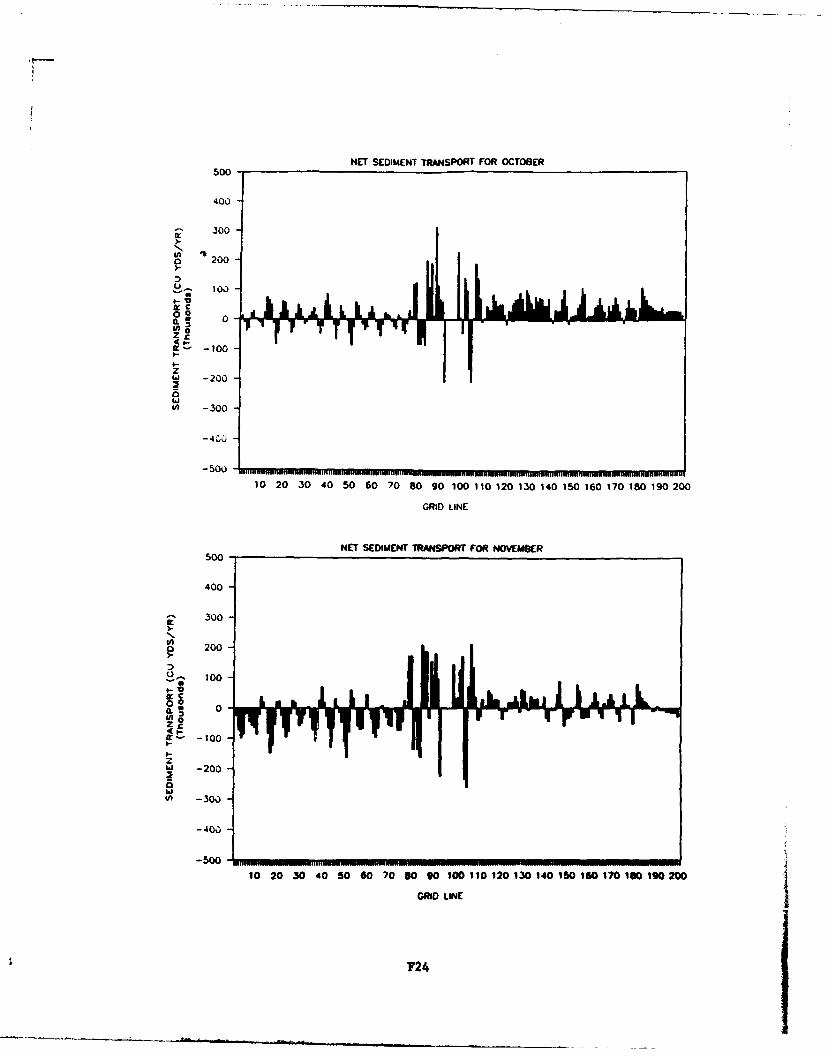
NET SEDIMENT TRANSPORT FOR OCTOBER
500
400
300
o 200D'
00
zhIr -200
-20
'n -300
10 20 30 40 50 60 70 80 90 100 110 120 130 140 150 160 170 180 190 200
GRID LINE
NET SEDIMENT TRANSPORT FOR NOVEMB3ER500
400
300
N,
ta
00'o
zhi -200
0to-30,0
-400
10 20 30 40 50 00 70 80 90 100 110 120 130 140 150 160 170 180 190 200
GRID LINE
F24
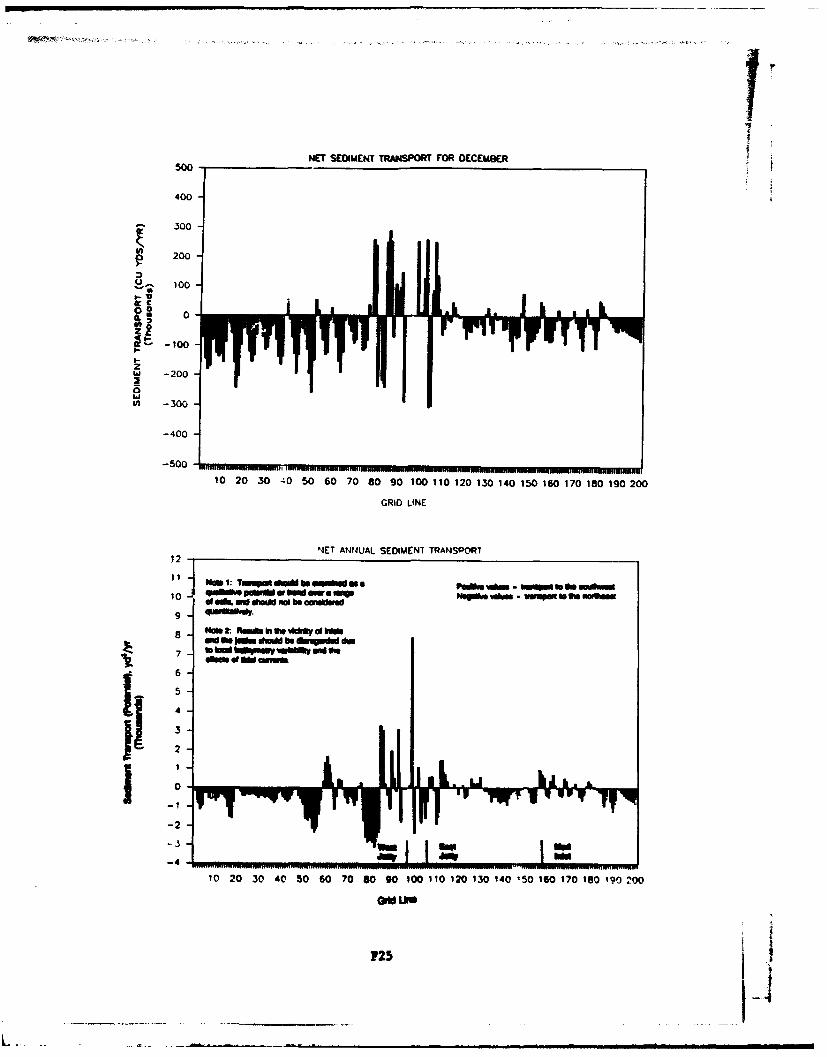
NET SEDIMENT TRANSPORT FOR DECEMB1ER
500
400
-~300
200
00IL1 0
S-100
hi -200
WI -300
-400
-500
10 20 30 -:0 50 60 70 80 90 100 110 120 130 140 150 160 170 180 190 200
GRID LINE
NET ANNUAL SEDIMENT TRANSPORT:1 NM N1: TmmutdoWhesbW wa ine o - W&"W I* feGw~10 -. db Newe wS Im cwaap"omv -fqwut bUSiWIg Ual af od vlU not be W~u
ads JW'e dinewn be 1 0- d
of 9" aomwt
-2
-3
10 20 30 40 50 60 70 80 90 100 110 120 130 140 150 160 170 180 190 100
am
725
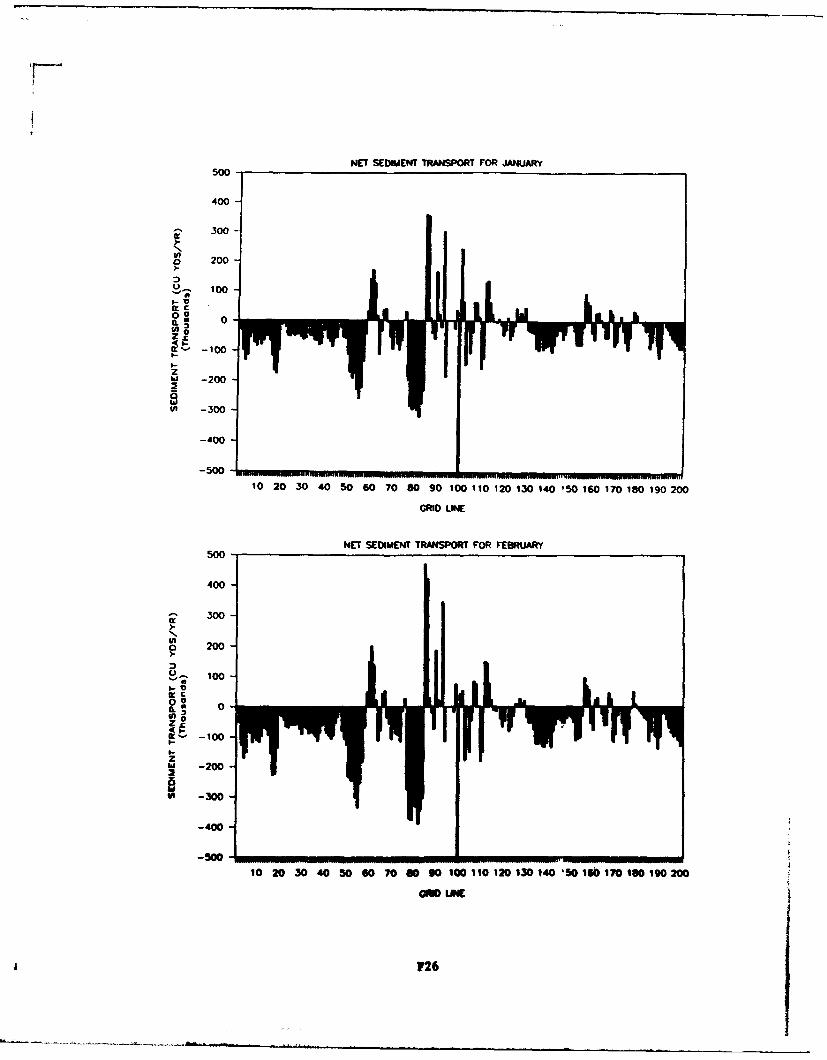
NET SEDIMENT TRANSPORT FOR JANUARY500
400
S 300-
Ntoo 200
2- 100c
00I,-z Ir
l-o
zw -200a
Yi-300
-400
10 20 30 40 50 60 70 80 90 100 110 120 130 140 150 160 170 180 190200
GRID LIE
NET SEDIMENT TRANSPORT FOR FEBRUARY500-
400
300
z
o 200
0~100-
0
) no4'1-
lK--100
z
U~-300-
-400
-510 20 30 40 50 60 70 90 90 100 110 120 130 140 '50 160 170 180 190 200
IF26
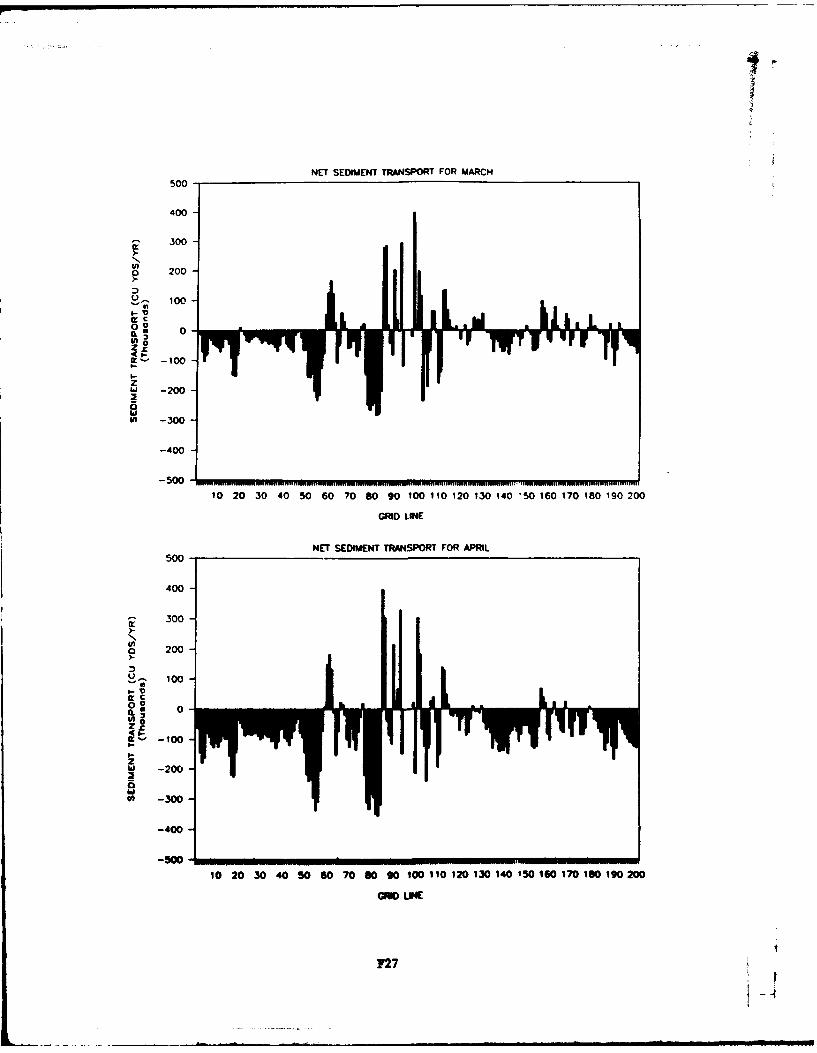
NET SEDIMENT TRANSPORT FOR MARCH500
400
£ 300NU) o 200
-- 100-
c-
1)-00
5200
-400
3 5 0 07 7 7 7
500
000
20
loo
-10
li -20
-10
him
U) -300-
-400
-5001
10 20 30 40 50 60 70 80 90 100110D 120 130 140 150 160 170 180 190 200
ONm UWE
727
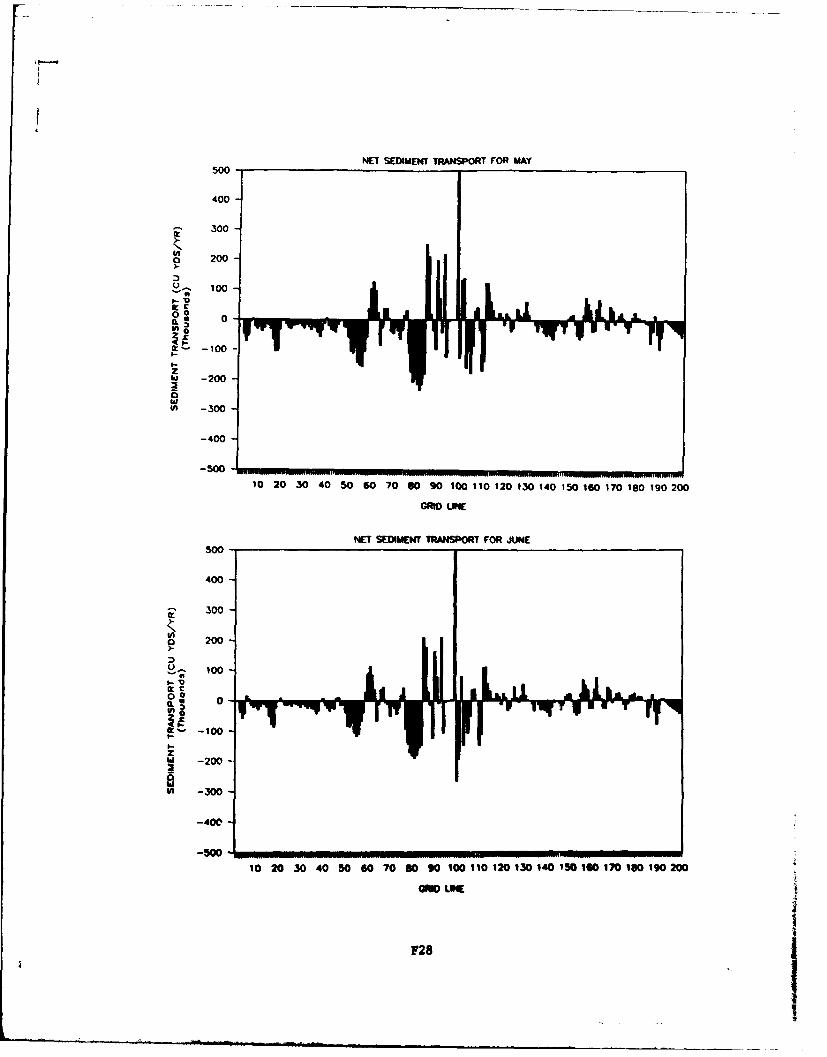
NET SEDIMENT TRANSPORT FOR MAY
400
0o 300
N,200
U~100
00 0
-10
zhi -200
w
hit
U~-300
-400
-500
10 20 30 40 50 60 70 80 90 100 110 120 130 140 150 160 170 180 190 200
GRID Loc
NET SEDIMEN TRANSPORT FOR JUNE500-
400
-' 300
in
o 200
0100
vi -300
-50
10 20 30 40 50 60 70 S0 90 100 110 120 130 140 150 160 170 'so 190 200
F28
I
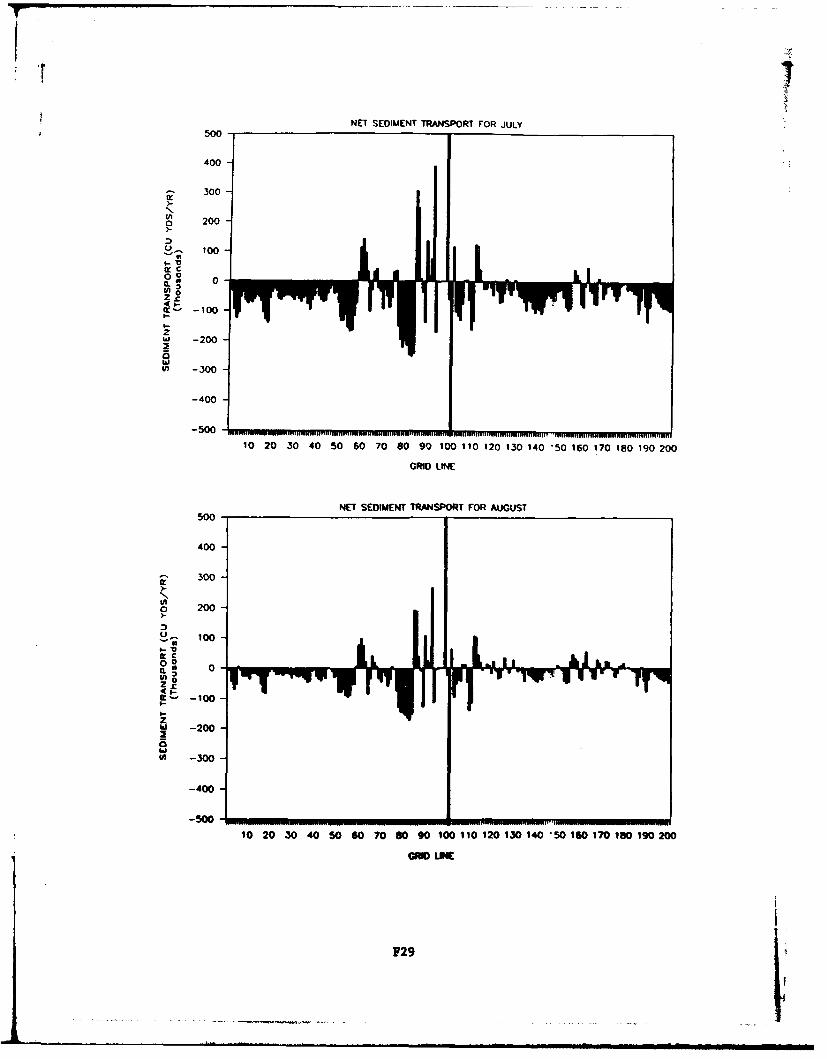
500- NET SEDIMENT TRANSPORT FOR JULY
400
300
O 200
2- 100
00 0(L 0VA 0
zia -200
(Al -300
-400
10 20 30 40 50 60 70 80 90 100 110 120 130 140 50O 160 170 180 190 200
GRID LINE
NET SEDIMENT TRANSPORT FOR AUGUST500
400
300
a 200
m c00 I
0a
-100
zhI -200
Wn -300
-400
-500 ....
10 20 30 40 50 Go 70 g0 g0 100 110 120 130 140 50 160 170 180 190 200
-W LINE
F29
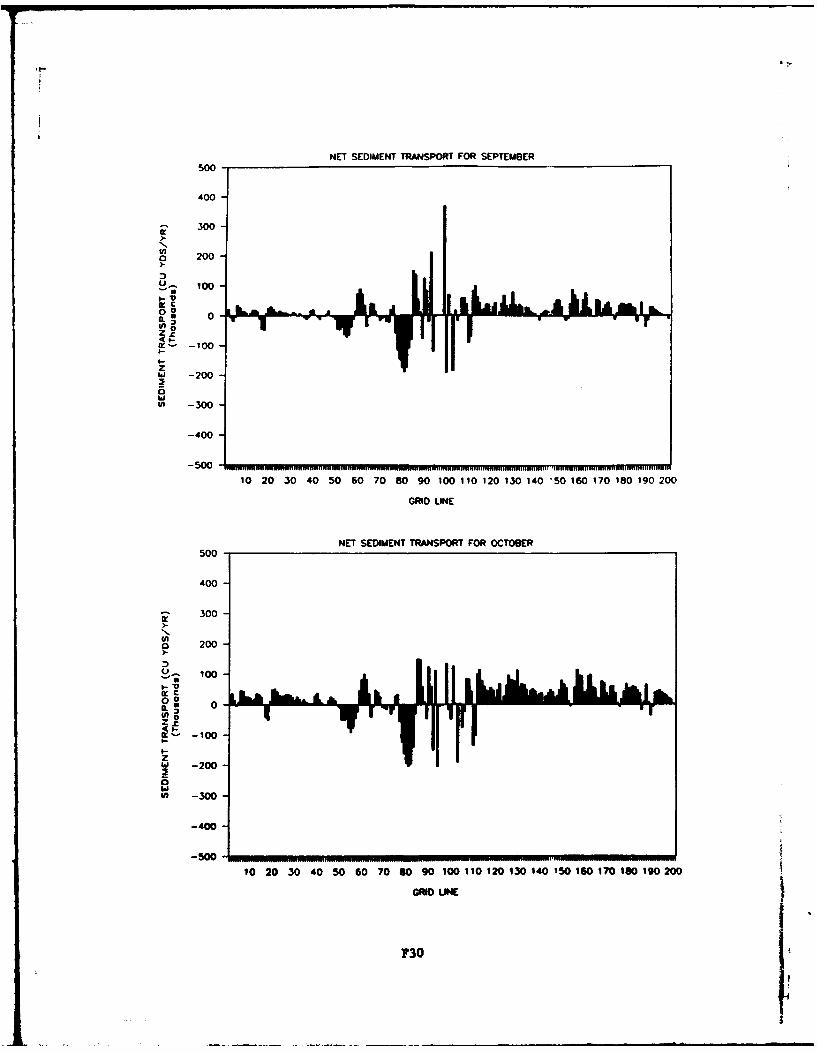
NET SEDIMENT TRANISPORT FOR SEPTEMBER500
400
300
200
U- 100
000
4'.t--100
zhi -200
U' -300
-400
-500.................
10 20 30 40 50 60 70 80 90 100 110 120 150 140 50O 160 170 180 190 200
GRID LINE
NET SEDIMENT TRANSPORT FOR OCTOBER500
400
300
o 200
100
00 0A
-100
zhi -200-
0hi4fl -300
-400
10 20 30 40 50 60 70 80 90 100 110 120 130 140 150 160 170 190 190 200
GM ID NE
730
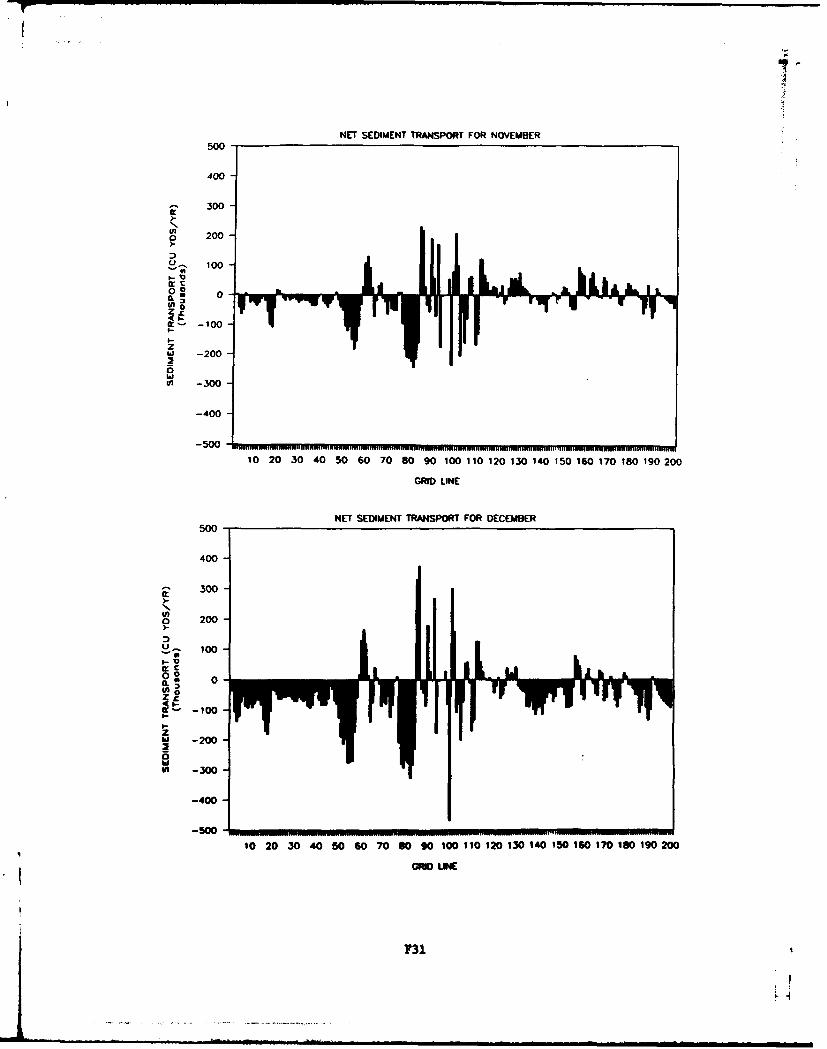
NET SEDIMENT TRANSPORT FOR NOVEMBER500
400
In o 200
100
0t -100
0
-100
50-
h -200
-400-
500c
010 1100
i-Um
00
V1 -300-
-4-0
050
10 20 30 40 50 60 70 80 90 100 110 120 130 140 150 160 170 160 190 200
GRID UNW
731
APPENDIX G:
LITTORAL ENVIRONMENT OBSERVATIONS
(Pages G3-G22 represent data for LEO Station 39098, Ocean Isle
Beach, NC; pages G23-G42 represent data for LEO Station 39099,
Sunset Beach, NC; pages G43-62 represent data for LEO Station
48002, Cherry Grove Beach, SC)
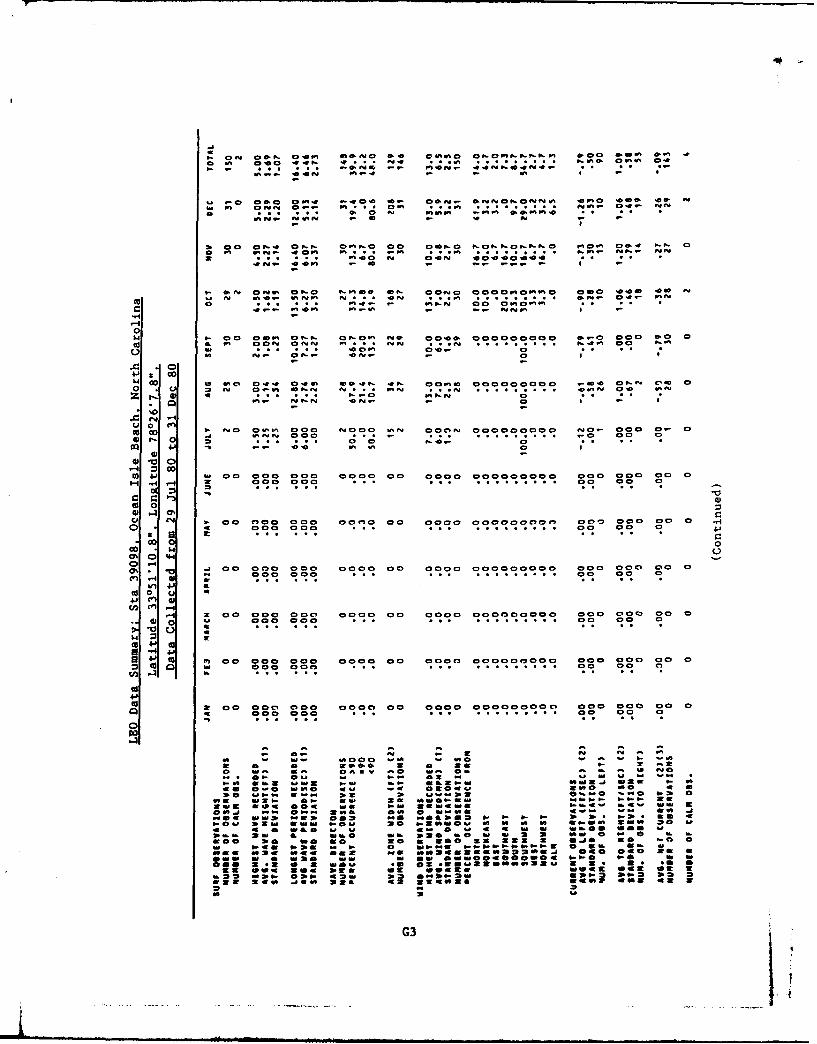
0- O C a- Caa W0 fftem0 00 m339 C- a.&-et- .0 .0
% . C!
U e 0 C 3. '.CC e CON C-CN .oaeC e*e N . N
N, CW -- P4N * 03 e4o foo r O S
* P 0 C 49.5 .a .oa'
r.c4 - e oan - 1 a a..
I ao at-a ata ~ooo.. . .oot-c oo oo.......-- 403 00o of.o C
~~ . aoo o ooo t- oooo~ '.o.'aoooo o o o o
$4 0N 0 O a N0 .VC a0 W. f a t- C 0 3%03439
4J0 20 00e e~ e - e OWl 00 an•coa V
o -
a a- ea Coa t-N Ct-Ca Jo oat.- oooCoCoo 0..o CoC oo C
0 a 0 1 . 999 0 :9 9 30 CCOCo C
.. ... . o .. . . . ... . . a
Z~~ .. .C 99t- 99 C!NCN-C
0 0
1 .. Co o -mu
443
On moo ... .CC CCC .. ... . . . . C C cc
00v
14 2 cc C C CC 0000 00 COCO 000000000 CC 0 CC L C C 0
2 .. ... .... ...
04 00 44 Cd
in aa 0 0 l c o 0, 9 10949l 9 9 9 9 9 0o d W a S 292 CC C . . . . . .. . . . . C C
00
02: "W a:
* a C C C n. . . . . . . C CC0 .;: 0
4z
00
0 ~ ~ ~ ~ ~ 1 2a:O I- WCe 0C 0C C 0C COCCO CC CC C
at 0 0 0 w 0 a ~ : % i i a . a. l
: 2 VA W. a 6- "-r OZ we -9 a W a* T
.2 0 3b M= 0. 3 0" 1.. -.
Va-a ma Q 2mE a-U a.. m 2.4 U tqu, mai a0 04 30 4h - 34. 30 m
20 S-.. W~ .2 2 ~ 2 0 -C a4 G3
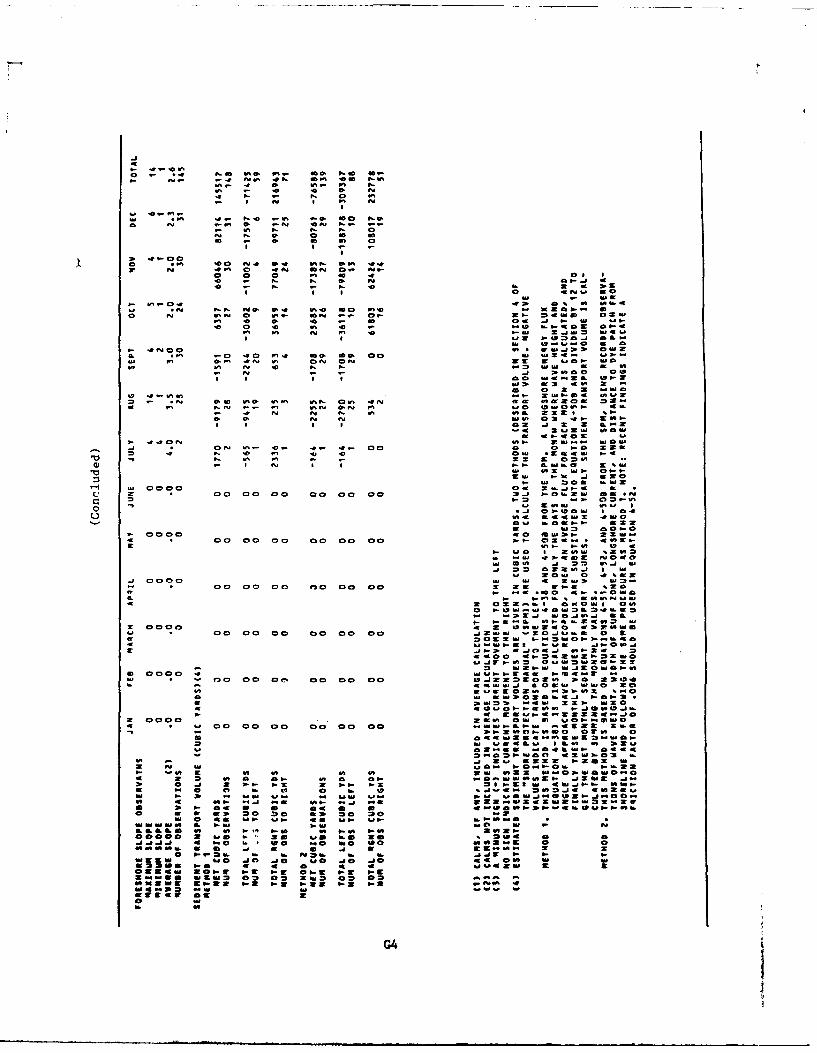
0.. 4 CP. .0
r I 4 at ft ge
o3 do r 0 ON 1f 0
-~31 doN Pa a CC 0 - 0
ev t 0
3~~ ZI. 0 44ON 0. WNOz 00 on no no 40 0
C~~~w w -.S. 2 0
S 0 C! m te maw
o .t .0a 0 .0- no 0..- cc 2CI WO . W
Sain .0 m .0 - w m . u ta
no~U 0bGt.E on no0 0ma-~~~.D -*N0 .0-J3
00% 1.- 00 . m z ~ 3 -
* a 2 Z - WO2 *N 0.0 no0 DoV 00 nog 4N 05 . 7"s5 2
no 002t 000W 0
00 N .0- .0 * 00 0 0o g-0W
Z_ a0z IN 0.0.0
m ,-m a 2
1W 00 0 0 00a 0
.j .0. -p o - 05V
:a Oo o a Owa 1211.C I 0 0 00 00 00S 00 %0-0m V
.03 := :;a 92I 00Cw A ~ l t~I
G4-. 4.O eem
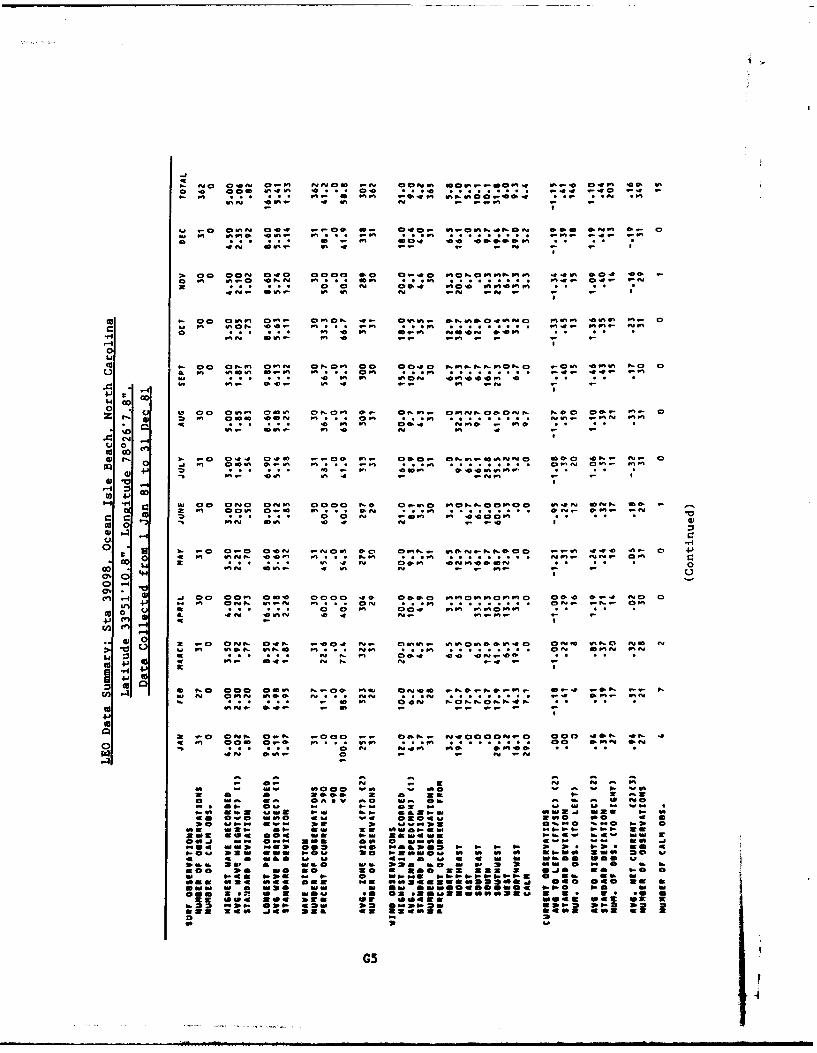
nn ear 0: a C! r.m
Cn ea a: n -- n -7
N. C30 C n~ 0.c m999 Waa 0 9i 0a:cn ear I% a a 0.0 m IO -.0 -' 9
a 10 at 10 Wom a: e.m nnn t-40
0
0. o o O - o i c
VI 00 * a, C O Ca ae Moe m Or 01 ar som mm t an s p,. 0 ~ a.G a
w Do af O - aaC a a CeD nin. P- a mra9 ea n e9 *n ac m -
(Jo'
Ma ao Dom a aoo o 0 eL Du-a...........9":fl7 Oa a a%n m Pbf -oe6; mm D a.am
cc 0 o-I4 4 m
@3 @3 0a 0 nt F.e a -eoa.
:- an: en rn %.r r
(3 -
.an en . et a - F- ar w I F
0.0 Ia-
ft~~~N on a a cc m m cm 1@3o 0z e an- 3o e o a m- I. -
w. w "a at t ow'46
w a3 0% a r& ano . aee on oa- a c -e o nm 3 3 a - ne aw3a e- at-r ao s a....................o a anw
woo V& w a .0 o = rn a n -. o
w a r " u n. t- W f a=:9-a I10 .6
94G5
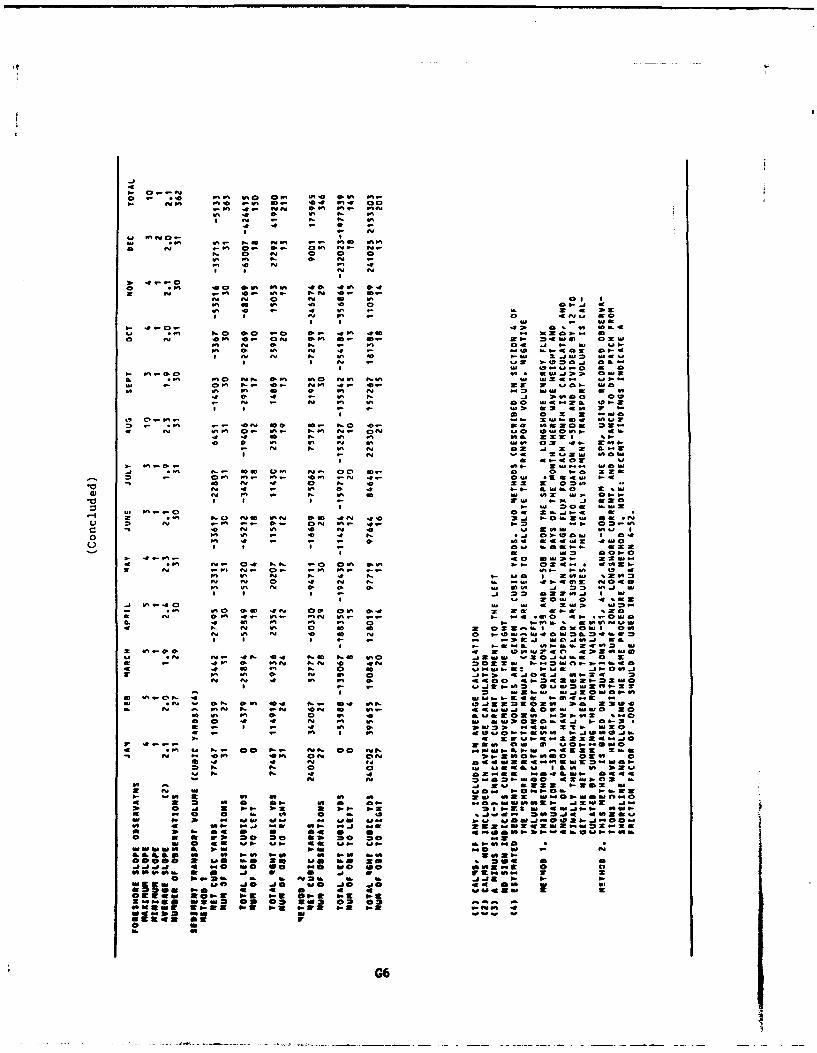
4- 0 - C2
.- m~~~r W.. n7. e i. n
-z z
o : ZZ. WOW. 0- c .. ..
N 4D 0 r 0110 0 N 0 n
F- 4 o-0
0 ft .0 ft3- z O
o~Ol *m 41m m 0 ey 0W, Nl . 40 a w 1m 0.
W: OZ =0 *I"00N
P4 4 4"= C
-A m :1 Oz z " -j I CO SIc wD*
0 0 0 N 4 -s . XO 0-
ft SD 45 D0 C
0~~~z 0 WI"W NS SWA C S4 , .0 4w -x - o N . O 0.
4-v NNow:00 S C0 5-
Uy a 9 2 z w 0
oft W 4 N 0 0 00. III I *s-
4~~& -0 N 0SDS 0 4- MEON
It C 3s-COE SDc
16 C5 0 S Ow F l.* W O.0 Ny 44 am N- ft C, N
- ; & .- 4wo0 to-N 4.- OW *E MW;"a
.33 4m 1= Wj 01 N Z"
0- 4j 4 0- 0 4N W C K4
so e a Io :0 "00 s- .j 020
to A n. 4"0 1 ON lot m. W- -s 2.4 ~ ~ 4 '0 0 4S l W mS
a 1 V J 0-5W I 0
0 0 4 - 0 0C CCCW 44n
I S I0*4 O N5-G6
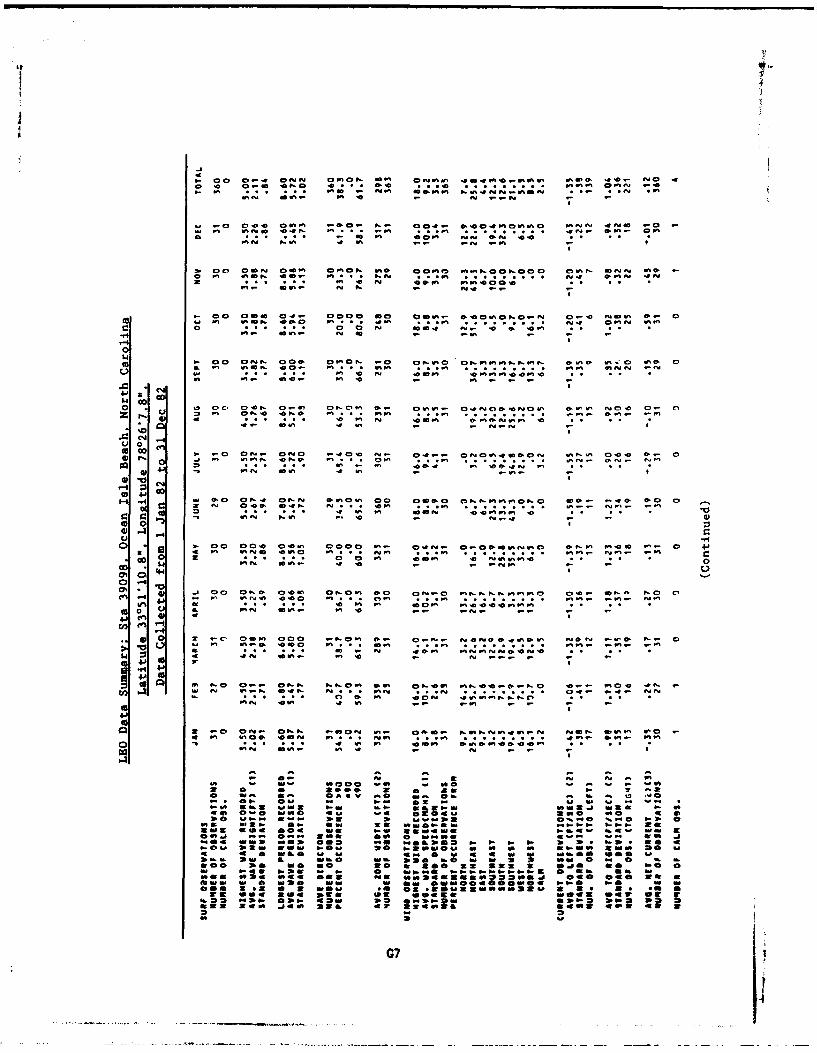
9fl 1 .9 Ad -M,0 Nn .eflmd,-fti
d 0 0.110 C . 00 1: f C91.- o0C9 0:9n9O rP~ Pf f
M. 00 fiN 0:- 0179% .... 99,1- ll 99 7Nzd p.% *wo -- - o m
W OM0 0flf: 0fr OmON 9 o 9 ~ f 9m ol.C n- f~~ o
Gof in- em N . -
0
cc "- 00 OMd CO: 0r.ON ;;0 0,! n O15,rN~. 0ef . O 0I. P m fl .00 .. . . m m ft. -
0 C, .CI,. C, '0 CIZ On: 01-
u 0 m- ~ P
;;It9 f; 900tz 9%9ni,edv nN
(A 4.5
- ny r~n ,Z n rn 9l. 0 orm. .
*0 - d-0 f
K l i 0 0 m 0fln .0 Pdnr.. *LI r., in- . 0 - - r.- -
044
* ~O V 0 0r-. 0.0SM 0,-Cm 0o CPr N N m-m 0 N O V'V- ~ '~0 .. 0 . . ~ . . . . . . m. -n- ~
41 .0 rfC. .0 0 r,~
0C C, 0. 00 fl, m *- P -- .
I'd ~ ~ ~ r a 8v fn- r
4i 0 4 C 0 '
0: l
0o%
if03-
aw a a
I" 4W "w -: ::z Pd"& : . - , S. elb
in~~~0 0 .009 V00 .0 0 -5.bo UOa 0 a A VWSWs 0 a - * W **J
- if t 5 ::: -: 4- O - It & P
b-dR zoo a4"SU atr aft :a:-3 .0,P b .
~U -e 3100 45. .4 KOSJ 5. .0 .
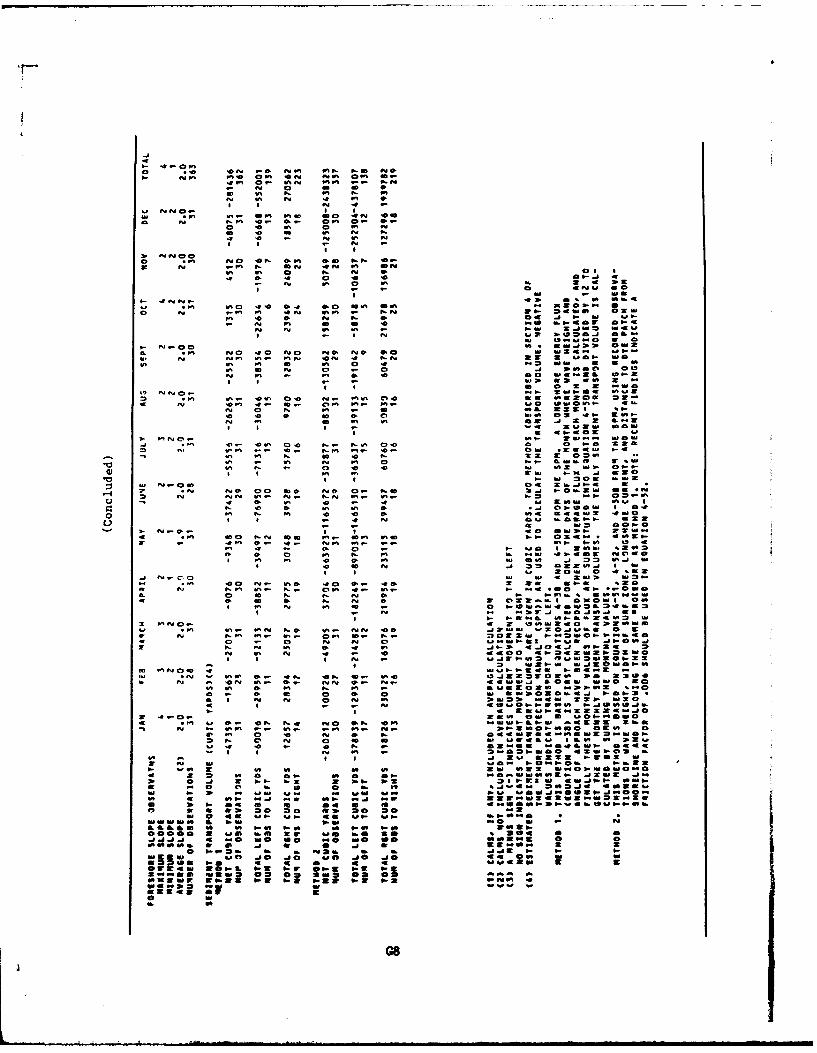
-4J
's t-e 0, inQ
I~~ft NNNo
40. a0 a;a N
Iw z
wW. . NO.0
- N . 002 4
0I 0 0 , - C ; 0 ft Nft m- ILw
*P fl 4.W4 0 00 00- OO
PP .0 0 NoN 0 w4 am -ftbe
we WO..~eC N
N~ If PP- 0 .00 e4 20 "1-,a - 0 m3 N4.0 z At-.t z
4D 0 N- #1 -4 o. a. 21 2 NN %.&0 .0 0 0 r CC -- l 0 ONOW 0"
N 65 0 .0 Cl x .j 1 2j05
P-0 -- ' ~ Ne6 P .0 OWa .1N4 me N-' ~ ~ f .10 10Na . N5 P
- Sn N 95 0 -N U~.OSfu
at N 1 w .0 . e .2 mN O-
o 4 Sn 0 - 4 be la0 abe Ia
I- w W e XN
U0 .- 0 aa a"Wff 56- *. 0N sVS 6
'~f I- I- 5 0 N e * am I- aO 0 P NaP- .m O-O C4I PP .0 00 a .I.. US 5V.
*0 :e to No Z.5 0226. 00hto be W0 or IF 0 0 I a
N 0 me We 4 .me6me
:sa.W 0 a Nt N "0 N91. NP WN0Nm4~- '1 09 N9 NZ 1 .. o m
-. N0 CwzF4 Do-.5 i 0 .
!Wm. 0 CZN0 m
I PPO...4 N 63am240 4I~aeII
-- *P----P-------N .0 .W ~ e be 0.b inN
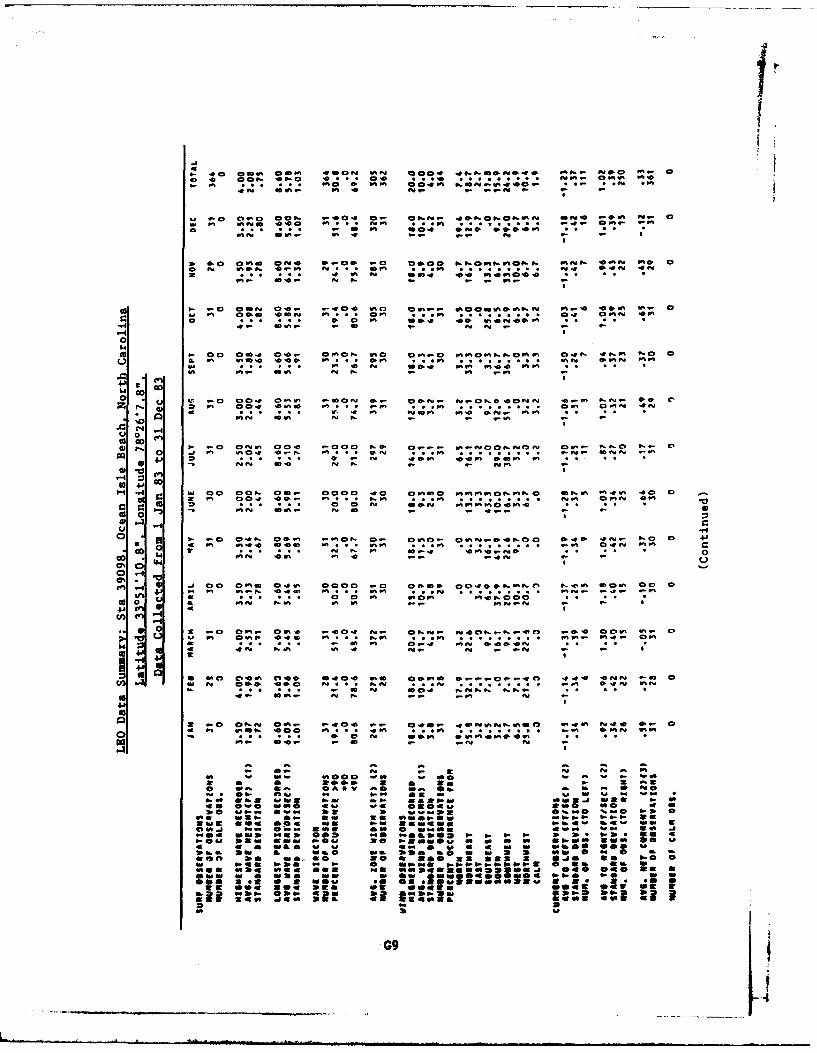
%UIc! 0
ou in inC C! mm oel .. .=ft..so: "Inon- a10,- ft F0- ..-
.. e - C 0 cON C,00 It- cam. 4. ON0.n an ' 0,i #4.mai im 00 ft** Om ... i zo 9.- 9m. .
* ~ - o. oftn s.. o.o c~enmm ft. wn do .0 on=. M fe
o m i in@: .0i In.. %ome.n .f- meft otmon= ff .0 9 ni in . n'i0
00 Go
o v -e 004 0:m- -O 09- oem.- monno .Ooi 0 n N.- 0 0Z ~ ~ ~ ~ ~ C iC. # n 0 4 US in* . o-n . .oZ". ci 0mm 4
co 0
w J in -n4 a0- in '0 . o ... mm - 0 i
"-4
0 " .1 0 on acm iMno0i.00.0 mm am. no an - - 4.-.- f
OM000 0
0 * N . 0 0 N 00in mO a. m - om-c Ne 04'we1 . 0 4
mm:,f 02m zi 'f n- P!4 ".- M -0 0
Mo -.. '00 ma .. m 000 -Z c-~a 000@ini Ni ~ 0 0
dlof-.............. 0l 4.0 o- ~ i mA&: . "wa u s
0 0& m Na in in otm - i.-n -4 4 1
2",j cm.- Cm. 0004 .- : . 4N-.'0 -' ~niso0 0.-,0 NO. inC04 m @e0i
- ~ o 4- a mto.N NN N
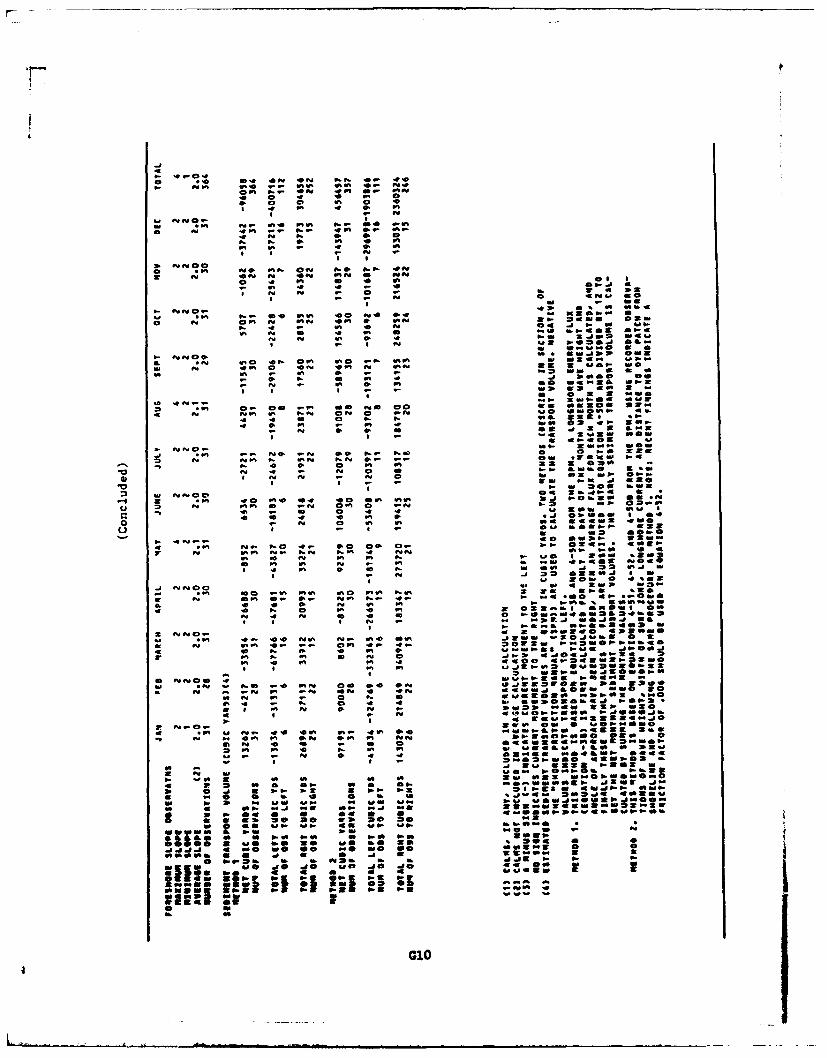
ft *4 r44l 4 N. - -*0
ft ow 0f 0 . ~w. 0 % 0 .0
A I. ft 10 1. 0%
94 *N C! h a:;. 06% NW@X al We- N 0 if '
I ft .44
.0
4o w0 Al M.. v~ ownAD 4
b- 0 4 4 - ON.
* l l 0 N 2 4W I-
*~~~o -a 0 Alx4 f
&ww a -40
Mf AlUlON 43 0 .% C @
N A @ 0 W 4 O EO 06.0Al Al 0' 0 4 N 3.Jo W4
0~~- *Al a' aN aN "A I N WUw.
W ow Z W: 0 4 owl 00 %a&
- 0 Al- o~t Wp% 0.6 a 0 W @ N
* I Co. - 3 if W
a on 0 0
4 0 0% . on .90 a 49 3 W N 2Mw o
-l Al 0 4. 3 0
.5 .*4 -- Al M~ 00 . -w 0 & N: w 33W ~
z 0-0 Al l.-A 00 W P W W
'C~; of to t W N c o.
U -alC 04A 306N 0000 Z
to go% ob 40 w 4 4 20
4 4 4 4 N .. 6 N WO S @
o - A 0 N 0% W WEEZ Of
a a .. OW OW N ifE
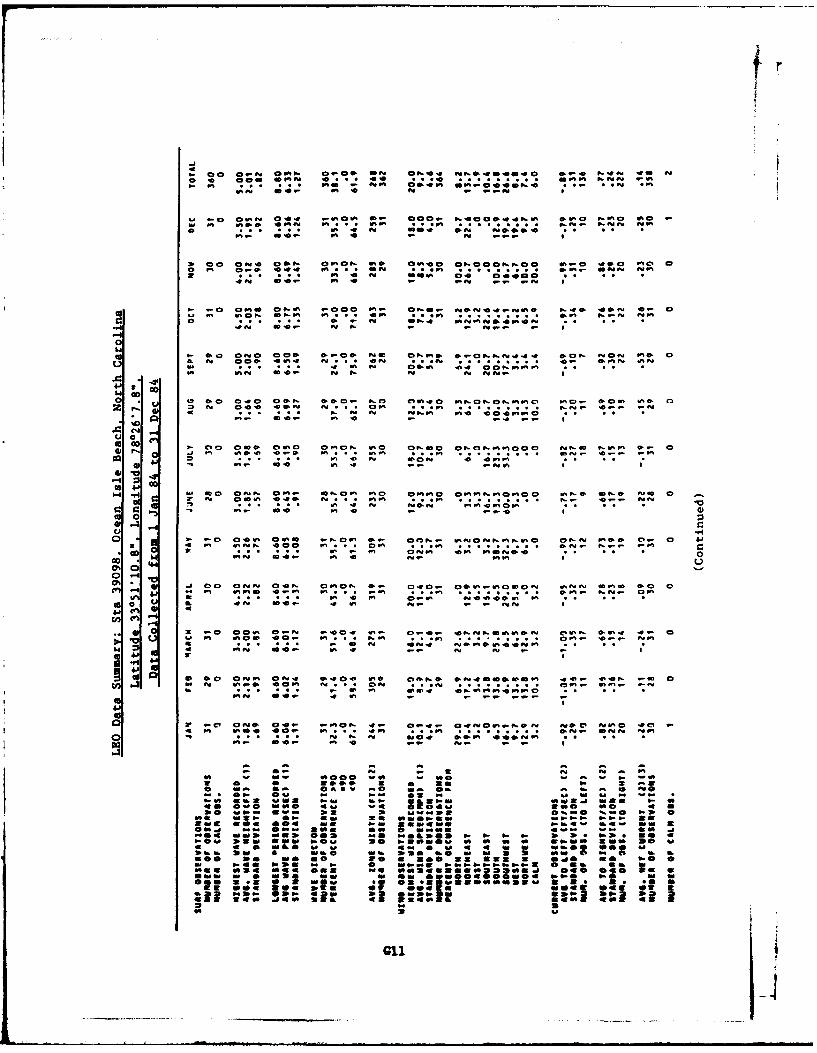
0-D
91 0 0 CD0,- 9 t0 C! - V.-
.0.- 4.- 39 t-N -
0 0 a.3 04 C)0O *
0.0:0 .00. Id wN -0 p
41
mrw WON 00
m.0
0n 90 0,40t 0:N 99. tO n00 -0O. n 9.C 40.. 90 %9in IN 0.0. C97 . I. . . ."4.:-.0 .a0 NL ft N 000 E 0.09
*~ 9" VM4- .00 i . .-. N3 U
o cc-w a
a 00 a ai. 1-0 0- 6. 1- w--. a- - :.
P000 6
I 39 - 39 0N0 1 . .0N.0 * .0. 39. .0- 3:. j93tto 40,aatoi a W- -0
0.-U
.J 00 CN .0 0900 9E 04. 0.0390.0 .0NGil. 9
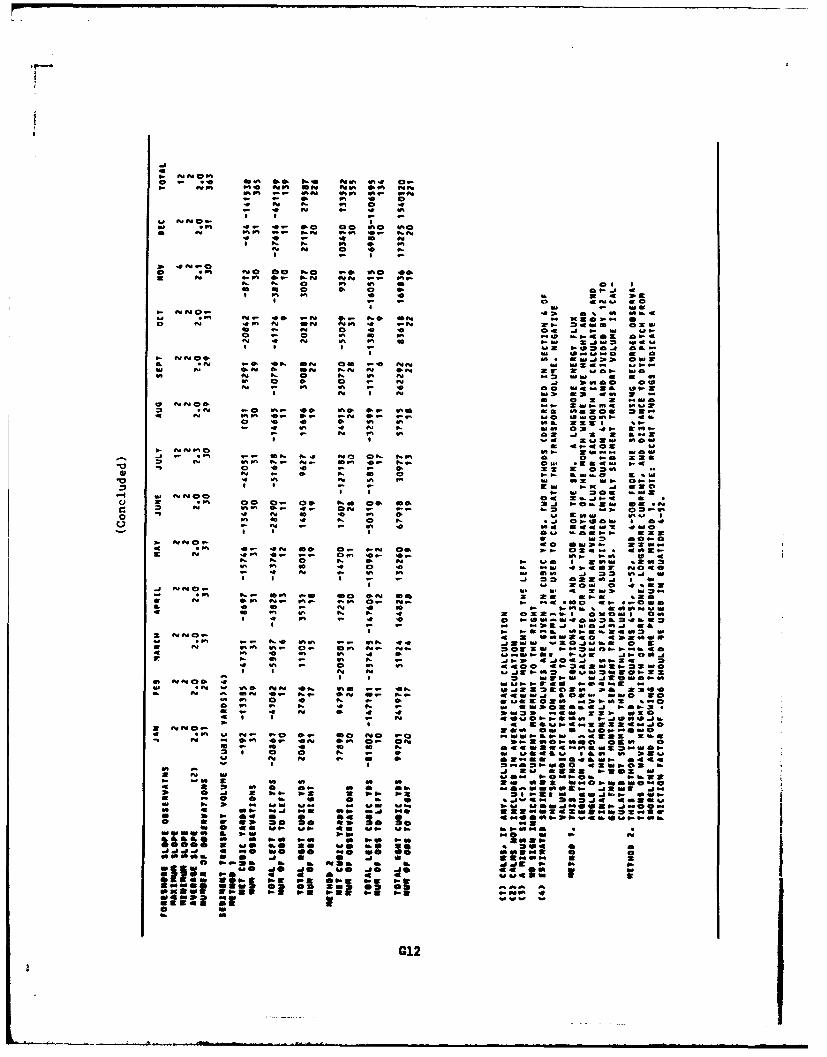
o~W 00 .o mo 0 N N. 0 .
-~0 o.9. V... I9 II.
go 0 * 9. 90IV N. W
9. W a-~ 41 as.
-y ft fv r-a r ..
99 IWO 4 00 owl V.0 001 0 . 4 a. a
4M a. C a0 a
p .e ew o ee . c *P4 &- a a w. I ma
.0~~m W00 0 0 9. 00
4 9.9 9. .0 o- W 3O -:z3
0 * s- M N0 rd- 9
a-M a~.- 0- 0 a0 =... 91 .. 4 **9~ ..- w. ew0 ew we
* a~ a W Z:M993.J 09N ~ ~ ~ ~ -NN O0* 0.33 0
orw a- e e U - 0 Ne 0 9 2 9 . 9
.0 0 0 NU I 0 ...a V .oao "Z IM
* 0 2 2 . 0
M 9N 90 Vs 0 VO0. 0900 0 2 0 3
ft 9. me"9 V 02 2 92fV -o 002. z 09.9
0 09.0 2 .9.~~~ ~ P,.0e. 2 9 959
do N9 a N 0 a a . to&W*o' o 29 9W 09 "@ VI . a x a.
tJ~' U9. Nm 00003. N 9 N*
so VI$- .0 4 N C N9 0 9 9 0 6 0HH Ni inI - VI 0 H000024
M* a W 6.. a0N 2
N C1209
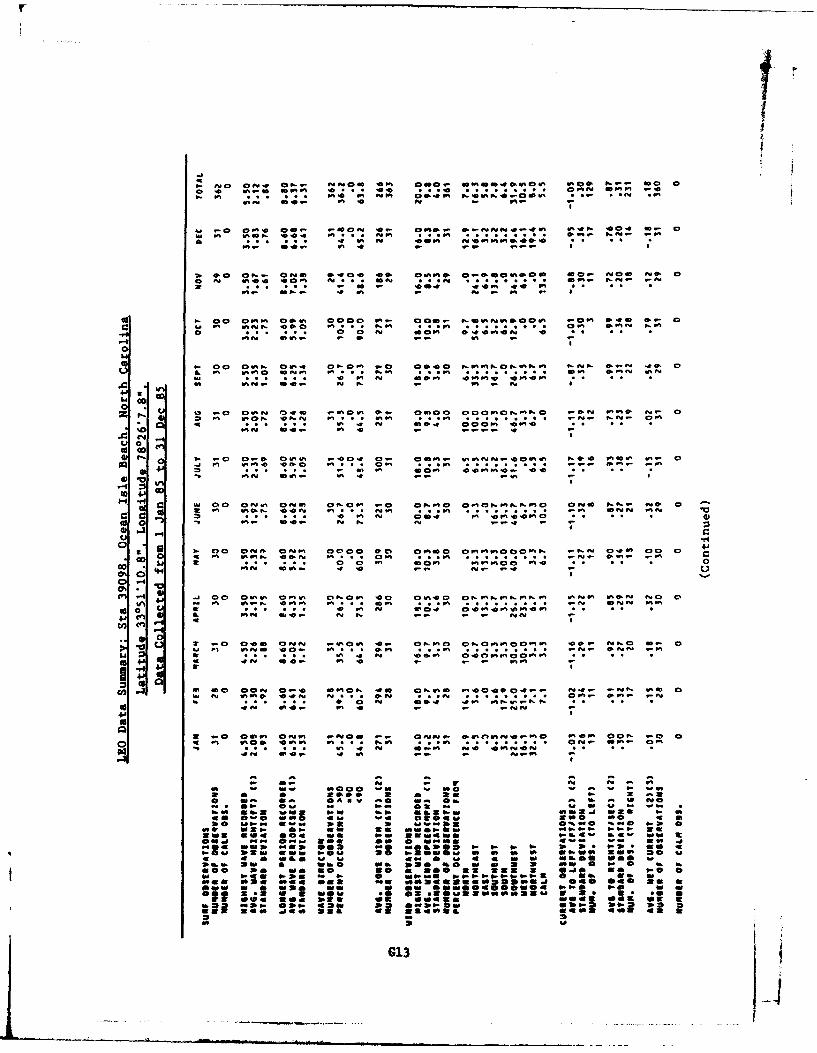
a 0
a,* in.
W191 lnlw9 ": 01 nit9 On:4%-ft 10 lvie:iVi0 0
0 a a0 emv CiW 000 vi. 9a. tiv v n0Y "!% 9. i%0
0: 9 0 1 OV 4 l15 4"Do
0
in if 00 Mvi. 0 4 0fO 0 0140 t-liONbv 0009f 10"4
to 4fvi 00~f
cc w o - @4.- a. 9 i - z 9
vifil @4. no 4 9 0: 10 -t
00m 00
RA ;o 19 .iv .O .. . .v
'-4-
44lI-I~W: an4 1 0W 0 15 1. N fi - 2l ~nP.S~fO 050 N. 10 0
0 IL
:00 3 o : 0 0 o vi mcvi OR vi atC go, t ab- a fi1 g- .. * a "-.- 1 - g- s- t.I
.4 .4 00 ~00 toi alv 0Nv 409 0.0,02 aPPvi-iv V'1W. i V'0W
:i5 0. 15 "-- .- Ii : 151R sm s W5 O
C1
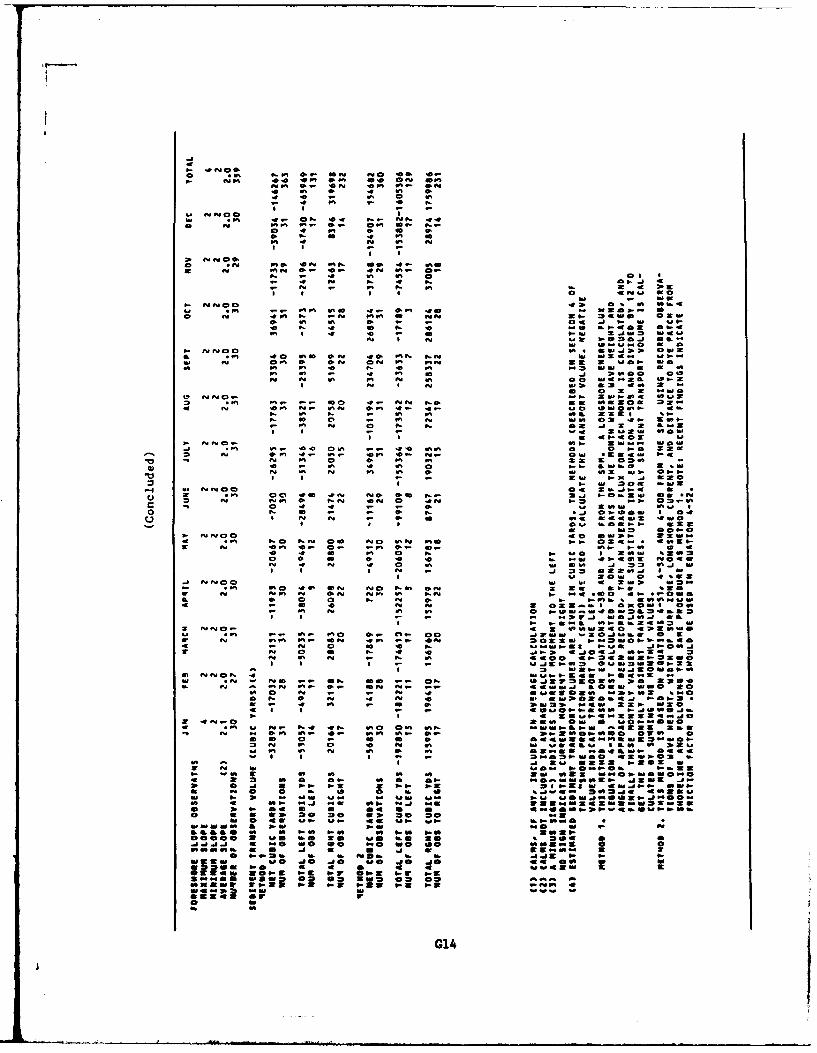
0- o
4NOft
04 m0 -m no IC
0* SO. =Aw -
mlai 0000
0~~4: N '0. '0 M. 0. .. 00 m T0 -C, t0 2 W.
3. .0 0 .
49 00A.0
N - .0 aw,0 a
OI I Iw .0mN9 .. C
N~w w.00 3.05 '0 '..
f'l Im n Q0 -9 a ON, 3. 2 0
00 0.0.J.0O a 0
a a00 10 * AN 4O ::*VI~'d 40 w%0 _N4j0 OU 0 4.
Im 0. w 90
N 0 - ' 00.003 40 O- '0 N ~ ~~0 N N* 0
*6 2 S.* - z 19.30 0.rd W,.. ft nW... WOWOW0 .
*'0 ~~ ~ ~ ~ = 9-~ '0- '. 0:Z .0 .. 0 N2 N ..0 4- .0 '0.0 '01. N.-a l- . 3.00 N
Z4 NOW00 0. a.J.3 ~ ~ O mm~ 00 400NN,0 j .0.3 a *
o N W .- %:-.IN :* =% 0 . .aW 0
N M NNO 40 W0 N a 3.01
30*0 N NO 0.0 NO '00 '00t 2N 034wQ m .. *- . 3.a N 00 '0 0.- f, @9l -a ""NOW N I
s.0 30 . 0 4aW 5'3%
- ~ ~ O N' 0 f'O N NOa 09 SN3 35 50
0 Go 40 No U. at 0Z . 03 .0 0
* 1- - .NV WOJ'a".aI a.
O"* NVW.0 .NWZ00
3 0 ... 900.0 4 300
5, '0 -- '0. '0 .- 0. 0 .J WW 5.OJW.14
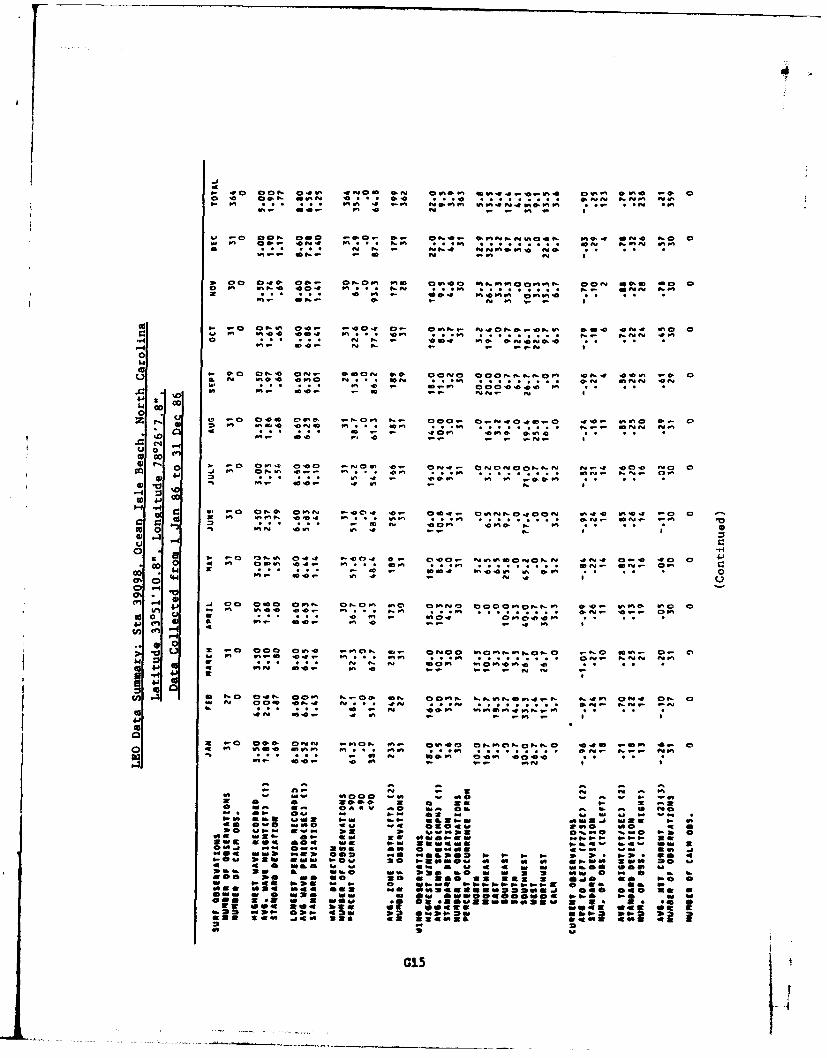
4 :0N ~ ~ ~ ~ ~ n 40 C0t 04 IN0 @.N 04 . 4 4.. . % 44 01 0o ~ ~ ~ ~ w 46 MOt- avom "... .46N~4 N
1 0: me. . - -~
..L -0 IV-a o -.. .- 0-1 -~.t 0 N0 N
14~0 . N -4 .. * N . N 4
0,0 a,- d 4 . 9 S
u0t"
00
0
a - a s0o 440 4J0
44 . - .9a
0 4 A w0 O O 0 :co 0 0t- C, It 9. 4 . *" . . . . 1 -a
41 en 04 4 .1 f9
-a oo a,
0l = C !0 ;4 C. ., ;1
4j-
0
.1 00 0 0 W4- 10 00O9 40 O4 O 0 0 40-D 4 4' 4
ft 4 0"- 4b a - -@0 4 4 -101 3 00 044 64- a- ON O 4 4- t-0 .t-O z4- 0 0:Z S. 00 V" .f 44 . . . . . 0 Owl N 0 9
KZ a"
- a -% N 2 .0 0" W 4 4 4 -.wo 4N 21 4 "M - 4
4-N a 4.- w 90 I- 4b.0 N0 M a:
20 - a a -nw a "bo z fl es- 0 N -1N 1 a
am ;Z :Wl 4000 loo Ov.. M l- a
do .e a mN 3 -
o w * ~ CAU V aC Na ft fGa s
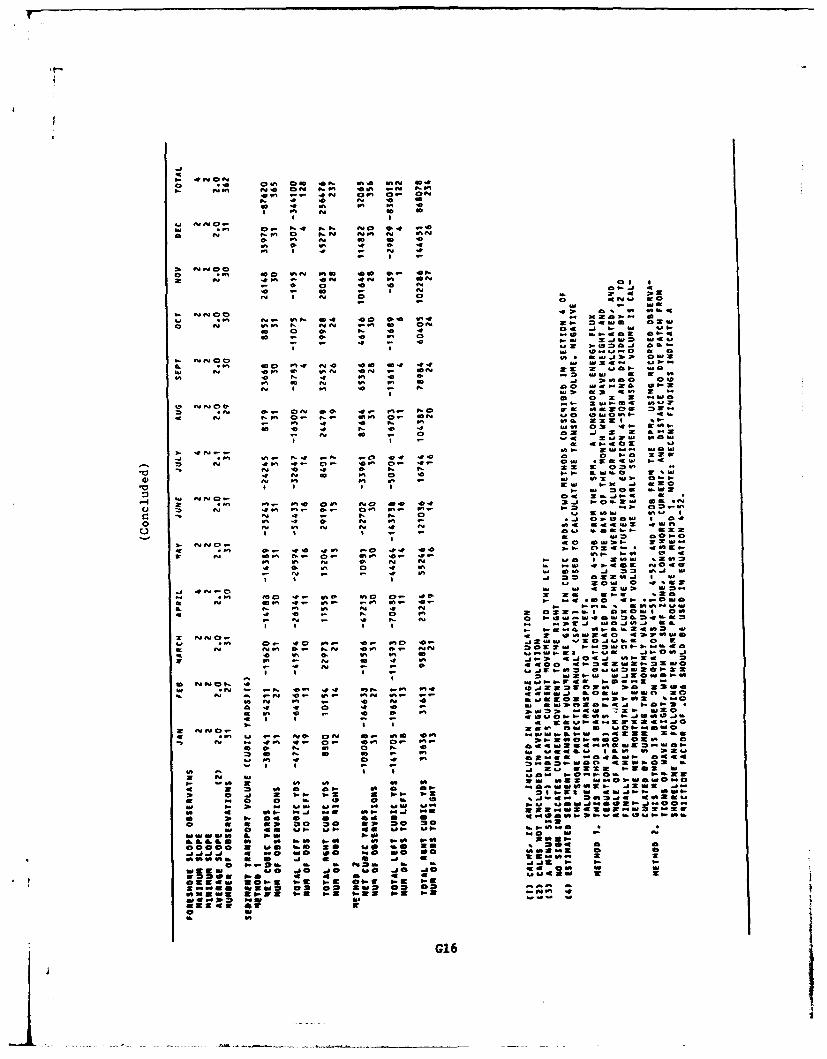
4q 4
a- OfNO
ft 4 .0 0 a
*O a
.4~~~ ... , a.- a-0 4t N
w. 0 . 0. N 0 fN
0 ~~ XU' .4 1.4 IM' I.- O
-j Z 0. '0 .
r4 w * .4
I Ow N:
w 0 04N
* : 0 ID w. Z. 4, 0 4 w0 0 4 .
VI 44 it.
. ~ 0
ty, ft305 of~a,, o-. ,' O
0-~~~~z " I000 w4*..,3 11
Mc*' .0 .4 NO .0 .4 4 . 2' .0
W N 0. 0 ON N .4 60 a. Wo .40- 1.1.4 ' P. Wi 0 0 -= .1.4 S w
41. .410
-l Z4 4& .0 WO .4 Z0 21 0 2
-~~~m NW a4 - 0 0 . I 2 M-
Iz" 6. M a 1102 0 10
Ox: 40-0w aow
3 N 4.4 4 C00- 00 a- 4 l 44. .
44 N 0 b. I. .0x0 .. 00 3..
No 4i 4. 0. 0- eft4.. ..
o~w s4 go0 4 - J 0- 04
Ob a a a a. .a-- .1
0 a o4 0 a.a-A
V c a N w. 0'.0. 00 r c . a4- 0-
a-0 4.5 s- 410 .0 . 33 05 I
.9 af a 5 3 2215 I
G106 0 404
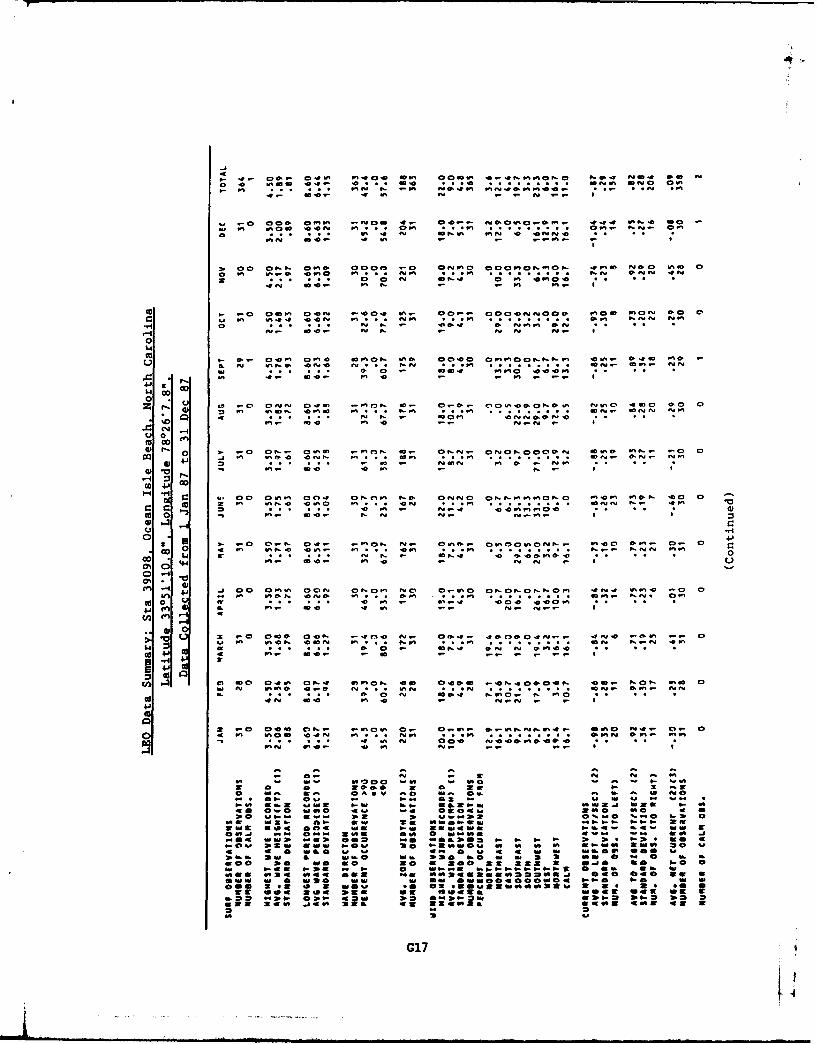
o 0 0om .0 20 z 9%9i% . in.900
0.- o .0 .0 aI -0-
*c 0 0i0'a 0 n *~
0
00 0 e Ct, n 0- ! --PI
W 0
00
. a - -. :, ;; -:, 9 ' n
0 -4
1-4 41 _ . 00 an.- no- O 0" Nto Onflo of, n ON n0o aI0- 0 0 g 0
In .0. n0 s!i-. .00na0cc 0 - n- m. if-n-.
0~
44.
00
00
00-in.- a" 0- m - n
-~~~ 0. 00 c -O- N. no .02, 00 n 0 :f2i - *
a4A-,'c
-C 0. 3; a K A0r aM. Za I.: a- c Sa 1 I I
,si .~ f 460" CI.' -i w- OK -- 5 -
S-I .K .0MZ hSM h- UBS.SMMSM..'G17 N .
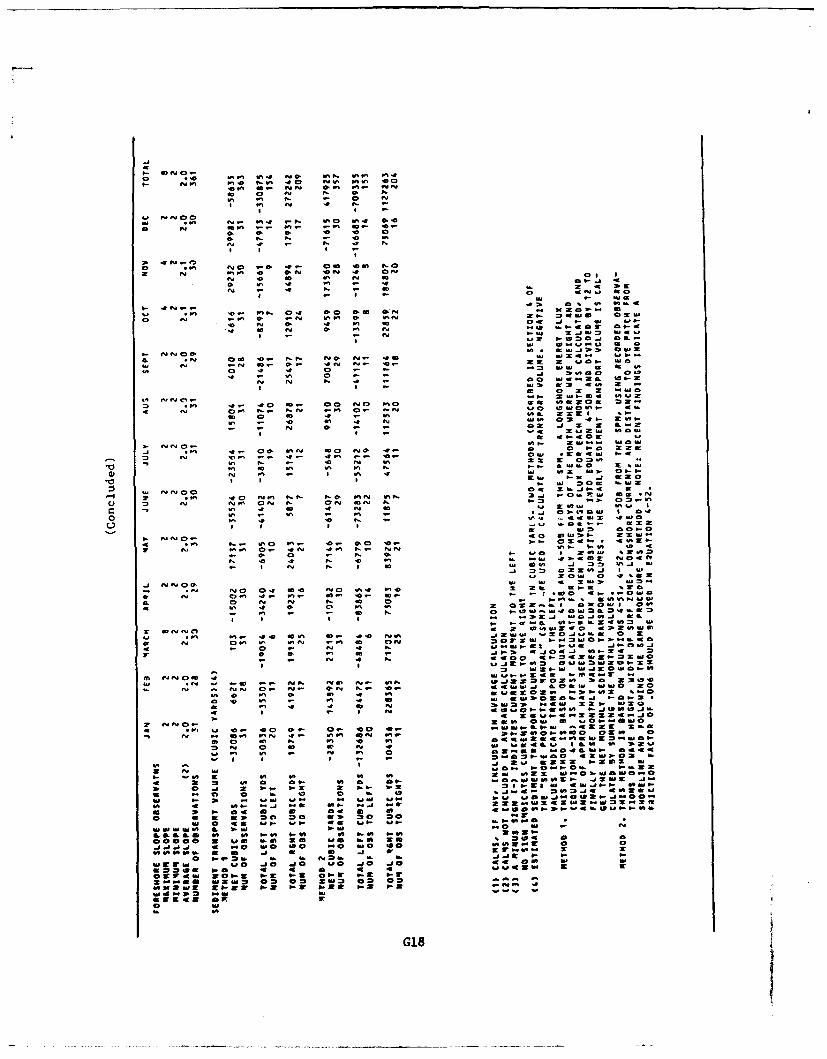
W- C.SIO
491 "N 0 0 NN
4 0 N N 0
0, wft Ni o
0p. 0 wN 6- =- w a
N 4o 0 &
-~~ 27 C4 0
4 0 N ) 0 0 N 0 "=WOW 01-
to2 N10 J 0@
KO4-...
NN0O 0 w42 0m42
lbS C, wn 0=-T4N N
9 0 0 00 0
00 a 2 2 -
x9 NNCV IK z4 O*111 40 0 0. 00NO 0 00 0020 23
C ~ ~ ~ ~ ~ ~ ~ ~ g NI,~N- N 0 0 N4 44- C.
4 0 ~' 00 2x2* I4 ~~ ~ ~f Z; 4 34 O
- - N - 02 2 m4
I 4 2424 40w CN 0 It
-~~ 4 a 4w arcN i.
0)~~~~x b Nz 0bI 0 b 2 N-S I0 I- Oj NW "1 0 9
N0 0:0 .40C.&MZWO -M
w :NwO%;
7 ~ ~ ~ ~ ~ ~ ~ 5s aw4wO N N O N3.s2=4 9*
0 a 4 C NOW
N" 4AO. XO 13"r 02C .11 N. 40 .- ..- 0 4-Nb- 2C *CO:
V ~ ~ ~ ~ ~ ~ ~ ~ W N r . N 4 y NO O I
-~~~~ ~ 0 = 0 . 0 * 34 .0
00- 2 04.
0 ~~~ ~~~~~~~~ N 091 4- O 11 . 4 - - 0 N.-
a I -b m.2 00 J:~~ r~f ONR C4 a4- z 0
Cm 25 :?2C 222 ONNO
4 .0. 4404 49-44 O .24 42..JbG18
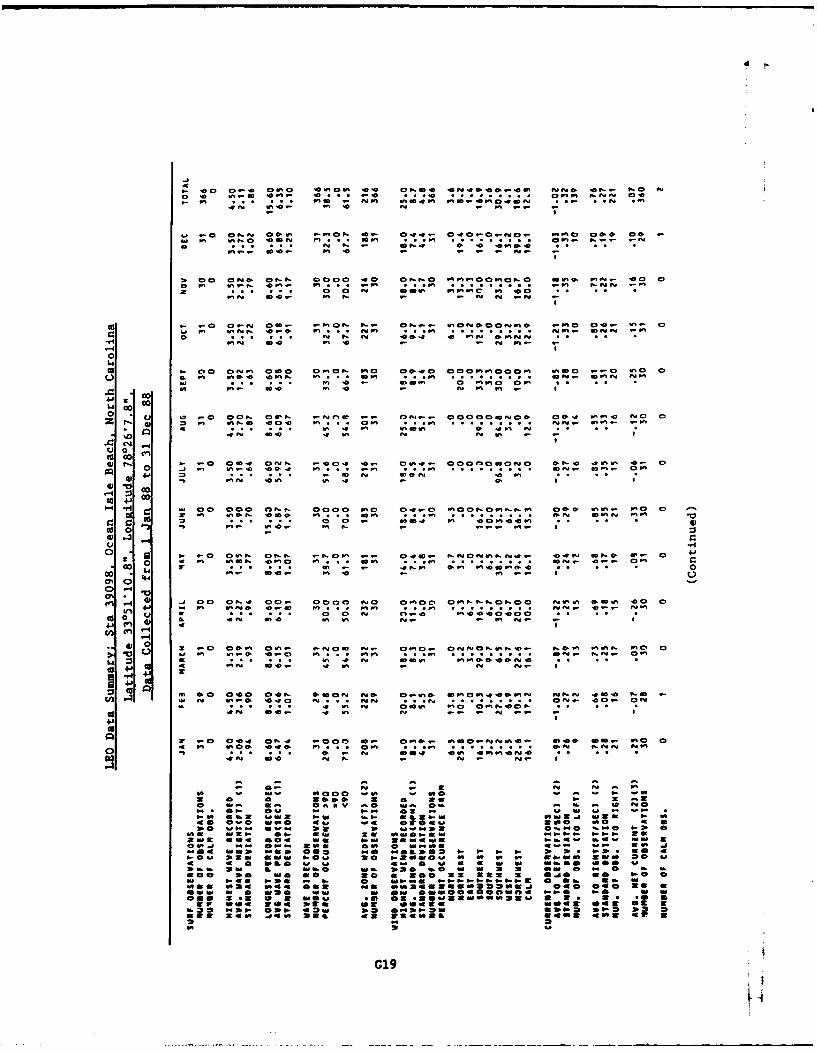
4D F..;4
nh Ih. n oC N -o i --t z
on. ftC CN Oe4010N 0- O t 0 0- .N . e~C a . a
od N0 N" Q= ;;;a 0 0*i.
en' f. i '
4- Go00-CN 00 0 NO eeeOnOO ~0 i. .o OD Cn- . -. ff N W0 mn Ven% n .0 .
pai S. ni N -- -O Nc Nt% C-N l ft
vi 0' h 0-- N e.
00
U 4 c CC 90 000 OniON9 a CO.r OC9~iOe %nm 9O at 0,e
w t e 0 40 .0e m enen 0 ~
3r W- C s W SOS - *n N0'. Soo 00N %
4j -n S ON. e-n VtN I-n eni.
041
S.' 000 0 00N 00 enO 9-.C WiOOiN 0- en.- nC C .
U ~ ~ ~ ~~ f a.. . . . 00 - n. n .- nC0n
14 en 1nm 'eC en . 0. . . . . .S4 om. :"ni U
0
0%0as Ot: W:: CC 04 0.a00 N eo eINNO Nnn ae 0
0. en 0.~ C 0 en- .- 3. . ia . . . . . . N . 0
U ~ ~ .0 4N 0. ne o-- W-92 Iw 0 V w o
2: we 00-e seno aO N- eno*- ONNON iN'.. N.&& ia&N eno 0$.a eno. - .0aC en 1 0 . aiI . . . . . O. NN-
en. " n.. 4 en : : N ~ N. - " -0 W "
0- N en. '.0 a 01 1 a aN. . . . . O . .00 ON
U~ ::p 0*.- M en . 4or0
as MM" 0.04 C 4 EftO 9 i, a- e-9 WiC.N USC a.. am. I n
4 n nO .40 e .. on. . . . . . . 0-CNN9e
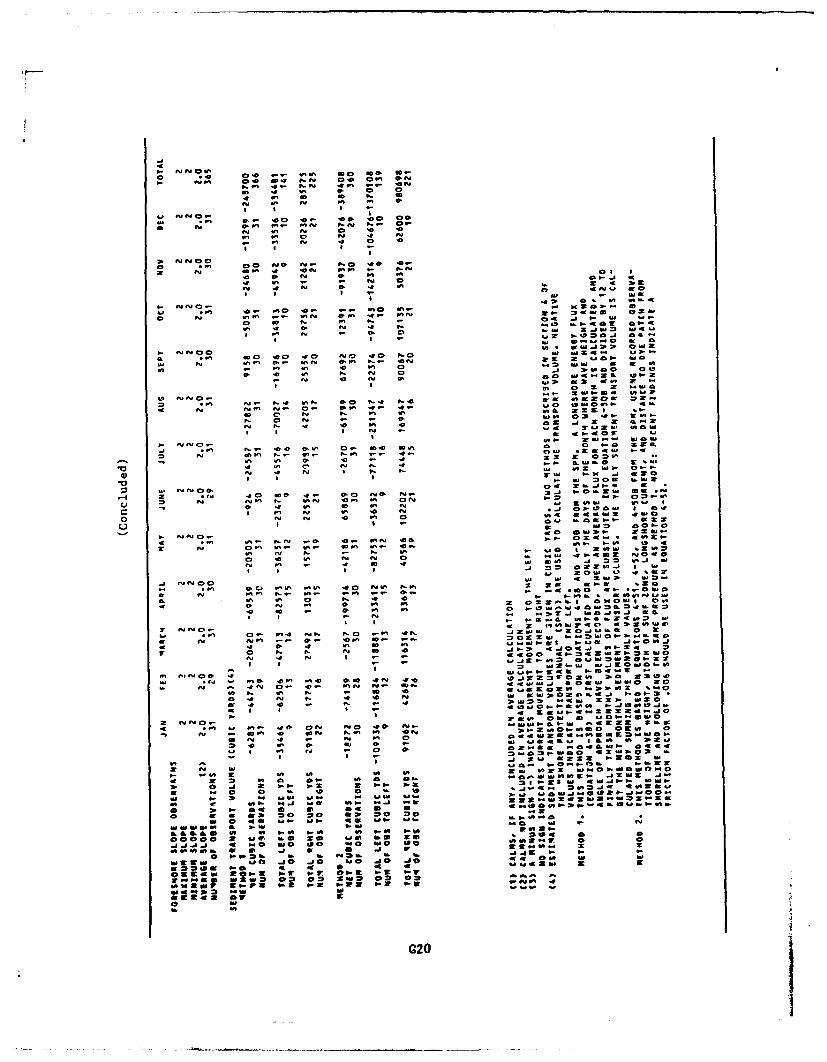
'o Un O_ 0 0 0
4~ j 4" - P
4L #, ;r SE z "n
.. , o j w N.
lo o 04 -
41% NI N..
0 ~ o. cm0
14 c: 0m D
-~m --rA 4 0 '
* I I -
N~~~~o *a 10- 4 ,2
.- ~g usDV~ a 4 0 V
c) -ml 's a0 *m -- "0 a Z0
w c..D 4
-o a
0 N C 1 "t
r4 ft 3 2 . a .
0~~ NNO - o.-4 o " _
*y rqN 1 . . N0@ 6 0 2
on 15Iwi M
*~w w _ caN NV V 0 Of 4 4z2=*4 0 N N 9' V
- fiiO w1 2D zO
-gh -c Viz0 .
* 0 1- MI W0 I.MI
a. 41 -1 0 .. i 09156
.0 ox N * 4 0 A"
O~~ N, N 0 4 0 4 646eMfu 06.- 2
U I I 20
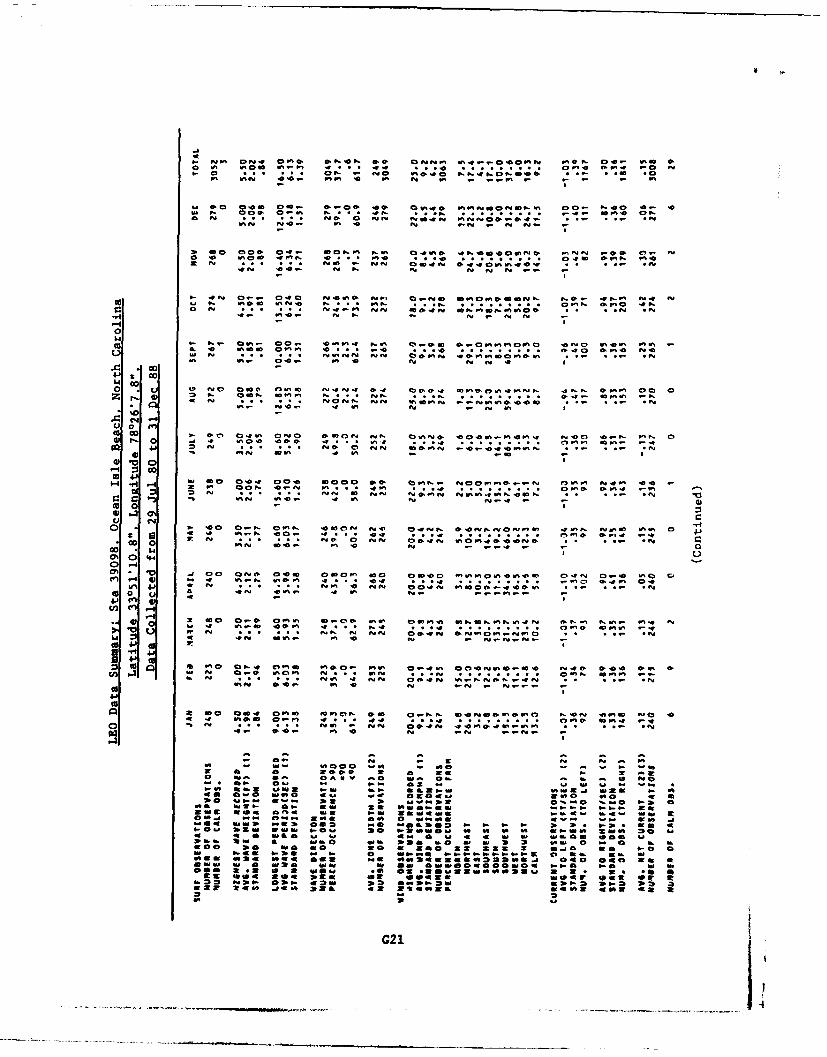
-hp ft- W
a fC C!W CpC . * P P C t e P
... Cn O-V a~. N-C CC C1 a CC0CP:. 17 PC-1 I.-
W~ .. N --. : C! n": I. - ~ P-. 'We,
O4 IV Cfm mP C0 C.2 .. PC PP. C P 0V C
-4 0
0
ft1'JR
'0
0 10 CO 0 a P 0 0 0 . Pt C . C C . C C a P' 0 C.. Cto 3 Go - I C C C C . - . . . . . . 0 C C .
o0 0
100.4C
0
O 4C , P. . . . .P C . aa P. 9C O aC . . . . P
41 -MU * 3 O 0- C .O S' OC4 PC.P.-a PC PC-nP
341
- P C.-C C4"DP. Cu. . . . . C P wCg
a i c u CC.- C:* :PC P .'
0
go CS . CZ .P .. P.
a a u, , a 0 a-Ct9 P. . r, P. P. I
C: -~:: ,- *-O - -C- a - N
6-1 Z a a 1- 2 a 23 N. a-I0 .0.b
o a ma CA S 0 aC aa O a %AP.w. :w ONl j; -C 0 I .
IC I m. 5.5C s-m OR a&s- aSZh Cf
CC SMO CC CC C 0 0C *~ G21
.. .... P .C .... ... N O C C -

S-i aaO
Ia 4.00.
*~~~ I.-..i
-. -j 3o aN. a
8-S 2 zSi -0
01i fts20 a4-
Si w~ Sz t 02
10 4 4) , 23 O W aft~ ~~~~~~~~ *. ? 4 4? N 5 4Si S2 .
Si N .0 O NO 0.0 8-0 O a ~aa - Mo~Si, N S - N S -0-= W S
W 3-SF. N 0 Z ..- O V,0 S* 0 - -
N~~~~a z - Ir -. 0. E K50 0 45. 0 v
Ca 0 - OJ- j W siE i *00S
8- N.22 0- Ei W Wb
9 Z-5 Tti ra -. - tSi j
Si 2 2 .Siciv .1 as:-;-5- Si 2 0 wW
2 -CP OrCo a. 5. O :EW wS *
4 NNl ~ .4W~ M- . M 0 *. -258
a Si2 w0-
S9 a Si 4540 N3. 0 4 3-- z I 058, w . 22j o 0 1"
s-i~~~ 20 - 0 U
- *4 ee .at 21 mo a . NO no ZO msa
W- w 0 : :l ft "M W 00:5 .w -"5
2 .- OO ~a 40 a 0 2 0 a E W
so 54 40 to. "N 0S. Z" W. 0- to~ 20J-t x 2a SN - a- 0.iw - .i .10 8
:. . SOL%-0 1 01% 0 0 It *1 001~~ PC~-S a we JK0 -2 **a 9
Io vs-e m* ;8 5 -8 g i S. ma S -Si*0 0 0 b4 0 - O0J 2 K E 5 3 39
- N S 40 .0 . if?. .0Cai~..' 0.5W622 2
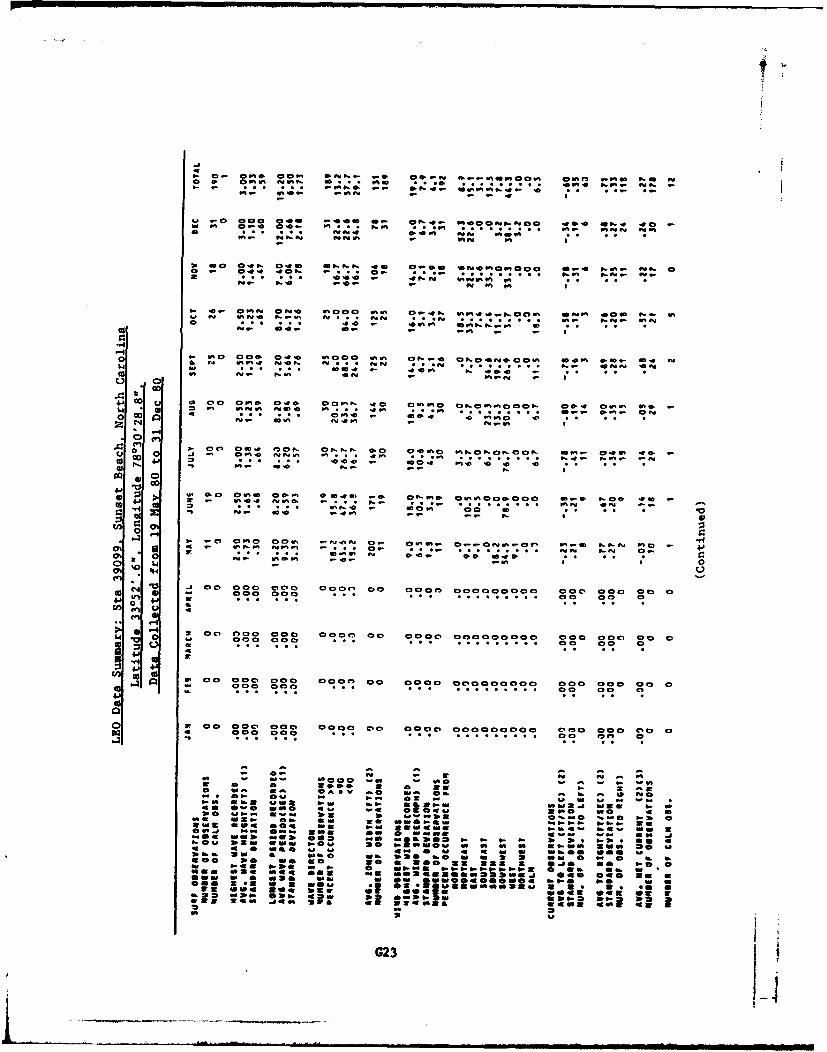
I- V P* on *m o hN - S . V " n1
-- inC. -in 0s !I nig9
.z .1 t0 06 WC M Op-.. %00 pe V%. a-. e
0 . n W 400 ~
n .1 04 . sow .4 ... .ft .& *4 ofCta N % % 0 *
4J 00.- 0 02: 01r' 51 Og v% W i 0.7P in0 ew..pO ov, SI C O P.. Woa 0. 44 0: .50 .0 P P..-, 6fm
0 aFM w'.. a.
0
4.1 0 00 0910 Ow C at 0%%%1 0p2O rn ~ P 00' 15 5 nnS'
o ~ . 0W%'O - a m 0 -&10 4
0 1
V . w' ' : 6 0: a'. 'o C'. '.% .. g z -cc -. n'' 0
*00 4 - v 0 .. 0- .14 .-. f111 6W~
aI .' 11 000 0: . 1: *." . .A ;M-, 1W. g-.4 %- - .
5. 0 coro 0051 00on1 00 0510. C.-.-c'...m0 00%6 90C2 0041. In 9g -~ SI.. 9W%0 1 .11I P1
.. M..m . a .
0% *q. 0 Coc o O~c cg a mmo c oa %0 00, 9 00 %99199C~c 0 0 0 0 8. . .0 .0 . . 00 cc 0C 0
*a OM MOO M0oo" 00: 00 0000 000000000 0000 000 00 0V 99 99 . .o .0 .. . . . 00 00 9
0. .0c CO 01 9 g g g ~ 9 0 00 10
000
a~ ~~~~ 00 z 0 0
- - a 69a
za :& -- mcc 1a - - -Z 1- -0O ass aa OAftao P. a& 0.0 N0.5 BP3 SWZ 1SI PS B aommoW... n UB :a a
w- .me 00, o e 3.0 00 t a20I w1- a- a . a .~2 so OOff 1j: C. B ~ Zi W N .a-SI. a-. EOVID 3.1 CO I 0b W W bPE .51
om.a a as 3m C o ma im -G23a
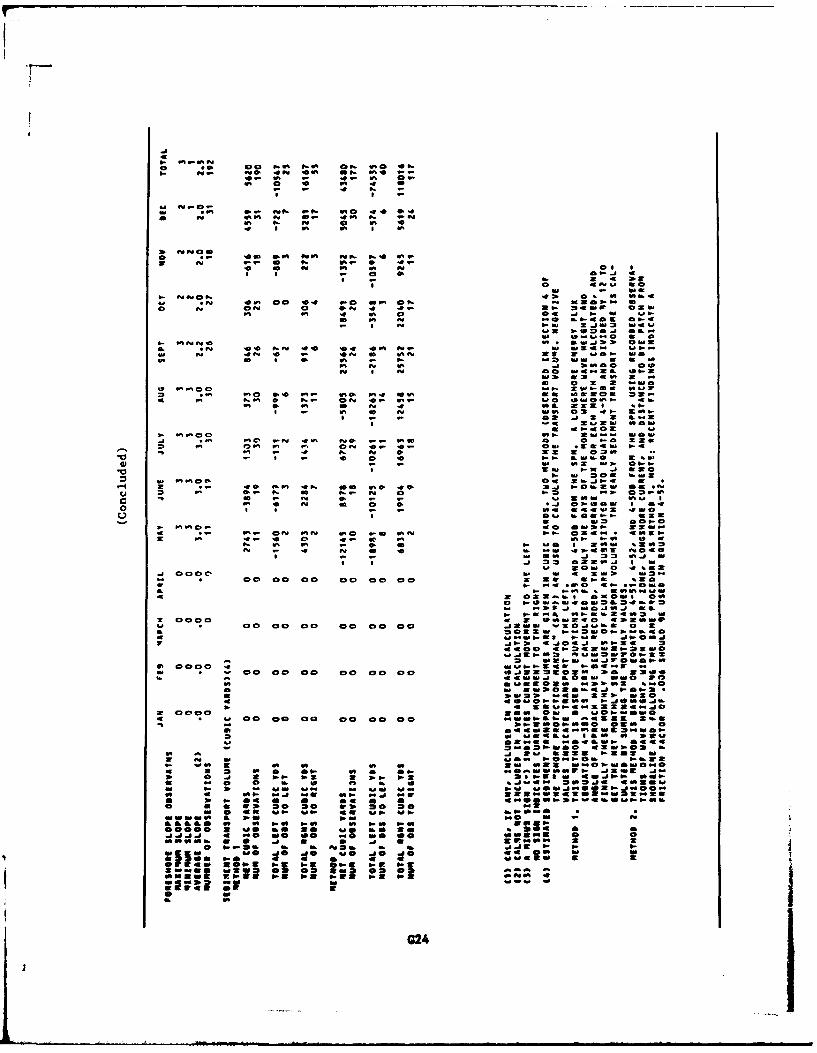
go V. IV44
o ~ ~ ff F. 00Q -V 1g 4 1
I-~~ 01 144W 4 t 4~
a. 44 to 4 0
4 0- :04.
1- -C!2NM-
P0 Me i W-N w a0 44 W 4
0~~ a. 41W 1- 1W 1N 1
I~w I Co 0 N.
"IC!- - - w NW
Wo 0: 01 _0
N ~ 6 4pN N 0 0
O~ ~~ awcW 01W 0 1 . N 3 0W
It4 4l 40 04 04 o.3 t N 9 N fir 4 D W11 -= 0N @ 0-~~ z Z.NW=33 W
0.11 .4 3 . OA....tAW MM £ 0.
U~ ~~~ OW 44 40 % 41 W 44c tMw 1W W =0 !4 0
cc Co 00 00 00 00-NNEx~fU~ 0 2 .K a
*~~.o '0 N iWNf
W 1.4 0 0 1W 00 0 00 j w w l . ...
- - 02 .3 1 0 -0=
0 w~l aw MN40 -S
z 00f00 4 O3 4 04 40 0 01W Co 04 O~tW -mWs N :a
N0 & U : M0 ww"
o~~~~g w 4*4o so to. so£N so
0040 Ow :W1 :: -0 0.
0 '0 4 0 1WN 0 I 4 . 4
I 3.3 33 02024 W
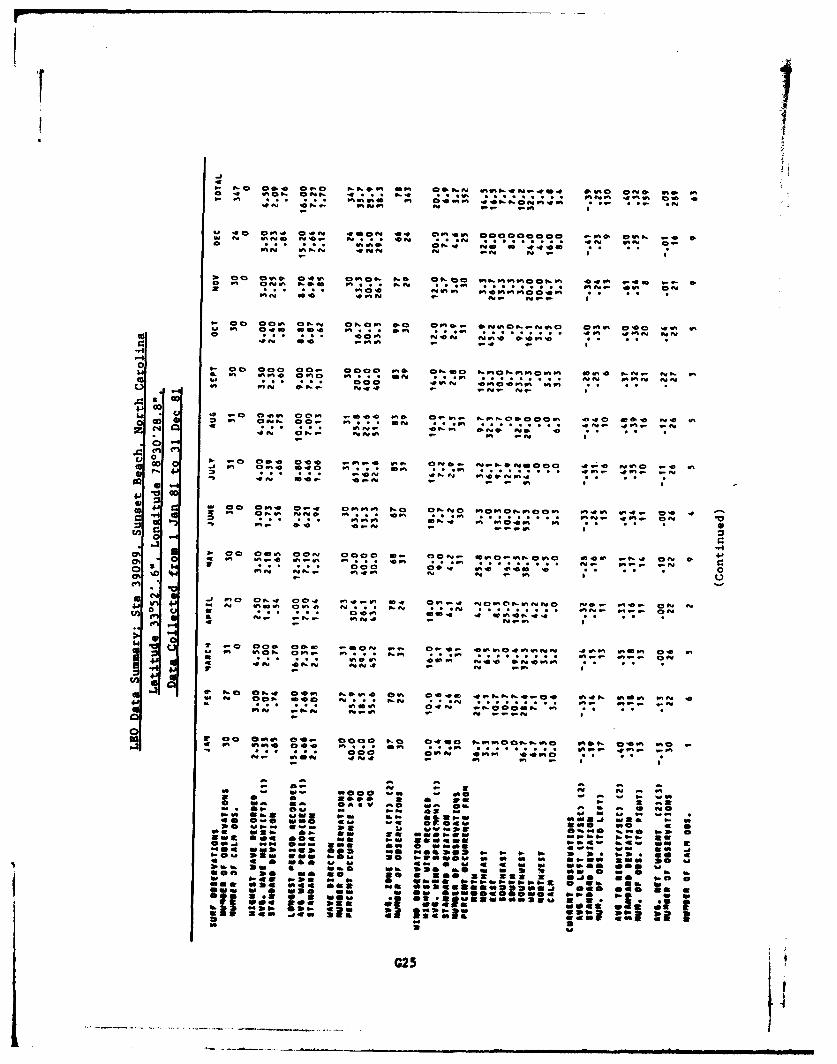
Iftmgo .4 .0 049 019 .ft !%%g9
o~9. 9 .. 9.9Z. % t o 04g9. ft.9 0 4. . .on"4 4.16 ft4.N - 9
W~ ~~~~ N, ftN P40. PA. N N* 99
*l0 OW9. N a N* c .40 *
301 9 9.0 Nf 9. :49 9 0 9 :
P.049..- . .4 409.e NON, 10. 04
-4 00 D 9i- so 000 w0. 000 9.0 09 0 0 . 4 N .. PP .
w ~ ~ ~ Z W -. a.. 0.0 a. I N * *.99 '9N P
0
494~ ~~~ ON. 94 9 9
~10
9..- -*0 ; %*9
00 59 0094 0000 -- % f0t. 0"9 o- ~ .0 n.4 .N. N
0 0 000:4!4 ~ .. .9 .NW O .& 0 ;:. 1.-9 Nw .9t
to v-4Z
3w I. w o 00W O N .. . ~ - O ~ sO 4 . . N 4 . . v 9 4~' 9 9.0 9 0 9. - 9 .... 9.9. . 109 . . . 9 . - 9 9 ~ Oow .0 9 94 9 . 9 4 N 9 9
-l5 i4~. M, CNN4 9444- N M94~~: j NO 0 . 4 . 94 .4 0. 0 4:NN . O4 94 . 9 9 .
r 9.09 j4 was;9 .o 4 ... 99. . . . . . 99- 9~ ~
at a a Z a. a a a
- 09N - f N a29
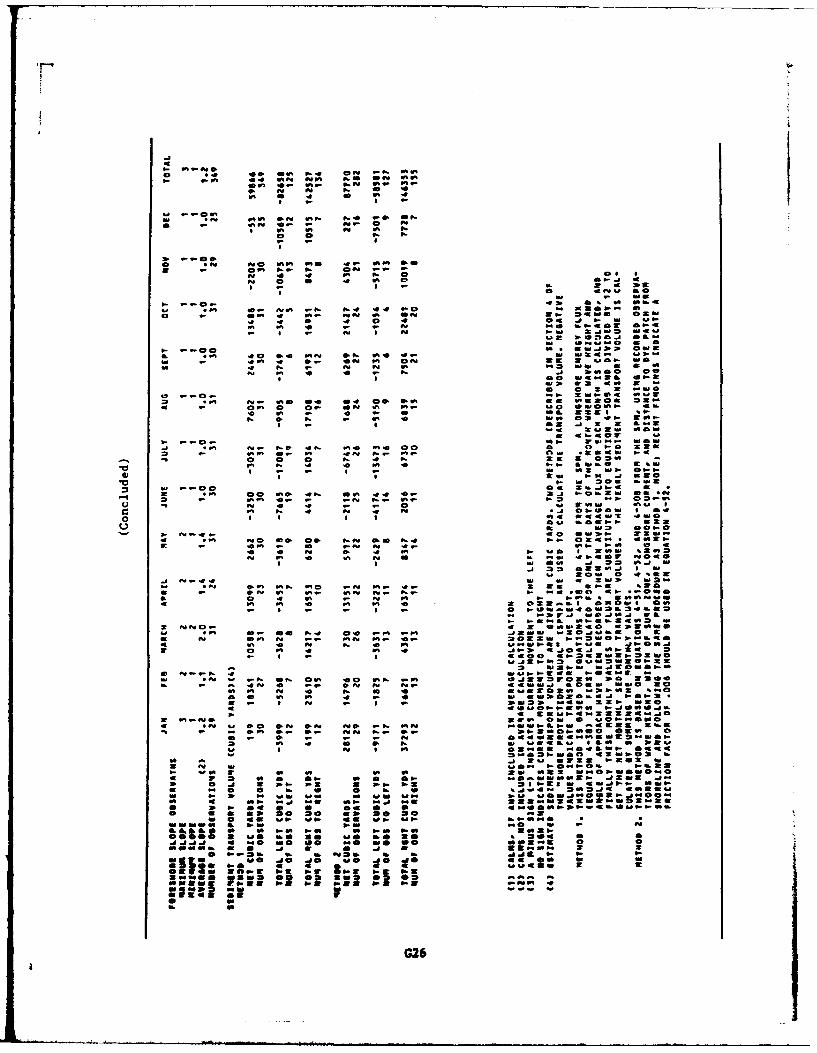
44
t- ob w
06 Nt N 0 3--:4
U .-.- :.t
0 a.
o'e at aO zv owWoo 0N~~" 0: N 00
N~-C Z 0 a.-000N
M 0 :WSW% c
a -1 aI
N~W V:Cu- 4wow 0 0VU *0 'a "O a- o- :4 '-CMUO
42 NW 0i
-a *.U0 W 0
ft-. 40, 4 0.*N NME 2 UO
N ~ ~ ~ 1 0 - N.8%00 0
Z S0 naz S It
0~ ~ 0 0 a
A ft - 4 - 0 00E225 S.0 0, N0 - 0 4 Na 1-06NE 2
-9 - I2 "WOO
a-0 -veu 6NW , awN
- 0 0 0 N N 2 C0
a - -S - N 42W.0 O a-
r. a-u so IA~ 0.0~0 W zW Z
.- ~~~ N NvW ~ O N
04 SO so .0 o S
N0 0 4 0 N 0 = w 4 42 NI S 'q0
. .. I 0
C26M O.
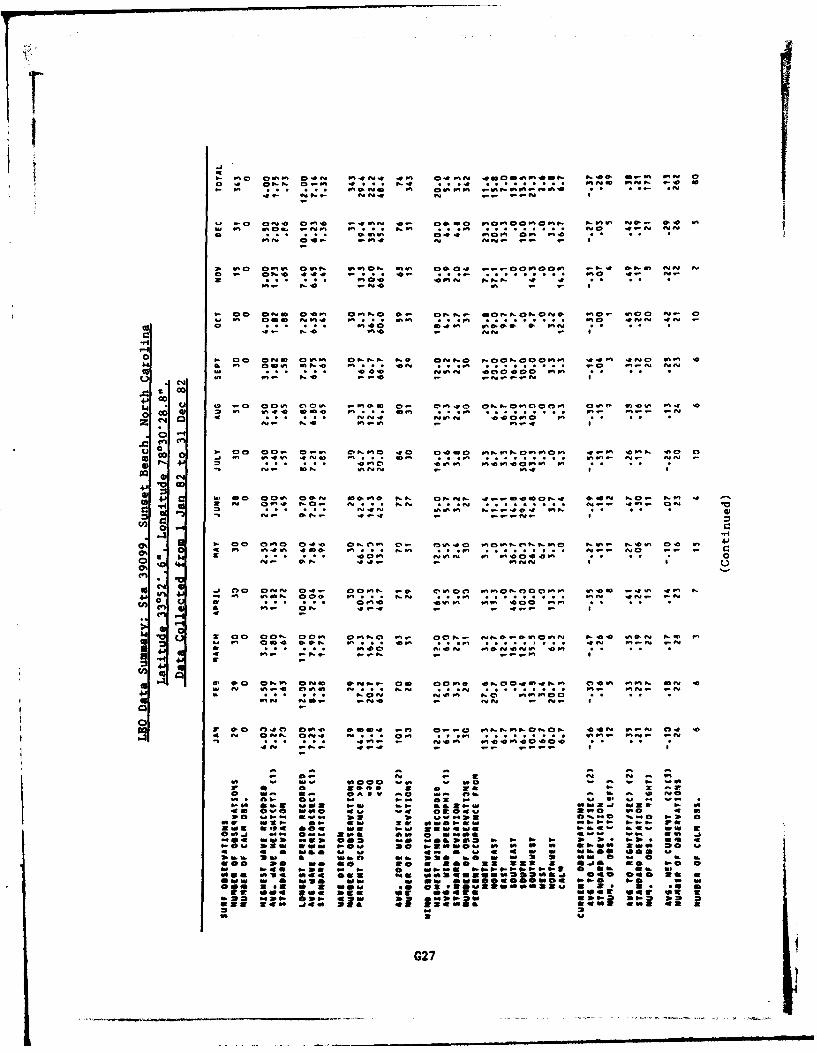
C! C
mo m z MA" On% 01 cwm 4-~~.nn c . .
0' 0m OPJC 0 nC! . n 00 ~m~~N Npmn 4 wW ILo n N O C n n
cn NC.cCm -
~0
o~ D 00 0 0 0Cm ONN N: VnO NOO~ n' ~ eo m
C4 a. in t Qo .9- m . A.. n m -cn0 -. C!9 n n C OC O m
en ILN - - mnn
T Om nECn 0O on C! .. 0C . ~~zni. ~n
0 b
I-. MoV I. wl ,pp. 0%. m . ~*wa Wm Ci mmei
4.34w, a 0 0 -S: -m zP a~a a-OC 0N eo O- mN ~ ~ ~ ~ ~ ~ ~ se n8244O.9 *N .P4- Cn9n
00 z mn 4nn Cr nN P 4
:Sr 4 0 P-n :rC zl 0. .. :: I
0% .x0 am? 0"C -W ~i am ane am- n N nt NC I a
o m n~n oo- m .. .m. . . . . . . .nG27 -
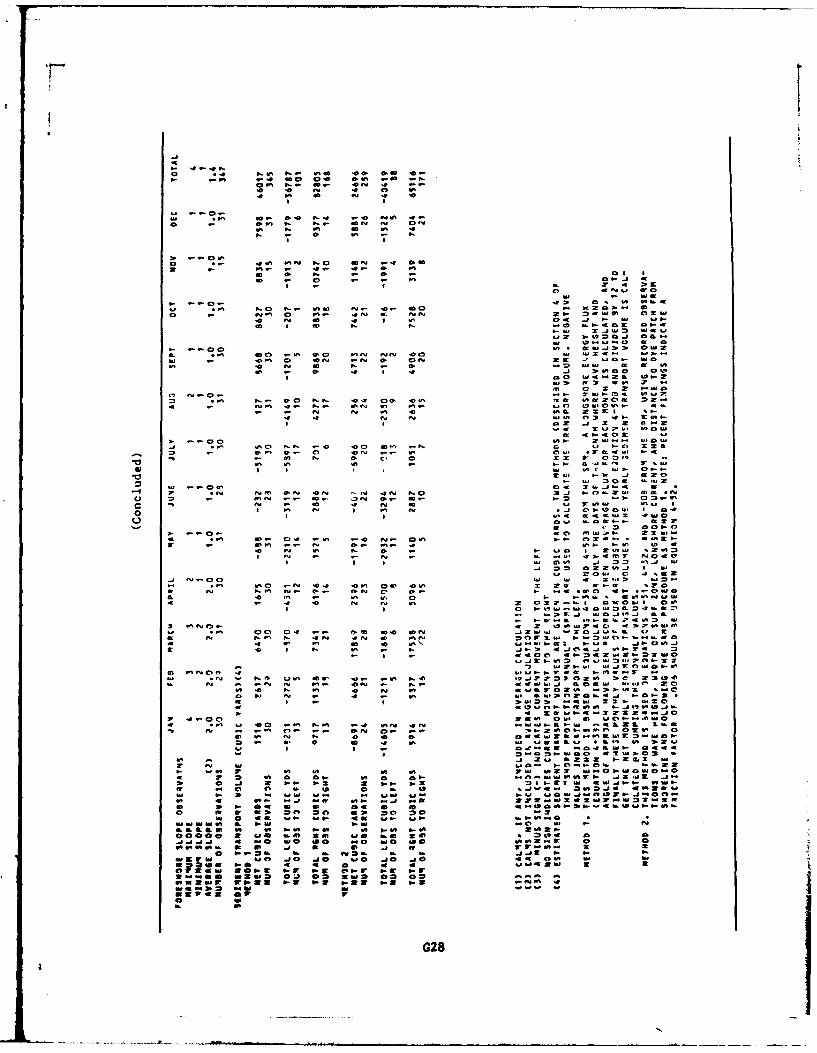
N 440
a-~0 Do,.. 0 a. . ~ - -
10 a ft3rw a
PW, a--0.
u - z a
a Iz
3 ~003~f - OW: S
* w 0- a
* ~~~ 07 O.
C) 0. C) 0 m m 40w.4-J , S
a, * 4 N 0 4 u14. - C Z O N E
a~~N toJ 61CMIII' 2 r
91 ov- MeNC.
- Or 0r ME. m-E 00 3. 3 C~
.. W.: - 0..f M4~ ~a to Z 4 8 4 0
w0 M CS 4-02
0a- 2- 0 wM .', plo- -J 0.w *Sa N. 00 N"n 44 j0wo 0 455 C, 43 0 W2a = - (- 4 N4 a % dc itAO 0nO 5
0 1NO 11: ;of 00 45. 7M W
az . a, C .N .4 .0 0 N ) 4 22 4 a C 'C -
CuO* O US N
- 4 N 0 C~0 23 G28
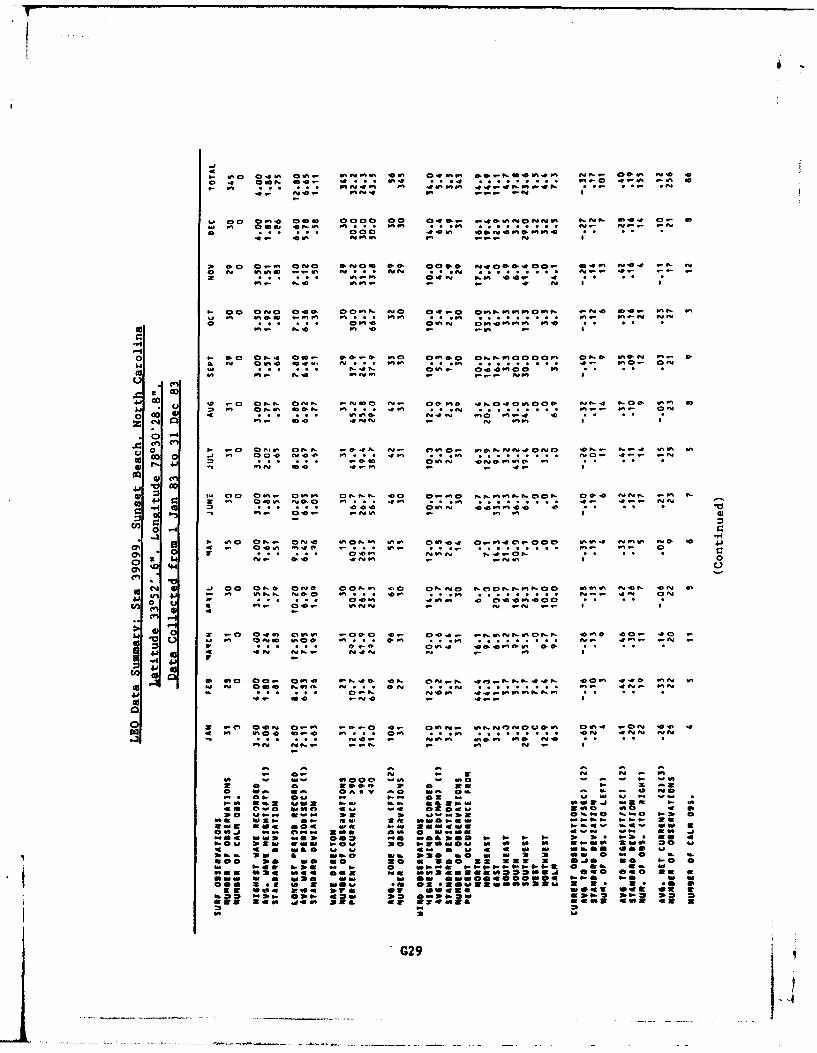
0::
A-I ,A-- A
o c oo 9;2 200 0000 00 040. ... NC N:P WE 00 ml %l tt i 2::!* S N ~ -z C. AC 4E' . .010- .0
Of - EK N10 8. 1- N
S0 0 0 2NO oWi 00 000.0. 9n..i":E C.i.4. N: No UW:.0 .. N' 0"10 .wf C30. " -otP ,,
CM r. t.. .00, b4 I
IL 0O0 ON4 0:0. Z~P t NO 0t. Lft.I'90l 9-E Ws .N
L. 9E n0 9 0: m-0z -4 4
0U a- M.*t Cv'. O .aC M
IVa 09 , 9
4.1 C: 0 -o 0 CNN CNN 0 - O a. 000e. N ~ ~ 0 0 .
N - . 0
14 to a .0- It. a . . . It- a.
ON5 , . 4 a. a 0 L,c.J a a0.0- 00 4f5-4 Va
0
41 .V-WCN .o~~vo0 l j 0 000 a 4o O .: -0 %%g %9 % 'm N
en 0,-
4J -
01 NCOT -. oN- .- N'
or -. o-4 t.NW AC aN NO wON VI O u51. N :If aN Na ": ft zs 5. N
0 . O a Em .0 OE.0 O ZZ W
* ~ ~ N s. 04 a . 0 :0 w.. . . . . . w -N .
0wo ' 03: Co.- 2aa ::;:O EN 00 4I .NN4 a% 40 aN 4
00 we w 0.00 .40. Nw- o w.a M .. N . . . . . a.- E I
W. WE N. 0 4.-.-i t
INN *N 2.- .0~ aus--
:. IN IaVaa% a a? 1 n
.0 0. N - K N a V
.0 w. mac' a .0 - -294
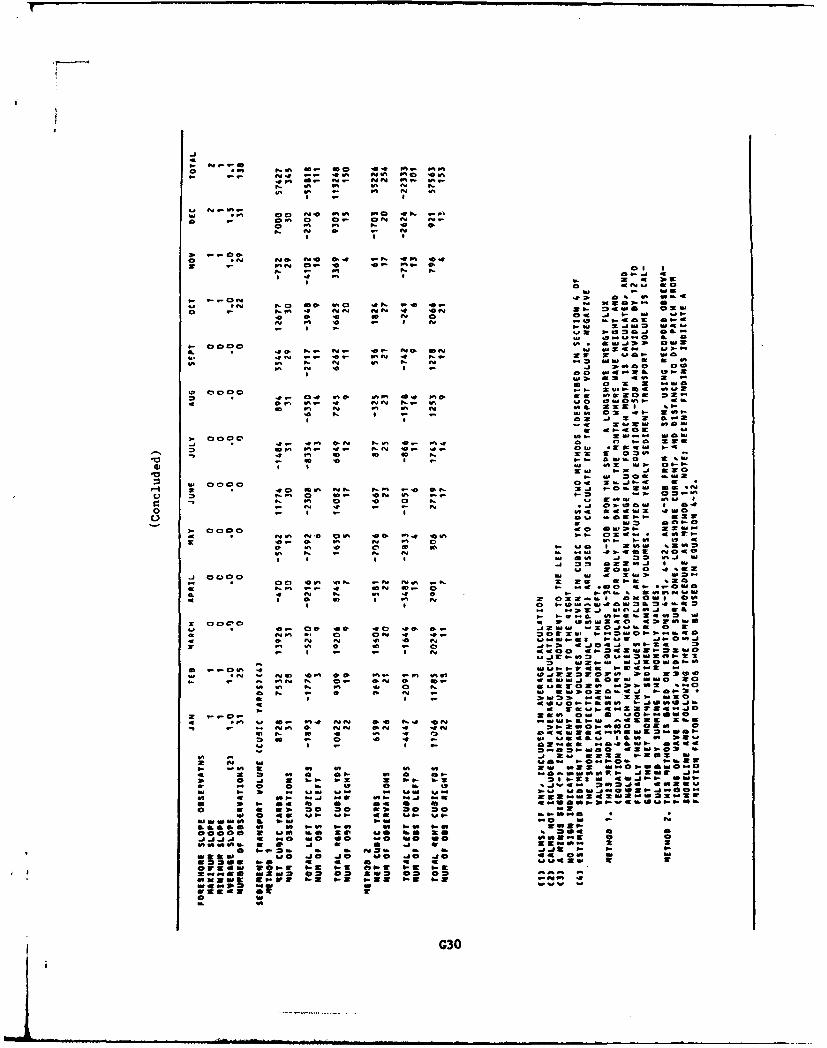
aJ
N~ aa.,N
VU =Wws u:s
aa 0. aa aa a0 .6oa -Ca two- N N
a 3. " a 0 04o 0 W:-:&
lb .10
of - O 0- - 0 K
N~ a- : N N0
0 4 aD 0 x .az 'go
0 4N 6. O
C, W 0 0 Zw w=
*a NO Om I0 wNm a Z N0 NO4 NN NN CN N~WW 01W
a ~0 0 ow 0 i 0 U
Z C, C, -, MI N *. I- fO K O
0 a. NW 1W WO_ z = w
:a W~. 0 wa .
N 00005'. BW JNN O !
0 N .0 I J NSo0or 00 p f N
ZW 0 a .I0 -00 .Nm ow NS aa..DZW
193 N jS 0 Na. 10
2C No I a 01 O
w- toEU 40 IWa
0 0000 Ws. -0 WOW 0wo:
a, a e aW 1 £ 0
4W a- a.J Z2
S2t at 0t a 0 N0 lotg, aWW
- N ' - N..J 8.00 S 0
o - I ssif fifOITW
U os. ... ONNG30
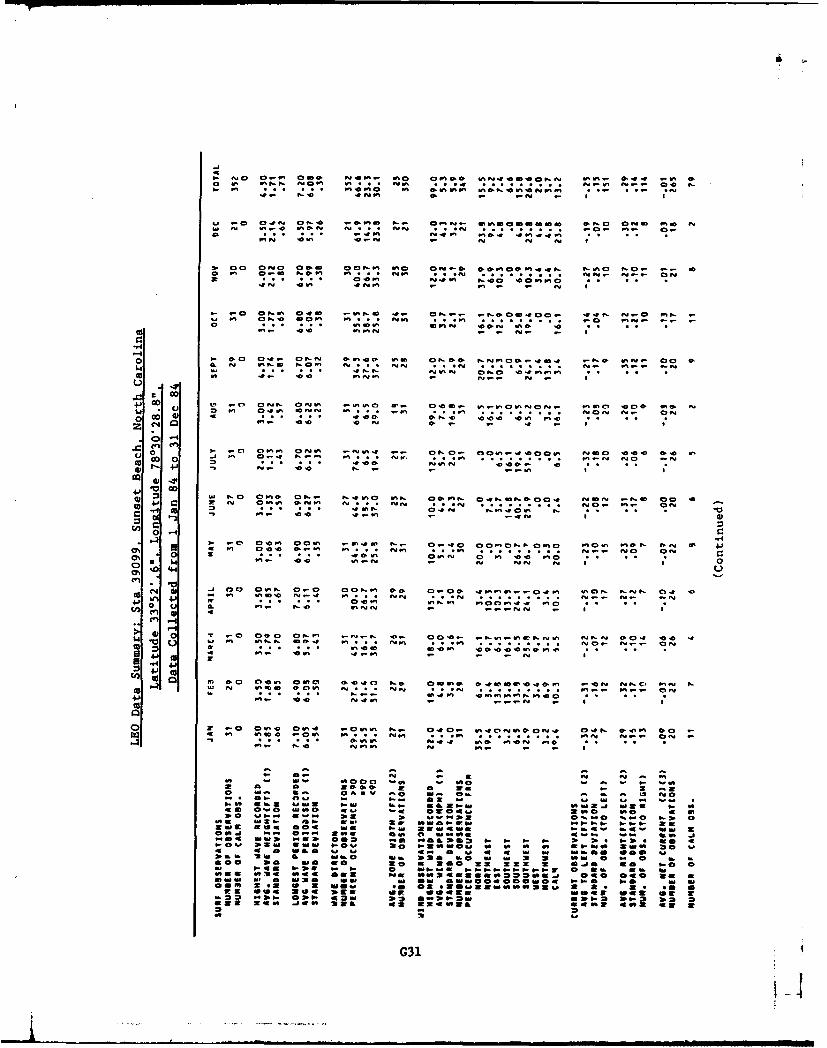
i 17 to Cn t nl It d~i !%% n::;olS
.. ft N.0 9N1 -01 mN .9I
9. - O.6! %N0 .-Mi N.. _0.. .' m m 'aO C m m Nft 10 mm ft In m~s ft.
a %z : . 400 nm ft 10, .9mm
0 -; a ,. iO %- tp~ oee %-.~ %W:- 9... 0:.~a.o . t a'. N. 0 me... %!" VI~tf ON.0 om m .. Nm. -O
1I- 40 -ft- ft N-
=. N nSN no % :; 9' . nf n . nn % N.
0U Ml .0 NVI ft~ -z
in0 .0F 0 a0 '0 N - 0c M.- me, 0, .0 wI'
0 . 0,0 m~. 00- r- 0.* NV.PP am ma- .' CN NO N1
w- 4.1 1 010 N-f - - ftf ft44
4 1 0 1 0 0 N 0 a. V N 0 F, M Nn a 0 a, Q NO t- aN
414
cn u IL 0. . 0- * m rM m . . .m. N O O
u 4 00 % 01,*. 0. 00.1 g ~ a %.Og %mw.. ."1N 0-t 0(U~ - ' m . .4 m *. N . * ..- N
U, *rto 0 ,010 ag itV 9-N-l n:.. 000. .- t .. 1p,t m I. 0o ..
no: i . C.m.; ft. .0 Z.0'.0..0 0 n %C 9f* 4.1 VI.- 0" ftm-- - N
KOo ~~w4Il 0 O~ 1 000~ -W ftee 0 eo O NC I
-, N 100 9a N C N O* .. at..- r11 O
- a a . a
.1 - 100 .1 - ll 20 02 :2 :W o . I- 0.
"a 0 :0 m - R .
o II a Oa N *o ma- M :::s Iwo NI-.,~WN .. .a - , n~- 13 4 M~ NO
46 1. 1140 4 4 020.. 300G314
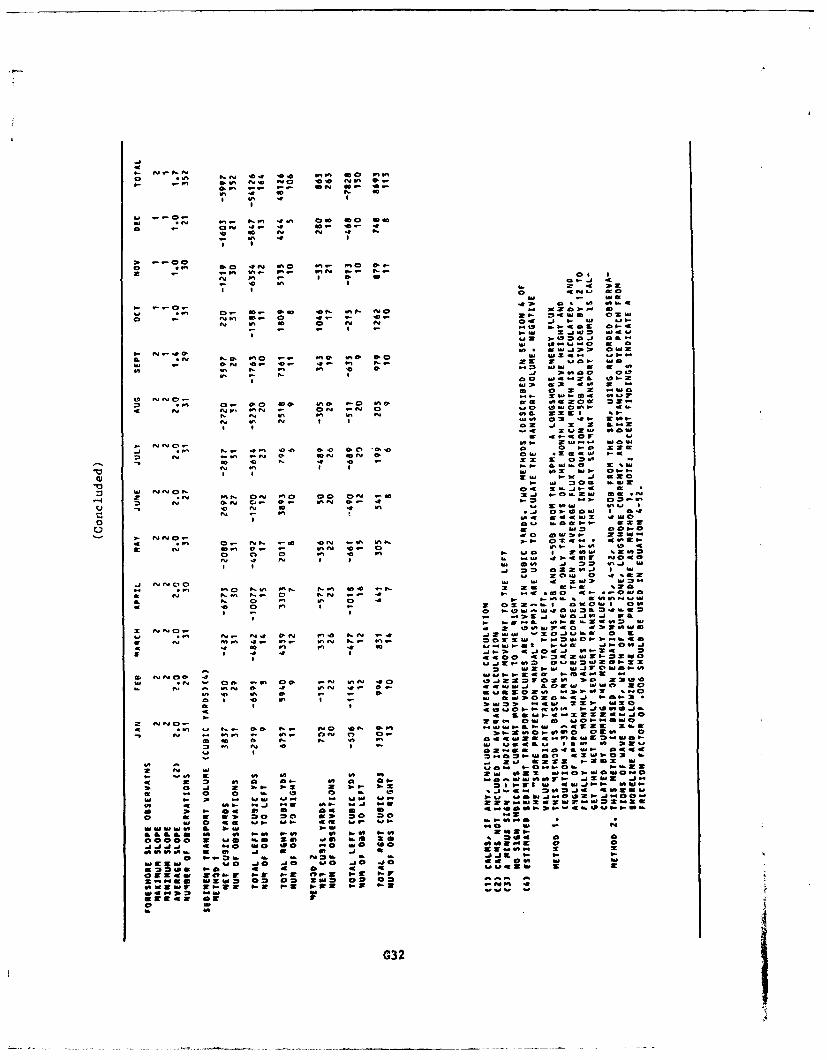
oe of. 4 . a e
wzo0 10af -1 ON .~4a- 0
*z 6
z~ ~~~ E I~ ..- fC - .- c
cm -#. w 4
o- o & - soz , . a a...
oNoW I.W 54
do~m~- ar z
iS~ ~~~~~ - N '-'.. 4 j.
a ~ ~~ ~~~ a dN z .~Z is
do nN 4aaa 0 a w
4~. N Ac m. 0 ON .N 0 O .UIj 5Nj N a" a-~ a N zS I S *
N"2 aw-" w N- w o - " ~ N 4- KO
-j z w z .2.o za o 0
K 46-40
o o- z . 3- P II K1 as~~~.~ aX S 0
w~~ Nn 2 1.-165
o -0 N 4CO 0 a Ls a
N ~ ~ ~ 0 a . N~, I0
0N w 5!V 6. m4s, 45a06as s.UN I
G32 08'
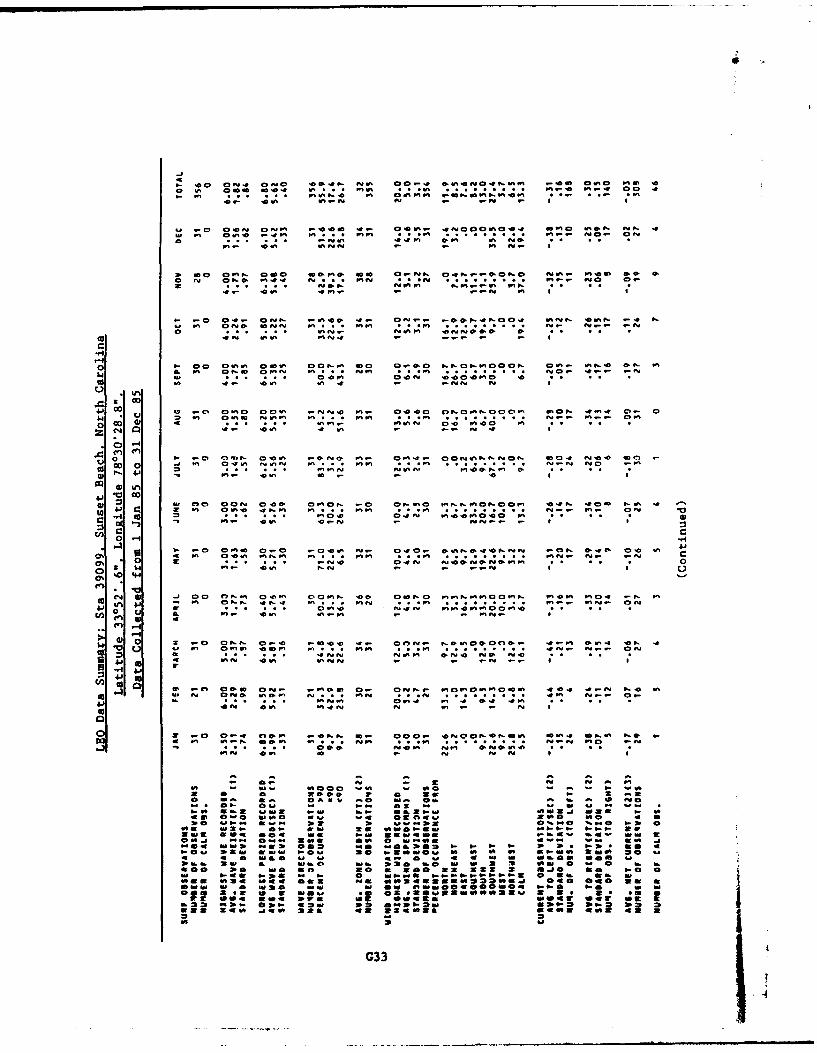
t- 0 20Ev4 , CvO 0t- EvE 00- :9go.Ns 9-.%C 9i% "-C% mm .9 . . 0W WE ftgb f -7 l-v
4n- 'Ort ov In. , i.
00a ap.co m-o m 0-v.a .. Oe~ v. b~m O
0J iv v10 m4 E n~ n. vW ,C . no,. 9im t-n: -i %e 9 C. .0 C:~4n ~ v i
1-.0 0. zi -e- 4- 0v-. -g. N 0 ~ , m- .4 t
9b 1 Mn n100 1F. m ... mE.- i.. .-Et- 4ev. 1van . n 0 1 #
4.H em - meC10.nO 0 m I
.4 0, ~ V a. - iao;0 C , 0t % i 1
0
mN IV 00 E -C ama, "o aam a&em~.~ a0t 0 -
0 u. emI.- Lv. I
0-. 0 0ommZ 4 a- z -. 0 9va 04. % moe~~ at 040 t
0% ~ ~ ~ ~ ~ ~ ~ W ft4 m a'0 ft-i m 10 m . i.............in- n- .
m.- em V.-m e4 in.
0~~~~~~ m4VvEmm ne Ee a
a in 1 Or in P4 m. a s -000
ZO Cog :a.i m gnome o. a
-~~4 aE W iQ - ma - - I-2~wn r swa aog 7 0 3 - 2 a
o W ma CAMV C ~a W. a aG3Ev
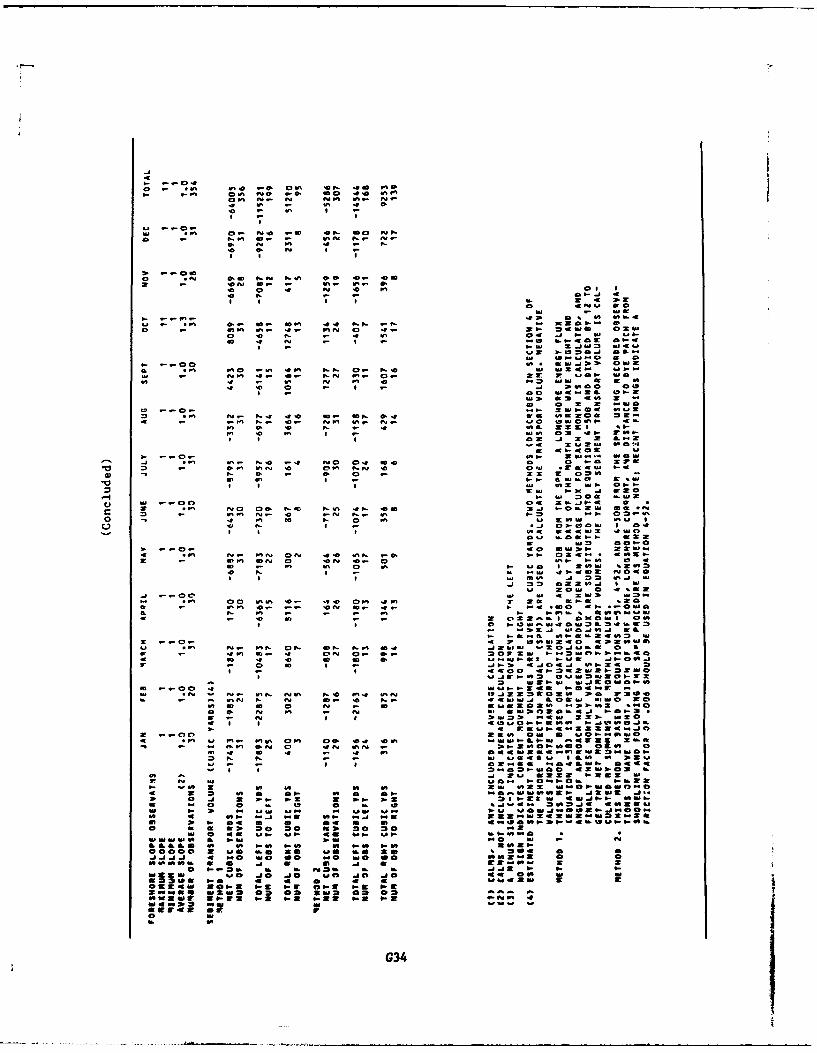
.- ~ ~ 0 .- - .e %ma n1
06: In. i M .06 1. 14
'0 - I -
I -I
LI ififO' O~
o~~~~~I a NV0r- 610 N- M
'0zo 0. 10IW II z I
100 _C% - Os I
I II 9L ev S 4"L WW : 91-6
4-~~6 -4 - f4 S 6 11
a~~~~~6 .. =0-.i 10 e N 39 0 0591a e N xe v 0. o-j -t I L -10 4 N - I $-I = 1 O os-
40 zW -WL M LI
Illm 0L14
W 0 -
s- .OO I~ * *W~s ~ Calmft~ ~~~~~~ cc1 61 f4 41 - . 10L 1
.-.- a..0- 0 "1 .I
go Im. -f N0 af 4 M10 El I 5' *0 11% - 961 0 41. tO
z Cl-tat LIwe Of
9- 0.1 6110 10 C pz" NWm II 2 46
V0 ft S - =I £ 1 .0 216I- o-v SJ I L 61 MN M-
J iml 1-41 J 02
.02- MZ N I *.j O ISOL I 0
r LI -.04- 01
K~ ~~~~ -1 "01 101 0 OmN 100.a61 -I I
10 -1 0 MI aN LO I O 53E N a. - W s.t 04
3.~~ 05 6. I z MW0ADLI tOW W 1
- - 0 10 - -S (5191 401I 0 a WW40WW36il.a
I0 0W -.- O a 7 06 64 40 43 ifOuI a 006-- N 0IN ON alN 0-l 04x34 OS 0 0
10 W 0 I -. 1N . 0 4 5
* - 64400 5LI~lG341
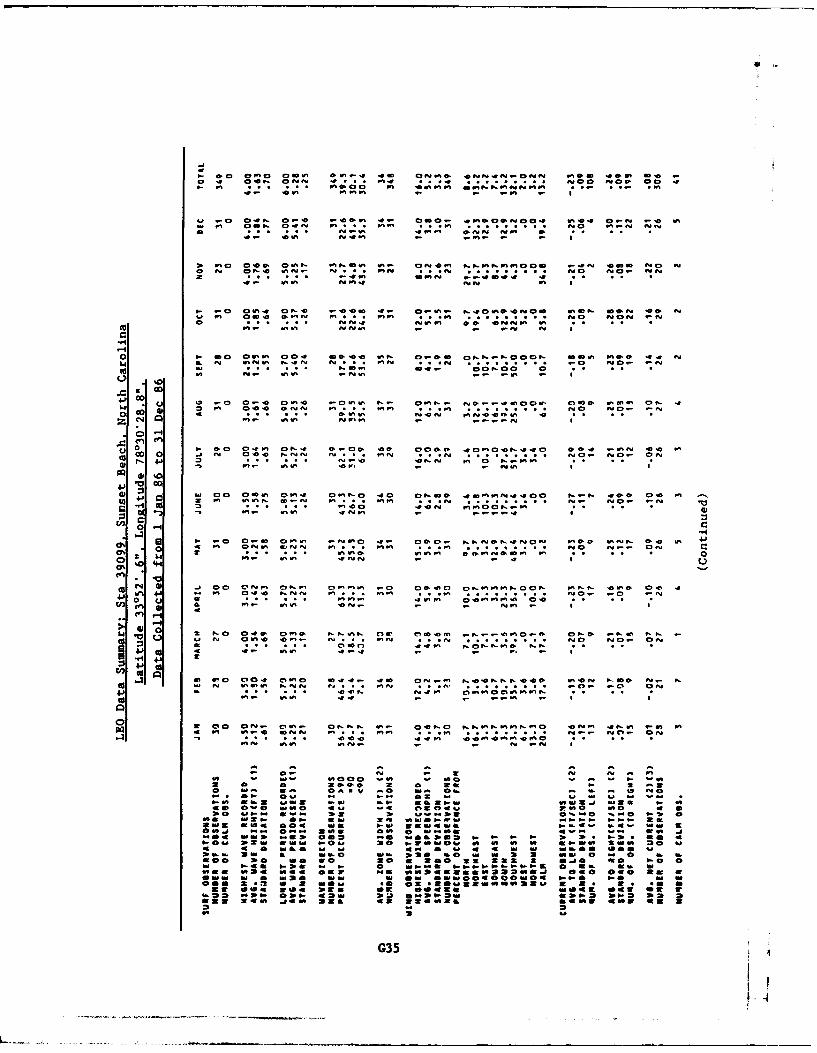
1-if .0:0 0% *u..1. 1 9neo 9 001 9 % zXC 1 u 9.i~ . -WM- -1ft
.0 "f OS 0 00%J fu . rI. n n n
C: '.ifl 0:999 ft'S V,0... 9% 0 1.. - 0%:
0e I n t o e uCn. 2.. . n 9, 0: no2 f60. 40-0- a~. nn 0 '
.. % c c 0.f Wl Ii .. n "O non -
SC4
.4 :
o 0 O OVIPI 00.0 0.C.C V f 0 .0. OP O r. r- 0.0. .0.0
0 z 02 9-u c0.- oo:o 0 1ON r.. :. y1%s n . - . q
91 0 ~ - .. o~ .~v N. o~.- .. ,.--0'o' oo ~~ g.
o . 4 10~ne rf.'.
.ceN 01 01 N.-Wi* a
0 u v1. -10 'or.' - - n
0.
0- 0 ~ c .0'O V. am: w 4. .
09-0
0 Ma C
Cr'r
.04 - :I
":z P, Atgr, w.f IO-N e NP- w
sw Pa. u0t. .0z0 - - u
-0 0-n - 6n n a rto ..: .l. .100 *..U a =&a -: z
2: 02. !* ! :a:.. 2z ow 260. 2z a0 ~ - a -0 02 - - 0y* at me
2.13 6.504 0 0 4 W a N W 20 14 P. $ - 4 . W~
0;:. .* .6 01 0 M C 4 ,. .1404GPM :11 6 2 0 2 lo :s0& g 0 3U2 N 3NN 2 2 * 0 2.: fU
*05 21 w1 ~s 0 'W..1~ . . V .01G3511 20 1
4 1. I44 0 4 1 . I0 O
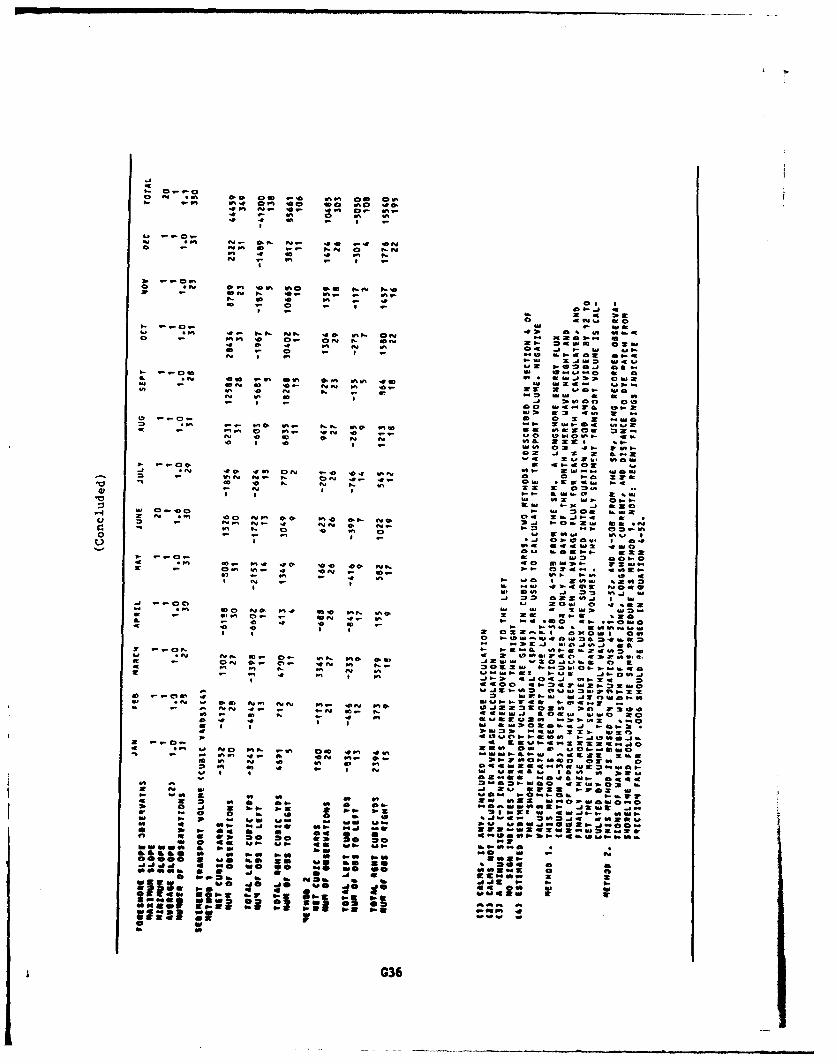
-a
4L. '04 so, CI 00 S .0 '
-. ~4 - -v w.0
I4 z -
I' I
*~~ w Apo. 'A w II
IW 0 w .. a: Ir
P~$ &N am W. WI.. -
w' C, _o a' S .0 - 20
I~~ Z
U .o w j _
o4 , m wwv .0 O. IN w. 52. 20 =W lILa. .e w N0 40 4 0 .. ' U
z 1 af~O- za
C. ftSu.J ' 8 I
* 0 2L z .. s
8j z z 2 2b zaam z. wo.. 080
-9 ts- 02 0N . - 0~ 2 0 - . . 5 1 8 0
Z01 -a0 a:@ z.-o~3 S o, a t N a N .0 vo~~ a I'9*
0 . 8.. I 8OL a. w ~ .i ' w000 mU0e at.,."
p ) iI - I VI &- 08 I 20, %'
I N I W 0.4 012N3 6
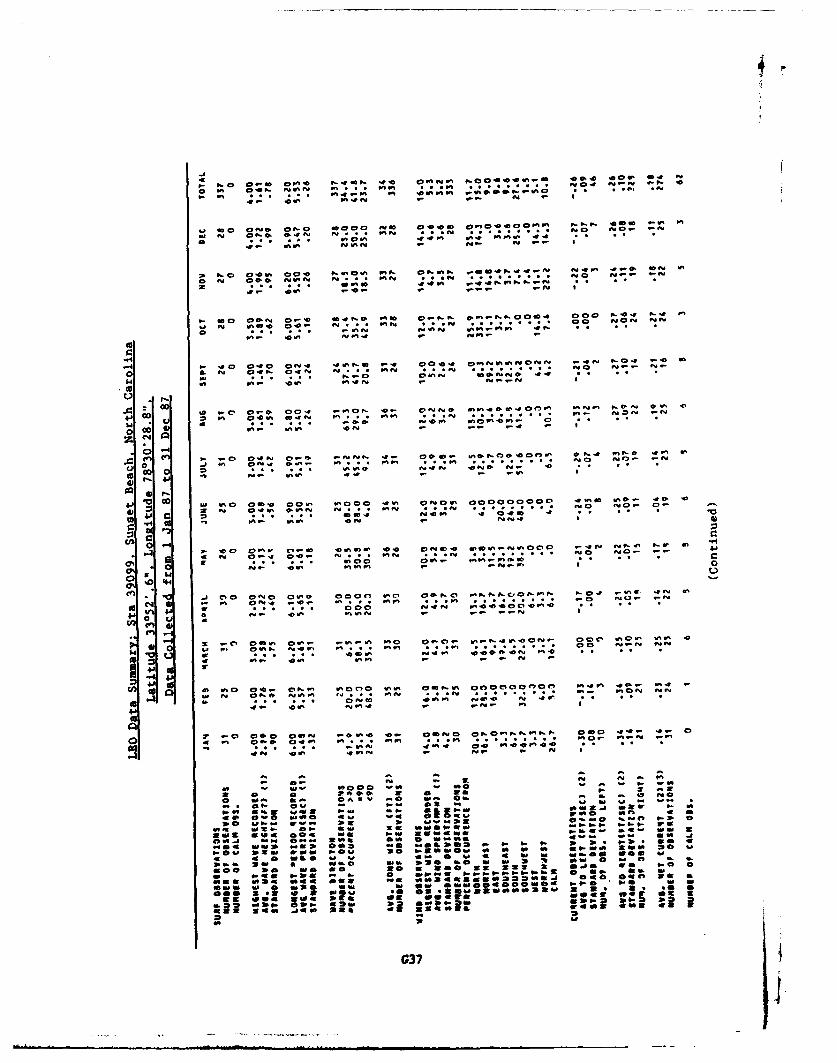
of,
t4 C
.- f-0 OU'i ey" f4Af em 0~-'t04~U ~ 44 LU . f
o~~~ Sn 0n. "t'f 11 * fP04 -' Uf
S.- ~ ~ ~ ~ ~ ~ ~ ~ ~ ~ % 1~v.~. U vm.U00U0 .. ... f
9i U P4 -
Mi m On asa 000 O 040 ona..O~n' .-.-.. om UVS M
o, 9 9f- 04. -.. Sf-fC fO
0 '0 .4U U49iU'4
co %' fUf-p j - 5
Go 0 W. OL 'oft ft- '- 0 ,.a~ S
e 4J
0-~a. 4 a4. -4a 00 C: V 5 O ~
IV Cl 90' U4--
00
p. na fa l coon 04^ 0-f 00-f 4.- Oem . #I .0la ^ P-4 '0 .t' U
0 U'' f. - fe f* -
01C
.0 &ft Q. 010- r COW v.00 455. Of-CU' oncoco n :v.. .0- 4 4
00 C!U .0 4 0
C!.
If 0.-5.4~ ~ - -. :'' 4 p
000~ Ovw 5'UiO
a-U LU Mo UU a ' f--U a 0z aa
0': so :",4a U5,"f sw"I As ' La'a
* a 0 a m
49 w o r -1
.J 0 00 0'0 004 U'' 0-0 OW -'--40-' f-04 42 U'
N -U' ~44 L ' ~U'U... .. ... ~C 1G37-
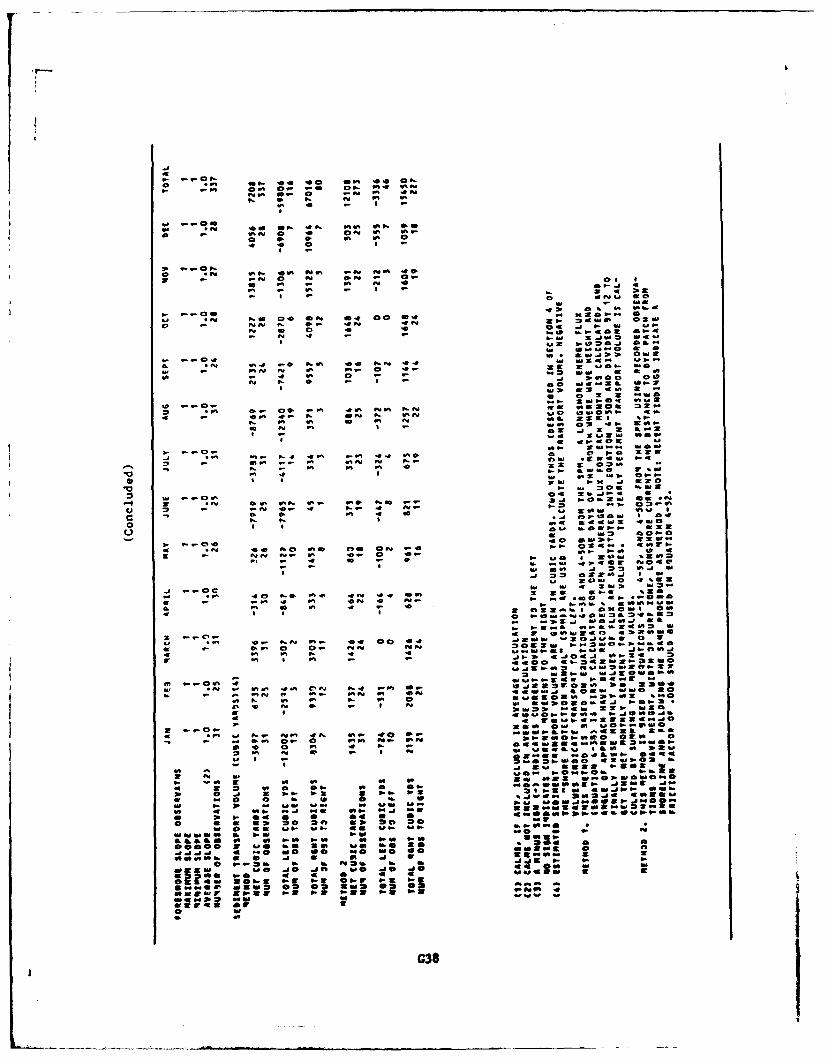
C).00
.00 0 - I
N0 3-% 0a wo
*N 4. * 4 0.0 1-. f 0.0IL ev
:.0w w gbN.0 .
*q v
110 . .0 .. I : :I - .
03N.0 060
a2 0 919 a T .C
oo -a Nw N . 4 4 S 2000
*~~2 *a2.. wr.
N ~ ~ ~ ~ . a. 419 ... 2 ~
.0 ~ ~ ~ ~ ~ ~ ~ ~ 4 wN.4 0 .. 4 O 4 1 0.. .
.0 - 0911 N ' 0.0 0 4 * I '09. .0VS .4 . 0 - .2 W .0 0or
I- a W 0.
4~~~1 .0 C. 4 N *N .0 -gg ..N1 = 09 11% .0 09 N
.0~~~~ N ' 'a.o a a .-
a. gut W :M,."=
~.~00
09 4S 9- 0,1 0 N:m
9. 0.0 ow
W 0919 04 0 . 0.-
4 ~ ~ ~ ~ ~ ~ ~ ~ S No *N 0. 0 0 9 . - . 002 M
3. .0 4 .0 w0 3 .b05. Mg
a % 2 0 o n2 a :1n o t o ":0 :002. - - -- :
"1 .. 04 . 1.
11 0 to, 99 00 0
00 0. .1 220.
"*9 ata.a-aaaa.
a: 0 0..0 a low,2
-aw .0232 .00.as;.. 3
N.. 38.0a0m
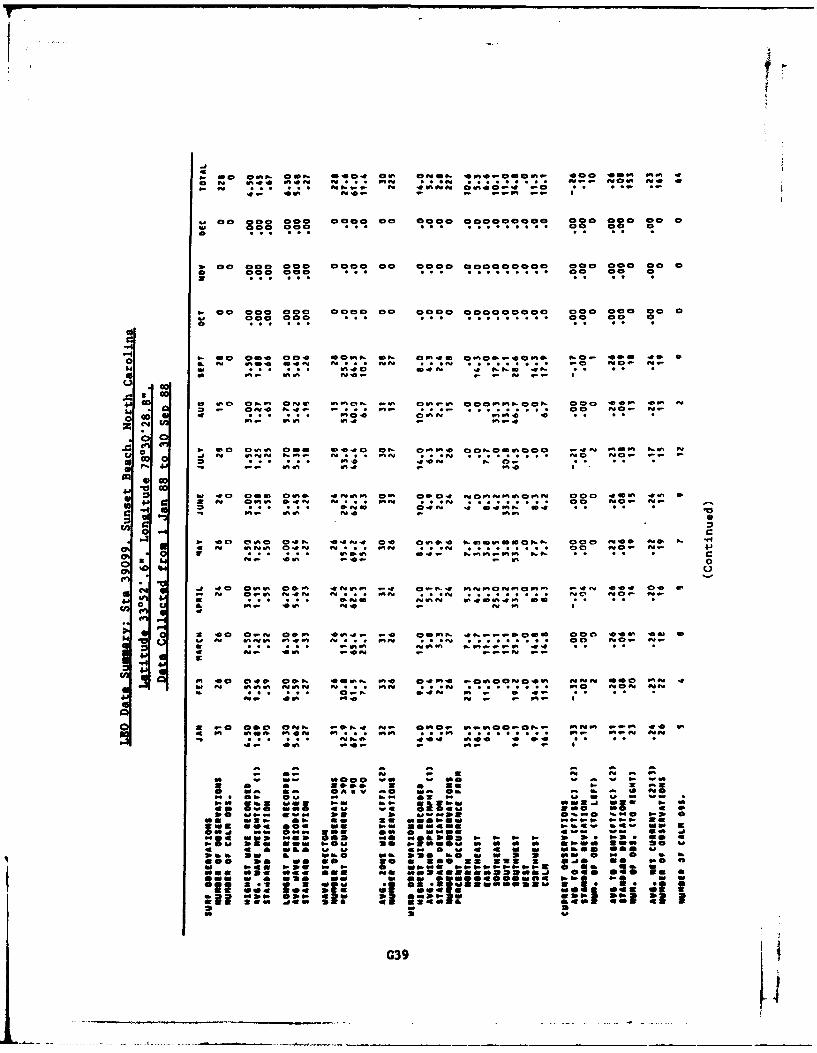
8 .. 9 .9. .. I. P19 * 9WWc . Iw
z . ,9 ... i 9 .- -
00 ccc 0eo c%1 cc I c 000000 .. 99.1 .9
o a 000 0010 :19n x0 00, In0%~ l:~n o w
1= .0 spS 0* 9 n*9"n % % 0C
o4 . .0 . S
0 :: ti90 e %9.-Iinc! za t* *
~~~~~~~~~~~t - a--c - . S P . . . . . . 0 W.
IS. IMv 9. n0 0v: ! f! ti
* . -
* 0 C: 0V02 91VP Z904 9019f9IP9 00 4v V 0
OM4 0C W, ftI e *
I- 6 P. n vP:. 1: ft ~ r
2 ' C C , zeft 0 49.. 0: 0 4 0v.04 9.VIv C Cc0 1910 t O
0Sm 494 - v. R-09 f
ni.)
2. 40- 2c c r I"4. a- cen-4-~O~m cc *ewa, a. 0 . pc ., r.c-. 44
4o r's. W." 3.9 Z 0~W -
C Co 00 00.- Ceo zoo evzot'e .- W 2 1 :as 9 .IaW0 a- c v~~v. evsc 9 *.. p9W .. ~9W.. ... P1 a909 oW"a c..a 049W No a-0 .~~
4 . 200c.-- 1.-
300 S a," rm low a -9(Az:£ :a :a 03V @ ma@ aC a tW
.9 B- O, mm *3 - I *G39 -
-77 maim aa
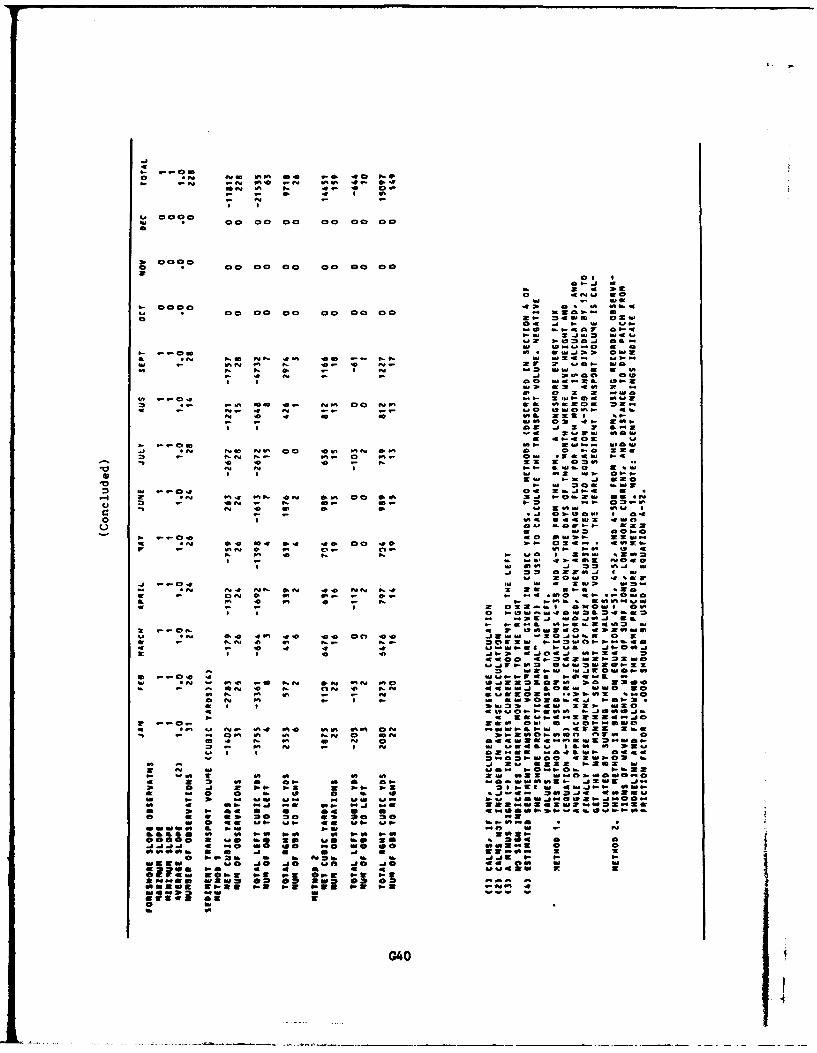
o ~ a C2N cc am 04 . 0 cc
Of - 00. 4
9.. 0000 0. 6- 30:m 00 C CO 00 0
0jw
315Ca '
N 0 000 0 0 9. z SU.S
z0O . N U 91
-09.9-1 ONO
NUft Z.J.2 U.49.
U. 04 W W
N Cm S S U.J m 0.
Uw 0-.N0 .0. 00 N- to 7 .09
S~~~~~ fN N. I . I N9 UU
IrU. SI 45 j 0w o C zw 3 sU.0
* * 03 .1 1 7 & a
w- 0 59 0 .. U: ... 9.9;0Wj
-v 4 0 4 4t -n Nw z 11 0
. 0 04 18N Sz
2O 2 W_-N 0- 0 N N C..
N 0 -9 0 I- U. 75
o 4 40 SE a44U.Z 4U.N09. :-%.N9 . E
IN .n-C a0 aUO -9
""l *N 04 0 4 4 a0 C 40 - --14 -"aw ZO aN w $- z 9 s- $_ a- 9
a"9 a,, oW lot,.5
.. j 9 4 W U S IU0G402
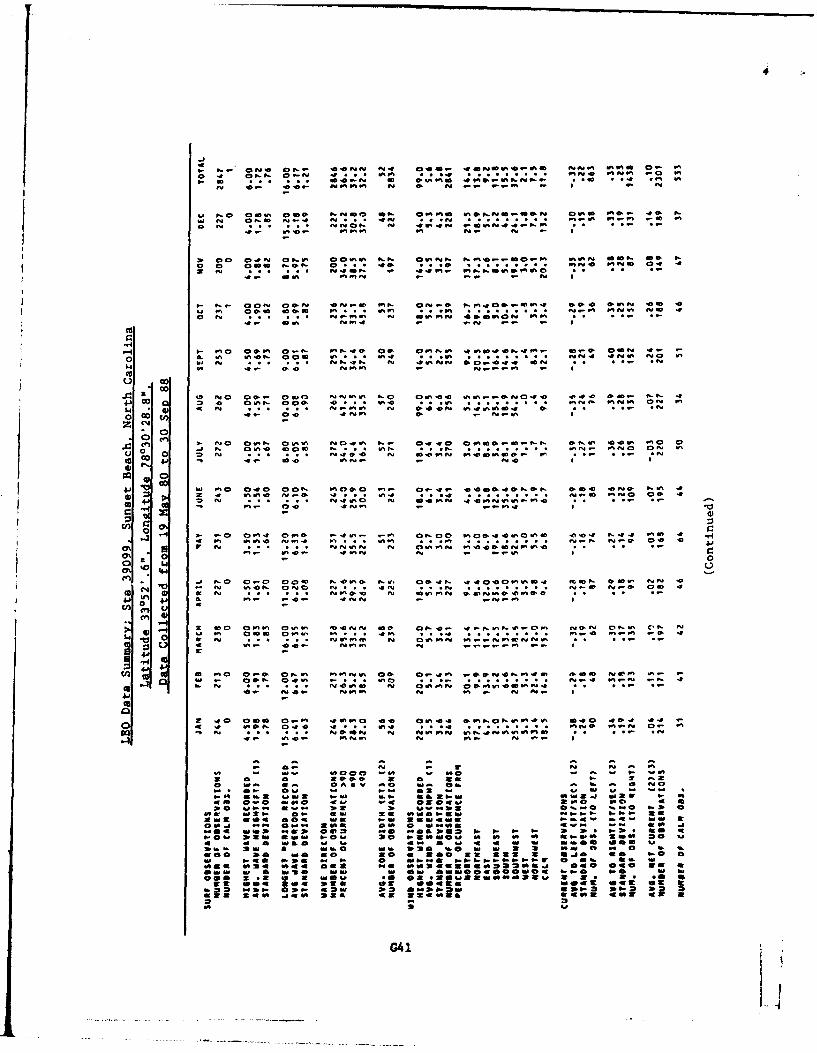
3.a a 04 . 0.- ft .t-N VINVI VIC Fo a4- VVO 11V1N.Vz . OftN 0VI VIV
1.1~f fm0 01 0 0 N 0 N 011 1 V 0 ~ . 10 4
#,- N CSft aII Qco No NN N N E IE 01 44. V
EVI m1 "II 0. 4; - N0
xn 01 NVI4 .0 .n -0
*14 Q 9 r*a
00>
*00'
.1 La 0010 0 0 N . 1 5 P- . . . . N V N N
'd fu P* 00 sly - OLnS4j fu 040 Z01 W,0V: C 4 - .0 0 o o O
- O O 0 -0I0 N. 0 4 4'CI1Ut .0. 01 N '
a 00 OVV 0111 9nN 0= 0 4 - . tV .i nOVI'V NON CINV 14
2.4~~~ ~~ O . . . .SV N OVVNV..-SONI
a N
0 0 SC VIIIn 0o 0~V w.O4NI .pf :90I .5Wr- O- 041 VI 2I . . . . . . . .2p 2I - 0
0 ~ ~ ~ w 0 . . . .. W 0 N am=SI WoIIOSN I
022 40 0 IN 0.I a .11 W0 ....0 0I 0PVSE0 .04 44o 4 4 VION 0 0 4 wow. . .. . VN 19N 0 V
I=* Z: fill 0000 OW -30 . a -Wo.OV so" a =a Am a a 05 aw -go V .9 NC a
- O Ot - 02 - L SM .G41
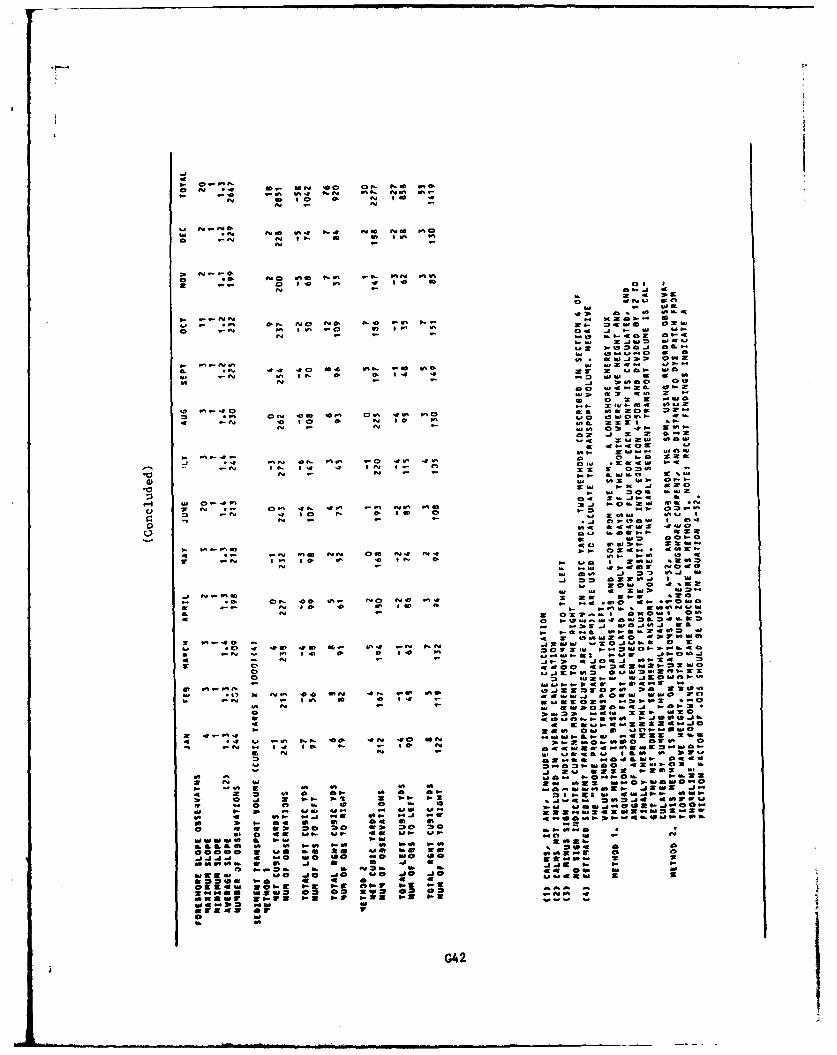
o~~ ~ a _j 0. &~ 0 O 5
0 -WZ . =
0. N
=* - -
w IZ 4
*3 a . S an4
N~~~ ..-N - 0-Sn - * O. NO O. N 7-5 N E-.4.0OE
O ~ ~~~~ .N 2. w~ X0 w2 * ~..M7 -t ..-t ft540 aSK"V
z .S V S4S
_Ej30. 0.
Ln CC -w w & Mn0 o- 7, 7 "U3
4 N 0 50 0 N SO 5 up5 07O~ -
.0M~ 01, w5s to - I4~~a 0 a z Io 2 110,
10o . 0 1-5 ESM a X
N~~~1 - -0 I 3..- ,-
a( K 5.
0
000 S 30 aW
-4 ~0 0 Sn 0-4 a . X .l-
-5 50 N 0 5
OooomsI-
0. S Na S, .S~ 4E I. n Iso* 0246 :24
up60 . 3 ,J S
G42ES- 5 S
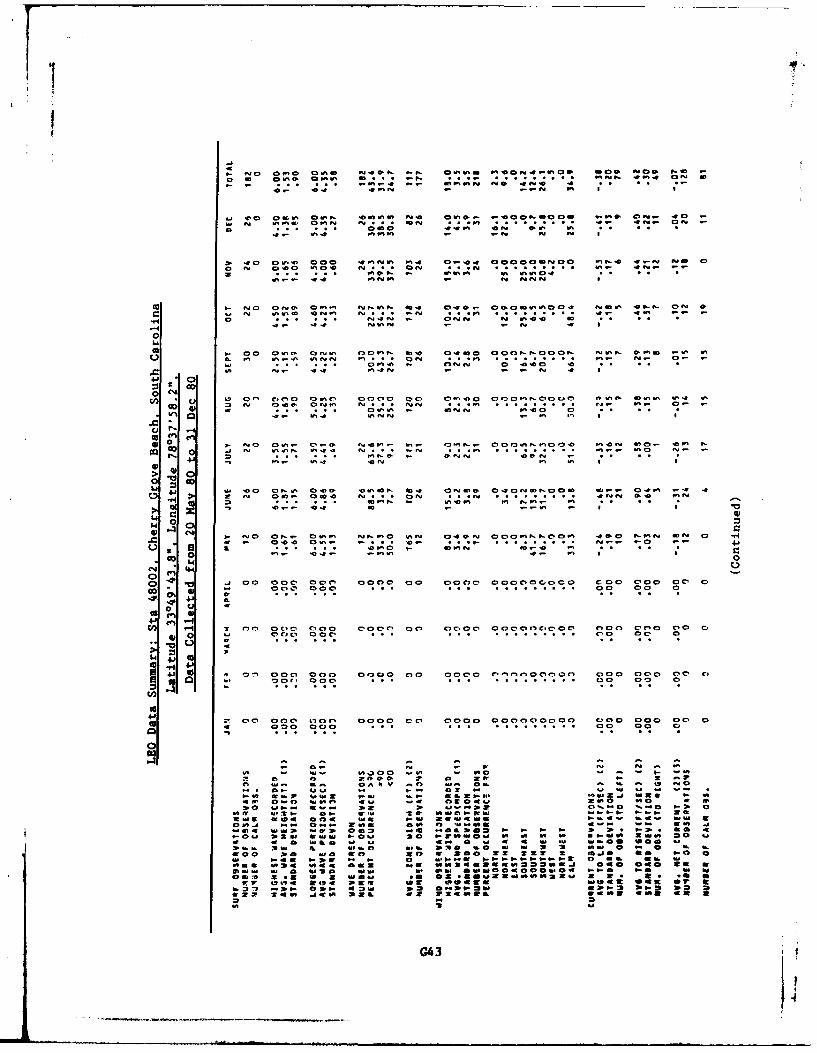
- o 0 ll ~ d N uN m , nn~j r 0 000 AOft 1-00 9
Cr C C314. mf W
3. 00 a5e ong cam .4 W:In. :,
.94 Mftf I~0- ~
o, n 0n0 00. 58 On f ft- 21010-
Cu 0- CC ~ --- -, - * n
0 C
I.- 00 aOO C:P00 0.0 O O 0 0 10 0- Nt. 000 -
*0 000 o Onl 0 000.
4.1
> 04* W 0 a N0 0.0% on0 Q!% %4 .0 o m.O o a ~ . mm O
9 0!m 90!lP.0 0
oI 0 1- fto 0C. a.-o - mu- a 00 .- 0 I.o O M ~ 0 4 0 - o 0
64 050 55 O
0 N 0 0 0 .0 o 09 4 00 cCO c Cnn 00 ccn
ao C-u- CC 09 - 9 9 9 941
0no on , u- )0 0m n nm no OC) ,N 0 a00C. C 000 C 40 0 C, ) n 0 r, r
4 00 C: .. C: . . .Cu. . . . . . . . f -.- u-: 4):
W 45
41 0 0 . 0 0 nnnn 110n 0 0 C ) C I C
7 00 C 000 0V)0 n 0000 00 0000 000000000 COO0 000o 00 010 ~ ~ ~ ~ ~ ~ ~ ~ 0 009 9%0 99
0%
al
14 ~ ~ W 000 _07 z . . . . . 00
Wa Ov a
We 0W0 0.I0 00 00c 0.
M1.3 - "Ma D. -W
W u 5 -W 3. a mI P- a sW% a . 1I00 V C Z
-o 'no 014 .1064oo W -z l Cl M 4 I419 0u CW ! 0. ~ Wp- a$0-" 21 00- I4 a:. a
209 1.9-1 M-- 22 M 0:0.l. 0-C0 awn -
j203 013 000 V. -0 00403: - 1-22. r *- I
00 ... 0C14 2.0 C 0 .. 3G43.
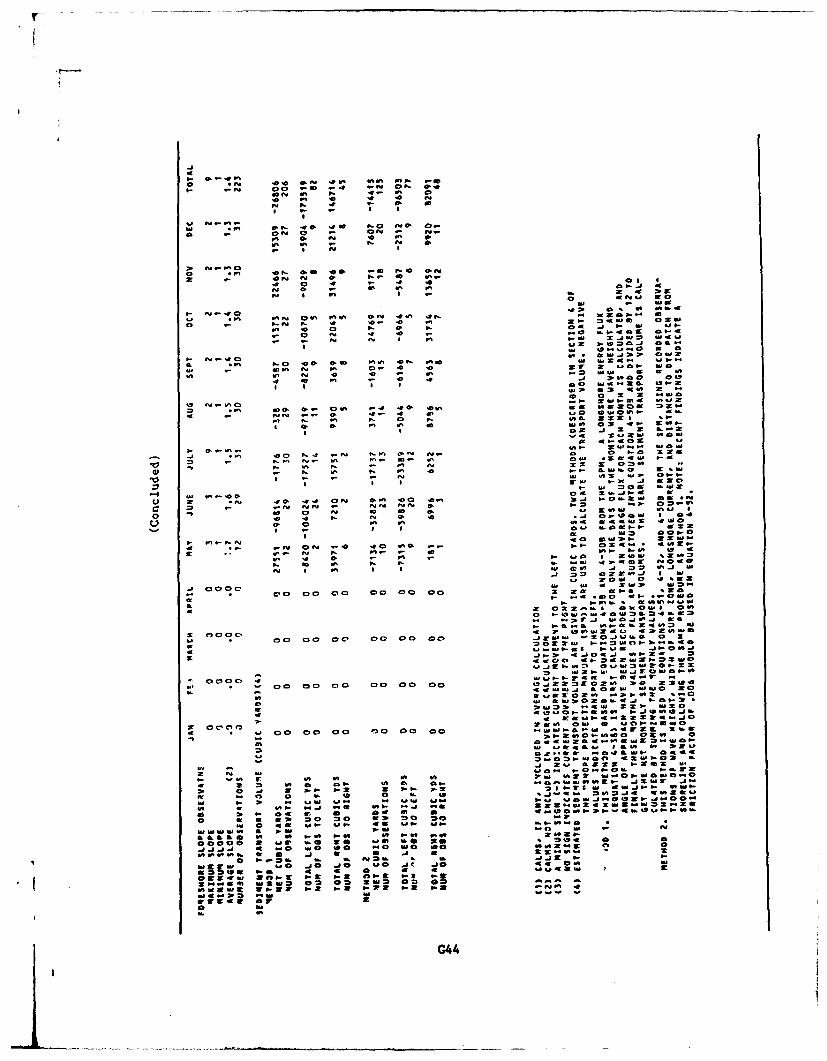
P4 0 to 4.4 p6 0 4 .0 N
N P. 441. .0
* ~ ~ D -- 00 0 - 09z 0 oW ' 0 as
a 1- -0 -
o~~~4. at aP . 0 - -
4 Co 4 4 .0
9p, a4 0e1 0 a .W 4
j 00 ' - 0 1 04 .J m- z ac
-. 0 0 4 .0 - =P4 .1- 0 0--. ~~~~ ~I - a .W 39.2 m4
*9 0tfl r W 0
64 ~ ~~~ Ws N 0 ' 0.2 mw 4j f0
40 .j C -:: -1 .0 all 64 0
W2 z3 464 r -0 1 3 3 * c9.
* 0 C. a 00 z u. 03 41 34
IL .0 5 1
009*0 40O- W.
N Nf O 9.-0 bC 3
N. 64 Q0 04D c zz so a.mu.o-W -1 IN a V43 w- 01 3
ro : e3 ca .04 ON n0 00 CC)9 .1.9 04.2 - .N NN- NN N 0 2 ac
o 0 0 N .0 0 mux~i0u 64u
p. N 0 .. 0 0 .90uW S04
0 e. 0 Q, 94 44 9 9
0 O . 0 - 061- -4 '
.g.. . . n 0 - "0 TO-490 S 3.9 30
p. b--= 0 p. evo - .9 404 3N j 0 go I u 44 90649
v~~~2 w2.. it mu . V-a 0
W.9 000 3. mu " VAu m
-r a 0 00 00 00 000 3 10
G449 *0 4- 09
-- --- - -- . .. ..... .. ......
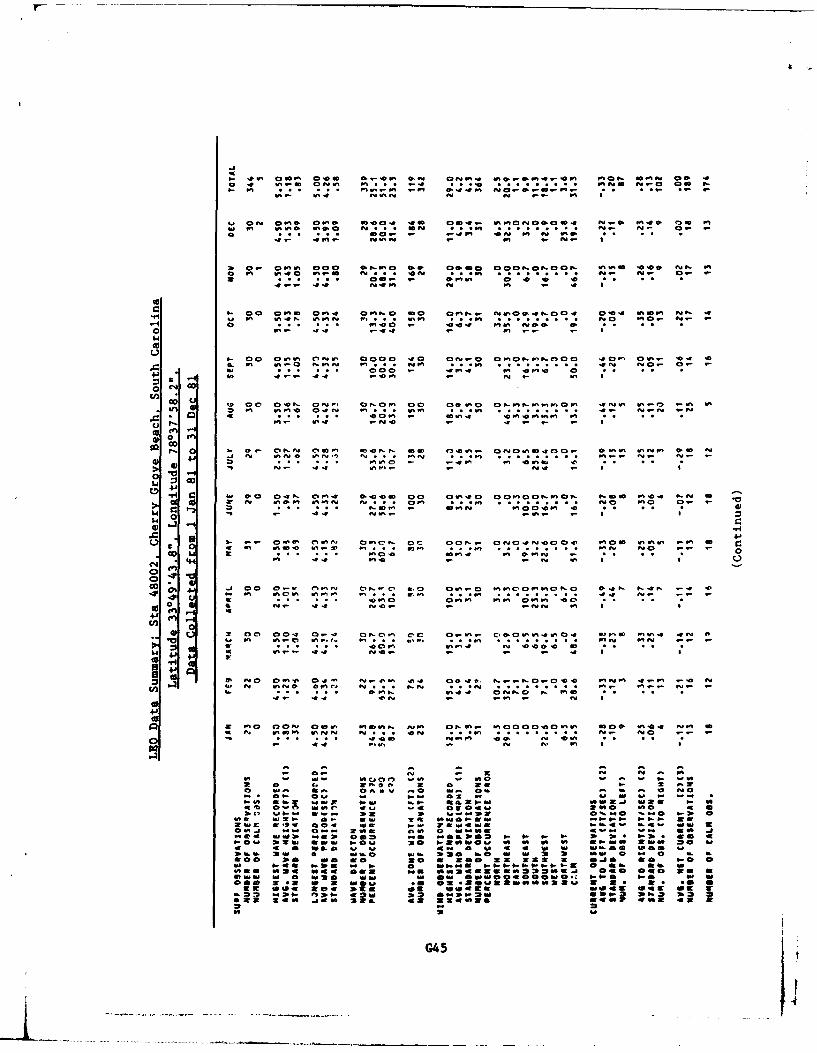
4- 4~ e om 0.e -. 0 PiM. 0.o~. a- 9mv a
oo 9T an.-. 0W %%: '001 mi... C!99 9%99 : 0 nOwl a,4 PM iv 04 : C
0- 00 QMM1 600 ofv % 9P n. n. i.a~~: . o0.0 ft ~ . m . 4
0
000infn 0 9 v..p. 0mi %-.. mm .c .o- ma
*1 Mo o . 9o. mm C!oa
o : 14. -S 4,;4 g- r4 -- ;.
en0 e
0 - 0 o Fv. r4 iv 0C0 400v- mi.fU.) 0 40 6. 0
o J j
0 (100
mila 0. ..- 4 .9 9644 IV
41 .x~ ~ 814 ~ - iv 4J-L9 %; !t "o .c
00 @0 Ini M.400 0 0 0 40 onmo0~~- P'W T40 fi
44.
00 -, C C . 9 ;
X. 0 mC. r 004... 0 0h 91 4 W'.
-: .. nn~
ao 400m, mtm4 iv -e a 0 4
LI~~~~1 43 m.10nCr -- .- .
0.4
N.C.
4 T *.r 0. v 0 -a1 a S00
0~:2 2 44 0f v i f
a~ ~~ so 0 .. .4o 0 . ZOa 0A 90 8.0 0.. a 9 6O
wes -2 4-8 4-68 sea s *-ma198 wms a-
40 0~' 68v.~ 44.84 5004 4 4

N 0
a .0 C 40 '. 0 0 N @
@0 0M AG0 W 2. K0 0
I C 0
ff N W - I- W
Z0 N1 -ax 0 1la N -i lw :11 a I-.J
zwz -WO2
N ON. 3 z C2 . 0=a"
OP Nf a' o Oo o- v2 0I-RI o .O o
w .0 0 0 Z
N~~ 1'00 0 =. 3 W .2A
0~o o- IL I. 0 N a2 %W2Z lof N
0 0 R I 11 .20
- 0m N. 0 0 -2 zRK wfN
3 0 .0 0 40 EON r*~~~ o I R . 2 011
'.2 m 42 W 01M
A ~ ~~~ ~ ~ 0,.e ItaU 1 .6-O~ ;-4 .I
~~~~~r - 0- O. - 4 -0.0W Em - .
I I -1- W IR W rCN
10 *D ft0' 455 N01.R 00 *DmN ,2~~~m w~ 002 ON . 0 0 NN -0 2 0
o -N 0 -" z 0 22W= W5~
if .2 000
NO.20 W 2 WN 2..
KWO,0 a w2 '0- ON =NO 1.
0~~~w 0w - 0 N .5lI2 -5 1211
W ROW 0 at .
-0 *0 9C 0 NO a 2 ;N a N a 20 ONE 20
m 0 0$-0 A. (a2 00 O we *.- Nw
a 0-4 4 IV 6.2 I- N0 02025
- N I - 0 0 7 RR I0 0.1 01
on. " W. 0 . 0 M OW 0'1
2N.0 fm 2 255.0.302
PA fu 0 NO N 0 Nw a 0 0O 2011 .95owl W
2 0 N' war 0 0 4 .N .2 0.5 2R2 2
0 WE1S W.J O2 N
.2 N40 . W..NNEO NO.G46
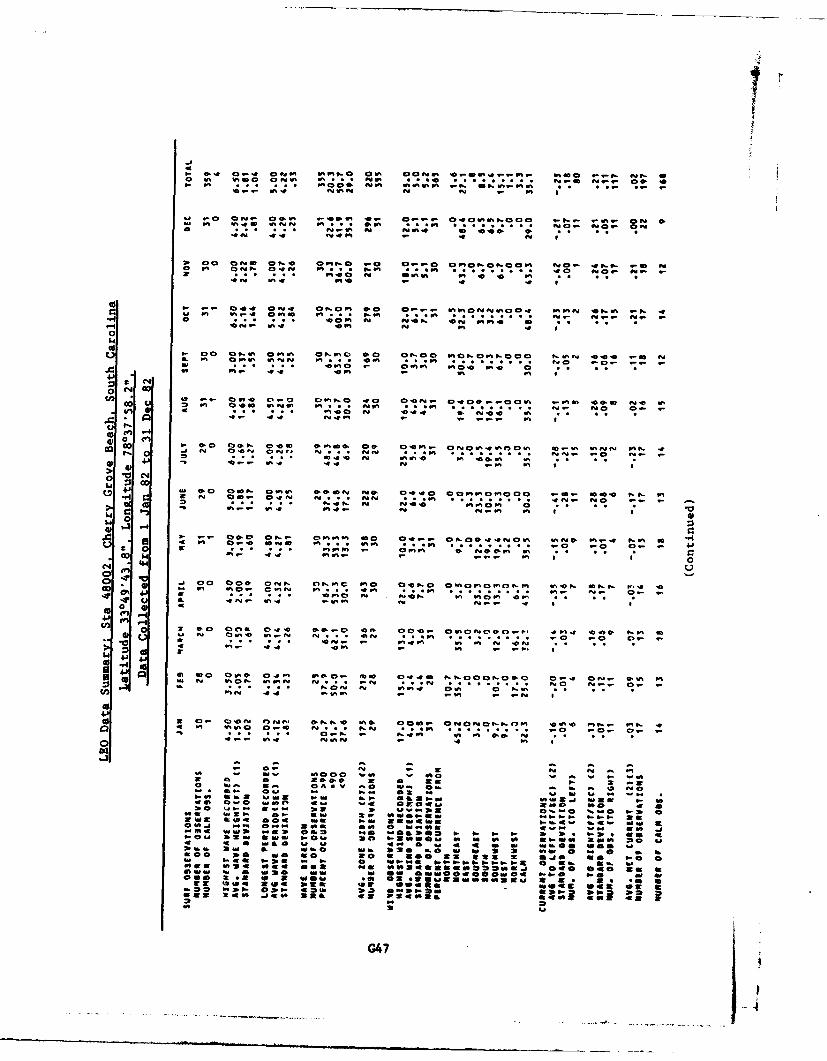
Of;-0 It
o t e IVS .0 o n i nr0 f* e
.4 -e ft.. 0 4 0%904 4-wo aVo. 0 fr. -. q. .-~~ nn !n % ZM04 vN 4 f..- O
'0 ad m ft4 e4 a4 1. 0 .q ".fo 1
M C! 440 Ni ViV% 40, .94 44ft m mi -
0
0o 0 OwnV gift 0440 90 0C.0 99nn9":99%00 :;X:.t 44* :4 v*~f 0% 04 4NN fri . . . . O 4 4 -
CI 0 C- . " 40 . 0ti4 gVt lt q ft 02 s
4 9 n 94 4 W14-p
4r 94 1? ft4 0.94 t
-n 4. 44, 044% 9 ' g O4. Vt CLI g
Vin 4-fv4P t I
a
4J
o~ 4444 t.N 4 f t
~~~C t -0.~ -W4 4 4- --
, z.. . . . . 4 40a 0 4:
0.~~ '0.4 - 44 4 Vt ftf'tt
V.0 w .0't :4s&. au 0 V
4 z vt a4 ft - P dj a1- W* 4 . . . 4 40 304
- 044 ~~~4 7 4 4 4 4 9 . .
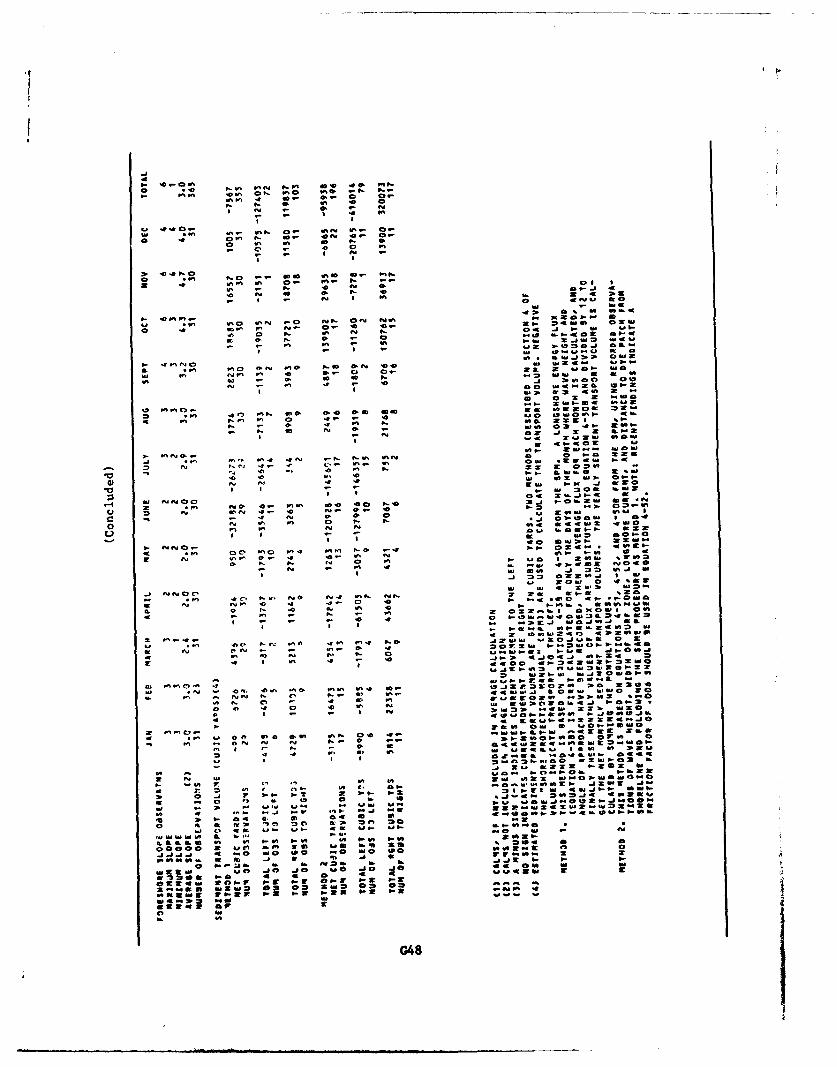
1. 4.. z
1.~~~~~Z OWE'0 N 40 15 N 1
W;-z 0- Z
n. 40,0 : 000W
a~4 &'. aaN4- 441 4 0
~ 0 Gtj
W -A a D o PN a 3 _
( 3 0 N .- a a n I .- I -' Oz
0' aT-..Z44~~ am 4b N '
4 ~ ~~~ *4 u0 4 lN ON Av # s !3 4 0
om 0r= N e. -
A .0 .- 04-~ ~~~ 401 .
, W 2J4
1.~~~w o .,rz W 4 4
42"o 42442 .
3. =M -90 lw 2 .44
It 4- It It .J I. Oar
0. 41l ' SE- 3- 0- 4I
-A~~ I4 I- E* 4 - - a W NW mow4
- 0 .J 4- * C. S0 2 4 -
- ft a 4c N 2 K 2,
cl. 4L L 4 I- *UhI 2-
Ip It N
_04 64
4 04 N00 04ZJN4
U0 W4N' 4 44 4 4 43J N 4 4 0
002 00-
1.. 404.- 40 42N 2
: ; 4 00 Z- No Z; O 4- - N
0 4 0 4 4 4
4- -N *' 0 - 4~I 4G484
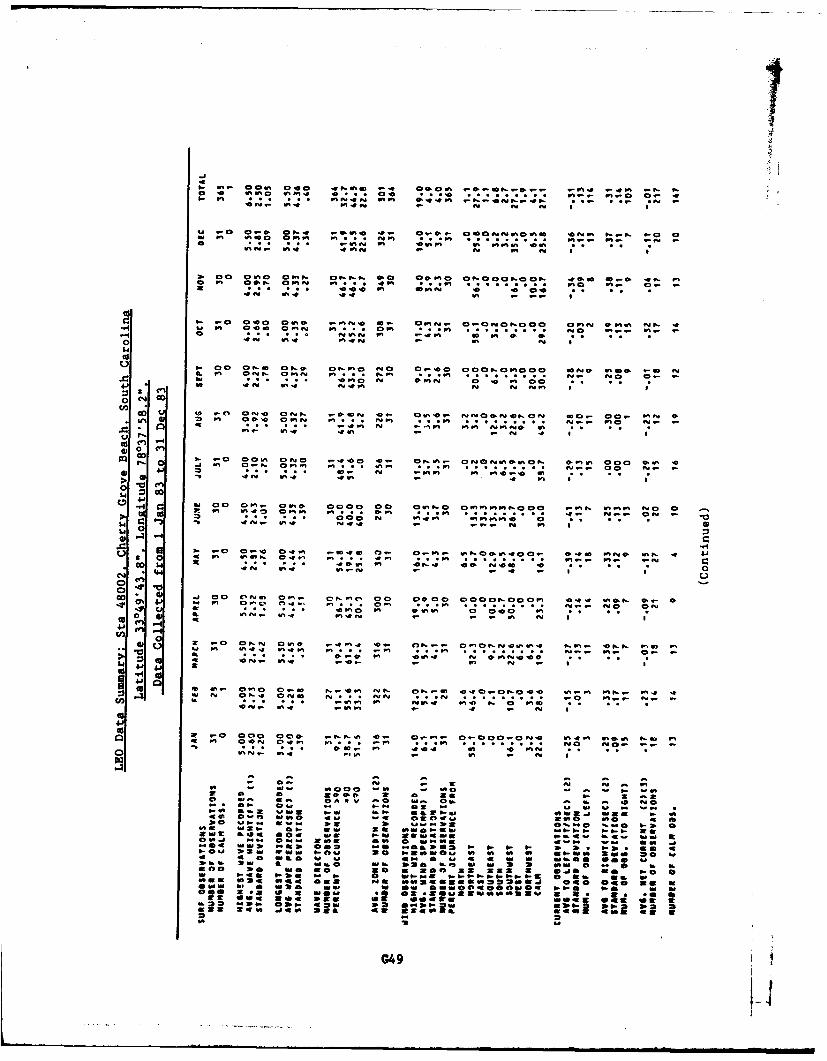
left-P on~ 04 t ft ft~ @.04 . t 4 t 4
98% -j N t "$new" Pt Vtt~ 010 1 t 9
Z ;;a Ca 00. Ow il ca.. 9-:-9% .9 wtC ft. 0.a ft on4 ot*Pn 4 0O
wn 9t0 0 Ot t .. O *.Pt 9. :V- 2:- vt. v9C1 ., MzmN C; .z .4 Pt C 0 *4141 ft 4 ft4 .0 Pt Ny m Sn
0 C
tot - t 4PWt Na * t em a Ft 00- -14
o cn1
CC, C,,'
I" C,0 a7N'S 014 .09 00 9nt4. mmmmmN44oc fS. . 0n Q> W: 0 9 O.t7 maa W; 4 NM Ii .* 9.. . . N -- Ft t.
*0
o 4 0
0 j~P 00 Oft.- c.Sm 0000 C 00 0v0 a Mcoa tN000 P0 . Pf,~ NO. 0
10
-A U . - . 4 0 P - S U .. 0 .. t P N S P 4 0 - 0 4 F N tt -
9S .#91. t mp. 5. N 0 .O ..
411.
% - .N 9 ; C!. 9- 9 % - I n - t
0Z 4 n 0 W1 frnw
ft ZZ2S Pt ;:A- N :Z4414ft o N.. Xt -.- - t N. - I
.P.; o Pt w~t Pt' N 00 Pa N. Pt0 w ~ :a* 4 Nt w
ft~a-w Ftt 04Nt O.p . .. .P . . . . . . N
- i Ow.- Pt 4 t Q- i sN -: o o
o0 01N It4 astt-
-G4
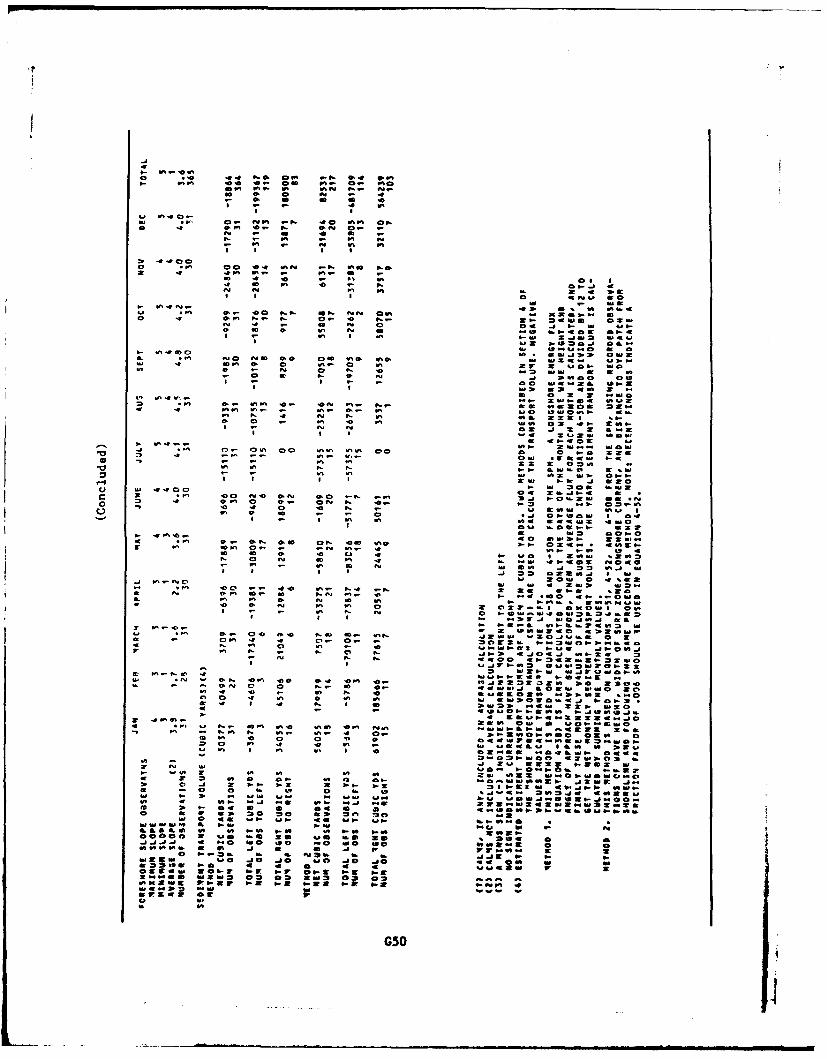
N ne .0 wo-m V.- 0- n0* A 10, go IV, zl
am 10 0Z N
.- ~~a a
W a
'a -Z Z a a
Oft M - -Z
I I I I
a~~ w X - t.t 1
a w WSW
*~6 C- Vt qI .9 on 2 W
Wa~~~ .0 t 5 V 0
I- Vt4Vt Vt M. 0ta 4 U1 0 t. 0 V 27 2r6 tar-
01 w0 -t N W 45 a aiS 7 --0 a a orN., 3 t0 -
0 0 w o- 'I 00 w w2& 151* I W3 23 C rt 2 -
1 *t.~' o r 2%9040 wr we. sita.
* - N N 02 M.1 2 2 za
OZ 0C C-1&W0 oww
4. a- 0 db2*wt w On
-0,-.Saot 0
At, - goV I , S. 0WJ OK 440 O4 w~ 0a
~ 4 O~t 0 a.-itN"N 0.- 1-2.- 0 -V00 z a0 4 0 t5 ~ W 5
0Vt1 .0 Na 2.0 0 ~ 0. 2 Vj W99 In 02 V .J I
A* 2W 0 42-,I- PtN Ed wC gW3 9c :
I~t 0 ~ 44 V 1- N 2 72G502
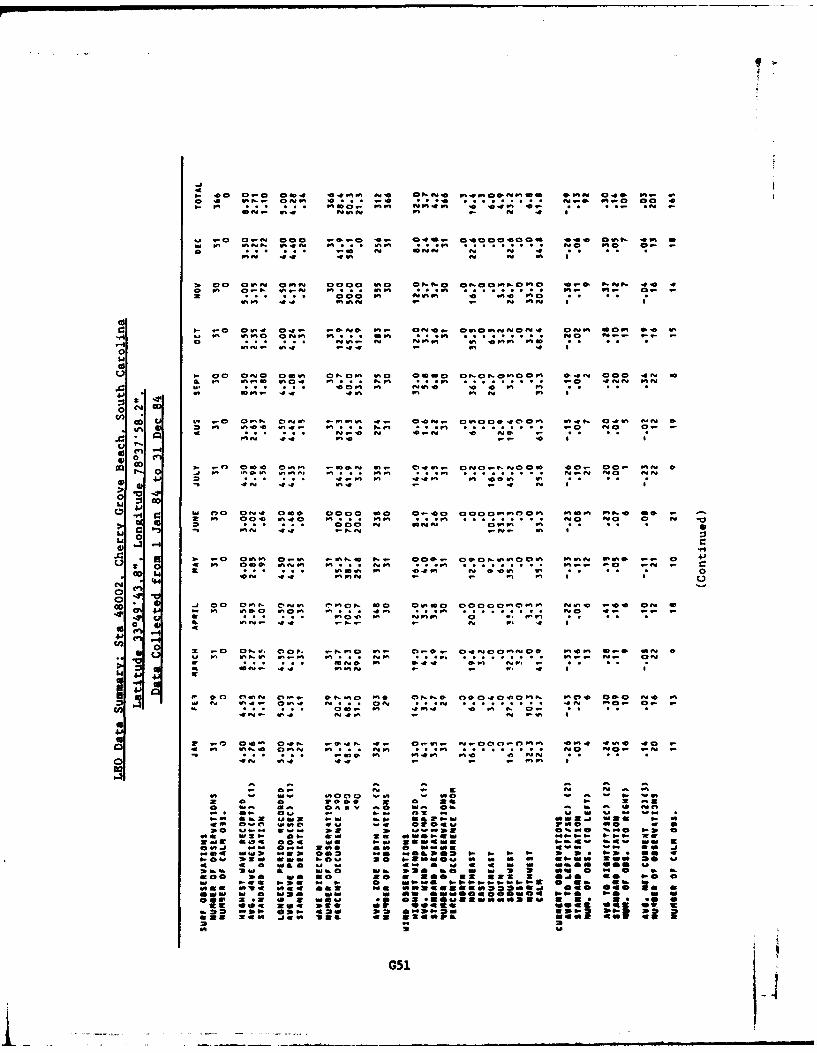
40"
'. 00 O 0.- 0:2 1099C :.a 41 4 0 4 04 4 4 OI. w- V V9%%g V.4evg v. 0 6, V.0 C.
9. coo on' ftC4N 1 n .0 4 7
P 00 0 11 a 02"4 9,00 91 W:t- coo~tO IC 4-N N 44C .-. Vn M.. VIP 10 M1. 9.
V 0c . n~, ~ .. . 4cn ~ ~ 4 VII .-1 N %i%9 *-9 i: 2 ,1
0.C : . ... vf. .9 NVi 9 VV
01en
0
oc , -1C3
*0
LlM: Q99 00 fl4 M... V.. no no a
Lao
'Oft pn t
0
.0 f
u-f-M
*~ ~ ~~t C,0rVN (e ~ l . NO 04'O~- V0 0 4V.1 N V4 0l a... ON . . . . ..n.. .
C,'~~ 90m. V i 4 V .
. M-n :. 4 .- -2. V. 0
;:a Nx at- w n a "I4r10. 04 :2 7000 0 26O ZZ 2 V
w or Ca w t- M zX I. Z: -
445 .0 WIOO :too0 oa4 40
MW 11 0 WO2 ot z WNWft 20046N0 5W a t04' -- a ~ 36 0a 0 = aW 0N M
Nw "aW "aaw NOW, a0N 40 4 N4 3 4We ~ 4 V5.0 40 0a~ a a ft W s 2 aa 19 W Ow M IU
w00 P0 a. : 0 -. : 300 I3 "-W * 0 00 Na a am" NP W N N NN N N m s
own AS 0 aP aa0 0 @ 4 00 4 NO N
@00 Z 2 8 ain . 0**3 a30442E G51#
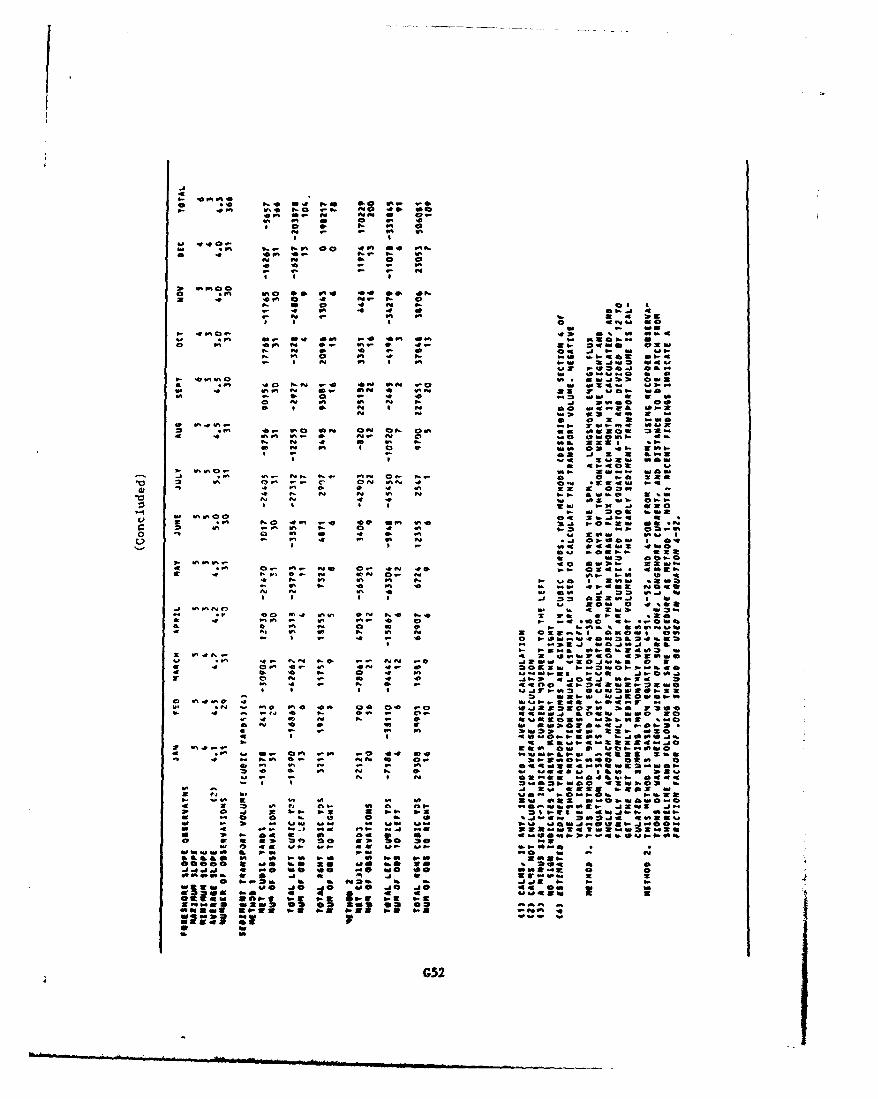
N ~ 1 aV4 N N 4 6 4
W 0I on W 0, .* a N 0
0 6I
p t a a
4 45.10
W 6 0 4 d 0
4 ~ l -. 0
N~ AV 0 --v 54 N 4O 4
14 W P .& - "
*~~ 44 w It w 4 04
a a 2 o. -m
o~~~~~~ 44v -p 7 . m4 452 ~ ~ ~ ~ w W4 4A' a0 mime N 0 5 5054 4 4 4.. 6 Pd. Pd 0,.. @404I*
N~.2 .d 4o *1 5 2 5S~~~~~o Pd"j 4 4 4 4
I-y m - zw2 3 6..
*Z WI 4o Aw a 6 4 2 3
ft ft0 0*A 4 _law 4 5
5 I - 44 34442 1- 440
04 *0544 wa l 52
4~tw Neo~ 4 0 NN o 3 4 .2t
ON 30. 0 *
4~ ~~~ WIIr w 6. a 4 4-~~~ ~ ~ ~ ' 4A af1 44 9 4 4 z5 S-
a.~~~~~~ #. W Zd0 5 0N 4 6.I 4 5
9bI. N%. 4e4* 4 a4-f. II ~ ~ t 44. 3 *440 4E
*w W W ~ 0 . P ~ . 3 4 2 4 5 .* 4 0~~4 4.- W w 8 0 1 .2 0 P
4 ~ ~ ~ ~ ~ ~ " .0 W P4S I-. 44am M vp so W 4 40 4 4 2
01 4 .w -" 440 I 2 ~ 2 2*~ I 474 2 @ ,4 4 4 2
ox3 4 w4 0a-We 44 0 4 4 6 34 04 .
51 Pd 49 44 0 0 04 O 4 1*2 074 40 42
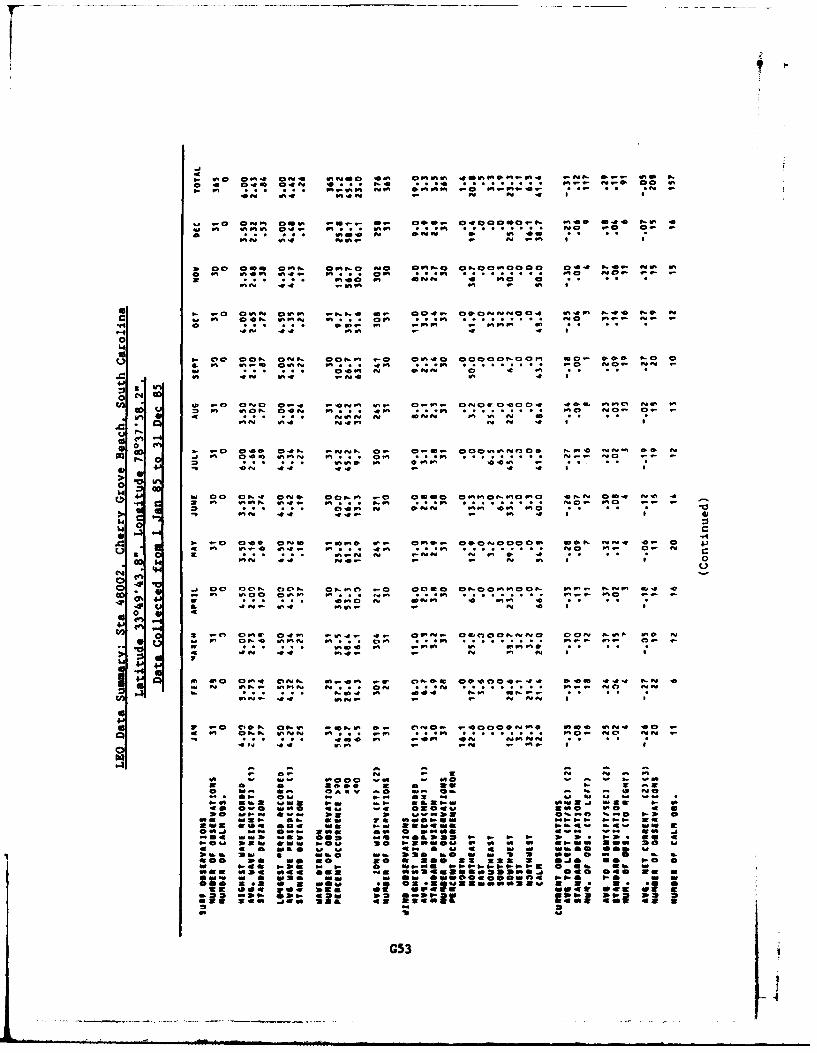
o : . .4 9.P 4 . .; ; - ..- m 0 0Pff W% .* vm n d -OPl.4* * P
on p.n t~m a4 PI. n ! -aw i C ft 0 0 ft MPP 0 Is C!
ft Mo fZ O mP 40 ev 0C
0
cft o- a0 10P a~p oogwv .e0 a 0 0-.C* O-*0 P.C a0 tW f
>- . . n . 0Idd v
*C C! VSP 0p s e 9d
12 to0A a:, Sftp. -ft zsP
a.I.--a
6- -o co 04P. .- p.P- so S.- Oo d5 * Pn dSp G d
0- 6p. @- $- sag 4 4
"a : a 40 :I .
all- a4a 0Pd a -n wow 0 n. 005.200 0O zp.154 * 0 44~3,1 ni .S4 Vs4 -910;-. O ~ a-
* * - Pd~d d PS 4G53
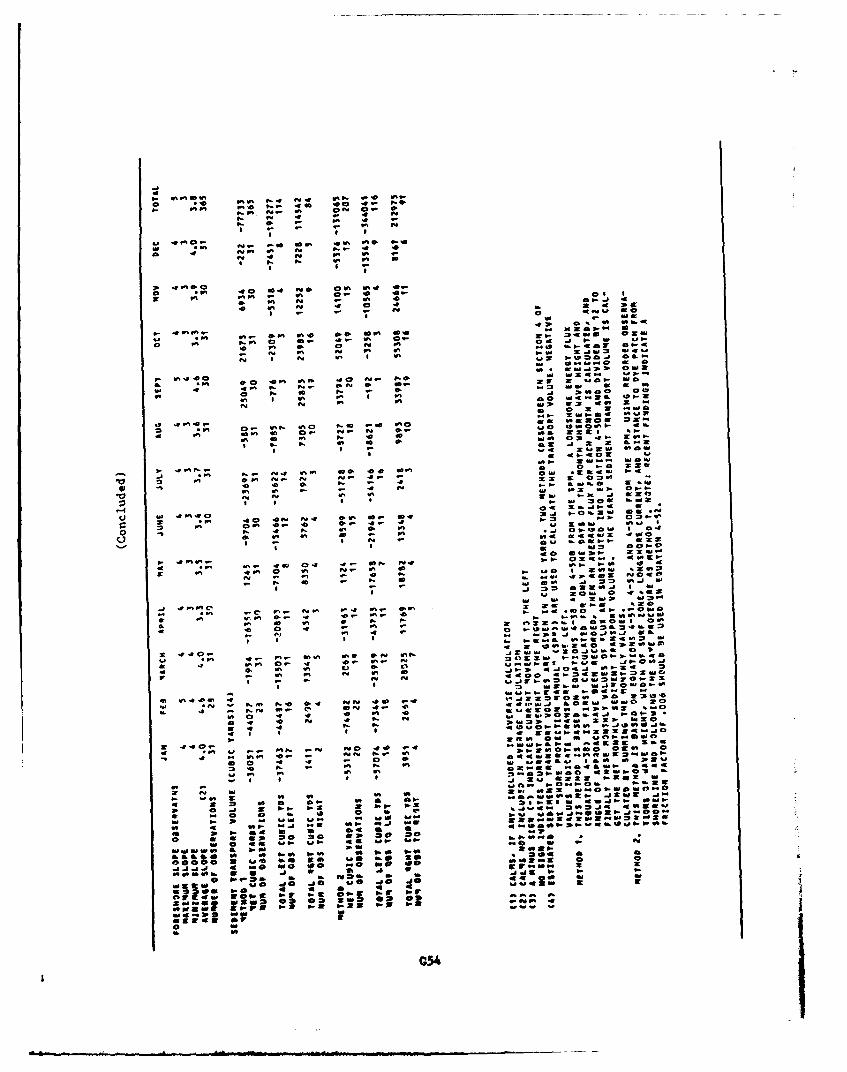
-AA
#f CC! 0 -
in ft - e 4 a:of W% t! , P, D
* , I
W) 4C0
0- N C 0 4w z t-
*C~~o 40 04.0
C 4 *
do OS o
40 a 4. o0 4-~od
..N NU
It . oo 3.
z'% 0,4* 0 1 .4
C*W0 0 NN,..PlmO.
~ 4 4C N N 0 S 2 0t _ 4
N'o : m~m -to '~
c. 0wwlZ *.o
o.oN. 312 jr N -f w -0'j
r~"o0 a,~ w- $-...ao
2. -
.N
-NN
£,.
we f
U ~o so 0o4 0 N.4
4c a s. '0 . we ow..V 0 0
.11 AtN .30lo I4
N'54C.
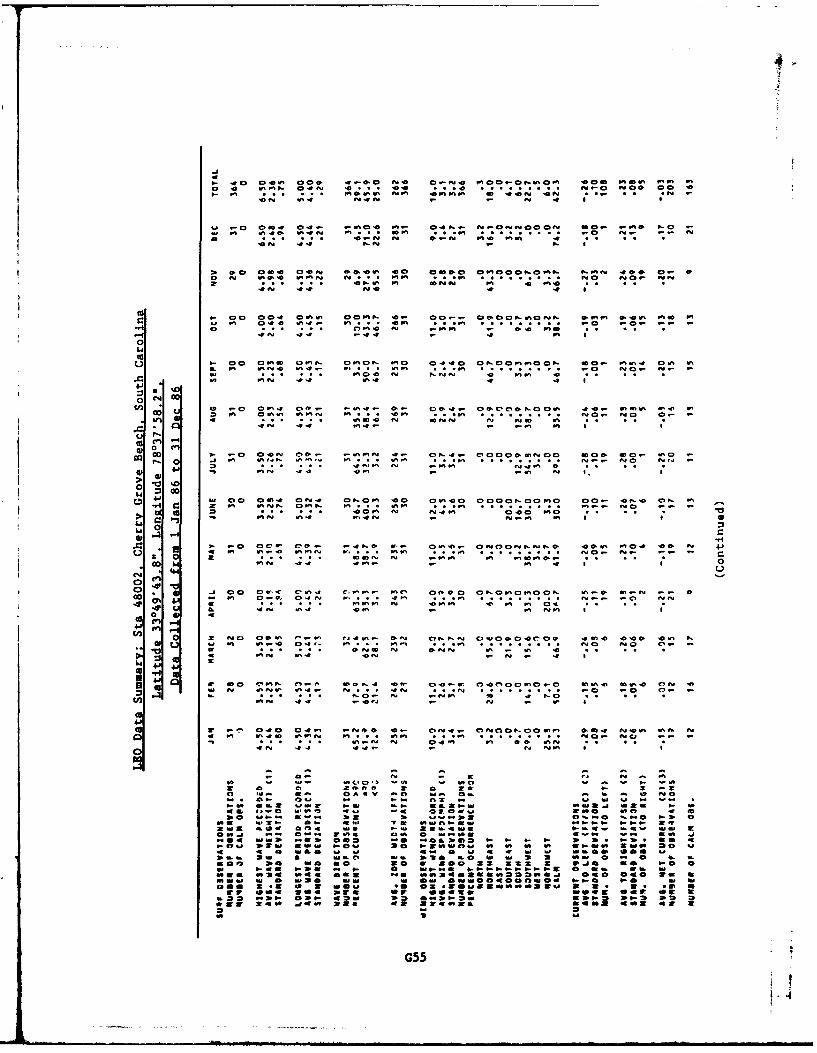
44
10 ~ l 00 44 ewIy 0, 00"10 ft, .0 fl 1 40 001f 4 w 4w .
n0 91 #440 $o9 1 9 :l- Z:44
a f t14 10w 44 . . u0 0.- -.
2. ftw S *0 14 00
041
b- 00 0042 .054 005P 4 0 -. 0 0Nne N 0M 4V f4
90 :"t "a ..
0
0" 0 2 : 044 9* i4 to 9% 9 9 .O- 0w f r-
01 010 000 4
40 c
I00*~~~9 .3 %0 991 91 t1%4 99 %04. to-04N00 n4 @5%
>0 -*4 %D 40 0
0 :$~ c
0044 004
44w 4
0i 0 0w or, all. a 01 4 I I
IL.
4.
0c404
a 010 04 40 v w 4
a 0 01 4 N0 4r SO .7 :0. . . .. ,. ;e, .0
010 44 . -:w 54 ; I
0:0O0 ;-a am0 04F 10w30 1, 01"- ONOCO 040 so 40 z 4 Nw 1 04 *00 1. .Vff. . . . . .Pf00 -
04.0 0w 401 @04 040w *4 Zo 40w 44 41 - NIN
- C-0w - K #1 0G550
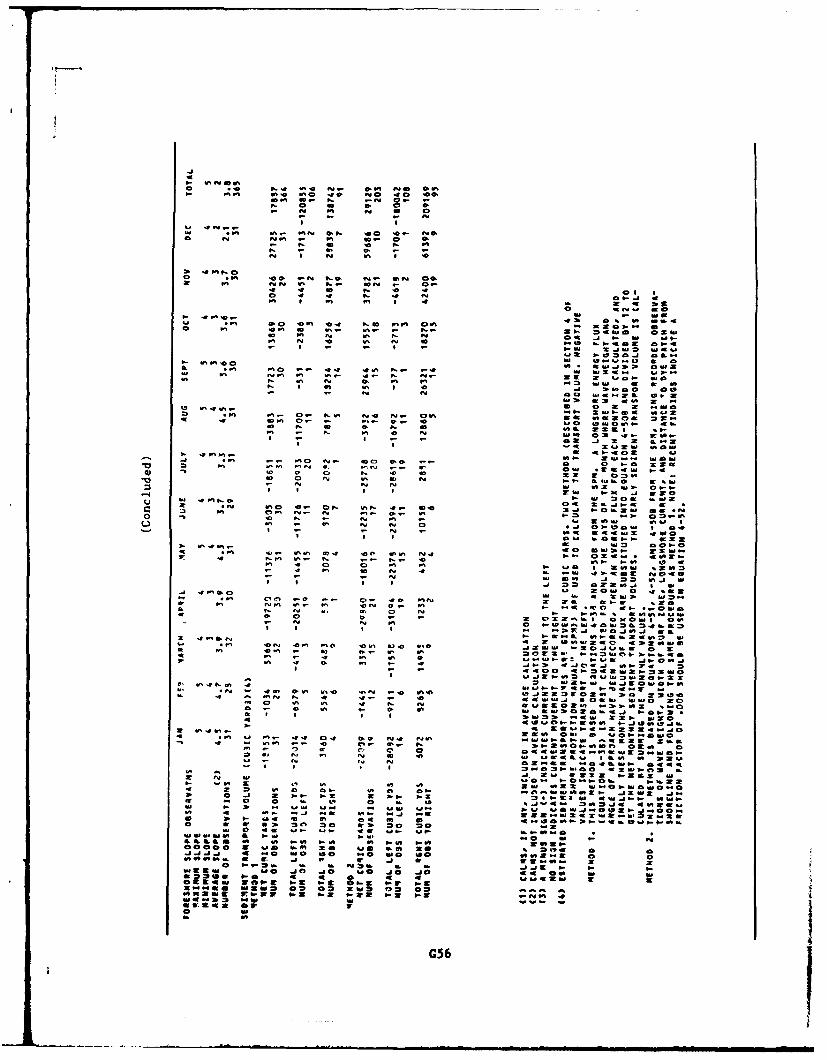
Do- ;Stt 11
melt~WM 01-,..N
.
-4 fn it N S
a Sa
-0 Nz U' ' NN U 0 mg- - 6
N- = N :tI7 XEwt C
0 .449 '00 N NO N. U'N 0
o 0 14 aN 4 N zw-.. UVt~~~ MS MWP I 4- '
o U'N4. v 60:DO - z
m 61-1. si 01 U' U'E
41 w Nt,0. 0
Ut~tOO ' UW.Jw2 w l2
1, a ' "a' . !(S~2 ayt "3r 14b C ' ~ I
U'~~~~~t -4 as-t M9 t @ ' JO (W~b'8M3 NO xU' wwo' 0 11S *
Vt - N Pt '0 05. ::= 0N -1:O-~~ z - -j .'U'90--w I'JZW 4490
U'wN OK 4.N *4 t4' .- IN t M.. .. o wa
'~4 -J *t Vt S N. ' 00zt O z rO~~ ~ -1 wtr tJ 3 -Nro r w44 b'0 ( C. 4 U I I 0 2.
U' ~ ~ ~ ~ 0 0=0tNN- W .Vt N N - A l b N C NOw K . bb. . 1
Pt J. _IN0 CU0 14-bU U'01~ sN5 0 ' N t . 'o 3 b O t l . ' *
Vt ~ ~ ~ ~ ~ --9 Ut N wk 5 ON O A I
Z' 01 0091N ~ ~ Z 3wEt. 6C *W N V3-0 *P Wr . 99 P4 '0 't N 9 l .7 0 t N V~ N ' - ' 0 U
Vt 0 C V V N .4 I 54G56.9
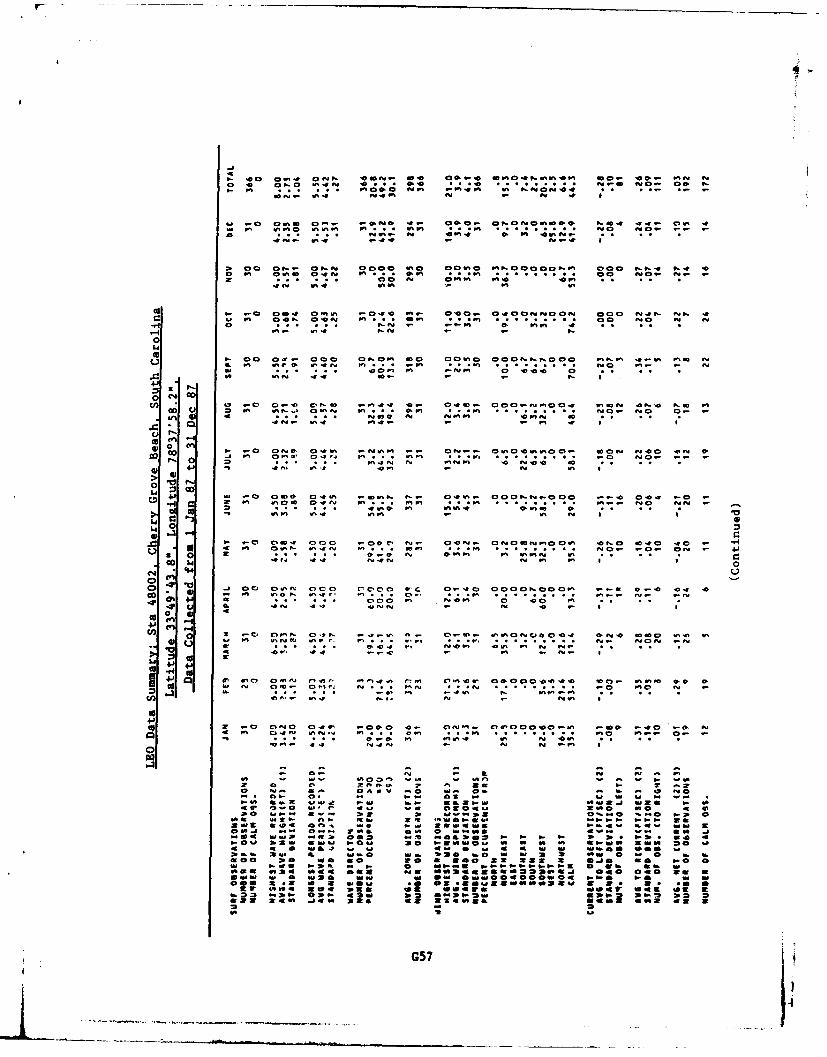
8. 0 0 '~- ot.. 0 0- v 4 . 4 A0 '09- 988I. PM at1a M4 -0,&* 0 8~ a ~ a
4-n . . . 00 0, M44 6=!NN4 ..
no- Qma ao- aONg 4.. 000.. On0NOISO00 Man 4SD PS 440 . 4 9 W, C, NO NX0 l~ 0j 9 1
-M 04 9. 91% PM .6 99sN . 14N 4.4 - 4
P- 00 00 044 44O M4 Q 0"
4N 00 584 4
W I 0e. go az4 0 4
(v0
C!.0 -Nn 0 '0 .9.
V411
0 -0 ago. 04N P, 0." .~v-f~ o . 4. . . . . . . 0~ N0 -0
9.% n It0 N X 44 04. m- P. .u% 9
OD Qt 9999w = 70 4
x C N, 0N P_ P40 0 4 0 IV w.
Li~~~~~~ -i .0 009 044 9.mt 9 09. Vtt-. 0 1! '4 04
44 g 9 4 T040 g' a
-, 44 44 q4 of I I'
S ~ ~ M 2'. ft w4 6. a4 . .0 40 W4 NO wP
IL 0
dt 4 0 N .IS.I- ; % 0". . . . o .. . . . r i .0%a I00 4 -z 0%0 '0 4 .
"2. ON 44 '(INN ..N .00
0-0 4 la: a4 3D 4a - N.
20 a 40 .4 wl0 #8 0.N 84*' t.~4#8 (',, 04.' 000 4440 00. 440 90
* M N 0 4fC N~ . N. . . . . . . .. ~ G0 N7
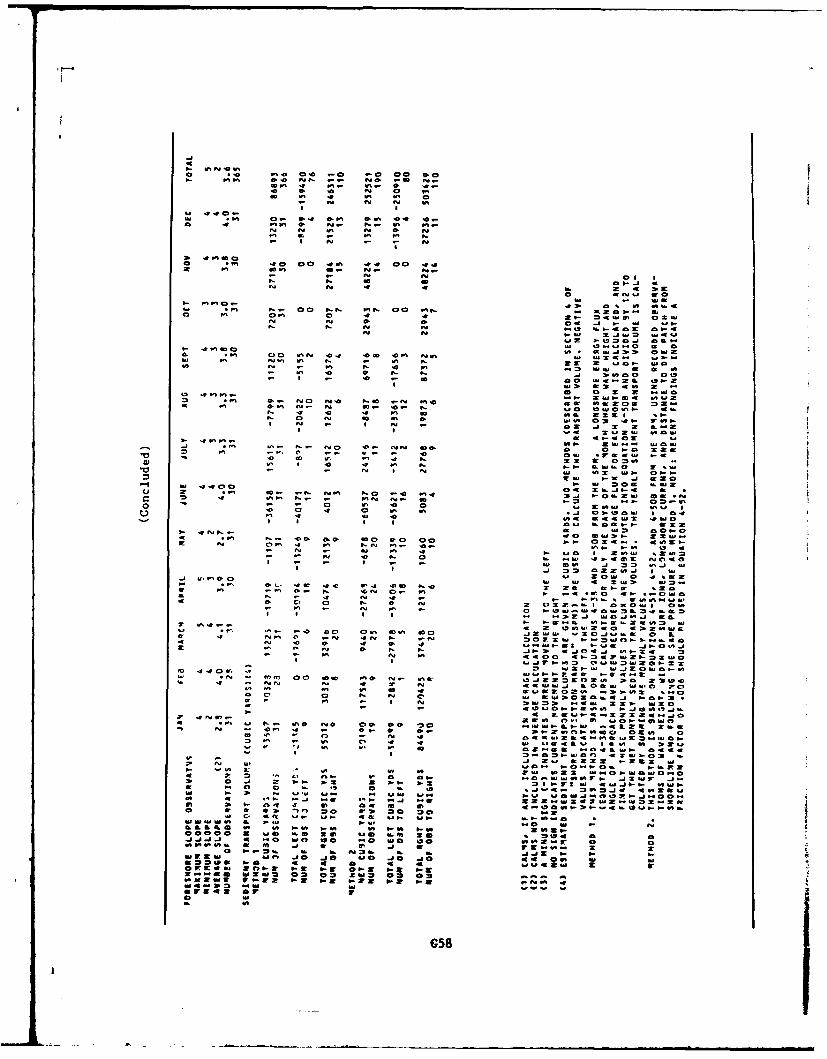
0- 0.0 6 0o ~ ~ ~ p Pat a e o a ~
a a
a) Cb . 0T V,£ .a 0 4 f 0.-
M~ CC -an a
a 00 .0 w- a01
0 Z NL UACmino n Na 00 N ~ 00 N a)-2.
Q.- Os an ODe&2~-~a
0 an O~a 4 4 EN a m . Z 5
- ,nn.- 0 : 0w = an =. . :n :~ O
an I a 0 a a. 00 toC'2 a 3
,cc~W C, Can 02 WO
- an San an N a..- tan N a -ob a - C
4 0,sC Zial w Wa CaCO a
a ao c * an N6NN tW.2O
*0~~~: -an-_ anN * NJ fl W)
C anN w-a- an 0a a
a 3a Z ~1 bO N Ew 4NN COU N t).
a a ~~a za.J a a5)z ZOSS 00 a S02*0 annO. e a) 2a *W *(.n w . it 4 an a. Na I C CNC ~ ~ ~ ~ ~ ~ ~ 0 it ana 0a N O a0 n1 .C *0 C .. i
* a 4 N S - Nn.. an aN.D s
C S 0 0 Nz O ,... a anoas658
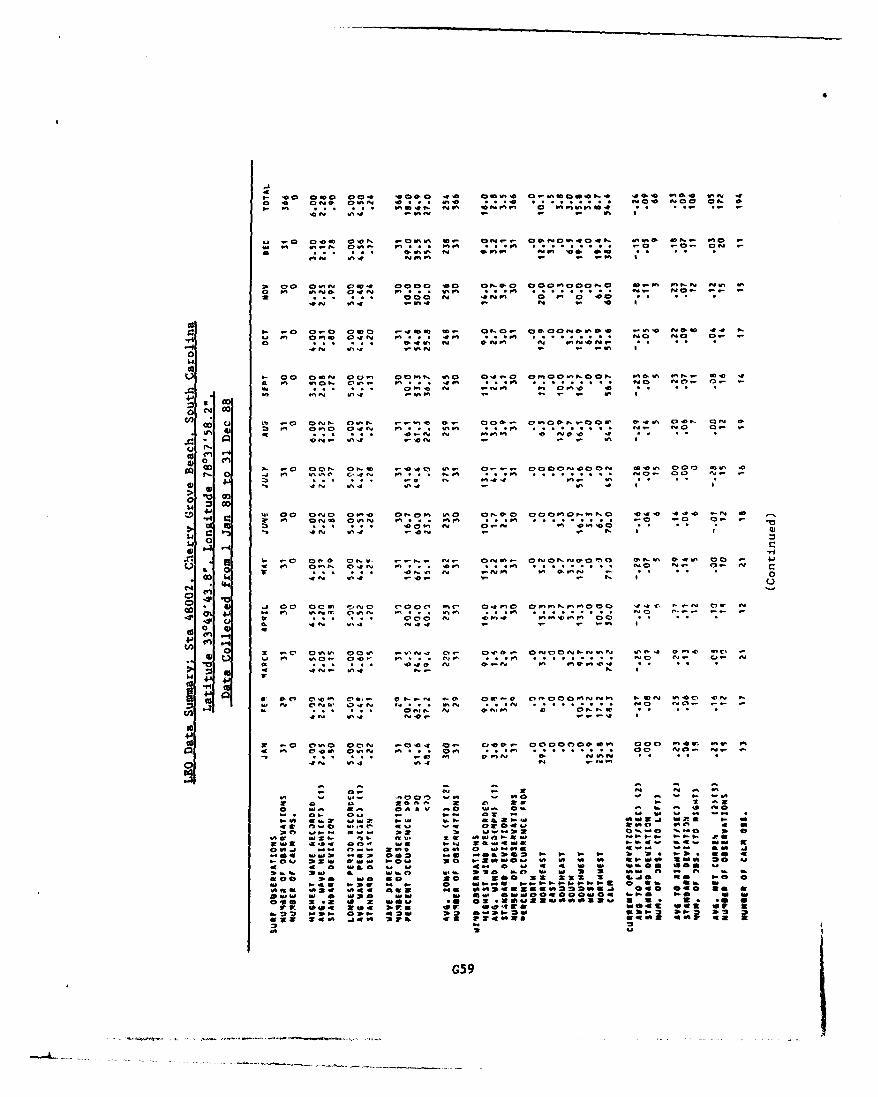
N 04 M.04 - - m 0
z ft 4-.11 CFO a.5 00 .- .-. O
0;;0 U' ,I0 0
0! a gym mft*MN I** 00. ~ - -
0
r -1
0 0
.0 . 0S00 05 0
C)
.0f ON. 041N
0 tn
0 0045 0 0
U. 0 50 CONo 0 m .0 a 00 00 0 C.
4-0 N00 0. 0. M04 04
0405 04 04 014
*0 10 -A 0 c c I 03 w~ r-- N- 05- O O N O O @O 0 0 .4 0 CO 0050 m C Or mc w0 c c O N -
14 05 044 -1 m. m N)
001:
wS 0 0050 0005 co m~ 0o00N: It4 Z C!490 00
00l m0
40 44-- -
VO 4N 04 ;r N MI a
00
Ow 0 z 0 ONM
ft 40 0O a4 N
-~ ~~~ 0.: f
co a -Z 200 2 ;; 20 a- 1 -MZ~owslat
o Ow- 0e so r.5 .2 z 5 - -
20 455-5 22 Fs t5'.,- ir.~ .. I
00 25 (.4 lt. 2 0.45-0 O55-59 P
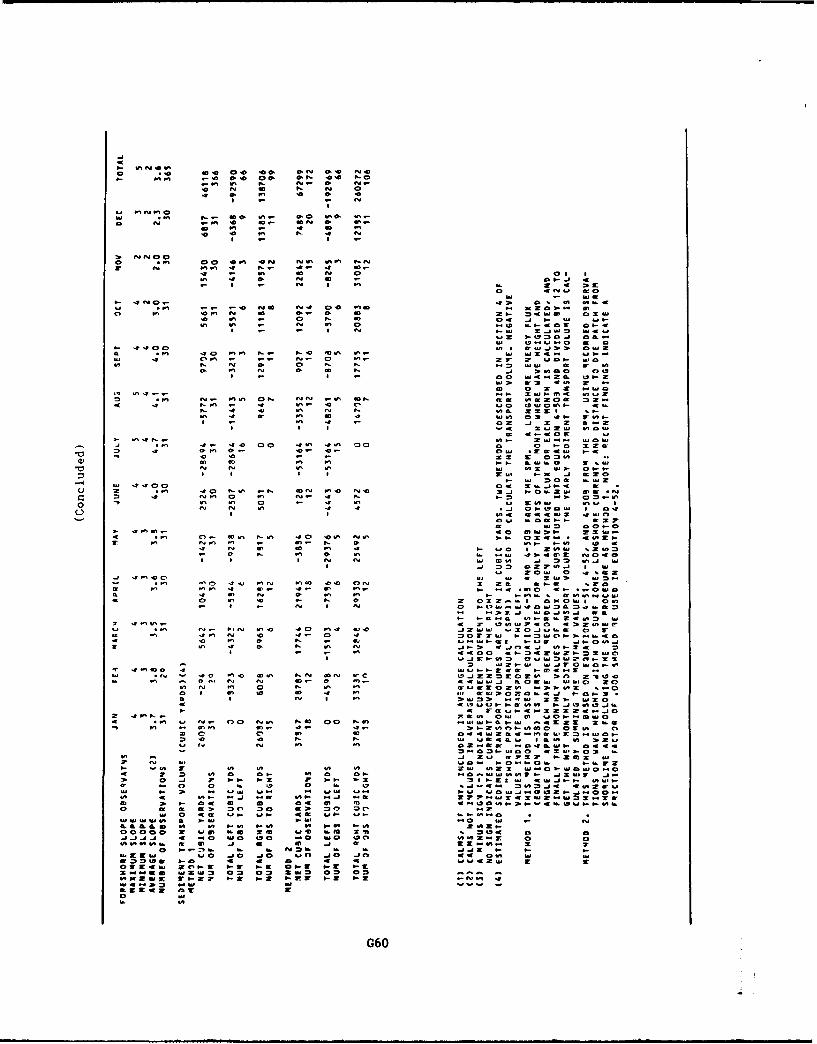
-0
-ft 01NCSo ~ ~ ~ ~ ' .'-0 4 o@ ON OC N
9- 00 Si N . 0 N
9a 10 Si '0 0 MW
4 Si -4 Si
40 to Si .9 0
Si - I i z a ~o) C5 NCi
N 4N0...
O3 NtW- 009.
23 -3-
N 440 CA iM'.J~0933
-- J fI . 0 -oo0 o M r -A
N 4 , '0 Si N .a 22
ft a>CO =n za 4.:D
.3 -a - 4S 0 00o 40 wo3 00 n o - 2
1. -0 Si ft =2 - - j
N .N Si K- 93 1-T WN 6OiC= 02 SW Sm on3 N 3
N 93 m r z3
-~ 9' 40 N~ SN SN SO O 05 ~ J1 i
U *S 3.3 9-09.293G60*
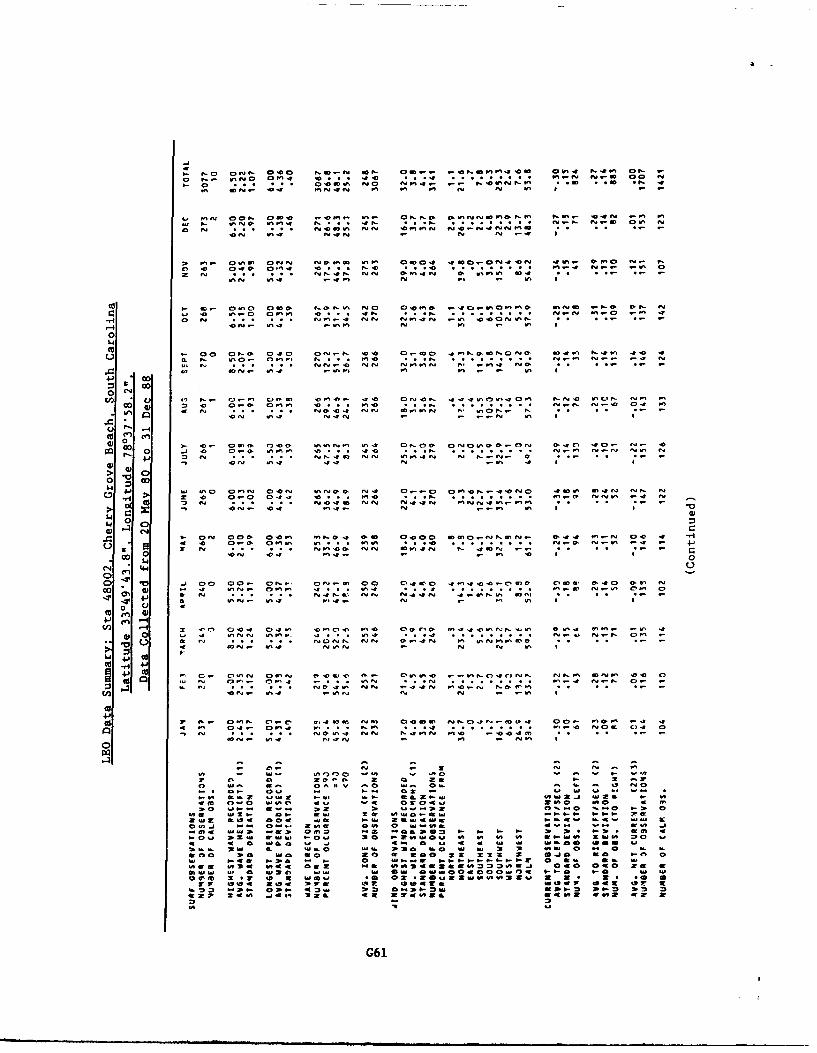
z C o~ CC "10C 0' pV W 1 U
nn~ C3 09 tm, .C fl ID o,. 0Nc a~-N~FP -. 0- 'C -
cc N %CN! Sit? SNN-P iO wol ii Cf i e ng N .NtO .
41~ 00 4 ~ i a -
m 00 sa N lVO Sp 0 4 0i0l4 m- 0n N.
0C 4 t CC 4 ..4N *. i-, N-- -
Z i-N N. W C iui 4 . .. i
0
0:0
4.1
C 0 0 C) 0iO O0~ o PuC Ni: C:- CC FN
0
V) I-4 0 C
0 0
0 ~ ~ ~ ~ ~ I X zi Ofi W4Z&UNuU4 CN0 NUOO-N -0 Ci i
At v iO l~n -t... 4 CN. . . . 'c- iNf,-. :.. . . N fiN i-4 N NiNi 0 2 00 C
*- o WT. Si,? w-, N: i-Si C
Zo, 3.2- W4 -0- i Nc i-in S I
N ~ I ON 00 4i -O,? 00 00- 0i0-Ni :!Ci-- 0 4 C *'
0. an. a0. i-c. .- nn -01.ai0 1 . z X * Z
N3.- U, ZS I.1-a
4im aPC p -C -9 zI a
4.61
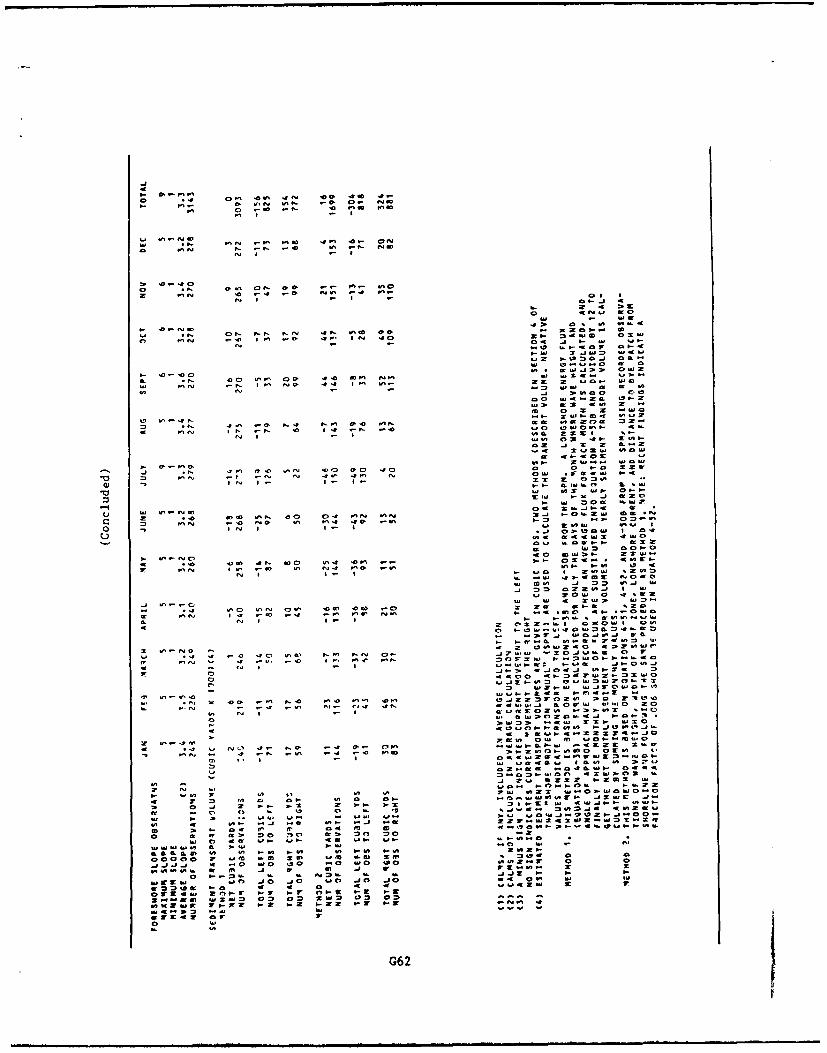
on .1
a-~~ *r.9
o *4 00 CVI4N '0 40 4
6- .0 0 WI ON . 0- N
6*1 -~ .0 00.-zx z
86*~~~~~~Z *N .N * 91W 4 000
o *N 0.u~ON 0 .- Pb .90
ws 2 0
oo C 31 gs
a-~w .o-4 i
row C-0 , C -
wa68* a4 6u C,
9-7 -0~4 09.8
00 68*,O -41huOV3 an 2
64 6fl4N C 0 2 2 .flXi0=-b .960 449.iW
*N~~~~~_~ 4.iIl 0 4 N640 O 5 9f001
C PIN 6 68 eN C 64 e rO ~s0 .9-00- 46
N 6 - 6*9& .26 Sb68*n 3 968 246
31 " .,W - 0-
a IL I8- in Z-
. j WN 40 00 hV 6*,0 420 0 0 9-0 22f
~ p1N .- 6 -1* 4d 4*9 N 0A f5S n
.11 -0~V
84zw ft 6-4 _ 9- a9- a- 4161 We-ti an W*6 *b
WXW= ol w0C
meS ~f .ai
9- CC 68-G62