Embed Size (px)
Citation preview
RTI International
RTI International is a trade name of Research Triangle Institute. www.rti.org
Coastal Monitoring Networkto Study Effects of Climate Change
Defense Coastal/EstuarineResearch Program (DCERP2)
April 2014
Kim Matthew
RTI International
Program Overview
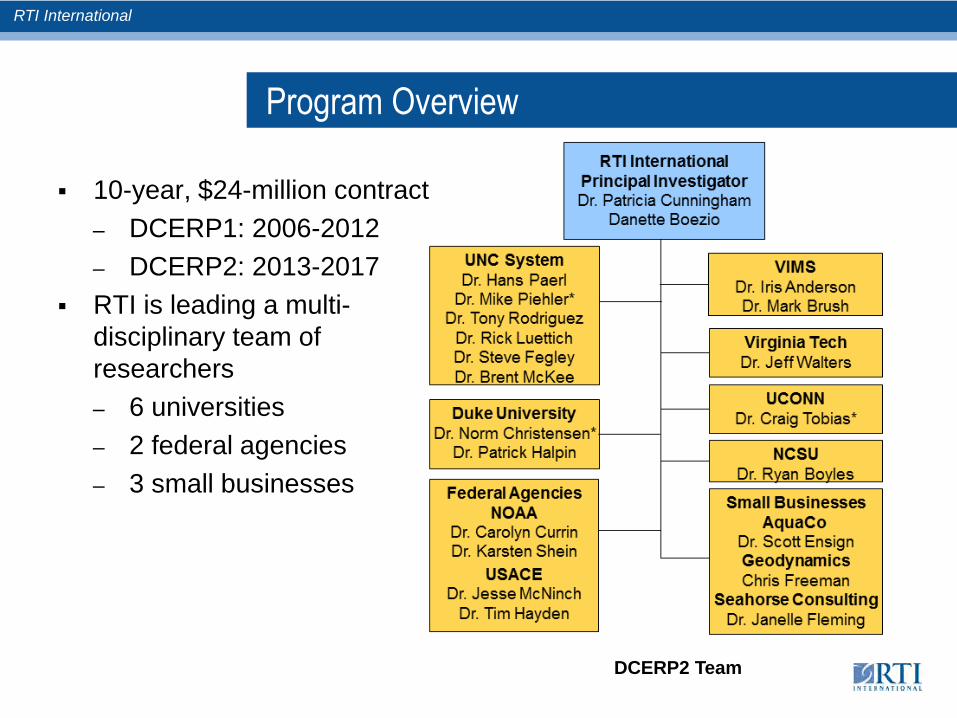
10-year, $24-million contract
– DCERP1: 2006-2012
– DCERP2: 2013-2017
RTI is leading a multi-disciplinary team ofresearchers
– 6 universities
– 2 federal agencies
– 3 small businesses
DCERP2 Team
RTI International
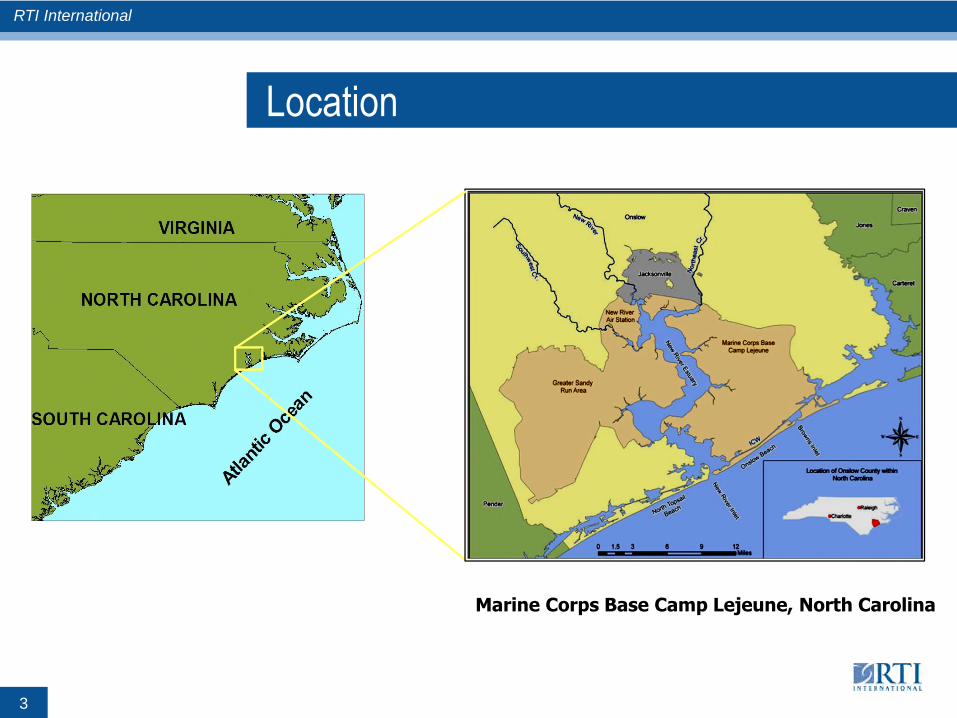
Marine Corps Base Camp Lejeune, North Carolina
Location
3
RTI International
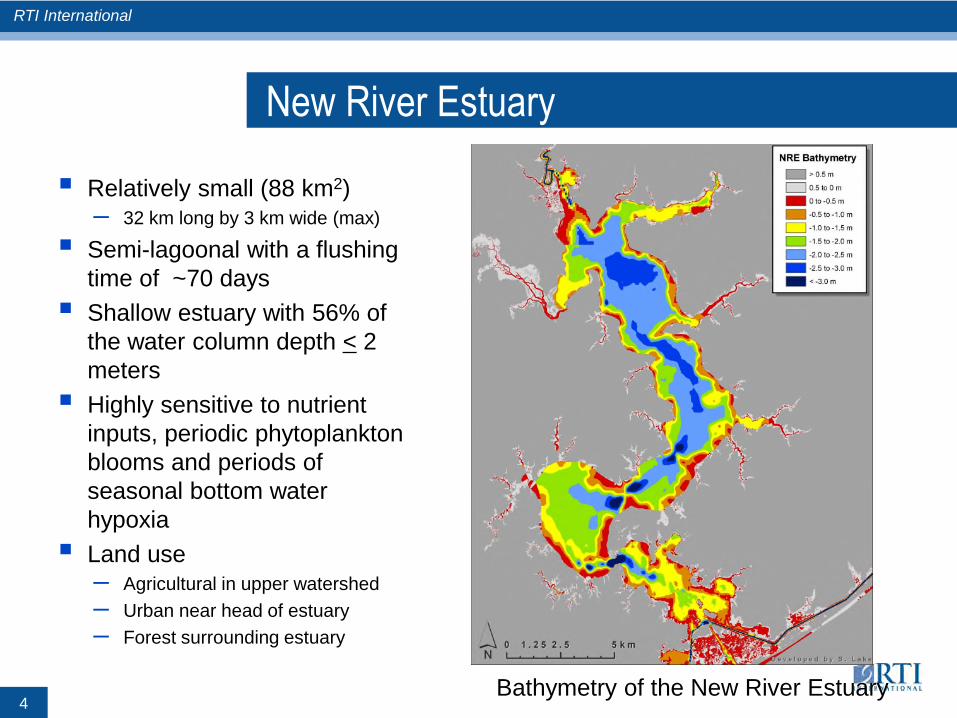
New River Estuary
Relatively small (88 km2)– 32 km long by 3 km wide (max)
Semi-lagoonal with a flushingtime of ~70 days
Shallow estuary with 56% ofthe water column depth < 2meters
Highly sensitive to nutrientinputs, periodic phytoplanktonblooms and periods ofseasonal bottom waterhypoxia
Land use– Agricultural in upper watershed
– Urban near head of estuary
– Forest surrounding estuary
Bathymetry of the New River Estuary4
RTI International
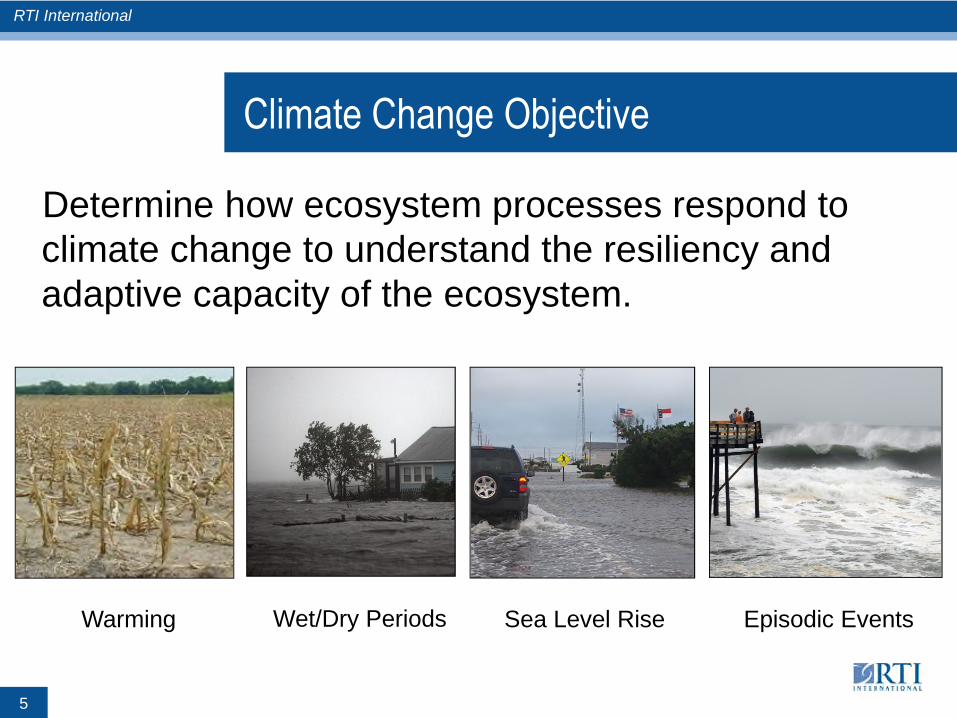
Climate Change Objective
5
Determine how ecosystem processes respond toclimate change to understand the resiliency andadaptive capacity of the ecosystem.
Warming Wet/Dry Periods Sea Level Rise Episodic Events
RTI International
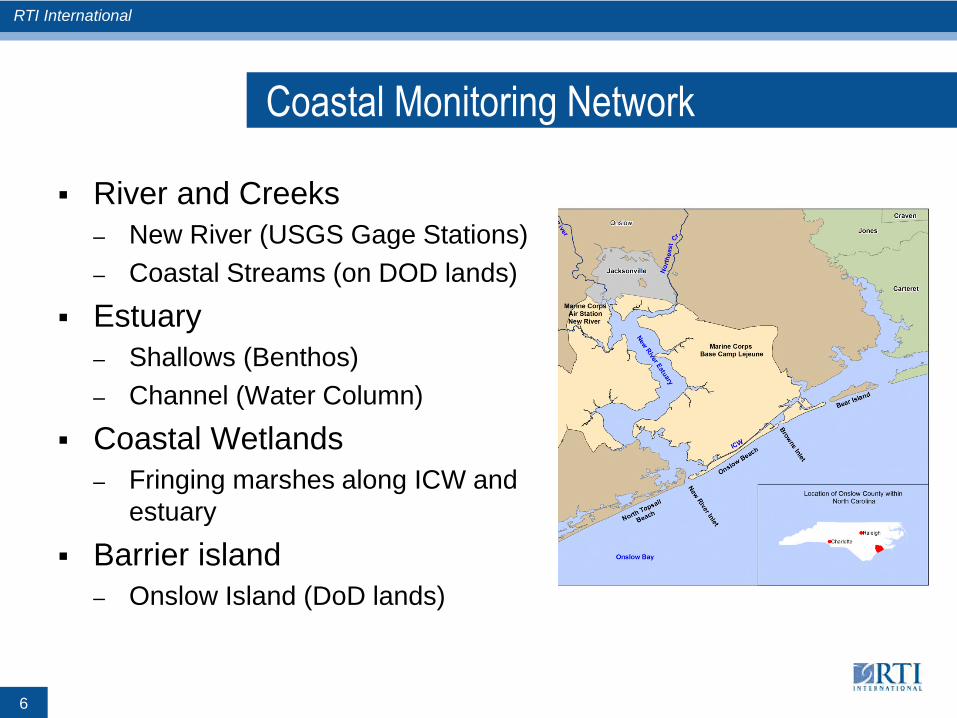
Coastal Monitoring Network
River and Creeks– New River (USGS Gage Stations)
– Coastal Streams (on DOD lands)
Estuary– Shallows (Benthos)
– Channel (Water Column)
Coastal Wetlands– Fringing marshes along ICW and
estuary
Barrier island– Onslow Island (DoD lands)
6
RTI International
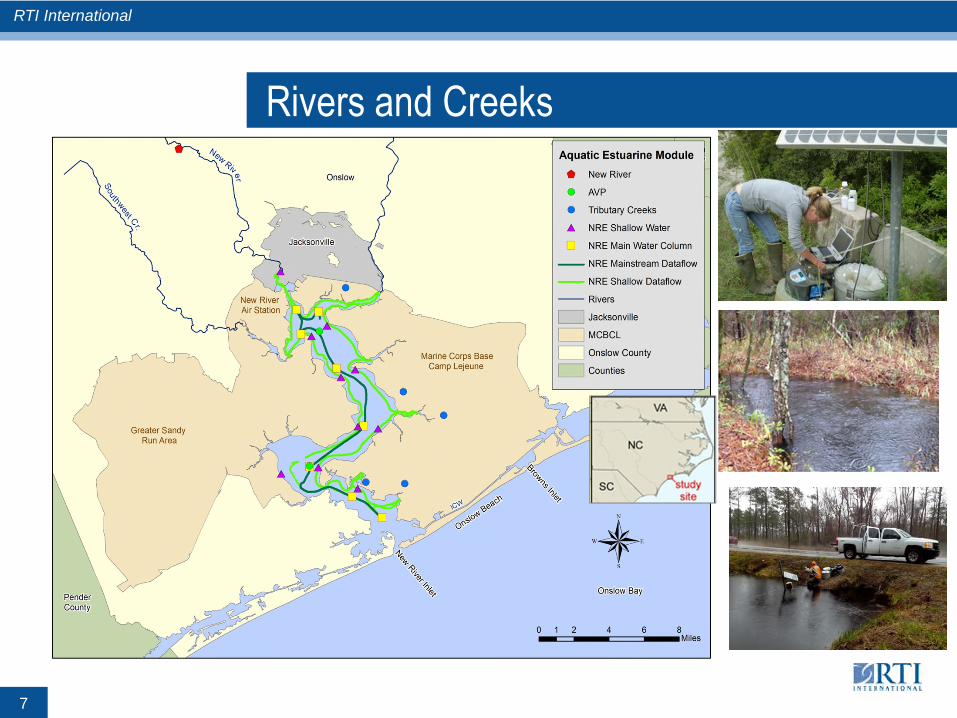
Rivers and Creeks
7
RTI International
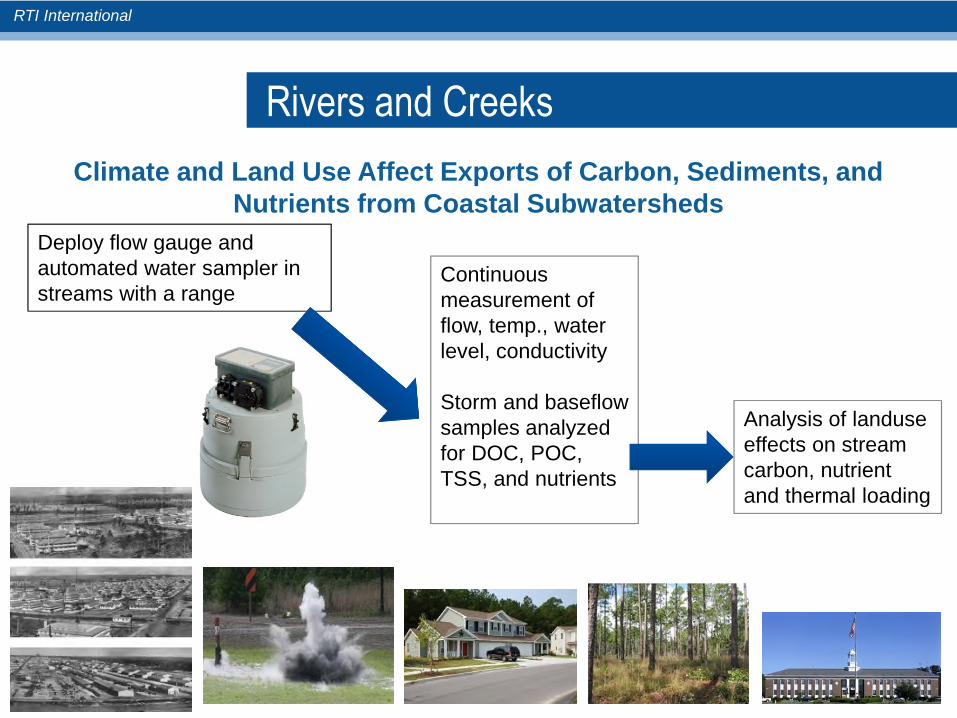
Climate and Land Use Affect Exports of Carbon, Sediments, andNutrients from Coastal Subwatersheds
Deploy flow gauge andautomated water sampler instreams with a range
Continuousmeasurement offlow, temp., waterlevel, conductivity
Storm and baseflowsamples analyzedfor DOC, POC,TSS, and nutrients
Analysis of landuseeffects on streamcarbon, nutrientand thermal loading
Rivers and Creeks
RTI International
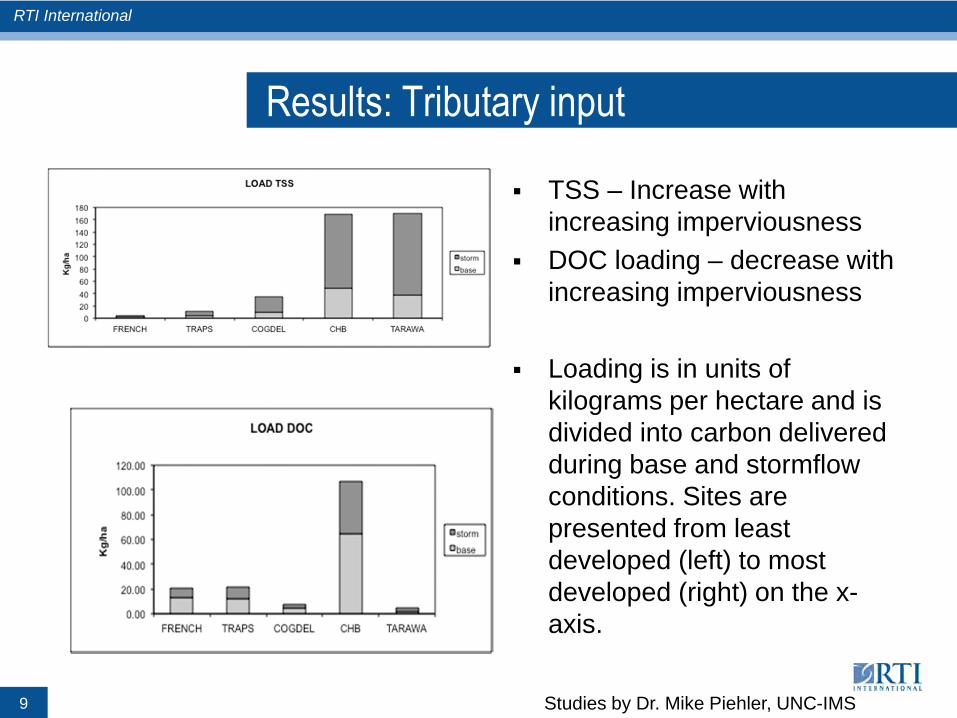
Results: Tributary input
TSS – Increase withincreasing imperviousness
DOC loading – decrease withincreasing imperviousness
Loading is in units ofkilograms per hectare and isdivided into carbon deliveredduring base and stormflowconditions. Sites arepresented from leastdeveloped (left) to mostdeveloped (right) on the x-axis.
9 Studies by Dr. Mike Piehler, UNC-IMS
RTI International
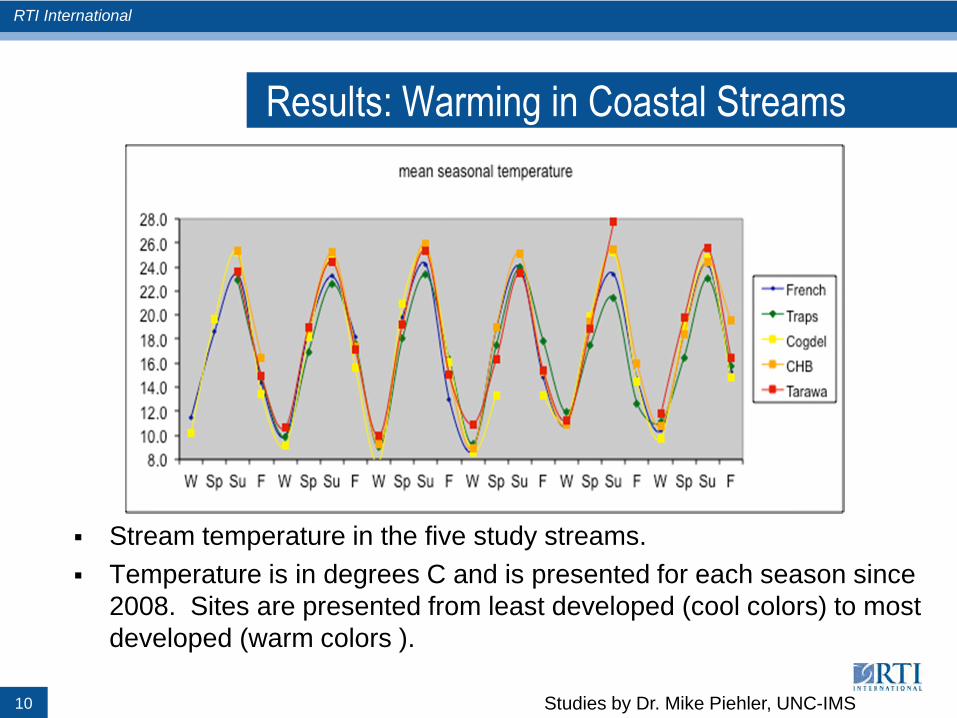
Results: Warming in Coastal Streams
Stream temperature in the five study streams.
Temperature is in degrees C and is presented for each season since2008. Sites are presented from least developed (cool colors) to mostdeveloped (warm colors ).
10 Studies by Dr. Mike Piehler, UNC-IMS
RTI International
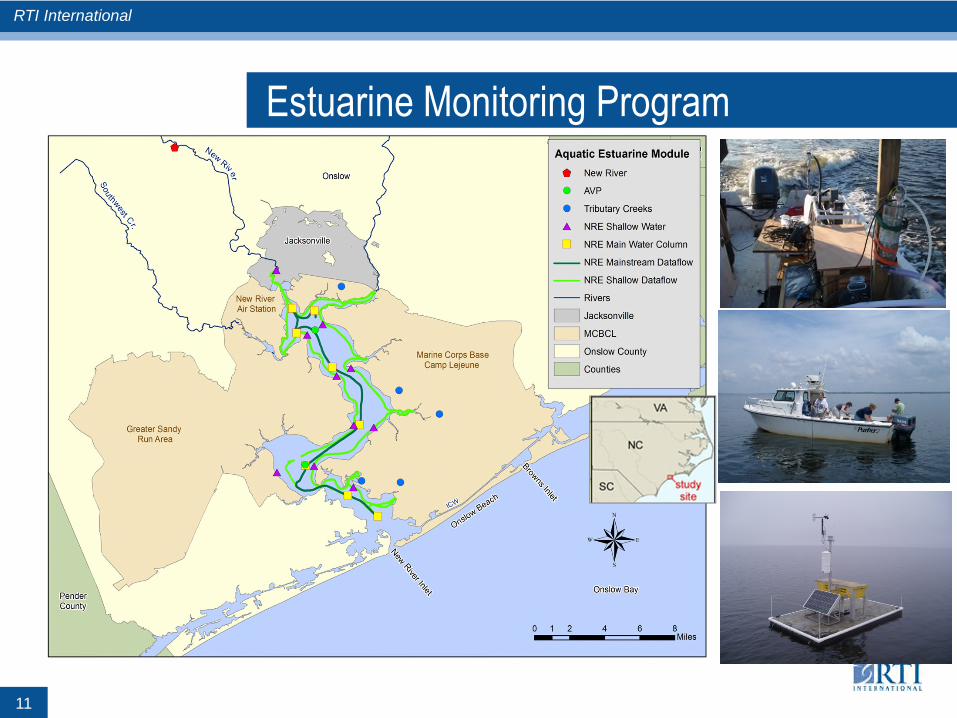
Estuarine Monitoring Program
11
RTI International
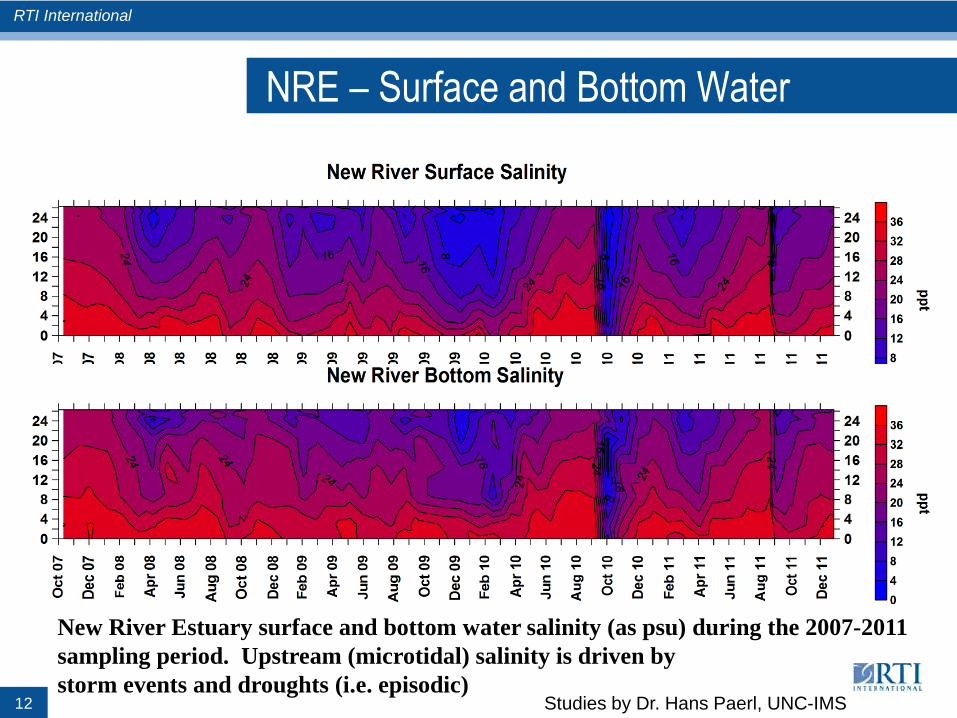
New River Estuary surface and bottom water salinity (as psu) during the 2007-2011sampling period. Upstream (microtidal) salinity is driven bystorm events and droughts (i.e. episodic)
NRE – Surface and Bottom Water
12 Studies by Dr. Hans Paerl, UNC-IMS
RTI International
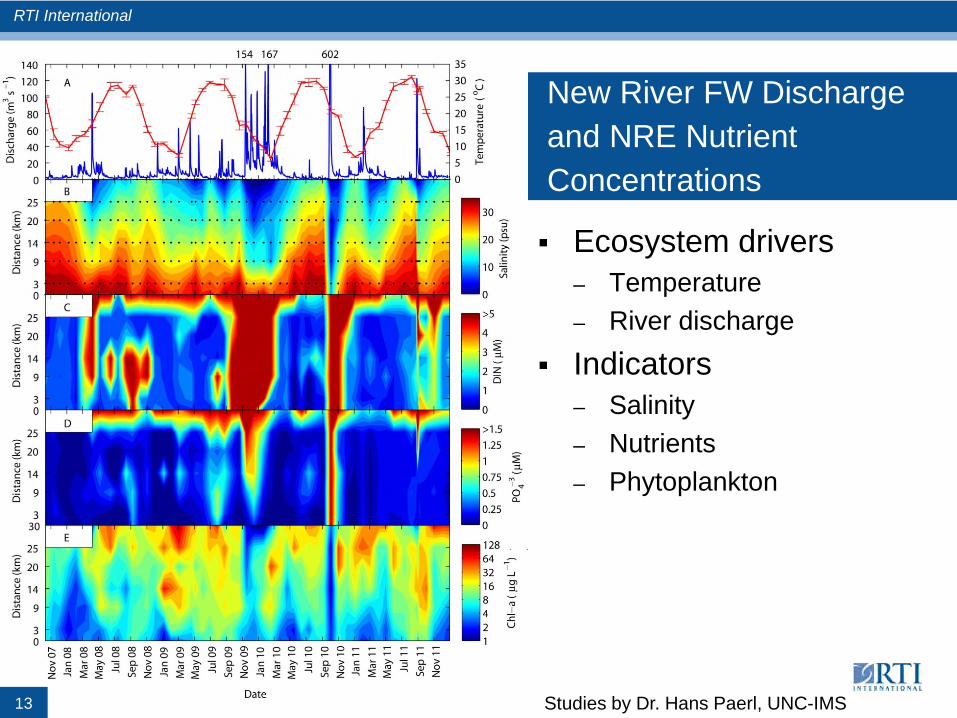
Ecosystem drivers– Temperature
– River discharge
Indicators– Salinity
– Nutrients
– Phytoplankton
New River FW Discharge
and NRE Nutrient
Concentrations
13 Studies by Dr. Hans Paerl, UNC-IMS
RTI International
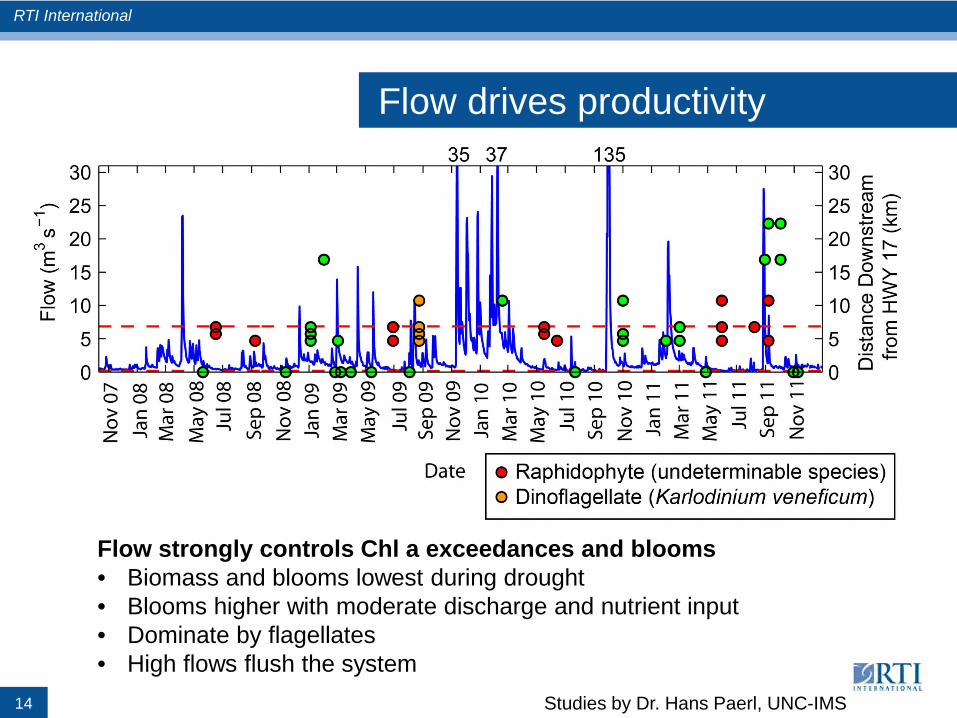
Flow drives productivity
14
Flow strongly controls Chl a exceedances and blooms• Biomass and blooms lowest during drought• Blooms higher with moderate discharge and nutrient input• Dominate by flagellates• High flows flush the system
Studies by Dr. Hans Paerl, UNC-IMS
RTI International
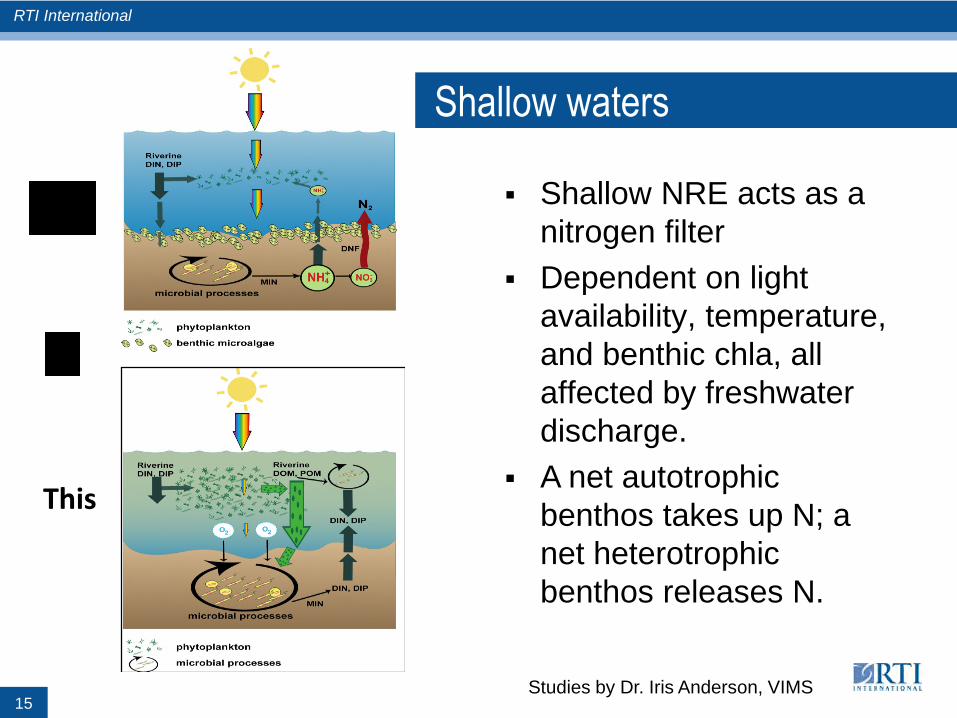
This
or
This
Shallow waters
Shallow NRE acts as anitrogen filter
Dependent on lightavailability, temperature,and benthic chla, allaffected by freshwaterdischarge.
A net autotrophicbenthos takes up N; anet heterotrophicbenthos releases N.
15Studies by Dr. Iris Anderson, VIMS
RTI International
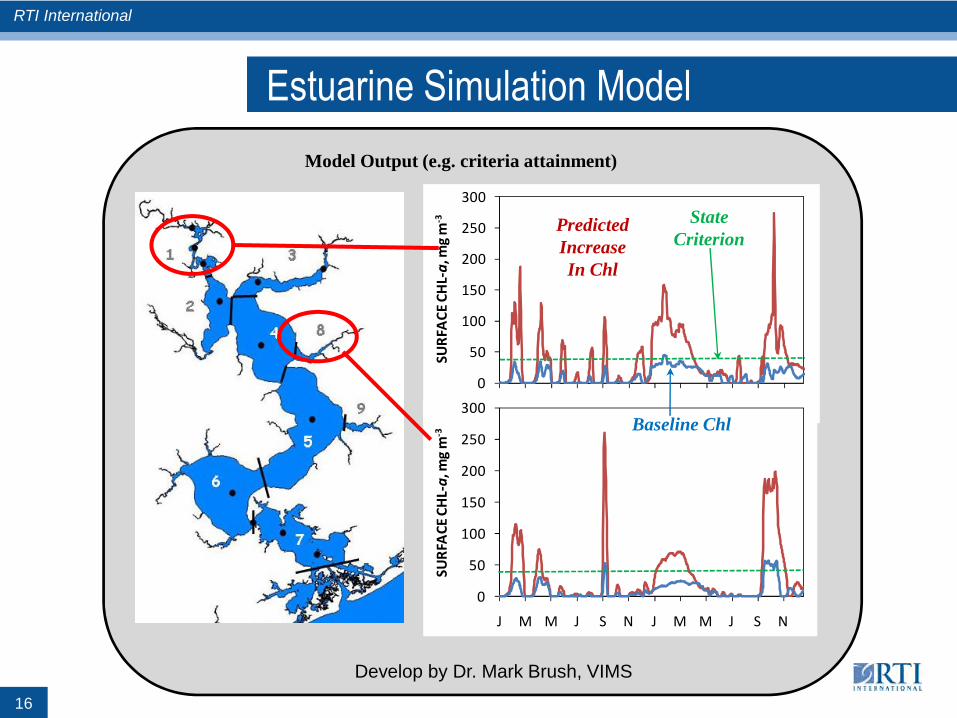
Estuarine Simulation Model
0
50
100
150
200
250
300
J M M J S N J M M J S N
SUR
FAC
EC
HL-
a,m
gm
-3
0
50
100
150
200
250
300
J M M J S N J M M J S N
SUR
FAC
EC
HL-
a,m
gm
-3
Model Output (e.g. criteria attainment)
PredictedIncreaseIn Chl
Baseline Chl
StateCriterion
Develop by Dr. Mark Brush, VIMS
16
RTI International
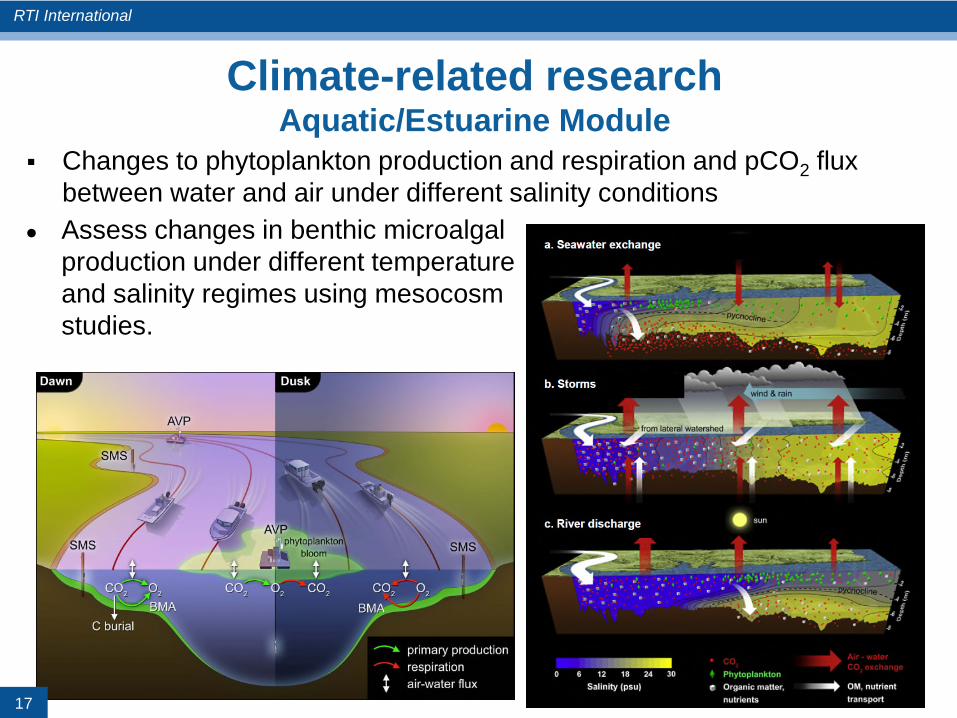
Climate-related researchAquatic/Estuarine Module
Changes to phytoplankton production and respiration and pCO2 fluxbetween water and air under different salinity conditions
● Assess changes in benthic microalgalproduction under different temperatureand salinity regimes using mesocosmstudies.
17
RTI International
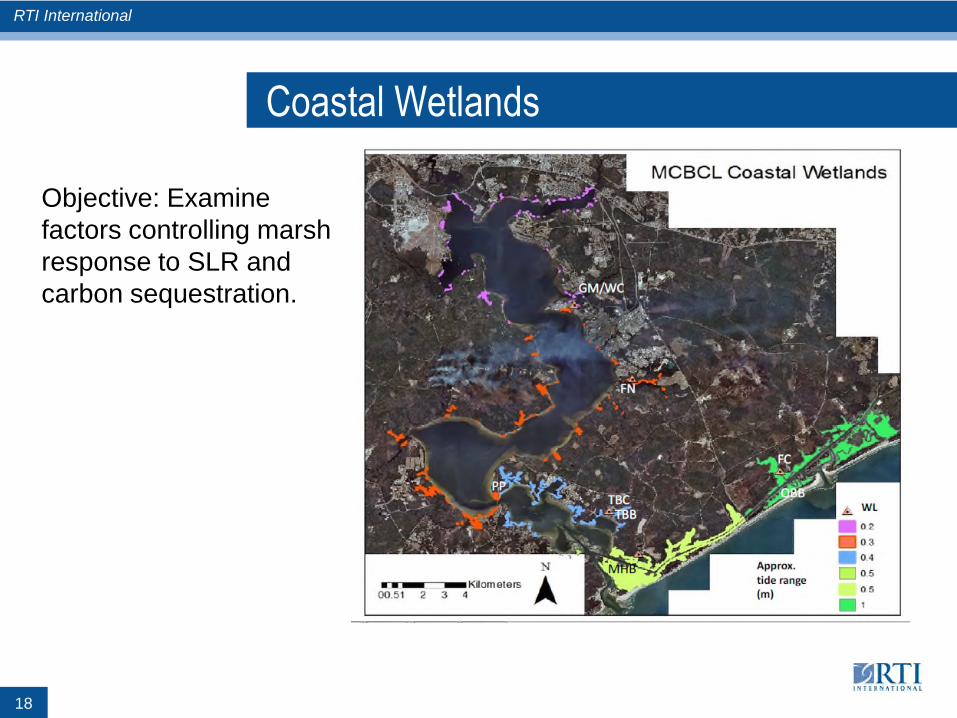
Coastal Wetlands
Objective: Examinefactors controlling marshresponse to SLR andcarbon sequestration.
18
RTI International
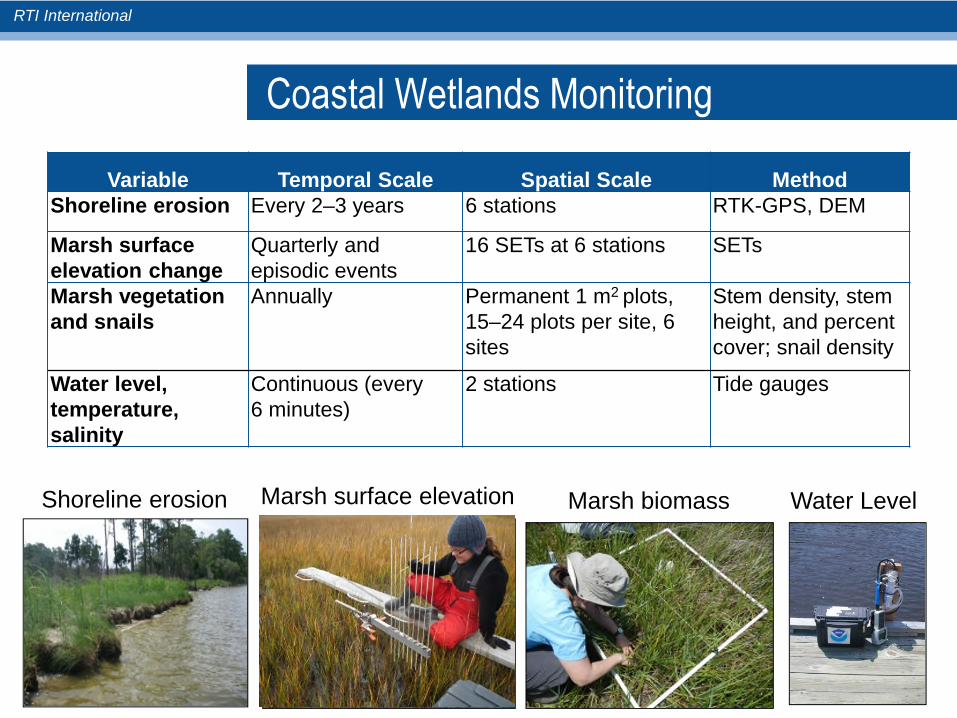
Coastal Wetlands Monitoring
Variable Temporal Scale Spatial Scale MethodShoreline erosion Every 2–3 years 6 stations RTK-GPS, DEM
Marsh surfaceelevation change
Quarterly andepisodic events
16 SETs at 6 stations SETs
Marsh vegetationand snails
Annually Permanent 1 m2 plots,15–24 plots per site, 6sites
Stem density, stemheight, and percentcover; snail density
Water level,temperature,salinity
Continuous (every6 minutes)
2 stations Tide gauges
Shoreline erosion Marsh surface elevation Marsh biomass Water Level
RTI International
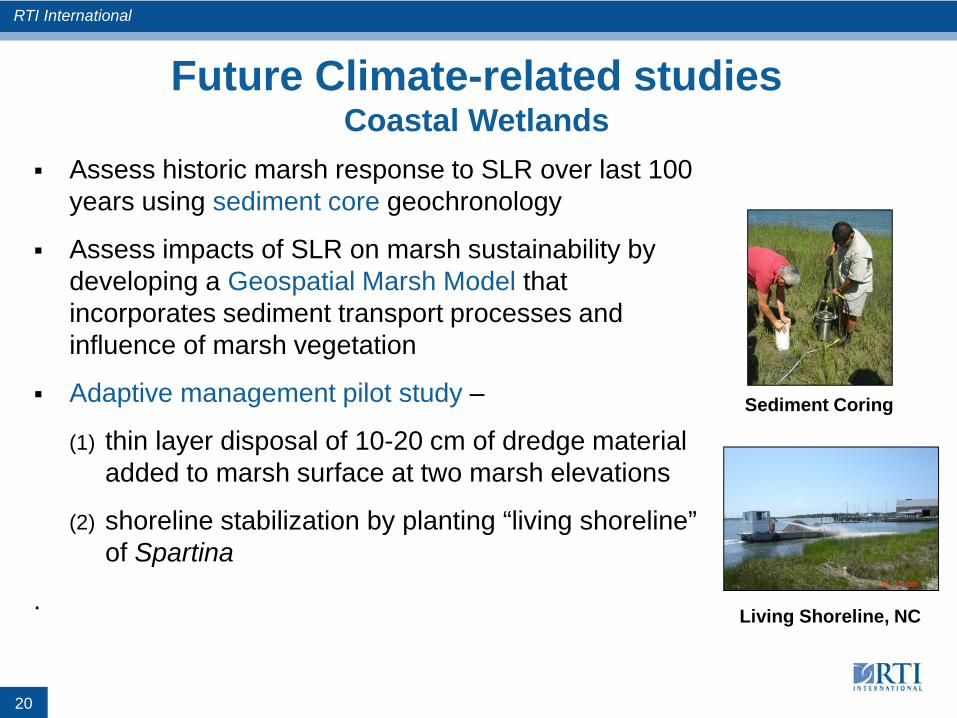
Assess historic marsh response to SLR over last 100years using sediment core geochronology
Assess impacts of SLR on marsh sustainability bydeveloping a Geospatial Marsh Model thatincorporates sediment transport processes andinfluence of marsh vegetation
Adaptive management pilot study –
(1) thin layer disposal of 10-20 cm of dredge materialadded to marsh surface at two marsh elevations
(2) shoreline stabilization by planting “living shoreline”of Spartina
.
Future Climate-related studiesCoastal Wetlands
Sediment Coring
Living Shoreline, NC
20
RTI International
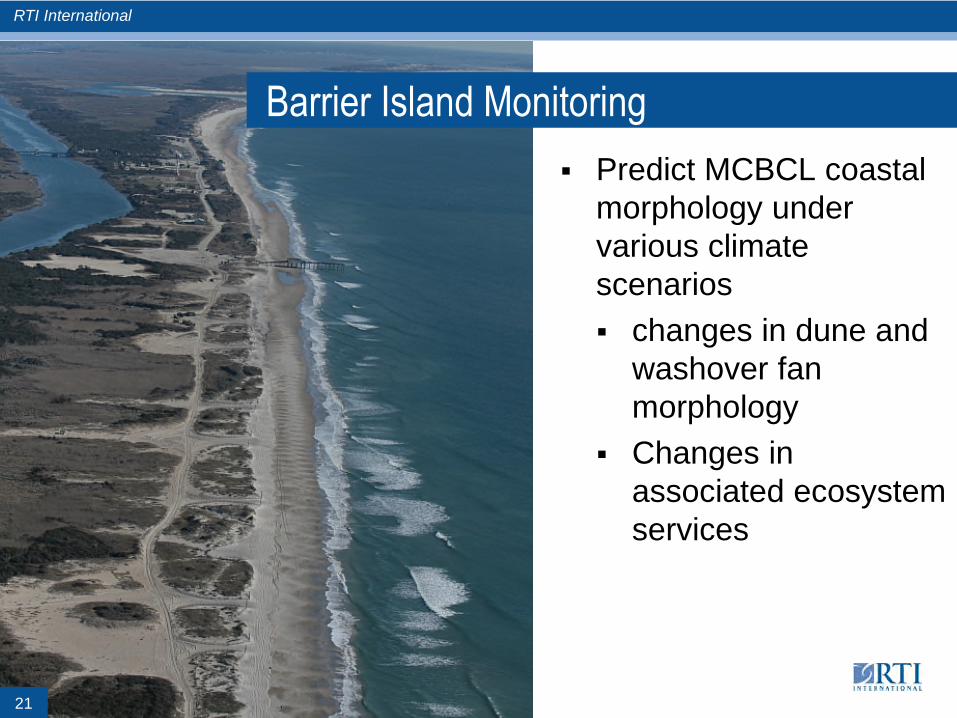
Barrier Island Monitoring
Predict MCBCL coastalmorphology undervarious climatescenarios
changes in dune andwashover fanmorphology
Changes inassociated ecosystemservices
21
RTI International
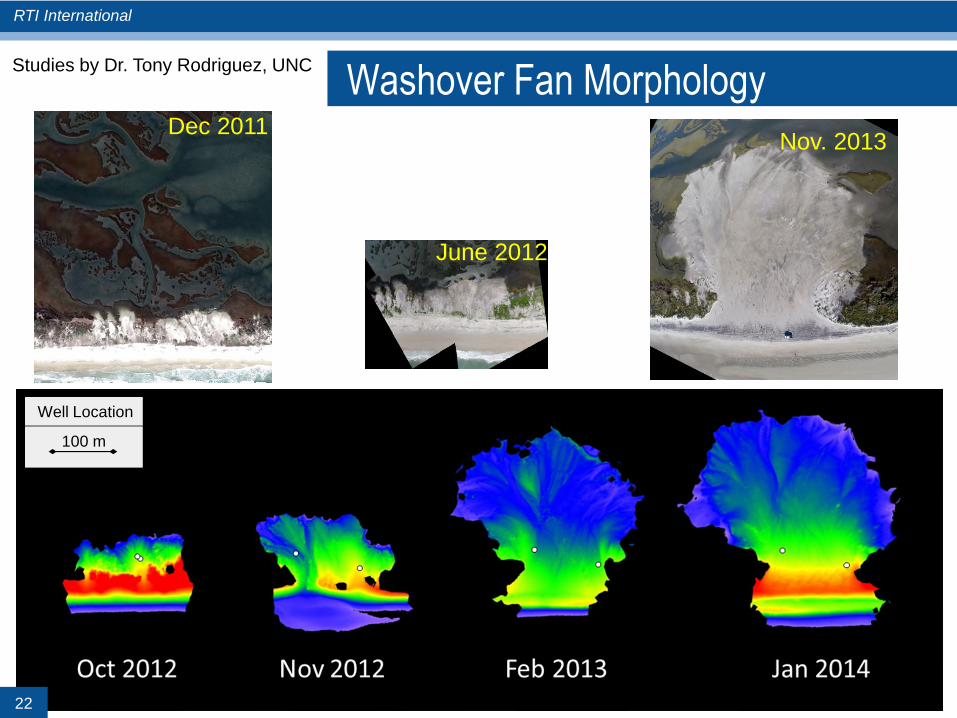
Well Location
100 m
June 2012
Nov. 2013Dec 2011
Washover Fan Morphology
22
Studies by Dr. Tony Rodriguez, UNC
RTI International
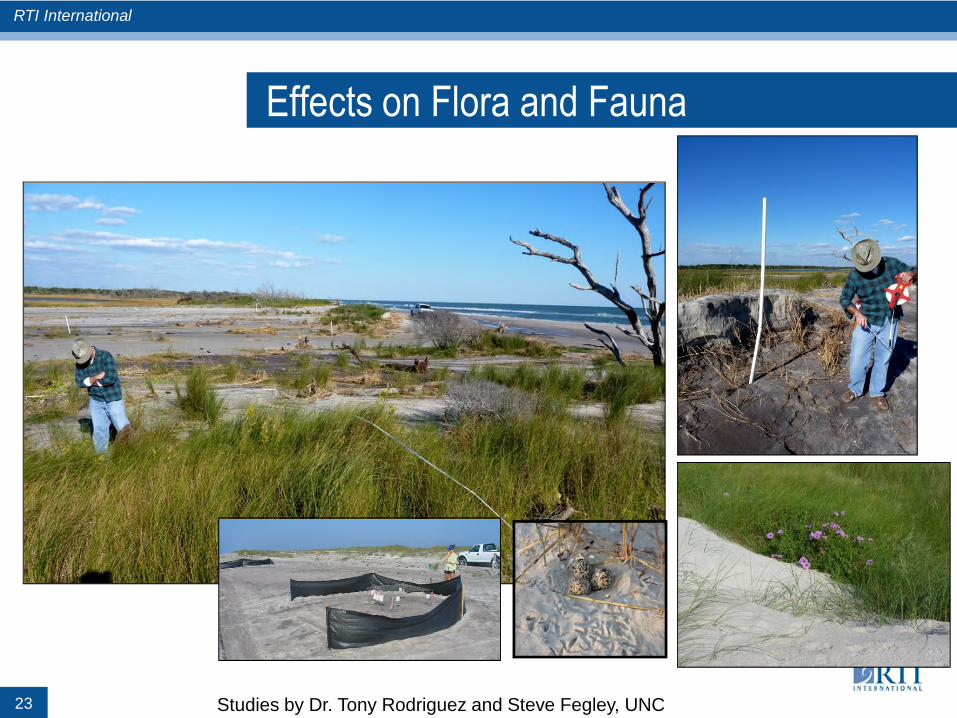
Effects on Flora and Fauna
23 Studies by Dr. Tony Rodriguez and Steve Fegley, UNC
RTI International
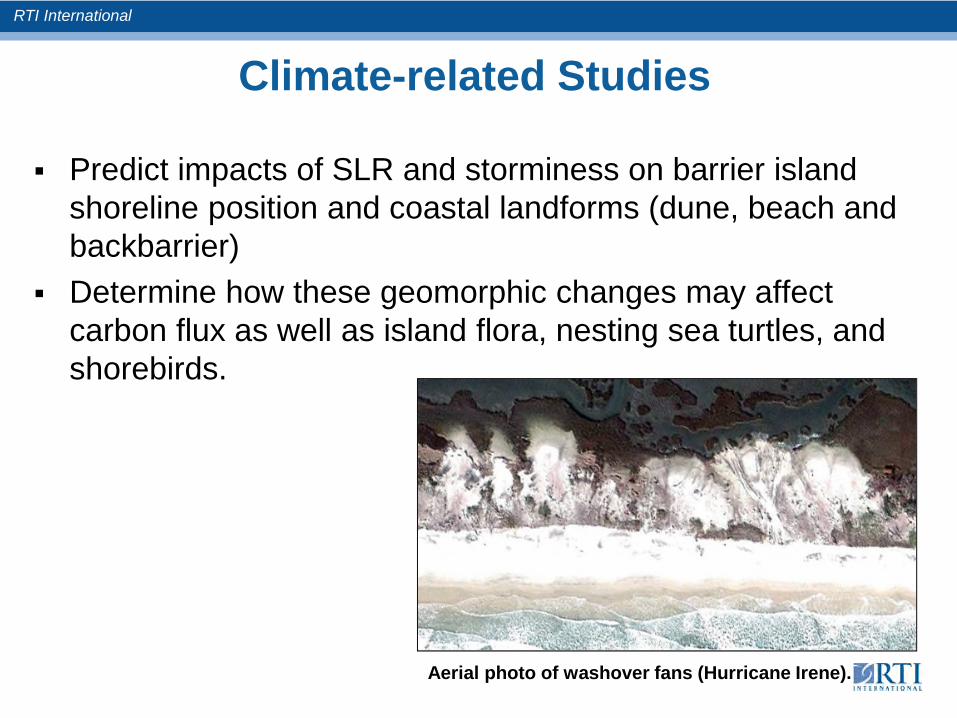
Predict impacts of SLR and storminess on barrier islandshoreline position and coastal landforms (dune, beach andbackbarrier)
Determine how these geomorphic changes may affectcarbon flux as well as island flora, nesting sea turtles, andshorebirds.
Climate-related Studies
Aerial photo of washover fans (Hurricane Irene).
RTI International
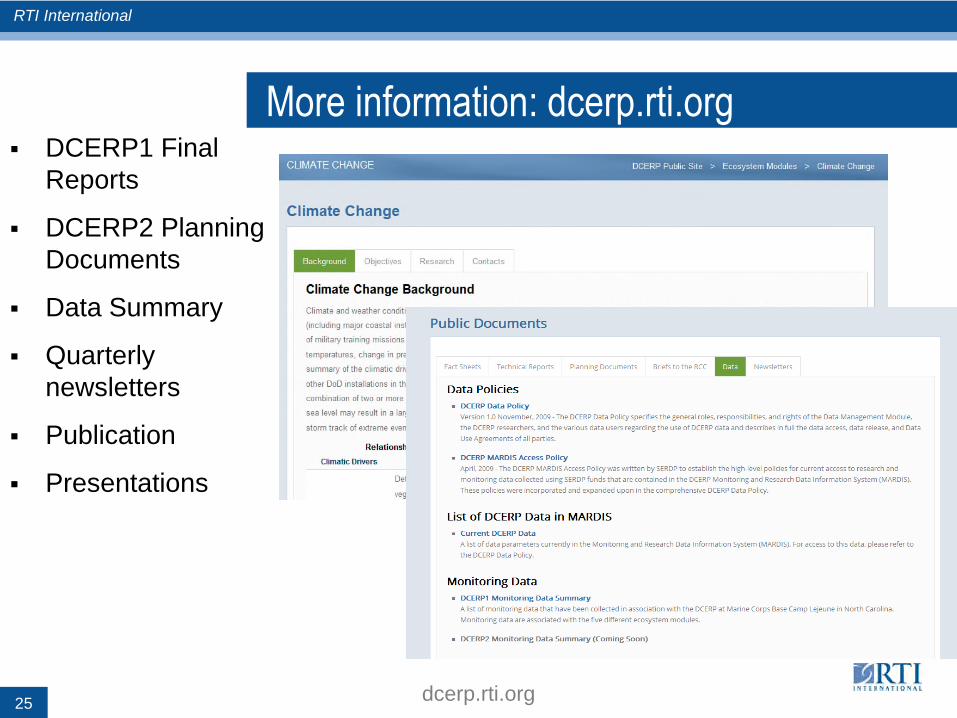
More information: dcerp.rti.org
dcerp.rti.org
DCERP1 FinalReports
DCERP2 PlanningDocuments
Data Summary
Quarterlynewsletters
Publication
Presentations
25
RTI International
Acknowledgements
DCERP Researchers: Hans Paerl, Mike Piehler, IrisAnderson, Scott Ensign, Jen Stanhope, Nathan Hall,Joey Croswell, Rachel Smith, Carolyn Currin, TonyRodriquez, Steve Fegley, Rick Luettich, Brent McKee,Craig Tobias
DCERP On-site Coordinator: Susan Cohen
This research was conducted under the Defense Coastal/EstuarineResearch Program (DCERP, https://dcerp.rti.org/), funded by theStrategic Environmental Research and Development Program(SERDP).
26
RTI International
More Information
Pat Cunningham
DCERP PI
919.316.3372
Kim Matthews
Research Scientist
919.316.3366
27
https://dcerp.rti.org
RTI International
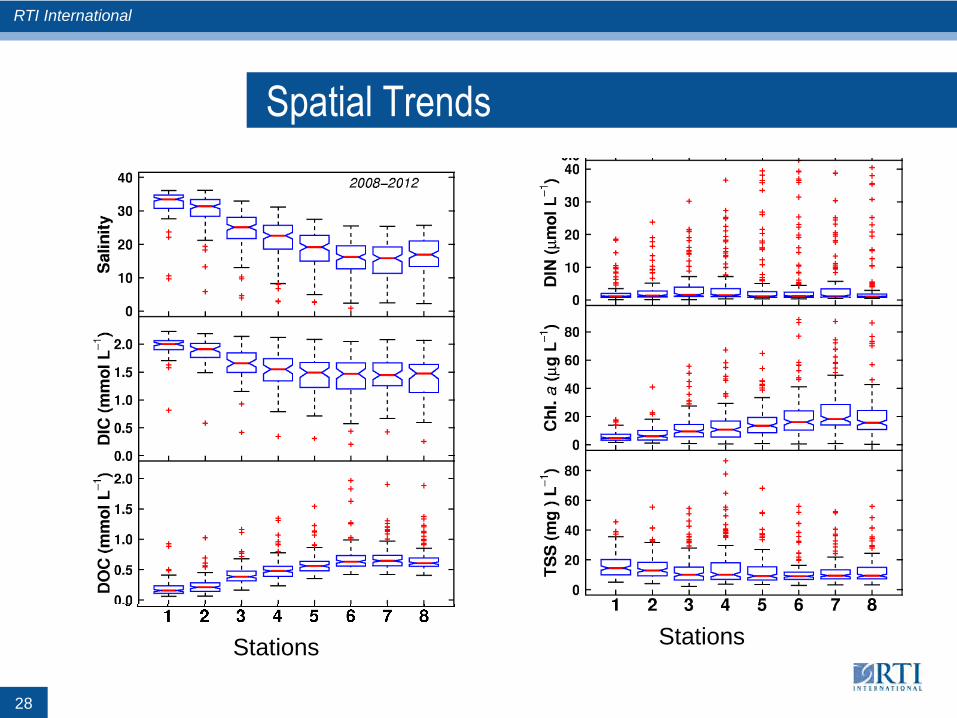
Spatial Trends
Stations Stations
28
RTI International
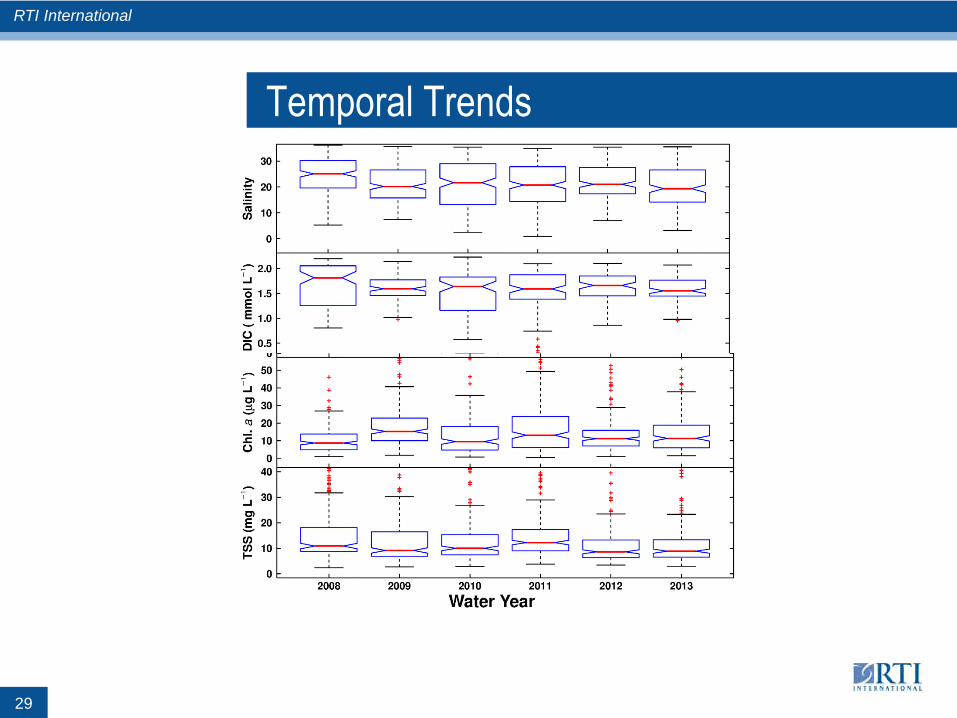
Temporal Trends
29
RTI International
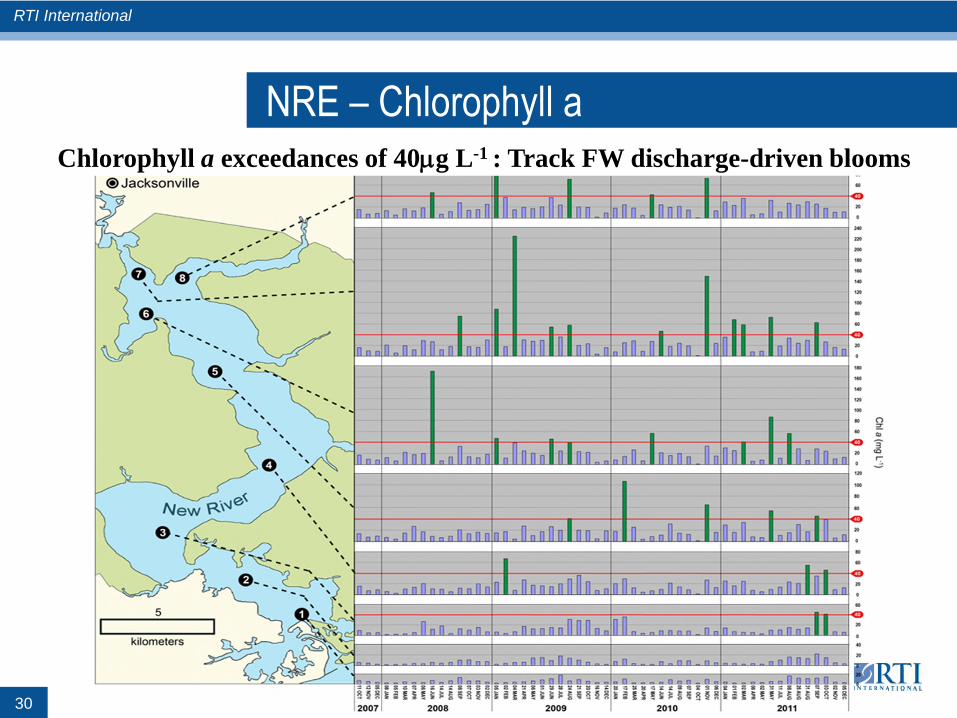
NRE – Chlorophyll aChlorophyll a exceedances of 40mg L-1 : Track FW discharge-driven blooms
30
RTI International
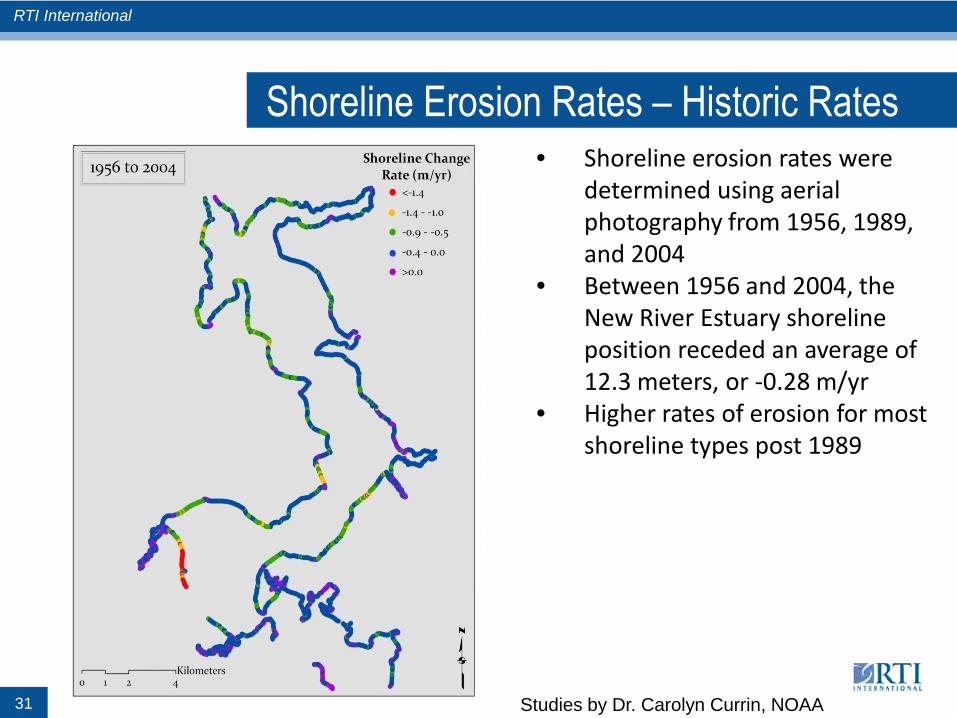
• Shoreline erosion rates weredetermined using aerialphotography from 1956, 1989,and 2004
• Between 1956 and 2004, theNew River Estuary shorelineposition receded an average of12.3 meters, or -0.28 m/yr
• Higher rates of erosion for mostshoreline types post 1989
Shoreline Erosion Rates – Historic Rates
31 Studies by Dr. Carolyn Currin, NOAA
RTI International
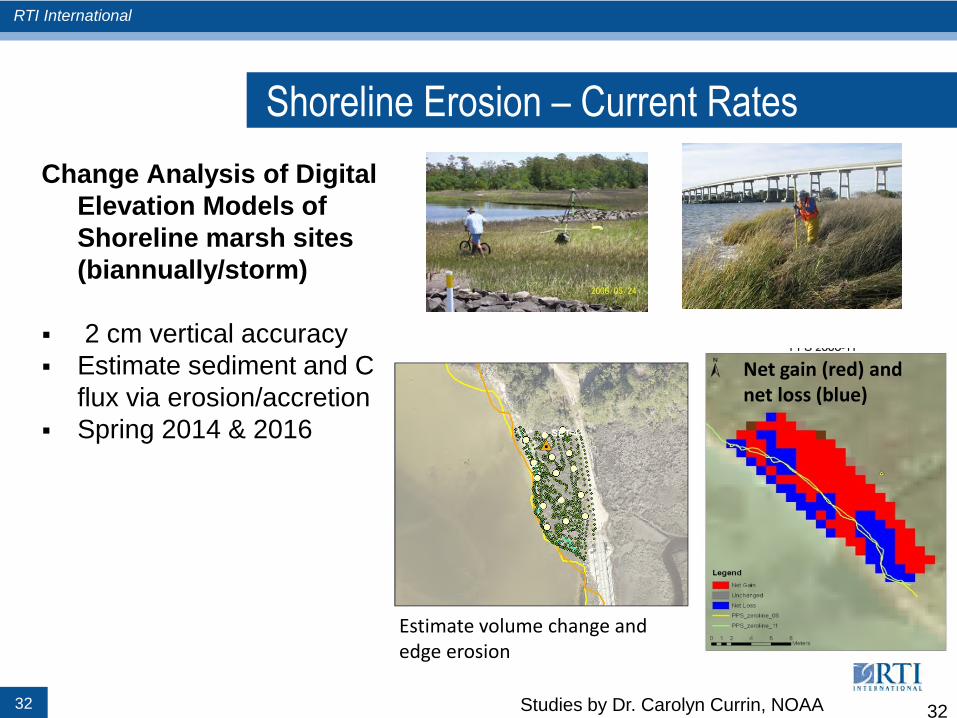
Shoreline Erosion – Current Rates
Change Analysis of DigitalElevation Models ofShoreline marsh sites(biannually/storm)
2 cm vertical accuracy Estimate sediment and C
flux via erosion/accretion Spring 2014 & 2016
32 32
Estimate volume change andedge erosion
Net gain (red) andnet loss (blue)
Studies by Dr. Carolyn Currin, NOAA
RTI International
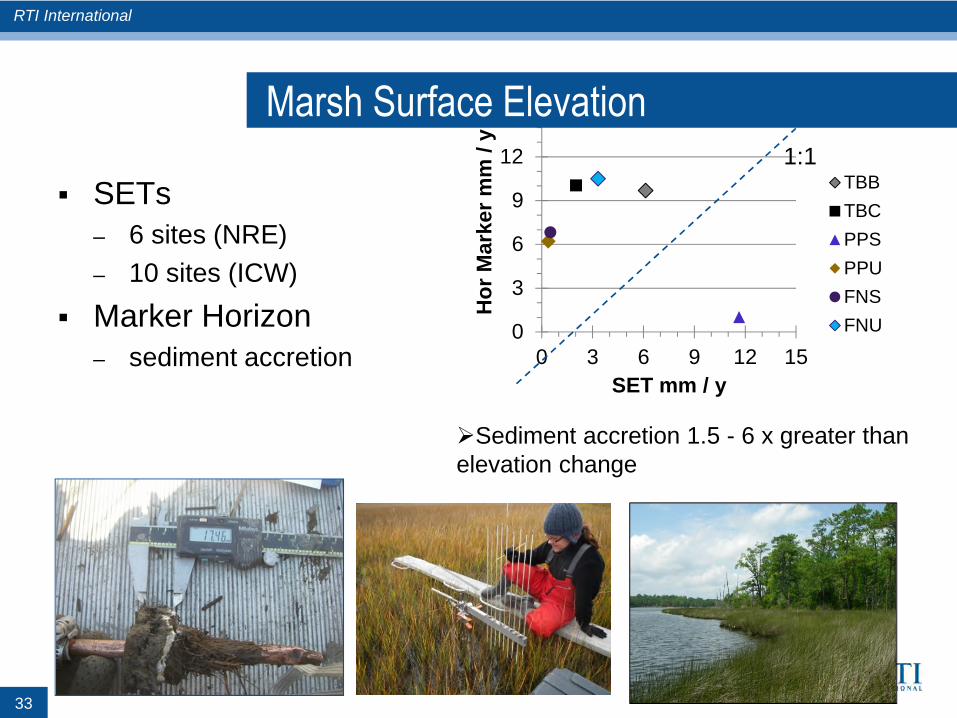
0
3
6
9
12
15
0 3 6 9 12 15
Ho
rM
ark
er
mm
/y
SET mm / y
TBB
TBC
PPS
PPU
FNS
FNU
1:1
Sediment accretion 1.5 - 6 x greater thanelevation change
Marsh Surface Elevation
SETs– 6 sites (NRE)
– 10 sites (ICW)
Marker Horizon– sediment accretion
33
RTI International
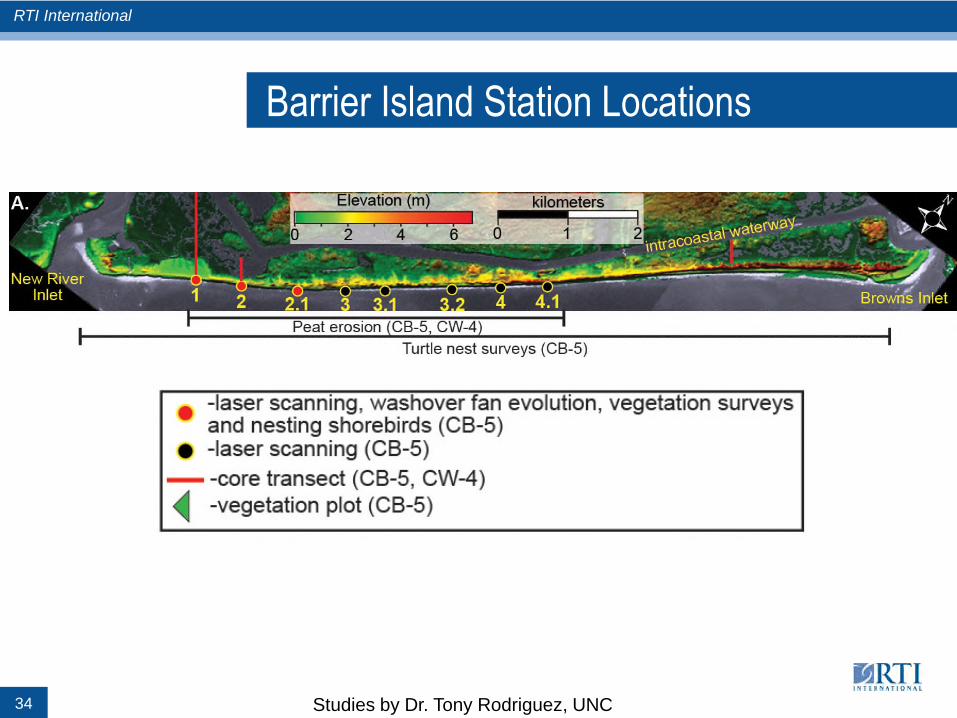
Barrier Island Station Locations
34 Studies by Dr. Tony Rodriguez, UNC