Embed Size (px)
Citation preview
Coastal Informatics:Web Atlas Design and Implementation
Dawn J. WrightOregon State University, USA
Ned DwyerUniversity College Cork, Ireland
Valerie CumminsUniversity College Cork, Ireland
Hershey • New YorkInformatIon scIence reference
Director of Editorial Content: Kristin KlingerDirector of Book Publications: Julia MosemannAcquisitions Editor: Lindsay JohnstonDevelopment Editor: Joel GamonTypesetter: Travis GundrumProduction Editor: Jamie SnavelyCover Design: Lisa TosheffPrinted at: Lightning Source
Published in the United States of America by Information Science Reference (an imprint of IGI Global)701 E. Chocolate AvenueHershey PA 17033Tel: 717-533-8845Fax: 717-533-8661E-mail: [email protected] site: http://www.igi-global.com
Copyright © 2011 by IGI Global. All rights reserved. No part of this publication may be reproduced, stored or distributed in any form or by any means, electronic or mechanical, including photocopying, without written permission from the publisher.Product or company names used in this set are for identification purposes only. Inclusion of the names of the products or com-panies does not indicate a claim of ownership by IGI Global of the trademark or registered trademark.
Library of Congress Cataloging-in-Publication Data
Coastal informatics : web atlas design and implementation / Dawn Wright, Ned Dwyer, and Valerie Cummins, editors. p. cm. Includes bibliographical references and index. Summary: "This book examines state-of-the-art developments in coastal informatics (e.g., data portals, data/ metadata vocabularies and ontologies, metadata creation/ extraction/ cross-walking tools, geographic and information management systems, grid computing) and coastal mapping (particularly via Internet map servers and web-based geographical information and analysis)"-- Provided by publisher. ISBN 978-1-61520-815-9 (hardcover) -- ISBN 978-1-61520-816-6 (ebook) 1. Coasts--Geographic information systems. 2. Coastal mapping. 3. Management information systems. I. Wright, Dawn J., 1961- II. Dwyer, Ned. III. Cummins, Valerie, 1974- GC10.4.R4C63 2010 526.0914'6--dc22 2009052431British Cataloguing in Publication DataA Cataloguing in Publication record for this book is available from the British Library.
All work contributed to this book is new, previously-unpublished material. The views expressed in this book are those of the authors, but not necessarily of the publisher.

Editorial Advisory BoardGreg Benoit, California Coastal Commission, USAJim Good, Oregon State University and Oregon Ocean Policy Advisory Council, USATorill Hamre, Nansen Environmental and Remote Sensing Center (NERSC), NorwayAlejandro Iglesias-Campos, European Topic Centre on Land Use and Spatial Information (ETC-LUSI), European Environment Agency, SpainEamonn Ó Tuama, Global Biodiversity Information Facility (GBIF), DenmarkJanine Salwasser, Oregon State University Natural Resources Digital Library Program, USAPauline Weatherall, GEBCO Digital Atlas Team, British Oceanographic Data Centre, UK
List of ReviewersDarius Bartlett, University College Cork, IrelandGreg Benoit, California Coastal Commission, USAMike Blakemore, Ecotec Research and Consulting Ltd. and Info-Dynamics Research Associates Ltd., UKHelen Bradley, University College Cork, IrelandBoyan Brodaric, Geological Survey of Canada, CanadaMargaret Carlisle, University of Aberdeen, UKAndrew Cooper, University of Ulster, UKRenee Davis-Born, Oregon State University, USATorril Hamre, Nansen Environmental and Remote Sensing Center (NERSC), NorwayMuki Haklay, University College London, UKDavid Hart, University of Wisconsin, USAChristina Hoffman, NOAA Coastal Services Center, USAJeroen B.J. Huisman, Water Noorderzijlvest, The NetherlandsAlejandro Iglesias-Campos, European Topic Centre on Land Use and Spatial Information (ETC-LUSI), European Environment Agency, SpainPhilip Konings, Aquaterra nv, BelgiumKathrin Kopke, University College Cork, IrelandAudra Luscher, NOAA Coastal Services Center, USASusanna McMaster, University of Minnesota, USAJan Mees, Flanders Marine Institute, Belgium

Amy Merten, NOAA Office of Response and Restoration, Coastal Response Research Center, USATheuri Mwangi, Nairobi Institute of Marine Science and United Nations Environment ' Programme (UNEP), KenyaFatima Navas Concha, University of Sevilla, SpainEoin O’Grady, Marine Institute, IrelandEamonn Ó Tuama, Global Biodiversity Information Facility (GBIF), DenmarkPeter Pissierssens, United Nations Education, Scientific, and Cultural Organization (UNESCO), Intergovernmental Oceanographic Commission (IOC), International Oceanographic Data and Information Exchange (IODE), BelgiumGreg Reed, Australian Ocean Data Centre Joint Facility and UNESSO IOC IODE, AustraliaJanine Salwasser, Oregon State University Natural Resources Digital Library Program, USAKathy Taylor, Washington Department of Ecology, USAKuuipo Walsh, Oregon State University, USAStephanie Watson, Independent Consultant Texas A&M University and Marine Metadata Interoperability Project, USAJames Wilson, James Madison University, USA
Foreword ............................................................................................................................................. xv
Preface ...............................................................................................................................................xvii
Acknowledgment ................................................................................................................................. xx
Section 1Principles
Chapter 1Introduction ............................................................................................................................................. 1
Dawn J. Wright, Oregon State University, USAValerie Cummins, University College Cork, IrelandEdward Dwyer, University College Cork, Ireland
Chapter 2Coastal Web Atlas Features ................................................................................................................... 12
Elizabeth O’Dea, Washington State, USATanya C. Haddad, Oregon Coastal Management Program, USADeclan Dunne, University College Cork, IrelandKuuipo Walsh, Oregon State University, USA
Chapter 3Coastal Web Atlas Implementation ....................................................................................................... 33
Tanya Haddad, Oregon Coastal Management Program, USAElizabeth O’Dea, Washington State Department of Ecology, USADeclan Dunne, University College Cork, IrelandKuuipo Walsh, Oregon State University, USA
Table of Contents

Chapter 4Coastal Atlas Interoperability ............................................................................................................... 53
Yassine Lassoued, University College Cork, IrelandTrung T. Pham, University College Cork, IrelandLuis Bermudez, Southeastern University Research Association, USAKaren Stocks, University of California San Diego, USAEoin O’Grady, Marine Institute, IrelandAnthony Isenor, Defense R&D Canada – Atlantic, Canada Paul Alexander, Marine Metadata Interoperability Initiative & Stanford Center for Biomedical Informatics Research, USA
Section 2Coastal Web Atlas Case Studies around the World
Chapter 5Overview of Coastal Atlases ................................................................................................................. 80
Dawn J. Wright, Oregon State University, USAGabe Sataloff, NOAA Coastal Services Center, USATony LaVoi, NOAA Coastal Services Center, USAAndrus Meiner, European Environment Agency, DenmarkRonan Uhel, European Environment Agency, Denmark
Chapter 6Oregon, USA ......................................................................................................................................... 91
Tanya C. Haddad, Oregon Coastal Management Program, USARobert J. Bailey, Oregon Coastal Management Program, USADawn J. Wright, Oregon State University, USA
Chapter 7Ireland ................................................................................................................................................. 105
Edward Dwyer, University College, IrelandKathrin Kopke, University College Cork, IrelandValerie Cummins, University College Cork, IrelandElizabeth O’Dea, Washington State, USADeclan Dunne, University College Cork, Ireland
Chapter 8Virginia and Maryland, USA .............................................................................................................. 131
Marcia Berman, College of William and Mary, USACatherine McCall, Maryland Chesapeake and Coastal Program, Maryland Department
of Natural Resources, USA
Chapter 9Wisconsin, USA .................................................................................................................................. 145
David Hart, University of Wisconsin Sea Grant Institute, USA
Chapter 10Belgium ............................................................................................................................................... 156
Kathy Belpaeme, Coordination Center on Integrated Coastal Zone Management, BelgiumHannelore Maelfait, Coordination Center on Integrated Coastal Zone Management, Belgium
Chapter 11Africa .................................................................................................................................................. 165
Lucy E.P. Scott, United Nations Development Programme (UNDP) Global Environment Facility (GEF) Agulhas and Somali Currents Large Marine Ecosystem (ASCLME) Project, South Africa Greg Reed, Australian Ocean Data Center Joint Facility, New South Wales, Australia
Chapter 12Caribbean ............................................................................................................................................ 171
Sean Padmanabhan, Institute of Marine Affairs, Republic of Trinidad & Tobago, West Indies
Chapter 13United Kingdom .................................................................................................................................. 192
David R. Green, University of Aberdeen, UK
Chapter 14Spain ................................................................................................................................................... 214
Alejandro Iglesias-Campos, Government of Andalusia, Spain Gonzalo Malvarez-García, University of Pablo de Olavide, SpainJosé Ojeda-Zújar, University of Seville, SpainJosé Manuel Moreira-Madueño, Government of Andalusia, Spain
Section 3Coastal Web Atlas Management and Governance Issues
Chapter 15The International Coastal Atlas Network ............................................................................................ 229
Dawn J. Wright, Oregon State University, USAValerie Cummins, University College Cork, IrelandEdward Dwyer, University College Cork, Ireland

Chapter 16Coastal Atlases in the Context of Spatial Data Infrastructures ........................................................... 239
Tony LaVoi, NOAA Coastal Services Center, USAJoshua Murphy, NOAA Coastal Services Center, USAGabe Sataloff, NOAA Coastal Services Center, USARoger Longhorn, Info-Dynamics Research Associates Ltd., BelgiumAndrus Meiner, European Environment Agency, DenmarkRonan Uhel, European Environment Agency, DenmarkDawn J. Wright, Oregon State University, USAEdward Dwyer, University College Cork, Ireland
Chapter 17Creating a Usable Atlas ....................................................................................................................... 256
Timothy Nyerges, University of Washington, USAKathy Belpaeme, Coordination Center on Integrated Coastal Zone Management, BelgiumTanya Haddad, Oregon Coastal Management Program, USADavid Hart, University of Wisconsin Sea Grant Institute, USA
Chapter 18Improving a Growing Atlas ................................................................................................................ 267
Tanya C. Haddad, Oregon Coastal Management Program, USADeclan Dunne, University College Cork, Ireland
Chapter 19Supporting a Successful Atlas ............................................................................................................. 275
Roger Longhorn, Info-Dynamics Research Associates Ltd., UKDawn J. Wright, Oregon State University, USAKathy Belpaeme, Coordination Center on Integrated Coastal Zone Management, Belgium
Compilation of References .............................................................................................................. 288
About the Contributors ................................................................................................................... 307
Index ................................................................................................................................................... 317

Foreword ............................................................................................................................................. xv
Preface ...............................................................................................................................................xvii
Acknowledgment ................................................................................................................................. xx
Section 1Principles
Chapter 1Introduction ............................................................................................................................................. 1
Dawn J. Wright, Oregon State University, USAValerie Cummins, University College Cork, IrelandEdward Dwyer, University College Cork, Ireland
General introduction to the entire book, including definition of a coastal web atlas and key issues sur-rounding it uses. The chapter also identifies the intended audience and gives a brief overview of topics and importance for all remaining chapters.
Chapter 2Coastal Web Atlas Features ................................................................................................................... 12
Elizabeth O’Dea, Washington State, USATanya C. Haddad, Oregon Coastal Management Program, USADeclan Dunne, University College Cork, IrelandKuuipo Walsh, Oregon State University, USA
This chapter features an overall summary with more detailed descriptions of common coastal web atlas features and the forms/functions they may take. This includes an extensive discussion of the various types of tools that one might find in a web atlas.
Detailed Table of Contents

Chapter 3Coastal Web Atlas Implementation ....................................................................................................... 33
Tanya Haddad, Oregon Coastal Management Program, USAElizabeth O’Dea, Washington State Department of Ecology, USADeclan Dunne, University College Cork, IrelandKuuipo Walsh, Oregon State University, USA
Following on the previous chapter, which describes what the basic features of a coastal web atlas are, this chapter goes on to present considerations and recommendations for actually implementing an atlas (i.e., design, development, deployment). This chapter includes lists of the advantages/disadvantages and applicability/execution challenges for various technical resources. And finally, it includes helpful information on open source versus proprietary software, as well as various technology standards.
Chapter 4Coastal Atlas Interoperability ............................................................................................................... 53
Yassine Lassoued, University College Cork, IrelandTrung T. Pham, University College Cork, IrelandLuis Bermudez, Southeastern University Research Association, USAKaren Stocks, University of California San Diego, USAEoin O’Grady, Marine Institute, IrelandAnthony Isenor, Defense R&D Canada – Atlantic, Canada Paul Alexander, Marine Metadata Interoperability Initiative & Stanford Center for Biomedical Informatics Research, USA
This chapter provides a general definition of interoperability is the ability of diverse systems and/or organizations to work together, especially in the use and exchange of information. This chapter is about interoperability between computer systems, especially those systems that underlie a coastal web atlas. It reviews the relevant standards for interoperability between coastal web atlases, and gives practical guidelines on how to make atlases interoperable through the use of standards, web services, vocabulary words and ontologies. It concludes with a description of the International Coastal Atlas Network’s in-teroperability prototype under development.
Section 2Coastal Web Atlas Case Studies around the World
Chapter 5Overview of Coastal Atlases ................................................................................................................. 80
Dawn J. Wright, Oregon State University, USAGabe Sataloff, NOAA Coastal Services Center, USATony LaVoi, NOAA Coastal Services Center, USAAndrus Meiner, European Environment Agency, DenmarkRonan Uhel, European Environment Agency, Denmark

This chapter provides a brief overview of various coastal web atlas projects around the world, providing a contextual bridge to the atlas case studies of Chapters 6-14. A summary of the policy context within which many European atlases operate is followed by a summary of other efforts emerging in Australia, the Western Pacific, Africa, and the Caribbean.
Chapter 6Oregon, USA ......................................................................................................................................... 91
Tanya C. Haddad, Oregon Coastal Management Program, USARobert J. Bailey, Oregon Coastal Management Program, USADawn J. Wright, Oregon State University, USA
Case study for the U.S. state of Oregon, focusing on the Oregon Coastal Atlas in action. This atlas, along with the Marine Irish Digital Atlas, has been online and in constant development for a long period of time, and therefore one of the more mature coastal atlases on the Internet. Each case study chapter describes the situation in country or state regarding the accessibility of coastal information, the motiva-tion for the producing the, atlas, the knowledge gap that it is trying to fill, the intended audience for the atlas, and where possible, how is it financed. Case study chapters also identify issues of data collection, system design, usage and associated statistics, strengths and weakness of approaches to date, and future plans, including its relationship to ICAN.
Chapter 7Ireland ................................................................................................................................................. 105
Edward Dwyer, University College, IrelandKathrin Kopke, University College Cork, IrelandValerie Cummins, University College Cork, IrelandElizabeth O’Dea, Washington State, USADeclan Dunne, University College Cork, Ireland
Case study for Ireland focusing on the Marine Irish Digital Atlas in action. This atlas, along with the Oregon Coastal Atlas, has been online and in constant development for a long period of time, and there-fore one of the more mature coastal atlases on the Internet. The case study follows the “template” of topics as described for Chapter 6.
Chapter 8Virginia and Maryland, USA .............................................................................................................. 131
Marcia Berman, College of William and Mary, USACatherine McCall, Maryland Chesapeake and Coastal Program, Maryland Department
of Natural Resources, USA
Case study for the Chesapeake Bay region of the U.S. states of Virginia and Maryland, focusing on the Virginia Coastal Geospatial and Educational Mapping System and the Maryland Shorelines Online in action. The case study follows the “template” of topics as described for Chapter 6.

Chapter 9Wisconsin, USA .................................................................................................................................. 145
David Hart, University of Wisconsin Sea Grant Institute, USA
Case study for the U.S. state of Wisconsin, focusing on the ongoing development of the Wisconsin Coastal Atlas, with a future eye toward a regional Great Lakes Coastal Atlas. The case study follows the “template” of topics as described for Chapter 6.
Chapter 10Belgium ............................................................................................................................................... 156
Kathy Belpaeme, Coordination Center on Integrated Coastal Zone Management, BelgiumHannelore Maelfait, Coordination Center on Integrated Coastal Zone Management, Belgium
Case study for Belgium, focusing on the Belgian Coastal Atlas, which was first published as a hardcopy book but then transitioned to the web. The case study follows the “template” of topics as described for Chapter 6.
Chapter 11Africa .................................................................................................................................................. 165
Lucy E.P. Scott, United Nations Development Programme (UNDP) Global Environment Facility (GEF) Agulhas and Somali Currents Large Marine Ecosystem (ASCLME) Project, South Africa Greg Reed, Australian Ocean Data Center Joint Facility, New South Wales, Australia
Case study for the continent of Africa, focusing on the African Marine Atlas. The case study follows the “template” of topics as described for Chapter 6.
Chapter 12Caribbean ............................................................................................................................................ 171
Sean Padmanabhan, Institute of Marine Affairs, Republic of Trinidad & Tobago, West Indies
Case study for the Caribbean region, focusing on the Caribbean Marine Atlas. The case study follows the “template” of topics as described for Chapter 6.
Chapter 13United Kingdom .................................................................................................................................. 192
David R. Green, University of Aberdeen, UK
Case study for the United Kingdom, providing a brief overview of the origins and evolution of coastal web atlases throughout the country. The case study follows the “template” of topics as described for Chapter 6.
Chapter 14Spain ................................................................................................................................................... 214
Alejandro Iglesias-Campos, Government of Andalusia, Spain Gonzalo Malvarez-García, University of Pablo de Olavide, SpainJosé Ojeda-Zújar, University of Seville, SpainJosé Manuel Moreira-Madueño, Government of Andalusia, Spain
Case study for Spain, focusing on the SIGLA (Sistema de Información Geografica del Litoral Andaluz or Coastal Information System of Andalusia). The case study follows the “template” of topics as de-scribed for Chapter 6.
Section 3Coastal Web Atlas Management and Governance Issues
Chapter 15The International Coastal Atlas Network ............................................................................................ 229
Dawn J. Wright, Oregon State University, USAValerie Cummins, University College Cork, IrelandEdward Dwyer, University College Cork, Ireland
This chapter transitions from coastal web atlas (CWA) case studies to atlas management and gover-nance issues, by way of a summary of the International Coastal Atlas Network (ICAN). ICAN is a new-ly-founded informal group of over 30 organizations from over a dozen nations who have been meeting over the past two years to scope and implement data interoperability approaches to CWAs. Most of the atlases profiled in Section 2, Case Studies, are members of ICAN.
Chapter 16Coastal Atlases in the Context of Spatial Data Infrastructures ........................................................... 239
Tony LaVoi, NOAA Coastal Services Center, USAJoshua Murphy, NOAA Coastal Services Center, USAGabe Sataloff, NOAA Coastal Services Center, USARoger Longhorn, Info-Dynamics Research Associates Ltd., BelgiumAndrus Meiner, European Environment Agency, DenmarkRonan Uhel, European Environment Agency, DenmarkDawn J. Wright, Oregon State University, USAEdward Dwyer, University College Cork, Ireland
This chapter summarizes key projects and initiatives that are being implemented on very large scales (national/international) by national governments and commissions to build coastal spatial data infra-structures (SDIs). These include SDI efforts in the U.S. and Europe that are closely related to ICAN, and as such are of great value to its mission of developing interoperable atlases, providing along the way solutions for the integration of not only technologies, but people, institutions, and institutional objectives.

Chapter 17Creating a Usable Atlas ....................................................................................................................... 256
Timothy Nyerges, University of Washington, USAKathy Belpaeme, Coordination Center on Integrated Coastal Zone Management, BelgiumTanya Haddad, Oregon Coastal Management Program, USADavid Hart, University of Wisconsin Sea Grant Institute, USA
Having covered some overarching management and governance issues for coastal web atlases, the book returns to the user level with 3 concluding chapters that guide the reader on how to create an atlas that is the most usable for its audience, how to make that seed effort grow, and how to maintain it. This chapter provides guidelines on how to better understand coastal web atlas users, how to undertake user-centered design and development for improved web site usability, and how to avoid major pitfalls with web interfaces.
Chapter 18Improving a Growing Atlas ................................................................................................................ 267
Tanya C. Haddad, Oregon Coastal Management Program, USADeclan Dunne, University College Cork, Ireland
This chapter covers aspects of atlas monitoring via web server statistics, user surveys, and other sorts of feedback mechanisms, and how to obtain improvement over time. Also covered are issues of sca-leability (how to accommodate increasing datasets and users), and the latest in reviewing/updating technology.
Chapter 19Supporting a Successful Atlas ............................................................................................................. 275
Roger Longhorn, Info-Dynamics Research Associates Ltd., UKDawn J. Wright, Oregon State University, USAKathy Belpaeme, Coordination Center on Integrated Coastal Zone Management, Belgium
This concluding chapter of the book is about to maintain a successful coastal web atlas. It discusses issues relating to securing long-term support for an atlas and provides guidance based on existing prac-tice and experience with atlas developments at national and international levels. Specific topics include institutional capacity, institutional support, partnerships, funding, governance, and continued promo-tion. Also included is a discussion of data and metadata ownership issues, intellectual property rights, and the legal protection of atlas content.
Compilation of References .............................................................................................................. 288
About the Contributors ................................................................................................................... 307
Index ................................................................................................................................................... 317

xv
Foreword
Coasts, seas and oceans are being threatened by an unprecedented range of pressures including land-based coastal and marine pollution due to poorly managed sewage and industrial waste and agricultural run-off, fragmentation and habitat loss through unsustainable extraction practices and industrial zoning, over-exploitation of marine resources, invasive species infestations and climate change.
The impacts of these pressures have been widespread and generally adverse: over the past 50 years we have observed declines in the abundance of many high-profile, commercially important marine spe-cies, loss of genetic diversity, detected alterations in ecosystem functioning and reductions in critical habitats such as coral reefs, coastal wetlands and mangroves. Some 30% of coral reefs – which often have higher levels of biodiversity than tropical forests – have been seriously damaged through fishing, pollution, disease and coral bleaching. Some 35% of mangroves have disappeared over the past two decades and in some cases up to 80% have been lost nationally through conversion to aquaculture and storms. More than 50% of wild marine fisheries are fully exploited, with a further 25% over-exploited.
And yet, coasts are the home of 50% of the world's population whilst more than a billion people rely on fisheries as their main source of protein. In addition, the newly established evidence of a rapid acidification of our oceans starts bringing large-scale disruptions to key components of the food sources.
The damaged resilience and adaptive capacities of our coasts is informed by observations, science and continuity in information systems, such as coastal atlases. The whole point here though is that the “patient science” of relatively slow ecological and biological cycles of such complex systems can easily escape the attentions of fast public news gatherers. Let’s face it: the proliferation of the www. and 24-hour news outlets, of scores of television and radio channels, and of personalized modes of receiving and delivering data and opinions has revolutionized the media through which complex science must pass to reach a multiplicity of publics. Dumbing down of much of the media and the seemingly shortening attention span of audiences is reducing the capacity to communicate complex science like that relating people to their dependency on coastal assets resources?
However, the problems arising from the new media technologies and configurations are accompanied by opportunities. For example, people with local and practical knowledge of coastal resources often ex-perience and know about the reality of hazards well before the experts recognize them. They and citizen journalists can report on what’s happening in their communities using new means of communication to get their knowledge out to wider publics in ways that were not possible just a decade ago. At the EEA we believe that if we are to tackle our environmental problems we need to move beyond conventional systems of data collection and management and adopt approaches such as the coastal web atlases described in this book. If we want to stimulate a change to the way we all live and confront natural processes it is no longer sufficient to develop passive lists or reports to “inform” citizens. Information is still too

xvi
often made available as lists of figures or spreadsheets that only experts can interpret. Imagine if all the statistics that inform our evening weather forecasts were presented in this way, or all the data that drives popular software like Google or Facebook – do you think they would continue to be as popular – and be able to draw the benefits from participation?
We believe that the current achievements and future activities in relation to coastal web atlases will provide useful operational services to a large community of practitioners and users across the world. To encourage participation we need to present our information in a way everyone can understand; the environmental monitoring and reporting systems designed in the 20th century will not be able to cope with this increasing demand for higher quality, faster access, cost efficient systems to respond to to-day’s emerging complex issues, e.g., climate change at our coastal door-step. Producers and providers of environmental data will have to move from centralized information management towards distributed data and information systems, both at a geographical scale, from local to global, as well as thematic integration. This book shows practical examples of how that is being achieved.
The EEA therefore looks forward to ongoing cooperation in these developments towards interoperable coastal information systems. This book will be tremendously useful in this regard, especially in view of services such as the methodological outcomes and content-based information, so as to help actions in the field of coastal zone integrated assessments, including coastal zone use potentials, vulnerabilities and adaptation needs to environmental changes.
Prof. Jacqueline McGladeExecutive DirectorEuropean Environment Agency
Professor Jacqueline McGlade became Executive Director of the European Environment Agency on June 1 2003. Prior to this she was Natural Environment Research Council Professorial Fellow in Environmental Informatics in the Mathematics Department of University College London where her main areas of research included spatial data analysis and informatics, expert systems, environmental technologies and the international politics of the environment and natural resources. Previous appointments have included Director of the UK’s Centre for Coastal & Marine Sciences, Director of Theoretical Ecology at the Forschungszentrum Jülich Germany, Associate Professor at the Honda funded International Ecotchnology Research Centre, Senior Scientist in the Federal Government of Canada and in the USA, Adrian Fellow at Darwin College, Cambridge and Professorships at Warwick University and Aachen. Professor McGlade has won various prizes including the Minerva Prize, the Swedish Jubileum Award and the Brno University Gold Medal. She also has Honorary degrees from Wales (Bangor) Kent and is a Fellow of the Linnean Society and the Royal Society for the Encouragement of Arts, Manufacture & Commerce. Professor McGlade has worked extensively in North America, south-east Asia and West Africa; she has published more than 100 research papers, written popular articles, presented and appeared in many radio and television programmes, including her own BBC series The Ocean Planet and Learning from Nature and more recently Our Arctic Challenge, a film about sport and tourism in Greenland. She has given public lectures worldwide on sustainable development, conflicts over environmental impacts of industrial and natural activities, environmental technologies and the use of multimedia in developing countries. Professor McGlade was Chairman of The Earth Centre and a Board Member of the Environment Agency. She is currently a Trustee of the Natural History Museum, and a member of the Environment Advisory Committee of the European Bank for Reconstruction and Development, UK-China Forum and UK-Japan 21st Century Group. She is also Director of the software company, View the World Ltd. Recent books: Advanced Ecological Theory (Blackwell 1999); The Gulf of Guinea Large Marine Ecosystem (Elsevier 2002).

xvii
Preface
This book is based on the results of two international workshops jointly funded by the US National Sci-ence Foundation and the National Development Program of Ireland. They brought together key experts from Europe, the United States, Canada Africa, and Australia to examine state-of-the-art developments in coastal informatics (e.g., data portals, data/ metadata vocabularies and ontologies, metadata creation/ extraction/ cross-walking tools, geographic and information management systems, grid computing) and coastal mapping (particularly via Internet map servers and web-based geographical information and analysis). The first workshop, held in Cork, Ireland in July 2006, enabled participants to examine state-of-the-art developments in coastal web atlases (CWAs), and to assess the potential and the limitations of selected CWAs from the United States and Europe. Participants also shared several case studies and lessons learned, and established key issues and recommendations related to the design, data requirements, technology and institutional capacity needed for these atlases. This necessitated an examination of best practices for achieving interoperability between CWAs, which led international participants to a second workshop entitled “Coastal Atlas Interoperability,” and held on the campus of Oregon State University in July 2007. At this second workshop, expert participants learned how to use controlled vocabularies and ontologies in order to build a common approach to managing and disseminating coastal data, maps and information, and concluded with the aim of designing and developing a demonstration interoper-ability prototype using the metadata catalogs of two mature atlases (the Oregon Coastal Atlas and the Marine Irish Digital Atlas).
The technical experts, scientists, decision makers and practitioners of the workshops in Ireland and Oregon decided to informally organize under the International Coastal Atlas Network (ICAN) and sought to continue the momentum with a third workshop. Based on the success of the group to this point, the European Environment Agency (EEA) sponsored and hosted this third event in 2008, at its headquarters in Copenhagen, Denmark, under the theme: “Federated Atlases: Building on the Interoperable Approach.” Workshop participants discussed the progress-to-date on the ICAN interoperability prototype and agreed upon future technical activities. The relevant policy context within which ICAN must operate was presented, along with an overview of a number of related coastal and marine information management projects that could inform ICAN developments. In addition, the workshop took place around a two-day conference on Coastal Atlas Development, organized by the EEA itself, whose objective was to inform EEA partners about the development of coastal atlases and the emergence of ICAN in light of relevant European policy developments in the maritime sphere.
By this time, CWAs in general and ICAN in particular had captured the interest of scores of local, state and national governments, non-governmental organizations, research institutes, and universities, as well NOAA, certainly the EEA, and the UNESCO Intergovernmental Oceanographic Commission.

xviii
Workshop participants therefore discussed ways of disseminating some of the wealth of knowledge and expertise that had been growing within the ICAN group (which now stands at over 35 organizations from over 10 countries). It was decided that one effective way to do this would be through the publication of a book to review and present the latest developments in the new emerging field of coastal web atlases, to share best practices and lessons learned through a series of case studies, to give practical guidance on geographic data management and documentation through standards-based metadata, as well as guidance on how to make underlying geographic databases interoperable. This current publication is the result. We hope that readers will find this book of practical use in web atlas design, development and implementa-tion, and will thus improve their spatial thinking in the coastal context. Hence, rather than a lengthy theoretical treatise on basic and futuristic research questions and problems, the book has been prepared more as a concise, ready reference, with collections of subject-specific instructions where appropriate.
The prime audience for the book is coastal resource managers and consultants, coastal scientists, coastal technologists (e.g., information technologists, GIS specialists, software developers), government researchers, and graduate students. The book should be especially valuable to coastal resource manag-ers who need to tackle such topic-based issues (explaining environmental concepts to the public and reaching them with current information has always been a difficult task).
The book may also be suitable for intermediate, advanced courses in coastal/marine GIS or coastal zone management (i.e., courses toward a related BS/BSc, MS/MSc or PhD degree, in the classroom, but also potentially for distance education as well). The material in the book and the dedicated website should allow students to familiarize themselves with what CWA (web GIS) technology is, what are the basics of related disciplines, and how to use physical environmental and biological data available in the atlases in order to develop specific GIS applications and models. Course instructors may use the contents of the dedicated website either to present ready-to-use applications or to use the variety of included data for building new GIS applications.
Further expected contributions of the book include:
• Wide data dissemination to enhance scientific and technological understanding. The book should be great interest not only to the coastal/marine research and management community, but also to libraries, high schools, and outreach sites. Linkages in the book are made to parallel research in geographic information science, digital library development, and computer science. The presenta-tion of lessons learned should help guide the development of new national and regional atlases, and improve decision-support systems.
• Advancing discovery and understanding; promoting teaching, training and learning through inte-gration of research and education. The book may be useful as additional content to faculty course materials and to graduate research. We anticipate a number of student research topics and projects at both the M.S./M.Sc. and Ph.D. levels that may be aided by this book.
• Benefiting society. With the release of the Pew and U.S. Ocean Commission reports as well as the European Union Integrated Maritime Policy there is growing public awareness of the critical state of our coastal zones and fisheries. The book poses informatics solutions that seek to improve management practices and decision-making. Mapping plays a critical role in issues of national sovereignty, resource management, maritime safety, and hazard assessment.
This book is also accompanied by a dedicated website (International Coastal Atlas Network, http://ican.science.oregonstate.edu) which includes links to mature CWAs, and is building templates for CWA

xix
design, snippets of scripts and programming routines to achieve interoperability with partner atlases, and several other resources mainly for online GIS developments and online data providers. We hope that you find it useful!
Dawn J. WrightOregon State University, USA
Valerie CumminsUniversity College Cork, Ireland
Edward DwyerUniversity College Cork, Ireland
xx
Handbook of Coastal Informatics: Web Atlas Design and Implementation ACKNOWLEDGMENTS We are very grateful to the US National Science Foundation (Award #0527216), the Marine Institute of Ireland’s Marine RTDI Networking and Technology Transfer Initiative under the National Development Plan, the Coastal and Marine Resources Centre of University College Cork (CMRC), Ireland, Oregon State University, which provided initial funding to bring together key experts from Europe, the United States, Canada and Africa to begin discussions, and collaborations that led to the idea for this handbook. We also thank the European Environment Agency, with additional support from the European Topic Centre on Land Use and Spatial Information (ETC-LUSI), the European Environmental Information and Observation Network (EIONET), SeaZone Solutions Limited, the European Platform for Coastal Research (ENCORA), and the Marine Institute, for additional funding to bring key international experts together for further discussions and collaborations that ultimately led to the production of this handbook. The additional support of the NOAA Coastal Services Center, and US National Science Foundation Award #0921950 is also gratefully acknowledged. We thank the many external reviewers whose careful comments and suggestions greatly improved the chapters, as well as our External Advisory Board for their support throughout this project. And finally, we extend a special thanks to Kathrin Kopke of the CMRC and Joel Gamon of IGI-Global for editorial assistance, as well as to Dawn’s pet dog Lydia for moral support during the final stages of the project.

1
Coastal Informatics: Web Atlas Design and Implementation AUTHOR BIOGRAPHIES Paul Alexander Paul R. Alexander studied Anthropology and received his B.A. from California State University, Monterey Bay and his M.A. from the University of Chicago. Using his background in Digital Anthropology and research methodologies, he now develops software in conjunction with researchers and scientists. Alexander was previously employed by the Marine Metadata Interoperability project, which is supported by an NSF grant to “To promote the exchange, integration and use of marine data through enhanced data publishing, discovery, documentation and accessibility.” While with the project he worked extensively on the community website, both developing functionality and writing guidance for the community. Currently, Alexander is a web and user interface developer with the Stanford Center for Biomedical Informatics Research, working on BioPortal, a project housed in the National Center for Biomedical Ontology that stores, indexes, and build relationships between publically accessible ontologies. Robert Bailey Robert Bailey is Manager of the Oregon Coastal Management Program in the Department of Land Conservation and Development. From 1982 to 2003 he was Ocean Program Administrator working on a range of state and national ocean policy issues under five governors. From 1995- 2000 he led the Pacific Northwest Ecosystems Regional Study a $6 million multidisciplinary assessment of coastal ecosystem process funded by NOAA’s Coastal Ocean Program. In 2004-2005 he was a member of the National Academy of Sciences Ocean Studies Board Sea Grant Review Panel. He has served on numerous regional and nation committees regarding marine and coastal science, policy and governance. Mr. Bailey was elected as a City Commissioner in Oregon City, Oregon, 2003-2006. He was born and raised on the Oregon coast and is a 1968 graduate of Portland State University in Earth Science. He is married with three grown children. Kathy Belpaeme Kathy Belpaeme studied biology at the Free University of Brussels, Belgium. She worked as a Ph.D. researcher for 3 years, focussing on mutagenetic effect of marine pollution. In 1999 she began working in the field of Integrated Coastal Zone Management. In 2001 she was instrumental in setting up the Coordination Center on Coastal Zone Management for Belgium, where she currently works. The Coordination Center’s main objective is to stimulate and promote integrated management of the coastal zone in Belgium. The Center is collaboration between different authorities at local, regional and national level. Marcia Berman Marcia Berman came to the Virginia Institute of Marine Science in 1989 to direct the Comprehensive Coastal Inventory, a GIS and remote sensing program. The Coastal Inventory is charged with mapping conditions along the 16,100 km of tidal shoreline in Virginia. This effort has expanded to include the state of Maryland and parts of North Carolina and Delaware. Marcia’s research interests in applied coastal science include the development of GIS based decision support tools to enhance coastal

2
management at the local and regional planning levels within the Chesapeake Bay Watershed. Her work has spanned subjects such as shallow water use conflict, ecosystem risk assessment, shoreline erosion control, and assessment of climate change impacts to coastal landscapes. Marcia is a coastal geologist by training with a B.S. in Geology from Northeastern University, Boston, MA, and a M.S. degree in Oceanography from the School of Oceanography at Old Dominion University in Norfolk, Virginia. Luis Bermudez Luis E. Bermudez received his B.S. in Industrial Engineering from Universidad de los Andes, Colombia an MS. and Ph.D. in Hydroinformatics from Drexel University, Philadelphia, US. He leads technical initiatives related to coastal research at the Southeastern University Research Association (SURA). The coastal research program advances the understanding of coastal phenomena by deploying cutting edge information technology (IT) for data integration in support of ocean observing efforts and advancing distributed modeling test-bed efforts. Previous to SURA he was a software engineer at the Monterey Bay Aquarium Research Institute (MBARI) and leading the technical work at the Marine Metadata Interoperability project. Before MBARI, he was involved with moving forward standardization efforts for data interchange and semantics with the Consortium of Universities for the Advancement of Hydrologic Science (CUAHSI). Luis participates in various standardization-working groups at the Open Geospatial Consortium (OGC) and World Wide Web Consortium (W3C). He leads the OGC Ocean Science Interoperability Experiment, participates in OGC Sensor Observation Service (SOS) working group, and is member of the Semantic Sensor Network working group. Valerie Cummins Valerie Cummins is the director of the Coastal and Marine Resources Centre, University College Cork, which has a staff of over 30 researchers. Her research interests cover a range of coastal governance issues including public participation, intuitional aspects of geomatics, capacity building for coastal management, and the science and policy interface and ecosystems frameworks. She is currently reading for a PhD on organizational tools for sustainability science in coastal zone management. She was instrumental in securing funding for the development of the Marine Irish Digital Atlas and has overseen the project since its inception. This activity led to her being a co-founder of the International Coastal Atlas Network. She contributes to the editorial panel of the international Marine Policy journal published by Elsevier and is a member of the Marine Geography Commission of the International Geographic Union. Edward (Ned) Dwyer Edward (Ned) Dwyer has a M.Sc. and a Ph.D. in remote sensing and image processing technology. He has worked in the area of terrestrial and marine remote sensing applications for many years using data from both optical and synthetic aperture radar sensors. Since joining the CMRC in 2002 he has been the project manager of the Marine Irish Digital Atlas, with particular responsibility for metadata specification and data acquisition. He is also researching climate observation systems in Ireland in regard to the Global Climate Observing System requirements. He is currently the co-chair of the International Coastal Atlas Network and an occasional lecturer on remote sensing and GIS topics at University College Cork.

3
Declan Dunne Declan Dunne has a B.Sc. in Computer Systems from the University of Limerick and a M.Sc. in Applied Science (Modeling and Numerical Computing) from University College Cork. Since joining the Coastal and Marine Resources Centre in 2002 he has worked on numerous Irish and European Union (EU) research projects involving computer science and geomatics expertise. Research interests include geospatial data integration, delivery and visualization using OGC standards. He developed the web-mapping GIS engine and database for the Marine Irish Digital Atlas. He was responsible for development of geospatial data and metadata web services for the EU Framework Program-6 InterRisk project using OGC standards, and lead architect and developer of a pan-European coastal observational data management system for the FP-6 ECOOP project. He is currently team leader and developer for the Geological Survey of Ireland funded Griffith Geomatics for Geosciences project which will advance standards-based data management solutions for geological data. David Green David R. Green wears many hats at the University of Aberdeen, Scotland: Director of the Centre for Marine and Coastal Zone Management (CMCZM), Director of the Applied Geospatial Technology (AGT) and Geographic Information Systems (GIS) M.Sc. Programmes, and Director of the Marine and Coastal Resource Management Degree Programme. He is currently the Editor-in-Chief of the Journal of Coastal Conservation: Planning and Management (JCCPM) and Vice-Chair of the European Centre for Nature Conservation (ECNC) Scientific Advisory Board, as well as past Editor-in-Chief of the British Cartographic Society’s Cartographic Journal, past Chairman of the UK Association for Geographic Information (AGI), and past President of the EUCC-The Marine and Coastal Union. David is also External Examiner for Kingston University’s GIS programme, the UNIGIS programme at Manchester Metropolitan University (MMU), and Falmouth Marine School’s (FMS) marine programme. He has edited a number of international books on ICZM and GIS, on landscape ecology and GIS, and on GIS in education. Tanya Haddad Tanya Haddad is a geospatial data and web application developer at the Oregon Coastal Management Program. She is a former NOAA Coastal Management Fellow, and has a B.S. in Biology and Environmental Science from Tufts University, and a M.E.M. degree in Coastal Environmental Management from Duke University. Since joining the Oregon Coastal Management Program in 2000 she has worked on numerous geospatial data and web information projects relating to coastal zone management and marine spatial planning. She is the chief information architect of the Oregon Coastal Atlas project and is involved in all facets of its maintenance and growth. In her spare time she is an avid sailor and loves to travel. Research interests include all aspects of coastal/marine geospatial data integration, delivery and visualization, in particular via the Internet using open-source tools. David Hart David Hart is the Geographic Information Systems Specialist at the University of Wisconsin Sea Grant Institute. Through this position, he conducts research and outreach that supports sustainable coastal development along the Great Lakes. David’s current research occurs at the intersection of geographic information science,

4
urban planning, and environmental management. He has developed methods for discovery, inventory, acquisition, integration, and analysis of local geospatial data for use in decision-making about regional-scale issues. Prior to moving to Wisconsin in 1993, David served six years at the New Orleans City Planning Commission as project manager for the City's Multipurpose Land Information System. He earned a Ph.D. in Land Resources from the University of Wisconsin-Madison, a Master degree in Urban and Regional Planning from the University of New Orleans, and a B.S. in Natural Resources Policy and Management from the University of Michigan. Alejandro Iglesias-Campos Alejandro Iglesias-Campos is a GIS analyst at the University of Seville involved in the development of different projects for the implementation of the Water Framework Directive in coastal zones, the generation of environmental indicators for ICZM and the implementation of the Coastal and Marine Information System of Andalusia. Since 2005, he has worked at the European Environment Agency’s Topic Centre on Land Use and Spatial Information, working in GIS support and coastal and marine management, and planning activities for different European and international projects. Additionally, Alejandro is the technical representative for the Ministry of Environment of the Junta de Andalucía at the ETC-LUSI and the EEA, and is also responsible for liaison with the Spanish National Ministry of Environment, Rural and the Marine, and other national authorities. He holds an M.Sc. in Physical Geography, Coastal Management and Water Information Systems, with an Advanced Study Diploma for Doctoral Studies from the University of Seville, Spain. Anthony Isenor Anthony W. Isenor currently works for Defence Research and Development Canada, an agency operating under the Canadian Department of National Defence (DND). He has extensive experience in geospatial data sets, metadata standards, data vocabularies, and data structures, and is currently working on applied research examining how technologies can influence user trust, within the context of maritime situational awareness. Nationally, Anthony is involved in efforts to implement information management solutions within the DND meteorological and oceanographic office and parent organization. Internationally, he is a member of North Atlantic Treaty Organization (NATO) research group investigating techniques to achieve semantic interoperability (group designation IST-075) among NATO coalition forces, and a second group investigating enabling technologies for NATO maritime situational awareness (group designation SCI-211). Anthony received his B.Sc. in physics and M.Sc. in physical oceanography from Dalhousie University in Nova Scotia, Canada. Kathrin Kopke Kathrin Kopke graduated with honors from the M.Sc. in Ecosystem Conservation and Landscape Management at University College Cork in 2005 and then joined the CMRC. She has carried out research in the area of Integrated Coastal Zone Management (ICZM) including an investigation of a coastal Brownfield site, a recreational carrying capacity study in Cork Harbor as well as being involved in the facilitation of the Cork Harbor Forum, a stakeholder group for the Harbor. Kathrin also contributes to projects within the coastal governance group, particularly in regard to adaptation to climate change in coastal communities. In 2007, Kathrin joined the Marine Irish Digital Atlas (MIDA) team as the Atlas data manager. Her work involves

5
working with GIS technologies and Open Source web-based mapping techniques and the supervision of GIS internships with CMRC. Kathrin is involved in the outreach and education work of the International Coastal Atlas Network (ICAN). Yassine Lassoued Yassine Lassoued is a computer science and GIS researcher interested in several fields, notably: geographic data integration, ontologies, metadata and data quality, and the use of Artificial Intelligence (AI) for data and metadata integration. Yassine graduated from the National Civil Aviation Faculty (Toulouse - France) with an engineering degree in Computer Science and Air Traffic, as well as a M.Sc. in computer science and Artificial Intelligence (AI), in 2000. In 2005, he graduated from University Aix-Marseille 1, with a Ph.D. in Computer Science and GIS. During his PhD, he worked as a temporary researcher and teacher in Universities Aix Marseille 1 & 2, and the Institute of Advanced Internet Applications. After graduation he joined the Coastal and Marine Resources Centre in 2006 as a researcher in the GIS team. He has extensive background in data integration, metadata and data quality, OGC and ISO standards, as well as the Arc Marine Data model. Tony LaVoi Tony LaVoi is the Chief of the Integrated Information Services (IIS) Division at the National Oceanic and Atmospheric Administration (NOAA) Coastal Services Center in Charleston, South Carolina. The Coastal Services Center was established in 1995 with a mission to support the environmental, social, and economic well being of the coast by linking people, information, and technology. The Center assists its primary customers, the US coastal resource managers, by providing access to information, technology, and training. The IIS division focuses its efforts on geospatial standards and interoperability, software application and database development, programming and visualization, and network and desktop information technology support. Tony serves as the NOAA representative to the Federal Geographic Data Committee (FGDC) and the Geospatial Line of Business. He chairs both the NOAA GIS Committee and the Marine and Coastal Spatial Data Subcommittee of the FGDC. Tony has a BS in Engineering from the University of Wisconsin. Roger Longhorn Roger Longhorn is the director of Info-Dynamics Research Associates Ltd. (headquartered in West Flanders, Belgium) and the chief editor of GEO:connexion International magazine. He has been involved in the information and communications technology industry since 1976. He developed marine information systems globally (1976 to 1986), then worked as an expert in information services for the European Commission (EC) until 1999, and has remained involved in several EC research and development programs since then. Roger assisted in developing the European Spatial Data Infrastructure strategy (now called INSPIRE) since 1995 to the present. He authored a practical guide to spatial data legal issues (2002) and co-authored a book on value, pricing and consumption of geographic information (2008), plus chapters in books dealing with SDI and marine/coastal information (1999, 2003, 2005, 2009). He is chair of the Global Spatial Data Infrastructure Association’s Legal and Socioeconomic Committee, and Information Policy Advisor to the Coastal and Marine Union (EUCC). Roger holds B.S. and M.S. degrees in Ocean Engineering and Shipping Management from the Massachusetts Institute of Technology (MIT).

6
Hannelore Maelfait Hannelore Maelfait earned an M.Sc. in Biology at the University of Leuven, Belgium. She came in contact with a variety of marine related research areas during her second international Master degree in Marine Science at the University of Ghent, Belgium. Since 2005 she has been working for the Coordination Center on Integrated Coastal zone Management for Belgium, as an adjunct adviser. Within the Center she is responsible for the development of local actions within an ICZM approach to stimulate the network between scientists, policy makers and stakeholders. Furthermore she is maintaining a set of sustainability indicators for the Belgian Coast and developing communication devices to stimulate the implementation of indicators and the use of data in a local government. Gonzalo Malvárez-García Gonzalo Malvárez-Garcia was awarded a Ph.D. in Physical Geography in 1997 by the University of Ulster, Northern Ireland, and worked at the university as a researcher, reader and lecturer. He then took the position of principal professor at the University Pablo Olavide in Seville, Spain. Since 2007 he has been Dean of the Faculty of Human Sciences at the University. Gonzalo has led and participated in many international projects on coastal and marine management and planning, and has many scientific papers published in international journals. He has also been author of nearly 30 chapters in various books on the coastal and marine environment. Among other projects at a regional level, Gonzalo participates in the implementation of the SIGLA (Coastal and Marine Information System of Andalusia). Catherine McCall Catherine McCall is a planner with the Maryland Department of Natural Resources' (MD DNR) Chesapeake & Coastal Program in Annapolis, Maryland. Since joining DNR, she has led a number of coastal habitat mapping and targeting initiatives including the development of a blue infrastructure assessment; marine spatial planning activities; and coastal habitat sea level rise adaptation planning. She has also been involved with a number of other programs at MD DNR related to marine protected areas, living shorelines, and coastal hazards. Catherine holds a B.S. from Pennsylvania State University and an M.S. from Georgetown University, both in biology with a focus on conservation ecology. Andrus Meiner Andrus Meiner is the Project Manager of Regional Assessments and Geospatial Data in Natural Systems and Vulnerability, Land (NSV3) at the European Environment Agency. He is currently working on integrated spatial assessment and indicator development for the coastal zones. Specific responsibility of that task involves analysis of land cover changes and main sectoral policies with regard of their impact of state of coastal zones on European level. Andrus is also involved in development of EEA spatial data infrastructure and coordinates land use/cover information system. His professional experience includes numerous international assignments in the fields of modeling, environmental information, geospatial database development and integrated environmental assessments, he is co-author of an assessment report on state of coasts in Europe and a monograph on simulation modeling of "river catchment-coastal sea" system. Andrus is a graduate from Tartu University in Estonia and holds academic degree in environmental geography (1990). He has attended various international courses, including research fellowships in the US and Norway.

7
José Manuel Moreira-Madueño José Manuel Moreira-Madueño has, since 1988, combined his scientific research with other responsibilities at the Regional Ministry of Environment of Andalusia. He is currently Deputy Director for Sustainable Development and Environmental Information, and previously served as Head of Department for Remote Sensing and Environmental Information Systems. José Manuel has many scientific publications and articles on GIS, as well as technologies for decision support and environmental management in international journals. José Manuel is responsible for the Environmental Information Network of Andalusia (REDIAM), and also teaches courses in cartography and GIS as applied to environmental management at three universities in Andalusia, Spain. He holds a Ph.D. in Physical Geography from the University of Seville, Spain. Joshua Murphy Joshua Murphy is a Management and Program Analyst with the National Oceanic and Atmospheric Administration (NOAA) Coastal Services Center in Charleston, South Carolina. Over the past eight years, he has supported the application of geographic information systems (GIS) to coastal issues through numerous capacity-building activities. As a trainer, Josh has taught introductory and intermediate-level GIS, global positioning systems (GPS) and metadata courses to hundreds of participants within the coastal zone. As a project manager, Josh has led the development of a variety of geospatial tools, such as the Benthic Terrain Modeler and the Chesapeake Bay Oyster Larvae Tracker (CBOLT). More recently, Josh’s interests lie in marine spatial planning and strategic conservation planning using a green infrastructure approach. He currently serves as the project manager for the Digital Coast initiative, a community resource for coastal geospatial data, tools, and training. Josh holds a B.S. in Geography from Penn State University. Elizabeth (Liz) O’Dea Elizabeth (Liz) O’Dea is a geographer with a taste for environmental mapping and making spatial information widely accessible. She has a M.Sc. in Geography from Oregon State University and has worked with terrestrial, coastal and marine environments in Oregon, Washington, and Ireland. Whilst at the Coastal and Marine Resources Centre in Cork, Ireland, she worked as a designer and developer of the Marine Irish Digital Atlas. She dealt with all aspects of what it takes to create and manage a coastal atlas, including web design, data management, usability, and technology. Liz has been involved in ICAN since its inception and was the inspiration behind the original workshop series. She is currently a GIS Analyst with the Washington State Department of Ecology in Olympia, Washington, where she works with the Washington Coastal Atlas team. In her spare time she geocaches, travels, and sea kayaks whenever she has the opportunity. Timothy Nyerges Timothy Nyerges is Professor of Geography at the University of Washington where he specializes in teaching and research related to public participation geographic information systems (GIS) and coastal GIS, focusing on land use, transportation, and water resource related issues. He received his Ph.D. from the Ohio State University in 1980 specializing in database management languages for GIS. For the past fifteen years he has had a stream of nationally-funded research projects to explore

8
development and evaluation of networked GIS, particularly as supported by cyberinfrastructure technology, for enabling stakeholder participation in environmental decision support. He is currently president (2009-2011) of the University Consortium for Geographic Information Science (UCGIS). Eoin O’Grady Eoin O’Grady currently leads the Information Services and Development Section in the Marine Institute (Ireland) and is responsible for overseeing the Institute’s IT and data management systems. These includes systems to manage a wide variety of physical, biological and chemical marine data from environmental monitoring, seabed surveys, predictive modeling and fisheries survey programmes, and participation in projects such as SeaDataNet. Eoin also leads the Knowledge and Information Management programme of SeaChange the Irish national Marine Research, Knowledge and Innovation Strategy. This includes the development of information systems such as the Irish Spatial Data Exchange to support marine research and innovation. Eoin currently participates in the Irish Spatial Data Infrastructure working group. Previous to the Marine Institute Eoin has worked in a variety of software development and architecture roles for telecoms, manufacturing and financial services companies. Eoin received his B. Eng in Computer Engineering from the University of Limerick in 1995. José Ojeda-Zújar José is the principal professor of coastal and marine geomorphology, management and planning, GIS and remote sensing at the University Pablo de Olavide in Seville, Spain. He is also the director of the Coastal Planning and Territorial Information Technologies research group there. José has more than 100 scientific publications in international journals, and has also had a number of scientific placements at a number of international institutions that lead research activities in remote sensing and GIS (Nottingham and Aberdeen, UK), coastal and marine policy (University of Delaware, USA) and the National Center of Scientific Research or CNRS (France), among others. José was responsible for the implementation of the SIGLA (Coastal and Marine Information System of Andalusia), which is part of the Environmental Information Network (REDIAM). He holds a Ph.D. in Physical Geography from the University of Seville, Spain. Sean Padmanabhan Sean Padmanabhan is a Research Officer in the field of Geographic Information Systems (GIS) at the Institute of Marine Affairs, Trinidad & Tobago. With 9+ years experience in GIS, he assisted in inter-departmental and inter-organizational research; created and implemented new strategies for improving the generation, flow and dissemination of spatial data and products across both intra- and inter-organizational levels; and, developed new GIS and GIS-related marine research projects at the Institute and around the wider Caribbean Region. Sean has also been significantly involved in several regional initiatives in the Caribbean such as IODE/ODINCARSA, under which the Caribbean Marine Atlas Project falls, and the UNEP/CAR-RCU Programme responsible for the Protocol and National Programme of Action for Land-Based Sources of Pollution. He holds an M.A. in Marine Affairs and Policy/GIS, as well as an M.S. in Marine Science/Biology from the Rosenstiel School of Marine and Atmospheric Sciences, University of Miami.

9
Trung Pham Dr. Trung Pham is a computer science and GIS researcher. His research interests include geographic information integration, data quality and 3D GIS, and the application of GIS in environmental science, geology and urban management. His recent research activity has been focused on Web delivery and visualization of GIS data. Trung graduated from University Aix-Marseille I, with a PhD in computer science and GIS, in 2005. After graduation, he joined the CNRS (French National Centre for Scientific Research) as a post-doctoral researcher, Nantes, 2005-2007. He then worked as a researcher and teacher at University Paris Est Marne-La-Vallée, 2007-2008. In addition to his academic background, Trung has two years of experience in industry in Paris, as an engineer at IBM. He also worked in ALSY Paris as a development, maintenance and evolution engineer for the L’Oreal e-commerce websites with new Microsoft technologies (ASP.NET, C#, Biztalk, Shapepoint, SQL Server, etc.). Greg Reed Greg Reed is the Executive Officer of the Australian Ocean Data Centre Joint Facility, a national multi-agency distributed data management system, and Deputy Director of the Ocean Data Services Group of the RAN Hydrography and Metoc Branch. Mr. Reed is an internationally recognized marine data expert and Co-chair of the IOC’s International Oceanographic Data and Information Exchange (IODE) committee. He is also involved in the development of international standards for oceanographic data management and exchange. Mr. Reed is a lead author for Ocean Teacher, an online encyclopedia aimed at training students and mid-level professionals on marine data and information management. He has participated in a number of international capacity building activities as course coordinator and lecturer and in the development of marine atlas projects. He is a contributed to the African Marine Atlas. Gabe Sataloff Gabe Sataloff is a GIS Analyst and Data Manager at the NOAA Coastal Services Center in Charleston, SC. Gabe joined the Coastal Services Center in 2008 after finishing his Masters of Environmental Studies at the College of Charleston. He got involved on the coastal atlas assessment team of the International Coastal Atlas Network in 2008. Lucy Scott Lucy Scott coordinates national and regional data and information management activities for the United Nations Development Program (UNDP) Global Environment Facility (GEF) Agulhas and Somali Currents Large Marine Ecosystem (ASCLME) Project. Over the past ten years, she has worked in South Africa, Mozambique, Tanzania, Malawi, Comoros, Kenya, Seychelles, Mauritius, Maldives and Madagascar on a variety of projects and programs. These ranged from marine research expeditions to data management projects and the development of Geographic Information Systems, particularly for coastal resource mapping, aquaculture and conservation planning. Lucy has participated in GIS atlas projects at several scales and is currently one of five editors of the African Marine Atlas, a project involving participants from 16 African, European and North American countries. She has published in several fields, serves on the board of trustees of the Sustainable Seas

10
Trust and is a member of the Global Oceanographic Observing System (GOOS)-AFRICA remote sensing working group. Karen Stocks Karen Stocks is a research scientist at the San Diego Supercomputer Center. Her interests include biodiversity informatics, data integration, and developing information systems for marine biogeography, seamount ecology, and oceanographic research vessel data. She is part of the Marine Metadata Interoperability project, and leads the development of the MMI Guides, a set of online resources introducing metadata topics and providing guidance on best practices for data documentation (http://marinemetadata.org/guides). Karen completed a Bachelors of Science degree in Wildlife and Fisheries Biology at the University of Massachusetts, and a doctorate in Biological Oceanography at Rutgers University, and has worked at the San Diego Supercomputer Center since 2000. Ronan Uhel Ronan Uhel is the Head of Natural Systems and Vulnerability, at the European Environment Agency. He has 20 years in environmental and sustainable development information and analysis at the European and international level. He specializes in bridging between science (knowledge) and policy (actions), and in assessing the state-of-the-environment and policy effectiveness. Ronan has had coordination and editorial responsibility for many studies, reports and publications on these topics, with broad coverage from economic sectors to technologies to education. He has participated in many committees and working groups at the European and international levels on environmental governance, and has been a speaker/discussant at conferences and workshops covering all aspects of environment and development issues. Ronan's academic background is in geography, physical planning, and oceanography, with additional training in EU environmental legislation and regional policies. Kuuipo Walsh Kuuipo Walsh is in her first year as Associate Director of the GIScience Certificate Program at Oregon State University (OSU). Kuuipo brings to her role a rich and varied background in computer science, marine and coastal geographic information science, and natural resource management. Kuuipo is not new to OSU as she works on making spatial information accessible through the Oregon Explorer, a web-based, digital library co-managed by OSU Libraries and the Institute for Natural Resources (INR). As a project manager for INR, she recently launched the Oregon Hazards Explorer, which provides online maps and spatial information about many natural hazards relevant to Oregon including coastal erosion, floods and tsunamis. Before joining INR, Kuuipo was the Data/Metadata Librarian in Dawn Wright’s Seafloor Mapping Marine and Coastal GIS Laboratory. She received her M.Sc. in Marine Resource Management from Oregon State University and her B.Sc. in Computer Science from California Polytechnic State University. Dawn Wright Dawn Wright is a professor of geography and oceanography at Oregon State University, and the director of the Davey Jones’ Locker Seafloor Mapping/Marine GIS Laboratory. Her research interests include geographic information science, coastal web atlases, benthic terrain and habitat characterization, tectonics of mid-

11
ocean ridges, and the processing and interpretation of high-resolution bathymetry and underwater videography/photography. She serves on the editorial boards of the International Journal of Geographical Information Science, Transactions in GIS, Journal of Coastal Conservation, The Professional Geographer, and Geography Compass, as well as on the US National Academy of Sciences' Ocean Studies Board, Committee on Strategic Directions in the Geographical Sciences for the Next Decade, Committee on an Ocean Infrastructure Strategy for US Ocean Research in 2030, and the Committee on Geophysical and Environmental Data. She serves on the Technical Advisory Board of the Marine Metadata Interoperability project. Dawn’s other books include Arc Marine: GIS for a Blue Planet (with M. Blongewicz, P. Halpin, and J. Breman, ESRI Press, 2007), Place Matters: Geospatial Tools for Marine Science, Conservation, and Management in the Pacific Northwest (with A. Scholz, Oregon State University Press, 2005), Undersea with GIS (ESRI Press, 2002), and Marine and Coastal Geographical Information Systems (with D. Bartlett, Taylor & Francis, 2000). Dawn holds a Ph.D. in Physical Geography and Marine Geology from the University of California at Santa Barbara. She is a fellow of the American Association for the Advancement of Science.

Section 1Principles

1
Copyright © 2011, IGI Global. Copying or distributing in print or electronic forms without written permission of IGI Global is prohibited.
Chapter 1
IntroductionDawn J. Wright
Oregon State University, USA
Valerie CumminsUniversity College Cork, Ireland
Edward DwyerUniversity College Cork, Ireland
COASTAL WEB ATLASES DEFINED
In recent years significant momentum has oc-curred in the development of Internet resources for decision makers, scientists and the general public who are interested in the coast. Govern-ments, industry sectors, academic institutions and non-governmental organizations (NGOs) have a tremendous stake in the development and manage-ment of geospatial data resources. Coastal mapping plays an important role in informing decision makers on issues such as national sovereignty,
resource management, maritime safety and hazard assessment. A key aspect of this trend has been the development of coastal web atlases (CWAs), based on web-enabled geographic information systems (GISs, Figures 1 and 2). A CWA is defined in O’Dea et al., (2007) as: a collection of digital maps and datasets with supplementary tables, illustrations and information that systematically illustrate the coast, oftentimes with cartographic and decision support tools, all of which are acces-sible via the Internet. These atlases organize and coordinate all of the above through a single portal or entry point, with a common design theme that is followed through all of the pages of a CWA site.
ABSTRACT
Coastal web atlas (CWA) development is introduced in this chapter as a relatively new field of technol-ogy, driven by a wide range of coastal policy issues such as population pressure and climate change. International interest in CWAs is demonstrated by the large number of CWA initiatives worldwide. However, there is a need to take stock of technological developments as well as other lessons learned. This chapter sets the scene in relation to these issues which in turn provides the context for describing the aims of the book. The aims of the book are articulated as presenting the latest developments in CWAs and helping readers to determine future needs in mapping and informatics for coastal management.
DOI: 10.4018/978-1-61520-815-9.ch001

2
Introduction
CWAs are also defined in Tikunov et al. (2008) (termed there as “atlas information systems”) and with regard to their increasingly important role in national spatial data infrastructures (SDIs).
CWAs deal with a variety of thematic priori-ties (e.g., oil spills or recreational uses) and can be tailored to address the needs of a particular user group (e.g., coastal managers or educators). There are many benefits that CWAs can provide, including:
• A portal to coastal data and information from diverse sources;
• Up to date geospatial data which is fre-quently changing;
• A widely accessible coastal resource to a broad audience;
• A comprehensive and searchable data catalogue;
• Improved efficiency in finding data and information;
• An instrument for spatial planning;• Interactive tools and resources which
empower users to find their own answers;• An educational resource which raises
people’s consciousness about coastal topics.
Driving factors for CWA development include the need for:
• Better planning to cater for increased pop-ulation pressures in the coastal zone (e.g., the UN estimate that by 2020 75% of the world’s population will be living within
Figure 1. Example of a coastal web atlas, the Oregon Coastal Atlas, http://www.coastalatlas.net, show-ing opening page with map, tools, learn, and search sections

3
Introduction
60 km of the coastal zone; United Nations, 1992; also World Resources Institute, 2001; Shi and Singh, 2003).
• Decision support systems in relation to climate change scenarios in vulnerable coastal regions.
• Information to facilitate assessments of risk to natural hazards (including tsuna-mis and floods).
• Access to data and maps to support marine spatial planning (MSP) as a tool for better coastal and marine area management (e.g., European Commission, 2007).
• Access to relevant data and information in coastal and ocean capacity-building ini-tiatives worldwide, especially for effective governance, sustained economic support, and education and training opportunities (e.g., National Research Council, 2008).
• Maps of jurisdictional boundaries for mari-time territories in support of claims related to the United Nations Convention on the Law of the Sea (UNCLOS), which has a deadline for submission of 2013.
• Information on resource availability and exploitation including habitat and species information, and ecological and commu-nity resilience as part of ecosystem-based management.
• Spatial information to underpin the de-velopment of emerging offshore sectors such as ocean energy, offshore aquaculture and marine bio-discovery.
Figure 2. Example of a coastal web atlas, the Oregon Coastal Atlas, http://www.coastalatlas.net,showing polygons of rapidly moving landslide regions resulting from a coastal hazard query.

4
Introduction
SCIENTIFIC AND RESOURCE MANAGEMENT CONTEXT
The driving factors mentioned above have already resulted in the proliferation of CWA projects (such as those introduced in Section 2 of the book) that have been designed to address thematic (e.g., fisheries management, recreational use) or spatial areas of interest (e.g., country to local level). Im-portant questions asked and potentially answered by coastal web atlases (given sufficient data and personnel), include these (in the realm of coastal erosion as an example):
From a coastal scientist…
1) What is the geomorphic evolution of the coast?a. What historic photography, geomor-
phology profiles, LIDAR surveys, shoreline surveys are available for study?
2) How many major erosion events due to se-vere storms have occurred within a defined section of shoreline in the past 50 years?
3) How have anthropogenic activities impacted natural coastal erosion processes?
4) Can a predictive model of hot spots be de-veloped with the data available?
From a coastal resource manager…
1) What are the erosion rates along a geographi-cally defined stretch of shoreline?a. Where are erosion hot spots based on
geology and wave action?b. Where are erosion hot spots conflicting
with human uses of the coast?c. For a defined planning window (e.g.,
25 years) what is the anticipated extent and magnitude of coastal erosion risk along a designated stretch of shoreline?
d. What is the potential for new devel-opment in the above designated risk zones? What actions can be taken to
avoid, minimize or mitigate the place-ment of new development in predicted high-risk zones?
2) Where is the potential for habitat loss due to coastal erosion a significant risk?a. Where are ecologically vulnerable
areas such as essential fish habitats, wetlands, beaches, wildlife refuges and conservation areas?
From a coastal private property owner…
1) What is the erosion rate along my stretch of shoreline?a. How close is my home to “the edge”?b. Will my home survive to the end of
my mortgage?
From an emergency responder…
1) How big is an incoming storm / erosion-causing event?a. How do I alert affected areas?
2) What public infrastructure is threatened by chronic or severe erosion events (e.g. trans-portation networks, pubic utilities (waste water treatment facilities, power plants, etc.)?
3) Where are the best evacuation routes during major coastal storm events?
From a coastal geographic information scien-tist/data analyst…
1) What data and information can I make ac-cessible regarding coastal erosion?a. What feature categories (historic pho-
tography, geomorphology profiles, LIDAR surveys, shorelines, plant/animal species, surveys etc.) exist in a designated area?
b. Where do existing data reside? Can my system access the data?

5
Introduction
c. Can the data be shared (data ownership, permissions, licensing)?
d. How well are existing data documented (reports, metadata), and does the documentation support the potential future uses of the data by my intended audience?
2) What analysis or visualization tools can I provide that can make use of available data to answer common questions from my audience(s) regarding coastal erosion?
3) Can I extract information from the atlas network to bolster data available to support coastal issues within my own program? Are current inventories sufficient?
4) Does my area of Interest extend beyond the geographic boundaries of the available Atlas system?a. If so, are there neighboring or regional
Atlases that might have supplemental information that might be of use?
b. If so, are the contents of neighboring or regional Atlases accessible to users of my Atlas, and the analysis or visualiza-tion tools it contains?
Significant capacity has been built in the field of coastal mapping and informatics in the last decade as a result of a steady advancement of GIS applications for coastal practitioners. For example, the European Commission is implementing the MARATLAS project as an educational tool and as a means of highlighting common maritime heritage. The web based MARATLAS will be multi-lingual and will link to other European mapping initiatives such as the Water Information System for Europe (WISE). In the U.S. NOAA’s Coastal Services Center (CSC) has launched the “Digital Coast” initiative (http://www.csc.noaa.gov/digitalcoast), which seeks new ways to build the U.S. coastal and marine National Spatial Data Infrastructure or NSDI (Mapping Science Com-mittee, 2001), so that U.S. coastal communities have improved access to organized and relevant
data and tools needed to make more informed deci-sions. In addition, NOAA CSC has been working on an inventory and registry of planned, current and completed Federal and non-Federal mapping activities, including coastal web atlases.
Developments in resource management policy can also have implications for the roll out of CWAs. For example, the recent reports of the Pew Oceans Commission and the U.S. Commission on Ocean Policy (Pew Oceans Commission, 2003; Juda, 2005) have clearly shown that coastal communi-ties are critical to the economy of the U.S., and to its overall health and well-being as a nation, and further that geographic technologies will be a fundamental, critical tool to address the threats of climate change, coastal hazards, overpopula-tion, and more. As such, the State Governors of Washington, Oregon and California signed the West Coast Governors’ Agreement on Ocean Health (http://westcoastoceans.gov), which in-cludes in its action plan, the need for harmonized ocean and coastal maps and information that also crosses administrative boundaries. In Europe, the European Commission has now published its vision for an integrated maritime policy for the European Union (European Commission, 2007), which calls for the development of an Atlas of the European Seas for use in regional ocean governance and management. Opportunities exist to facilitate such a development by providing for data interoperability among existing CWAs, and within the context of the Inspire Directive which establishes an infrastructure for spatial informa-tion in the European Community. Similar trends in resource management with implications for CWAs can be seen in other parts of the world, such as Australia, the Western Pacific, Africa and the Caribbean, as introduced in Chapter 5.
KEY ISSUES TO BE ADDRESSED
Despite the importance of key drivers described above, little has been done to take stock of the

6
Introduction
implications of these developments or to identify best practice in terms of creating an approach that takes lessons learned into consideration. Further-more, the research community is still working toward providing widespread solutions to deal with common issues such as achieving full semantic interoperability of metadata and databases (where concepts, terminology, even abbreviations that are shared between two or more individuals, systems, or organizations are understood by all to mean the same thing; Gruber 1993; Egenhofer, 2002), reversing the lack of tool integration for coastal analysis and decision-making, and removing most impediments to effective use of online atlases for decision-support.
While multiple benefits are derived from tailor-made atlases (e.g., speedy access to multiple sources of coastal data and information; economic use of time by avoiding individual contact with different data holders), the potential exists to de-rive added value from the integration of disparate CWAs, to optimize decision making at a variety of levels and across themes (Chapter 4). And while digital data sets have continued to grow exponen-tially, our ability to derive meaning, knowledge and management decisions from all of these data in an analytical context remains poor (e.g., Aditya & Kraak, 2006; Deliiska, 2007; Athanasis et al., 2008; Sahoo et al., 2008). Hence, a fundamental research question that applies to CWAs is:
(1) How best to achieve semantic interoperabil-ity so as to mitigate vague data queries, vague concepts or natural language semantics when retrieving and integrating data and information?
For example, the terminology used to describe similar data in CWAs can vary widely between specialties or regions, which can complicate data searches and integration. Use of the word “sea-bed” in Europe versus use of the word “seafloor” to describe the same feature in North America is a good example of this scenario, as is the inter-
changeable use of “coastline” versus “shoreline” in both regions. Agreements on content/semantic interoperability must be developed to eliminate such problems, making searches between dispa-rate, but mutually beneficial, projects feasible. The International Coastal Atlas Network (ICAN) aims to address such issues by providing a forum to share knowledge and experience among atlas developers (See Chapter 17). A technical group within the ICAN community have been developing a demonstration prototype as a proof-of-concept to inter-relate metadata and other information between two initial CWAs (the Marine Irish Digital Atlas or MIDA, http://mida.ucc.ie, and the Oregon Coastal Atlas or OCA, http://www.coastalatlas.net). The prototype is in the form of an Open Geospatial Consortium (OGC) catalogue services for the Web (CSW), where web map services (WMS) will be registered. But much more collaborative discussion about refining and extending this prototype is needed, which can best be achieved through the type of international col-laboration accommodated through ICAN.
A second major question driving research is:
(2) What are the best ways to share data and information across multiple distributed organizational and social contexts? And related to this, under what conditions do virtual organizations (such as ICAN) best foster and support transformative scientific research while also providing an effective spatial data infrastructure? Again, very little work has been done in any of these realms with respect to CWAs (e.g., there is a need for an assessment of CWAs used by differ-ent communities, and, where possible, to quantify the impact of CWA end user groups such as agencies, regions and states).

7
Introduction
AIM OF THE BOOK
This book is a book, as opposed to a research monograph. Hence, rather than a lengthy theo-retical treatise on basic and futuristic research questions and problems, it has been prepared more as a concise, ready reference, with collections of subject-specific instructions where appropriate. The purpose of the book is to present the latest developments in the new field of coastal web atlases while also sharing best practices and les-sons learned. This will, in turn, help readers to determine future needs in mapping and informat-ics for coastal management and improve spatial thinking in the coastal context. As such, this book provides a complete guide to CWA development and implementation including established prin-ciples and recommendations for atlas design, data requirements, software technology and institutional capacity, as well as best practice for achieving interoperability between CWAs (where concepts, terminology, and even abbreviations that are shared between two or more atlases are understood by all to mean the same thing).
The approach to the book is to present informa-tion according to three parts. Section 1 covers the principles of CWAs. Within Section 1, Chapter 2 covers the major features that make up an atlas, Chapter 3 covers how to implement those features, and Chapter 4 describes how to interoperate the services of one atlas with other atlases as part of a network, especially by way of international stan-dards. The chapters of Section 2 provide examples of CWAs from around the world, including North America, Europe, Africa and the Caribbean. The chapters of Section 3 covers CWA management and governance issues, including how to best meet the needs of one’s user community, how to make improvements in an atlas based on those user needs and make it grow, how to support an atlas with partnerships, funding, and the like so that it will mature, and how atlases play a key role in SDIs. Table 1 provides more detail by way of summarizing the content and importance of each chapter. This book is also accompanied by a dedicated website (International Coastal Atlas Network, http://ican.science.oregonstate.edu) which includes links to mature CWAs, and is building templates for CWA design, snippets
Table 1. Summary of the content of each chapter in this book
Section 1: Principles
1: Introduction General introduction to the entire book, including definition of a coastal web atlas and key issues sur-rounding it uses. The chapter also identifies the intended audience and gives a brief overview of topics and importance for all remaining chapters.
2: Coastal Web Atlas FeaturesThis chapter features an overall summary with more detailed descriptions of common coastal web atlas features and the forms/functions they may take. This includes an extensive discussion of the various types of tools that one might find in a web atlas.
3: Coastal Web Atlas Imple-mentation
Following on the previous chapter, which describes what the basic features of a coastal web atlas are, this chapter goes on to present considerations and recommendations for actually implementing an atlas (i.e., design, development, deployment). This chapter includes lists of the advantages/disadvantages and applicability/execution challenges for various technical resources. And finally, it includes helpful information on open source versus proprietary software, as well as various technology standards.
4: Coastal Atlas Interoperability
This chapter provides A general definition of interoperability is the ability of diverse systems and/or organizations to work together, especially in the use and exchange of information. This chapter is about interoperability between computer systems, especially those systems that underlie a coastal web atlas. It reviews the relevant standards for interoperability between coastal web atlases, and gives practical guidelines on how to make atlases interoperable through the use of standards, web services, vocabulary words and ontologies. It concludes with a description of the International Coastal Atlas Network’s interoperability prototype under development.
continued on following page

8
Introduction
Section 2: Coastal Web Atlas Case Studies Around the World
5: Overview of Coastal Atlases
This chapter provides a brief overview of various coastal web atlas projects around the world, providing a contextual bridge to the atlas case studies of Chapters 6-14. A summary of the policy context within which many European atlases operate is followed by a summary of other efforts emerging in Australia, the Western Pacific, Africa, and the Caribbean.
6: Oregon, USA
Case study for the U.S. state of Oregon, focusing on the Oregon Coastal Atlas in action. This atlas, along with the Marine Irish Digital Atlas, has been online and in constant development for a long period of time, and therefore one of the more mature coastal atlases on the Internet. Each case study chapter describes the situation in country or state regarding the accessibility of coastal information, the motivation for the producing the, atlas, the knowledge gap that it is trying to fill, the intended audience for the atlas, and where possible, how is it financed. Case study chapters also identify issues of data collection, system design, usage and associated statistics, strengths and weakness of approaches to date, and future plans, including its relationship to ICAN.
7: Ireland
Case study for Ireland focusing on the Marine Irish Digital Atlas in action. This atlas, along with the Oregon Coastal Atlas, has been online and in constant development for a long period of time, and is therefore one of the more mature coastal atlases on the Internet. The case study follows the “template” of topics as described for Chapter 6.
8: Virginia and Maryland, USACase study for the Chesapeake Bay region of the U.S. states of Virginia and Maryland, focusing on the Virginia Coastal Geospatial and Educational Mapping System and the Maryland Shorelines Online in action. The case study follows the “template” of topics as described for Chapter 6.
9: Wisconsin, USACase study for the U.S. state of Wisconsin, focusing on the ongoing development of the Wisconsin Coastal Atlas, with a future eye toward a regional Great Lakes Coastal Atlas. The case study follows the “template” of topics as described for Chapter 6.
10: BelgiumCase study for Belgium, focusing on the Belgian Coastal Atlas, which was first published as a hardcopy book but then transitioned to the web. The case study follows the “template” of topics as described for Chapter 6.
11: Africa Case study for the continent of Africa, focusing on the African Marine Atlas. The case study follows the “template” of topics as described for Chapter 6.
12: Caribbean Case study for the Caribbean region, focusing on the Caribbean Marine Atlas. The case study follows the “template” of topics as described for Chapter 6.
13: UK Case study for the United Kingdom, providing a brief overview of the origins and evolution of coastal web atlases throughout the country. The case study follows the “template” of topics as described for Chapter 6.
14: SpainCase study for Spain, focusing on the SIGLA (Sistema de Información Geografica del Litoral Andaluz or Coastal Information System of Andalusia). The case study follows the “template” of topics as described for Chapter 6.
Section 3: Coastal Web Atlas Management and Governance Issues
15: The International Coastal Atlas Network
This chapter transitions from coastal web atlas (CWA) case studies to atlas management and governance issues, by way of a summary of the International Coastal Atlas Network (ICAN). ICAN is a newly founded informal group of over 30 organizations from over a dozen nations who have been meeting over the past two years to scope and implement data interoperability approaches to CWAs. Most of the atlases profiled in Section 2, Case Studies, are members of ICAN.
16: Coastal Atlases in the Context of Spatial Data Infrastructures
This chapter summarizes key projects and initiatives that are being implemented on very large scales (national/international) by national governments and commissions to build coastal spatial data infra-structures (SDIs). These include SDI efforts in the U.S. and Europe that are closely related to ICAN, and as such are of great value to its mission of developing interoperable atlases, providing along the way solutions for the integration of not only technologies, but people, institutions, and institutional objectives.
17: Creating a Usable Atlas
Having covered some overarching management and governance issues for coastal web atlases, the book returns to the user level with 3 concluding chapters that guide the reader on how to create an atlas that is the most usable for its audience, how to make that seed effort grow, and how to maintain it. This chapter provides guidelines on how to better understand coastal web atlas users, how to undertake user-centered design and development for improved web site usability, and how to avoid major pitfalls with web interfaces.
18: Improving a Growing AtlasThis chapter covers aspects of atlas monitoring via web server statistics, user surveys, and other sorts of feedback mechanisms, and how to obtain improvement over time. Also covered are issues of scalability (how to accommodate increasing datasets and users), and the latest in reviewing/updating technology.
Table 1. continued
continued on following page

9
Introduction
of scripts and programming routines to achieve interoperability with partner atlases, and several other resources mainly for online GIS develop-ments and online data providers.
REFERENCES
Aditya, T., & Kraak, M. J. (2006). Geospatial Data Infrastructure Portals: Using National Atlases as a Metaphor. Cartographica, 41(2), 15–133.
Athanasis, N., Kalabokidis, K., Vaitis, M., & Soulakellis, N. (2008). Towards a semantics-based approach in the development of geographic portals. Computers & Geosciences. doi:.doi:10.1016/j.cageo.2008.01.014
Deliiska, B. (2007). Thesaurus and domain ontol-ogy of geoinformatics. Transactions in GIS, 11(4), 637–651. doi:10.1111/j.1467-9671.2007.01064.x
Digital Coast. (2009). Retrieved October 31, 2009, from NOAA Coastal Services Center website http://www.csc.noaa.gov/digitalcoast
Egenhofer, M. (2002). Toward the Semantic Geo-spatial Web, Tenth ACM International Symposium on Advances in Geographic Information Systems. New York: ACM Press.
European Commission. (2007). Communication from the Commission to the European Parlia-ment, the Council, the European Economic and Social Committee and the Committee of the Regions: An Integrated Maritime Policy for the European Union. Commission of the European Communities. Brussels, 10 October 2007, COM (2007) 575 final. Retrieved July 29, 2009 from the European Commission web site: http://eur-lex.europa.eu/LexUriServ/site/en/com/2007/com2007_0575en01.pdf
Gruber, T. (1993). A translation approach to por-table ontology specifications. Knowledge Acquisi-tion, 5(2), 199–220. doi:10.1006/knac.1993.1008
International Coastal Atlas Network. (2009). Re-trieved October 15, 2009, from the International Coastal Atlas Network web site: http://ican.sci-ence.oregonstate.edu.
Juda, L. (2005). The report of the U.S. Com-mission on Ocean Policy: State perspec-tives. Coastal Management, 34(1), 1–16. .doi:10.1080/08920750500364930
Mapping Science Committee. (2001). National Spatial Data Infrastructure Partnership Pro-grams: Rethinking the Focus. Washington, DC: National Academy Press.
Marine Irish Digital Atlas. (2009). Retrieved October 31, 2009, from Coastal and Marine Resources Centre, University College Cork web site: http://mida.ucc.ie.
Table 1. continued
19: Supporting a Successful Atlas
This concluding chapter of the book is about to maintain a successful coastal web atlas. It discusses issues relating to securing long-term support for an atlas and provides guidance based on existing prac-tice and experience with atlas developments at national and international levels. Specific topics include institutional capacity, institutional support, partnerships, funding, governance, and continued promotion. Also included is a discussion of data and metadata ownership issues, intellectual property rights, and the legal protection of atlas content.

10
Introduction
National Research Council. (2008). Increasing Capacity for Stewardship of Oceans and Coasts: A Priority for the 21st Century, Committee on Inter-national Capacity-Building for the Protection and Sustainable Use of Oceans and Coasts (Feeley, M. H., & Pantoja, S. C., Eds.). Washington, D.C.: The National Academies Press.
O’Dea, L., Cummins, V., Wright, D., Dwyer, N., & Ameztoy, I. (2007). Report on Coastal Map-ping and Informatics Trans-Atlantic Workshop 1: Potentials and Limitations of Coastal Web Atlases. University College Cork, Coastal & Marine Re-sources Centre: Cork, Ireland. Retrieved May 7, 2009, from the ICAN web site: http://ican.science.oregonstate.edu/node/47
Oregon Coastal Atlas. (2009). Retrieved October 31, 2009, from the Oregon Coastal Atlas web site: http://www.coastalatlas.net.
Pew Oceans Commission. (2003). America’s Liv-ing Oceans: Charting a Course for Sea Change. A Report to the Nation. Arlington, VA: Pew Oceans Commission.
Sahoo, S. S., Bodenreider, O., Rutter, J. L., Skinner, K. J., & Sheth, A. P. (2008). An ontology-driven semantic mashup of gene and biological pathway information: Application to the domain of nicotine dependence. Journal of Biomedical Informatics, 41(5), 752–765. doi:10.1016/j.jbi.2008.02.006
Shi, H. & Singh, A. (2003). Status and intercon-nections of selected environmental issues in the global coastal zones. AMBIO: A Journal of the Human Environment, 32(2), 145–152.
Tikunov, V. S., Ormeling, F., & Konecny, M. (2008). Atlas information systems and geo-graphical names information systems as con-tributants to spatial data infrastructure. Interna-tional Journal of Digital Earth, 1(3), 279–290. doi:10.1080/17538940802291817
United Nations. (1992). Agenda 21: The United Nations Programme of Action from Rio. New York: United Nations.
West Coast Governors’ Agreement on Ocean Health. (2009). Retrieved October 31, 2009, from West Coast Governors’ Agreement on Ocean Health web site: http://westcoastoceans.gov.
World Resources Institute. (2001). World Re-sources 2000–2001. Washington, DC: World Resources Institute.
KEY TERMS AND DEFINITIONS
Coastal Web Atlas: A collection of digital maps and datasets with supplementary tables, illustrations and information that systematically illustrate the coast, oftentimes with cartographic and decision support tools, all of which are acces-sible via the Internet. Also known as web atlas, digital atlas, digital coastal atlas.
Capacity Building: With regard to coastal atlases, the actions involved in building local GIS infrastructure, including maintenance and update of GIS data layers, software, computer equipment and labs/offices, salaried personnel, and action items for project initiatives.
Coastal Informatics: A broad academic field encompassing the management and analysis of data collected from and representing the coast. Informatics can include spatial data infrastructure, hardware and software infrastructure, computa-tional networking, modeling, and experimentation, the design and deployment of data portals and Internet mapping sites, as well as the creation, analysis, and understanding of data/metadata vocabularies and ontologies, metadata creation/extraction/cross-walking tools, geographic and information management systems, and grid computing.

11
Introduction
Information Management: The means by which an organization, agency, or individual col-lects, documents, shares, and uses information. It often involves creating or identifying the appropri-ate resources to find quality information in order to fill gaps in knowledge. Coastal web atlases are therefore a key component of information man-agement as applied to coast region of the world.
Marine Spatial Planning: A critical part of regional governance that involves the inte-grated, forward-looking planning and consistent decision-making regarding various uses of the coast and nearshore. Marine spatial planning must be guided by specific policies and regulations governing usage, the conditions that apply, and an eye toward what possible conflicts in use may arise. Marine spatial planning is often aided by a coastal web atlases which can provide data on habitats, species migrations, land and territorial sea use by humans, navigation, managed areas (parks, reserves, disposal sites, etc.), commercial and recreational fishing, and the like.
Regional Governance: Policies and initiatives that allow state and local governments to pursue concrete, practical steps toward more coordinated and holistic management of ocean and coastal resources. This often includes establishing lines
of communication among regions to facilitate implementation of best practices, forming part-nerships among regions, and deploying proven management principles and approaches (e.g., ecosystem-based management). Coastal web atlases often provide the datasets, mapping tools, and contextual information needed for effective regional governance
Research Collaboration Network: A collabo-ration of research scientists, resource managers, technical staffers, and other interested parties to develop a coordinated research network focused on a particular topic. The group fosters communica-tion among those with common goals and interests, along with collaboration on common projects across disciplinary, organizational, institutional and geographical boundaries. The International Coastal Atlas Network is an example of a research collaboration network.
Spatial Data Infrastructure or SDI: A framework via an organization of people or government agencies, via the Internet, or via a series of guiding policies or standards to assist people with acquiring, processing, using, and preserving spatial data. The spatial data are often in geographic information system (GIS) format, are not, but not limited to this.

105
Copyright © 2011, IGI Global. Copying or distributing in print or electronic forms without written permission of IGI Global is prohibited.
Chapter 7
IrelandEdward Dwyer
University College Ireland
Kathrin KopkeUniversity College Cork, Ireland
Valerie CumminsUniversity College Cork, Ireland
Elizabeth O’DeaWashington State, USA
Declan DunneUniversity College Cork, Ireland
INTRODUCTION
Data and information regarding Ireland’s coastal and marine environment are held by a broad range of organizations with both terrestrial and marine remits, including national government depart-ments and agencies, local authorities, research and
teaching institutions, industry, private consultants and non-governmental organizations. Only a lim-ited number of these (such as the Environmental Protection Agency (EPA), the Marine Institute, the Geological Survey of Ireland (GSI) and the Ordnance Survey of Ireland (OSI)) provide ready access to their holdings (Dwyer et al. 2003). The time-consuming process of data sourcing and acquisition from these various data owners is
ABSTRACT
The Marine Irish Digital Atlas (MIDA) is an Internet resource built in a web GIS environment, where people interested in coastal and marine information for Ireland can visualize and identify pertinent geospatial datasets and determine where to acquire them. The atlas, which is being constantly main-tained, currently displays more than 140 data layers from over 35 coastal and marine organizations both within Ireland and abroad. It also features an “InfoPort” which is a repository of text, imagery, links to spatial data sources and additional reference material for a wide range of coastal and marine topics. The MIDA team has been active in the creation of the International Coastal Atlas Network and the Atlas was chosen as one of the nodes for the Semantic Interoperability Demonstrator.
DOI: 10.4018/978-1-61520-815-9.ch007

106
Ireland
complicated by the lack of data catalogues within many organizations, nonexistent or poor-quality metadata and variations in data quality (Bartlett 1999; McCormack 2003; O’Dea et al. 2004).
In order to address some of these issues and to improve the visibility of and access to coastal and marine related data and information, the Coastal & Marine Resources Centre (CMRC) at University College Cork developed the Marine Irish Digital Atlas (MIDA). The overall aim of the MIDA project was to collate island-wide coastal and marine spatial data and make it freely acces-sible over the Internet. The Atlas was intended as a resource for a broad audience and aimed to cater for anyone interested in coastal and marine matters on the Island of Ireland, encompassing the casual user searching for general information as well as the specialist that required particular data sets. This interactive, online tool, centered on a web GIS, was created with a number of specific objectives in mind:
• to develop a web site for presentation of geo-referenced coastal and marine datasets,
• to provide greater accessibility to data and information in the form of a web-enabled, customized GIS,
• to provide flexibility of use via a range of tools that allow users to select, overlay and compare geospatial layers,
• to allow users to search for and identify sources of data, information and expertise on the marine environment, and
• to encourage a greater appreciation of Ireland’s coastal regions by incorporating educational and informational materials based on multi-media technology.
Development of the Atlas was funded by a grant from the Higher Education Authority of Ireland under the Program for Research in Third Level Institutions as part of the National Devel-opment Plan (2000-2006). Additional funding was provided by the Environment and Heritage
Service of the Department of the Environment, Northern Ireland.
Since the MIDA was launched in 2006, the project has had multiple impacts and outcomes in areas as diverse as coastal governance in Ireland to technology development within the European Union (EU). In terms of international significance, the MIDA, together with the Oregon Coastal Atlas, served as a catalyst in the establishment of the International Coastal Atlas Network (ICAN). The partners involved in the development of the respective atlases organized and co-chaired the initial and subsequent ICAN workshops. The current operational version of the MIDA was launched at the first ICAN workshop held in Cork in July 2006 (O’ Dea et al. 2007). Subsequently MIDA was chosen as one of the atlases for the Semantic Interoperability Demonstrator, which is presented in chapter 4. Ongoing enhancement and improvement of the Demonstrator keep MIDA at the forefront of technical development within ICAN.
This chapter presents the many aspects in-volved in the development of the MIDA including an assessment of the Atlas’ impact to date. The following are discussed in detail:
• approaches to and challenges involved in spatial data and information collection, including data and metadata management issues,
• Atlas design and layout from both a user and developer perspective,
• Atlas usage, statistics and publicity,• challenges in maintaining and enhancing
the Atlas,• a partnership for creating distributed sys-
tems between key data holders in Ireland and
• current Atlas developments in the context of ICAN.

107
Ireland
DATA AND INFORMATION IN THE MIDA
Data and Information Collection
Regardless of the intended web GIS purpose, developers and spatial data managers often face similar difficulties when sourcing and acquiring data in addition to displaying them on the web. Challenges include variability in data quality, scale, data licensing and metadata (O’Dea et al. 2004; Department of Environment, Food and Rural Affairs 2002). When a web GIS contains spatial data from multiple data sources as opposed to from a single organization, these issues are compounded by differences in data management practices, including the existence of or differences in data catalogues and standard specifications. For the MIDA team, addressing the underlying data issues proved to be as challenging as the technological ones.
When the MIDA project started in 2002 a deci-sion was taken to set up a centralized repository to hold all the spatial datasets to be displayed via the Atlas. This approach was taken as few organiza-tions provided Internet access to their data holdings and those that did were not in a position to make their data available via distributed, standards-based, interoperable, web-sharing services.
In some countries, such as the United States, base datasets are easy and free/inexpensive to acquire. In Ireland licensing and significant data costs apply. The Ordnance Survey of Ireland (OSI), the Ordnance Survey of Northern Ireland (OSNI) and the United Kingdom Hydrographic Office (UKHO) are responsible for Ireland’s terrestrial and marine base data, and all charge for the licens-ing of their data as well as for datasets derived from their base maps. Base data such as coastline, bathymetry, digital terrain models, hydrographic chart data, roads, rivers and imagery can often be the most expensive acquisition cost in a project (O’Dea et al. 2004). Access may also be difficult due to strategic and commercial factors that limit
their availability (Bartlett 1999). The MIDA team encountered problems in regard to data cost and licensing restrictions therefore limiting the detail and amount of base data that was included in the Atlas. However, multi-annual licensing agree-ments at academic rates were reached with OSI, OSNI and SeaZone Solutions Ltd (distributors of UKHO data) for the base data used in the Atlas and this helped to contain data costs. An all-island raster map at 1:450,000 and coastal tiles at 1:50,000 were included. Cost prohibited the inclusion of a more extensive range of scales or the use of vector base data.
The broad spectrum of coastal data owners across Ireland made it challenging to find out who held what. Data acquisition involved personal knowledge, word of mouth and significant time investment. There were few resources in place to make data discovery easier (O’Dea et al. 2004). In some cases months were spent locating and sourc-ing important national or island-wide datasets for the MIDA. It was not uncommon to find that some desirable datasets, expected to exist in GIS-ready format, were not available, for example data layers pertaining to commercial, fishing and ferry ports. In such cases a decision was taken to generate the spatial datasets in-house using all available information such as published reports, web-sites and direct contact with relevant organizations. Having located datasets additional time passed before they could be included in the Atlas as is-sues such as the owner’s data preparation time, the establishment of license agreements and the determination of licensing costs had to be resolved (O’Dea et al. 2004). In order to ensure clarity and avoid misunderstanding each data owner was of-fered the possibility of completing and signing a memorandum of understanding (MOU). The MOU specified the conditions under which the data owner supplied the data to the MIDA and also those that the CMRC adhered to in their use of the data. This MOU also helped to avoid any misunderstandings with regard to data use, when
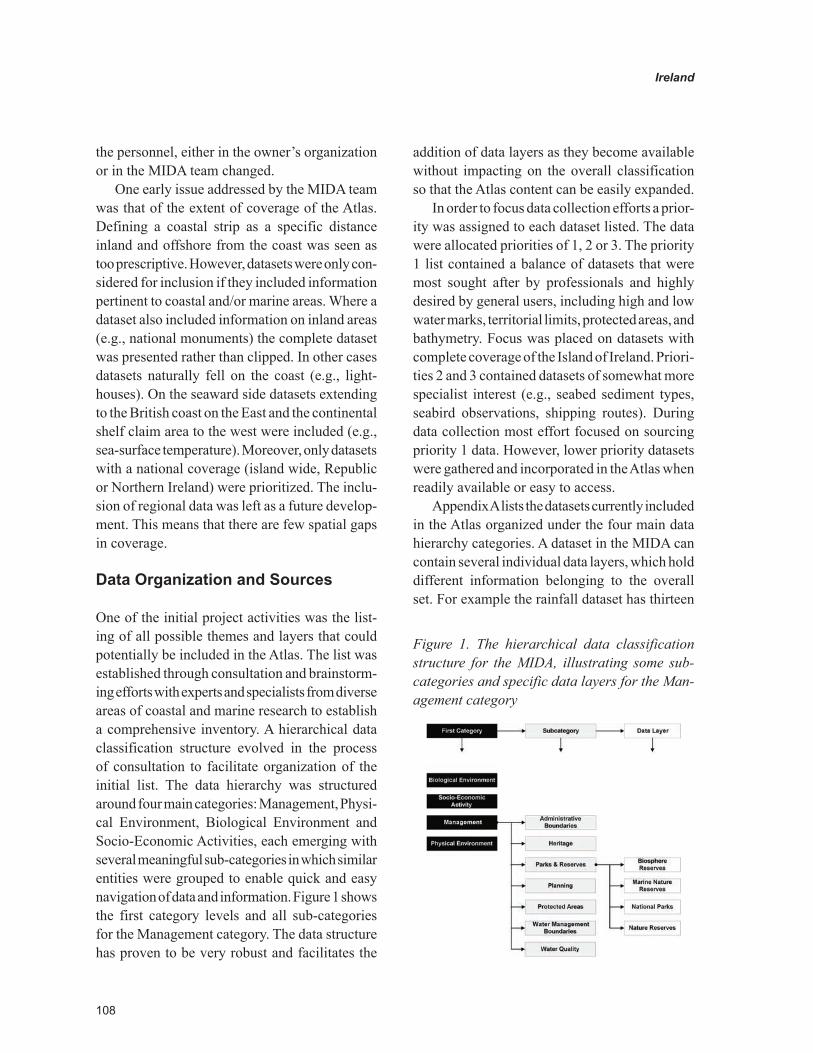
108
Ireland
the personnel, either in the owner’s organization or in the MIDA team changed.
One early issue addressed by the MIDA team was that of the extent of coverage of the Atlas. Defining a coastal strip as a specific distance inland and offshore from the coast was seen as too prescriptive. However, datasets were only con-sidered for inclusion if they included information pertinent to coastal and/or marine areas. Where a dataset also included information on inland areas (e.g., national monuments) the complete dataset was presented rather than clipped. In other cases datasets naturally fell on the coast (e.g., light-houses). On the seaward side datasets extending to the British coast on the East and the continental shelf claim area to the west were included (e.g., sea-surface temperature). Moreover, only datasets with a national coverage (island wide, Republic or Northern Ireland) were prioritized. The inclu-sion of regional data was left as a future develop-ment. This means that there are few spatial gaps in coverage.
Data Organization and Sources
One of the initial project activities was the list-ing of all possible themes and layers that could potentially be included in the Atlas. The list was established through consultation and brainstorm-ing efforts with experts and specialists from diverse areas of coastal and marine research to establish a comprehensive inventory. A hierarchical data classification structure evolved in the process of consultation to facilitate organization of the initial list. The data hierarchy was structured around four main categories: Management, Physi-cal Environment, Biological Environment and Socio-Economic Activities, each emerging with several meaningful sub-categories in which similar entities were grouped to enable quick and easy navigation of data and information. Figure 1 shows the first category levels and all sub-categories for the Management category. The data structure has proven to be very robust and facilitates the
addition of data layers as they become available without impacting on the overall classification so that the Atlas content can be easily expanded.
In order to focus data collection efforts a prior-ity was assigned to each dataset listed. The data were allocated priorities of 1, 2 or 3. The priority 1 list contained a balance of datasets that were most sought after by professionals and highly desired by general users, including high and low water marks, territorial limits, protected areas, and bathymetry. Focus was placed on datasets with complete coverage of the Island of Ireland. Priori-ties 2 and 3 contained datasets of somewhat more specialist interest (e.g., seabed sediment types, seabird observations, shipping routes). During data collection most effort focused on sourcing priority 1 data. However, lower priority datasets were gathered and incorporated in the Atlas when readily available or easy to access.
Appendix A lists the datasets currently included in the Atlas organized under the four main data hierarchy categories. A dataset in the MIDA can contain several individual data layers, which hold different information belonging to the overall set. For example the rainfall dataset has thirteen
Figure 1. The hierarchical data classification structure for the MIDA, illustrating some sub-categories and specific data layers for the Man-agement category

109
Ireland
separate layers representing mean monthly and mean annual rainfall. Over 140 data layers from thirty five different organizations were gathered as of June 2009.
Figure 2 (a) shows that although 47% of the data layers came from seven organizations, the rest originated in the remaining 28 organizations. This broad distribution of data illustrates the many sectoral interests in the coastal and marine space and underlines the need for tools such as the MIDA, which can improve discovery and accessibility of spatial data.
Although data layers in the MIDA came from numerous organizations (Figure 2 (a)) many of these can be grouped as government organizations. Figure 2 (b) shows that over half of the MIDA data layers were from such organizations, a further 27% were supplied by educational institutions, followed by 17% from non-governmental orga-nizations, while only 4% of data layers originated in the private sector. The MIDA collated and integrated many publicly available datasets from government organizations, which is encouraged through the EU Directive on the Re-use of Pub-lic Sector Information (European Union, 2003). Therefore it indirectly facilitates implementation of this Directive for public coastal and marine data in Ireland.
The seemingly large contribution of the CMRC to datasets in the MIDA is due to the fact that a significant number of datasets were constructed from other publicly available sources as directly usable GIS-ready spatial datasets did not exist (e.g., marinas, sailing clubs, saltmarshes). The private sector has a low representation among the data providers to the Atlas. This may be due to the commercial sensitivity of certain data and for less sensitive data companies market them directly. However, the MIDA offers a potential shop-window to private organizations to publicize their data holdings. The MIDA team hopes to develop a referrer capability for such organiza-tions in the future.
THE MIDA LOOK AND FEEL
The Atlas Interface
The core of the MIDA is a web-based mapping system. The main page, illustrated in Figure 3, consists of three key areas: the map and toolbar, the layer/legend area and the information area. Users control what they see in the map by loading and displaying one or more layers. The layer/legend area lists those data layers that are currently loaded
Figure 2. (a) The primary data supplier organizations (n=7) according to percentage of data layers provided to the Atlas. All those that contributed less than 3% of datasets are grouped as other (n=28). (b) Sectors to which data supply organizations (n=35) belong.

110
Ireland
in the map, according to the four major categories mentioned previously. A tick-box is used to show or conceal the loaded layer in the map area while an expansion button allows control over the dis-play of the individual layer’s legend. Clicking on the “add/remove layer” button activates a pop-up window, which provides access to the full list of layers. One or more layers may be chosen to be added to or removed from the map. All layers loaded are automatically displayed in the map. Tools to navigate and query the layers within the map area include zoom-in, zoom-out, zoom to full extent, re-centre and feature query. These tools can be selected from the toolbar available underneath the map.
It is not appropriate to view together layers generated at very different scales without the pos-sibility of misinterpretation by the user. Therefore, scale factor limits are associated with each layer in the Atlas display, so that when a user zooms in on an area, certain layers are turned off if the data are being viewed at a scale inappropriate to the level of detail in the layer (von Meyer et al., 1999). The data owner who supplies each dataset specifies which of its attributes can be viewed. The attribute table opens in an external window when the user clicks on a specific feature after selecting the feature query tool from the toolbar.
The attributes for the features in all layers directly below the point clicked are displayed. This was deemed to be more user- friendly than having to activate a specific layer in order to view its attributes. In some cases, the feature attributes contain a link to live data feeds (e.g., marine data buoys, webcams).
One of the innovative areas of the MIDA is the information area (see Figure 3) that provides access to additional functionality. From the “search” tab a basic and advanced search facility allows users to search for specific layers based on combinations of title, keyword, theme, region, downloadable da-taset and a defined geographical area. The “links” tab provides a list of links to specific areas of the site. The “zoom to” tab allows users focus on a specific marine or terrestrial region or a specific subject theme (e.g., marine safety) by loading only those layers having a keyword associated with that region or theme. The “information” tab provides access to thematic information, metadata and the digital spatial data itself in cases where the data is freely downloadable.
Thematic Information
A brief description of the thematic content and a relevant photograph or image is provided for each data layer via the information tab. Currently 62 of the spatial layers are linked to specific additional thematic information in the MIDA InfoPort, which can be accessed directly from the information tab or via the Information link on the main Atlas page. The InfoPort is a repository of text, imagery, links to spatial data sources and additional reference material for a wide range of topics under the four main sections of the data hierarchy. In this regard the MIDA follows the approach of traditional, printed atlases, which provide descriptive information in addition to thematic maps. Each section has a brief descrip-tion of the thematic areas addressed in the specific topic information pages within that sub-section.
Figure 3. The main atlas page of the Marine Irish Digital Atlas illustrates the map and toolbar, layer/legend area and the information area

111
Ireland
As shown in Figure 4 each information page has five tabs providing access to:
• Overview – This is a short introduction to the specific thematic topic.
• Details – This section presents the key aspects of the topic, organized under a number of headings to which the user can navigate. Images, tables and links to map views of relevant layers within the MIDA web GIS are provided.
• Data Sources – These are links to spatial data resources that are pertinent to the thematic topic. The spatial data may be in the MIDA itself or available via external websites.
• Links – These provide access to additional information and allow users explore a top-ic in more depth.
• References – This is a list of the documents and sources consulted in compiling the in-formation page.
Each page is reviewed by an expert in the thematic area to ensure that the key information is complete and correct. The material is written so as to be accessible to and understandable by a wide audience whilst also being of relevance to specialists and professionals.
Metadata Display
In many web GIS applications metadata presenta-tion is less than ideal. Long and extensive records, using the implemented standard’s hierarchy, ele-ment names, technical terminology and structure are displayed. For users with limited familiarity with metadata, this can be incomprehensible and off-putting. Indeed, it can be difficult for users to find the basic information required on the dataset. For the purpose of the MIDA it was decided that metadata should be presented in a user-friendly and easy to follow manner. XSLT style sheets were used to display the XML encoded discovery metadata as HTML. Elements which are obliga-
Figure 4. Via the InfoPort users can access thematic information, images, links to spatial data sources and additional reference material for a wide range of coastal and marine topics

112
Ireland
tory in the implementation of the ISO metadata standard but deemed to be of little interest to the general user (e.g., metadata language, character encoding) are not displayed although they are available in the XML. Moreover a tiered approach to viewing the metadata was adopted in order to enhance usability. Three tiers or levels of metadata may thus be viewed in the MIDA:
• Abstract Metadata: This is a succinct description of each dataset. It is the first level that users see when they choose to view the metadata for a particular layer. Five elements (title, abstract, geographical extent, owner, publication date) are simply extracted from the Discovery Metadata da-tabase and displayed. There is a link to the complete Discovery Metadata if users wish to view more information.
• Discovery Metadata: This contains all the metadata elements defined in the cus-tomised ISO profile for each dataset. It forms the main catalogue of the Atlas and may be queried. Appendix B lists and de-fines the elements that form the Discovery Metadata. If the user wishes to see more information, a link to Full Metadata is available.
• Full Metadata: This may be provided by the data owner who contributes the dataset. The format, detail and quality of the meta-data are the data owner’s responsibility and it is displayed as supplied. Full metadata is available for 82 of the over 140 data layers.
FACILITATING DIFFERENT USER-GROUPS
One of the MIDA developers’ main intentions was to cater for a broad audience, which would enable professionals, students and casual visitors to find coastal and marine data and information of interest. In order to attract and facilitate such a wide range of user groups, the team developed a
number of options to access and search the Atlas. A tutorial, which can be opened from the Atlas start page, was developed to help fist time visitors understand the various ways of using the atlas and it demonstrates the different search options to access specific data layers and information.
A list of all the spatial data layers in the At-las, which can be accessed from the home page, provides an immediate but extensive overview for first time and casual MIDA visitors. A more controlled exploration of data is possible by using the “add/remove layer” button in the Layer/Legend area (see Figure 3) of the Atlas interface. Here the datasets are organized in pre-grouped themes.
The MIDA search facility was developed with the professional user in mind. The tool provides search options on dataset title, keyword, theme, region or by downloadable datasets. An advanced search tool (Figure 5) permits selection of a com-bination of these options in addition to selection of geographical area. The search results are pre-sented in a table (Figure 5) providing a summary paragraph on the data. The table provides direct links to the data, metadata, and additional thematic information (if available).
To support research on coastal and marine top-ics, the MIDA InfoPort (see Figure 4) provides a good starting point for a number of thematic areas. This could be of particular value to students when researching associated subjects. In addition the student can use the InfoPort to view relevant spatial datasets available in the MIDA via in-built links in the information page of interest. It also provides links to external web sites holding related spatial data via the data sources tab. In addition the links tab of the InfoPort lists and links to web sites that can support further research of the thematic information in question.

113
Ireland
PUBLICITY AND ATLAS USAGE
Workshops
A workshop which targeted some key user groups and potential data contributors was held in Dublin in December 2003 to demonstrate the MIDA pro-totype. The feedback was used in design changes for the version of the MIDA released in May 2005. Following the release three workshops were held in different locations around the country. The main aims of these were to raise awareness and publi-cize the Atlas as well as get additional feedback to aid ongoing development of the MIDA. Each workshop was attended by approximately twenty people representing a typical cross-section of users. The attendees had the opportunity to work with the Atlas and had to carry out a number of tasks specified by the workshop facilitators. Both written and oral feedback was gathered. The “one-stop-shop” nature of the Atlas was identified as a key benefit by many participants. Feedback proved to be very useful in tailoring certain aspects of the Atlas. For example a number of participants expressed interest in spatial data for specific ad-ditional themes; as of June 2009 over 85% of those themes suggested contain spatial information.
Publicity
The Atlas was promoted at both national and in-ternational specialist conferences. Initially articles were written for a number of popular publications in the marine domain which are distributed in Ireland and Britain. To enable quick and easy dissemination of MIDA news and to raise the profile of the resource an email list of those with an interest in the coastal and marine environ-ment and web GIS developments was compiled. Furthermore an Atlas brochure was published and distributed widely. A specific email address ([email protected]) was set up when the Atlas went online so that users could send queries and com-ments to the MIDA team. This has been less used than expected with just over 50 emails received since June 2005. Most have been requests for data or information not included in the Atlas whilst others have been questions on specific data layers or technical aspects of the Atlas. In addition there have been many positive comments on the Atlas.
The Atlas was officially launched by the President of University College Cork during the Coastal Mapping and Informatics Trans-Atlantic Workshop held in Cork in July 2006. This gener-ated significant media interest and led to articles
Figure 5. The advanced search tool within the MIDA and the results of a search presented in an infor-mative scroll down table

114
Ireland
being published in the national and regional press. Furthermore, through all the ICAN Workshops and the Network’s outreach work, the MIDA has become known as a good example of Coastal Web mapping to an international audience. MIDA statistics show external links to the MIDA are incorporated in at least 40 web sites, while there are dozens of references to the Atlas in various online documents and publications (e.g., González Del Campo, 2009; IWEA, 2008; CSA Group/Circa Group/Swiftsure, 2005).
Usage
Figure 6 shows usage statistics for the Atlas since June 2006. The publicity associated with the offi-cial launch in July 2006 led to an increase in visits to the Atlas which was sustained for about three months, visits thereafter reducing somewhat. No additional significant publicity events have been carried out since July 2006 but with approximately six hundred unique visitors per month, the MIDA is proving to be a relevant and popular resource.
A further analysis of the 2008 MIDA user statistics confirmed that most Atlas visitors were from the Republic of Ireland, followed by visi-tors from the UK and the USA. High UK interest was expected as the MIDA was a cross border collaboration featuring island-wide datasets as well as some specific Northern Irish data layers.
The 2005 workshop participants stated that the most appealing aspects of the MIDA included the amount of data in one site as well as the download-able data layers and metadata records. The 2008 MIDA statistics showed that of the 53 data layers that were directly downloadable from the Atlas, the most popular were from the socio-economic activity section, specifically water-based recre-ation. Three of the five most popular downloads in 2008 belonged to the sub-section of water based recreation:
1. The Blue Flag Beaches in the Republic of Ireland,
2. The Blue Flag beaches in Northern Ireland,3. The Location and relevant information of
Marinas and Pontoons on the Island of Ireland,
4. A MODIS Satellite Image of Ireland,5. The Territorial and Fisheries Limits of the
Republic of Ireland.
The keen interest in spatial data regarding water based recreation, as shown by the MIDA visitor statistics, indicate that this type of information was not readily available elsewhere for the Island of Ireland, therefore supporting the decision of the MIDA team to create such layers in-house.
The MIDA is used in teaching on a number of courses organized by the department of Geography
Figure 6. Number of unique visitors to the MIDA and visits per months since June 2006

115
Ireland
within UCC. Technology and web GIS aspects are presented in GIS courses and many students use the Atlas as a resource for their research in coastal management related courses. Furthermore, since 2004, the CMRC facilitates work experience for trainees through the Atlas developing skills in web mapping and GIS and data and metadata manage-ment. Trainees improve their writing skills through work on the information pages, which also raises their awareness of coastal and marine concerns. To date nine trainees from five different countries have joined the MIDA team on placements that last from three to twelve months. Most of these placements were funded through the European Union’s Leonardo da Vinci vocational training program. Local students and secondary school transition year students on shorter term place-ments with the CMRC have also worked on the MIDA. Feedback given by the students indicates that MIDA is utilized as a tool by teachers in some secondary schools.
The Marine and Coastal Heritage Directory (http://www.coastalheritage.ie/), developed by the Heritage Council features text and imagery related to Ireland’s coastal heritage. Links from the directory to specific spatial data layers within the MIDA are used to illustrate the text within this
Directory. Such collaborations help to expand the user community for the Atlas.
THE ATLAS SYSTEM: A DEVELOPER PERSPECTIVE
Selection of Web GIS Software
Visualization and overlay of the many data layers on a map within a web browser was one of the key objectives of the MIDA. Therefore, a web mapping software package had to be selected. Two were evaluated: ESRI ArcIMS and University of Minnesota MapServer. Table 1 presents the main advantages and disadvantages of each system. MapServer was chosen as the most appropriate solution as display and navigation of layers rather than elaborate processing were sufficient for the Atlas; significant programming experience was available with the CMRC and the absence of a license fee made it a more low-cost, long-term solution.
Data and Metadata Preparation
As the number of data layers to be included in the MIDA was in the hundreds, a geospatial database
Table 1. Advantages and disadvantages of the ESRI ArcIMS and the Minnesota MapServer
ESRI ArcIMS Minnesota MapServer
Advantages Advantages
“out of the box” web GIS Non-proprietary technology
High level of built-in GIS functionality No licensing fees
Large user base Large community of users
Good online support Simple configuration structure
Integrated metadata server
Disadvantages Disadvantages
Significant cost Not “out of the box” web GIS
Proprietary technology Limited GIS functionality
Complex configuration structure Require programming skills to build and customise web GIS
Require programming skills for customization Lacks integrated metadata system

116
Ireland
was considered unnecessary. Instead, standard file formats are used. Shapefiles store vector data and GeoTIFF store imagery/raster data. Data prepara-tion principally involved conversion, cleaning, reprojection, tiling and attribute table editing. Most data preparation tasks were carried out in ESRI ArcGIS. However, for certain operations that enhanced MapServer performance other tools were employed. For example, the open source utilities gdaltindex was used for tiling large raster layers and shptree for optimizing vector display.
Metadata forms an integral part of the MIDA by consistently documenting each dataset held. Although no national metadata standard existed in Ireland at the project’s outset, many key or-ganizations that handle spatial data have been adopting ISO 19115 in view of its inclusion as the standard of choice in the implementation of the European Union’s INSPIRE Directive (Euro-pean Union 2007). After a review of a number of metadata standards, and taking into account the limited availability of metadata associated with spatial data in Ireland, it was decided to devise a customized profile of the ISO 19115 standard for the MIDA. A total of 55 elements were selected as the Discovery Metadata for each layer in the Atlas (see Appendix B). These included all elements defined as obligatory in the ISO standard and a number of optional ones believed to be necessary in order to have a minimum acceptable amount of information for each dataset. This metadata was saved in Extensible Markup Language (XML), using the Short Names defined in the ISO 19115 as tags (ISO 2003). ISO 19139 tags were not used as this standard had not yet been released when this phase of the project was undertaken.
A number of metadata entry tools available at the project’s outset, such as the ESRI ArcCatalog ISO wizard, M3Cat™ (http://www.intelec.ca/html/en/technologies/m3cat.html), Enraemed (http://geoinfo.uneca.org/geoinfo/ethiopia/enraemed.html) and the ANZLIC Metadata Collector (http://www.walis.wa.gov.au/anzlic_met_project) were reviewed but were not deemed suitable for
MIDA metadata collection. Therefore a custom-ized, HTML web-enabled, data entry wizard was designed and implemented in order to ease the task of Discovery metadata collection and entry. This wizard was developed using HTML, JavaS-cript and JavaServer Pages (JSP) technologies. Metadata were entered in a sequence of HTML forms. Once submitted they were saved on the web server in a flat XML document. The MIDA administrator collected this metadata, reviewed it, and registered it, in the MIDA system. An XSLT (Extensible Stylesheet Language Transformation) stylesheet was created in order to visualize the XML metadata in HTML.
ESRI’s ArcCatalog was used to help the MIDA team with management of the datasets included in the Atlas. This system was separate from the Discovery Metadata described above. ArcCatalog provided a way of recording details vital for data management and update, such as when and how data from external organizations were acquired and what modifications were made in order to display those datasets in the Atlas. When the project started only a limited profile of ISO ele-ments was available within ArcCatalog therefore the more complete and extensive FGDC (Federal Geographic Data Committee) standard was chosen for the management of metadata.
The MIDA Prototype
The MIDA prototype consisted of the main Atlas page (including the map and toolbar, the layer/legend area and the information area), and the InfoPort page. The technologies used were HTML, JavaScript and MapServer, running in CGI (Com-mon Gateway Interface) mode. It was deployed within the Apache web server in a Linux Operat-ing System. This prototype was inherently static, which led to update and maintenance problems. In order to incorporate a new layer, the MIDA administrator needed to edit the HTML code manually, and register the layer both in the layer/legend area, and the information area. Another
117
Ireland
problem was the system’s inability to perform dynamic searching for datasets using metadata elements. In order to overcome these problems the ‘MIDA Engine’ was conceived.
The MIDA Engine
The “MIDA Engine” is a customized mini content management system (CMS) designed to handle the main Atlas page. At the time of the develop-ment, no operational framework for implement-ing MapServer web GIS applications existed. Although generic frameworks such as CartoWeb (http://www.cartoweb.org/), Mapbender (http://www.mapbender.org/) and Openlayers (http://openlayers.org/) now exist, they still require customizations to meet specific web GIS devel-opment needs. The “MIDA Engine” consisted of three main components: the map and toolbar, the layer/legend area and the information area. The content for these components was entered into two database tables which interact with MapServer’s main configuration file (known as the mapfile). One table dynamically controls the layer/legend area. It contains layer information such as the filename, keywords and location of downloadable data among others. This structure facilitates user data search. The full XML metadata for each layer is also stored in this table. Currently each new metadata record must be manually uploaded to the database by the MIDA administrator, but there are plans to automate and streamline this process. The other table contains: information theme title; a brief description of the thematic content of the layer; a photo/image and a caption.
The “MIDA Engine” is principally imple-mented using PHP (hypertext preprocessor) and MapServer’s MapScript/PHP module. MapScript provides a scripting API (application program-ming interface) to MapServer which enables a programmer to extend/customize MapServer’s default functionality contained in the CGI version. MapScript supports programming languages/environments including PHP, Python, Perl, Ruby,
Java, and .NET. PHP was chosen because it is the best supported MapScript module and it is also used in frameworks such as CartoWeb and Mapbender. The PHP code controls the Atlas functions including layer display and overlay, the zoom extent, watermarking and attribute display.
When a user queries a vector feature in the map, its attributes are displayed. For this the CGI version of MapServer requires that HTML templates are created for each dataset. As this is a cumbersome task, the “MIDA Engine” uses PHP code to register a layer’s attributes in the mapfile and control their display in a pop-up window.
The MIDA search facility is implemented via SQL queries on the two database tables described above. The “MIDA Engine” can connect to any RDBMS (relational database management system) database supported by PHP; in this case the open source database PostGreSQL is used.
The MIDA Engine Legacy
The “MIDA Engine” has proven to be a robust platform which can be deployed on both UNIX and Windows platforms. It has provided excel-lent added value as it has been used to support other initiatives requiring web GIS portals. For example, the European Commission, Framework Program 6, funded InterRisk project which pro-vided tools for management of marine pollution events (Hamre et al., 2009) and the Interreg III A funded IMAGIN project which studied sustain-able aggregate exploitation in the Irish Sea (O’ Mahony et al., 2008) have both used the “MIDA Engine.” As neither project required a dynamic database search facility, the “MIDA Engine” was deployed without an RDBMS and used dynamic layer management via the mapfile directly. More-over, as the “MIDA Engine” uses MapServer, it automatically supports OGC (Open Geospatial Consortium) technologies including WMS (Web Map Service), WFS (Web Feature Service) and WCS (Web Coverage Service), as demonstrated in InterRisk. In early 2009 an agreement was reached

118
Ireland
with the National Institute of Marine Sciences and Technologies (INSTM), Carthage, Tunisia to use the “MIDA Engine” in the development of a Tunisian Marine Atlas (Y. Lassoued, pers. comm., 2009).
There is a need for constant innovation in web GIS data presentation and management in order to meet the expectation of users. New open source technologies such as OpenLayers are being investigated in order to enhance the user interface. With regard to metadata management, as part of the ICAN semantic interoperability initiative, selected MIDA metadata records have been transposed into the open source GeoNetwork metadata management system, which supports the ISO 19115/19139 metadata standards and the CSW (Catalogue Services for the Web) standard (described elsewhere in this book). This will im-prove metadata management and interoperability with data sharing initiatives.
DISCUSSION
An Assessment of the MIDA
The MIDA has met its primary goal as a key access point for spatial data and information on Ireland’s coastal and marine areas for a broad audience. The user statistics confirm that the Atlas is constantly visited attesting to its relevance and usefulness. Recognizing that the Atlas is an extremely valuable resource for the coastal and marine community, the CMRC maintains the Atlas from its own re-sources, since the initial development concluded in 2007, when the project funding period ended. Overcoming difficulties and finding solutions to problems that emerged early in Atlas development have equipped the MIDA team with experience and skills that are invaluable in maintaining and enhancing the Atlas. The use of the ‘MIDA En-gine’ in other national and international initiatives requiring web GIS portals illustrates the added value of the project as it highlights the technical
skills within the Centre which in turn has led to additional project work.
The MIDA team was able to overcome initial obstacles concerning data licensing agreements and cost but will have to continuously address these issues, adopting new solutions that will benefit the data owners and the Atlas simultaneously. The lack of data catalogues and the non-existence of metadata for most layers, except for a few institu-tions was a major barrier. Almost all the Discovery Metadata had to be compiled by the development team. This often involved phone calls with the data providers in order to collect a minimum of information on the datasets. New developments such as the European INSPIRE Directive should lead to an improvement in coastal and marine data documentation and discovery ability. The requirement to provide metadata with all spatial data generated by public bodies should not only benefit existing CWAs such as the MIDA but aid new CWA developments in Europe. Initial MIDA data classification and organization has proven to be extremely useful and has developed into a strong data classification system. However, a shortcom-ing of the Atlas from a developer’s perspective is the lack of a streamlined and automated data management system. MIDA metadata entry and update is currently a time consuming process but the emergence of GeoNetwork and other data management tools now offer the possibility for improved and more streamlined metadata manage-ment and can also enhance interoperability within distributed systems.
The MIDA has proven to have numerous uses from providing data and information to differ-ent end-user groups to being a valuable training resource for skills in web mapping, data and metadata management. Throughout the design and development phase MIDA developers consulted a representative cross-section of end-users. Such consultation is vital in CWA development as end-user input can ensure that the atlas meets their needs. Face-to-face meetings are more effective than anonymous web-based surveys as a means

119
Ireland
of gathering feedback. In addition to keeping the atlas up to date, sustained promotion and publicity is vital for any CWA in order to raise awareness and attract new users. Analysis of the Atlas usage statistics has highlighted the most popular aspects of the Atlas and is informing ongoing develop-ment work. Furthermore, the MIDA is useful with regard to the implementation of Integrated Coastal Zone Management and the emergence of Marine Spatial Planning initiatives as supported by the proposed Integrated Maritime Policy for Europe (Commission of the European Communi-ties 2007). As the Atlas allows the visualization of multiple data layers from a wide range of sectors it can help inform marine and coastal planners and managers. Although it is not a decision support tool, access to the data and information that can form the basis for such tools is provided. It also complements the European Atlas of the Seas which is being developed by the European Commission (Commission of the European Communities 2007)
Challenges
A major challenge for any atlas developer and the current MIDA team is the on-going financing of the atlas. Research funds are often available for the development of new and innovative solu-tions. However, it is more difficult to get funding for the maintenance of existing tools. There is a need for constant innovation to keep the Atlas relevant. Advances in the display of spatial data in environments such as Google Earth (http://www.openioos.org/real_time_data/gm_sos.html) and Google Maps (e.g., http://marinemap.org/marinemap/) raise expectations of web GIS users concerning the look and feel of such applica-tions. The MIDA team needs to address not only maintenance but also updates to develop a new technology interface as well as a data management system. Furthermore these updates have to take into consideration people with limited knowledge of GIS functionality, who have found it somewhat difficult to operate the current interface. However
these challenges also offer opportunity for techni-cal innovation and therefore the ability to target appropriate funding programs.
It is important to keep the Atlas in the public eye and to engage in ongoing publicity and pro-motion. This will be an ongoing challenge but also creates opportunities to address other issues such as funding. It is imperative that the data and information in the Atlas are kept up to date and that new data are constantly added. Many such initiatives fail because web-sites are not updated once the initial projects which brought them into being are concluded. The CMRC has assured the MIDA’s future by dedicating resources to maintain it. Moreover active participation in initiatives such as ICAN provides constant exposure for the Atlas and a stimulus to undertake additional development work.
Future Developments
With advances in technology and CMRC expertise gained through the MIDA and related projects the potential exists to develop a new technology interface and data management system. New open source technologies such as OpenLayers for data visualization and GeoNetwork for metadata management will be investigated in order to en-hance the system. This could provide the requisite funding to update the technological aspects of the Atlas as well as resources to address ongoing issues with regards to data acquisition and maintenance. Efforts will be made to complete the InfoPort therefore strengthening the thematic aspects of the Atlas. Ideas for further development of the Atlas include a tiered approach to address the needs of different audiences. For example, the MIDA team has evidence that the Atlas is sporadically used in some schools to aid teaching. Creating a tailored version to compliment the secondary school geography curriculum for use by both teachers and students would not only fulfill the MIDA potential as a teaching tool but also raise awareness and profile of the resource in general.

120
Ireland
Other ideas include a second tier targeting tourism and recreation and a third tier for professionals, designed with advanced mapping tools for use in coastal management and spatial planning.
Since the MIDA project began, there has been significant progress in interoperable solutions and the development of OGC standards to facilitate the sharing of geospatial data and metadata. Indeed the CMRC together with the Marine Institute, the Environmental Protection Agency (EPA) and the Department of Communications, Energy and Natural Resources (DCENR) have set up the Irish Spatial Data Exchange (http://www.isde.ie). This Exchange enables the sharing of metadata from these institutions’ online catalogues across a distributed network. The MIDA is using open source solutions whilst the other partners are using proprietary tools from ESRI, however with the use of CSW and ISO standards, it is possible to share the metadata seamlessly. The next step will be to expand the efforts to include the seamless display of spatial data within each portal’s web GIS. This will allow access to the data source instead of potentially outdated versions on indi-vidual servers. As part of the ISDE network, the ability to implement WMS and potentially WFS/WCS will be investigated further.
On an international level, as presented in Chap-ter 4, the MIDA is one of the nodes of the ICAN global atlas prototype which is testing semantic interoperability between two coastal web atlases. This work is currently incorporating additional nodes and extending OGC services to include CSW and WMS. This project is relevant in regard to the emerging EU Integrated Maritime Policy, in which the need for data and infrastructure is highlighted as well as awareness raising tools such as the European Atlas of Seas. Interoperability approaches and coastal web mapping in general are innovations that can facilitate those visions on a very practical level.
CONCLUSION
The MIDA is facilitating better sourcing of and improved access to spatial data in Ireland and will continue to do so with ongoing maintenance assured by CMRC. Usage statistics illustrate that the site is in constant use and that many of the accessible data layers are being downloaded. The Atlas has also been extremely valuable as a tech-nology demonstrator as acknowledged by its use in other web GIS initiatives including the ICAN semantic interoperability prototype. However, ongoing development is crucial to the MIDA’s long term survival. Funding, technology and data management issues all need to be addressed. The MIDA’s key driving role in regard to developing catalogue and atlas interoperability on a national and international level offers new opportunities for advanced deployment and future development of the Atlas.
ACKNOWLEDGMENT
This work was funded for the period September 2002 – August 2005 by the Higher Education Au-thority (HEA) of Ireland under the third Program for Research in Third Level Institutions (PRTLI 3) Program as part of the National Development Plan 2002 – 2006. Additional funding was received from the Environment and Heritage Service, Northern Ireland. The authors would like to thank Ciara Herron, Didac Perales, Juan Arévalo, Carlo Brondi, Iban Ameztoy, Kristel Coutel, Natasha Faucher, Diego del Villar, Paula Domingo, and Yvette Harrington for their contributions to the MIDA development. Furthermore we are grateful to all those who provided feedback on the MIDA at the various workshops and other events organized around the project.

121
Ireland
REFERENCES
Bartlett, D. J. (1999). Working on the Frontiers of Science: Applying GIS to the Coastal Zone . In Wright, D. J., & Bartlett, D. (Eds.), Marine and Coastal Geographical Systems (pp. 11–24). London: Taylor & Francis.
Commission of the European Communities. (2007). Communication from the commission to the European parliament, the Council, the Eu-ropean economic and social committee and the committee of the regions- An Integrated Maritime Policy for the European Union, COM(2007) 575 final.
CSA Group/Circa Group/Swiftsure. (2005). An Assessment of the optimal use and application in the immediate to long term future of the Irish Na-tional Seabed Survey Deliverables to Date (Phase 1) and to contribute towards the development of phase 3. Retrieved June 29, 2009, from Infomar website: http://www.infomar.ie/documents/As-sessment_of_the_INSS.pdf
Department of Environment, Food, and Rural Affairs. (2002). Delivering Integrated Marine Mapping for the UK: Report of DEFRA-funded workshop held at Church House, London, 11 Sep-tember 2002, compiled by F.L. Franklin, DEFRA, Burnham Laboratory.
Dwyer, N., O’Dea, L., & Cummins, V. (2003). The Marine Irish Digital Atlas: a Web Portal to Coastal and Marine Data in Ireland. Paper presented at CoastGIS 2003, Genova, Italy. Retrieved June 24, 2009, from MIDA website: http://mida.ucc.ie/assets/documents/ MIDA_CoastGIS2003.pdf
European Union. (2003). Directive 2003/98/EC of the European Parliament and of the Council on the re-use of public sector information. Official Jour-nal of the European Union. L&C, L345(90), 46.
European Union. (2007). Directive 2007/2/EC of the European Parliament and of the Council establishing an Infrastructure for Spatial Infor-mation in the European Community (INSPIRE). Official Journal of the European Union. L&C, L108(1), 50.
González Del Campo, A. (2009). Current Practice and Potential on the Application of Geographic Information Systems as a Support Tool in Strate-gic Environmental Assessment of Irish Land Use Plans. GISEA Manual – Consultation Draft (1st April 2009). Ireland: Environmental Protection Agency.
Hamre, T., Krasemann, H., Groom, S., Dunne, D., Breitbach, G., & Hackett, B. (2009). Interoperable web GIS services for marine pollution monitoring and forecasting. Journal of Coastal Conservation, 13, 1–13. doi:10.1007/s11852-009-0046-y
International Organization for Standards (ISO). (2003). International Standard ISO 19115, geo-graphic Information. Metadata.
IWEA. (2008). Best Practice Guidelines for the Irish Wind Energy Industry. The Irish Wind En-ergy Association and Sustainable Energy Ireland. Retrieved from http://www.iwea.ie
Mahony, O. C., Sutton, G., McMahon, T., O’Cinneide, M. & Nixon, E. (2008). Issues and Recommendations for the Development and Regulation of Marine Aggregate Extraction in the Irish Sea. Galway, Ireland: Marine Institute.
McCormack, B. (2003). Irish Spatial Data Infra-structure, paper presented at Irish Organization for Geographic Information (IRLOGI) 2003 Conference, Dublin, Ireland. Retrieved June 24, 2009, from IRLOGI website: http://www.irlogi.ie/pdf/ISDI_IRLOGI_2003.pdf

122
Ireland
O’Dea, L., Cummins, V., & Dwyer, N. (2004). Developing an Informational Web Portal for Coastal Data in Ireland: Data Issues in the Marine Irish Digital Atlas. Paper presented at Oceanology International London 2004, 18 March, London, UK. Retrieved June 24, 2009, from MIDA website: http://mida.ucc.ie/assets/documents/oceanol-ogy2004_mida.pdf
O’Dea, L., Cummins, V., Wright, D., Dwyer, N., & Ameztoy, I. (2007). Report on Coastal map-ping and Informatics Trans-Atlantic Workshop 1: Potentials and Limitations of Coastal Web Atlases. University College Cork, Ireland. Retrieved June 24, 2009, from ICAN website: http://workshop1.science.oregonstate.edu/final_rpt
Von Meyer, N., Foote, K. E., & Huebner, D. J. (1999). In Information Quality Considerations for Coastal Data. In D.J. Wright & D. Bartlett (Ed.), Marine and Coastal Geographical Systems (pp. 295-308). London: Taylor & Francis.
KEY TERMS AND DEFINITIONS
Coastal Web Atlas: A collection of digital maps and datasets with supplementary tables, illustrations and information that systematically illustrate the coast, oftentimes with cartographic and decision support tools, all of which are ac-cessible via the Internet.
Atlas Interoperability: The ability to inter-rogate two or more unrelated atlas systems and potentially exchange metadata, images, vector and raster data.
Coastal and Marine Information: Both spatial and non-spatial information regarding the coastal and marine areas of a region or country.
Integrated Coastal Zone Management: A dynamic, multi-sectoral approach to managing the coast which takes into account social, economic and environmental concerns of all parties with an interest in the coastal space.
Ireland: European Island in the Northeast Atlantic.
Metadata: Metadata in the geographical do-main is structured information on a dataset, which helps the data owner to document and catalogue the data, whilst helping a data user to understand the content and fitness for use of a dataset.
MIDA: Marine Irish Digital Atlas.Spatial Data Visualization: The ability to
view digital data with a spatial dimension in a computer environment containing a coordinate reference system.
Web GIS: A geographical information system which can be accessed over the Internet and allow visualization and interaction with spatial data via a map as well as providing analysis functionality such as spatial analysis, querying and buffering.

123
Ireland
APPENDIX A
Data layers currently contained in the Marine Irish Digital Atlas organized by the four main categories
Table 2. Management
First Category: Management
Name Description Owner
AONB Areas of Outstanding Natural Beauty Environment and Heritage Service Northern Ireland (EHSNI)
ASSI Areas of Special Scientific Interest Environment and Heritage Service Northern Ireland (EHSNI)
Biosphere ReservesUNESCO sites to promote solutions to rec-onciling conservation of biodiversity with sustainable use.
Coastal and Marine Resources Centre (CMRC)
Border Border of the Rep. of Ireland Environmental Protection Agency (EPA), Ordnance Survey Ireland (OSI)
Celtic Sea Cod Spawning Box Location of Cod restriction area Coastal and Marine Resources Centre (CMRC), European Commission
Coastline Coastline of IrelandOrdnance Survey Ireland (OSI); Global Self-consistent, Hierarchical, High-resolution Shoreline Database (GSHHS)
Country Parks Country Parks of Northern Ireland Environment and Heritage Service Northern Ireland
Clár Areas Rural areas targeted for investment National University of Ireland Maynooth (NUIM)
Current PAD Authorizations The current exploration authorizations given by the Petroleum Affairs Division (PAD)
Department of Communications, Energy and Natural Resources (DCENR)
Hydro-chemical propertiesStation sites. North of Ireland Joint Agency Coastal Monitoring Programming (NI-JACMP).
D e p a r t m e n t o f A g r i c u l t u r e a n d Rura l Development (NI) / Agr i -F o o d a n d B i o s c i e n c e s I n s t i t u t e (AFBI)
High & Low Watermarks High & Low Watermarks Ordnance Survey Ireland (OSI)
ICES areas ICES fishing blocks International Council for Exploration of the Sea (ICES)
Irish Conservation Box Irish Conservation Box Coastal and Marine Resources Centre (CMRC), European Commission
Gaeltacht Boundaries Gaeltacht Boundaries GAMMA company
MNR Marine Nature Reserves Environment and Heritage Service Northern Ireland (EHSNI)
National Monuments National Monuments in state care National Parks and Wildlife Service (NPWS)
National Parks National Parks National Parks and Wildlife Service (NPWS)
NHAs Natural Heritage Areas National Parks and Wildlife Service (NPWS)
Nature Reserves Statutory Nature ReservesNational Parks and Wildlife Service (NPWS), Environment and Heritage Service Northern Ireland (EHSNI)
Outline NI Coastline and border of Northern Ireland Ordnance Survey of Northern Ireland (OSNI)
continued on following page

124
Ireland
Table 3. Physical environment
First Category: Physical Environment
Name Description Owner
450,000 base map 1:450,000 base map image Ordnance Survey Ireland (OSI)
50,000 Webmap 1:50,000 OSI Webmap images (coastal tiles only) Ordnance Survey Ireland (OSI)
Bathymetry GEBCO vector and gridded bathymetry Natural Environment Research Council (NERC)
Bedrock Geology 1:500,000 bedrock geology map Geological Survey Ireland (GSI)
First Category: Management
Name Description Owner
Petroleum Licensed Blocks License Blocks designated by the Petroleum Affairs Division (PAD)
Department of Communications, Energy and Natural Resources (DCENR)
Ports Commercial and Ferry Ports Coastal and Marine Resources Centre (CMRC)
Ramsar Sites Wetlands of international importanceNational Parks and Wildlife Service (NPWS); Environment and Heritage Service Northern Ireland (EHSNI)
Regions Local Authority Regions of the Republic of Ireland
Environmental Protection Agency (EPA), Ordnance Survey Ireland (OSI)
River Basin Districts River Basin Districts for the Water Frame-work Directive Environmental Protection Agency (EPA)
Rockall Haddock Box Location of Fishery Protected Area Rockall Haddock Box
Coastal and Marine Resources Centre (CMRC), European Commission
SACs Special Areas of Conservation (NATURA 2000)
National Parks and Wildlife Service (NPWS); Environment and Heritage Service Northern Ireland (EHSNI)
SLNCI Sites of Local Nature Conservation Impor-tance
Environment and Heritage Service Northern Ireland (EHSNI)
SPAs Special Protection Areas (NATURA 2000)National Parks and Wildlife Service (NPWS); Environment and Heritage Service Northern Ireland (EHSNI)
Straight Baselines Irish Straight baselines Irish Naval Service (INS)
Territorial limits Location of 6,12 and 200 nautical mile limits Irish Naval Service (INS)
Towns Towns over 2,000 people (1995) Environmental Protection Agency (EPA); Ordnance Survey Ireland (OSI)
Water Quality Bathing Water QualityEnvironmental Protection Agency (EPA); The Northern Ireland Environment Agency (NIEA)
Whitefish Restriction Area Location of Whitefish Restriction Area Coastal and Marine Resources Centre (CMRC), European Commission
World Heritage Sites World Heritage Sites on the island of Ireland Coastal and Marine Resources Centre (CMRC)
Table 2. continued
continued on following page

125
Ireland
First Category: Physical Environment
Name Description Owner
Coastal Geology Coastal protection classified in the European EUrosion Project European Environmental Agency (EEA)
Coastal Geomorphology Coastal protection classified in the European EUrosion Project European Environmental Agency (EEA)
Coastal Defense Works Coastal protection classified in the European EUrosion Project European Environmental Agency (EEA)
Coastal Lagoons Distribution of lagoons Dr. Marinus Otte; Coastal and Marine Re-sources Centre (CMRC)
Coastal Waters Coastal Waters Environmental Protection Agency (EPA)
CORINE Landcover Satellite interpreted landcover for 1990 and 2000
Environmental Protection Agency (EPA); European Environmental Agency (EEA)
CORINE Landcover Change Satellite interpreted landcover change be-tween 1990 and 2000
Environmental Protection Agency (EPA); European Environmental Agency (EEA)
Erosion Trends Coastal erosion trends classified in the Euro-pean EUrosion Project European Environmental Agency (EEA)
General Soil Map General Soil Classification Map Teagasc
General Soil Map of Northern Ireland Soil Classification Map of Northern Ireland at a scale of 1:250,000
Department of Agriculture and Rural Devel-opment (DARD); Agri-Food and Biosciences Institute (AFBI)
Landsat Image LANDSAT Satellite Image of Ireland European Environmental Agency (EEA); Joint Research Centre (JRC)
LaCoast Coastal Land Cover Change between 1975 and 1990
ERA Maptec Ltd; European Environmental Agency (EEA)
LCA Landscape Character Areas Environment and Heritage Service Northern Ireland (EHSNI)
Lifeboat Stations Lifeboat stations Royal National Lifeboat Institution (RNLI)
Lighthouses Lighthouses and other navigational aids Commissioners of Irish Lights
Main Lakes Main Lakes Environmental Protection Agency (EPA)
Main Rivers Main Rivers Environmental Protection Agency (EPA)
Mean Tidal Amplitude Mean Tidal Amplitude classified in the Eu-ropean EUrosion Project European Environmental Agency (EEA)
MODIS Image MODIS Satellite Image National Aeronautics and Space Administra-tion (NASA)
Rainfall Average monthly rainfall grid Met Éireann
River Basins River Basins Environmental Protection Agency (EPA)
Salt marshes Significant salt marshes on the island of Ireland
Coastal and Marine Resources Centre (CMRC); T. Curtis and M. Sheehy Skeffington
Seabed Survey Irish National Seabed Survey - areas surveyed Geological Survey Ireland (GSI)
Sea Level Rise Sea level rise classified in the European EUrosion Project European Environmental Agency (EEA)
Sea Waves Sea wave height classified in the European EUrosion Project European Environmental Agency (EEA)
Table 3. continued
continued on following page

126
Ireland
Table 4. Biological environment
First Category: Biological Environment
Name Description Owner
Brown Crab Brown Crab fishing areas in Northwest and Southwest
Bord Iascaigh Mhara – Irish Sea Fisheries Board (BIM)
Cetacean sightings Cetacean (whales, dolphins, porpoises) sighted in Irish waters
Coastal and Marine Resources Centre (CMRC)
Cockle Cockle fishing areas around Dundalk bay Bord Iascaigh Mhara – Irish Sea Fisheries Board (BIM)
Crayfish Crayfish fishing areas Bord Iascaigh Mhara – Irish Sea Fisheries Board (BIM)
Harbour Seals 1968-2002 (N. Ireland) Harbour Seals sighted in NI CEDaR, Ulster Museum
IBAs Important Bird AreasBirdlife International; Bird Watch Ireland (BWI); Royal Society for the Protection of Birds (RSPB)
Lobster Lobster fishing areas Bord Iascaigh Mhara – Irish Sea Fisheries Board (BIM)
Scallop Scallop fishing areas Bord Iascaigh Mhara – Irish Sea Fisheries Board (BIM)
Shrimp Shrimp fishing areas Bord Iascaigh Mhara – Irish Sea Fisheries Board (BIM)
Table 3. continued
First Category: Physical Environment
Name Description Owner
SPOT Image SPOT (Satellite Pour l’Observation de la Terre) -Satellite Image of Ireland
LANDMAP (a service to provide spatial data to academic users in the UK and Ireland)
SST Average Monthly Sea Surface Temperature (SST) grid
National Aeronautics and Space Administra-tion (NASA)
Stable lights Image of Irish urban areas taken from space National Oceanic and Atmospheric Admin-istration (NOAA)
Submarine Cables Location of underwater cables Coastal and Marine Resources Centre (CMRC); Kingfisher Information Service
Swell Waves Swell wave height classified in the European EUrosion Project European Environmental Agency (EEA)
Tide Gauges Location of tide gauges Coastal and Marine Resources Centre (CMRC)
Topography Shaded Topographic Relief at 50m spatial resolution
ERA Maptec Ltd; Shuttle Radar Topography Mission (SRTM); Coastal and Marine Re-sources Centre (CMRC)
Marine Data Buoys Location of marine data buoys around the island of Ireland
Coastal and Marine Resources Centre (CMRC)
Waves Wave height average classified in the Euro-pean EUrosion Project European Environmental Agency (EEA)
Weather Stations Weather Data Collection Stations Met Eireann; Coastal and Marine Resources Centre (CMRC)
continued on following page

127
Ireland
Table 5. Socio-Economic activity
First Category: Socio-Economic Activity
Name Description Owner
Blue Flag Beaches Blue Flag Beaches An Taisce; Tidy Northern Ireland; Coastal and Marine Resources Centre (CMRC)
Fishing Ports Fishing Port Locations Coastal and Marine Resources Centre (CMRC)
Irish Surfing Association Clubs Members of ISA Irish Sailing Association; Coastal and Marine Resources Centre (CMRC)
Marinas Location of marinas and pontoons around the island of Ireland
Coastal and Marine Resources Centre (CMRC)
Moorings Location of tourist moorings Coastal and Marine Resources Centre (CMRC)
Sailing Clubs Location of ISA affiliated sailing clubs Coastal and Marine Resources Centre (CMRC), Irish Sailing Association (ISA)
Surf Spots Location of Surfing Spots Coastal and Marine Resources Centre (CMRC)
Webcam Location of coastal web cameras Coastal and Marine Resources Centre (CMRC)
First Category: Biological Environment
Name Description Owner
Seaweeds Seaweeds NUI Galway
Seals - Harbor Harbor Seal Distribution
Coastal and Marine Resources Centre (CMRC); National Parks and Wildlife Service (NPWS); Environment and Heritage Service Northern Ireland (EHSNI)
Seals - Grey Grey Seal Distribution Coastal and Marine Resources Centre (CMRC); NPWS
Periwinkles Distribution of significant periwinkle sites Coastal and Marine Resources Centre (CMRC), MI
Whelk Whelk fishing areas Bord Iascaigh Mhara – Irish Sea Fisheries Board (BIM)
Table 4. continued

128
Ireland
Table 6. Description of the 55 elements from ISO 19115 included in the Discovery Metadata
Plain English Description Short Name Definition
Title of the dataset ResTitle Name by which the cited resource is known
Filename of dataset to which this metadata corresponds
ResAltTitle Short name or other language name by which the cited information is known
Brief description, or abstract for the dataset IdAbs Brief narrative summary of the content of the resource
When the dataset was created or published ResRefDate Reference date for the cited resource
See table RefDateType Event used for reference date
Main themes of dataset (see table) TpCat Main theme(s) of the dataset
A list of keywords Keyword Commonly used word ….used to describe the subject
GraphOver A graphic that illustrates the resource
DataLang Language used within the dataset
DataChar Full name of the character coding standard used for the dataset
Use a scale value (e.g., 1:50000) for vector data EquScale Level of detail expressed as the scale of a comparable map or chart
Use pixel spacing (e.g., 30 m) for raster data ScaleDist Ground sample distance
Is it vector, grid, data etc SpatRpType Method used to spatially represent geographic information
Describe which area the dataset covers GeoDesc Description of the geographic area within which data is available
What area does the data set cover ExDesc Spatial and temporal extent for the referring object
Name of the projection system used RefSysId Name of reference system used
Western most coord in lon WestBL Western-most coordinate of the limit of the dataset extent, expressed in longitude in decimal degrees (positive east)
Eastern most coord in lon EastBL Eastern-most coordinate of the limit of the dataset extent, expressed in longitude in decimal degrees (positive east)
Southern most coord in lat southBL Southern-most coordinate of the limit of the dataset extent, expressed in latitude in decimal degrees (positive north)
Northern most coord in lat northBL Northern-most coordinate of the limit of the dataset extent, expressed in latitude in decimal degrees (positive north)
Local projection system (west) *WestEx Western-most coordinate of the limit of the dataset extent
Local projection system (east) *EastEx Eastern-most coordinate of the limit of the dataset extent
Local projection system (south) *SouthEx Southern-most coordinate of the limit of the dataset extent
APPENDIX B
continued on following page

129
Ireland
Plain English Description Short Name Definition
Local projection system (north) *NorthEx Northern-most coordinate of the limit of the dataset extent
When was the data collected or created TM_CalDate Date for the content of the dataset
DqScope The specific data to which the data quality information applies
How was the dataset generated Lineage Statement General explanation of the data producer’s knowledge about the lineage of a dataset
Is dataset, complete, being updated, etc IdStatus Status of the resource
How often the dataset is updated MaintFreq Frequency with which changes and additions are made to the resource after the initial resource is completed
In what format is the data distributed FormatName Name of the data transfer format
Is there a version number FormatVer Version of the format (date, number, etc)
What media is the data distributed on MedName Name of the medium on which the resource can be received
Is the data free, commercial, research price etc ResFes Fees and terms for retrieving the resource, including monetary units
What constraints exist on accessing and us-ing the data
OthConsts Other restrictions and legal prerequisites for accessing and using the resource
Name of distributor RpIndName Name of the responsible person – surname, given name, title separated by a delimiter
Their organization RpOrgName Name of the responsible organization
Their role (see table) Role Function performed by the responsible party
Address DelPoint Address line for the location
City City of the location
County. For NI or GB insert postcode here as well
AdminArea County
Country Country of the physical address
VoiceNum Telephone number
FaxNum Fax number
EMailAdd Email
Linkage/ orName/ orDesc
Location for on-line access to additional info.
This filename MdFileID Unique identifier for this metadata file
Language MdLang Language used for documenting metadata
Character coding MdChar Full name of the character coding standard used for the metadata set
When was this MD record created MdDateSt Date that the metadata was created
Metadata standard MdStanName Name of the metadata standard (including profile name used)
Standard version mdStanVer Version (profile) of the metadata standard used
Who is responsible for this metadata RpOrgName Name of the responsible organization for metadata
Table 6. continued
continued on following page

Director of Editorial Content: Kristin KlingerDirector of Book Publications: Julia MosemannAcquisitions Editor: Lindsay JohnstonDevelopment Editor: Joel GamonTypesetter: Travis GundrumProduction Editor: Jamie SnavelyCover Design: Lisa TosheffPrinted at: Lightning Source
Published in the United States of America by Information Science Reference (an imprint of IGI Global)701 E. Chocolate AvenueHershey PA 17033Tel: 717-533-8845Fax: 717-533-8661E-mail: [email protected] site: http://www.igi-global.com
Copyright © 2011 by IGI Global. All rights reserved. No part of this publication may be reproduced, stored or distributed in any form or by any means, electronic or mechanical, including photocopying, without written permission from the publisher.Product or company names used in this set are for identification purposes only. Inclusion of the names of the products or com-panies does not indicate a claim of ownership by IGI Global of the trademark or registered trademark.
Library of Congress Cataloging-in-Publication Data
Coastal informatics : web atlas design and implementation / Dawn Wright, Ned Dwyer, and Valerie Cummins, editors. p. cm. Includes bibliographical references and index. Summary: "This book examines state-of-the-art developments in coastal informatics (e.g., data portals, data/ metadata vocabularies and ontologies, metadata creation/ extraction/ cross-walking tools, geographic and information management systems, grid computing) and coastal mapping (particularly via Internet map servers and web-based geographical information and analysis)"-- Provided by publisher. ISBN 978-1-61520-815-9 (hardcover) -- ISBN 978-1-61520-816-6 (ebook) 1. Coasts--Geographic information systems. 2. Coastal mapping. 3. Management information systems. I. Wright, Dawn J., 1961- II. Dwyer, Ned. III. Cummins, Valerie, 1974- GC10.4.R4C63 2010 526.0914'6--dc22 2009052431British Cataloguing in Publication DataA Cataloguing in Publication record for this book is available from the British Library.
All work contributed to this book is new, previously-unpublished material. The views expressed in this book are those of the authors, but not necessarily of the publisher.

192
Copyright © 2011, IGI Global. Copying or distributing in print or electronic forms without written permission of IGI Global is prohibited.
Chapter 13
United KingdomDavid R. Green
University of Aberdeen, UK
INTRODUCTION
This chapter briefly examines some of the origins and the evolution of Internet or Web-based marine and coastal atlases, and online mapping and GIS in the United Kingdom (UK). Using some of the early disk and CD-based marine atlases first available in the 1990s as the earliest examples of electronic atlases that became widely available
in the UK, it also explores some of the earliest web-based equivalents when the potential of the Internet was first realized. Subsequent develop-ments, paralleling the rapid evolution of computer technology, have provided the platforms for more recent and more widely available examples of web-based atlases. The chapter will firstly introduce the electronic atlas as a modern day equivalent of the traditional paper-based atlas. Reference to the rapid developments in computer hardware and software, coupled with increasing familiarity with
ABSTRACT
This chapter briefly examines the origins and evolution of electronic coastal and marine atlases, and online mapping and GIS in the United Kingdom (UK). Beginning with some early examples, such as the UK Digital Marine Atlas (UKDMAP), initially distributed on floppy disk (MS-DOS) and later CD (MS-Windows), consideration is then given to some of the first online Internet-based information systems e.g., The UK Coastal Map Creator, some of the current systems now available e.g., MAGIC, MESH, and UKSeaMap, and finally the potential of Google Earth (GE) and Google Ocean (GO) to provide a framework for the development of simple local scale coastal and marine atlases. In each case, attention is paid to the origins of the atlas, its development, the user-interface, functionality, data and information content, and the target audience. Some of the advantages and disadvantages of electronic atlases are also discussed, together with some of the problems, and possible solutions.
DOI: 10.4018/978-1-61520-815-9.ch013

193
United Kingdom
the tools and skills required to construct web-based applications, provides a contextual framework to the origin and development of web-based atlases and online map information systems. Some of the problems faced by potential atlas authors are also highlighted, including access to data and information and copyright issues that frequently inhibit the development of such atlases and their maintenance.
FROM PAPER TO ELECTRONIC: THE CONTEXT
Electronic or digital atlases are a natural evolution of the paper-based traditional paper atlas, albeit for use in a computer environment. There are many examples of electronic atlases available, some of which cover the marine and coastal environment. Electronic atlases originated at a time when com-puter technology (hardware and software, storage, processing, and display capabilities) had reached a stage when it was possible to design, create, and present maps and charts in an electronic or computer-based environment using computer-aided or computer-assisted cartography (CAC). While some early examples relied upon very basic black and white computer displays, the arrival of high resolution color monitors greatly enhanced the possibilities to display increasingly better quality maps on the computer screen. These took advantage of the additional dimension of color for mapping. In recent years, desktop computers (PCs) and small mobile geographic information system (GIS) hardware have evolved so rapidly that it is now possible to provide very high resolution color displays of maps and charts on the smallest of mobile platforms, including mobile phones. There are also many examples for displaying electronic chart displays on the modern yacht.
Whilst computer hardware has evolved quickly, providing the storage and memory capacity and processor speed to handle large volumes of geographical data on the desktop and mobile
platform, so too has computer software. Software applications now provide the tools to design, create, and display very sophisticated map and chart displays. At the same time, software has become more user-friendly and so many more people are now empowered to create their own electronic maps, aided by software that provides the necessary cartographic, design, layout, and publishing tools. Map and graphic design software (e.g., Golden Software’s MapViewer and Adobe Illustrator) can be used to create maps and present them as dynamic examples with the aid of MS-Powerpoint-based slideshows.
The potential of the electronic atlas as a medium to access, view and share coastal and marine information, has been further enhanced with the development of the Internet and a range of website development software tools, as well as GIS and online GIS-based mapping software that has ultimately led to the development of a wide range of different web-based examples of marine and coastal atlases. A sample of these can be accessed from the International Coastal Atlas Network (ICAN) website: http://ican.science.or-egonstate.edu/atlases. The ICAN initiative (http://ican.science.oregonstate.edu) seeks to document best practice in the development of coastal web atlases (CWA) around the world by coordinating the sharing of international knowledge and exper-tise. It therefore represents a significant step in the evolution of Internet-based electronic atlases and may in turn have considerable influence on the development of data models and spatial data infrastructures (SDIs) that may underpin electronic atlases in the future.
In this chapter, the term electronic or digital atlas covers a wide range of examples ranging from electronic mapping to online GIS. The overview presented and the subsequent discussion necessar-ily also includes a number of other examples that are based around a searchable online catalogue of datasets, make use of maps as the interface to such a catalogue, or provide an online map/image-based service. Whilst not strictly fulfill-

194
United Kingdom
ing the definition of an electronic atlas they are nevertheless closely related and in effect form the basis of an electronic atlas.
EARLY ELECTRONIC ATLASES IN THE UK: SOME EXAMPLES
In the UK, some notable marine and coastal atlases were first developed in the 1990s by the British Oceanographic Data Centre (BODC) at Bidston. The United Kingdom Digital Marine Atlas Project (UKDMAP) and the UK Current Meter Series Database are two good examples. Other examples from the same source were the Global Bathymetric Chart of the Oceans (GEBCO) atlas and the North Sea Project Database. Together these represented a combination of software, database and visual-ization packages that were initially distributed on one or more 3.5” floppy disks and subsequently on CD. These were some of the first examples of electronic marine and coastal atlases in the UK, and were very similar to a number of other examples that became available at approximately the same time in North America such as the Coastal Ocean Management, Planning and Assessment System (COMPAS) and Atlas T. COMPAS (Alexander and Tolson, 1990) was developed by NOAA for the Apple Macintosh using Hypercard software and was accompanied by a Guided Tour for user familiarization. Atlas T written by Rhines in 1992, was a micro-computer-based ocean atlas for tracer and hydrographic sections based on ship tracks. Running under MS-DOS, and controlled by keyboard input, Atlas Tprovided visualizations of ocean data including depth profiles and contour maps. It was also accompanied by a detailed Help file. All of these examples of computer-based atlases reflect the growing availability of digital data, mapping and visualization software, and the state-of the art computer technology at the time.
Some UK examples will now be briefly ex-amined to provide some evolutionary context for
the subsequent development of UK Internet-based electronic map information systems and atlases.
The UK Digital Marine Atlas
The UKDMAP (http://www.bodc.ac.uk/products/bodc_products/ukdmap/) was probably the most notable and widely available example of a UK coastal and marine atlas, and certainly the most popular and familiar (BODC, 1992; Barne et al., 1994; Green, 1994a, 1994b). This electronic atlas provided the end-user with access to a wide range of marine and coastal data (originating from BODC databases) presented in the form of a digital map or chart. Initially for desktop (PCs) computers running MS-DOS (later replaced by an MS-Windows version) and a color display moni-tor, this electronic atlas provided the potential for end-users to interact with and map a wide range of terrestrial, coastal, and marine datasets for the UK (Figure 1). At the time, UKDMAP was quite a novel application that had considerable poten-tial as an information and educational resource and was targeted at people involved in research, conservation, engineering, fishing, transport and leisure, education, recreation, and planning (Green, 1994b). One advantage of the electronic format was the ease with which updated data could be made available to the end-user. Customization of the maps was also possible and there was some limited GIS functionality (Green, 1994b). One novel feature of UKDMAP was the capability to assemble a selection of maps into a slide show to examine changes over time, trends, and the exploration of specific themes (Green, 1994b). For various reasons (e.g., lack of funding, changes in computer technology etc.), after several releases of updated versions of UKDMAP, it was no lon-ger maintained, although it is still available from BODC. This is unfortunate as the overall concept of a UK information system rapidly became very popular and the product was well-packaged; easy to use, low cost, and a very useful information and educational resource for the UK.

195
United Kingdom
British Oceanographic Data Centre Inventory of Moored Current Meter Data
Another example, also developed by the BODC, was the Current Meter Series Database (BODC, 1991). It was developed in co-operation with in-ternational marine organizations and comprised a database and visualization software with a similar user interface of pop-up/drop-down menus found in UKDMAP. It included moored current meter data collected by sixteen countries from around the World. Although not solely focused on the UK, a large part of the BODC Current Meter Series database (part of their National Oceanographic Database) contained current meter data for the UK. The end-user was able to browse the data-base, select a sample of records, and to display or visualize the selected locations on a map outline. Records could be selected according to various criteria such as the start date, country, and labora-tory of origin, and sorted, retained, printed to file and previous record selections reloaded for review.
Whilst initially also distributed on floppy disk, the Current Meter Series Database is now acces-sible via a simple map interface based around the Environmental Systems Research Institute or ESRI’s ArcIMS map server software (https://www.bodc.ac.uk/data/online_request/current_meters/). It is easy to use and comprises a descriptive web page and a help file, together with some simple navigational tools e.g., zoom and pan, and previ-
ous extent. This map interface allows the end-user to explore the data holding prior to making an online request for the data. In its current guise it is probably one of the most basic examples of an electronic interface to spatial data and utilizes only a small part of the full functionality of ArcIMS software. A similarly configured product is the Wave Data Series which also includes a web-based ArcIMS interface (https://www.bodc.ac.uk/data/online_request/waves/).
North Sea Project Database
The North Sea Project Database (Lowry et al., 1992) is a comprehensive collection of physical, chemical, and biological data collected from sur-vey cruises and process study cruises containing data on temperature, salinity, and dissolved oxy-gen. It also included satellite AVHRR (Advanced Very High Resolution Radiometer) data from NOAA, metadata, the BODC Moored Current Meter database, and a North Sea Bibliography. As with the other BODC products the North Sea Project Database is now supplied on a CD and was designed as an electronic publication of data complete with visualization software. A range of tools was also provided to help visualize the variety of different datasets e.g., time series, underway data and the analysis of satellite imagery. The latter tools include UNESCO’s Bilko image process-ing software (UNESCO, 1989), Image Display
Figure 1. Screen snapshot of the UKDMAP (courtesy of BODC, UK)
196
United Kingdom
Program in Interactive Data Language (IMDISP), and PicLab (a freeware graphics package). Data could be subset, listed to screen, printed as both black and white and color hardcopy, and images saved to the GEM .IMG format facilitating use of the information in a slide show, and integration in text documents. Cruise tracks could also be plot-ted. Customization of the visualization was con-trolled by the end-user allowing for the selection of colors and specification of contour intervals. Data could also be copied to a computer’s hard disk to facilitate faster access (Lowry et al., 1992).
By comparison to other BODC products this was a less user-friendly source of data, compris-ing a number of different interfaces to different software used to view, analyze and visualize the data, and was aimed more at the specialist audi-ence than the layman.
GEBCO Digital Atlas
The General Bathymetric Chart of the Oceans or GEBCO Digital Atlas (http://www.gebco.net/data_and_products/gebco_digital_atlas; Jones et al., 1994) was another BODC product, first released in 1994 on 3.5” floppy disk (software) and CD (data). Complete with a comprehensive 70 page printed Supporting Volume (including Annexes) to the GEBCO Digital Atlas (GDA), it contained the following: digitized bathymet-ric contours and coastlines; digitized trackline control; the existing digitized bathymetric charts from the Intergovernmental Oceanographic Com-mission (IOC) regional ocean mapping projects; a copy of the computerized gazetteer of geographic names of undersea features as maintained by the International Hydrographic Bureau; a stan-dard world coastline (the US Defense Mapping Agency’s World Vector Shoreline); and a trackline inventory of digital sounding data (Jones et al., 1994). The end-user interface and functionality were very similar to that of UKDMAP and the Current Meter Series Database. Running under MS-DOS, with an interface comprising drop-down
menus, the software provided a range of function-ality to visualize the data on a map using overlays, to extract and save data, provide printout, and to generate slideshows. Current information about the latest release of GEBCO and the software is now available online at http://www.gebco.net/
In summary, all of these BODC products were clearly quite unique when first made available. Furthermore, they were well developed, executed, and subsequently supported, which at the time, placed the UK at the forefront of electronic ac-cess to coastal and marine data and information and electronic atlases. Although UKDMAP was not developed further by BODC, the closest equivalent now is the Marine Irish Digital Atlas (MIDA) (http://mida.ucc.ie/) which is discussed in Chapter 7 and utilizes web mapping technology.
HelFal
With the arrival of Windows-based operating systems, first pioneered by Apple and later pur-sued by Microsoft as a replacement for MS-DOS, came a new generation of micro-computers and software. As mentioned earlier in this chapter, NOAA developed their COMPAS system for the Apple Macintosh using Hypercard (a hypermedia application program) software. A similar approach was used at the University of Aberdeen by Green (1994c) to develop a simple demonstrator for coastal management of a UK estuary in Cornwall, South West England. HelFal (the Helford Passage and Fal Estuary Community Information System) was used to convey the concepts and potential of developing a multimedia GIS-based information system, using maps, text and imagery for the two estuaries. A version of this demonstrator was later also developed in Toolbook, multimedia training software program for the PC. The objective was to take advantage of the opportunities to construct a simple intuitive interface to a wide range of data and information about an estuary including maps, imagery and text documents using interactive multimedia software.

197
United Kingdom
THE WORLD WIDE WEB AND SOME EARLY EXAMPLES
In the mid-to late-1990s, with the then emerg-ing Internet, web browsers (e.g., Mosaic and Netscape), and accompanying software, attention soon turned to the potential the web offered as a means to construct online mapping and informa-tion systems and electronic atlases, and to provide access to spatial data and information by a wider end-user community via both network and commu-nications software. A number of early web-based examples were soon developed, more often than not as demonstrators of the potential the Internet offered as an interface to a wide range of coastal and marine information from multiple disparate formats and sources.
Over time, progress towards web-based GIS has been greatly aided by the development of Internet map- and image- server software and the concept of an Internet map service (IMS). The best known software initally was perhaps ESRI’s ArcIMS which has been widely used as the basis for many online GIS projects. Indeed, nearly all commercial GIS software packages now have their own IMS as part of the software or as an add-on. Besides commercial software products such as ArcIMS, there are a number of open source software examples such as GeoServer (http://GeoServer.org) and Minnesota MapServer (http://MapServer.org). Web Mapping Services (WMS), an Open Geospatial Consortium (OGC) standard, are also now supported by Google Earth (http://earth.google.co.uk/), NASA’s World Wind. (http://worldwind.arc.nasa.gov/), and Microsoft’s Virtual Earth (http://www.microsoft.com/maps/).
Proposal for a UK Network-Based Spatial Information System: The United Kingdom Marine and Coastal Information System (UKMCIS)
The success of UKDMAP clearly revealed the demand for a simple means to access UK marine
and coastal data and information. Green (1995) therefore proposed a national coastal and marine information system based around the world-wide web. At the time this represented a unique and potentially very useful way to translate the work and content of products such as UKDMAP into a format offering many advantages over distribu-tion on a CD. UKMCIS (the United Kingdom Marine and Coastal Information System) was a conceptual idea to integrate existing disparate coastal and marine data and information held by many UK organizations into a widely accessible national information system based around the net, which would provide and enhance opportunities for more people to access and use coastal and ma-rine information. The rationale for this approach lay with the following advantages: establishing a resource for multi-user access; promoting aware-ness, contact and discussion; providing improved communication links; providing opportunities for direct sharing of data, information and expertise; providing opportunities for integration of data; developing a multidisciplinary approach to re-search and problem solving; minimizing duplica-tion of data and work; providing cost-effective solution to problems; enhancing planning and decision-making. Additional benefits included: overcoming the isolation of data and information sources; promotion of data standardization and documentation; encouraging regular updating; and an emphasis on data quality and error checking.
The UK Coastal Map Creator
As with all computer technology the Internet evolved very rapidly and by the mid- to late- 1990s software to generate map-based or GIS-based map delivery across the Internet was well devel-oped. One of the most notable early examples was ESRI’s ArcIMS, a product that allowed a developer to create web-based portals providing an opportunity for map and image based data and information to be accessed, and shared across a computer network.

198
United Kingdom
One early example that took advantage of the potential offered by the world-wide-web was the UK Coastal Map Creator (Green and King, 1998; Figure 2), the outcome of some research under-taken at the University of Aberdeen in Scotland, UK using ESRI’s ArcIMS 3 software. Supported and hosted by ESRI UK, the UK Coastal Map Creator was one of the first examples of a web-based coastal zone information system in the UK. Building upon the ideas first presented by Green (1995) for UKMCIS, the UK Coastal Map Creator took advantage of the functionality of ESRI’s ArcIMS to develop a framework to deliver coastal and marine information to the UK coastal community. Initially developed as a demonstra-tor to enhance access to UK coastal and marine information, the UK Coastal Map Creator sought to encourage potential data providers to make their data and information more widely available.
The rationale for the development of the UK Coastal Map Creator was that access to data and information is an essential component of day-to-day coastal planning and decision-making in integrated coastal zone management (ICZM). In the United Kingdom (UK), coastal zone man-agement was undertaken by a wide variety of government and non-government agencies and institutions guided and co-ordinated by voluntary
forums or partnerships for specific areas of the UK coastline. Although many of these organizations gathered data and information relating to the coast, often it was not stored in a standard or accessible format for people to use outside of a particular agency or to share easily. The web environment therefore provided an opportunity to overcome such constraints.
The Bartholomew 1:200,000 raster data pro-vided the navigational base map for the system, developed with their postcode and gazetteer data, providing the end-user with the ability to search the database either by town name or postcode. Other datasets included were English Nature’s (now Natural England) boundaries of national and international conservation site designations in England. Proposed additions to the system in-cluded aerial photography, satellite imagery, and Lidar, some aided by commercial agreements with Infoterra (http://www.infoterra.co.uk/). Consider-able care was taken to develop a user-friendly and aesthetically pleasing interface for the end-user, bearing in mind the growing and ever widening end-user community for such information. Cus-tomization was easily achieved using the ArcIMS software tools.
However, whilst successful as a conceptual framework, the UK Coastal Map Creator ulti-
Figure 2. The UK Coastal Map Creator

199
United Kingdom
mately proved practically difficult to develop into a national resource for a number of reasons, even despite an attempt to commercialize the system. One reason was the difficulty in getting map data suppliers to contribute data into the system. Commercial agreements to both list and show an example of available information on the website with a pointer to the data supplier’s contact details overcame some of these difficulties but did not lead to wider population of the system with spatial datasets of interest to the coastal and marine com-munity. Another was the ever present problem of copyright issues in the UK which usually made the base datasets prohibitively costly to purchase and use in an online system such as this.
Geo-Information Decision Support Processing and Dissemination System
An extension of the UK Coastal Map Creator idea was the GDSPDS (Geo-Information Decision Support Processing and Dissemination System) (http://www.abdn.ac.uk/~geo402/index.htm) de-veloped by King at the University of Aberdeen in the Centre for Marine and Coastal Zone Manage-ment (CMCZM) (http://www.abdn.ac.uk/cmczm) between 1999 and 2001. Constructed using ESRI’s ArcIMS 3 software, the GDSPDS sought to ex-tend the basic and typical concept of a GIS and mapping portal into one that included links to a wide range of additional geographical data and information representations, thereby providing a multimedia information system for planning and decision-making in the coastal zone. The system focused on the Solway Firth in Scotland, UK.
In addition to ESRI’s ArcIMS software used for the mapping component, the system offered the end-user access to digital satellite and airborne imagery, panoramic photography, mobile GIS data, and video, all within a single system. A key component of the work involved emphasis on the end-user interface, with a focus being placed on the aesthetics, functionality, and usability of the interface by the coastal manager and coastal
practitioner, and development included some end-user tests. Some additional experiments were undertaken to explore the utilization of image compression software e.g., LizardTech’s Mr. Sid (http://www.lizardtech.com/) and ER-Mapper’s ECW compression formats (http://www.erdas.com), and a range of software utilities to process and visualize data and information, as well as some more experimental ideas utilizing software to develop a 3D realistic navigational interface to the coastal zone information.
As an experimental decision-making frame-work, based around recognition of the importance of the ease of access to coastal data and informa-tion for coastal managers, this research revealed how off-the-shelf software and hardware could easily be utilized and customized to create the framework for an online GIS mapping, data and information system for coastal zone management.
SOME RECENT UK WEB-BASED EXAMPLES
With greater availability of spatial data and devel-opments in web-based technology, coupled with a desire to develop institutional and national online information systems using map servers, more and more organizations have been placing their marine and coastal data and information online in one format or another. Whilst some simply provide access to catalogues of data holdings with accompanying search tools, others have provided online mapping systems with custom-ized interfaces, metadata, tutorials, manuals, help files and data download facilities. Recognition of the potential of the Internet-based marine and coastal information system is finally beginning to take shape particularly now with the UK Marine Bill (http://www.defra.gov.uk/) and the Scottish Marine Bill (http://www.scotland.gov.uk/Publica-tions/2009/09/28115722/0). The growing use of GIS and the need for spatial datasets is also being influenced by the greater emphasis now placed

200
United Kingdom
on the development of Marine Protected Areas (MPAs), marine national parks, and the overall en-thusiasm for marine or maritime spatial planning. A few different examples of such developments are summarized below to illustrate some of the progress that has been made to date.
Data Archive for Seabed Species and Habitats
The Data Archive for Seabed Species and Habitats (DASSH; http://www.dassh.ac.uk/) is an archive centre for digital benthic data, as well as images and video, and an online catalogue of data and metadata, providing a long-term store and a data and information resource. Funded by Department of Environment, Food and Rural Affairs (DEFRA), DASSH works with the Marine Biological Asso-ciation, the Marine Life Information Network, the National Marine Biological Library, the Marine Environmental Digital Information Network (also known as MEDIN), and the Marine Data Archive Centers regarding data standards. Although pri-marily a search-based interface, there is a simple map interface search window in SEArchable BEnthic Data or SeaBED. This is interactive and allows one to draw a bounding box around an area on a map and returns the coordinates to the search tool and a list of datasets. These can then be downloaded in the comma separated value or CSV file format for use in a spreadsheet and subsequently imported into a GIS such as ESRI’s ArcView or ArcGIS. Links to other organiza-tions are provided where the data are not held by DASSH. Registration of a user’s details allows continuing access to any datasets retrieved from the database.
Marine Environment Data and Information Network
MEDIN (http://www.oceannet.org/) is hosted at the BODC and comprises a partnership of UK organizations whose aim is to improve access to
marine data. The web interface is being tested at present and provides links to marine data held by a number of other organizations e.g., DASSH, British Geological Survey (BGS), and the United Kingdom Hydrographic Office (UKHO). It pro-vides hyperlinks to access a data discovery portal, a data search by theme, and advice on marine data standards, mainly for the UK. Searches return a series of links to detailed metadata files in Exten-sible Markup Language (XML).
ICES FishMap
The International Council for the Exploration of the Sea, Denmark (ICES) Fishmap (http://www.ices.dk/marineworld/ices-fishmap.asp) is an on-line atlas of fifteen fish species in the North Sea based on data collected from trawl surveys col-lected between 1983 and 2004. It was created by RIVO (Institute of Fisheries Research, The Neth-erlands), Center for Environment, Fisheries and Aquaculture Science, UK (CEFAS), and ICES and is partly funded by the European Commission’s 6th Framework Program. Fishmap provides an online web portal together with background informa-tion, some downloadable as PDFs and includes data from GEBCO (see earlier). Fishmap has two modes: Basic and Advanced. In Basic mode, the end-user is provided with a simple, largely static, interface which provides a legend of the fifteen fish species in the North Sea. Selecting each fish species changes the map accordingly. Contextual information on each species is also provided. This is a very basic user-interface and functionality is limited to changing the fish species and the selection of Basic or Advanced mode. Advanced mode, by comparison, provides a more interactive interface with an array of zoom, measure, re-center, select area, and select polygon functionality. In addition, a pane provides the end-user with reset, export, select, query, clear and help functionality. The legend pane provides access to the data. The data layers can be selected and displayed. This is a simple web atlas with basic functionality. It

201
United Kingdom
operates in interactive Spatial Explorer and Ad-ministrator (iSEA), CEFAS’s spatial data explorer and webGIS interface for UK data (http://www.cefas.co.uk/isea).
WaveNet
Another web-based interface provided by CEFAS is WaveNet (http://www.cefas.co.uk/wavenet-mapping) which provides access to DEFRA’s wave buoy locations and wave height data. This is a very simple interface to a map, where interac-tion of the mouse with each symbol also reveals the data for that buoy, which includes wind and temperature information. As with ICES Fishmap, the CEFAS web interface includes a Basic and Advanced mapping capability. The Advanced mapping capability provides access to a similar map but with more functionality and many layers, including wind farms, buoys, and waveriders, that can be toggled on and off, selected, deselected, and redrawn. Clicking on a symbol takes the end-user to a separate web page with further options to display the data. Links to satellite and text data, as well as Google Earth KML files are also provided.
Mapping European Seabed Habitats (MESH)
The Mapping European Seabed Habitats (MESH) marine mapping and metadata portal is one of the outcomes of the MESH project (http://www.searchmesh.net/). Funded by Interreg IIIB NW Europe, MESH was developed over three years, starting in 2004 and finishing in 2008. It involved twelve European partners led by the Joint Nature Conservation Committee (JNCC). Accompanying the webGIS mapping interface is a very compre-hensive website providing both the scientist and the non-scientist with information about benthic habitat mapping and the process of producing a map, as well as details on a data model, metadata, and a series of case studies. The webGIS was developed using the open source GIS software
Minnesota MapServer, which can be freely downloaded and used to develop an online map-ping system. The portal contains a wide range of marine datasets.
UKSeaMap
The UKSeaMap webGIS (http://www.jncc.gov.uk/page-3663) provides a map portal (described as a mapping data delivery service) giving access to information on seabed landscapes and seasonal water column features. Additional contextual layers (e.g., geology, bathymetry, tide stress, and salinity) are also provided. It was funded by the following organisations: the Countryside Council for Wales (CCW), DEFRA, Department of Trade and Industry (DTI), Natural England, The Royal Society for the Protection of Birds (RSPB), the Scottish Executive, the Crown Estate, the JNCC, and the World Wildlife Fund (WWF). UKSeaMap was developed as part of MESH (see above). The web GIS is launched using an initial layer chosen from a drop down menu list (e.g., a base map). The web-mapping interface was developed by the JNCC and exeGesIS SDM Limited and made use of Minnesota MapServer and the Javascript language. The interface comprises a typical web-mapping view on a map window, an overview map, a legend and a number of basic navigational tools, complete with tabs for Location, Legend, Info, Layers, and Help. These can all be selected and the information is displayed in the right hand pane of the view. Layers can be toggled on and off. The webGIS can be launched from a number of points in the website pages that accompany the mapping portal, and the water column data and the seabed landscape data can also be downloaded as zipped data files.

202
United Kingdom
Multi-Agency Geographic Information for the Countryside (MAGIC)
The Multi-Agency Geographic Information for the Countryside or MAGIC (http://www.magic.gov.uk/) is a website with an interactive map service providing public access to geographic information on the environment and designations. A detailed overview of MAGIC is provided by Askew et al. (2005). As part of this online resource, a Coastal and Marine Atlas was added in 2005. This is promoted as a tool for marine planning and con-tingency response. It is funded by the following organizations: the Maritime and Coast Guard Agency (MCA), DEFRA, the Scottish Executive (SE), Scottish Natural Heritage (SNH), the Energy Institute (EI), JNCC, the Environment Agency (EA), English Nature (EN; now Natural England), the Department of Trade and Industry (DTI), the Hampshire County Council (HCC), Essex County Council (ECC), Kent County Council (KCC), and the British Geological Survey (BGS). Much of the data are from the Ordnance Survey (http://www.ordnancesurvey.gov.uk) and also SeaZone (http://www.seazone.com). Compared to many of the other online mapping systems discussed earlier in this chapter, MAGIC has more GIS functionality accessible via the user-interface. There are a number of navigational functions including zoom, pan and the addition of an Ord-
nance Survey map backdrop, grid co-ordinates, identify, measure distance and area, print, save (in GIF format), re-project, and bookmark. The view window includes a map pane, a scale and scale bar, a legend pane, and an overview map. Up to fifteen thematic layers can be displayed at any one time. Tabs provide access to map tools, and other themed resources. Aside from the online map-based information the website also includes a map tutorial, dataset information, some static maps, a training manual, and work in progress (Figure 3).
Western Channel Observatory
The Western Channel Observatory (WCC: http://www.westernchannelobservatory.org.uk/) is hosted by the Plymouth Marine Laboratory (PML: http://www.pml.ac.uk/) and provides access to marine data e.g., ocean color, sea surface tem-perature, chlorophyll, weather data and webcams for the Western English Channel. Data, including remotely sensed data are integrated within a GIS. At present the interface is basic and provides web links to data and graphic visualizations, as well as the satellite data. The latter utilizes the NERC Earth Observation Data Acquisition and Analysis Service (NEODASS) (http://www.npm.ac.uk/), a Java image viewer which includes some zoom and GIS data overlay capabilities. An additional, and unique, feature of this portal is the interactive
Figure 3. Screen snapshot of MAGIC (courtesy of DEFRA)

203
United Kingdom
image stretch function as well as the pixel by pixel enquiry tool – both of which open in separate viewing windows – allowing for some elementary digital image processing and visualization to be undertaken.
Channel Coastal Observatory
By comparison, the Channel Coastal Observa-tory (CCO) (http://www.channelcoast.org/) has an online map viewer and data search tool. This provides a web-based interface to a catalog of a wide range of marine and coastal data for part of the UK, largely focused on the South Coast and the English Channel. The web view provides the end-user with a map pane (including a summary of the functionality of the map tools), an overview map, and a list of the map layers as clickable fold-ers. These include remotely sensed data (ortho-rectified and non-rectified aerial photography, color infrared (CIR) aerial photography, and light detection and ranging (LIDaR) data, topographic and topographic model data, hydrographic and hydrographic model data, photogrammetric data, sediment distribution data, beach profile change data, real time wave buoy and tide gauge data, and other data including the Ordnance Survey (OS) grid, management units, coastal places, and GPS points. The web-map interface provides the
end-user with an interactive geographical search tool (Figure 4). Following the initial area search it is possible to refine the search for the datasets available for an area by choosing from a range of formats for each data type (e.g., a recommended format such as ECW (Enhanced Compression Wavelet) for aerial imagery, and PDF (Portable Document Format). Selected datasets are then placed in the ‘basket’ and can be downloaded providing they are not over 300 Mb. The web interface includes a Help file and Feedback form. This is an aesthetically pleasing and navigable interface which uses the map server software to identify and display the location and coverage of the data holdings. One weakness, perhaps, is that the datasets cannot be displayed, only downloaded. The reason for this is probably to minimize stor-age requirements of the data. Logically, however, the end-user expectation is to be able to display and examine the data e.g., the imagery and the provision of an electronic atlas instead might be beneficial to the end-user community in the longer term.
Godiva
Godiva is a NERC project (http://www.nerc-essc.ac.uk/godiva) hosted by Reading University’s e-Science Center and uses GADS (Grid Access
Figure 4. Screen snapshot of the Channel Coastal Observatory (courtesy of CCO)

204
United Kingdom
Data Service) It was designed for scientists so as to facilitate analysis and visualization of data from various sources including climate, atmospheric and oceanic models. Godiva provides a map-based interface (Godiva2) for a range of marine spatial datasets from the ESSC Web Map Service for environmental data for a number of different areas and from different origins e.g., UK Met Office. One such area is the Irish Sea. Available datasets include: sea water velocity, sea surface height, sea water temperature, and wind speed. Data can be selected for viewing with the aid of a calendar and drop down time (clock) menu. The data are visualized against a map outline. The interface also includes some basic navigational tools for the map data e.g., Pan and Zoom, together with a legend. A choice of linear or log displays can also be selected. A Transect tool allows transect graphs to be shown in a separate window. The basic interface is simple and practical, aesthetically appealing, and functional, allowing the end-user to locate and display multi-temporal marine spatial datasets, and to focus on the information, thereby providing a useful browse service. It also allows for the comparison of different datasets from different EU projects e.g., MERSEA. The accompanying User Guide gives details about using Godiva and the ways in which it can be customized by the end-user e.g., navigation, changing the color palette, creating an animation, and changing the map projection, as well as saving and emailing a view.
SeaDataNet
SeaDataNet of the Pan European Infrastructure for Ocean and Marine Data Management (www.seadatanet.org) has been developed by a number of EU partners including the British Oceanographic Data Center (BODC) in the UK. The web portal provides access to marine datasets from thirty-six countries. The viewing services are in the form of a Catalog and Maps, with point, track and area entries. Developed in compliance with OGC (Open Geospatial Consortium) standards
and in co-operation with my-Ocean (see below) it includes a Common Data Index (CDI) Metadata Search interface. This includes a Geographical Box selection criteria function with a map view, simple navigational tools, and additional informa-tion resources. More details are provided at the BODC website: http://www.bodc.ac.uk/projects/european/seadatanet/.
MyOcean
At the time of writing, the MyOcean Service (2009-2012 - http://www.myocean.eu.org) is a new project (a contribution to Global Monitoring Environment and Security or GMES) that aims to provide a catalog of worldwide and European regional ocean products (in the form of real time observations, analysis and forecasts) that have been made available from previous projects e.g., MarCoast. It will include the INfrastructure for SPatial InfoRmation in Europe (INSPIRE) functionalities e.g., discovery, visualization and downloading tools and includes marine and coastal environments.
InterRisk
InterRisk (http://interrisk.nersc.no) is an EU funded project (FP6-IST) designed to provide GMES information services for environmental risk management in marine and coastal areas of Europe. It has been built on existing solutions from other GMES projects e.g., MASS GSTP and the Data Integration System for Marine Pollution Water Quality or DISMAR (http://www.nersc.no/dismar/) The pilot service is based on open system architecture of GIS and web service protocols and has been implemented for several European regional seas, one of which is UK/Irish waters (Plymouth Marine Laboratory). It is also based on a number of recognized standards including the World Wide Web Consortium (W3C), the OGC, the International Organization for Standardization (ISO), and follows INSPIRE recommendations.

205
United Kingdom
The Open-source Project for a Network Data Access Protocol (OPeNDAP) and software tools have also been investigated.
MarCoast
MarCoast (Marine and Coastal Environmental Information Services: http://gmes-marcoast.com/) was a three year (2005-2008) GMES (Global Monitoring for Environment and Security) project funded by the European Space Agency (ESA). It comprises a network of marine and coastal infor-mation services e.g., the MarCoast Service Portal and provides a catalog of the services provided by the MarCoast partners at a European scale, includ-ing the UK. These are in the form of surveillance, forecast, monitoring and alert, and assessment services. This includes access to oil spill, water quality, algae bloom, water quality assessment and Met-Ocean data. The basic map interface is simple and offers navigational and search tools, and an overview map. A ‘map’ link provides ac-cess to Google Map as a backdrop and a Google Earth file that displays a map of links to service providers. In addition, some data are available for download and services can also be added.
Proudman Oceanographic Laboratory Observatory
Included as part of the Proudman Oceanographic Laboratory’s (POL) Observatory for the Irish Sea is a MapViewer link (http://cobs.pol.ac.uk/gmap-per/). The map interface is based on Google Maps, together with an interactive legend, instructions, and links to a map and satellite imagery backdrop. Additional map data layers include near real time data on Coastal Tide Gauges, WaveRider Buoys, SmartBuoys, as well as and RiverFlow monitor data, and model output. Switching to satellite provides an image backdrop instead of the map. The interactive legend can be hidden from view. This website takes advantage of the Google Maps interface as a backdrop to other layers. Clicking
on the symbols gives a pop-up window which provides further links to data. For example clicking on the tide gauge symbol for Lowestoft leads to web links for near real time tide gauge data and seven day predictions. The interface is aestheti-cally pleasing and easy to navigate and use, with its interactive legend, and is perhaps closest to a combination of a GIS and the Google interface, something that makes it potentially quite familiar.
Google Earth and Local Information Systems
With the availability of Google Earth and a range of software utilities it has become possible to consider this as yet another way to provide access to and share data and information relevant to the marine and coastal environment. As seen earlier some of the web-based services are already making use of Google Maps and Google Earth. However, while Google Earth, in its base form, provides access to geospatial information for anywhere in the World, the additional element explored in this section of the chapter lies with the potential to create a local information system allowing for the addition of additional data and information (vector and raster) as well as data collected with mobile systems to the base layers provided in Google Earth. With the aid of software utilities e.g., Shape2Earth (http://shape2earth.com/), MapWindow (http://www.mapwindow.org/) and a number of Google blogs (e.g., OgleEarth (http://www.ogleearth.com/) it is possible to add more information to the Google Earth view that can then be shared as a KMZ (KML-Zip file) file and opened by anyone who has access to Google Earth. These provide a powerful toolbox to create a simple online GIS system.
The latest release of Google Earth, including Google Ocean, has extended the terrestrial infor-mation resources to the coastal and marine areas, allowing for the addition of bathymetric data. This combination can then be used to develop local GIS for small areas of the coast and, in an

206
United Kingdom
educational and training context, can be used as the basis for developing virtual fieldtrips or as a ground-truthing resource. Two simple examples are used here for illustration. The first is a local information system developed for the Ythan Es-tuary in North East Scotland, UK, which is also used to provide a virtual fieldtrip and tour of the estuary and the sand dune system. The second example is the use of Google Earth to create a local information system for Nigg Bay to the south of Aberdeen that is also used as the basis to create a multimedia coastal footpath walk, and a visual fly-through of the Bay as the basis for visualizing a proposed waterfront regeneration proposal (Figure 5). Although Google Earth has some limitations as a Geographical Information System (GIS) mainly in terms of its functionality, it has considerable potential to provide a relatively simple way to bring together and display spatial data and information, and to share the data and information without the need to have a GIS. Google Earth also allows for layering on top of an image back drop, the addition of more layers, and incorporates a DEM (Digital Elevation Model). The popularity of Google Earth is increasingly evident from the number of data providers who are now willing to share their GIS data layers in the KMZ format; for example, Scottish Natural Heritage (SNH), and the Maritime Coastguard Agency (MCA), and by the number of GIS soft-ware packages that now allow the export of data
in a GIS to the KML format. Perhaps the biggest drawback to using Google Earth is the apparent limitation in file sizes that can be handled, and in the UK problems that might arise when sharing data if the source originates with, for example, the Ordnance Survey (OS).
ISSUES AND DEVELOPMENTS: PAST, PRESENT AND FUTURE
Green (1994b) raised some general issues con-cerning ease of access to coastal and marine data and information for the wider community. Whilst progress towards overcoming some of the constraints has clearly been made over time, there still seem to be a number of the very same issues continuing to hinder progress in this area.
Access to data and information about the coastal and marine environment has clearly im-proved greatly over time. This has largely been aided by the development of web portals that al-low end-users to find, locate and explore the data, to visualize database holdings in the form of an interactive map (some with simple GIS function-ality), and in some cases to download the digital datasets for use in a GIS. In the UK there have been a number of initiatives to collect and make more widely available data for the marine and coastal environment. Two have been the result of collaborative projects to develop links between the
Figure 5. Virtual Fieldtrip of Ythan Estuary in Google Earth

207
United Kingdom
Ordnance Survey (OS) terrestrial data and marine chart datasets from the UK Hydrographic Office (UKHO).This resulted in two map demonstrators. The first produced a single paper sheet map of the coastal zone for the area around Southampton and the Isle of Wight. The second, Integrated Coastal Zone Map (ICZMap), a collaborative project of the Ordnance Survey, the UKHO and the Brit-ish Geological Survey (BGS) was completed in 2003 and resulted in an example demonstrator digital dataset. Latterly this led to the creation of SeaZone thematic GIS layers. These include: hydrospatial, digital survey bathymetry, charted raster, and charted vector data. These have since been successfully used within some of the web map portals described earlier. Recent develop-ments for academic use (teaching and research) have been Marine Digimap (http://edina.ac.uk/digimap/description/marine_overview.shtml) which makes the SeaZone datasets available for in-class exercises and project work. This has been some time in coming but is definitely a very posi-tive development for up and coming generations to be able to use the data in their education and research.
Interfaces to information systems have also clearly evolved, and whilst there is considerable variety in the end result and ultimately the func-tionality and usability of each one, the Internet (and some of the web mapping software) has had a huge impact upon improving access to information through more aesthetically appealing, navigable, intuitive, and usable interfaces.
In nearly all cases, the online portals also pro-vide considerable contextual background which is focused on the likely potential end-user com-munity and usually include resource pages with additional information, tutorials, links, manuals, and help files. This is not unlike earlier systems provided on disk and CD. What is still not included, however, for those systems where it is possible to create a new map, with the end-user having control over the choice and use of color, shading and symbols, and overall design, is guidance or
best practice guidelines on how to produce the most effective map as output. This is especially important where maps are to be exported to a document or used in a slideshow presentation for communication to a wider audience. While some systems do provide information about the map-ping process (e.g., MESH has a link to a Mapping Guide), there is a still a fundamental need to direct end-users of these online information systems towards the basics of map design through books and tutorials etc., particularly as Green (1994b) points out that: cartographic design is far from trivial and it is easy for those lacking knowledge and experience to end up with a poor map. This should not really be a problem as there are now many books and resources to aid the end-user (e.g., Brewer, 2005; Brown & Feringa, 2002; Dent, 2002; Erle et al., 2005; Krygier & Wood, 2005; Madej, 2000; Memorial University, 1998; Peterson, 2009).
There is clearly also a wide range of differ-ent digital examples of online mapping systems, online GIS, and electronic atlases, that provide interfaces to either databases via search tools, and/or interactive map searches, as well as provid-ing online mapping tools, and even online GIS. Whilst many examples are simply little more than information systems, other examples allow one to download the actual map data for further analysis in a desktop GIS. Although not every end user requires the data, most simply requiring access to the information, in some cases the demand for datasets for spatial analysis in a GIS can be very advantageous for education, training, and research applications
Problems once associated with being able to read different data formats have largely disap-peared and where data are available for download this is usually available in a number of well rec-ognized and accepted formats that can be easily used directly in GIS software. These are typically ESRI shapefiles and coverages. More recently Google Earth KML Keyhole Markup Language (KML) and KMZ (KML-Zip) files are now often

208
United Kingdom
an option, finding favor as the popularity and functionality of Google Earth and Google Ocean continues to grow.
More emphasis is now also being placed on the development of data models e.g., the Arc Marine data model (http://dusk.geo.orst.edu/djl/arcgis/), and metadata standards for documenting spatial datasets. In Europe the INSPIRE initiative is becoming increasingly relevant to the future of UK (as part of the EU) datasets. However, although much has also been written about na-tional SDI and marine data infrastructures over the years (see Longhorn, 2009) there still seems to be some problems and perhaps even reluctance with translating words into practice, and there is much work still to be done in this area. As noted earlier, this is perhaps one area where the work and collective expertise of ICAN can begin to help to contribute to and drive progress in the future.
The main issue remaining, however, in the UK still lies with copyright and charging associated with digital datasets. On the whole most UK da-tasets are still relatively costly to buy and use and this tends to restrict their use by all the interested parties ultimately hindering attempts to produce Internet-based mapping and GIS systems at the local, regional, and national scale. While it is perfectly acceptable that data should be charged for (after all data costs money to collect, capture, create, and maintain) identifying what seems to be a ‘reasonable’ and ‘acceptable’ cost for use still appears to be quite difficult to achieve. Certainly substantial progress has been made over the years, as can be seen from the many online examples now available. But it would seem that despite the best efforts of people and organizations, many of the online websites are either very specific or are at best are still only partial solutions, despite the general availability of the software tools to create the resources. This is somewhat disappointing given the timeframe over which these ideas have been discussed, and the speed with which the tech-nology has been developed to provide technical solutions. However, at the time of writing, recent
Government-led developments at the Ordnance Survey (OS) have launched a new initiative called OS OpenData designed to provide users with free and unrestricted access to most of its map data (http://news.bbc.co.uk/1/hi/8597779.stm). This is an interesting and welcome step forward and one that will hopefully address many of the issues that have prevented more widespread development of the online examples of marine and coastal atlases in the UK.
SUMMARY AND CONCLUSION
Rapid developments in computer hardware and software have provided considerable opportuni-ties for accessing and sharing geospatial data and information about the marine and coastal environment in the last twenty years. While early examples of marine and coastal atlases provided opportunities for more people to explore and uti-lize such data and information, the Internet and associated software in the form of map and image servers have provided the biggest step forward in providing access to both data and information for the marine and coastal environment. Although still not plug and play solutions, Internet-based map server software is more widely available and can now be more easily configured by virtually anyone with the help of various manuals, tutorials, books and blogs, which means that more people can set up their own web portals and create electronic atlases. With the development of products such as GeoServer, MapServer, TimeMap and more recently Google Earth, and Google Ocean, there is now even more scope to share geospatial data-sets across the net, and to develop digital coastal atlases. The University of Aberdeen, for example, is currently investigating the development of a coastal atlas for the Aberdeen and Aberdeenshire coast (http://www.sacrp.info), and another for the Living North Sea (LNS) (http://www.livingnorth-sea.eu) Project using Google Earth, TimeMap and MapServer.

209
United Kingdom
An historical overview reveals the develop-ment of the hardware and software, networking and communications technology, the Internet, and the growing freedom for the individual to upload and share their geographical data. In the UK though it has been relatively slow to develop and take off. Over the years there have been many examples of proposals, demonstrators, and project-based examples of Internet-based electronic atlases. In the UK, some of the potential and the will seems to have been lost in all the continuing discussions about data availability, data models, spatial data infrastructures, and a general lack of recognition of the value of the Internet as an information resource, as well as continuing to involve people who lack the vision of the potential, underfund-ing, lack of commitment, and to some extent the degree to which it is all become ‘bogged down’ in words rather than actions.. This perhaps goes some way towards explaining the origins and suc-cess of Google Earth! In other parts of the World there would appear to be far fewer constraints and barriers to accessing digital map and chart data which has, not surprisingly, led to the development of some very comprehensive and very appealing online examples of electronic atlases which pro-vide the sort of resource that is desirable by the end-user community, including that in the UK.
Where to now in the UK? ICAN has revealed how useful, important and powerful web-based mapping, atlas, and GIS tools are and, from the list of examples provided, just how successful they have become. The technology is also proven and more and more digital spatial data are becom-ing available. It is a pity then that there are so few UK examples which truly mirror the earlier success of UKDMAP. The resources now avail-able range from the basic to the comprehensive, simple to aesthetic and intuitive interfaces, and basic to sophisticated functionality. Certainly there are some good UK examples and much has been achieved. Yet it would seem, from looking at other examples originating in North America and Europe that we could do so much more and
better in the UK. Perhaps the work of ICAN will provide the required stimulus?
Finally, a thought. Despite the advantages of all this computer-based spatial technology to provide access to and share digital coastal and marine data and information, there are still a number of printed, paper-based examples of atlases being produced around the World (albeit with the use of electronic data and the help of computer soft-ware and usually provided on an accompanying CD/DVD for use in GIS software). While there are clearly advantages and disadvantages of both media, and a certain appeal and practicality as-sociated with the electronic format, it is hard to beat the look and feel of information presented in the form of a bound paper volume. Maybe there is a challenge here to consider new ways of presenting and visualizing coastal and marine information in the electronic atlases of the future that tries to capture some of the visual attraction of the printed atlas? Assuming of course the data are available!
ACKNOWLEDGMENT
The Living North Sea (LNS) Interreg IVB North Sea Region Program: Investing in the future by working together for a sustainable and competi-tive region.
REFERENCES
Alexander,C., &Tolson, J.P.(1990). COMPAS - NOAA’s Coastal Ocean Management, Planning, and Assessment System National Ocean Service, National Oceanic and Atmospheric Administra-tion. Unpublished. Galveston Bay Information Center, (pp. 213-214).
Arc Marine Data Model. (2009). Retrieved Octo-ber 31, 2009 from the OSU Davey Jones’ Locker web site: http://dusk.geo.orst.edu/djl/arcgis

210
United Kingdom
Askew, D., Evans, S., Matthews, R., & Swanton, P. (2005). MAGIC: a Geoportal for the English Countryside. Computers, Environment and Urban Systems, 29, 71–85.
Barne, J., Davidson, N. C., Hill, T. O., & Jones, M. (1994). Coastal and Marine UKDMAP Da-tasets: A User Manual. JNCC Report No. 209. Joint Nature Conservation Committee, Coastal Conservation Branch.
Brewer, C. A. (2005). Designing Better Maps: A Guide for GIS Users. Redlands, CA: ESRI Press.
British Oceanographic Data Centre. (1991). Manual of Inventory of Moored Current Meter Data. Plymouth, UK: British Oceanographic Data Centre.
British Oceanographic Data Centre. (1992). United Kingdom Digital Marine Atlas. Version 2.0. User Guide. Plymouth, UK: British Oceano-graphic Data Centre.
British Ordnance Survey. (2009). Retrieved Oc-tober 31, 2009 from the British Ordnance Survey web site: http://www.ordnancesurvey.gov.uk.
Brown, A., & Feringa, W. (2002). Colour Basics for GIS Users. New York: Prentice Hall.
Centre for Marine and Coastal Zone Manage-ment. (2009). Retrieved October 31, 2009 from the University of Aberdeen web site: http://www.abdn.ac.uk/cmczm.
Channel Coastal Observatory. (2009). Retrieved October 31, 2009 from the Channel Coastal Ob-servatory web site: http://www.channelcoast.org
Current Meter Series Database. (2009). Retrieved October 31, 2009 from the British Oceanographic Data Centre web site: https://www.bodc.ac.uk/data/online_request/current_meters
Data Archive for Seabed Species and Habitats. (2009). Retrieved October 31, 2009 from the Data Archive for Seabed Species and Habitats web site:http://www.dassh.ac.uk.
Data Integration System for Marine Pollution Water Quality. (2009). Retrieved October 31, 2009 from the Nansen Environmental and Remote Sens-ing Center web site:http://www.nersc.no/dismar
Dent, B. D. (2002). Cartography with ArcView GIS Software: Thematic Map Design: With ArcView GIS Software. New York: McGraw-Hill Higher Education.
Directory of Coastal Web Atlases Worldwide. (2009). Retrieved October 31, 2009 from the In-ternational Coastal Atlas Network website:http://ican.science.oregonstate.edu/atlases.
Erdas Imagine. (2009). Retrieved October 31, 2009 from the Erdas, Inc. web site:http://www.erdas.com.
Erle, S., Gibson, R., & Walsh, J. (2005). Mapping Hacks Tips & Tools for Electronic Cartography. O’Reilly.
General Bathymetric Chart of the Oceans GEBCO Digital Atlas. (2009). Retrieved October 31, 2009 from the Global Bathymetric Chart of the Oceans websitehttp://www.gebco.net/data_and_products/gebco_digital_atlas
Geo-Information Decision Support Processing and Dissemination System. (2009). Retrieved October 31, 2009 from the University of Aberdeen web site:http://www.abdn.ac.uk/~geo402/index.htm
GeoServer. (2009). Retrieve dOctober 31, 2009 from the GeoServer website http://GeoServer.org
Global Bathymetric Chart of the Oceans. (2009). Retrieved October 31, 2009 from the Global Bathymetric Chart of the Oceans web site:http://www.gebco.net
211
United Kingdom
Godiva. (2009). Retrieved October 31, 2009 from the Natural Environment Research Council of the UK websitehttp://www.nerc-essc.ac.uk/godiva
Google Earth. (2009). Retrieved October 31, 2009 from the Google Earth web site: http://earth.google.com.
Green, D. R. (1994a). The United Kingdom Digital Marine Atlas: A review. GeoCal, (June), 280-30. Green, D.R. (1994b). Geographic and marine information systems: Some recent developments and progress in the United Kingdom. In Proceed-ings Hydro ’94, The Ninth Biennial International Symposium of the Hydrographic Society, UK Branch (pp. 13-15). Aberdeen Exhibition and Conference Centre. Special Publication No. 33.
Green, D. R. (1994c). Using GIS to construct and update an estuary information system. In Proceedings of Management Techniques for the Coastal Zone. Centre for Coastal Zone Manage-ment, University of Portsmouth. October 24-25, (pp. 129-162).
Green, D. R. (1995). Internet, the WWW and Browsers: The Basis for a Network-Based Geo-graphic Information System (GIS) for Coastal Zone Management. In Proceedings of AGI’95 Conference. Expanding Your World. 21-23 No-vember 1995. (pp. 5.1.1- 5.1.12).
Green, D. R., & King, S. D. (1998). The UK Coastal Map Creator: ArcIMS provides a solution to coastal map and data delivery for the United Kingdom’s coastal community. In Proceedings of the ESRI User Conference, San Diego, CA.
Infoterra. (2009). Retrieved October 31, 2009 from the Infoterra website http://www.infoterra.co.uk/.
interactive Spatial Explorer and Administrator. (2009). Retrieved October 31, 2009 from the Cen-ter for Environment, Fisheries and Aquaculture Science, UK websitehttp://www.cefas.co.uk/isea
International Council for the Exploration of the Sea. Denmark ICES Fishmap. (n.d.). Retrieved from http://www.ices.dk/marineworld/ices-fishmap.asp.
InterRisk. (2009). Retrieved October 31, 2009 from the Nansen Environmental and Remote Sensing Center websitehttp://interrisk.nersc.no
Jones, M. T., Tabor, A. R., & Weatherall, P. (1994). Supporting Volume to the GEBCO Digital Atlas. British Oceanographic Data Centre (BODC). Swindon, UK: Natural Environment Research Council.
Krygier, J., & Wood, D. (2005). Making Maps: A Visual Guide to Map Design for GIS. New York: The Guildford Press.
Longhorn, R. (2009). Coastal and marine data infrastructure . In Green, D. R. (Ed.), Coastal Zone Management (pp. 206–225). London: Thomas Telford Limited.
Lowry, R. K., Cramer, R. N., & Rickards, L. J. (1992). North Sea Project CD-ROM User’s Guide. British Oceanographic Data Centre. Swindon, UK: Natural Environment Research Council.
Madej, E. (2000). Cartographic Design Using Arcview GIS. Albany, NY: OnWord Press.
MapWindow. (2009). Retrieved October 31, 2009 from the MapWindow websitehttp://www.mapwindow.org
Marine and Coastal Environmental Information Services. (2009). Retrieved October 31, 2009 from the Marine and Coastal Environmental Services website http://gmes-marcoast.com
Marine Digimap. (2009). Retrieved October 31, 2009 from the Marine Digimap websitehttp://edina.ac.uk/digimap/description/marine_over-view.shtml

212
United Kingdom
Marine Environment Data and Information Net-work. (2009). Retrieved October 31, 2009 from the Marine Environmental Data and Information Network websitehttp://www.oceannet.org
Marine Irish Digital Atlas. (2009). Retrieved October 31, 2009, from the Marine Irish Digital Atlas website:http://mida.ucc.ie
Memorial University. (1998). Guide to Map De-sign and Production Using CorelDRAW 7 and CorelDRAW 8. St. Johns, Newfoundland, Canada: Memorial University of Newfoundland.
Microsoft Virtual Earth. (2009). Retrieved October 31, 2009 from the Microsoft Virtual Earth web site:http://www.microsoft.com/maps/.
Minnesota MapServer. (2009). Retrieved October 31, 2009, from the Minnesota MapServer web site: http://www.MapServer.org.
Mr. Sid. (2009). Retrieved October 31, 2009 from the Lizard Tech websitehttp://www.lizardtech.com
Multi-Agency Geographic Information for the Countryside. (2009). Retrieved October 31, 2009 from the Multi-Agency Geographic Information for the Countryside web site: http://www.magic.gov.uk.
MyOcean Service. 2009-2012. (2009). Retrieved October 31, 2009 from the My Ocean web site:http://www.myocean.eu.org.
NERC Earth Observation Data Acquisition and Analysis Service. (2009). Retrieved October 31, 2009 from the Natural Environment Research Council web site:http://www.npm.ac.uk.
OgleEarth. (2009). Retrieved October 31, 2009 from the OgleEarth web site:http://www.oglee-arth.com.
Peterson, G. N. (2009). GIS Cartography: A Guide to Effective Map Design. Boca Raton, FL: CRC. doi:10.1201/9781420082142
Plymouth Marine Laboratory. (2009). Retrieved October 31, 2009 from the Plymouth Marine Laboratory web site:http://www.pml.ac.uk.
Proudman Oceanographic Laboratory Observa-tory. (2009). Retrieved October 31, 2009 from the Proudman Oceanographic Laboratory Oberva-tory web site:http://cobs.pol.ac.uk/gmapper/
Scottish Marine Bill. (2009). Retrieved Oc-tober 31, 2009 from the Scottish government web site:http://www.scotland.gov.uk/Publica-tions/2009/09/28115722/0.
SeaData Net. (2009). Retrieved October 31, 2009 from the British Oceanographic Data Centre web site:http://www.bodc.ac.uk/projects/european/seadatanet/.
SeaZone. (2009). Retrieved October 31, 2009 from the SeaZone Solutions web site:http://www.seazone.com.
Shape2Earth. (2009). Retrieved October 31, 2009 from the Shape2Earth web site: http://shape2e-arth.com.
UK Digital Marine Atlas. (2009). Retrieved October 31, 2009 from the UK Digital Marine Atlas web site:http://www.bodc.ac.uk/products/bodc_products/ukdmap.
UK Marine Bill. (2009). Retrieved October 31, 2009 from the Department of Environment, Food and Rural Affairs web site:http://www.defra.gov.uk.
UKSeaMap. (2009). Retrieved October 31, 2009 from the Joint Nature Conservation Committee web site:http://www.jncc.gov.uk/page-3663.
UNESCO. (1989). Bilko Software. Retrieved-October 13, 2009, from the UNESCO-Bilko web site:http://www.noc.soton.ac.uk/bilko.

213
United Kingdom
Wave Data Series. (2009). Retrieved October 31, 2009 from the British Oceanographic Data Centre web site:https://www.bodc.ac.uk/data/online_request/waves/.
WaveNet. (2009). Retrieved October 31, 2009 from the Center for Environment, Fisheries and Aquaculture Science, UK web site: http://www.cefas.co.uk/wavenetmapping.
Western Channel Observatory. (2009). Retrieved October 31, 2009 from the Western Channel Observatory web site:http://www.westernchan-nelobservatory.org.uk.
World Wind, N. A. S. A. (2009). Retrieved Oc-tober 31, 2009 from the NASA World Wind web site:http://worldwind.arc.nasa.gov.
KEY TERMS AND DEFINITIONS
Coastal Web Atlas: A collection of digital maps and datasets with supplementary tables, illustrations and information that systematically illustrate the coast, oftentimes with cartographic and decision support tools, all of which are acces-sible via the Internet. Also known as web atlas, digital atlas, digital coastal atlas.
Coastal and Marine Information: Both spatial and non-spatial information regarding the coastal and marine areas of a region or country.
Metadata: Metadata in the geographical do-main is structured information on a dataset, which
helps the data owner to document and catalogue the data, whilst helping a data user to understand the content and fitness for use of a dataset.
Spatial Data Infrastructure or SDI: A framework via an organization of people or government agencies, via the Internet, or via a series of guiding policies or standards to assist people with acquiring, processing, using, and preserving spatial data. The spatial data are often in geographic information system (GIS) format, are not, but not limited to this.
Spatial Data Visualization: The ability to view digital data with a spatial dimension in a computer environment containing a coordinate reference system.
Web GIS: A geographical information system which can be accessed over the Internet and allow visualization and interaction with spatial data via a map as well as providing analysis functionality such as spatial analysis, querying and buffering.
Virtual Globe: A three-dimensional visual rendering of the Earth or of other planets, usu-ally available as online software application, or as an application for the desktop. A virtual globe provides the user with the ability to navigate throughout the virtual world freely in all directions, by changing viewing angle, azimuth, and heading. A virtual globe is primarily a visualization tool (oftentimes open source) and is not completely synonymous with a geographic information sys-tem in terms of spatial analysis capabilities. Examples include Google Earth, NASA World Wind, and Microsoft Virtual Earth.

256
Copyright © 2011, IGI Global. Copying or distributing in print or electronic forms without written permission of IGI Global is prohibited.
Chapter 17
Creating a Usable AtlasTimothy Nyerges
University of Washington, USA
Kathy BelpaemeCoordination Centre on Integrated Coastal Zone Management, Belgium
Tanya HaddadOregon Coastal Management Program, USA
David HartUniversity of Wisconsin Sea Grant Institute, USA
INTRODUCTION
Coastal Web Atlas (CWA) specialists at a work-shop about coastal mapping and informatics (O’Dea et al., 2007) concluded that existing atlases are sometimes too complicated for general audi-ences. Recommendations were made to suggest that: (1) development must be responsive to user needs; (2) developers should consider designing
multiple interfaces and capabilities to offer a range of services; and (3) regular user feedback is crucial for atlas success. This chapter is written in the general spirit of providing guidelines for creating a usable CWA; it is directed at designers and developers. Previous chapters have already provided insight about the capabilities of a CWA, and therefore the focus here is on what makes those capabilities more or less usable.
ABSTRACT
Knowing user audiences for coastal web atlases is important for designing atlas capabilities that ad-dress different user skill levels. This chapter presents guidelines about how to better understand coastal web atlas users, how to undertake user-centered design and development, and how to avoid major pitfalls with web interfaces. User groups are formed based upon understanding user characteristics. User-centered design for different user groups can take advantage of a logic model; that is, a series of steps for scoping, designing, implementing and testing the capabilities. The end result of design and implementation should be a usable system, thus software usability is an important goal. Regardless of how well designers know users, web interface pitfalls inevitably arise during the development process, some of which are discussed based on personal experience of the chapter authors.
DOI: 10.4018/978-1-61520-815-9.ch017

257
Creating a Usable Atlas
Design information including basic constructs for developing CWAs has been presented in previ-ous chapters. However, it is important to reiter-ate that basic CWA constructs such as map data layers with various themes and tool capabilities such as pan, zoom and search form the basis for generating information for a user. Users develop an understanding of a CWA in their heads based on what they know and as they experience the tools and information in a CWA. Developers must be able to “connect” their intended designs of constructs to what users already understand, at least partially to begin with, and to help users learn about the world.
The chapter begins by helping the reader understand the general nature of users based on their backgrounds and associated abilities, their information needs, and their expectations for a CWA. We continue the chapter by providing a bit more detail about how to conduct usability studies as a systematic approach for evaluating CWA user interfaces and capabilities accessible through those interfaces. We end the chapter by examining some of the pitfalls that developers might incur while developing user interfaces.
UNDERSTANDING USERS
When understanding use of GIS-based CWA ap-plications, whether they are supported by single-user workstation or web-based technologies, it is crucial to take into account the nature of users. Users can be described in terms of characteris-tics of people as in their abilities, user needs for information, and expectations of users (Nyerges, 1993). Combining some of those characteristics helps us form user groups, whether we consider the whole of the group or individuals. When un-derstanding user groups, some developers might emphasize an “audience” perspective while others might emphasize an individual user perspective. An audience is a user group whereas the user is an individual with certain qualities. One way to
bridge the divide between the two perspectives is to articulate “prototypical users,” as we can never fully understand all the details of single users, nor all the characteristics of an aggregated audience. We need to make some simplifying assumptions about who will use a CWA. Toward that end, the subsections that follow emphasize how we characterize user abilities, the information needs of users, and the expectations of users.
User Abilities
Users have different abilities. For example, some people are more technically-skilled than others, and thus can understand complex information displays as part of the user interface of tools, while other users are more challenged to understand such displays. Some users have more experience problem solving within a particular substantive area, while others have less experience with such problems. Such qualities are rather difficult to track, and thus difficult to generalize across, hin-dering our understanding of users. More general qualities that can give us a better understanding about user abilities include user background and perspective. Our understanding of background and perspective make it easier to develop user group categories.
USER BACKGROUND: A QUALITYINHERENT TO A USER (GROUP)
People have certain qualities gained through liv-ing their lives based on choices and constraints in social settings.
• Age – years of personal experience being exposed to various topics
• Education/experience – formal / informal training ◦ Problem solving ability
• Number of years addressing a problem ◦ Technical/computer ability

258
Creating a Usable Atlas
• Number of years working with computer-ized information systems
• Hours per week spent working with com-puterized information systems
• Culture – community context / worldview based on upbringing
User Perspective: A Quality Characterizing how People View Information
People have roles largely due to responsibility, authority, and/or interest in a topic, for example as technical specialists, executives, members of a public, and educators. A person might have one or more of those roles at any given time.
• Technical Specialists focus on problem articulation/elucidation ◦ Scientists ◦ Resource analysts/researchers
• Executives focus on responsibility for managing community well-being ◦ Policy/Decision makers ◦ Elected officials
• Public at large focus on valued concerns about their place/identity in the world ◦ Stakeholder interest groups ◦ Property owners
• Educators focus on what/how/why people learn ◦ Primary and secondary school age ◦ Higher education ◦ Life-long (social) learning
An enumeration of the types of user groups targeted by the developers of a selected set of CWA is shown in Table 1 (O’Dea et al., 2007). A variety of user groups have been targeted. Clearly, different organizations have different purposes in mind for respective CWA’s.
Developing software systems for all intended user groups identified in Table 1 is not easy, particularly if developers want to gain empirical insight into the goals and motivations of groups. How we collect information about users and what they like, do not like, how they perform tasks and work with information are key concerns. However, in this chapter, we want to continue to explore more about the general issues associated with a usable atlas. To do that we recognize that the groups listed in Table 1 have different responsibilities to work with information. As such, the different groups have different information needs. We now turn to how to understand better user information needs.
User Needs
User needs for information differ depending upon the user group targeted. Thus, the first step is to know your audience as discussed in the previous section. Once the target audiences have been identified, then information needs can be elicited for each of the groups. Below is an example from experience with the Belgian Coastal Atlas.
• Scientist users need detailed and complex information (about diverse aspects of the coast) perhaps presented using graphs, maps, etc.
• Policy and decision maker users need se-lected information directed towards policy advice, with clear interpretations and/or indications. The interface must be user-friendly and less scientific, avoiding tech-nical complexity with clear messages and comprehensible figures. The atlas could be integrated with policy supporting tools (e.g., sustainability indicators, scenario building, case studies, etc.).
• Public users need easily accessible and transparent capabilities that contain basic information of interest for a wide audience.

259
Creating a Usable Atlas
• Educational users need information pre-pared in ready to use education tools/packages.
Once a general idea of the content has been articulated, a next step is to define the geographic area(s) to be covered by the themes and overall by the atlas including both the seaward and landward boundary. The Belgian Coastal Atlas was unique in its approach, as it covered the land as well as the seaside of the coast from the very beginning. Many atlases still cover either the land or the sea-side. From an integrated coastal zone management perspective, it is important to stress the need for integrated coastal and marine maps and informa-tion because of the intricate link between the two environments and the need for an integrated policy and management over the land-sea interface. This has been stressed in the European Maritime Policy and in the integrated coastal zone management
communication (European Commission, 2000). Opportunities for stimulating integrated manage-ment and policies are missed if developers do not consider the landward side as well as the coastal seaward side.
Having defined the area, the more detailed themes/sectors that are to be included need to be considered. Will the content cover one theme/sector (biological atlas, social atlas) or several themes? One way to enumerate the themes is to aggregate the topics across a series of use cases.
The concept of use case has been developed as a way of characterizing complex tasks addressed through information technology capabilities. At its core, a use case contains a description of a series of invoked software actions to accomplish a task that are characterized from the point of view of a user. A use case scenario sets specific assump-tions/parameters about a use case. The scenario
Table 1. User groups (target audience) of selected CWA’s (based on targeted audiences identified in O’Dea et al., 2007)
User groups Coastal Web Atlas1
A B C D E F
General Public √ √ √
Tourists √ √
Students √ √
Researchers/Scientists √ √ √ √ √
NGOs √ √ √ √ √
Government/Public Bodies √ √ √ √ √ √
Commercial/Industry √ √ √
Consultancies √ √ √ √ √ √
Coastal/Environmental Managers √ √ √ √ √ √
Decision Makers √ √ √ √ √ √
Other: Outreach1Coastal Web Atlas column identifierA. The UK Coastal and Marine Resource AtlasB. DE Kustatlas Online, BelgiumC. The Marine Irish Digital AtlasD. The Oregon Coastal AtlasE. North Coast Explorer, OregonF. Mapping Tools for Coastal Management, Virginia
260
Creating a Usable Atlas
helps to refine (putting constraints on) the use case actions to address the task goal.
As an example, a coastal erosion use case is being developed as part of the initial ICAN effort addressing data interoperability (Wright et al., 2007). The initial user focus of ICAN is on regional planners/resource managers, property owners, emergency response teams, and local CWA system administrators (aka atlas administrators) that ad-dress coastal erosion. Hazard-related information and the boundaries of regulatory jurisdictions are routinely required for land and ocean planning, regulatory, and enforcement work. Eventually, the outcomes are meant to improve the ability of agency staff to quickly and efficiently analyze local geographic patterns of hazards, community development, and jurisdiction in a regulatory and/or planning context. The use case can be used to characterize and evaluate issues and impacts related to coastal erosion, but could also be used to inform and educate the public and coastal zone management community. Generalizing across the information needs of the information users listed above, a collection of key datasets for this use case includes the following:
• Coastal access and recreation• Coastal armoring• Cadastral datasets with assessor attribution• Geology• Land use and zoning• Current shoreline position• Historic shoreline positions• Permit tracking systems and a dynamic
link to cadastral data• Aerial imagery• Streams• Beaches• Bluff and dune fields• Regulatory jurisdictions• Community development• Geomorphology profiles• Erosion Risk study results – Risk Zones or
Lines
• Topography• Wave climate data• Shallow water bathymetry• Transportation networks• Public utilities• Public lands
Aggregating the data themes across applica-tions provides a first pass summary of the infor-mation content of interest to users, or what users might expect to find in an application.
User Expectations
Software can have widely varying degrees of consistency. User expectation refers to the consistency that users expect from products. Interaction design deals with the organization of design elements, such as CWA constructs employed for a user interface, particularly when implemented as a sequence of actions. A good design principle to use in interaction design is to follow the “Principle of least astonishment”. In the case of interactive software applications, for example, users form expectations based on their experience with similar kinds of software. Effec-tive interaction design aims to conform to norms for user behavior about software interfaces and responsiveness. Many design features were identi-fied at the 1st Coastal Mapping and Informatics Workshop that are relevant to the expectations of a user-centered interaction design (O’Dea et al., 2007). These features were organized using a framework for strengths, weaknesses, opportuni-ties, and threats (SWOT).
Strengths of CWA Design
• Intuitive structure of web sites and map pages;
• Inclusion of contextual information in or-der to better understand the data;
• Hierarchical data organization;

261
Creating a Usable Atlas
• Multiple user pathways to retrieve maps and layers of interest;
• Tools for data analysis and creating reports.
Weaknesses of CWA Design
• The cartography / design challenge of dis-playing many layers;
• Inadequate database management system for efficient management of information; metadata and data;
• Inadequate search functions for data and content;
• Failure to meet user needs where atlas de-velopments are technology-driven;
• Lack of distributed systems to enable data owners to share and manage their own data.
Opportunities for Better CWA Design
• Improved cartographic display of large quantities of layers in coastal atlases;
• Potential for sharing data through distrib-uted networks (e.g., utilizing Web Map Services and Web Feature Services);
• Potential to develop regional nodes that tie in with larger atlases (e.g., national or statewide).
Threats to CWA Design
• Keeping up with design expectations of us-ers (e.g., Google Earth);
• User interpretation: misunderstanding of how to use atlases or their components.
Developers can address surprises with user expec-tations by detailing use cases to the extent that both users and developers can agree on the sequencing of CWA actions. Having users participate in the articulation of use cases with developers, called user consultation, fosters shared understanding
among users and developers with regard to atlas capabilities, and will also make it easier to iden-tify pitfalls and eventually the problems once the system is developed. Influences on use case action sequencing might consider each of the SWOT is-sues raised above. Developers and users should agree on which to address and which can be left for another time. More details about developing use cases are presented below.
USER-CENTERED DESIGN
User-centered design can be used to help guide the development of a CWA (Lazar, 2006). By the nature of its name, user-centered design is an ap-proach to system design that makes users important participants in the design process. User-centered design is a design philosophy and a process in which the needs, wants, and limitations of the end user of an interface or document are given extensive attention at each stage of the design process. User-centered design can be character-ized as a multi-stage problem solving process that not only requires designers to analyze and foresee how users are likely to use an interface, but also to test the validity of their assumptions with regards to user behavior in real world tests with actual users. Such testing is necessary as it is often very difficult for the designers of an interface to understand intuitively what a first-time user of their design experiences (Wikipedia, 2008). When one considers users to be an important part of the broader process of implementing, testing and evaluating systems, then one is engaging in a user-centered development process.
A productive approach for engaging users within design and development of a CWA is the use of a LOGIC Model. A LOGIC model is a structured process that integrates project design and evalua-tion (Mayeske & Lamber, 2001; McLaughlin & Jordan, 1999). Developers pose the design from input provided by users. Evaluation involves an

262
Creating a Usable Atlas
assessment of how well the design features sup-port the use case (user) actions.
Kramer (2008) describes one type of LOGIC model consisting of three stages for user-centered design within the context of user-centered devel-opment of the Canadian Atlas. The first stage is an examination of business requirements. The second stage is detailed user requirements. The third stage involves systems design, including product design. Others might see more steps, but seldom would we have fewer steps in the devel-opment process. An important point, no matter whose version of user-centered design one might take, the user is always placed “front and center” in the overall process.
The University of Wisconsin Sea Grant Insti-tute and its partners are utilizing a LOGIC Model in developing the Wisconsin CWA. The process includes conducting an inventory of potential CWA partners to ascertain data capabilities, contact information, etc.; forming an advisory committee with broad representation of coastal constituencies; completing the LOGIC model for the project; documenting objectives, outputs, and outcomes; and utilizing collaborative technologies to share the LOGIC Model with members of the ICAN for review and critique. It is worth noting that the U.S. National Oceanic and Atmospheric Administration (NOAA) has adopted the LOGIC Model as a means to ensure that coastal manage-ment projects are well designed and that it is easy to measure the performance of projects as they are implemented and offers training courses on project design and evaluation that features the LOGIC Model (NOAA CSC, 2009).
In the user-centered design paradigm, some of the users become actual or de facto members of the design team. The term user friendly is often used as a synonym for usable, though it may also refer to accessibility of capabilities. Usability is a term that denotes the ease with which people can employ a particular tool, display, or other capability to achieve a particular goal. For several years Haklay (2009) has been researching the
advantages of usability engineering for develop-ment of geographic information systems (GIS), including web GIS. That research has “…focused on the way in which ‘common users’ of GIS and geospatial technologies use these systems. The aim is to understand how the interfaces work and how to improve them so they will be effective, efficient and enjoyable to use” (Haklay, 2009). Us-ability can also refer to the methods of measuring usability and the study of the principles behind an object’s perceived efficiency or elegance. To continue the theme of what makes a usable atlas, we focus on the issues concerned with the former rather than the latter.
The primary notion of usability is that an object designed with the users’ psychology and physiology in mind is, for example:
• More efficient to use – it takes less time to accomplish a particular task;
• Easier to learn – operation can be learned by observing the object;
• More satisfying to use – a sense of produc-tivity; and
• Understanding CWA usability develops from understanding both user-centric and technology-centric issues. User-centric is-sues address the abilities, needs, and ex-pectations of users. Technology-centric issues address the capabilities presented to users for addressing their needs and expectations.
Usability evaluation starts with the develop-ment of a set of use cases (defined earlier in the user needs section) that are representative of the kinds of activities users will perform. Use cases can be drafted and adopted jointly by users and developers as “agreements” about the kinds of information linked to the kinds of capabilities to be offered within a CWA. A single use case as a narrative can contain many elements. However, to make a narrative somewhat systematic, some designers recommend using templates for devel-

263
Creating a Usable Atlas
oping use cases. Below is a template based upon the Wikipedia description that is quite thorough in comparison to several academically-oriented descriptions of a use case (Wikipedia, 2008). Developers can use this template as a quick guide for detailing use cases, adding or removing char-acteristics as appropriate to each case.
• Use case name: A unique descriptor, short and to the point.
• Version: Versions help users and develop-ers track what changes, as use cases can be revised through iterative steps of creating and/or updating an atlas.
• Goal: With a user in mind, in its simplest sense the goal of a use case could take the form of a question that is posed. Questions beg answers. Since every (or at least al-most any) statement can be transformed easily into a question, we use the ques-tions because they motivate users to seek information.
• Summary: The brief description of the use case that can be consulted when someone wants to scan an overview.
• Actors: The user groups identified in sec-tion 17.1 form the basis for describing actors in a use case. As mentioned above various user groups have different needs for information, and thus the questions are likely to vary depending on user group actors.
• Preconditions: Preconditions are the basic inputs to a question, perhaps assumptions being made about the circumstances under which a question would be asked.
• Triggers: Triggers are what activate the questions, perhaps in the circumstances set up as part of preconditions.
• Basic course of actions: The basic course of actions in the use case is the sequence of capabilities to be invoked by a user group actor once the preconditions are in place. These events would be the button pushing,
keystrokes or screen picks made to initiate computer activities within the atlas.
• Alternative paths: A work-around to the basic course of events, if it is possible.
• Postconditions: What results from the ex-ecution of the basic course of events?
• Business rules: Business rules are the gen-eral guidelines established by an organiza-tion for the ways of carrying out activities. Such rules might or might not apply to the use of certain information within certain conditions of seeking information, e.g., constrains on accessing information from certain sources.
• Notes: An ancillary information that could help interpret the use case, e.g., if there are special circumstances for its inclusion in development effort.
• Author and date: Sometimes, the template has variations, and it would be good to know whose creative input was used to es-tablish that variation.
It is nearly impossible to specify all the ca-pabilities and information to be designed, and thus a diverse collection of use cases, each with perhaps two or more scenarios, provide a sampling of what is to be created, and when tested, what was actually created in the software. Use cases can be prioritized to provide developers and users with a shared understanding about what is more important and less important.
WEB INTERFACE PITFALLS
All CWAs are websites, and thus need to consider and avoid common web interface mistakes that can materially detract from any user experience. In addition, due to the importance of maps and interactive map interfaces in CWA implementa-tion, certain interface “caution areas” related to maps should also be considered.

264
Creating a Usable Atlas
In regards to common web interface mistakes, Nielsen & Loranger (2006) present a long list of web interface characteristics that can pose significant usability problems for users. They note that over the past decade, some old interface problems have become no longer relevant, while many others continue to be serious. If possible, designers should avoid or minimize use of features that those authors deem persistent “high-impact usability problems”. Such serious issues include the following:
• Links that don’t change color when visited.• Breaking the back button.• Opening new browser windows.• Pop-up windows.• Design elements that look like
advertisements.• Violating web-wide conventions (e.g.,
what can be clicked, and how).• Non-existent content and empty claims.• Dense content and unscannable text.
These items are provided as a checklist over-view of typical web usability problem areas, and it is recommended that designers research the issues more thoroughly to understand how these problems might impact their design.
With regards to the particular hazards of incor-porating maps and interactive map interfaces into a CWA, the issues are different depending whether static or interactive maps are being considered.
With static maps, many of the important issues to consider are those that are standard in conven-tional cartography. Legibility, ease of interpreta-tion, and communication of essential information such as scale, map projection, metadata, etc. are all typical issues. These are complicated slightly on the web by issues of screen resolution (different screen resolutions can alter the scale of a displayed map if it has been rendered to display at a certain number of pixels per inch), available colors (some web image type palettes may be limited, causing maps to render poorly), and the inconsistencies
of print vs. on-screen display renderings (typical rendering for print requires higher resolution than screen display, and this can alter the size of map elements such as labels and symbols). Coping with these cartographic challenges is inherent in any map-making exercise, while mastering the specific challenges of web maps will require close study of and experimentation with the specific map rendering software employed by each CWA.
When discussing interactive map interface hazards, all those items that pertain to static maps remain of concern, and in addition, the designers must consider the usability difficulties that might come with the addition of interactions such as panning, zooming, feature identification, feature search, and any other advanced map widget used in the mix. Harrower & Sheesley (2005) make the point that an interactive map that feels “natural” or “intuitive” to the user is not something based purely on design, but is a combination of the predisposition of the user (their level of need to accomplish a task, and their prior experience with similar tasks), as well as their level of exposure to any one specific design and the amount of rep-etition (or practice time) they have had with that design. As a result, testing of complex interactive map tools with real users asked to perform real tasks is the primary way that designers can obtain insight into how specific map interface features perform for the intended audience.
CONCLUSION
Knowing who the user groups are for coastal web atlas design, development, and evaluation is a necessary factor in successful user-centered design, but it is not sufficient for success. A sys-tematic approach to user-centered design should use a logic model to frame the series of steps for engaging with users. Usability comes about by having users test software in multiple phases.
Inevitably, web interface pitfalls will arise. Sometimes this occurs because of “feature creep”,
265
Creating a Usable Atlas
that is, users ask for this and that feature as the system moves forward in development. Designers should stay vigilant for the “high impact” usability problems as part of the design; as such vigilance can reduce and/or eliminate problems before they enter the development phase.
REFERENCES
De Kustatlas Vlaanderen/België. (2005). Re-trieved December 11, 2008 from Kustatlas web site: www.kustatlas.be.
European Commission. (2000). Communica-tion from the Commission to the Council and the European Parliament on Integrated Coastal Zone Management: a Strategy for Europe (COM/2000/547), adopted 27 September, 2000. Retrieved July 2, 2009, from the European Com-mission web site: http://ec.europa.eu/environ-ment/iczm/ comm2000.htm.
Haklay, M. (2009). Human-Computer Interac-tion and Usability of GIS. Retrieved February 12, 2009 from UCL web site: http://homepages.ge.ucl.ac.uk/~mhaklay/usability.htm.
Harrower, M., & Sheesley, B. (2005). Designing better map interfaces: A framework for panning and zooming. Transactions in GIS, 9(2), 77–89. doi:10.1111/j.1467-9671.2005.00207.x
Kramers, R. E. (2008). Interaction with maps on the Internet – A user centered design approach for the Atlas of Canada . The Cartographic Journal, 45(2), 98–107. doi:10.1179/174327708X305094
Lazar, J. (2006). Web usability: a user-centered de-sign approach. Boston: Pearson Addison Wesley.
Mayeske, G. W., & Lambur, M. T. (2001). How to Design Better Programs: A Staff Centered Stakeholder Approach to Program Logic Model-ing. Crofton, MD: The Program Design Institute.
McLaughlin, J. A., & Jordan, G. B. (1999). Logic models: A tool for telling your program’s performance story. Evaluation and Program Planning, 22(1), 65–72. doi:10.1016/S0149-7189(98)00042-1
Nielsen, J., & Loranger, H. (2006). Prioritizing Web Usability. Berkeley, CA: New Riders.
NOAA Coastal Services Center. (2009). Project design and evaluation . Coastal Connections, 7(2), 1–3.
Norman, D. (1990). The Design of Everyday Things. New York: Double Day.
Nyerges, T. (1993). How do people use geographi-cal information systems? In Medyckyj-Scott, D., & Hearnshaw, H. (Eds.), Human Factors in Geographical Information Systems (pp. 37–50). London: Belhaven Press.
O’Dea, L., Cummins, V., Wright, D., Dwyer, N., & Ameztoy, I. (2007). Report on Coastal Map-ping and Informatics Trans-Atlantic Workshop 1: Potentials and Limitations of Coastal Web Atlases. University College Cork, Coastal & Marine Re-sources Centre: Cork, Ireland. Retrieved May 7, 2009, from the ICAN web site: http://ican.science.oregonstate.edu/node/47.
Wikipedia, (2008). Use Case. Retrieved Decem-ber 11, 2008 from the Wikipedia web site: http://en.wikipedia.org/wiki/Use_case.
Wright, D. J., Watson, S., Bermudez, L., Cummins, V., Dwyer, N., O’Dea, L., et al. (2007). Report on Coastal Mapping and Informatics Trans-Atlantic Workshop 2: Coastal Atlas Interoperability. Oregon State University: Corvallis, Oregon. Re-trieved July 29, 2009 from the ICAN web site: http://ican.science.oregonstate.edu/node/46.

266
Creating a Usable Atlas
KEY TERMS AND DEFINITIONS
Logic Model: A structured process that inte-grates project design and evaluation as part of the overall steps in development of software systems.
Usability: The ease with which people can employ a particular tool, display, or other capabil-ity to achieve a particular goal.
Use Case: Contains a description of a series of invoked software actions to accomplish a task.
User: A person that makes use of software.User Abilities: The level of skills that a par-
ticular user possesses, but can also be attributed to a user group.
User Background: A collection of character-istics relevant to a particular user group.
User-Centered Design: A perspective on software system design that places the user ‘front and center’ in the design process.
User Expectations: Refers to the consistency that users expect from products.
User Group: A collection of users with the same set of characteristics for which the system is designed and intended.
User Needs: A collection of information (composed of information products and/or out-comes) that is relevant to a particular user and/or a user group.
User Perspective: An outlook on information that derives from responsibility and/or role within an organization.
Web interface: The style and tools presented to users for the purpose of interacting with the atlas.