Embed Size (px)
Citation preview

COASTAL HYDRAULICS REPORT
FINAL DESIGN
October 2019

EAST SIDE COASTAL RESILIENCY –COASTAL HYDRAULICS REPORT
FINAL DESIGN
arcadis.com
EAST SIDE COASTAL
RESILIENCY
Coastal Hydraulics Report
Final Design
Prepared for:
New York City Department of Design and
Construction in partnership with New York City
Mayor’s Office of Recovery and Resiliency and
New York City Department of Parks and
Recreation
Prepared by:
Arcadis of New York, Inc.
27-01 Queens Plaza North
Suite 800
Long Island City
New York 11101
Tel 718 446 0116
Fax 718 446 4020
Our Ref.:
NYCDAKRF.0000.00003
Date:
October 30, 2019
This document is intended only for the use of
the individual or entity for which it was
prepared and may contain information that is
privileged, confidential and exempt from
disclosure under applicable law. Any
dissemination, distribution or copying of this
document is strictly prohibited.
Ryan Stoddard, PE.
Principal Engineer/Civil
Joseph Marrone, PE
Area Leader – Coastal and Urban Resiliency
Walter Baumy, PE
Principal Engineer/National Technical Manager

EAST SIDE COASTAL RESILIENCY –COASTAL HYDRAULICS REPORT
FINAL DESIGN
arcadis.com i
CONTENTS
Acronyms and Abbreviations ........................................................................................................................ iv
Executive Summary ....................................................................................................................................... 1
1 INTRODUCTION.................................................................................................................................. 1-1
1.1 Background .................................................................................................................................. 1-2
1.2 Tide Range .................................................................................................................................. 1-3
2 FLOOD PROTECTION ALIGNMENT .................................................................................................. 2-1
3 STORM TIDE CONDITIONS ............................................................................................................... 3-1
3.1 100-Year Coastal Surge Elevation (Design Case) ...................................................................... 3-1
3.2 500-Year Storm Tide (Resiliency Case) ...................................................................................... 3-2
3.3 Storm Tide Time Series ............................................................................................................... 3-2
4 SEA LEVEL RISE CONDITIONS......................................................................................................... 4-1
5 WAVE CONDITIONS ........................................................................................................................... 5-1
5.1 Wave Transects ........................................................................................................................... 5-1
5.2 100-Year Waves at Shoreline ...................................................................................................... 5-1
5.3 100-Year Waves at Levee/Wall ................................................................................................... 5-3
5.4 Wave Time Series........................................................................................................................ 5-3
5.5 500-Year Waves .......................................................................................................................... 5-3
6 WAVE LOADS ..................................................................................................................................... 6-1
6.1 Horizontal Wave Loads ................................................................................................................ 6-1
6.2 Vertical Wave Loads .................................................................................................................... 6-2
6.3 Wave Load Calculations for Features Not Related to Flood Protection. ..................................... 6-3
7 WAVE OVERTOPPING ANALYSIS .................................................................................................... 7-1
7.1 Wave Overtopping Scenarios ...................................................................................................... 7-1
7.2 Critical Wave Overtopping Rates ................................................................................................. 7-2
7.2.1 Minimum Required Crest Elevation for the 100-Year Event ............................................ 7-2
7.2.1.1 90th Percentile SLR (Design Event) ........................................................................ 7-2
7.2.1.2 Adaptations for the 2120s SLR (50th Percentile) .................................................... 7-3
7.2.2 Minimum Required Crest Elevations for the 500-Year Event and No SLR. ..................... 7-5
7.2.2.1 500-Year Event and 50th Percentile SLR ................................................................ 7-5
7.3 Wave Overtopping Volumes ........................................................................................................ 7-6

EAST SIDE COASTAL RESILIENCY –COASTAL HYDRAULICS REPORT
FINAL DESIGN
arcadis.com ii
7.4 Spatial Extent of Overtopped Discharge for Raised Landforms .................................................. 7-6
8 FEMA Requirements for flood protection systems .............................................................................. 8-1
9 NO IMPACT ANALYSIS ...................................................................................................................... 9-1
9.1 Selection of a Representative 100-Year Storm Tide Event ......................................................... 9-1
9.2 ADCIRC+SWAN Simulation Setup .............................................................................................. 9-2
9.3 Water Level Comparisons ........................................................................................................... 9-4
10 Summary of Flood Protection elevation requirements .......................................................................10-1
11 REFERENCES...................................................................................................................................11-1
TABLES
Table 1-1 Example Resiliency Assessment, East 16th St ................................................................. 1-3
Table 1-2 Tide Ranges from Station: 8518750, The Battery, NY ..................................................... 1-3
Table 2-1 FEMA transect numbers, approximate city location and project reach location. ............. 2-3
Table 3-1 FEMA PFIRM 100-year and 500-year Still Water Elevations (for FEMA transects location
see Figure 2-2) ................................................................................................................. 3-1
Table 4-1 SLR Projections in the 2050s/2120s for NYC for the 10th/50th/90th Percentile ................. 4-1
Table 5-1 100-year Wave Height and Wave Period. ........................................................................ 5-2
Table 6-1 Horizontal Wave Loads Results - Flood Protection and Non-Flood Protection Structures -
100-year 90th percentile SWL scenario ............................................................................ 6-3
Table 6-2 Vertical Wave Load - Waterfront Structures - 100-year 90th percentile SWL.................. 6-4
Table 7-1 Summary of Wave Overtopping Analysis ......................................................................... 7-2
Table 7-2 Maximum Overtopping Rates - 100-year Event 2050s with the 90th percentile SLR. ..... 7-3
Table 7-3 Maximum Overtopping Rates 2120s 100-year event with the 50th percentile SLR ....... 7-4
Table 7-4 Maximum Overtopping Rates Current Day 500-year Event with no SLR. ...................... 7-5
Table 7-5 Minimum Required Crest Elevations 2050s- 500-year event with the 50th percentile SLR.
.......................................................................................................................................... 7-6
Table 7-6 Upper Boundary of Overtopped Water Volumes in Elevated Land Mass of East River
Park. ................................................................................................................................. 7-7
Table 10-1 Summary of Minimum Required Crest Elevations for the Design Event (2050s 30 inches
of SLR) ...........................................................................................................................10-1
Table 10-2 Summary of adaptation requirements for the 500-year event (with no SLR and with the
50th percentile SLR projection in the 2050s) and for the 100- year event with SLR
projections in the 2120s. ................................................................................................10-3

EAST SIDE COASTAL RESILIENCY –COASTAL HYDRAULICS REPORT
FINAL DESIGN
arcadis.com iii
FIGURES
Figure 2-1 Final Design Flood protection alignment from Montgomery Street in the south to East 25th
Street in the north. ............................................................................................................ 2-1
Figure 2-2 FEMA Transects along the project alignment, and project reaches. ............................... 2-2
Figure 2-3 Proposed cross-section at station 18+43 featuring an I-wall as flood protection measure.
.......................................................................................................................................... 2-4
Figure 2-4 Proposed cross-section at elevated park waterfront (buried floodwall not shown) .......... 2-4
Figure 2-5 Proposed cross-section at station 212+96 featuring a L-wall as flood protection measure.
.......................................................................................................................................... 2-5
Figure 3-1 Parametric storm tide time series for the 100-year and 500-year events. ....................... 3-3
Figure 6-1 Schematic of horizontal pressure distributions on a vertical wall. .................................... 6-1
Figure 6-2 Basic wave loads on a horizontal element. ...................................................................... 6-2
Figure 6-3 Reaches along the East River Park. ................................................................................ 6-3
Figure 7-1 Schematic of Wave Overtopping at a Vertical Wall ............................................................. 7-1
Figure 9-1 Storm Tide Time Series for all FEMA PFIRM Events, the Parametric Fit Time Series, and
Two Potential 100-year Storm Tide Events. ...................................................................... 9-1
Figure 9-2 Raw comparison of FEMA PFIRM mesh (top) and the enhanced mesh (bottom) used in this
analysis. Mesh size shown in ft. Alignment shown by solid black line. .............................. 9-2
Figure 9-3 100-year Peak Storm Tide Elevations With and Without the Flood Protection Alignment,
Current-Day Sea Levels. .................................................................................................. 9-4
Figure 9-4 100-year peak storm tide elevations With and Without the Flood Protection Alignment,
90th percentile SLR projection in the 2050s. ................................................................... 9-5
Figure 9-5 100-year Peak Storm Tide Comparisons With and Without the Flood Protection Alignment
for both current-day sea levels and the 90th percentile SLR projection in the 2050s
(protected floodplain in gray shadow) .............................................................................. 9-6
Figure 9-6 Storm Tide Time Series Comparisons With and Without the Flood Protection Alignment for
the 100-year event,Current-Day Sea Levels,90th percentile SLR projection in the 2050s.
.......................................................................................................................................... 9-7

EAST SIDE COASTAL RESILIENCY –COASTAL HYDRAULICS REPORT
FINAL DESIGN
arcadis.com iv
ACRONYMS AND ABBREVIATIONS
BFE Base Flood Elevation
CEM Coastal Engineering Manual
CFR Code of Federal Regulations
CFS/FT cubic feet per second per foot
DTL Mean Diurnal Tide
ESCR East Side Coastal Resiliency
FDR Franklin Delano Roosevelt
FEMA Federal Emergency Management Agency
FT Feet
HUD Housing and Urban Development
MTL Mean Tide Level
MSL Mean Sea Level
MHW Mean High Water
MHHW Mean Higher-High Water
MLW Mean Low Water
MLLW Mean Lower Low Water
MSL Mean Sea Level
MTL Mean Low Tide
Lidar Light detection and ranging
NAVD88 North American Vertical Datum of 1988
NYC New York City
OT Overtopping
PFIRM Preliminary Flood Insurance Rate Maps
RBD Rebuild by Design
SLR Sea level rise
SWEL Still water elevation
USACE U.S. Army Corps of Engineers
WHAFIS Wave Height Analysis for Flood Insurance Studies
VAMC Veterans Administration Medical Center
EAST SIDE COASTAL RESILIENCY –COASTAL HYDRAULICS REPORT
FINAL DESIGN
arcadis.com 1
EXECUTIVE SUMMARY
As part of the Rebuild-by-Design HUD grant award requirements, the ESCR flood protection system must
mitigate the risk associated with the Federal Emergency Management Agency (FEMA) Preliminary Flood
Insurance Rate Map (PFIRM) 100-year storm event and address potential impacts of climate change over
the design life of the project and beyond. The project design includes measures to address the potential
effects of future sea level rise based on values established by the New York City Panel on Climate
Change (NPCC). During the evaluation of potential sea level rise (SLR) over time, the 2050s 90th
percentile SLR projection was selected as most appropriate for this project. This case also falls within the
mid-range projection for the 50th percentile scenario in the 2100s. In addition to SLR and the minimum
mitigation requirements of the HUD grant, the City required the design team to include an adaptability and
resiliency evaluation to help inform the selection of the system’s minimum design elevation.
Updated alignment and project features during the progression from conceptual to final design
necessitated the re-evaluation of the coastal hydraulic model. This updated hydraulic model also
provides necessary wave loads for the design, as well as updated predicted system overtopping rates.
The following is a high-level summary of the storm mitigation requirements and associated resiliency
evaluation of the current design and alignment, which includes the elevation of East River Park and the
extension of the flood protection system to the Veterans Administration Medical Center (VAMC) hospital
floodwall along East 25th Street. Model results were evaluated to identify any potential flood threat
increase of the current project on adjacent areas. Results were also used to update predicted
overtopping rates and confirm the future adaptability of the flood protection features. The following is a
summary of the minimum requirements to satisfy:
1. Initial FEMA Accreditation Required by the HUD Grant:
Mitigate the risk associated with a 100-year storm event the at the end of construction per FEMA
guidelines (Code of Federal Regulations (CFR) Title 44 §65.10 (b) (iii-iv)) and including requirements for
assessments of wave runup and freeboard.
2. Minimum Design Elevation for the Project’s Future Design Case:
Mitigate the risk associated with a 100-year storm event with the 2050s 90th percentile SLR projection of
30 inches resulting in a still water elevation of +13.5 ft NAVD88). Note that this elevation does not include
wave considerations or freeboard. Elevation requirements based on this criterion varied between +15.5 ft
NAVD88 and +16.5 ft NAVD88.
3. Resiliency Assessment
As part of the City’s commitment to providing a resilient design, the report assesses performance of the
current design elevation under a 500-year storm event with the 2050s 50th and 90th percentile SLR
projections. Design elevations between +15.5 ft NAVD88, +16.0 ft NAVD88 and +16.5 ft NAVD 88 were
evaluated to assess performance for these scenarios with the result being that +16.5 ft NAVD88 was
selected to prevent free flow of surge over walls. For this case, significant wave overtopping volumes
could occur, but protection against catastrophic failure of the wall system has been designed for by
setting the elevation at the projected 500-Year still water level.

EAST SIDE COASTAL RESILIENCY –COASTAL HYDRAULICS REPORT
FINAL DESIGN
arcadis.com 2
Based on analysis of the design condition wave requirements as well as resiliency considerations, the
current minimum flood protection system design height has been established at +16.5 ft NAVD88. This
elevation satisfies the design criteria and provides additional resiliency when subjected to surge events
higher than the design condition.
The following is a summary of additional considerations related to the design criteria:
1. Future Adaptability Requirement
As part of the future adaptability evaluation, the City team direction was to mitigate the risk associated
with a 100-year storm event with the 2120s 50th percentile SLR projection. Foundations for floodwalls
have been designed to allow for an additional minimum 2 feet of wall height (18.5 ft NAVD88) to be
incorporated into the system as sea level rise progresses and is monitored over the next 100 years. For
Areas within East River Park, the buried floodwall top of wall is set at +16.5 ft NAVD88 and ground
elevations vary between +18.0 to +25.0 ft NAVD88. Future adaptability in the park can be achieved by a
combination of the initial overbuild of +18.0 ft NAVD88 (with materials above the buried floodwall verified
to be impervious in nature), additional elevation added within the park or park areas, elevation of the
esplanade structure, addition of knee walls, addition of seat walls or other features which raise the overall
grade. The current design has been analyzed for the 2120s condition and waves are shown to be limited
by the park grades (+18.0 to +25 ft NAVD88) as well as the geometry of the esplanade deck and mass of
the park.
2. Impact to Adjacent Areas
The updated hydraulic modeling evaluated the new alignment and East River Park elevation’s impact on
surrounding areas flooding potential during storm events. The model results are the same as the 2015
model in that there is no measurable change in storm surge heights in the adjacent areas based on
construction of the project.
3. Sea Level Rise for Future Accreditation Periods
Based on the assumption that the system is operated and maintained in accordance with the design and
maintenance plans and there are no changes to the FEMA base flood elevations as shown in the FEMA
PFIRMS, the current design elevation will accommodate 30 inches of sea level rise and still have the
ability to function as an accredited system. This extends the system’s future accreditation potential, at a
minimum, into the 2050s and beyond.
4. Overtopping Rates for Input into Interior Drainage Model
The elevated East River Park design and current alignment were modeled to determine the impact to the
predicted overtopping rates. As expected, there is a significant reduction in the model overtopping rates
for the design condition of the 100-Year surge event plus 30 inches of sea level rise as compared to the
2015 project alignment and analysis results. The final project design and alignment model predicts both
lower rates for the area outside the elevated areas of East River Park and no overtopping in the elevated
portions of East River Park, thereby reducing volume that will have to be managed by the interior
drainage system.
Overtopping estimates at the initial accreditation period (assumed to be the year 2025) with a 100-year
surge shows practically no overtopping volumes.

EAST SIDE COASTAL RESILIENCY –COASTAL HYDRAULICS REPORT
FINAL DESIGN
arcadis.com 3
Summary
Based on results of the revised analysis, the design elevation of +16.5 ft NAVD 88 exceeds the
requirements for FEMA accreditation for current day conditions. Additionally, the design elevation meets
elevation requirements for future accreditation until 30 inches of sea level rise is reached and has an
additional 24 inches of adaptability for extending the elevation to +18.5 ft NAVD 88 built into the design of
the floodwalls. In the current design, park elevations in some cases exceed +18.5 ft NAVD88 and/or can
be adapted.
While not required for initial FEMA accreditation, the condition of a resilient design was set forth by the
City as part of the project design requirements to minimize the potential for catastrophic failure of the
structures and uncontrolled flow over the walls associated higher surge events. This resiliency check
resulted in a design elevation slightly higher (0.5 to 1.0 feet) than the 100-Year future condition 2050s 90th
percentile sea level rise wall height requirements in some areas of the project. This increase for the line
of protection to the minimum design elevation of 16.5 ft NAVD88 provides a significant reduction in
estimated overtopping rates where wall design heights have been modified and provides added stability
to the floodwalls. The increase also reduces the future overtopping potential to manageable levels
through the design life of the project in 2120s for the 100-year design condition.
Based on results of modeling using 2-Dimensional wave data and established FEMA baseline still water
elevations, no changes to the minimum design elevation are recommended. While the current design
lowers the potential for wave overtopping to contribute to interior ponding, it is still possible in the event
that a storm that exceeds either the flood protection design event or interior drainage design storm,
flooding could occur.

EAST SIDE COASTAL RESILIENCY –COASTAL HYDRAULICS REPORT
FINAL DESIGN
arcadis.com 1-1
1 INTRODUCTION
Following the devastation of Hurricane Sandy, the Department of Housing and Urban Development (HUD)
initiated the Rebuild by Design (RBD) competition to develop innovative and resilient coastal flooding
solutions against future storms. The “Big U” RBD strategy for the Manhattan waterfront from East 42nd Street
south to the Battery and then north to West 57th Street was selected as a winning concept. HUD ultimately
provided funding to develop a design of the “Big U” flood protection strategy for two segments: from
Montgomery Street north to East 14th Street (Reaches A-J) and from East 14th Street north to East 25th
Street (Reaches K-Q), referred to as the East Side Coastal Resiliency project and as “Project Area 1” and
“Project Area 2” respectively. In October 2015, an initial coastal hydraulic study was completed to help
establish design elevations for the alternative's analysis. As the project has progressed through the final
design phase; decisions and design solutions have occurred that dictated the need to update the coastal
hydraulic models.
This report builds upon the findings of the initial coastal hydraulic analysis and summarizes updated
predicted surge and wave heights from various storm and sea level rise scenarios throughout the design
life of the project. In addition, the new hydrodynamic modeling results provide updated wave forces
necessary to complete the final design of the project. The storm tide levels, New York City Panel on
Climate Change (NPCC) sea level rise (SLR) projections (Horton et al. 2015), and wave conditions have
been quantified for the wave overtopping analysis. Wave overtopping rates are presented to inform the
minimum required crest elevations (top of wall or flood protection feature elevations) along the full length of
the flood protection system. The rates are first presented for the design event, predefined by the design
team as the 100-year event with 30 inches of sea level rise, representing the 90th percentile SLR projection
in the 2050s. Wave overtopping rates are also presented for the 500-year event in the 2050s and for SLR
projections in the 2120s to discuss resiliency and adaptability of the system in the future using system
elevation, armoring or other resiliency improvements.
This evaluation then compares the wave overtopping-based crest elevation requirements to the crest
elevations needed for Federal Emergency Management Agency (FEMA) recognition of the flood
protection system based on criteria from federal regulations, Code of Federal Regulations (CFR) Title 44
§65.10 (b) (iii-iv).
Finally, the 500-year 2050s 90th percentile still water elevation is considered in order to evaluate resiliency
of the floodwalls for an event exceeding the design case. This is equivalent to a 0.2% surge plus 30
inches of sea level rise. This condition limits the risk of a catastrophic failure from weir flow or full
uninhibited flow over the walls. It is important to note that overtopping rates will exceed pavement damage
thresholds and extensive damage to roads and other erosion may occur behind the walls as well as ponding
of water from wave overtopping. This condition was selected by the design team as a reasonable case to
analyze for resiliency. It exceeds both current day and future FEMA requirements and overtopping
requirements for the 100-Year 2050s 90th percentile design storm and thus controls design for minimum

EAST SIDE COASTAL RESILIENCY –COASTAL HYDRAULICS REPORT
FINAL DESIGN
arcadis.com 1-2
system heights. There is an exception to this case for a small portion of the incorporated ConEdison
floodwall, which exceeds current conditions in all cases, but is at a lower elevation than the project
recommended future condition for 30 inches of sea level rise. This area will need to be monitored over time
as sea level rise occurs to determine if retrofits are needed in the future as that system height is 1 foot lower
than the adjacent walls at +15.5 NAVD88. Similarly, at the northern tie-in, the VAMC hospital wall is set 4
inches below the project design height of +16.5 NAVD88 at +16.2 NAVD88.
The report then concludes by presenting a no-impact analysis that evaluates effects to adjacent properties as
a result of the flood protection system.
1.1 Background
As part of the initial conceptual design, a preliminary Coastal Hydraulics Report was completed in
October 2015 which included a wave overtopping analysis based on a range of storm tide and wave
conditions to quantify the wave overtopping rates for a baseline project configuration. This baseline
project configuration consisted of a combination of floodwall and earthen features from Montgomery
Street to East 25th Street. The overtopping rates were compared to tolerable rates in order to arrive at
overtopping rates and wave loads based on preliminary design alignments and features as well as those
features heights for system features such as elevated earthen sections and flood walls. Tolerable wave
overtopping rates were based on criteria summarized in EuroTop (Pullen et al. 2007) to prevent impacts
to critical transportation routes immediately behind the flood protection system and to prevent damage to
the flood protection system itself.
Results of the initial 2015 model indicated that in some cases, the flood protection features needed to be
raised from preliminary design elevations, which had been set as low as 15.5 ft NAVD88 and which
ranged from 15.5 to 16.0 ft NAVD88. Overtopping volumes in some low-lying portions of the protected
area allowed for moderate ponding in local roadways and a series of drainage mitigation features were
researched including sub-surface storage, emergency pump stations and parallel conveyance
improvements, which increased flows to the Manhattan Pump station during emergency events. Due to
the financial and project budget implications as well as operation and maintenance cost of some of the
preliminary design solutions, an elevation study was conducted by the team, where it was recommended
that the minimum system height be raised to 16.5 ft NAVD88 to both allow for the previously mentioned
resiliency benefits for higher than design storm tides, but also to reduce or eliminate the interior drainage
ponding volumes which resulted from overtopping contributions.
To help frame the benefit of raising the system to the 16.5 ft NAVD88 elevation, Arcadis evaluated
several factors including wall stability and potential surge and wave overtopping. Table 1 -1 provides a
summary of an example of the resiliency assessment at E16th Street. Additionally, Table 1-1
characterizes the potential impacts to the flood protection system, as well as inundation behind the line of
protection in the event of a 500-year storm event.

EAST SIDE COASTAL RESILIENCY –COASTAL HYDRAULICS REPORT
FINAL DESIGN
arcadis.com 1-3
Table 1-1 Example Resiliency Assessment, East 16th St
Design Elevation
500-year Resiliency Assessment 2050s, 50th Percentile SLR
500-year Resiliency Assessment 2050s, 90th Percentile SLR
NAVD88
Freeboard above
Storm Tide + SLR
(Ft)
Wall Stability OT
Rates vs Damage
Threshold
OT influence
on potential Interior Ponding
Freeboard above Storm
Tide + SLR (Feet)
Wall Stability OT
Rates vs Damage
Threshold
OT influence on Potential
Interior Ponding
0.0 2.5x Greater Extreme -1.0 5x Greater Extreme
16.0 0.5 Equal to or
below High -0.5 3.5x Greater Extreme
16.5 1.0 Below High 0.0 2.5x Greater Extreme
Red Numbers indicates Storm Tide Free Flow over wall.
1.2 Tide Range
The tide range in Table 1-2 has been adopted for the project design.
Table 1-2 Tide Ranges from Station: 8518750, The Battery, NY
Datum Description NAVD88
(feet)
MHHW Mean Higher-High Water 2.28
MHW Mean High Water 1.96
MTL Mean Tide Level -0.3
MSL Mean Sea Level -0.2
DTL Mean Diurnal Tide Level -0.24
MLW Mean Low Water -2.57
MLLW Mean Lower-Low Water -2.77

EAST SIDE COASTAL RESILIENCY –COASTAL HYDRAULICS REPORT
FINAL DESIGN
arcadis.com 2-1
2 FLOOD PROTECTION ALIGNMENT
During the conceptual design phase, the baseline alternative alignment was evaluated as part of the initial
coastal hydraulic modeling effort. This alignment was originally designed to follow the eastern edge of
Franklin Delano Roosevelt (FDR) Drive for the portion of the project in most of East River Park. However,
in 2018, this East River Park flood protection strategy was modified by the City, resulting in raising the
elevation of the park starting just north of the Amphitheatre to the ConEdison Generating Facility at 15th
Street (Reaches C through L). The ground elevation along the modified alignment will be raised and a
cut-off wall buried below the surface of this park segment will now be the line of protection or “flood wall”.
Furthermore, this buried flood wall will be located behind a water side bulkhead wall and esplanade
structure that will form the east limit of the raised park. The esplanade structure and associated bulkhead
wall will serve to dissipate wave energy and impede seepage during coastal storm events. The alignment
south of the East River Park and north of the Con Edison Generating facility remains close to how it was
originally planned during the concept design phase with some variations at the VA Medical Center and
the crossing of Asser Levy Park. The previous alignment joined the VA Medical Center floodwall at 23rd
Street, but now crosses the park at a mid-park location and the VA Medical Center floodwall at 25th Street
is the project terminus.
The final design alignment is shown on Figure 2-1. The flood protection system has been updated to
consist of several segments of above ground floodwalls, gates and buried sheet pile I-wall in the elevated
portions of East River Park, or in the case of areas outside the park and/or adjacent to local roadways,
reinforced concrete and pile founded I-walls or L-walls. The northern and southern ends of the alignment
extend inland to higher elevations and “tie-back” the project to high ground on both ends. Closure
structures are included at roadways and other pedestrian pathways. Sewer interceptors will be fitted with
closure gates and sewer outfalls will continue to function with tide gates in order to isolate the protected
area from both storm surge and sewer inflows from tidal surge. Sections 3 and 4 will describe the design
water level conditions for both present day and with future SLR projections.
Figure 2-1 Final Design Flood protection alignment from Montgomery Street in the south to East 25th
Street in the north.

EAST SIDE COASTAL RESILIENCY –COASTAL HYDRAULICS REPORT
FINAL DESIGN
arcadis.com 2-2
The alignment shown in Figure 2-1 has been divided into geographic reaches, as shown in Figure 2-2 below.
Each reach is approximately 900 feet in length. Several reaches have similar flood protection measures and
are represented by the following typical sections. The primary flood protection measure implemented in
Reaches A, B, portions of C in Project Area 1 and Reaches K, L, and M in Project Area 2 is an I-Wall. North of
the Amphitheater in Reach C, and all of Reaches D, E, F, G, H, I and J are the areas of East River Park that
will be raised and flood protection is provided by a buried sheet pile cutoff wall within the park and
supplemented by additional structures at the waterfront. The northern Reaches N, O, and Q utilize an L-Wall
design to provide the primary flood protection in these areas.
To facilitate the inclusion of the FEMA data, transect numbers generated in that study have been
overlaid on the project reaches. Figure 2-2 provides a graphic depiction of the project reaches and the
FEMA transects.
Figure 2-2 FEMA Transects along the project alignment, and project reaches.

EAST SIDE COASTAL RESILIENCY –COASTAL HYDRAULICS REPORT
FINAL DESIGN
arcadis.com 2-3
Table 2-1 has been prepared to further assist in the cross comparison of the FEMA data to the physical
location to project features.
Table 2-1 FEMA Transect Numbers, Approximate Location and Primary Flood Protection Measure.
FEMA PFIRM
Transect # Reach(es) Approximate Location Primary Flood Protection Measure
23 Q Asser Levy/VAC L-Wall
24 O-Q East 23rd St/East
River
L-Wall
25 O East 22nd St/East
River
L-Wall
26 N-O East 20th St/East
River
L-Wall
27 N-M East 19th St/East
River
L-Wall
28 M East 18th St/East
River
L-Wall/I-Wall
29 L-M East 17th St/East
River
I-Wall
30 K East 14th St/East
River/ConEdison
I-Wall
31-38 J through D
East 12th St/East River
to Grand St/East River
Elevated Park with Buried Floodwall
40 B Gouverneur - Jackson
St/East River/Pier 42
I-Wall
41 A Montgomery St I-Wall

EAST SIDE COASTAL RESILIENCY –COASTAL HYDRAULICS REPORT
FINAL DESIGN
arcadis.com 2-4
Typical sections have been generated to graphically depict the flood protection measure and physical
features with a reach. Figure 2-3 represents a portion of the project that utilizes an I-Wall section for flood
protection. Reaches that use I-Walls as the primary flood protection feature include Reaches A, B, C, I, J,
K, L and M.
Figure 2-3 Proposed cross-section at station 18+43 featuring an I-wall as flood protection measure.
Reaches that are associated with the elevation of East River Park are Reaches D, E, F, G, H and I.
Figure 2-4 is a representation of the flood protection features in these reaches.
Figure 2-4 Proposed cross-section at elevated park waterfront (buried floodwall not shown)

EAST SIDE COASTAL RESILIENCY –COASTAL HYDRAULICS REPORT
FINAL DESIGN
arcadis.com 2-5
The third primary flood protection measure is found in Reaches N, O and Q and is an L-Wall. Except for
the foundation, the L-Wall is similar to an I-Wall. Figure 2.5 provides a graphical depiction of the L-Wall
Section in Reach O.
Figure 2-5 Proposed cross-section at station 212+96 featuring a L-wall as flood protection measure.
EAST SIDE COASTAL RESILIENCY –COASTAL HYDRAULICS REPORT
FINAL DESIGN
arcadis.com 3-1
3 STORM TIDE CONDITIONS
3.1 100-Year Coastal Surge Elevation (Design Case)
The design coastal storm surge water elevation for this conceptual analysis is the FEMA 1-percent-
annual–chance still water elevation (100-year storm tide) determined from the Preliminary Flood
Insurance Rate Maps (PFIRMs) for NYC, released January 30, 2015. Although the PFIRMs are still
preliminary and undergoing an update, the PFIRM still water elevations are higher (more conservative)
than the those associated with FEMA’s 2007 Effective FIRMs. NYC Local Law 96 currently requires the
use of the higher of the two still water elevations (City of New York Law Department 2013) in the design
of coastal protection features.
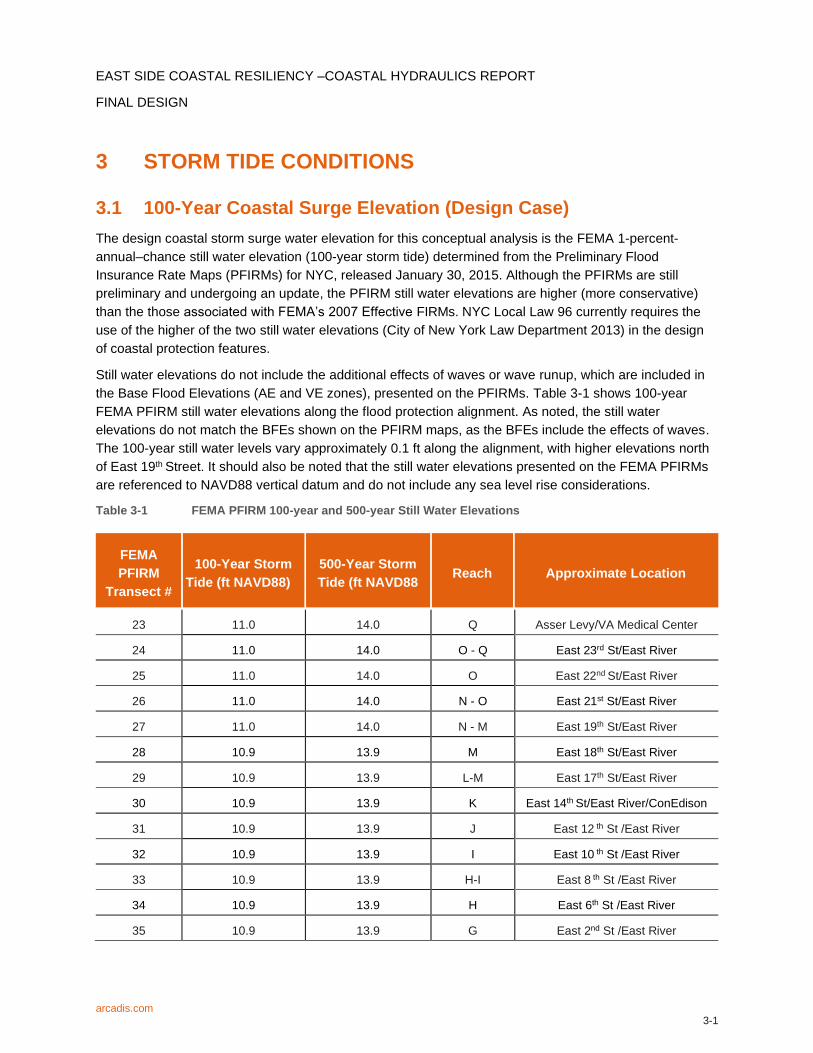
Still water elevations do not include the additional effects of waves or wave runup, which are included in
the Base Flood Elevations (AE and VE zones), presented on the PFIRMs. Table 3-1 shows 100-year
FEMA PFIRM still water elevations along the flood protection alignment. As noted, the still water
elevations do not match the BFEs shown on the PFIRM maps, as the BFEs include the effects of waves.
The 100-year still water levels vary approximately 0.1 ft along the alignment, with higher elevations north
of East 19th Street. It should also be noted that the still water elevations presented on the FEMA PFIRMs
are referenced to NAVD88 vertical datum and do not include any sea level rise considerations.
Table 3-1 FEMA PFIRM 100-year and 500-year Still Water Elevations
FEMA
PFIRM
Transect #
100-Year Storm
Tide (ft NAVD88)
500-Year Storm
Tide (ft NAVD88 Reach Approximate Location
23 11.0 14.0 Q Asser Levy/VA Medical Center
24 11.0 14.0 O - Q East 23rd St/East River
25 11.0 14.0 O East 22nd St/East River
26 11.0 14.0 N - O East 21st St/East River
27 11.0 14.0 N - M East 19th St/East River
28 10.9 13.9 M East 18th St/East River
29 10.9 13.9 L-M East 17th St/East River
30 10.9 13.9 K East 14th St/East River/ConEdison
31 10.9 13.9 J East 12 th St /East River
32 10.9 13.9 I East 10 th St /East River
33 10.9 13.9 H-I East 8 th St /East River
34 10.9 13.9 H East 6th St /East River
35 10.9 13.9 G East 2nd St /East River

EAST SIDE COASTAL RESILIENCY –COASTAL HYDRAULICS REPORT
FINAL DESIGN
arcadis.com 3-2
FEMA
PFIRM
Transect #
100-Year Storm
Tide (ft NAVD88)
500-Year Storm
Tide (ft NAVD88 Reach Approximate Location
36 10.9 13.9 F Rivington St/East River
37 10.9 13.9 H Delancey St/East River
38 10.9 13.9 D Grand St/East River
39 10.9 13.9 C Jackson - Cherry St/East River
40 10.9 13.9 B Gouverneur - Jackson St/East
River/Pier 42
3.2 500-Year Storm Tide (Resiliency Case)
In addition to the 100-year storm tide, the 500-year storm tide was analyzed to provide an understanding
of the performance of the flood protection alignment and design elevations if exposed to a lower
probability event. The current day 500-year storm tide elevations range from +13.9 ft NAVD88 to +14.0 ft
NAVD88 along the flood protection alignment. 500-Year storm tide elevations in future design conditions
with 30 inches of sea level rise are set at +16.5 ft NAVD88 and control the minimum future design height
for the proposed project flood protection features (with the exception of incorporated ConEdison and VA
Medical Center features, which may have to be slightly adapted as future storm tide conditions develop to
match the 30 inches of future adaptation).
3.3 Storm Tide Time Series
FEMA does not provide a time series of storm tide elevations, only peak levels associated with the return
period events. However, a time series associated with storm tide is important for determining:
• Wave overtopping volumes and seepage over the duration of a storm.
• Boundary conditions for interior drainage analysis.
• Gate and valve closure operations.
• Lead times for deployment of mechanically implemented flood protection features.
To generate a representative storm tide time series for wave overtopping analysis, the parametric method
supported by the U.S. Army Corps of Engineers (USACE 2009) was used. The 189 historical extratropical
(nor’easters) and synthetic tropical (hurricanes) storm time series used in the FEMA PFIRM analysis were
used to determine the best fit shape of the storm tide time series. The parametric method assumes a
Gaussian shape to the time series and fits a correlation between the 30 percent width and the peak storm
tide for all 189 storms. Figure 3-1 shows the parametric storm surge time series for 100-year and 500-
year storm tide events relative to mean higher high water.
Although the 500-year event generates larger peak storm tide elevations than the 100-year event, the
duration in which water levels would be expected to be above mean higher high water, for example, are
approximately double for the 100-year event when compared to the 500-year event. The reason for this is

EAST SIDE COASTAL RESILIENCY –COASTAL HYDRAULICS REPORT
FINAL DESIGN
arcadis.com 3-3
that nor’easters are longer-duration storms than hurricanes and contribute more heavily to the fit of the
100-year event than the 500-year event. The implementation of these storm tide time series for the
estimation of time-integrated wave overtopping volumes is discussed further in Section 6.
Figure 3-1 Parametric storm tide time series for the 100-year and 500-year events.

EAST SIDE COASTAL RESILIENCY –COASTAL HYDRAULICS REPORT
FINAL DESIGN
arcadis.com 4-1
4 SEA LEVEL RISE CONDITIONS
The NYC Panel on Climate Change (NPCC) released updated climate projections specific to NYC in
January 2015 (Horton et al. 2015). The SLR projections include the effects of multiple physical processes,
primarily:
• Land subsidence
• Expansion of warming ocean waters
• Melting of global ice
Warming of oceans has been the leading cause of global SLR over the last century, with melting of global
ice expected to be the leading cause in the next century. In NYC, land subsidence has accounted for 45
percent of historical SLR (NPCC 2013). These and other components attributing to SLR in NYC are
projected independently to inform a total SLR (Horton et al. 2015).
Uncertainties are inherent in the projection of each component of SLR; therefore, projections are listed
using the distributions of outputs from numerous SLR model simulations, i.e., the 10th percentile is a low
SLR estimate with lower probability of not being exceeded, the 50th percentile is a middle range estimate
and high probability of being met or a mean value, and the 90th percentile is a high estimate with a low
probability of occurring. In simple terms, the majority of the SLR model simulation outputs are associated
with the 50th percentile, with fewer simulation outputs associated with the 10th and 90th percentiles. The
range of SLR projections for the 2050s and the 2100s for NYC are shown in Table 4-1. An additional row
shows an extrapolated value for the 2120s, which was used in modeling the 50th percentile SLR scenario
for the adaptability condition.
It should be noted that the NPCC periodically reviews and updates SLR projections. The latest update
(March, 2019) noted that the 2015 NPCC projections are reaffirmed as the projections of record for New
York City.
Table 4-1 SLR Projections in the 2050s/2100s/2120s for NYC for the 10th/50th/90th Percentile
Year 10th Percentile 50th Percentile 90th Percentile
2050s 8 in 16 in 30 in
2100s 15 in 36 in 75 in
2120s - 43 in -
For the current analysis, SLR was linearly added to the storm tide conditions to inform the total water
levels used in the wave conditions and wave overtopping analysis discussed in Sections 5 and 6. Orton et
al. demonstrated that this linear superposition is an appropriate approximation for the majority of the NYC
region, including the area adjacent to the flood protection alignment (2014).
In consultation with the design team and NYC, 30 inches of SLR (2050s 90th percentile) was selected as
the design SLR scenario.

EAST SIDE COASTAL RESILIENCY –COASTAL HYDRAULICS REPORT
FINAL DESIGN
arcadis.com 5-1
5 WAVE CONDITIONS
5.1 Wave Transects
Wave conditions for the 100-year event were extracted from the FEMA PFIRM analysis, specifically from
the Wave Height Analysis for Flood Insurance Studies (WHAFIS; FEMA 2008) wave transects at the East
River shoreline from Montgomery Street to East 25th Street, as shown on Figure 2-2. FEMA’s WHAFIS
transects contain the parameters associated with the variation of wave heights and periods as they move
from the shoreline inland toward high ground. FEMA transect numbers 25 through 40 intersect the flood
protection alignment and were reviewed for appropriate topographic, wind fetch1, vegetation, and building
parameters. Transects 23 and 24 also intersect the alignment, but large waterfront infrastructure on the
flood side of the alignment provides shelter from wave exposure; therefore, the transects are not
considered as part of this assessment except for the exclusion of overtopping volumes in those areas as
appropriate.
Review of the WHAFIS parameters was completed using the NYC 2010 light detection and ranging (lidar)
dataset (City of New York 2012), project-specific topographic surveys, on-site photographs, street view
imagery, and aerial imagery. Any topographic discrepancies deemed of significance to the wave
overtopping analysis were adjusted to the project specific topographic survey or the NYC 2010 lidar data.
5.2 100-Year Waves at Shoreline
The 100-year wave heights and wave periods reviewed and extracted from the FEMA WHAFIS transects
at the East River shoreline are shown in Table 5-1. The terms “wave height” and “wave period” will be
used throughout the document to refer to significant wave height and spectral peak wave period,
respectively. The wave heights at the East River shoreline vary from 2.6 ft to 3.3 ft along the alignment,
with the lower wave heights occurring along the shoreline between Gouverneur and Cherry Streets. Wave
periods range from 2.7 to 3.5 seconds, which is a range expected for harbor waters during larger storm
events. Project variations in the alignment along the East River Park did not affect the wave information
that needs to be used as input for both the wave load calculations and the overtopping calculations in the
raised park areas where the landform is to be raised.
Because the wave height varies along the flood protection system and because the wave runup will vary
depending upon the type of structure (vertical wall or L-wall), estimates of elevation requirements at each
transect along the alignment were made.
The 1-percent-annual-chance (100-year) wave was calculated using significant wave heights at the toe of
the flood protection alignment and converting them to FEMA’s controlling wave height using the 1.6 and
0.7 multipliers.
The maximum wave runup associated with the 1-percent-annual-chance (100-year) still water elevation
(storm tide) was calculated using either the Shore Protection Manual (FEMA 2011) or the Goda (2010)
formula at vertical walls.
1 Fetch is the distance of open water over which wind-generated waves can develop. Larger fetch typically correlates
with larger wave heights for a given wind speed and duration.

EAST SIDE COASTAL RESILIENCY –COASTAL HYDRAULICS REPORT
FINAL DESIGN
arcadis.com 5-2
The Shore Protection Manual method was developed from data at vertical walls with toe slopes of 1:10
and 1:30, whereas the Goda method was developed from data of standing waves at a vertical wall.
Therefore, the Goda estimates were used when the vertical wall was within one deep water wavelength of
the shoreline, and the Shore Protection Manual estimates were used when the vertical wall was offset
inland.
Table 5-1 100-year Wave Height and Wave Period.
FEMA
PFIRM
Transect #
Reach Approximate Location
100-Year
Wave Height
(ft)
100-Year Wave
Period (seconds)
23 Q Asser Levy/VA Medical
Center Limited
Wave dissipation
from existing Bridge
Abutment and inland
location.
24 Q East 23rd St/East River Limited
Wave dissipation
from existing Parking
Garage and
Structures
25 O (O6) East 22nd St/East River 3.2 3.2
26 N-O (N8-N11) East 21st St/East River 3.2 3.3
27 N-M (N1-N5) East 19th St /East River 3.2 3.2
28 M (N5-N7) East 18th St /East River 3.2 3.3
29 L-M East 17th St East River 3.1 3.2
30 K East 14th St/East
River/ConEdison 3.3 3.5
31 J East 12th St /East River 3.3 3.5
32 I East 10th St /East River 3.3 3.5
33 H-I East 8th St/East River 3.3 3.5
34 H East 6th St/East River 3.2 3.5
35 G East 2nd St/East River 3.2 3.4
36 F Rivington St/East River 3.2 3.4
37 H Delancey St/East River 3.1 3.3
38 D Grand St/East River 3.1 3.3
39 C Jackson - Cherry St/East
River 2.7 2.8
40 B Gouverneur - Jackson St/
East River 2.6 2.7

EAST SIDE COASTAL RESILIENCY –COASTAL HYDRAULICS REPORT
FINAL DESIGN
arcadis.com 5-3
5.3 100-Year Waves at Levee/Wall
For portions of the flood protection alignment, the levee/wall is offset inland from the East River shoreline
as presented in Section 2. Wave overtopping analysis requires wave conditions at the toe of the
levee/wall; therefore, the FEMA PFIRM wave transects were evaluated in WHAFIS to transform wave
properties from the East River to the toe of the levee/wall. Transformed wave conditions were extracted
roughly one deep water wavelength flood side of the wall/levee.
The wave transformation is controlled by the depth of water, the inland topography, buildings and other
infrastructure, and vegetation. Each of these parameters has the effect of dissipating wave energy. On
the contrary, the local wind speed acts to increase wave heights as waves propagate inland. FEMA’s
recommended wind speed of 60 miles per hour for inland fetch areas was used for the 100-year wave
transformation analysis (FEMA 2007). Increases in water depth, which reduce energy dissipation, were
included due to the 500-year storm tide and the SLR projections presented in Section 4.
The shallowing of the water depth in the first 30 ft from the shoreline has the effect of decreasing wave
heights. After this initial decrease in wave height close to the shoreline, water depths and wave heights
remain roughly constant until reaching the levee/wall.
5.4 Wave Time Series
The discussion so far has been about peak wave conditions at the toe of the levee/wall; however, during
a storm, wave conditions will vary with changing water levels and wind forcing. Wave condition time
series are not available from the FEMA PFIRM analysis; therefore, the variability of the wave conditions
needed to be approximated. To approximate this variability, wave height and wave period time series
were generated assuming the same variation from the peak as assumed for the storm tide time series
presented in Section 3.
Wave heights are set to a minimum of 1 ft as water depths become shallower, allowing the presence of
locally generated wind waves associated with storm events to be replicated. The wave period was also
varied over time in the same manner as the storm tide series, with the minimum value set at 1.56
seconds. This minimum wave period was calculated based on the minimum wave height using Goda’s
formula for wind generated waves (Goda 2010).
5.5 500-Year Waves
Even though the flood protection alignment is designed for the 100-year event, the 500-year event was
analyzed as well to determine flood protection system response to a lower probability event. To determine
the 500-year wave conditions,189 historical and synthetic storms simulated in the FEMA PFIRM coastal
study were reviewed. Wave conditions from simulated storms with a peak storm tide in proximity to the
500-year FEMA storm tide were extracted for use in this analysis.
Shoreline values of the 500-year wave heights averaged in the range of approximately a 10% percent
increase in wave height at the shoreline relative to the 100-year wave.
The 500-year wave conditions were then used in all WHAFIS and wave overtopping analyses associated
with the 500-year event. Time series for the 500-year wave height were generated in the same manner as
the 100-year wave height and wave period time series.

EAST SIDE COASTAL RESILIENCY –COASTAL HYDRAULICS REPORT
FINAL DESIGN
arcadis.com 6-1
6 WAVE LOADS
Wave loads have been determined for both the flood protection features in Reaches A-C and K-Q as well
as to inform marine structure designs for the waterfront esplanade and bulkheads in reaches C-J in East
River Park. The wave loads that have been calculated are:
• Horizontal loads, applied on vertical surfaces such as the vertical wall.
• Uplifting loads, applied on horizontal overhanging elements for the waterfront esplanade structure,
which is not a flood protection feature. Loads calculated to inform the esplanade design.
6.1 Horizontal Wave Loads
Horizontal wave loads have been determined following Goda’s method (Goda, 2010) to determine wave
pressure under wave crests (see Figure 6-1).
Figure 6-1 Schematic of horizontal pressure distributions on a vertical wall.
The Goda Method formulas used to calculate the wave pressures shown on Figure 6-1 on the front of a
vertical wall are:
𝑝1 = 12 1 + 𝑐𝑜𝑠𝛽 𝛼1𝜆1 + 𝛼2𝜆2𝑐𝑜𝑠𝛽2𝜌𝑔𝐻𝑚𝑎𝑥
𝑝2 =𝑝1
cosh (2𝜋ℎ
𝐿)
𝑝3 = 𝛼3𝑝1
With:
𝛼1 = 0.6 +1
2[
4𝜋ℎ𝐿
sinh (4𝜋ℎ
𝐿)
]
2

EAST SIDE COASTAL RESILIENCY –COASTAL HYDRAULICS REPORT
FINAL DESIGN
arcadis.com 6-2
𝛼2 = 𝑚𝑖𝑛 {ℎ𝑏 − 𝑑
3ℎ𝑏
(𝐻𝑚𝑎𝑥
𝑑)
2
,2𝑑
𝐻𝑚𝑎𝑥
}
𝛼3 = 1 −ℎ′
ℎ[1 −
1
cosh (2𝜋ℎ
𝐿)
]
Where:
Hmax: The highest wave in the design sea state
d: water depth above the foundation
hb: water depth at a distance of 5Hs from the vertical wall
h’: distance from the design water level to the bottom of the upright section
β: Angle between the direction of wave approach and a line normal to the breakwater
L: wavelength
6.2 Vertical Wave Loads
Uplifting (vertical upwards) loads on overhanging structures can be calculated based on equations
adapted from (McConnell, 2004). These equations were derived from the analysis of two-dimensional
(2D) physical model tests and are intended to present easily applicable equations for quasi-static and
impact wave forces on decks. These constitute a statistically equivalent load for a first estimation of the
effect of these short-duration loads (see Figure 6-2).
Figure 6-2 Basic wave loads on a horizontal element.
The vertical hydrostatic pressure applied at the bottom of the horizontal element (which in turn
corresponds to the horizontal hydrostatic pressure applied at the bottom of the vertical face of the
horizontal element (see Table 6-2) can be calculated as:
𝑝2 = [𝜂𝑚𝑎𝑥 − 𝑍𝑐] × 𝜌𝑠𝑤 × 𝑔

EAST SIDE COASTAL RESILIENCY –COASTAL HYDRAULICS REPORT
FINAL DESIGN
arcadis.com 6-3
6.3 Wave Load Calculations for Features Not Related to Flood
Protection.
Horizontal wave loads have been calculated following the methods described in Sections 6.1 and 6.1, for
reaches C through I which run along the East River park Figure 6-3.
Figure 6-3 Reaches along the East River Park.
These wave loads were calculated to inform the design of waterfront structures and are not related to
flood protection features for the project. Results are summarized in Table 6-1.
Table 6-1 Horizontal Wave Loads Results - Flood Protection and Non-Flood Protection Structures -
100-year 90th percentile SWL scenario
Transect ID
Structure SWL
Scenario SLR Pressure [psf]
p1 p2 p3
C-1 Bulkhead/Esplanade 100 year 2050s 90th 177.7 113.7 13.1
D-1 Bulkhead/Esplanade 100 year 2050s 90th 183.3 221.7 11.7
D-2 Bulkhead/Esplanade 100 year 2050s 90th 188.9 278.5 18.4
E-1 Bulkhead/Esplanade 100 year 2050s 90th 186.7 122.7 13.5
E-2 Bulkhead/Esplanade 100 year 2050s 90th 186.1 122.1 18.8
F-1 Bulkhead/Esplanade 100 year 2050s 90th 186.5 226.4 12.7

EAST SIDE COASTAL RESILIENCY –COASTAL HYDRAULICS REPORT
FINAL DESIGN
arcadis.com 6-4
Transect ID
Structure SWL
Scenario SLR Pressure [psf]
p1 p2 p3
F-2 Bulkhead/Esplanade 100 year 2050s 90th 185.6 108.8 16.7
G-1 Bulkhead/Esplanade 100 year 2050s 90th 190.4 126.4 15.6
G-2 Bulkhead/Esplanade 100 year 2050s 90th 192.1 332.8 11.7
H-1 Bulkhead/Esplanade 100 year 2050s 90th 193.0 116.2 9.6
I-1 Bulkhead/Esplanade 100 year 2050s 90th 195.8 119.1 12.8
I-2 Bulkhead/Esplanade 100 year 2050s 90th 197.5 120.7 18.0
Table 6-2 Vertical Wave Load - Waterfront Structures - 100-year 90th percentile SWL
Transect ID
Structure SWEL Vertical Effective Force
[ft NAVD88] [lb/linear ft]
C-1 Bulkhead/Esplanade 13.50 6,991
D-1 Bulkhead/Esplanade 13.50 0.0
D-2 Bulkhead/Esplanade 13.50 7,506
E-1 Bulkhead/Esplanade 13.50 11,060
E-2 Bulkhead/Esplanade 13.50 11,058
F-1 Bulkhead/Esplanade 13.50 N/A
F-2 Bulkhead/Esplanade 13.50 N/A
G-1 Bulkhead/Esplanade 13.50 7,320
G-2 Bulkhead/Esplanade 13.50 N/A
H-1 Bulkhead/Esplanade 13.50 10,875
I-1 Bulkhead/Esplanade 13.50 11,185
I-2 Bulkhead/Esplanade 13.50 11,389
EAST SIDE COASTAL RESILIENCY –COASTAL HYDRAULICS REPORT
FINAL DESIGN
arcadis.com 7-1
7 WAVE OVERTOPPING ANALYSIS
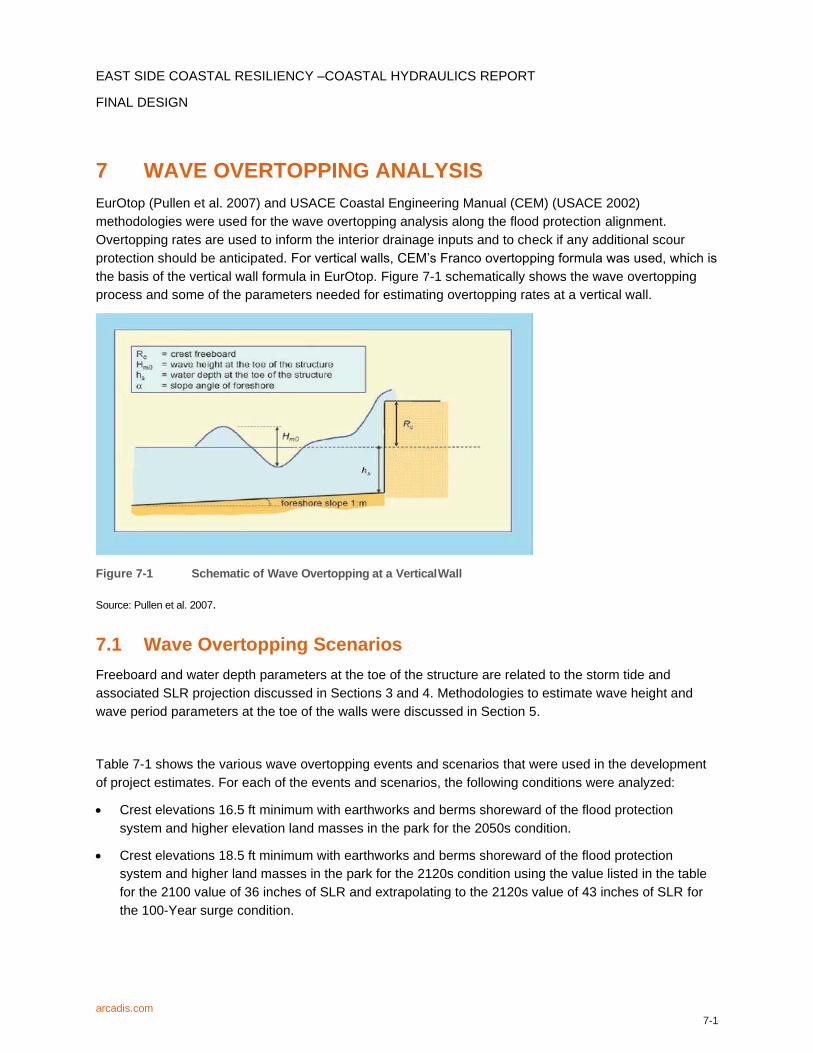
EurOtop (Pullen et al. 2007) and USACE Coastal Engineering Manual (CEM) (USACE 2002)
methodologies were used for the wave overtopping analysis along the flood protection alignment.
Overtopping rates are used to inform the interior drainage inputs and to check if any additional scour
protection should be anticipated. For vertical walls, CEM’s Franco overtopping formula was used, which is
the basis of the vertical wall formula in EurOtop. Figure 7-1 schematically shows the wave overtopping
process and some of the parameters needed for estimating overtopping rates at a vertical wall.
Figure 7-1 Schematic of Wave Overtopping at a Vertical Wall
Source: Pullen et al. 2007.
7.1 Wave Overtopping Scenarios
Freeboard and water depth parameters at the toe of the structure are related to the storm tide and
associated SLR projection discussed in Sections 3 and 4. Methodologies to estimate wave height and
wave period parameters at the toe of the walls were discussed in Section 5.
Table 7-1 shows the various wave overtopping events and scenarios that were used in the development
of project estimates. For each of the events and scenarios, the following conditions were analyzed:
• Crest elevations 16.5 ft minimum with earthworks and berms shoreward of the flood protection
system and higher elevation land masses in the park for the 2050s condition.
• Crest elevations 18.5 ft minimum with earthworks and berms shoreward of the flood protection
system and higher land masses in the park for the 2120s condition using the value listed in the table
for the 2100 value of 36 inches of SLR and extrapolating to the 2120s value of 43 inches of SLR for
the 100-Year surge condition.

EAST SIDE COASTAL RESILIENCY –COASTAL HYDRAULICS REPORT
FINAL DESIGN
arcadis.com 7-2
• Vertical wall (I- or L- walls) geometry (see Section 2)
Table 7-1 Summary of Wave Overtopping Analysis SLR basis
SLR Projections
2050s (Percentiles) 2100s/2120 (Percentiles)
Timeframe Current Day 10th 50th 90th 10th 50th 90th
SLR 0.0 in. 8 in. 16 in. 30 in. 15 in. 36 in./43
in. (2120) 6 ft-6 in.
EurOtop’s wave overtopping estimates are based on regression equations fit to an international database
of experimentally observed and field-observed wave overtopping events. Deterministic and probabilistic
estimates are available, with deterministic estimates including one standard deviation above the mean
regression of the data. As a result, the deterministic estimate used in this analysis has the effect of
including a factor of safety in design. Current-day sea levels are based on the middle year of the 1983-
2001 National Tidal Datum Epoch.
7.2 Critical Wave Overtopping Rates
The use of wave overtopping rates in the determination of minimum required crest elevations is based on
the appropriate definition of the critical overtopping rate for the existing and proposed site conditions. The
critical overtopping rates are based on EurOtop guidance, summarized here for conditions appropriate to
the flood protection alignment (Pullen et al. 2007):
• Vehicles – Driving at low speeds and cars not immersed, overtopping at low, pulsating depths –
critical rate 0.1 to 0.5 cubic ft per second per ft (cfs/ft).
• Wall Damage – Damage to paved or armored section behind wall – critical rate 2.1 cfs/ft.
7.2.1 Minimum Required Crest Elevation for the 100-Year Event
7.2.1.1 90th Percentile SLR (Design Event)
Maximum overtopping rates along the flood protection alignment for the design event are shown in Table
7-2. For each transect along the alignment, the rates at the minimum required crest elevation based on
the design overtopping rate of 0.1 cfs/ft.

EAST SIDE COASTAL RESILIENCY –COASTAL HYDRAULICS REPORT
FINAL DESIGN
arcadis.com 7-3
Table 7-2 Maximum Overtopping Rates - 100-year Event 2050s with the 90th percentile SLR.
FEMA
PFIRM
Transect
#
Reach Approximate Location
Maximum
Overtopping Rate for
Design Condition of
90th (30 inches).
Percentile SLR 2050s
with 100 Year Surge
[cfs/ft]
16.5 ft-NAVD88 Crest
Elevation
Requirement Based
on Overtopping Rate
or Minimum
Freeboard
23 Q Asser Levy/VAMCr Limited 15.5
24 Q East 23rd St/East River Limited 15.5
25 O-Q
Stuyvesant Cove Park/East
River
0.06 15.5
26 N-O
Stuyvesant Cove Park/East
River
0.07 16.0
27 N-M Avenue C/East River 0.1 16.5
28 M East 18th
St/East River 0.09 16.5
29 L-M East 17th St/East River 0.1 16.5
30 K
East 14th St/East
River/ConEdison
0.1 16.5
31-38
J through D
East 12th St/East River to
Grand St/East River
No Overtopping due to
Elevated Land
Mass/Buried Floodwall
15.5
39 C
Jackson - Cherry St/East
River
0.01 16.5
40 B
Gouverneur - Jackson St/
East River/Pier 42
0.01 16.5
The design crest elevation chosen is 16.5 ft-NAVD88. This design crest elevation is based on the 500
Year resiliency for the 2050s 90th percentile condition. Requirements based on FEMA recognition of the
flood protection system will be compared in Section 8.
7.2.1.2 Adaptations for the 2120s SLR (50th Percentile)
The adaptability of the flood protection system to the 2120s 50th percentile SLR projection of 43 inches
for the 100-year event was also considered. The SLR values were derived for the 2120s by taking the 36
inches of rise at the year 2100 and extrapolating the linear trend line out an additional 20 years to provide
an analysis at 43 inches of sea level rise. This was done using a linear extrapolation of the NPCC sea
level rise data. Foundations are designed for the system to be raised by 2 feet to an elevation of +18.5
NAVD88. Maximum overtopping rates for the design crest elevation of 18.5 ft is shown in Table 7-3. Still

EAST SIDE COASTAL RESILIENCY –COASTAL HYDRAULICS REPORT
FINAL DESIGN
arcadis.com 7-4
water elevation in this condition (100-Year Surge) was modelled at +14.6 NAVD88. A resiliency check
was also performed for the 500-Year surge at +17.6 NAVD88 for the 2100s condition.
For this future condition, where 43 inches of SLR is assumed, the vertical wall sections meet or exceed
the design criteria with 1% waves plus freeboard resulting in requirements that range from +18.3 to +18.5
NAVD88. For the resiliency condition, the rates exceed the upper limit overtopping rate of 0.5 cfs/ft for
transportation behind the wall, but do not exceed the upper limit overtopping rate of 2.1 cfs/ft for well-
protected walls. It is anticipated that the areas immediately behind the walls, including local bike lanes,
intersections and parks will be monitored and adapted as necessary over the next 80-100 years as SLR
rates are monitored. For the elevated portions of East River Park, initial construction in most areas will
have the landform set at +18.0 to +25.0 ft NAVD88, exceeding the adaptability scenario of +14.6 ft
NAVDD88 SWL and the resiliency SWL check for +17.6 NAVD88. Materials in the upper soils above the
buried flood wall will need to be monitored or analyzed to ensure that the materials adhere to
requirements for stability and porosity in the future condition. Some areas may already be paved and or
concrete and would satisfy this requirement. In areas where this solution does not apply, other features
added such as independent low walls or augmented existing walls as well as possible soils-based
solutions such as berms would need to be considered.
Table 7-3 Maximum Overtopping Rates 2120s 100-year event with the 50th percentile SLR and
Increase Wall Height (+18.5 NAVD88)
FEMA PFIRM
Transect # Reach Approximate Location
Maximum Overtopping Rate
in 100-Year Sea Level Rise
(43 inches) and 2 feet of
additional wall height raise
[cfs/ft]
18.5 ft-NAVD88 Crest
Elevation
23 Q Asser Levy/VAMC Limited
24 Q East 23rd St/East River Limited
25 O-Q Stuyvesant Cove Park/East River 0.3
26 N-O Stuyvesant Cove Park/East River 0.3
27 N-M Avenue C/East River 0.3
28 M East 18th St/East River 0.02
29 L-M East 17th St/East River 0.04
30 K East 14th St/East River 0.04
31-38 J through D East 12th St/East River to Grand
St/East River
No Overtopping due to Elevated
Land Mass/Buried Floodwall
39 C Jackson - Cherry St/East River 0.01
40 B
Gouverneur - Jackson St/ East
River/Pier 42
0.01
EAST SIDE COASTAL RESILIENCY –COASTAL HYDRAULICS REPORT
FINAL DESIGN
arcadis.com 7-5
7.2.2 Minimum Required Crest Elevations for the 500-Year Event and No SLR.
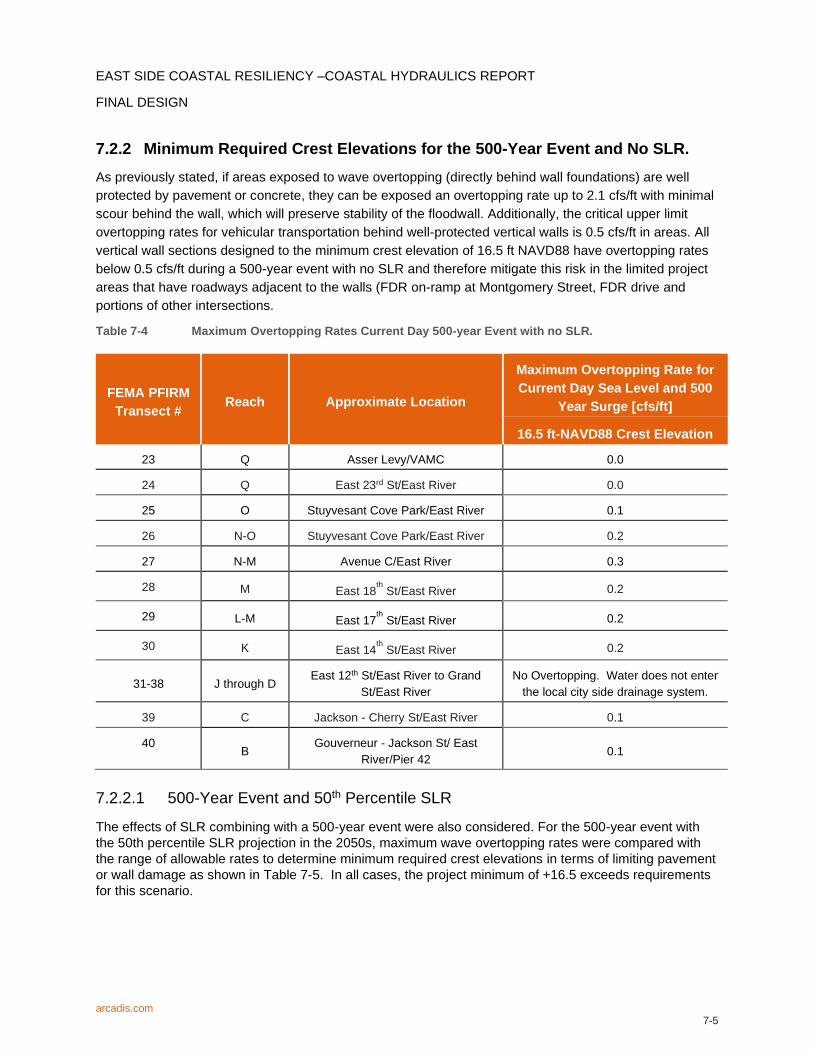
As previously stated, if areas exposed to wave overtopping (directly behind wall foundations) are well
protected by pavement or concrete, they can be exposed an overtopping rate up to 2.1 cfs/ft with minimal
scour behind the wall, which will preserve stability of the floodwall. Additionally, the critical upper limit
overtopping rates for vehicular transportation behind well-protected vertical walls is 0.5 cfs/ft in areas. All
vertical wall sections designed to the minimum crest elevation of 16.5 ft NAVD88 have overtopping rates
below 0.5 cfs/ft during a 500-year event with no SLR and therefore mitigate this risk in the limited project
areas that have roadways adjacent to the walls (FDR on-ramp at Montgomery Street, FDR drive and
portions of other intersections.
Table 7-4 Maximum Overtopping Rates Current Day 500-year Event with no SLR.
FEMA PFIRM
Transect # Reach Approximate Location
Maximum Overtopping Rate for
Current Day Sea Level and 500
Year Surge [cfs/ft]
16.5 ft-NAVD88 Crest Elevation
23 Q Asser Levy/VAMC 0.0
24 Q East 23rd St/East River 0.0
25 O Stuyvesant Cove Park/East River 0.1
26 N-O Stuyvesant Cove Park/East River 0.2
27 N-M Avenue C/East River 0.3
28 M East 18th St/East River 0.2
29 L-M East 17th St/East River 0.2
30 K East 14th St/East River 0.2
31-38 J through D East 12th St/East River to Grand
St/East River
No Overtopping. Water does not enter
the local city side drainage system.
39 C Jackson - Cherry St/East River 0.1
40 B
Gouverneur - Jackson St/ East
River/Pier 42 0.1
7.2.2.1 500-Year Event and 50th Percentile SLR
The effects of SLR combining with a 500-year event were also considered. For the 500-year event with
the 50th percentile SLR projection in the 2050s, maximum wave overtopping rates were compared with
the range of allowable rates to determine minimum required crest elevations in terms of limiting pavement
or wall damage as shown in Table 7-5. In all cases, the project minimum of +16.5 exceeds requirements
for this scenario.

EAST SIDE COASTAL RESILIENCY –COASTAL HYDRAULICS REPORT
FINAL DESIGN
arcadis.com 7-6
Table 7-5 Minimum Required Crest Elevations 2050s- 500-year event with the 50th percentile SLR.
FEMA PFIRM
Transect # Reach Approximate Location
500 Year 2050s 50th Percentile
SLR Condition (16”) for Wall
and Pavement Protection
2.1 cfs/ft
25 O Stuyvesant Cove Park/East River 16.0 ft
26 N-O Stuyvesant Cove Park/East River 16.0 ft
27 N-M Avenue C/East River 16.0 ft
28 M East 18th St/East River 16.0 ft
29 L-M East 17th St/East River 16.0 ft
30 K East 14th
St/East River 16.0 ft
31-38 J through D East 12th St/East River to Grand
St/East River Exceeds Requirements.
39 C Jackson - Cherry St/East River 15.5 ft
40 B Gouverneur - Jackson St/ East
River/Pier 42 15.5 ft
7.3 Wave Overtopping Volumes
The maximum wave overtopping rates inform flood protection elevation requirements, while the total
overtopping volume is used to inform the expected depth of flooding and interior drainage needs for flood
mitigation on the back side of the flood protection system. The total overtopping volumes were integrated
over the storm duration and over the full length of the flood protection alignment.
The wave overtopping volumes have been reduced to negligible amounts or eliminated for the initial
accreditation and have been calculated at approximately 3 MG for the mean overtopping wave and at
below 5 MG for the 68th percentile overtopping wave. The 2015 concept design yielded 19 MG for the
68th percentile wave. Note that the original configuration of the alignment in the 2015 study allowed for
more overtopping due to the fact that wall heights were set lower than the current design minimums for
portions of the alignment and the design also did not incorporate a raised park section.
7.4 Spatial Extent of Overtopped Discharge for Raised Landforms
To determine zones affected by direct wave overtopping hazard, the determination of the spatial
distribution of overtopped discharge may be used. There are two main scenarios that may lead to the
overtopped volumes to travel a certain distance inland:
• Non-impulsive conditions (greenwater): the distribution of the overtopped water will depend on the
form of the area landward of the structures crest, and according to the EuroTop Manual, no generic
guidance can be offered.

EAST SIDE COASTAL RESILIENCY –COASTAL HYDRAULICS REPORT
FINAL DESIGN
arcadis.com 7-7
• Impulsive conditions (violent): laboratory tests have been used to identify an upper bound on the
possible wind-driven spatial distribution of the fall back to ground footprint of these type of overtopped
volumes. The conservative guidance indicates that:
▪ 50% of the overtopped discharge will land within a distance of 0.06 x Lm-1,02
▪ 90% of the overtopped discharge will land within a distance of 0.20 x Lm-1,0
▪ 95% of the overtopped discharge will land within a distance of 0.25 x Lm-1,0
The guidance above has been applied to determine the overland propagation extent of overtopped
volumes for each of the alignments considered in this study. Since drainage collection in the park is
designed to route water downstream of tide gates from the water’s edge to about 80 to 100 feet inland,
any volume in this area cannot be considered overtopping volume since the water never enters the City-
side. Results are summarized in Table 7-6.
Table 7-6 Upper Boundary of Overtopped Water Volumes in Elevated Land Mass of East River Park.
Transect location
SWEL Height of System at Edge of
Esplanade/Waterfront
Distance of travel of
overtopped wave
Overtopping Rate
Entering City Side
Station ft-NAVD88 ft-NAVD88 ft CFS/LF
C-1 13.50 16.00 12.56 0.00
D-1 13.50 12.00 23.03 0.00
D-2 13.50 10.00 32.43 0.00
E-1 13.50 16.00 12.53 0.00
E-2 13.50 16.00 12.33 0.00
F-1 13.50 11.95 17.30 0.00
F-2 13.50 16.50 50.07 0.00
G-1 13.50 16.00 12.43 0.00
G-2 13.50 8.00 26.36 0.00
H-1 13.50 16.50 12.54 0.00
I-1 13.50 16.50 12.65 0.00
I-2 13.50 16.50 12.76 0.00
2 Deepwater wave length.

EAST SIDE COASTAL RESILIENCY –COASTAL HYDRAULICS REPORT
FINAL DESIGN
arcadis.com 8-1
8 FEMA REQUIREMENTS FOR FLOOD PROTECTION
SYSTEMS
In order for FEMA to recognize a flood protection system and amend the FIRMs, the flood protection
system must meet federal design requirements. FEMA regulations related to minimum freeboard
requirements of levee systems are greater of values summarized below as taken from CFR Title 44
§65.10 (b) (iii-iv):
• 100-Year Storm Tide + 100-Year Wave Profile + 1 ft or
• 100-Year Storm Tide + Maximum Wave Runup + 1 ft
Exceptions to the minimum freeboard requirement may be approved for a lesser freeboard with
engineering analysis to demonstrate:
• Analysis must evaluate the uncertainty in the estimated base flood loading conditions.
• Effects of wave attack and overtopping are considered in assessing stability of the floodwall/levee.
A minimum of 2 feet of freeboard is provided.
The elevation requirements based on overtopping rate for the design event are presented in Section 7.2.1
summarizes the minimum required crest elevations along the length of the flood protection system. For
the vertical wall locations at or close to the water’s edge, the FEMA maximum wave runup criteria is the
control for elevation requirements without use of the exception. The design elevation of +16.5 ft NAVD88
will satisfy the initial freeboard and the design condition requirements.
Obtaining FEMA recognition of the flood protection system will be based on current day SLR and FEMA
PFIRMs. However, considering the effects of SLR to understand adaptation requirements needed to
obtain FEMA recognition in the future are important as well.
The system will likely meet the freeboard criteria during the initial certification period, but the exception
category will be required for the design condition (100-year storm, 2050s 90th percentile sea level
rise). The overtopping analysis and design of the flood wall confirms that the design would meet the
requirements for the exception approval, if or when needed.
The system wide minimum has been set at +16.5 NAVD88 to assure that the flood protection system
continues to be recognized by FEMA in the future. However, two incorporated flood protection systems
at the ConEdison generating station (+15.0 NAVD88) and at the VA Medical Center (+16.2 NAVD88) will
need to be monitored as sea level rise occurs and adjusted accordingly if necessary. The ConEdison
area will require more scrutiny and monitoring over the next 50-100 years.
Again, this simple demonstration does not consider the impact of potential future storm events and how
they could further increase the FEMA storm tide elevations on future PFIRMs.

EAST SIDE COASTAL RESILIENCY –COASTAL HYDRAULICS REPORT
FINAL DESIGN
arcadis.com 9-1
9 NO IMPACT ANALYSIS
An analysis was performed to determine the effects of the flood protection alignment on 100-year storm
tide elevations at properties adjacent to and outside of the flood protection alignment. A representative
100-year storm event was simulated using the ADCIRC+SWAN models with and without the flood
protection alignment in place. An additional set of simulations were performed that considered the 100-
year storm tide event with the 90th percentile SLR projection in the 2050s to determine any potential
impacts in the future. The following section discusses the selection of the representative100-year storm
event, the setup of the ADCIRC+SWAN simulations, and the demonstration of no-impact in the simulation
results.
9.1 Selection of a Representative 100-Year Storm Tide Event
To determine a representative 100-year storm tide event, all of the tropical and extratropical storms used
by FEMA to develop the 100-year storm tide shown on the PFIRMs were reviewed. Storm events that
produced peak storm tide close to the 100- year storm tide were identified. Figure 9-1 shows all of the
FEMA PFIRM storms, potential representative events, and the parametric fit hydrographs (previously
shown on Figure 3-1).
It can be seen on Figure 9-1 that two tropical storm events, NJB_0003_010 and NJB_0007_006 result in
peak storm tide slightly higher than the 100-year storm tide. Because the width of NJB_0007_006
matches the 100-year parametric fit hydrograph better than the NJB_0003_010 event, the
NJB_0007_006 storm has been selected as a representative 100-year storm tide event.
Figure 9-1 Storm Tide Time Series for all FEMA PFIRM Events, the Parametric Fit Time Series, and Two
Potential 100-year Storm Tide Events.

EAST SIDE COASTAL RESILIENCY –COASTAL HYDRAULICS REPORT
FINAL DESIGN
arcadis.com 9-2
This event is a synthetic tropical storm, developed by FEMA, based on tropical storm parameters (storm
track, storm size, storm speed, and atmospheric pressure distributions) that are statistically representative
for the NYC region (FEMA, 2014a).
9.2 ADCIRC+SWAN Simulation Setup
The representative storm tide event was simulated using the same models used by FEMA during the
analysis performed to generate the PFIRMs, i.e. coupled ADCIRC (Luettich et. al., 2004) and SWAN
(SWAN, 2006). These models simulate hydrodynamics and waves respectively and are run in tandem so
that hydrodynamic outputs can be used in calculating wave conditions and vice versa. The simulation of
the representative 100-year storm tide event was performed using the model input files provided by
FEMA, which are further described in the FEMA PFIRM documentation (FEMA, 2014b).
The bathymetric finite element grid, or mesh, used for the ADCIRC + SWAN simulations was based on
the mesh used in the FEMA PFIRM study, but was enhanced with more resolution, especially in the areas
adjacent to the flood protection alignment. Figure 9-2 shows raw images of the mesh, demonstrating that
close to the flood protection alignment (shown by the solid black outline) the enhanced mesh size ranges
from roughly 75 to 250 ft compared to roughly 200 to 600 ft in the FEMA PFIRM mesh. These same mesh
enhancements were used in the simulations conducted for the NYC Mayor’s Office following Hurricane
Sandy (City of New York Mayor’s Office, 2013).
Figure 9-2 Raw comparison of FEMA PFIRM mesh (top) and the enhanced mesh (bottom) used in this
analysis. Mesh size shown in ft. Alignment shown by solid black line.

EAST SIDE COASTAL RESILIENCY –COASTAL HYDRAULICS REPORT
FINAL DESIGN
arcadis.com 9-3
The flood protection alignment, previously shown in Figure 2-1, was added to the enhanced mesh by
raising the nodes in the model along the flood protection alignment to the elevation of the flood protection
alignment. The alignment elevations were those developed for the design event as shown in
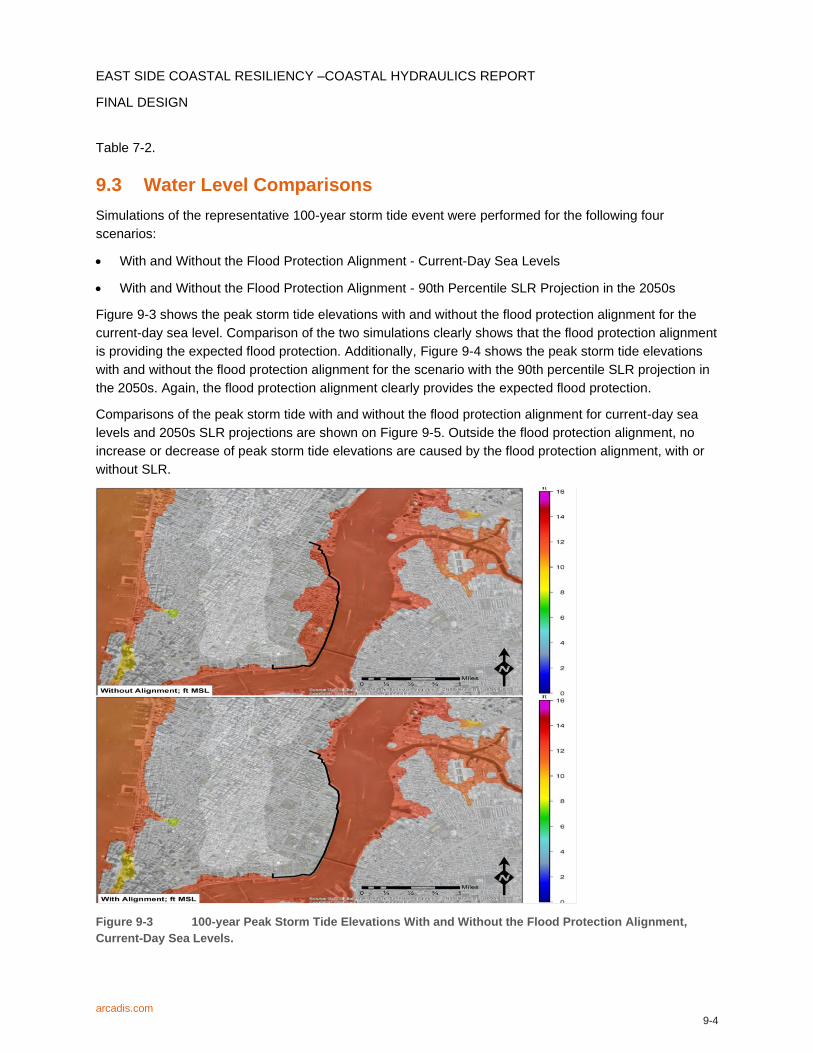
EAST SIDE COASTAL RESILIENCY –COASTAL HYDRAULICS REPORT
FINAL DESIGN
arcadis.com 9-4
Table 7-2.
9.3 Water Level Comparisons
Simulations of the representative 100-year storm tide event were performed for the following four
scenarios:
• With and Without the Flood Protection Alignment - Current-Day Sea Levels
• With and Without the Flood Protection Alignment - 90th Percentile SLR Projection in the 2050s
Figure 9-3 shows the peak storm tide elevations with and without the flood protection alignment for the
current-day sea level. Comparison of the two simulations clearly shows that the flood protection alignment
is providing the expected flood protection. Additionally, Figure 9-4 shows the peak storm tide elevations
with and without the flood protection alignment for the scenario with the 90th percentile SLR projection in
the 2050s. Again, the flood protection alignment clearly provides the expected flood protection.
Comparisons of the peak storm tide with and without the flood protection alignment for current-day sea
levels and 2050s SLR projections are shown on Figure 9-5. Outside the flood protection alignment, no
increase or decrease of peak storm tide elevations are caused by the flood protection alignment, with or
without SLR.
Figure 9-3 100-year Peak Storm Tide Elevations With and Without the Flood Protection Alignment,
Current-Day Sea Levels.

EAST SIDE COASTAL RESILIENCY –COASTAL HYDRAULICS REPORT
FINAL DESIGN
arcadis.com 9-5
Figure 9-4 100-year peak storm tide elevations With and Without the Flood Protection Alignment, 90th
percentile SLR projection in the 2050s.

EAST SIDE COASTAL RESILIENCY –COASTAL HYDRAULICS REPORT
FINAL DESIGN
arcadis.com 9-6
Figure 9-5 100-year Peak Storm Tide Comparisons With and Without the Flood Protection Alignment
for both current-day sea levels and the 90th percentile SLR projection in the 2050s (protected floodplain in
gray shadow)
Figure 9-6 shows the storm tide comparisons over the event duration at the shoreline of the East River
and East 14th Street. The time series shows no noticeable changes in storm tide by the flood protection
alignment in current-day sea levels or the 90th percentile SLR projection in the 2050s. Note that some
differences with and without alignment appear after the peak of the storm, but these differences occur
below mean higher high water. The floodplain near the alignment begins to flood at roughly elevation 8 ft
NAVD88, so is not flooded below mean higher high water. Therefore, the storm tide differences below
mean higher high water cannot be attributed to the flood protection alignment.

EAST SIDE COASTAL RESILIENCY –COASTAL HYDRAULICS REPORT
FINAL DESIGN
arcadis.com 9-7
Figure 9-6 Storm Tide Time Series Comparisons With and Without the Flood Protection Alignment for
the 100-year event,Current-Day Sea Levels,90th percentile SLR projection in the 2050s.
To verify the no-impact results associated with peak storm tides, the displaced floodplain volume for each
scenario was calculated by multiplying the area of the protected floodplain by the average depth of water
in the unprotected floodplain. The displaced floodplain volumes are then:
• 100-Year with Current-Day Sea Levels: 500 acre-ft
• 100-Year with the 90th Percentile SLR Projection in the 2050s: 1200 acre-ft
These displaced volumes are compared to the total volume conveyed through the East River by
multiplying the surface area of the East River at mean sea level, 2,562 acres (Jay et.al. 1975) by a storm
tide of 10 ft, for simplicity. The total storm tide volume conveyed through the East River is then 25,562
acre-ft. The volume displaced by the flood protection alignment is then roughly 2% and 5% of the total
storm tide volume with and without SLR respectively. These small percentages demonstrate that the
displaced volume is small compared to the total storm tide volume in the East River, confirming the
simulation results.

EAST SIDE COASTAL RESILIENCY –COASTAL HYDRAULICS REPORT
FINAL DESIGN
arcadis.com 10-1
10 SUMMARY OF FLOOD PROTECTION ELEVATION
REQUIREMENTS
This report has presented storm tide and wave conditions for the proposed flood protection alignment
from East 25th Street to Montgomery Street along the East River. Storm tide levels, wave conditions, and
SLR projections were quantified as inputs for wave overtopping analysis along the full alignment,
considering vertical wall sections. A design overtopping rate of 0.1 cfs/ft to protect transportation and the
flood protection alignment itself was then used to inform minimum flood protection system wall heights or
crest elevations. However, the resiliency check for the 500-Year 2050s 90th percentile condition was the
controlling factor in most cases for wall minimums, as summarized in Table 10-1.
Table 10-1 Summary of Minimum Required Crest Elevations for the Design Event (2050s 30 inches of
SLR)
Below is a summary of minimum required crest elevations for the design event in the 2050s with 90th
percentile sea level rise predictions (30 inches) based on an overtopping design rate of 0.1 cfs/ft for the
alignment/geometry as well as minimums set by resiliency consideration for a 500 Year 2050s 90th
percentile Sea Level Rise still water elevation is shown on Figure 2-1. Controlling elevations shown in
bold.
FEMA
PFIRM
Transect
#
Reach Approximate
Location Geometry
Requirement
Based on
Overtopping
Rate or
Minimum
Freeboard
Requirement
Based on 500
Year 2050s
90th Percentile
Still Water
Level
Resiliency
Check
25 O
Stuyvesant
Cove
Park/East
River
Vertical wall 15.5 16.5
26 N-O
Stuyvesant
Cove
Park/East
River
Vertical wall 15.5 16.5
27 N-M Avenue C/East
River Vertical wall 15.5 16.5
28 M
East 18th
Street/East
River
Vertical wall 16.5 16.5

EAST SIDE COASTAL RESILIENCY –COASTAL HYDRAULICS REPORT
FINAL DESIGN
arcadis.com 10-2
FEMA
PFIRM
Transect
#
Reach Approximate
Location Geometry
Requirement
Based on
Overtopping
Rate or
Minimum
Freeboard
Requirement
Based on 500
Year 2050s
90th Percentile
Still Water
Level
Resiliency
Check
29 L-M
East 17th
Street/East
River
Vertical wall 16.5 16.5
30 K
East 14th
Street/River/F
DR Drive
Vertical wall 16.5 16.5
31-38
J
through
D
East 12th
St/East River
to Grand
St/East River
Elevated Land Mass/Buried
Floodwall 15.5 16.5
39 C
Jackson -
Cherry
Street/East
River
Vertical wall 15.5 16.5
40 B
Gouverneur -
Jackson
Street/ East
River/Pier 42
Vertical wall 15.5 16.5
Beyond the design event for 30 inches of SLR, adaptation requirements for the 100-year event with SLR
projections in the 2120s were demonstrated, as summarized in Table 10-2. The adaptations that would
be required in that scenario 100 years from construction, with 43 inches of SLR at vertical walls, to
maintain maximum overtopping rates below 0.1 cfs/ft or 0.5 cfs/ft are shown. These adaptations are
relative to the design event minimum required crest elevations shown in Table 10-2. A 2 feet increase in
system height is built into the design of the floodwalls to allow for a future adaptability-based increase in
wall height, without impacts or required modifications to the foundations or significant alterations to the
base of the structures, allowing for less challenging retrofits. For the ConEdison and VA Medical Center,
adaptation may need to occur sooner.

EAST SIDE COASTAL RESILIENCY –COASTAL HYDRAULICS REPORT
FINAL DESIGN
arcadis.com 10-3
Table 10-2 Summary of adaptation requirements for the 500-year event (with no SLR and with the 50th
percentile SLR projection in the 2050s) and for the 100- year event with SLR projections in the 2120s.
Geometry
500-Year With 50th Percentile SLR
Projection (16”) in the 2050s
100-Year With 50th Percentile SLR
Projection (43”) in the 2120s
To Maintain Overtopping Rates Below 0.1 cfs/ft (Design Rate for Earthen Levees/Unarmored areas)
Vertical
Wall
Increase top of wall
0.5 ft to 1.0 ft
Increase top of wall 2 ft and provide additional scour protection where required
Elevated
Park
No change Required
Analysis of Existing Elevations with Targeted improvements where required. Initial park
elevations are set at +18.0 to +25.0
To Maintain Overtopping Rates Below 0.5 cfs/ft (Levees Protected and Upper Limit for Transportation Safety)
Vertical
Wall
No change
Increase top of wall 2 ft
Elevated Park
No change Required
Analysis of Existing Elevations with Targeted improvements where required. Initial park
elevations are set at +18.0 to +25.0
Ranges in the crest elevation adaptations shown in Table 10-2 are the result of variation in wave climate
along the flood protection system, with more exposed locations requiring the higher range of adaptation.
For the future condition 100-year event with the 50th percentile SLR projection of 43 inches in the 2120s,
only minor or no changes based on the current design will be required if the planned 2 feet of wall height
is added before those conditions are met in 100 years. For the 100-year event with the 90th percentile
SLR projection in the 2120s, a major adaptation or total system re-design may be needed as over 6.5 feet
of sea level rise would have occurred.
To assess if the proposed flood protection alignment would impact surge elevations at properties adjacent
to and outside the flood protection alignment, a representative 100-year event was simulated using
ADCIRC + SWAN with and without the flood protection alignment. For the 100-year event with no SLR
and with the 90th percentile SLR projection in the 2050s, no increase (or decrease) of peak storm tide
elevations were observed adjacent to and outside the flood protection alignment as was shown on Figure
9-5.

EAST SIDE COASTAL RESILIENCY –COASTAL HYDRAULICS REPORT
FINAL DESIGN
arcadis.com 11-1
11 REFERENCES
City of New York. 2012. Digital Elevation Model (DEM), 2010, New York City – Improved Shoreline.
City of New York Mayor’s Office. 2013. PLANYC Special Initiative for Rebuilding and Resiliency.
City of New York Law Department. 2013. Local Law 96.
FEMA. 2007. Guidelines and Specifications for Flood Hazard Mapping Partners.
FEMA. 2008. Wave Height Analysis for Flood Insurance Studies. September.
FEMA. 2011. Procedure Memorandum No 60. October 31.
FEMA 2014a. Region II Storm Surge Project – Joint Probability Analysis of Hurricane and Extratropical
Flood Hazards. September.
FEMA 2014b. Region II Storm Surge Project – Model Calibration and Validation. September.
Goda, Yoshimi. 2010. Random Seas and Design of Maritime Structures.
Horton, Radley, Christopher Little, Vivien Gornitz, Daniel Bader, and Michael Oppenheimer. 2015. New
York City Panel on Climate Change 2015 Report, Chapter 2: Sea Level Rise and Coastal Storms.
January.
Jay, D.A. and Bowman, M.J. 1975. The Physical Oceanography and Water Quality of New York Harbor
and Western Long Island Sound.
Luettich, R., and Westerink, J. 2004. Formulation and Numerical Implementation of the 2D/3D ADIRC
Finite Element Model Version 44.xx. December.
NYC Panel on Climate Change. 2013. Climate Risk Information 2013, Observations, Climate Change
Projections, and Maps. June.
Orton, Philip, Sergey Vinogradov, Alan Blumberg, and Nickitas Georgas. 2014. Hydrodynamic Mapping of
Future Coastal Flood Hazards for New York City. February.
Pullen, T., N.W.H. Allsop, T. Bruce, A. Kortenhaus, H. Schuttrumpf, and J.W. van der Meer. 2007.
EurOtop Wave Overtopping of Sea Defenses and Related Structures: Assessment Manual. August.
Steendam, Gosse Jan, Jentsje W. van der Meet, Bianca Hardeman, and Andre van Hovenet. 2012.
Destructive Wave Overtopping Tests on Grass Covered Landward Slopes of Dikes and Transitions
to Berms.
SWAN. 2006. SWAN Technical Documentation. SWAN Cycle III Version 40.51.
USACE. 2002. Coastal Engineering Manual 1110-2-1100.
USACE. 2009. Louisiana Coastal Protection and Restoration Final Technical Report Hydraulics and
Hydrology Appendix. June.

Arcadis of New York, Inc.
Arcadis of New York, Inc.
27-01 Queens Plaza North
Suite 800
Long Island City
New York 11101
Tel 718 446 0116
Fax 718 446 4020
www.arcadis.com