Embed Size (px)
Citation preview
Coastal development impacts on biological Coastal development impacts on biological communities in the Chesapeake Baycommunities in the Chesapeake Bay
Examples from the Atlantic Slope ConsortiumExamples from the Atlantic Slope Consortium
R-82868401

Cast of many…
Smithsonian Environmental Research Center (SERC): Bill Deluca, Pete Marra, Don Weller, Tom Jordan, Tuck Hines, Chuck Gallegos, Ryan King, Matt Baker
Virginia Institute of Marine Science (VIMS): Donna Marie Bilkovic, Carl Hershner, Molly Roggero
Penn State University: Rob Brooks, Denice Wardrop
Atlantic Slope Consortium (ASC) = An Estuarine Indicator Research Atlantic Slope Consortium (ASC) = An Estuarine Indicator Research ProgramProgram
Goal: To develop a suiteof ecological and socioeconomic
indicators for assessingand managing the condition
ofthe vital resources in the
Mid-Atlantic region

Coastal development leads to disruption of ecosystem services…Coastal development leads to disruption of ecosystem services…
Coastal development and deforestation
reduce the filtration capacity of the riparian zone which impacts the
littoral zone
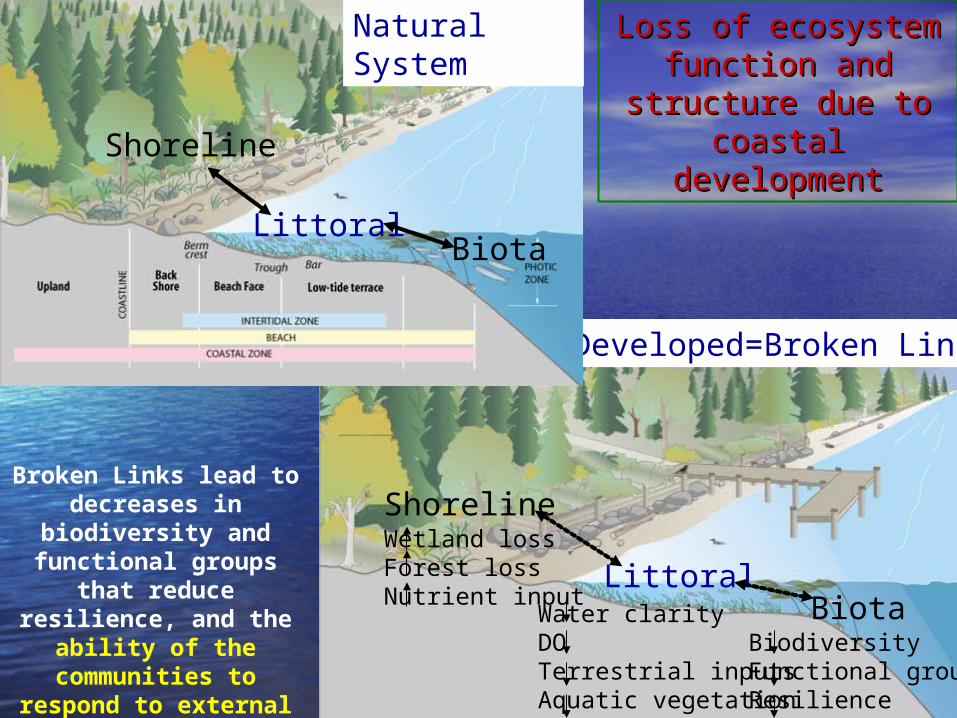
Loss of ecosystem Loss of ecosystem function and function and
structure due to structure due to coastal developmentcoastal development
Developed=Broken Links
Littoral
Shoreline
Biota
Littoral
Shoreline
Biota
Natural System
Water clarityDOTerrestrial inputsAquatic vegetation
Wetland lossForest lossNutrient input
BiodiversityFunctional groupsResilience
Broken Links lead to decreases in
biodiversity and functional groups
that reduce resilience, and the
ability of the communities to
respond to external drivers such as climatic events

• ““Estuarine Estuarine segments”: segments”:
Watersheds and Watersheds and subestuaries of a subestuaries of a larger estuarine larger estuarine
ecosystemecosystem
• Segment land-Segment land-use ranges from use ranges from
forested to forested to highly highly
agricultural or agricultural or developeddeveloped
ASC Goal: to identify linkages between patterns of ASC Goal: to identify linkages between patterns of land use and environmental indicators in estuarine land use and environmental indicators in estuarine
habitats.habitats.
Developed
Agricultural
Mixed-Developed
Mixed-Agricultural
Forested

IndicatorIndicator WatershedWatershed Local land useLocal land use
Stream nutrientsStream nutrients XX
Stream Stream macroinvertebratemacroinvertebrate
ss
XX XX
Estuarine water Estuarine water qualityquality
XX
Benthic IBIBenthic IBI XX XX
Fish IBIFish IBI XX XX
PhragmitesPhragmites abundanceabundance
XX XX
Blue crab Blue crab abundanceabundance
XX XX
PCB in White PCB in White perchperch
XX
Waterbird IBIWaterbird IBI XX XX
Wetland Bird IBIWetland Bird IBI XX
SAV abundanceSAV abundance XX
Potential environmental indicators of the health of Potential environmental indicators of the health of the Baythe Bay

Available subtidal habitat
Abundant Moderate Low
Fish
Com
mun
ity
Inde
x (F
CI)
0
1
2
3
4
5
6
7
Amount of Alterations to Shoreline
Minimal Moderate High
Fish
Com
mun
ity
Inde
x (F
CI)
0
1
2
3
4
5
6
7
Higher FCI scores were associated with increasing
abundance of subtidal habitat
FCI scores were lower at sites with highly altered shorelines versus natural
shorelines.Bilkovic et al. 2005
p<0.001; all different p=0.003; High vs. Minimal
Fish Communities and HabitatFish Communities and Habitat

r2 = 0.61, P < 0.001
% Developed Land in Watershed
0 20 40 60 80
Phragmites
abu
nd
ance
est
imat
e
0
1
2
3
4
5
6
7
DevelopedMixed-DevAgriculturalMixed-AgForested
r2 = 0.61, P < 0.001r2 = 0.61, P < 0.001
% Developed Land in Watershed
0 20 40 60 80
Phragmites
abu
nd
ance
est
imat
e
0
1
2
3
4
5
6
7
DevelopedMixed-DevAgriculturalMixed-AgForested
Whigham et al. 2005
Invasive Species and DevelopmentInvasive Species and Development

y = 10.3e0.067x
R2 = 0.77
1
10
100
1000
0 20 40 60 80
Percent Developed Land in Watershed
To
tal P
CB
s in
Wh
ite
Pe
rch
(n
g/g
)
1 meal/mo
0.5 meal/mo
no consumptionrecommended*
Developed
Agricultural
Mixed-Developed
Mixed-Agricultural
Forested
y = 10.3e0.067x
R2 = 0.77
1
10
100
1000
0 20 40 60 80
Percent Developed Land in Watershed
To
tal P
CB
s in
Wh
ite
Pe
rch
(n
g/g
)
1 meal/mo
0.5 meal/mo
no consumptionrecommended*
Developed
Agricultural
Mixed-Developed
Mixed-Agricultural
Forested
Developed
Agricultural
Mixed-Developed
Mixed-Agricultural
Forested
Total PCBs in white perch in relation to percent developed land in the watershed. USEPA (1999) guidelines for cancer
health endpoints.
King et al. 2004
White Perch and PCBsWhite Perch and PCBs

Juvenile blue crabs (< 3 in) were most abundant at sites with extensive shoreline wetlands, forested watersheds, and sub-estuaries with average salinity > 16 ppt.
King et al. 2005
Juvenile Blue Crabs and HabitatJuvenile Blue Crabs and Habitat

Developed riparian land use (%)0 20 40 60 80 100
Cu
mu
lati
ve p
rob
abil
ity
of c
han
ge p
oin
t
0
20
40
60
80
100B
IBI
in t
he
Nea
rsh
ore
0
1
2
3
4
5
6
Negative macrobenthic community responses occurred when developed shorelines were 10% or higher.
Cumulative Probability Curve
Changepoint AnalysisChangepoint Analysis——Assessing Ecological ThresholdsAssessing Ecological Thresholds
Bilkovic et al. 2006

King et al. 2005
Cu
mu
lati
ve P
rob
ab
ility
of
A
Th
resh
old
Str
eam
macr
oin
vert
eb
rate
dis
sim
ilari
ty
score
s
Increasingly positive scores=more diverse,
pollution-sensitive taxa
Increasingly Negative score = taxa associated with impaired streams
Development appeared to have its greatest
effect on stream macroinvertebrates when close to the
sampling station, where it contributes to
riparian degradation and reduced woody-
debris input.
21-32% Dev. threshold
1-22% Local Dev. threshold
Stream Macroinvertebrates and DevelopmentStream Macroinvertebrates and Development

Mar
sh B
ird
Co
mm
un
ity
Inte
gri
ty
Low
High
Percent Development within 500m of a Wetland
0 25 50
100
0
50
Cu
mu
lati
ve P
rob
abili
ty o
f a
Th
resh
old
Occ
urr
ing
Mar
sh B
ird
Co
mm
un
ity
Inte
gri
ty
Low
High
Percent Development within 500m of a Wetland
0 25 50
100
0
50
Cu
mu
lati
ve P
rob
abili
ty o
f a
Th
resh
old
Occ
urr
ing
When 15% of the land within 500 m of a marsh was developed there was a significant decline in Marsh Bird
Community Integrity.
Marsh Bird Integrity and DevelopmentMarsh Bird Integrity and Development
DeLuca et al. 2004
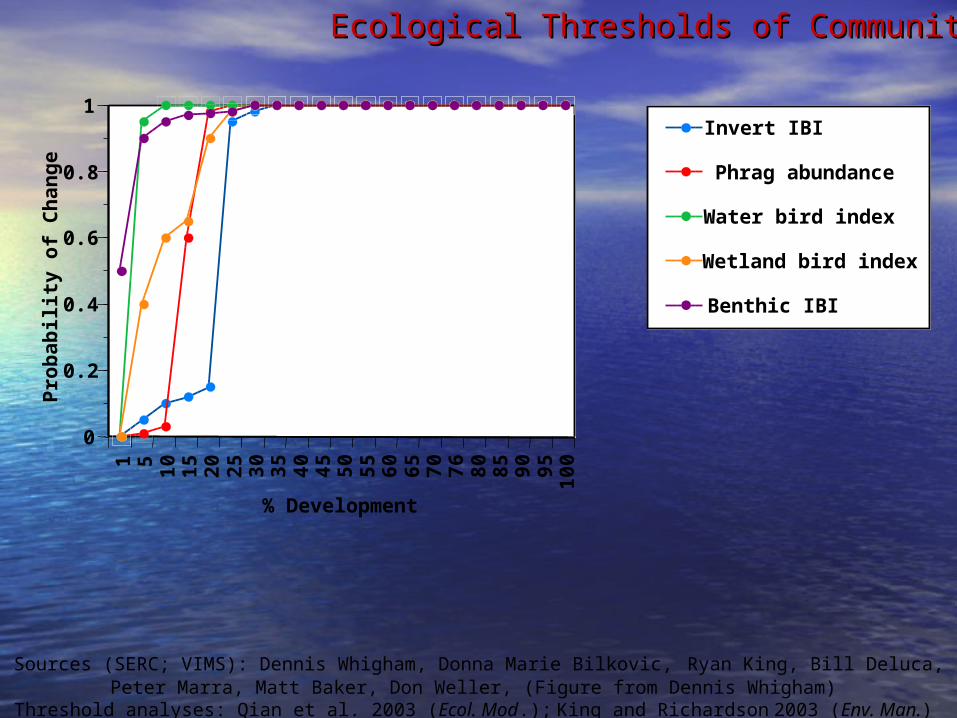
Sources (SERC; VIMS): Dennis Whigham, Donna Marie Bilkovic, Ryan King, Bill Deluca, Peter Marra,
Matt Baker, Don Weller, (Figure from Dennis Whigham) Threshold analyses: Qian et al. 2003 (Ecol. Mod.); King and Richardson 2003 (Env. Man.)
1 5 10
15
20 25 30
35
40
45
50
55
60
65
70
76
80
85
90
95
10
0
0
0.2
0.4
0.6
0.8
1
Pro
ba
bil
ity
of
Ch
an
ge
% Development
Invert IBI
Phrag abundance
Water bird index
Wetland bird index
Benthic IBI
Ecological Thresholds of CommunitiesEcological Thresholds of Communities

YES--Our research indicated that structural and functional changes in biological communities
occurred in relation to alterations in subtidal habitat, shoreline condition, and/or land use.
Do Biota Respond to Variations in Nearshore Condition?

► Both the amount of development and its proximity to the estuary or wetland contributes to degradation of aquatic resources.
►In general, > 20% development (at local and/or watershed levels) was related to shifts in biological communities (indicators), revealing possible ecological thresholds
►Forest buffers were also noted to reduce sediment and nutrient loads along stream corridors or around wetlands
►In many instances, local development had stronger links with the aquatic resource than watershed development
FINAL ASC REPORT ONLINE: http://www.asc.psu.edu/public/pubs/_Final%20Report_AtlanticSlopeConsortium.pdf
SUMMARYSUMMARY