Embed Size (px)
Citation preview

CCTR
COALThe Essential Fuel
Advances in Clean Coal and Control of CO2
December 9, 2008 ISMR Presentation
Jasper, Indiana
Marty W. Irwin, Director
Indiana Center for Coal Technology Research
Indiana Center for Coal Technology ResearchLocated in the Energy Center at Discovery Park, Purdue University

CCTR Are we using to much Energy?
Population Energy GDP Energy/GDP
1000Btu/$
USA 6% 25% 33% .758
ROW 94% 75% 67% 1.12
Do the Math
US population consumes 5.26 times the energy of the average person in the rest of the World;
But we produce 7.7 times the goods and services of the Rest Of the World.
The USA only 67% of the energy per unit of GDP as does the rest of the world.
We are the model of energy efficiency, (only Japan and Lichtenstein are better).
Per capita energy is of no value to measure, to reduce your per capita consumption you need only add population.
It is what you do with the energy that matters.33% of the world has never used a telephone:
40% of China population have no electricity or indoor plumbing:
50% of the population of the world is on a subsistence economy:
How do you compare the energy us of a Bushman in the Kalahari trying to feed his family with a Hoosier farmer who uses his 255 acres to feeds 150 people?
Its not how much you use, its what you do with it.
2

CCTR
3
Indiana Primary Energy ConsumptionSource & Sector, 2006
. Trillion Btu’s Trillion Btu’s
COAL1,547.552.6%
PETROLEUM890.729.7%
NATURAL GAS512.117.1%
RENEWABLES46.31.5%
TRANSPORTATION648.722.5%
INDUSTRIAL1346.346.7%
RESIDENTIAL & COMMERCIAL
532.3 + 353.1 = 885.430.7%
Source % Sector %
40.2
%
18.6%
9.3%
44.1%47.8%7.1%
1.0%
4.2%72.2%
22.9%0.6%
0.5%
22.6%
31.8%
96.2%
0.4%
2.9% 0.4%
97.6%
0.8%
1.6%
42.6%24.8%
29.8%
2.5%
2.8%
13.1%
78.1%
6.3%
76.9%
Total = 2.88 Quads (1015 Btu)75% of energy imported
http://www.eia.doe.gov/emeu/states/state.html?q_state_a=in&q_state=INDIANAhttp://www.eia.doe.gov/emeu/states/sep_use/total/pdf/use_in.pdf
Net inter-state flow of electricity/losses = -116.1
0.0%
ELECTRIC POWER1,237.4
INDUST 524.9 RES 349.0 COMM 247.2 TRANS 0.2 EXPORT 116.1
0.0%
Ene
rgy
for
elec
tric
ity in
eac
h se
ctor
is in
clud
ed

CCTR
4
How Important is Manufacturing to Indiana?Manufacturing as % of Indiana’s GDP
1997 GDP 2006 GDPDurable Goods 18.1% 20.5%Non-Durable Goods 10.2% 10.0%Total Manufacturing 28.3% 30.5%• In 1997 Indiana’s 18.1% durable goods as part of GDP
was the highest in the nation. (2006 Indiana ranked 3rd).• 2006 Total Manufacturing of 30.5% is highest in the
nation.• Your CO2 Footprint is large if you live in Indiana because
we are a Manufacturing State: CO2 and Energy use measurements do not account for where the final product is consumed, only where it is produced.
Indiana is a manufacturing stateIndiana’s industrial sector provides about 1/3 of the state GDP & consumes nearly 1/2 of
total energy
Source: Indiana Business Review, Spring 2008

CCTRWho uses coal in
Indiana?When you use Electricity you use
Coal.• When you allocate the coal used to make electricity to the electricity user:
Coal consumed in Indiana
Sector % of total Million Tons Used
• Industrial 55.2% 38.8• Residential 21.7% 15.3 10 tons /household
• Commercial 15.8% 11.1• Export 7.3% 5.1• Total 100.0% 70.3• http://www.eia.doe.gov/emeu/states/state.html?q_state_a=in&q_state=INDIANA
5

CCTR
Real Cost of Energy
6

CCTR
Econ: 666Demand Increases as Price Increases
• From 1995 to 2006 :• Coal price per MMBTU increased 21.1%
Demand increased 14.0%
• N G price per MMBTU increased 250.5%
Demand increased 26.7%
• Petroleum price per gallon 107.5%
Demand increased 14.9%
• Electricity in Indiana price increased 23.5% Demand increased 21.3%
7

CCTR
8
2006 COAL DESTINATION: INDIANA
Alabama: 946 Total944 Coke Rail
In state: 32,965 Total30,532 Electricity GenerationRail 17,021 River 30Conveyer 3,606 Truck 12,308
2,379 Industrial Plants Truck
54 Residential-Commercial Truck
Illinois: 6,450 Total5,347 Electricity GenerationRail 4,672 River 428 Truck 589761 Industrial PlantsRail 675 Truck 86
Colorado: 153 Total109 Electricity Gen, Rail, 44 Industrial
Kentucky: 1,371 Total882 Electricity GenerationRail 530 River 352489 Industrial PlantsRail 392 Truck 97
Montana: 2,226 Total2,226 Electricity GenerationRail
Ohio: 195 Total188 Electricity GenerationRail 73 River 96 Truck 197 Industrial Plants Truck
Pennsylvania: 546 Total475 Electricity GenerationRail 223 River 251 68 Industrial Plants Truck
Wyoming: 11,927 Total11,686 Electricity GenerationRail Industrial 240 River
60,582 Power Generation (9,300 from Synfuel) 6,140 Coke Plants 5,932 Industrial Plants
Source: http://www.eia.doe.gov/cneaf/coal/page/coaldistrib/coal_distributions.html
Utah: 164 Total164 Industrial Rail
West Virginia: 7,942 Total2,111 Electricity GenerationRail 1,114 River 968 Truck 284,634 Coke PlantsRail 4,163 River 420, Truck 511,197 Industrial PlantsRail 949 River 246 Truck 2
Virginia: 670 Total670 Coke Plants Rail
Coal Destined for Indiana: 72,346 (Thousand short tons) & Methods of Transportation
Indi
ana
Coa
l

CCTR Why Coal?Because that is what we have in Indiana,
and lots of it
9

CCTR
10
Coal is the Answer to the emissions problem.Increasing the use of electricity puts the emissions controls at the
Utility. You rent pollution control when you buy electricity
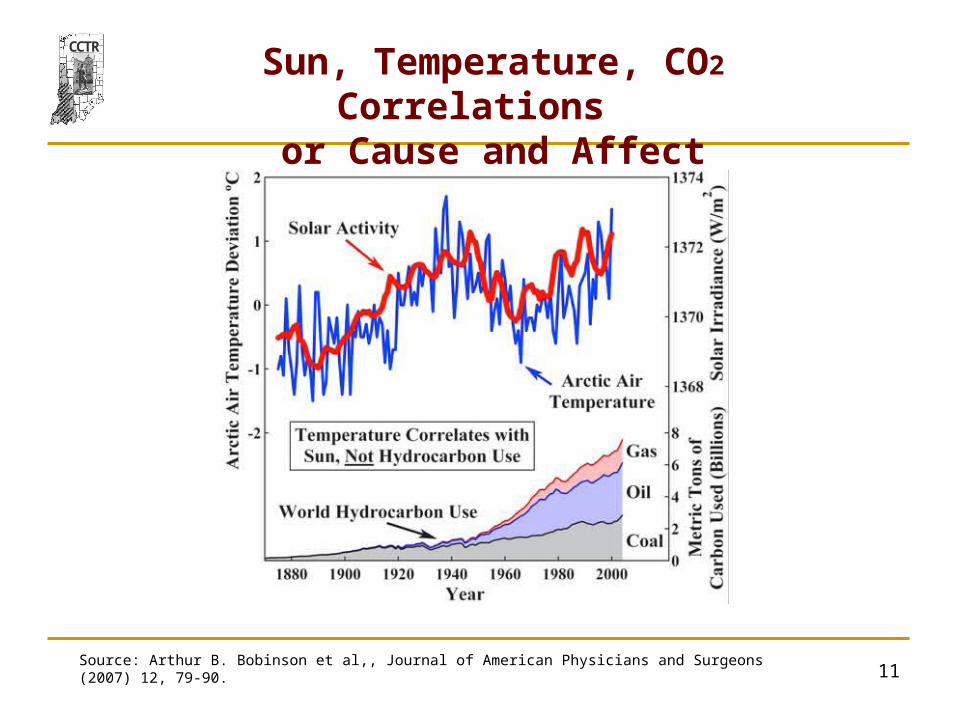
Unintended consequences of spending Billions on Pollution Control?Nitrogen based fertilizer applications increase 44.4% from 1983 to 2004. NOx emissions fell 44% during same time period. (Correlation Coefficient 99.1)Australian Scientist has proposed putting SOx in the atmosphere to reduce global warmingIS GLOBAL WARMING THE RESULT OF INCREASING THE CO2 EMISSIONS OR THE REDUCTION OF SOX?
CCTR
11Source: Arthur B. Bobinson et al,, Journal of American Physicians and Surgeons (2007) 12, 79-90.
Sun, Temperature, CO2 Correlations or Cause and Affect
CCTR
12
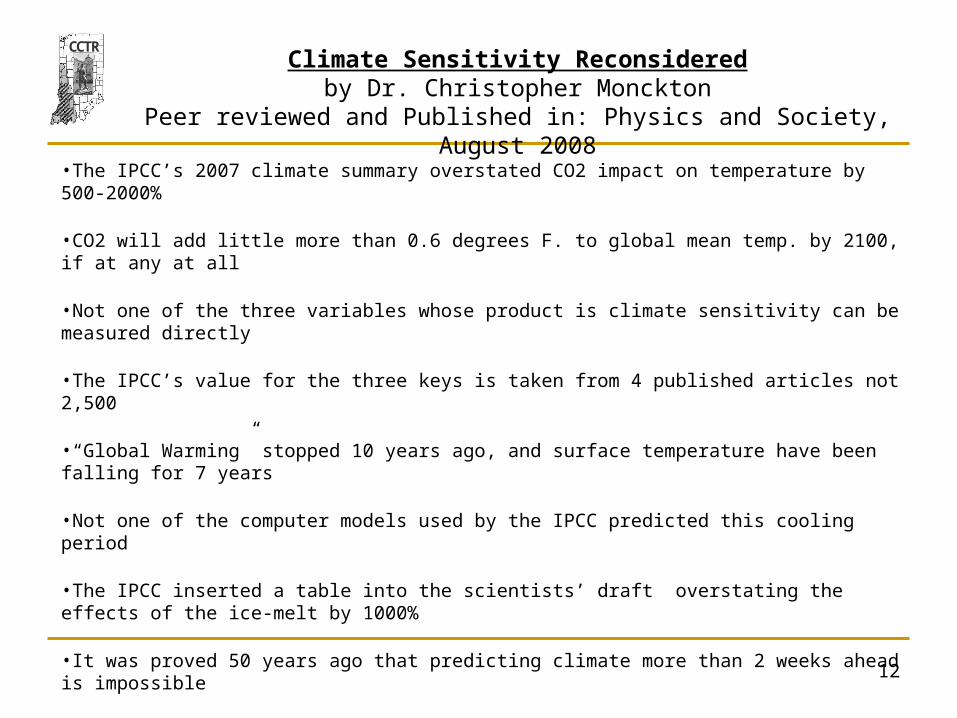
Climate Sensitivity Reconsideredby Dr. Christopher Monckton
Peer reviewed and Published in: Physics and Society, August 2008
•The IPCC’s 2007 climate summary overstated CO2 impact on temperature by 500-2000%
•CO2 will add little more than 0.6 degrees F. to global mean temp. by 2100, if at any at all
•Not one of the three variables whose product is climate sensitivity can be measured directly
•The IPCC’s value for the three keys is taken from 4 published articles not 2,500
•“Global Warming” stopped 10 years ago, and surface temperature have been falling for 7 years
•Not one of the computer models used by the IPCC predicted this cooling period
•The IPCC inserted a table into the scientists’ draft overstating the effects of the ice-melt by 1000%
•It was proved 50 years ago that predicting climate more than 2 weeks ahead is impossible
•Mars, Jupiter, Neptune’s largest moon, and Pluto warmed at the same time as Earth
•In the past 70 years the Sun was more active than at almost any time in the past 11,400 years

CCTR
1313
A High- Resolution, Interactive Map of U.S. CO2 Emissions and Density from Fossil Fuels

CCTR
14

CCTR
15
Problem: We have a need for lots of energy;we produce stuff used elsewhere.
We have a lot of coal;We have real issues with CO2 ;
Regardless of whether there is any legitimate environmental basis for the concerns or not.
We are shipping out $1 billion a year to buy coal from other states and bring it to Indiana;
What would resolve all of the issues?Use Indiana’s own coal in a way that would;
1) Retain energy capital,2) Create jobs for Hoosiers,3) Leave the environment cleaner than it is now,4)Reduce the cost of the goods manufactured in the state
(especially steel),5) Turn CO2 into a desirable resource
We must get the Science Right, or We will get the Policy Wrong.

CCTR
16

CCTR Economic ResultsOf CO2 Removal and Sequestration
17
Base power plant cost for an existing plant obtained from Energy Velocity ranged from 2 to 3 cents/kWh.
6.5 ¢/kWh assumes make-up power from a new non-capture supercritical PC plant12.0 ¢/kWh assumes make-up power from a new supercritical PC plant with 90% capture
With make-up power at 6.5 ¢/kWhCOE by >300%
With make-up power at 12¢/kWhCOE by >400%
Source: Jared Ciferno, DOE NETL 401/110907

CCTR
18
What choice do we have?Change the way we produce power and energy

CCTR
19
Wabash RiverOne of the Cleanest Coal Fired
Power Plants in the WorldGasification operations require more space than the original power plant

CCTR
20
Extensions and Existing CO2 Pipelines in Relation to
Gasification Projects

CCTR
21

CCTR
22

CCTR
23

CCTR
24
CCTR
25

CCTR Direct Affect of Coal Mining In Indiana
• In 2007, Indiana’s coal mining industry:
a) Employed 2968 people at 44 mines in 9 counties
b) Mined 34.231 million tons of coal valued at $985 million
c) This represents 0.1% of state employment, and 0.47% of state GDP, about 1% of southwest regional employment
26

CCTR Full Affect of Coal Industry In Indiana
• The direct effect understates the full regional impact, as workers and owners locally spend their earnings
• This full impact is measured by a regional multiplier, which measures the full spending impact of each direct effect dollar
• The value of the regional multiplier for coal mining in Indiana is currently 2.2
• Thus, the full impact of coal mining on Indiana’s economy is $2167 million, not $985 million
27
CCTR
28
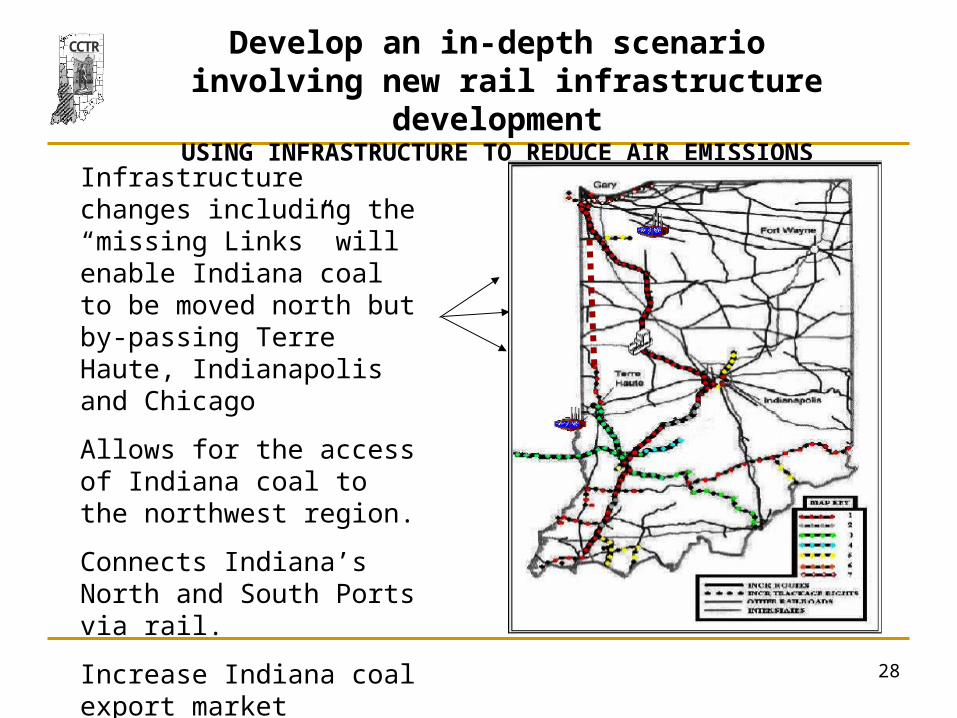
Develop an in-depth scenario involving new rail infrastructure development
USING INFRASTRUCTURE TO REDUCE AIR EMISSIONS
Infrastructure changes including the “missing Links” will enable Indiana coal to be moved north but by-passing Terre Haute, Indianapolis and Chicago
Allows for the access of Indiana coal to the northwest region.
Connects Indiana’s North and South Ports via rail.
Increase Indiana coal export market potential

CCTR Southwest/Northwest Indiana Economic Development Plan
Future Idea Areas
Indiana Coal Production Potential:
A) Indiana coal to make coke:
reducing cost of steel production, reducing air emissions in the region 2.1 million tons
NiSource coal replacement potential 6.8 million tons
TOTAL Indiana Coal Potential 8.9 million tons
Producing 8.9 million tons of coal adds:
742 direct mine workers*
2967 Ancillary workers * employment to South West IN
Total added annual economic activity in South West Indiana $530.3 million*
Estimated cost of the Indiana/Illinois order rail line $ 50.0 million
B) Newport Military Base transfer to Indiana/Purdue University:
1. Biomass to Energy test site
2. Wind Energy gasification supplement site
3. Provide syngas to Cayuga making it more usable during peak demand times
*EXPANDING THE UTILIZATION OF INDIANA COALS
Brian H. Bowen, Forrest D. Holland, F.T. Sparrow, Ronald L. Rardin, Douglas J. Gotham, Zuwei Yu, Anthony F. Black. Center for Coal Technology Research, Purdue University, 2004, page 20.
29

CCTR
Evaluate every suggestionTrust but verify
30
Clean Wind Energy?

CCTR
31
We welcome visits Indiana Center for Coal Technology Research, CCTR
500 Central Dr., Potter 326
Purdue University
West Lafayette, IN 47907-2022
Phone: 765-494-7037
Fax: 765-494-6298
http://www.purdue.edu/dp/energy/CCTR
Marty W. Irwin, Director
Dr. Brian Bowen, Deputy Director
Indiana Center for Coal Technology ResearchLocated in the Energy Center at Discovery Park,
Purdue University