Embed Size (px)
Citation preview
Coal Synfuel and CO2 Enhanced Oil Recovery
Opportunities for Early CCS Projects
Robert H. Williams Princeton Environmental Institute
Princeton University
IEA Workshop on Industrial CCS Beijing, China
5 December 2013
Outline • Widespread deployment of CCS technology requires a strong
carbon-mitigation policy or an equivalent incentive.
• In the absence of such policies there are two promising approaches for going forward in the near term with no or only modest government subsidies—by taking advantage of:
– The inherently low CO2 capture cost at chemical and synfuel plants (at which CO2 has to be removed before synthesis—even in absence of a carbon policy);
– The market value of captured CO2 if used for enhanced oil recovery (EOR) applications.
• Chinese opportunities in both areas are reviewed.
• The economic aspects of exploiting CO2 EOR opportunities is explored for systems that make electricity from coal, synfuels from coal, and synfuels + electricity from coal in the US.
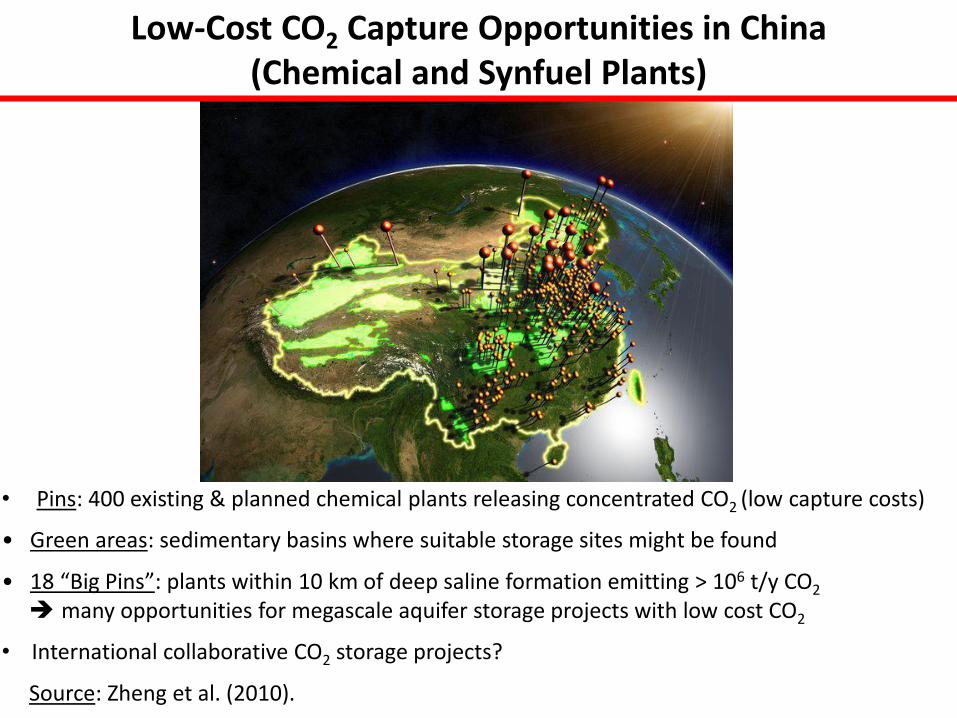
• Pins: 400 existing & planned chemical plants releasing concentrated CO2 (low capture costs)
• Green areas: sedimentary basins where suitable storage sites might be found
• 18 “Big Pins”: plants within 10 km of deep saline formation emitting > 106 t/y CO2 many opportunities for megascale aquifer storage projects with low cost CO2
• International collaborative CO2 storage projects?
Source: Zheng et al. (2010).
Low-Cost CO2 Capture Opportunities in China (Chemical and Synfuel Plants)
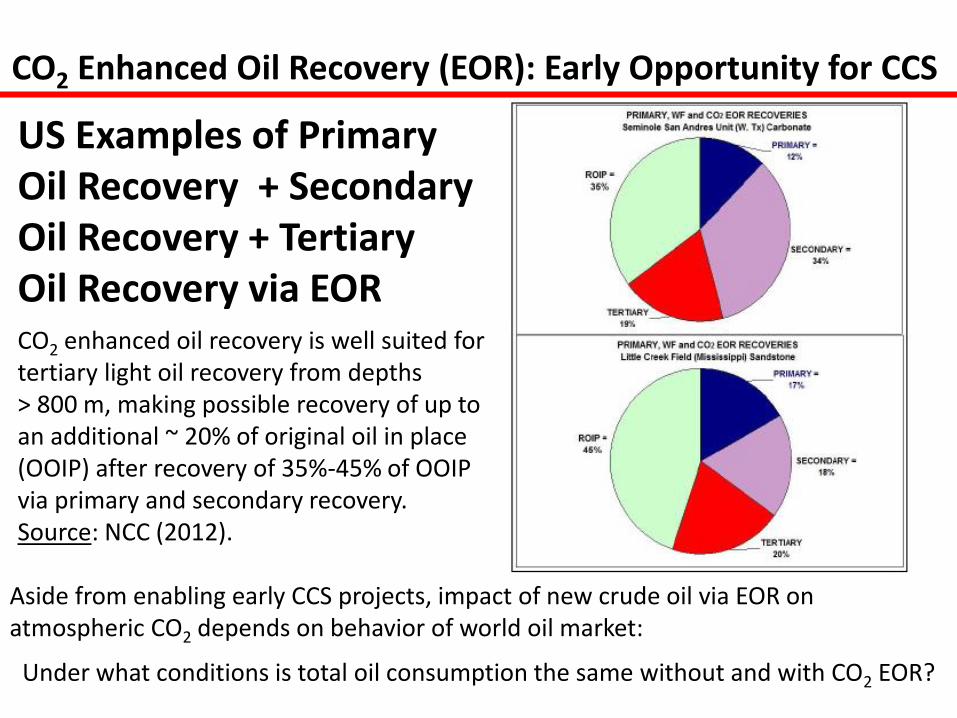
CO2 enhanced oil recovery is well suited for tertiary light oil recovery from depths > 800 m, making possible recovery of up to an additional ~ 20% of original oil in place (OOIP) after recovery of 35%-45% of OOIP via primary and secondary recovery. Source: NCC (2012).
US Examples of Primary Oil Recovery + Secondary Oil Recovery + Tertiary Oil Recovery via EOR
CO2 Enhanced Oil Recovery (EOR): Early Opportunity for CCS
Aside from enabling early CCS projects, impact of new crude oil via EOR on atmospheric CO2 depends on behavior of world oil market:
Under what conditions is total oil consumption the same without and with CO2 EOR?
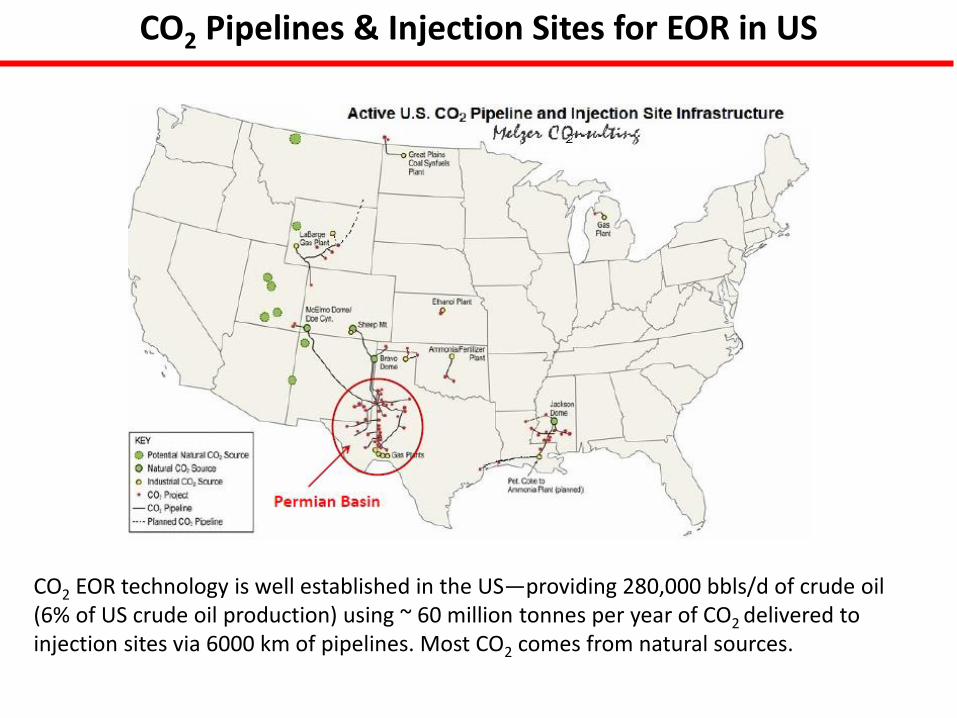
CO2 Pipelines & Injection Sites for EOR in US
CO2 EOR technology is well established in the US—providing 280,000 bbls/d of crude oil (6% of US crude oil production) using ~ 60 million tonnes per year of CO2 delivered to injection sites via 6000 km of pipelines. Most CO2 comes from natural sources.
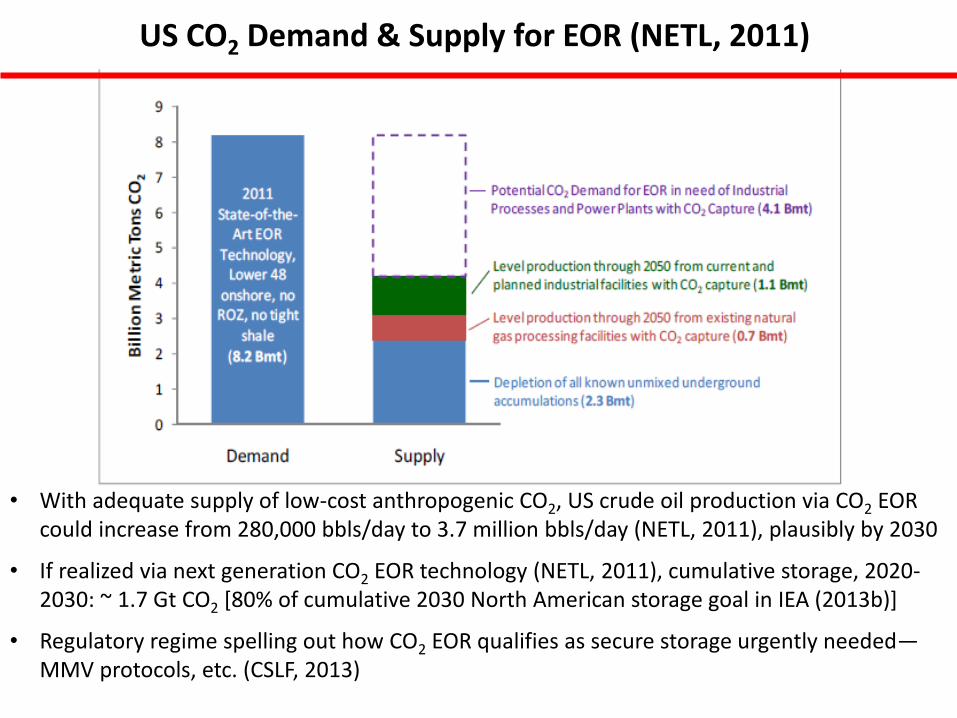
US CO2 Demand & Supply for EOR (NETL, 2011)
• With adequate supply of low-cost anthropogenic CO2, US crude oil production via CO2 EOR could increase from 280,000 bbls/day to 3.7 million bbls/day (NETL, 2011), plausibly by 2030
• If realized via next generation CO2 EOR technology (NETL, 2011), cumulative storage, 2020- 2030: ~ 1.7 Gt CO2 [80% of cumulative 2030 North American storage goal in IEA (2013b)]
• Regulatory regime spelling out how CO2 EOR qualifies as secure storage urgently needed—MMV protocols, etc. (CSLF, 2013)
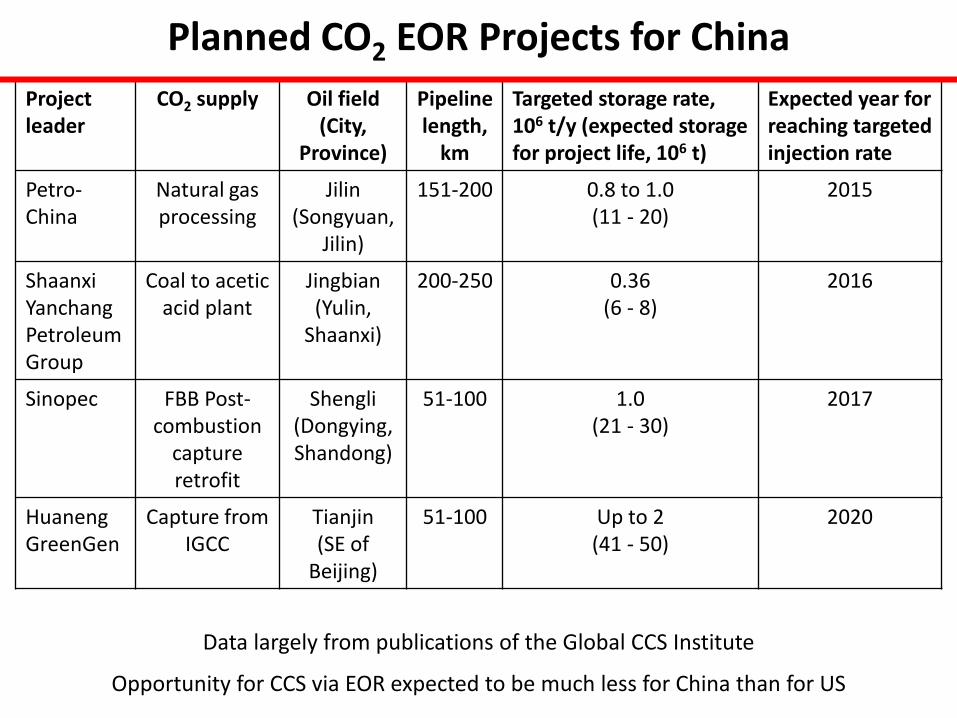
Planned CO2 EOR Projects for China
Project leader
CO2 supply Oil field (City,
Province)
Pipeline length,
km
Targeted storage rate, 106 t/y (expected storage for project life, 106 t)
Expected year for reaching targeted injection rate
Petro-China
Natural gas processing
Jilin (Songyuan,
Jilin)
151-200 0.8 to 1.0 (11 - 20)
2015
Shaanxi Yanchang Petroleum Group
Coal to acetic acid plant
Jingbian (Yulin,
Shaanxi)
200-250 0.36 (6 - 8)
2016
Sinopec FBB Post-combustion
capture retrofit
Shengli (Dongying, Shandong)
51-100 1.0 (21 - 30)
2017
Huaneng GreenGen
Capture from IGCC
Tianjin (SE of
Beijing)
51-100 Up to 2 (41 - 50)
2020
Data largely from publications of the Global CCS Institute
Opportunity for CCS via EOR expected to be much less for China than for US
GHGI—a “Carbon Footprint” Metric
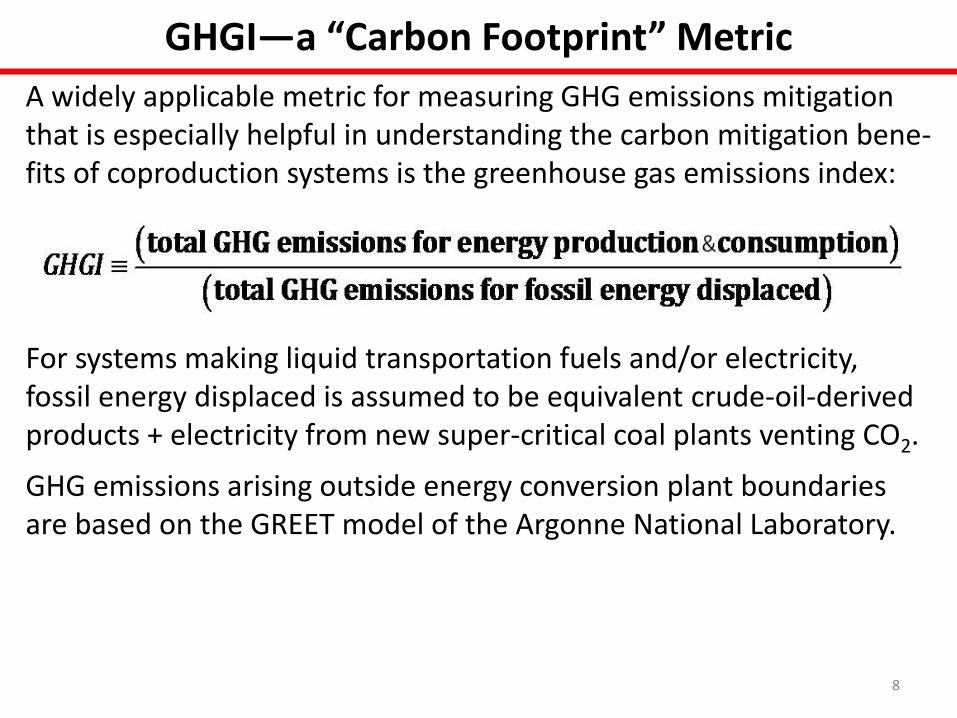
A widely applicable metric for measuring GHG emissions mitigation that is especially helpful in understanding the carbon mitigation bene-fits of coproduction systems is the greenhouse gas emissions index:
For systems making liquid transportation fuels and/or electricity, fossil energy displaced is assumed to be equivalent crude-oil-derived products + electricity from new super-critical coal plants venting CO2.
GHG emissions arising outside energy conversion plant boundaries are based on the GREET model of the Argonne National Laboratory.
8
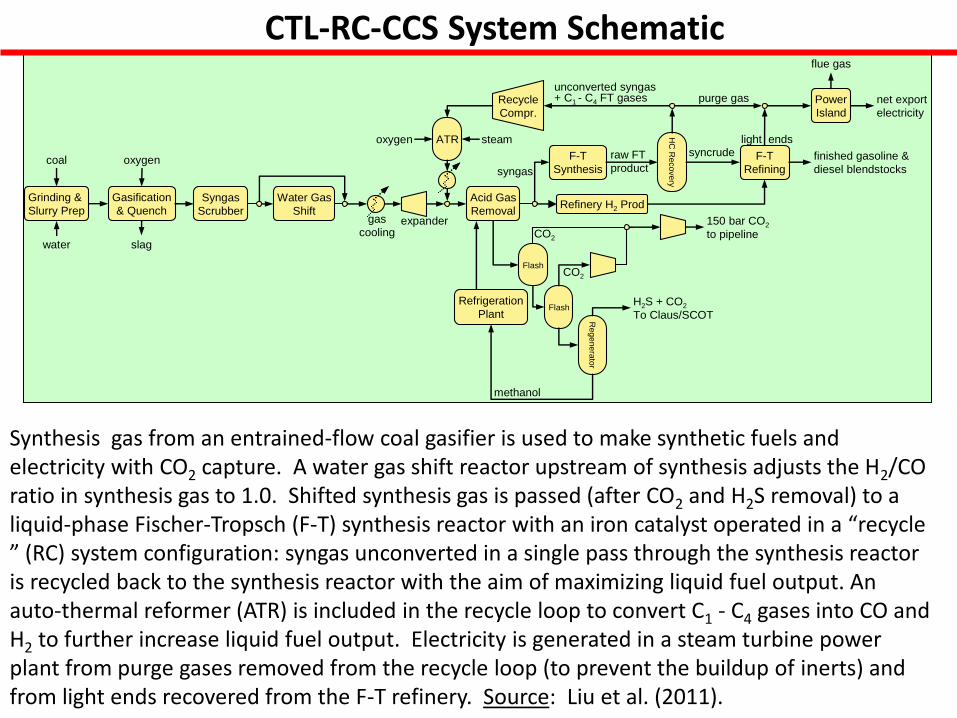
Synthesis gas from an entrained-flow coal gasifier is used to make synthetic fuels and electricity with CO2 capture. A water gas shift reactor upstream of synthesis adjusts the H2/CO ratio in synthesis gas to 1.0. Shifted synthesis gas is passed (after CO2 and H2S removal) to a liquid-phase Fischer-Tropsch (F-T) synthesis reactor with an iron catalyst operated in a “recycle ” (RC) system configuration: syngas unconverted in a single pass through the synthesis reactor is recycled back to the synthesis reactor with the aim of maximizing liquid fuel output. An auto-thermal reformer (ATR) is included in the recycle loop to convert C1 - C4 gases into CO and H2 to further increase liquid fuel output. Electricity is generated in a steam turbine power plant from purge gases removed from the recycle loop (to prevent the buildup of inerts) and from light ends recovered from the F-T refinery. Source: Liu et al. (2011).
Gasification
& Quench
Grinding &
Slurry Prep
oxygen
water
coal
Syngas
Scrubber
Acid Gas
Removal
F-T
Refining
F-T
Synthesis
CO2
FlashRefrigeration
Plant
slag
Flash
methanol
CO2
syngas
Water Gas
Shift150 bar CO2
to pipeline
Re
ge
ne
rato
r
H2S + CO2
To Claus/SCOT
HC
Re
co
ve
ry
Recycle
Compr.
finished gasoline &
diesel blendstocks
unconverted syngas+ C1 - C4 FT gases
raw FT
product
Refinery H2 Prod
syncrudelight ends
purge gas Power
Island
net export
electricity
gas
coolingexpander
ATRoxygen steam
flue gas
CTL-RC-CCS System Schematic
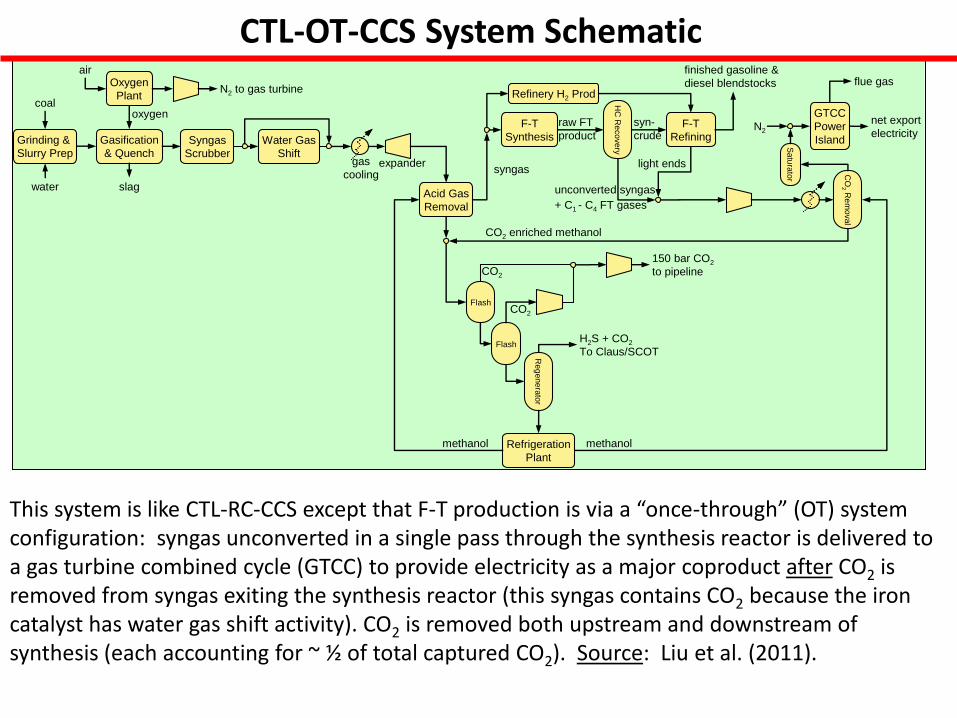
This system is like CTL-RC-CCS except that F-T production is via a “once-through” (OT) system configuration: syngas unconverted in a single pass through the synthesis reactor is delivered to a gas turbine combined cycle (GTCC) to provide electricity as a major coproduct after CO2 is removed from syngas exiting the synthesis reactor (this syngas contains CO2 because the iron catalyst has water gas shift activity). CO2 is removed both upstream and downstream of synthesis (each accounting for ~ ½ of total captured CO2). Source: Liu et al. (2011).
Gasification
& Quench
Grinding &
Slurry Prep
oxygen
water
coal
Syngas
Scrubber
Acid Gas
Removal
F-T
Refining
F-T
Synthesis
CO2
Flash
slag
Flash
CO2
syngas
Water Gas
Shift
150 bar CO2
to pipeline
Re
ge
ne
rato
r
H2S + CO2
To Claus/SCOTH
C R
eco
ve
ry
finished gasoline &
diesel blendstocks
unconverted syngas
+ C1 - C4 FT gases
raw FT
product
Refinery H2 Prod
syn-
crude
light ends
GTCC
Power
Island
net export
electricity
gas
coolingexpander
CO
2R
em
ova
l
CO2 enriched methanol
flue gas
methanolmethanol Refrigeration
Plant
Sa
tura
tor
Oxygen
PlantN2 to gas turbine
N2
air
CTL-OT-CCS System Schematic
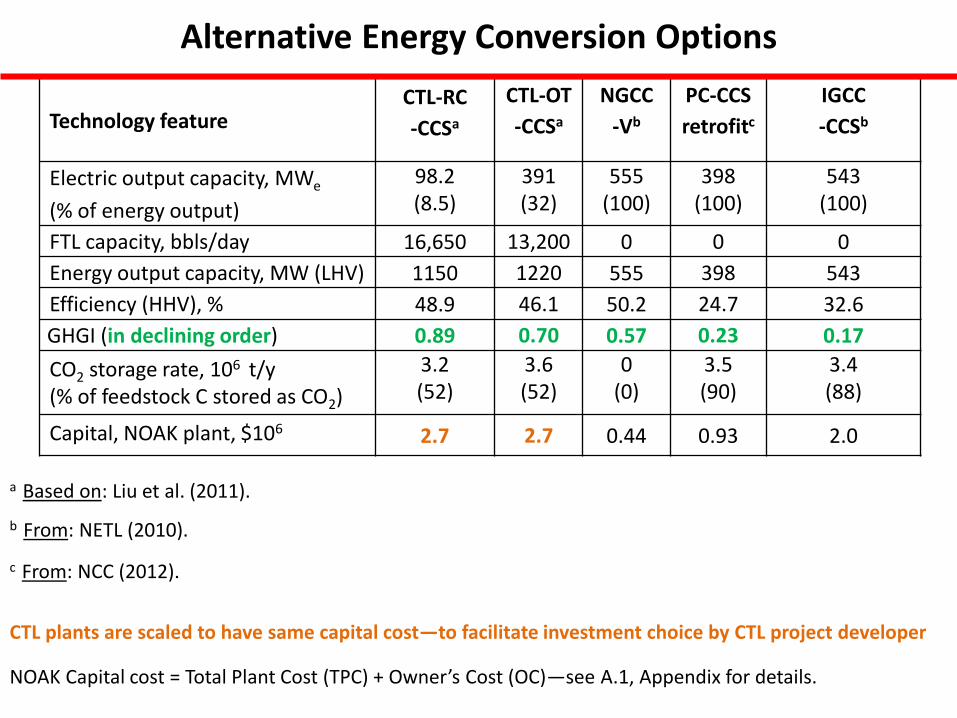
Alternative Energy Conversion Options
Technology feature options CTL-RC
-CCSa
CTL-OT
-CCSa
NGCC
-Vb
PC-CCS
retrofitc
IGCC
-CCSb
Electric output capacity, MWe
(% of energy output)
98.2 (8.5)
391 (32)
555 (100)
398 (100)
543 (100)
FTL capacity, bbls/day 16,650 13,200 0 0 0
Energy output capacity, MW (LHV) 1150 1220 555 398 543
Efficiency (HHV), % 48.9 46.1 50.2 24.7 32.6
GHGI (in declining order) 0.89 0.70 0.57 0.23 0.17
CO2 storage rate, 106 t/y (% of feedstock C stored as CO2)
3.2 (52)
3.6 (52)
0 (0)
3.5 (90)
3.4 (88)
Capital, NOAK plant, $106 2.7 2.7 0.44 0.93 2.0
a Based on: Liu et al. (2011).
b From: NETL (2010).
c From: NCC (2012).
CTL plants are scaled to have same capital cost—to facilitate investment choice by CTL project developer
NOAK Capital cost = Total Plant Cost (TPC) + Owner’s Cost (OC)—see A.1, Appendix for details.
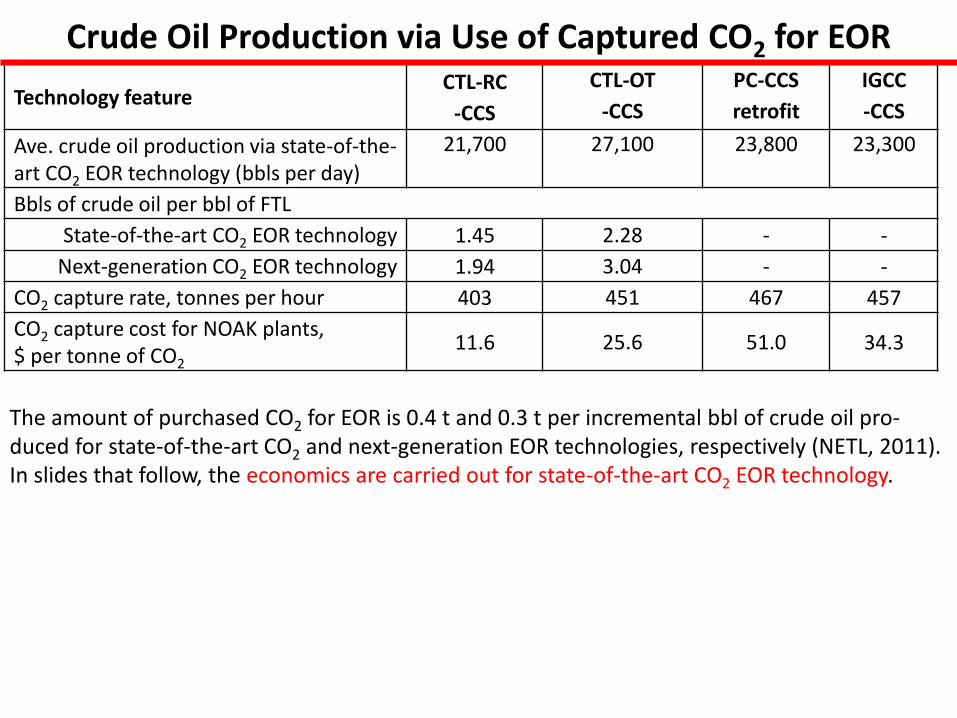
Crude Oil Production via Use of Captured CO2 for EOR
Technology feature options CTL-RC
-CCS
CTL-OT
-CCS
PC-CCS
retrofit
IGCC
-CCS
Ave. crude oil production via state-of-the- art CO2 EOR technology (bbls per day)
21,700 27,100 23,800
23,300
Bbls of crude oil per bbl of FTL
State-of-the-art CO2 EOR technology 1.45 2.28 - -
Next-generation CO2 EOR technology 1.94 3.04 - -
CO2 capture rate, tonnes per hour 403 451 467 457
CO2 capture cost for NOAK plants, $ per tonne of CO2
11.6 25.6 51.0 34.3
The amount of purchased CO2 for EOR is 0.4 t and 0.3 t per incremental bbl of crude oil pro-duced for state-of-the-art CO2 and next-generation EOR technologies, respectively (NETL, 2011). In slides that follow, the economics are carried out for state-of-the-art CO2 EOR technology.
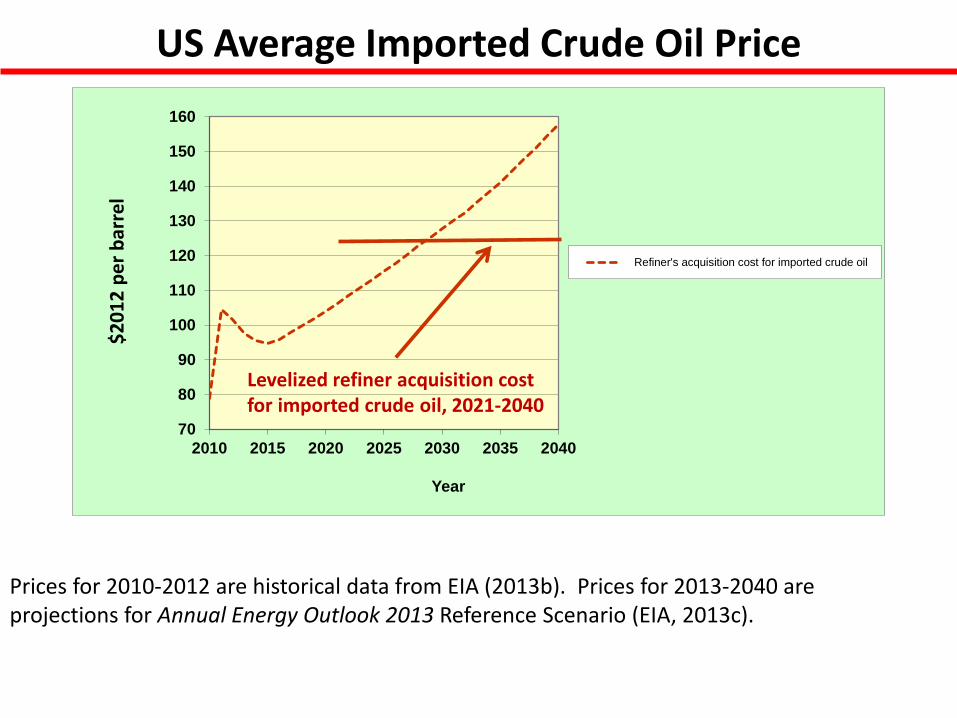
US Average Imported Crude Oil Price
70
80
90
100
110
120
130
140
150
160
2010 2015 2020 2025 2030 2035 2040
Year
Refiner's acquisition cost for imported crude oil
Levelized refiner acquisition cost for imported crude oil, 2021-2040
$2
01
2 p
er
bar
rel
Prices for 2010-2012 are historical data from EIA (2013b). Prices for 2013-2040 are projections for Annual Energy Outlook 2013 Reference Scenario (EIA, 2013c).
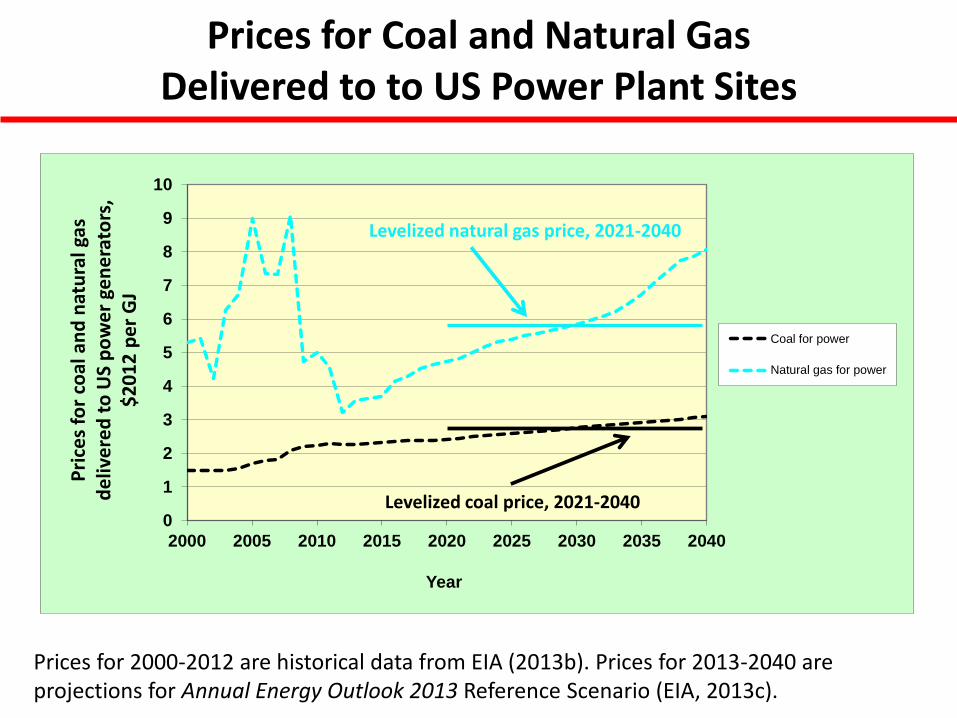
Prices for Coal and Natural Gas
Delivered to to US Power Plant Sites
Prices for 2000-2012 are historical data from EIA (2013b). Prices for 2013-2040 are projections for Annual Energy Outlook 2013 Reference Scenario (EIA, 2013c).
0
1
2
3
4
5
6
7
8
9
10
2000 2005 2010 2015 2020 2025 2030 2035 2040
Year
Coal for power
Natural gas for power
Levelized natural gas price, 2021-2040
Pri
ces
for
coal
an
d n
atu
ral g
as
de
live
red
to
US
po
we
r ge
ne
rato
rs,
$2
01
2 p
er
GJ
Levelized coal price, 2021-2040
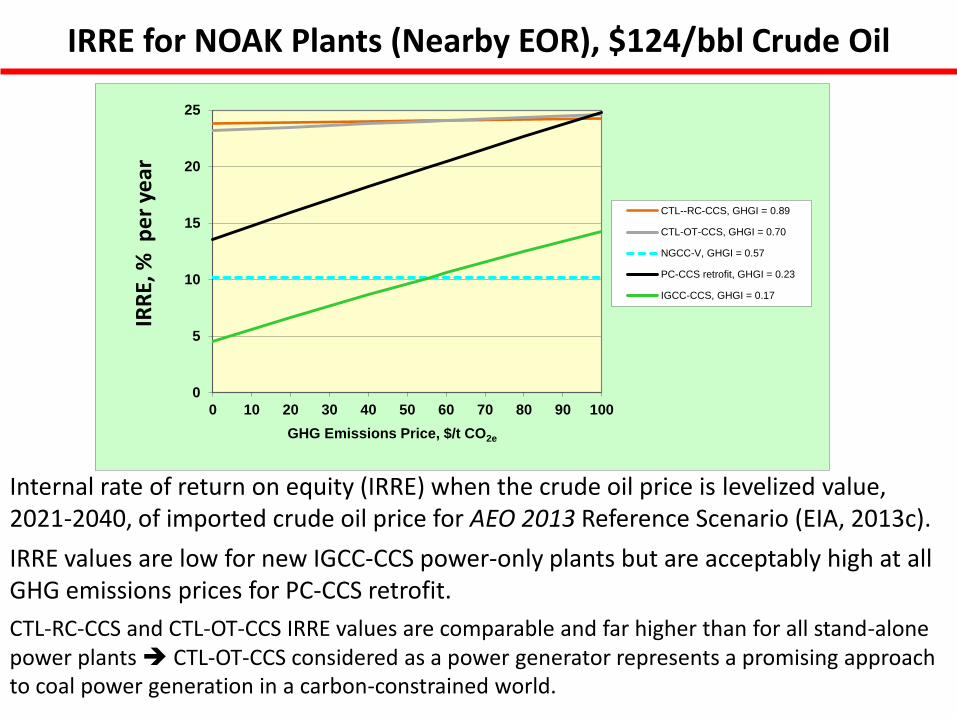
IRRE for NOAK Plants (Nearby EOR), $124/bbl Crude Oil
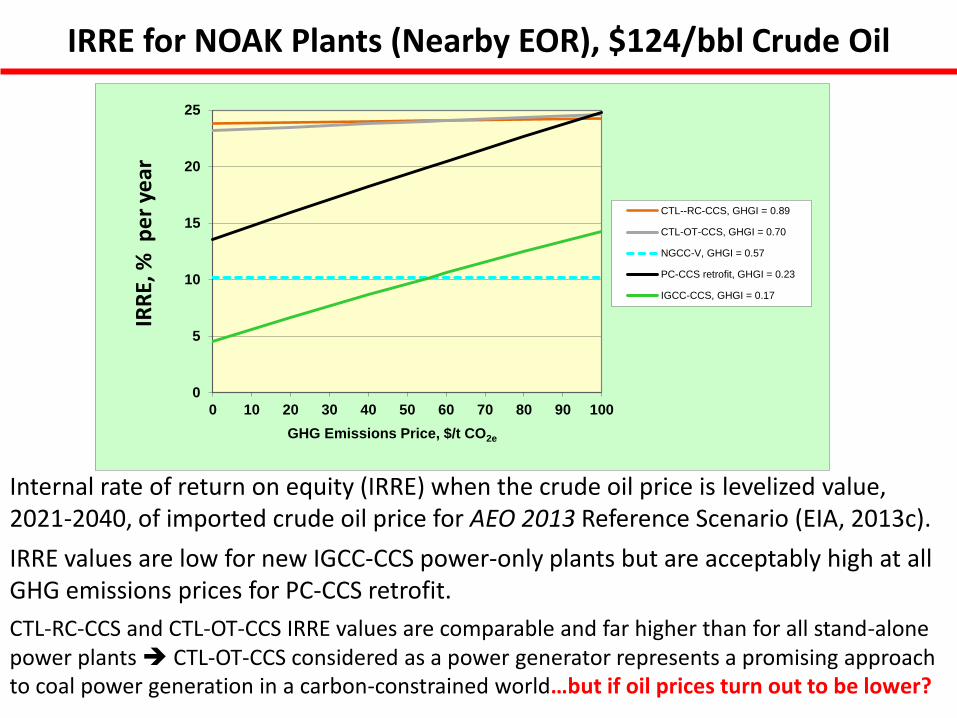
Internal rate of return on equity (IRRE) when the crude oil price is levelized value, 2021-2040, of imported crude oil price for AEO 2013 Reference Scenario (EIA, 2013c).
IRRE values are low for new IGCC-CCS power-only plants but are acceptably high at all GHG emissions prices for PC-CCS retrofit.
CTL-RC-CCS and CTL-OT-CCS IRRE values are comparable and far higher than for all stand-alone power plants CTL-OT-CCS considered as a power generator represents a promising approach to coal power generation in a carbon-constrained world.
0
5
10
15
20
25
0 10 20 30 40 50 60 70 80 90 100
GHG Emissions Price, $/t CO2e
CTL--RC-CCS, GHGI = 0.89
CTL-OT-CCS, GHGI = 0.70
NGCC-V, GHGI = 0.57
PC-CCS retrofit, GHGI = 0.23
IGCC-CCS, GHGI = 0.17
IRR
E, %
pe
r ye
ar
IRRE for NOAK Plants (Nearby EOR), $124/bbl Crude Oil
Internal rate of return on equity (IRRE) when the crude oil price is levelized value, 2021-2040, of imported crude oil price for AEO 2013 Reference Scenario (EIA, 2013c).
IRRE values are low for new IGCC-CCS power-only plants but are acceptably high at all GHG emissions prices for PC-CCS retrofit.
CTL-RC-CCS and CTL-OT-CCS IRRE values are comparable and far higher than for all stand-alone power plants CTL-OT-CCS considered as a power generator represents a promising approach to coal power generation in a carbon-constrained world…but if oil prices turn out to be lower?
0
5
10
15
20
25
0 10 20 30 40 50 60 70 80 90 100
GHG Emissions Price, $/t CO2e
CTL--RC-CCS, GHGI = 0.89
CTL-OT-CCS, GHGI = 0.70
NGCC-V, GHGI = 0.57
PC-CCS retrofit, GHGI = 0.23
IGCC-CCS, GHGI = 0.17
IRR
E, %
pe
r ye
ar
IRRE for NOAK Plants (Nearby EOR), $0/t GHG Emissions Price
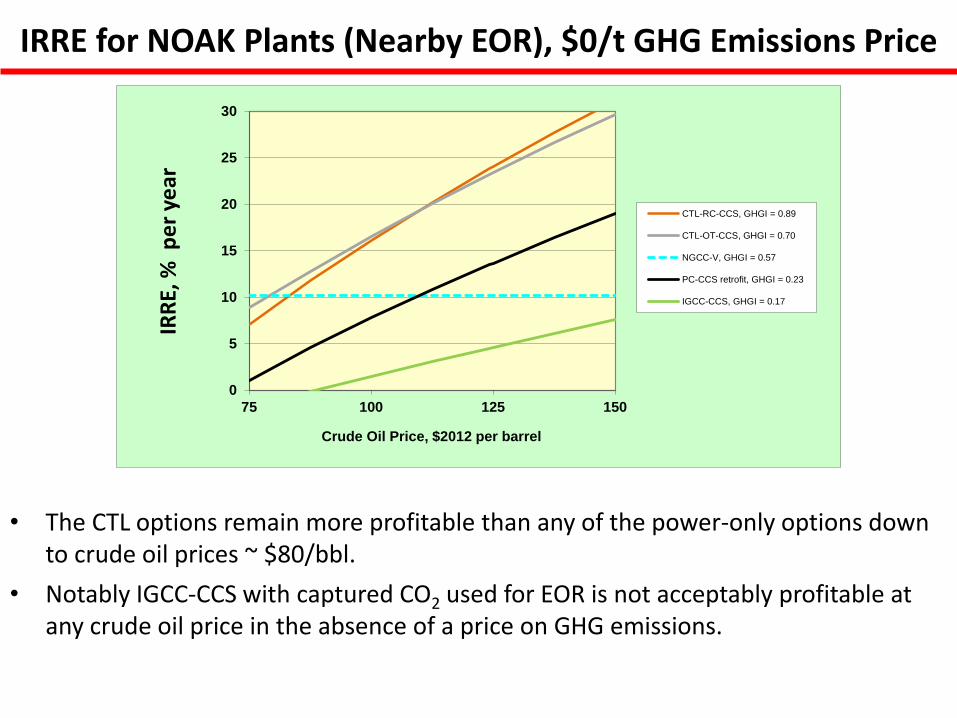
• The CTL options remain more profitable than any of the power-only options down to crude oil prices ~ $80/bbl.
• Notably IGCC-CCS with captured CO2 used for EOR is not acceptably profitable at any crude oil price in the absence of a price on GHG emissions.
0
5
10
15
20
25
30
75 100 125 150
Crude Oil Price, $2012 per barrel
CTL-RC-CCS, GHGI = 0.89
CTL-OT-CCS, GHGI = 0.70
NGCC-V, GHGI = 0.57
PC-CCS retrofit, GHGI = 0.23
IGCC-CCS, GHGI = 0.17
IRR
E, %
pe
r ye
ar
FOAK vs NOAK Plants
• Much lower IRRE values are expected for more costly first-of-a-kind (FOAK) plants [perhaps up to 2X as costly as NOAK plants described above (Williams, 2013a)]
• But early-mover plant costs are expected to decline with experience [learning by doing (LBD)] (Rubin et al., 2004).
• In absence of a substantial price on GHG emissions subsidies probably be needed for early-mover projects to facilitate technology cost buydown (TCB).
• NOAK plant IRRE analysis can be screening analysis for choosing best TCB candidates: – CTL-RC-CCS, CTL-OT-CCS, and PC-CCS retrofit are the more promising candidates
– Because it is about as profitable as CTL-RC-CCS and far more profitable than any other stand-alone power option for crude oil prices > $80/bbl, CTL-OT-CCS (considered as a power plant) stands out as the leading candidate for technology cost buydown
• Williams (2013a) estimates that in the TCB process for CTL-OT-CCS linked to CO2 EOR
and a crude oil price = AEO 2013 levelized (2021-2040) Reference Scenario oil price: – Subsidies for early-mover projects would be large if it is required that the LCOE be as low as for NGCC-V
– Only a few (~ 3) plants would require subsidy before CTL-OT-CCS plants could compete without subsidy
– If subsidies are financed from the new federal corporate income tax revenues/royalties arising from deployment of these systems, new federal revenues net of subsidies would be +tive for the very first plant—at so that needed subsidies would be affordable even for fiscally constrained governments.
Toward Deep Reductions in GHG Emissions • Despite attractive prospective CTL economics, these synfuel systems are characterized
by carbon footprints only modestly less than for conventional energy: (GHGI = 0.89 for CTL-RC-CCS and 0.70 for CTL-OT-CCS)
• Between now and 2050, deep reductions in GHG emissions will be needed to realize the aspirational goal of keeping the global mean temperature increase from pre-industrial levels below 2°C [as all countries agreed to in Cancun (COP 16, December 2010)].
• Deep reductions in GHG emissions are realizable by coprocessing sustainably grown biomass with coal in CBTL systems similar to CTL systems: negative GHG emissions associated with photosynthetic CO2 storage is exploited in CBTL systems to offset positive emissions from coal-derived carbon (Liu et al., 2011; Williams, 2013a, 2013b):
– Coproduction systems coprocessing ~ ¼ biomass (CBTL systems) could be designed to have same carbon footprint (GHGI) as IGCC-CCS; NOAK versions might be highly profitable at the social cost of carbon (Williams, 2013a).
– CCS via CBTL systems is likely to be more profitable than for BTL systems…a result of scale economies and lower average feedstock cost (Williams, 2013b).
– For low-rank coals (lignite or subbitiuminous coal) the coprocessing of > ¼ biomass has been demonstrated for the transport gasifier biomass coprocessing might well go forward first for low-rank coals (Williams, 2013c).
– The # of costly early-mover systems coprocessing ~ ¼ biomass requiring subsidy in CO2 EOR applications in the absence of a price on GHG emissions higher than for CTL-OT-CCS but still modest (~ 6) at same projected crude oil price (Williams, 2013a).
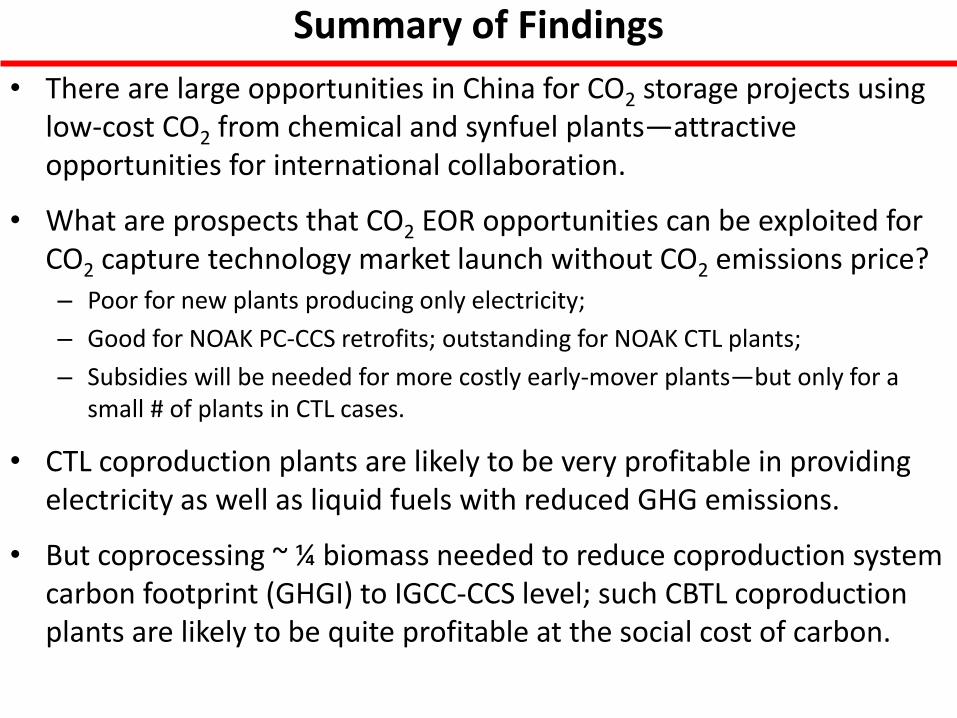
Summary of Findings
• There are large opportunities in China for CO2 storage projects using low-cost CO2 from chemical and synfuel plants—attractive opportunities for international collaboration.
• What are prospects that CO2 EOR opportunities can be exploited for CO2 capture technology market launch without CO2 emissions price? – Poor for new plants producing only electricity;
– Good for NOAK PC-CCS retrofits; outstanding for NOAK CTL plants;
– Subsidies will be needed for more costly early-mover plants—but only for a small # of plants in CTL cases.
• CTL coproduction plants are likely to be very profitable in providing electricity as well as liquid fuels with reduced GHG emissions.
• But coprocessing ~ ¼ biomass needed to reduce coproduction system carbon footprint (GHGI) to IGCC-CCS level; such CBTL coproduction plants are likely to be quite profitable at the social cost of carbon.

Appendix with Supporting Materials
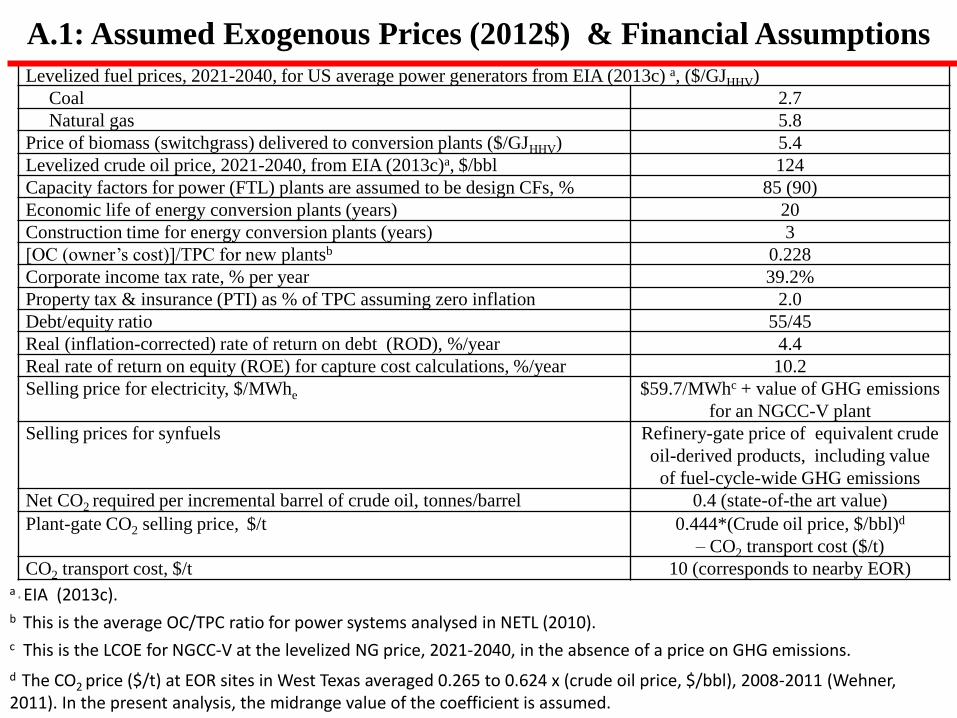
Levelized fuel prices, 2021-2040, for US average power generators from EIA (2013c) a, ($/GJHHV)
Coal 2.7
Natural gas 5.8
Price of biomass (switchgrass) delivered to conversion plants ($/GJHHV) 5.4
Levelized crude oil price, 2021-2040, from EIA (2013c)a, $/bbl 124
Capacity factors for power (FTL) plants are assumed to be design CFs, % 85 (90)
Economic life of energy conversion plants (years) 20
Construction time for energy conversion plants (years) 3
[OC (owner’s cost)]/TPC for new plantsb 0.228
Corporate income tax rate, % per year 39.2%
Property tax & insurance (PTI) as % of TPC assuming zero inflation 2.0
Debt/equity ratio 55/45
Real (inflation-corrected) rate of return on debt (ROD), %/year 4.4
Real rate of return on equity (ROE) for capture cost calculations, %/year 10.2
Selling price for electricity, $/MWhe $59.7/MWhc + value of GHG emissions
for an NGCC-V plant
Selling prices for synfuels Refinery-gate price of equivalent crude
oil-derived products, including value
of fuel-cycle-wide GHG emissions
Net CO2 required per incremental barrel of crude oil, tonnes/barrel 0.4 (state-of-the art value)
Plant-gate CO2 selling price, $/t 0.444*(Crude oil price, $/bbl)d
– CO2 transport cost ($/t)
CO2 transport cost, $/t 10 (corresponds to nearby EOR)
A.1: Assumed Exogenous Prices (2012$) & Financial Assumptions
a a EIA (2013c).
b This is the average OC/TPC ratio for power systems analysed in NETL (2010).
c This is the LCOE for NGCC-V at the levelized NG price, 2021-2040, in the absence of a price on GHG emissions.
d The CO2 price ($/t) at EOR sites in West Texas averaged 0.265 to 0.624 x (crude oil price, $/bbl), 2008-2011 (Wehner, 2011). In the present analysis, the midrange value of the coefficient is assumed.
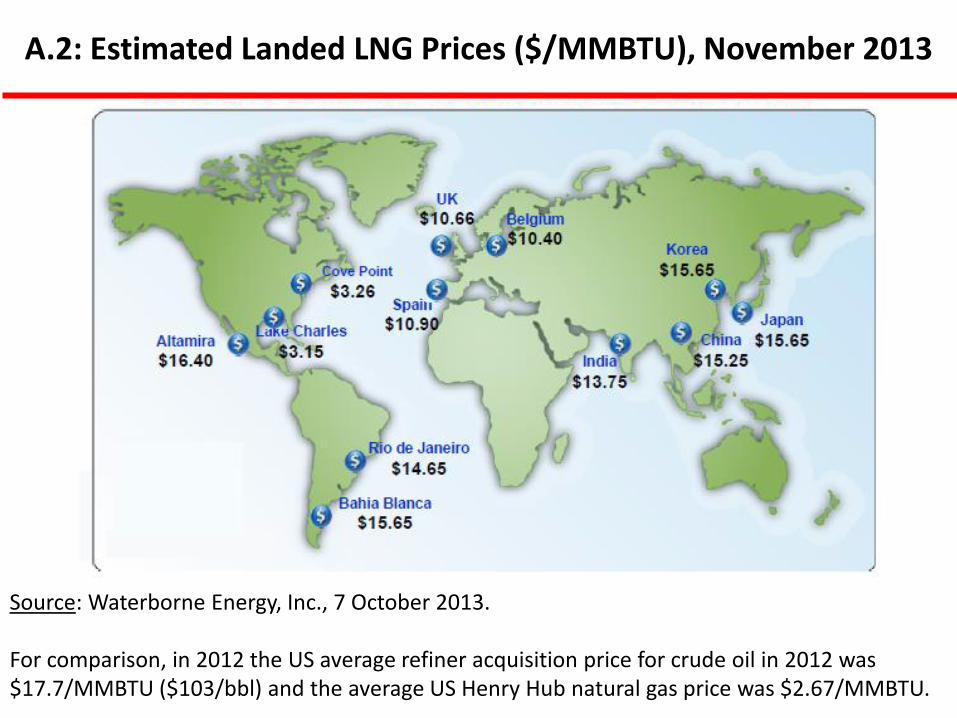
A.2: Estimated Landed LNG Prices ($/MMBTU), November 2013
Source: Waterborne Energy, Inc., 7 October 2013. For comparison, in 2012 the US average refiner acquisition price for crude oil in 2012 was $17.7/MMBTU ($103/bbl) and the average US Henry Hub natural gas price was $2.67/MMBTU.