Embed Size (px)
Citation preview
COAL MARKET IN INDIA 2012
“ Demand - Supply Gap
&
Technical Challenges in
Augmenting Coal Production”
10th July, 2012T K Mukherjee
General Manager (Corporate Planning)
Coal India Limited

STRATEGIC IMPORTANCE OF COAL IN INDIA
Around 85 % of coal consumed is met through indigenous source
CIL produces 81 % of India’s current coal production and meets 70 % of coal demand equivalent to 37 % of India’s commercial energy needs
* Others - 9 %
SCCL - 10 %
CIL - 81 %
Steel - 2 %
** Others - 26 %
Power (U)-72%
Coal Production : Company -wise Share Sector-wise Supply Share from CIL Sources
2
* Others include captive producer ,TATA STEEL, Meghalaya & Other PSUs
** Others include cement, sponge iron, fertilizer. Bricks etc
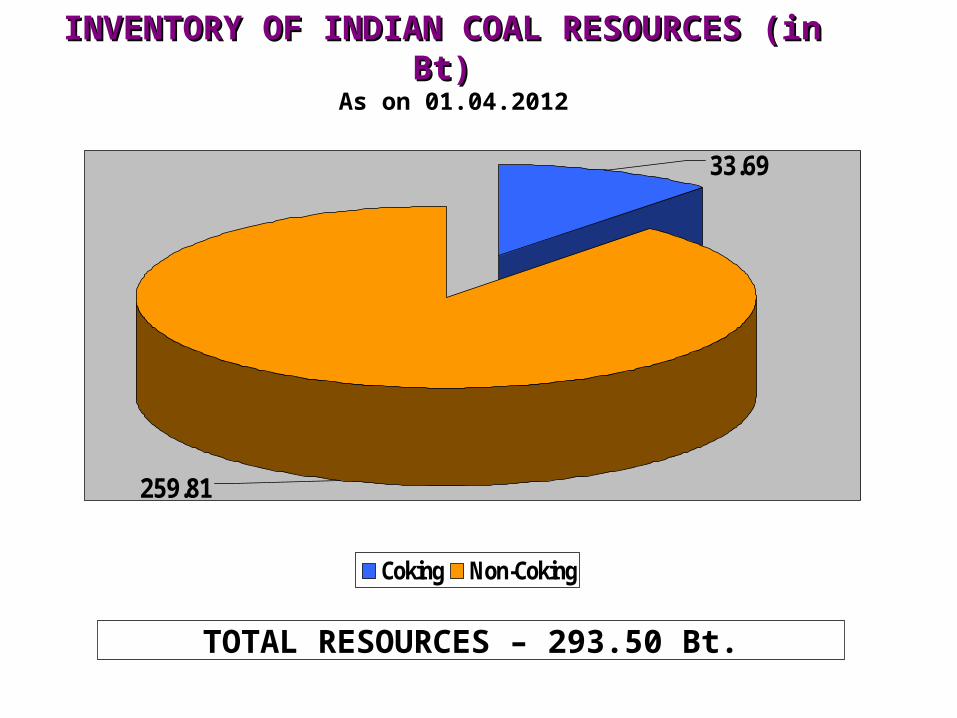
INVENTORY OF INDIAN COAL RESOURCES (in Bt)INVENTORY OF INDIAN COAL RESOURCES (in Bt)
259.81
33.69
Coking Non-Coking
TOTAL RESOURCES – 293.50 Bt.
As on 01.04.2012
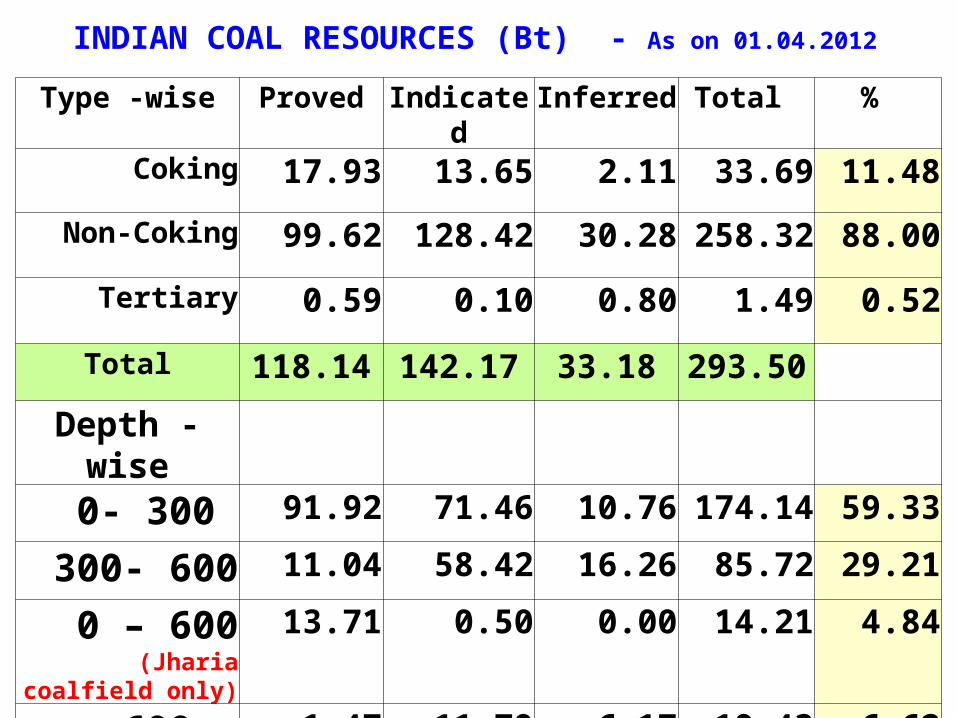
INDIAN COAL RESOURCES (Bt) - As on 01.04.2012
Type -wise Proved Indicated Inferred Total %
Coking 17.93 13.65 2.11 33.69 11.48
Non-Coking 99.62 128.42 30.28 258.32 88.00
Tertiary 0.59 0.10 0.80 1.49 0.52
Total 118.14 142.17 33.18 293.50
Depth -wise0- 300 91.92 71.46 10.76 174.14 59.33
300- 600 11.04 58.42 16.26 85.72 29.21
0 – 600(Jharia coalfield only)
13.71 0.50 0.00 14.21 4.84
600 – 1200 1.47 11.79 6.17 19.43 6.62
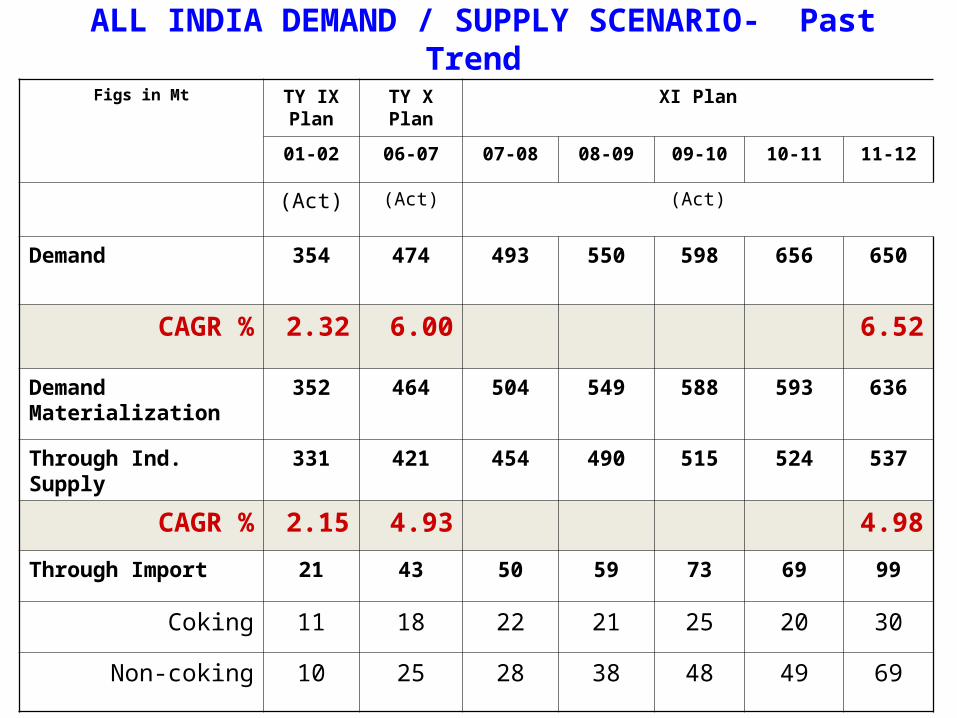
ALL INDIA DEMAND / SUPPLY SCENARIO- Past Trend
Figs in Mt TY IX Plan
TY X Plan
XI Plan
01-02 06-07 07-08 08-09 09-10 10-11 11-12
(Act) (Act) (Act)
Demand 354 474 493 550 598 656 650
CAGR % 2.32 6.00 6.52
Demand Materialization
352 464 504 549 588 593 636
Through Ind. Supply
331 421 454 490 515 524 537
CAGR % 2.15 4.93 4.98
Through Import 21 43 50 59 73 69 99
Coking 11 18 22 21 25 20 30
Non-coking 10 25 28 38 48 49 69
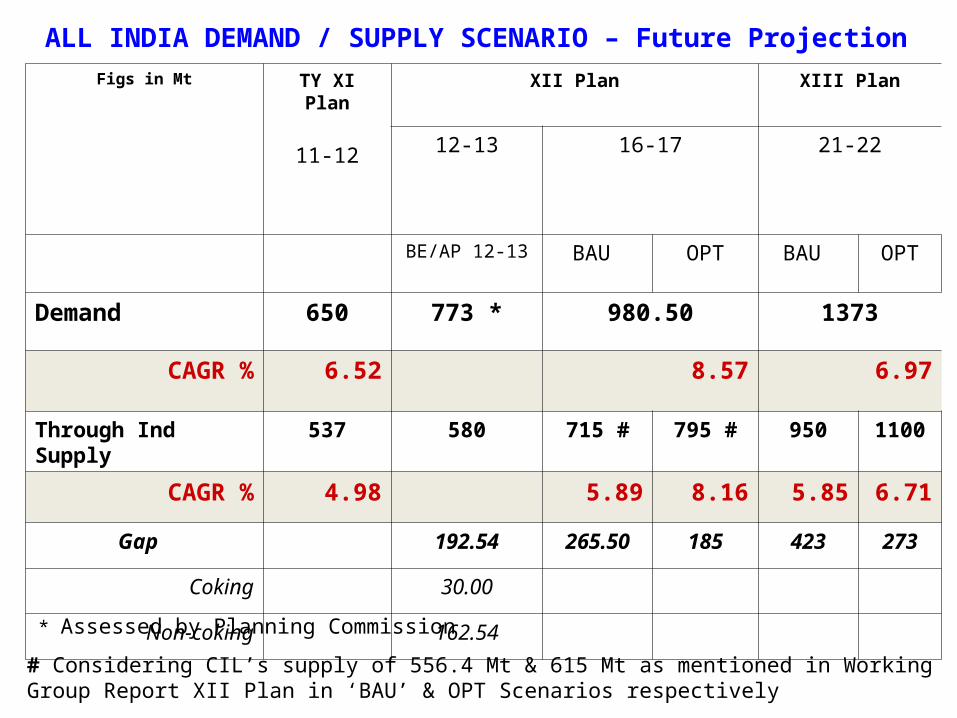
ALL INDIA DEMAND / SUPPLY SCENARIO – Future Projection Figs in Mt TY XI Plan
11-12
XII Plan XIII Plan
12-13 16-17 21-22
BE/AP 12-13 BAU OPT BAU OPT
Demand 650 773 * 980.50 1373
CAGR % 6.52 8.57 6.97
Through Ind Supply
537 580 715 # 795 # 950 1100
CAGR % 4.98 5.89 8.16 5.85 6.71
Gap 192.54 265.50 185 423 273
Coking 30.00
Non-coking 162.54
* Assessed by Planning Commission
# Considering CIL’s supply of 556.4 Mt & 615 Mt as mentioned in Working Group Report XII Plan in ‘BAU’ & OPT Scenarios respectively

Year-wise/Sector-wise Coal Consumption/Demand - Mt
Sector TY X Plan
XI Plan XII Plan
06-07 07-08 08-09 09-10 10-11 11-12 (Prov)
12-13 16-17
(Actual) TGT/AP12-13
PROJ
Steel 35.17 39.00 37.66 41.14 36.81 42.08 52.30 67.20
Power (U)
307.92 332.40 362.08 378.30 390.09
399.09 512.00 682.08
CAGR % 4.32 5.32 11.31
Others 120.78 132.89 149.28 167.77 166.10 194.45 208.54 231.22
Total 463.87 504.29 549.02 587.81 593.00
635.62 772.84 980.50
CAGR % 5.70 6.50 9.06

Drivers of future coal demand
Sufficient upside in demand available,
Per capita annual electricity consumption in FY08 was approx 704 kwh compared to USA (13066 kWh), UK (6231 kWh), China (1379 kWh), Brazil (1934 kWh)
High Unmet Demand
During summer, the power supply deficit is about 11-12 %
Electricity for All - As per the National Minimum Common Program, the government intends to provide access to electricity to all households. Rajiv Gandhi Grameen Vidyutikaran Yojana (RGGVY), is designed to provide access to all households and actually electrify only BPL households
Coal being the most abundant fuel source in India, the coal based power generation will remain strong in India
~ Coal based capacity addition is growing at a faster pace than the general power industry and as such the demand for coal is expected to remain strong
Coal based Generation Capacity Addition Scenario IX Plan (1997- 02) ~ 8000 MW X Plan (2002- 07) ~ 8500 MW XI Plan (2007-12) ~ 41660 MW XII Plan (2012-17) Projection: Proposed Capacity Addition Programme around 70, 000 MW
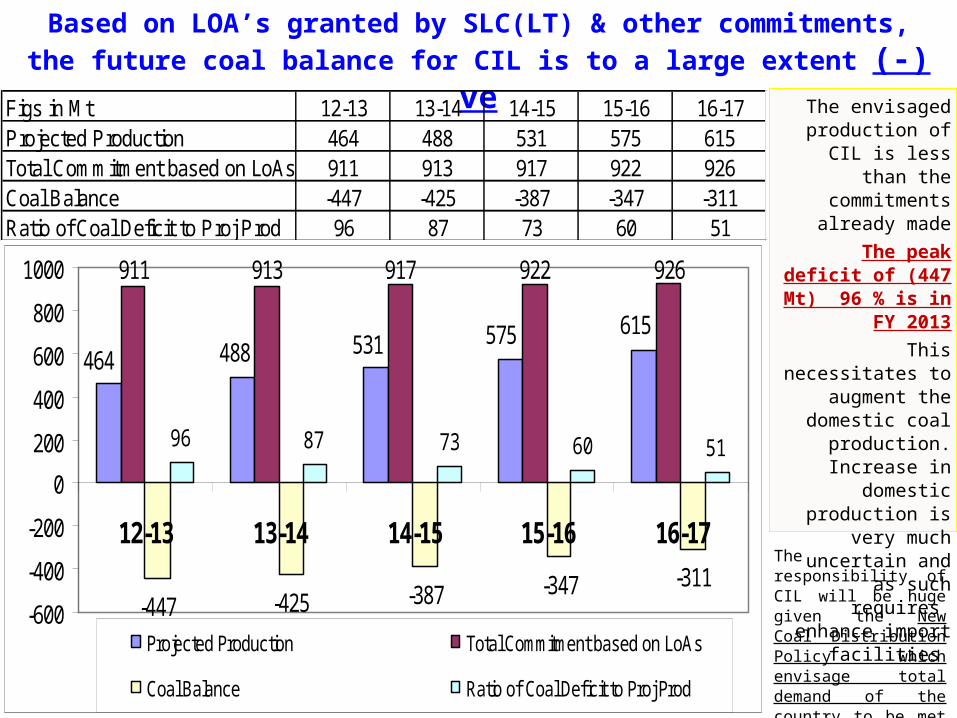
Based on LOA’s granted by SLC(LT) & other commitments, the future
coal balance for CIL is to a large extent (-) veThe envisaged
production of CIL is less than the commitments already made
The peak deficit of (447 Mt) 96 % is in
FY 2013
This necessitates to augment the
domestic coal production. Increase
in domestic production is very
much uncertain and as such requires
enhance import facilities
911 913 917 922 926
-447 -425 -387 -347 -311
96 87 73 60 51
615575531488464
-600
-400
-200
0
200
400
600
800
1000
12-13 13-14 14-15 15-16 16-17
Projected Production Total Commitment based on LoAs
Coal Balance Ratio of Coal Deficit to Proj Prod
Figs in Mt 12-13 13-14 14-15 15-16 16-17Projected Production 464 488 531 575 615Total Commitment based on LoAs 911 913 917 922 926Coal Balance -447 -425 -387 -347 -311Ratio of Coal Deficit to Proj Prod 96 87 73 60 51
The responsibility of CIL will be huge given the New Coal Distribution Policy which envisage total demand of the country to be met by CIL including coal imports, if required.

Source-wise Production (Mt) – Past Trend & Programme for 12-13 & XII Plan (Mt)
TY of VIII Plan
(96-97
TY of IX Plan
(01-02)
TY of X Plan
(06-07)
TY XI Plan
(11-12)
XII Plan
(12-13)
XII Plan
(16-17)
(BAU)
XII Plan
(16-17)
(OPT)
Production Actual TGT PROJ
CIL 250.62 279.65 360.91 435.84 464.10 556.40 615.00 #
CAGR % 4.19 2.22 5.23 3.84 ( 6.48)* 5.00 7.13
Non-CIL 38.70 48.14 69.92 103.95 110.30 180.00
All India 289.32 327.79 430.83 539.79 574.40 715.00 795.00
CAGR % 4.44 2.53 5.62 4.61 (6.42)* 5.78 8.05
10
* Growth% over previous year# The production in Optimistic Scenario is available only if the requisite clearances are processed in fast-tracked route and delivered within the specified time schedule. The issues affecting land acquisition, R & R, law & order and evacuation infrastructure in particular will also have to be addressed in a time bound manner

Production vs Off-take vs Stock Scenario in CIL
0
10
20
30
40
50
60
70
80
200
250
300
350
400
450
FY03 FY04 FY05 FY06 FY07 FY08 FY09 FY 10 FY11
ProductionOff-take
Stock position
Coal inventory levels have
grown as coal production has
increased.
It has not been possible to push
coal to customers & off take has lagged
behind coal production due
to non-availability of
scheduled no of rakes.
Evacuation not kept pace with
production leading to build-up of abnormal
coal stock(74 Mt)
(About 53 Mt increase in 8
years
Mt M
t
02-03 03-04 04-05 05-06 06-07 07-08 08-09 09-10 10-11 11-12
290.69 306.36 323.58 343.39 360.91 379.46 403.73 431.26 431.32 435.84
289.23 304.44 321.55 333.67 351.14 375.33 401.44 415.88 424.50 433.08
19.26 21.18 23.21 32.93 42.70 46.83 49.12 64.50 71.32 74.08
X Plan XI Plan
Act
** As on 31st May 2012, Coal stock position is 63.618 Mt
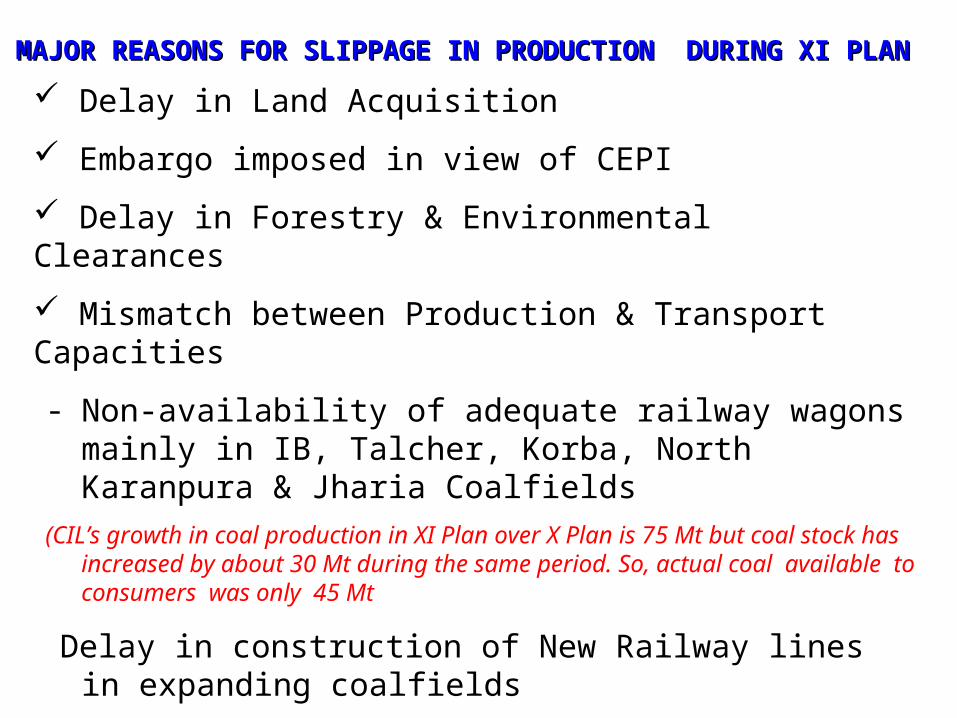
MAJOR REASONS FOR SLIPPAGE IN PRODUCTION DURING XI MAJOR REASONS FOR SLIPPAGE IN PRODUCTION DURING XI PLANPLAN Delay in Land Acquisition
Embargo imposed in view of CEPI
Delay in Forestry & Environmental Clearances
Mismatch between Production & Transport Capacities
- Non-availability of adequate railway wagons mainly in IB, Talcher, Korba, North Karanpura & Jharia Coalfields
(CIL’s growth in coal production in XI Plan over X Plan is 75 Mt but coal stock has increased by about 30 Mt during the same period. So, actual coal available to consumers was only 45 Mt
Delay in construction of New Railway lines in expanding coalfields
Delay in implementation of projects
Law & Order problems in Jharkhand & Orissa
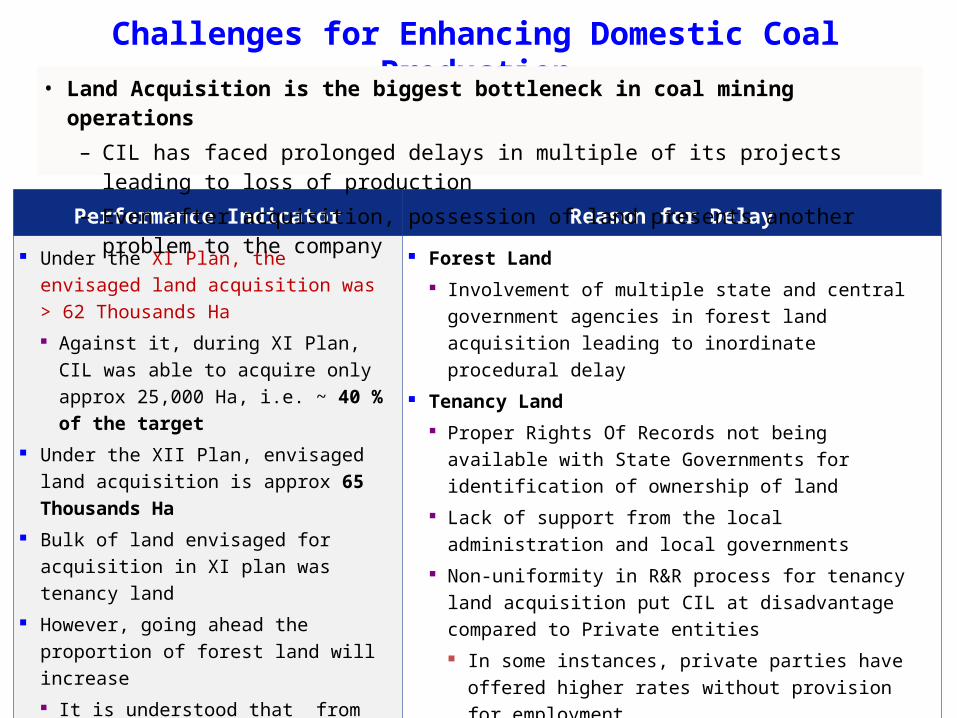
Challenges for Enhancing Domestic Coal Production
Performance Indicator Reason for Delay
Under the XI Plan, the envisaged land acquisition was > 62 Thousands Ha Against it, during XI Plan, CIL was
able to acquire only approx 25,000 Ha, i.e. ~ 40 % of the target
Under the XII Plan, envisaged land acquisition is approx 65 Thousands Ha
Bulk of land envisaged for acquisition in XI plan was tenancy land
However, going ahead the proportion of forest land will increase It is understood that from the
present proportion of 30 %, the forest land will increase to 50 % in the future years
Forest Land Involvement of multiple state and central
government agencies in forest land acquisition leading to inordinate procedural delay
Tenancy Land Proper Rights Of Records not being available with
State Governments for identification of ownership of land
Lack of support from the local administration and local governments
Non-uniformity in R&R process for tenancy land acquisition put CIL at disadvantage compared to Private entities In some instances, private parties have offered
higher rates without provision for employment
• Land Acquisition is the biggest bottleneck in coal mining operations
– CIL has faced prolonged delays in multiple of its projects leading to loss of production
– Even after acquisition, possession of land presents another problem to the company

Evacuation Infrastructure
Performance Indicator Reason for Delay
Average time for Stage I Forestry clearance is about 4 years
Average time for Stage II clearance is about 3 years
Thus the total time for Forestry Clearance is 7 years against the normative time of 2-3 years.
SPCB takes considerable time to issue Consent to Establish and Consent to Operate
Environment Clearance is only given up to a certain capacity (projected peak production) for specific project. Further capacity expansion requires new clearance which again is a prolonged process
In last 8 years coal stock has been increased by approx 53 Mt due to non-availability of, Sufficient railway rakes Matching feeder lines as well
as loading facilities in IB Valley, Korba & N.Karanpura fields
Bulk of future production will come from 5 coal fields of CIL and it is imperative that continuous investment is made in logistics infrastructure
The progress of new railway line projects related to coal evacuation have not achieved the desired progress in the last few years (Tori-Shivpur-Hazaribagh, Angul-Kalinga, Gopalpur-Manoharpur,
Non-availability of sufficient number of railway rakes CCL , MCL & BCCL are particularly
facing the problems in dispatch of coal and increasing coal inventory levels
Forestry/ Environment
Clearance
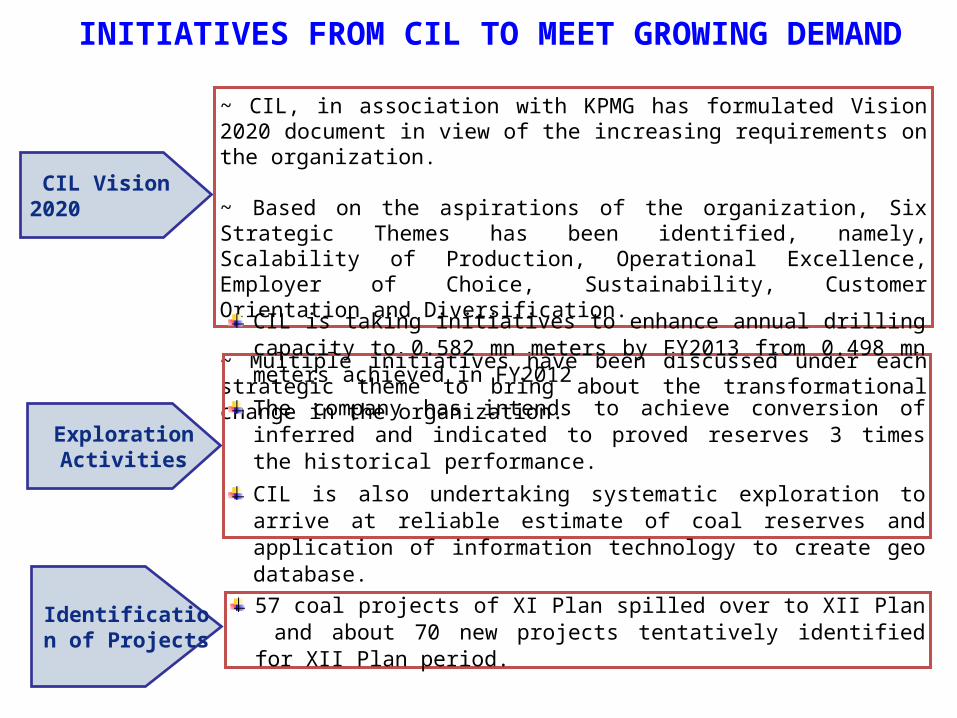
Identification of Projects
57 coal projects of XI Plan spilled over to XII Plan and about 70 new projects tentatively identified for XII Plan period.
CIL Vision 2020
~ CIL, in association with KPMG has formulated Vision 2020 document in view of the increasing requirements on the organization.
~ Based on the aspirations of the organization, Six Strategic Themes has been identified, namely, Scalability of Production, Operational Excellence, Employer of Choice, Sustainability, Customer Orientation and Diversification.
~ Multiple initiatives have been discussed under each strategic theme to bring about the transformational change in the organization.
Exploration Activities
CIL is taking initiatives to enhance annual drilling capacity to 0.582 mn meters by FY2013 from 0.498 mn meters achieved in FY2012
The company has intends to achieve conversion of inferred and indicated to proved reserves 3 times the historical performance.
CIL is also undertaking systematic exploration to arrive at reliable estimate of coal reserves and application of information technology to create geo database.
INITIATIVES FROM CIL TO MEET GROWING DEMAND
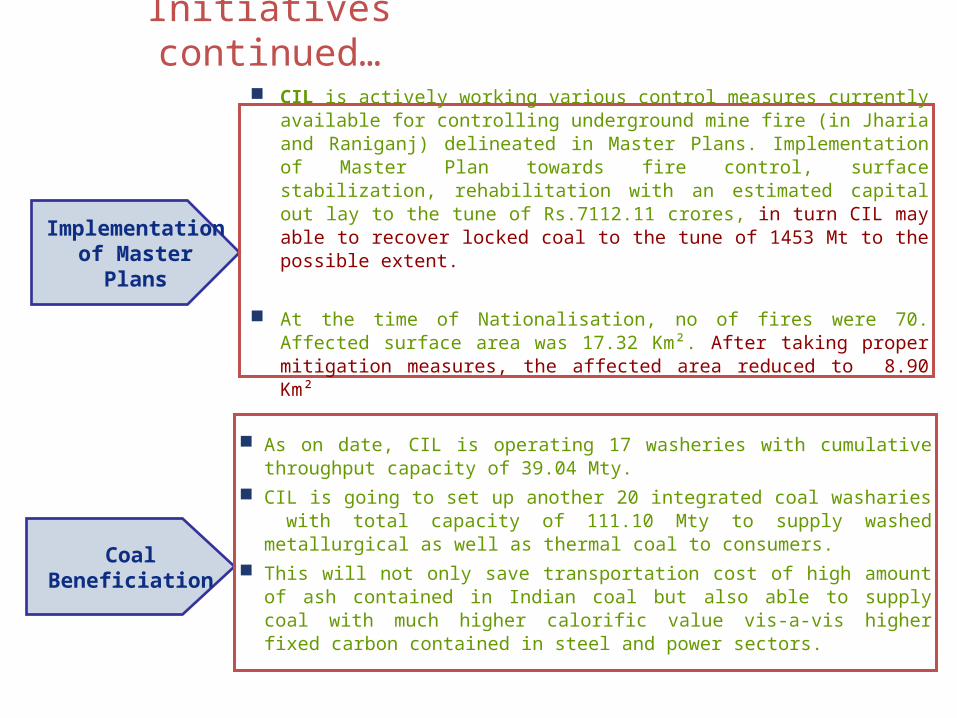
Initiatives continued…
Implementation of Master Plans
CIL is actively working various control measures currently available for controlling underground mine fire (in Jharia and Raniganj) delineated in Master Plans. Implementation of Master Plan towards fire control, surface stabilization, rehabilitation with an estimated capital out lay to the tune of Rs.7112.11 crores, in turn CIL may able to recover locked coal to the tune of 1453 Mt to the possible extent.
At the time of Nationalisation, no of fires were 70. Affected surface area was 17.32 Km². After taking proper mitigation measures, the affected area reduced to 8.90 Km²
Coal Beneficiation
As on date, CIL is operating 17 washeries with cumulative throughput capacity of 39.04 Mty.
CIL is going to set up another 20 integrated coal washaries with total capacity of 111.10 Mty to supply washed metallurgical as well as thermal coal to consumers.
This will not only save transportation cost of high amount of ash contained in Indian coal but also able to supply coal with much higher calorific value vis-a-vis higher fixed carbon contained in steel and power sectors.
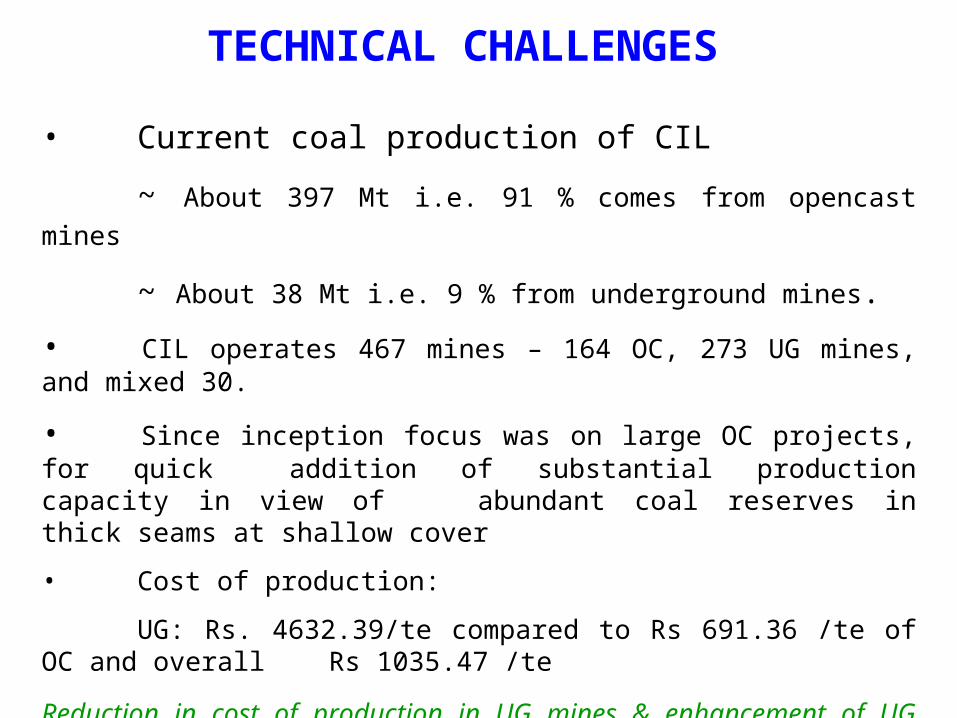
TECHNICAL CHALLENGES
• Current coal production of CIL
~ About 397 Mt i.e. 91 % comes from opencast mines
~ About 38 Mt i.e. 9 % from underground mines.
• CIL operates 467 mines – 164 OC, 273 UG mines, and mixed 30.
• Since inception focus was on large OC projects, for quick addition of substantial production capacity in view of
abundant coal reserves in thick seams at shallow cover
• Cost of production:
UG: Rs. 4632.39/te compared to Rs 691.36 /te of OC and overall Rs 1035.47 /te
Reduction in cost of production in UG mines & enhancement of UG production is a challenge for CIL
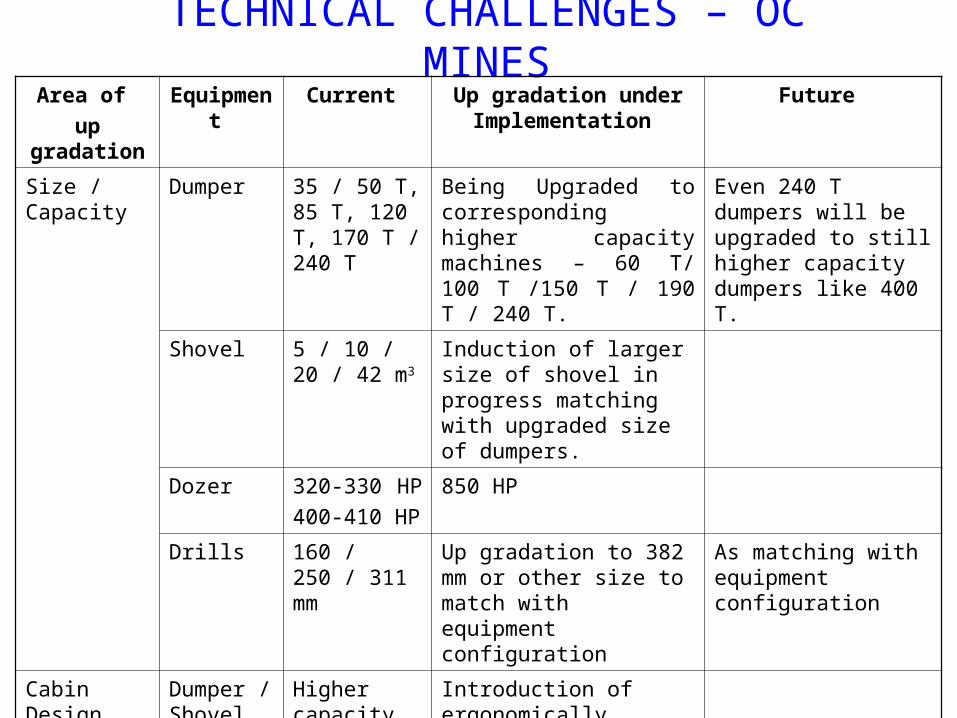
TECHNICAL CHALLENGES – OC MINES
Area of up gradation
Equipment Current Up gradation under Implementation
Future
Size / Capacity
Dumper 35 / 50 T, 85 T, 120 T, 170 T / 240 T
Being Upgraded to corresponding higher capacity machines – 60 T/ 100 T /150 T / 190 T / 240 T.
Even 240 T dumpers will be upgraded to still higher capacity dumpers like 400 T.
Shovel 5 / 10 / 20 / 42 m3
Induction of larger size of shovel in progress matching with upgraded size of dumpers.
Dozer 320-330 HP 400-410 HP
850 HP
Drills 160 / 250 / 311 mm
Up gradation to 382 mm or other size to match with equipment configuration
As matching with equipment configuration
Cabin Design Dumper / Shovel
Higher capacity machines/ equipment are fitted with AC & ergonomic seats.
Introduction of ergonomically designed AC cabins with on screen gadget monitoring systems
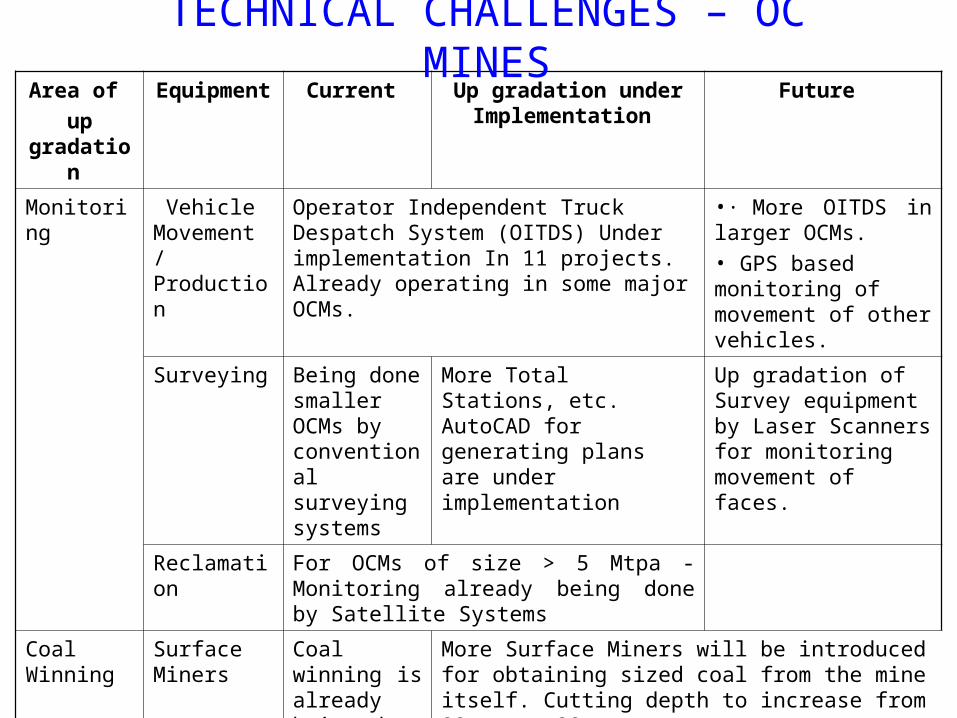
Area of up
gradation
Equipment Current Up gradation under Implementation
Future
Monitoring Vehicle Movement / Production
Operator Independent Truck Despatch System (OITDS) Under implementation In 11 projects. Already operating in some major OCMs.
•· More OITDS in larger OCMs. • GPS based monitoring of movement of other vehicles.
Surveying Being done smaller OCMs by conventional surveying systems
More Total Stations, etc. AutoCAD for generating plans are under implementation
Up gradation of Survey equipment by Laser Scanners for monitoring movement of faces.
Reclamation For OCMs of size > 5 Mtpa - Monitoring already being done by Satellite Systems
Coal Winning
Surface Miners
Coal winning is already being done by SMs in a no. of mines
More Surface Miners will be introduced for obtaining sized coal from the mine itself. Cutting depth to increase from 22 mm to 38 mm
TECHNICAL CHALLENGES – OC MINES
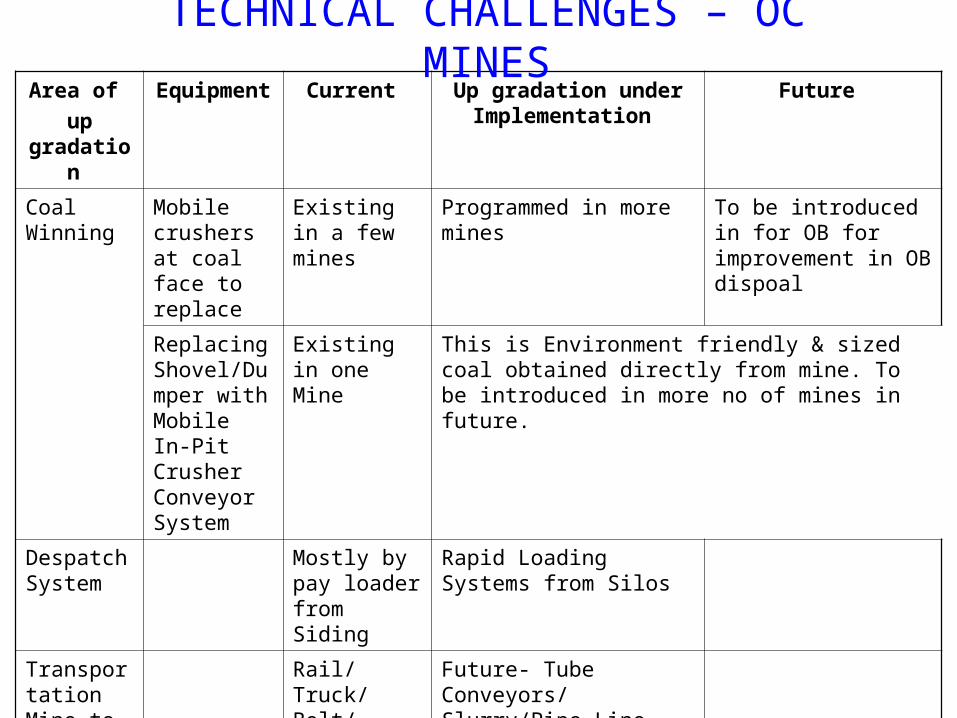
Area of up
gradation
Equipment Current Up gradation under Implementation
Future
Coal Winning
Mobile crushers at coal face to replace
Existing in a few mines
Programmed in more mines To be introduced in for OB for improvement in OB dispoal
Replacing Shovel/Dumper with Mobile In-Pit Crusher Conveyor System
Existing in one Mine
This is Environment friendly & sized coal obtained directly from mine. To be introduced in more no of mines in future.
Despatch System
Mostly by pay loader from Siding
Rapid Loading Systems from Silos
Transportation Mine to End User
Rail/Truck/Belt/Conveyors
Future- Tube Conveyors/ Slurry/Pipe Line Transportation
TECHNICAL CHALLENGES – OC MINES
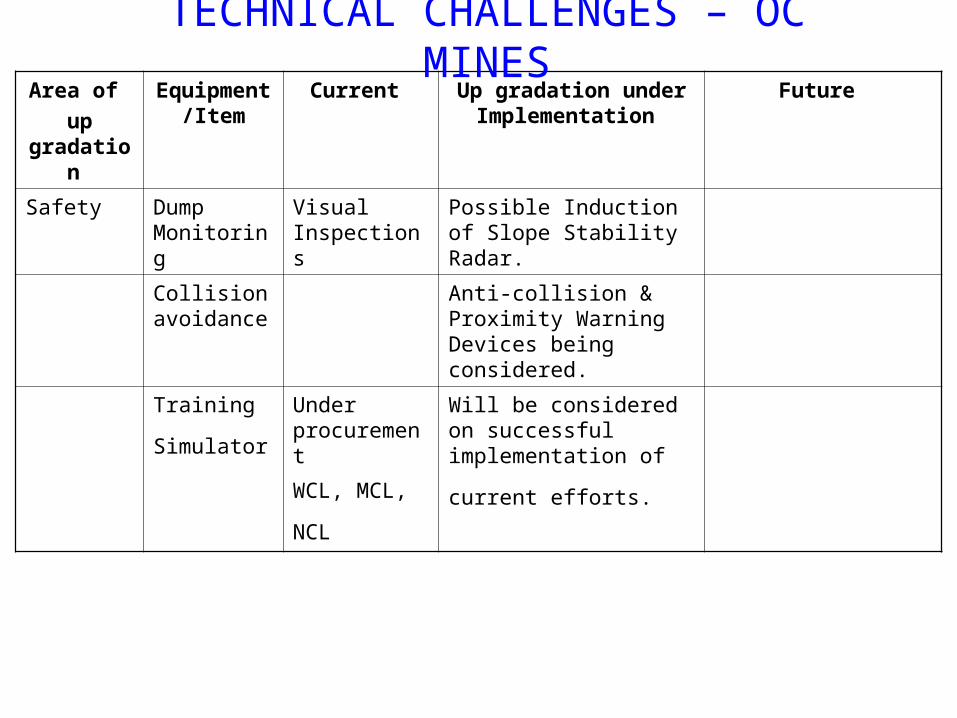
Area of up
gradation
Equipment /Item
Current Up gradation under Implementation
Future
Safety Dump Monitoring
Visual Inspections
Possible Induction of Slope Stability Radar.
Collision avoidance
Anti-collision & Proximity Warning Devices being considered.
Training
Simulator Under procurement
WCL, MCL, NCL
Will be considered on successful implementation
of current efforts.
TECHNICAL CHALLENGES – OC MINES
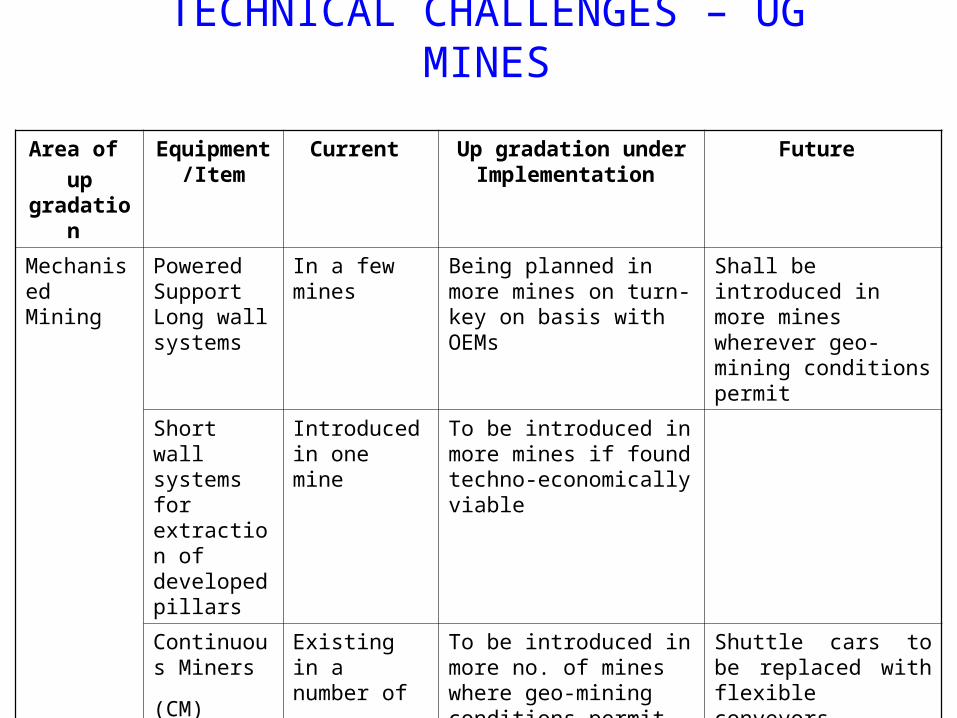
Area of up
gradation
Equipment /Item
Current Up gradation under Implementation
Future
Mechanised Mining
Powered Support Long wall systems
In a few mines Being planned in more mines on turn-key on basis with OEMs
Shall be introduced in more mines wherever geo-mining conditions permit
Short wall systems for extraction of developed pillars
Introduced in one mine
To be introduced in more mines if found techno-economically viable
Continuous
Miners (CM) Existing in a number of
mines
To be introduced in more no. of mines where geo-mining conditions permit
Shuttle cars to be replaced with flexible conveyors. Small size cutting /bolting equipment for thin seams
TECHNICAL CHALLENGES – UG MINES

Area of up
gradation
Equipment /Item
Current Up gradation under Implementation
Future
Mechanised Mining
Shaft Sinking / Drift Drivage
Conventional · Rapid Shaft Sinking Systems.Tunnel Borers for faster drift drivage
Man-Riding Systems
In operation in a number of mines
Under implementation in more mines
To be introduced in more extensive UG mines.
Man & Material Transportation
Multi-Utility Vehicles & Diesel Carts – Will be considered after DGMS approval.
Safety Strata
Monitoring Manually by
experience. Load Cells, Extensometers,
etc. On line Roof Behavior
Monitoring Systems Environmental
Systems Installed in a no. of highly gassy fiery mines
Gas chromatography for enhanced accuracy.
Tube Bundle technology
TECHNICAL CHALLENGES – UG MINES
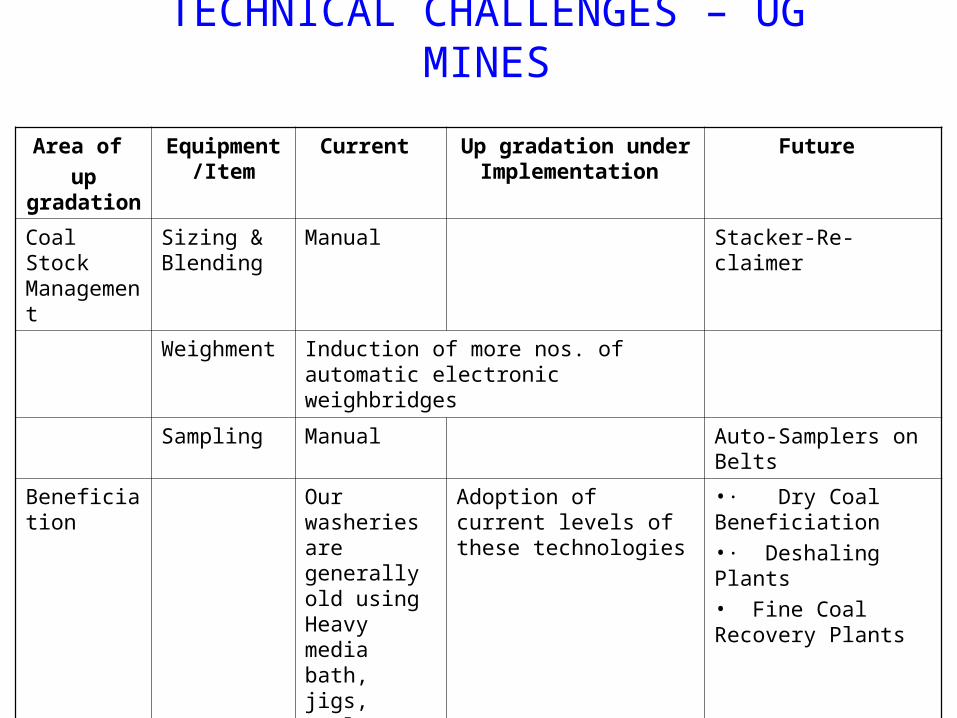
Area of up gradation
Equipment /Item
Current Up gradation under Implementation
Future
Coal Stock Management
Sizing & Blending
Manual Stacker-Re-claimer
Weighment Induction of more nos. of automatic electronic weighbridges
Sampling Manual Auto-Samplers on Belts
Beneficiation Our washeries are generally old using Heavy media bath, jigs, cyclone, flotation
Adoption of current levels of these technologies
•· Dry Coal Beneficiation•· Deshaling Plants• Fine Coal Recovery Plants
TECHNICAL CHALLENGES – UG MINES

BUSINESS MODEL:• Equity Model
– Stake with off take contract in brown field assets
– 100% or majority stake in green field assets
• Off-take Model :
– Long term contract essentially with coal miners
– Short term contract
TARGET PRODUCTS & DESTINATIONS:
• Mozambique – Coking & thermal from own assets
• Indonesia - Thermal coal [ > 4000 kcal/kg (ARB)]
• South Africa - Thermal Coal [ > 5500 kcal/kg(ARB)]
• USA - Thermal Coal [ > 6000 kcal/kg(ARB)]
• Australia - Thermal Coal [ > 5500 kcal/kg(ARB)] 25
Foreign Acquisitions - Strategy Framework
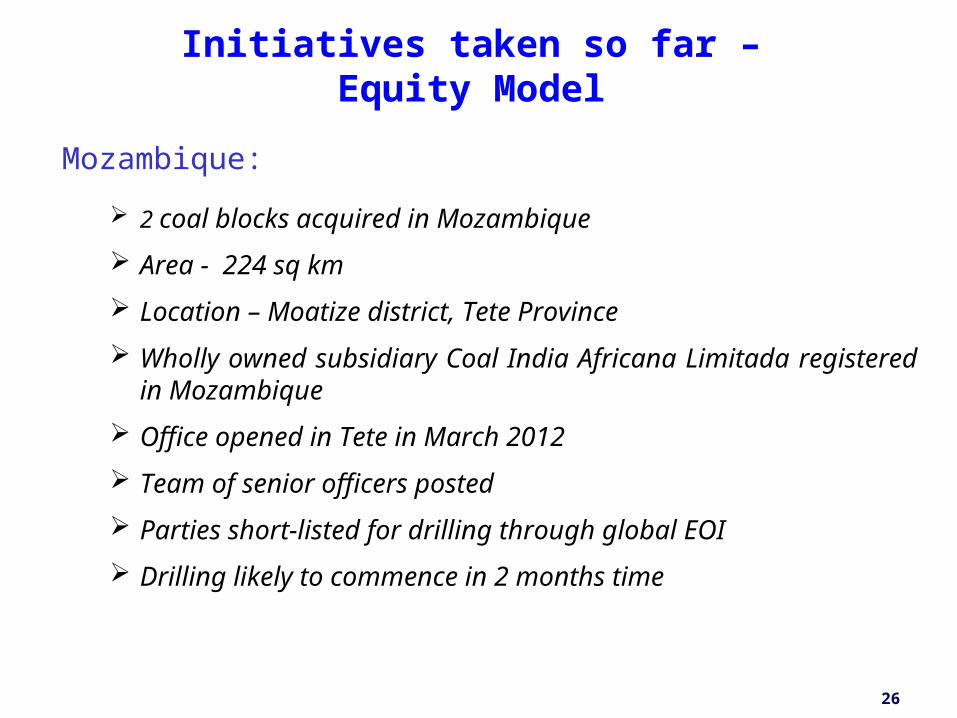
Mozambique:
2 coal blocks acquired in Mozambique
Area - 224 sq km
Location – Moatize district, Tete Province
Wholly owned subsidiary Coal India Africana Limitada registered in Mozambique
Office opened in Tete in March 2012
Team of senior officers posted
Parties short-listed for drilling through global EOI
Drilling likely to commence in 2 months time
26
Initiatives taken so far – Equity Model
South Africa:
MoU signed with Provincial Govt. of Limpopo in 2011
Strategic alliance for exploration and development of coal assets in Limpopo Province
Exploratory visit by CIL
Potential zones for coal resources identified
27
Initiatives taken so far – Equity Model
Other countries :
Govt. of India has issues guidelines for PSUs in Jan 2011 for acquisition of raw material assets abroad
Policy adopted by CIL Board
Investment Bankers sensitized to assist CIL in M&A
Opportunities are being explored through bi-lateral platforms particularly in African continent
28
Initiatives taken so far – Equity Model

THANK YOU