Embed Size (px)
Citation preview
Coal in China: Environment Risks and It’s future Qingwei Sun, Greenpeace Woodrow Wilson – May 3, 2013
• China coal industry overview • Thirsty coal • Air pollution • CO2 emissions • Policy dynamics • Coal imports
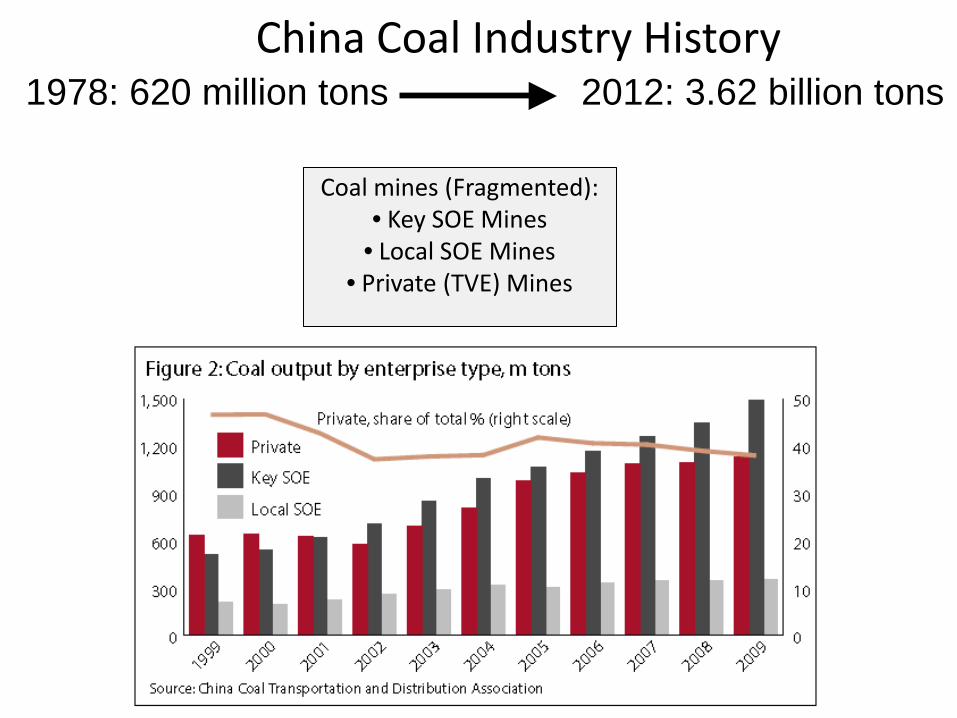
China Coal Industry History 1978: 620 million tons 2012: 3.62 billion tons
Coal mines (Fragmented): • Key SOE Mines
• Local SOE Mines • Private (TVE) Mines
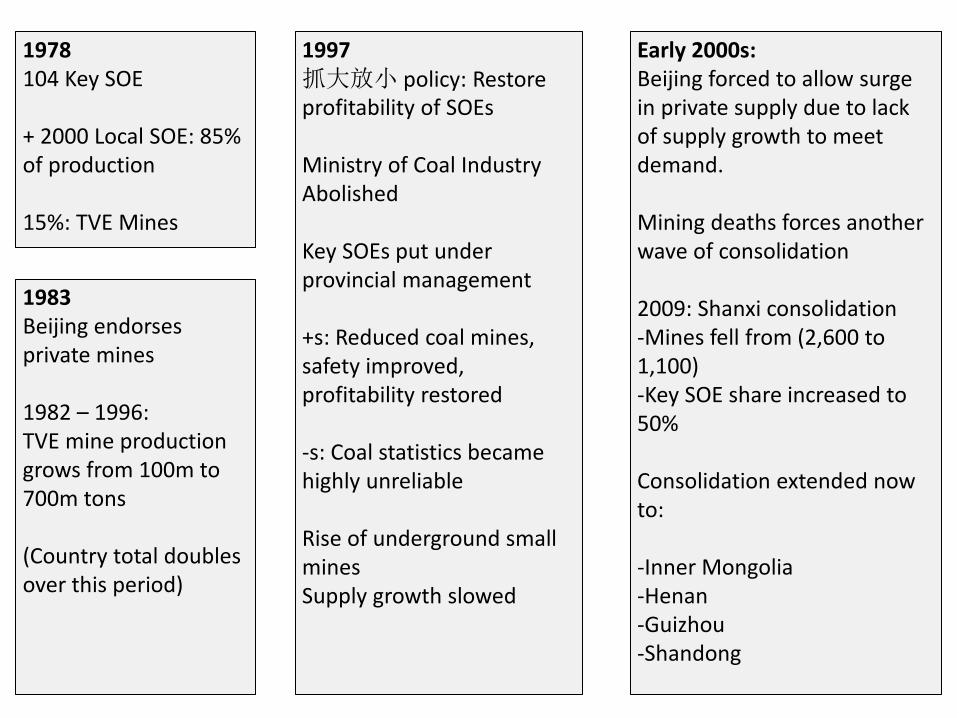
1978 104 Key SOE + 2000 Local SOE: 85% of production 15%: TVE Mines
1983 Beijing endorses private mines 1982 – 1996: TVE mine production grows from 100m to 700m tons (Country total doubles over this period)
1997 抓大放小 policy: Restore profitability of SOEs Ministry of Coal Industry Abolished Key SOEs put under provincial management +s: Reduced coal mines, safety improved, profitability restored -s: Coal statistics became highly unreliable Rise of underground small mines Supply growth slowed
Early 2000s: Beijing forced to allow surge in private supply due to lack of supply growth to meet demand. Mining deaths forces another wave of consolidation 2009: Shanxi consolidation -Mines fell from (2,600 to 1,100) -Key SOE share increased to 50%
Consolidation extended now to: -Inner Mongolia -Henan -Guizhou -Shandong
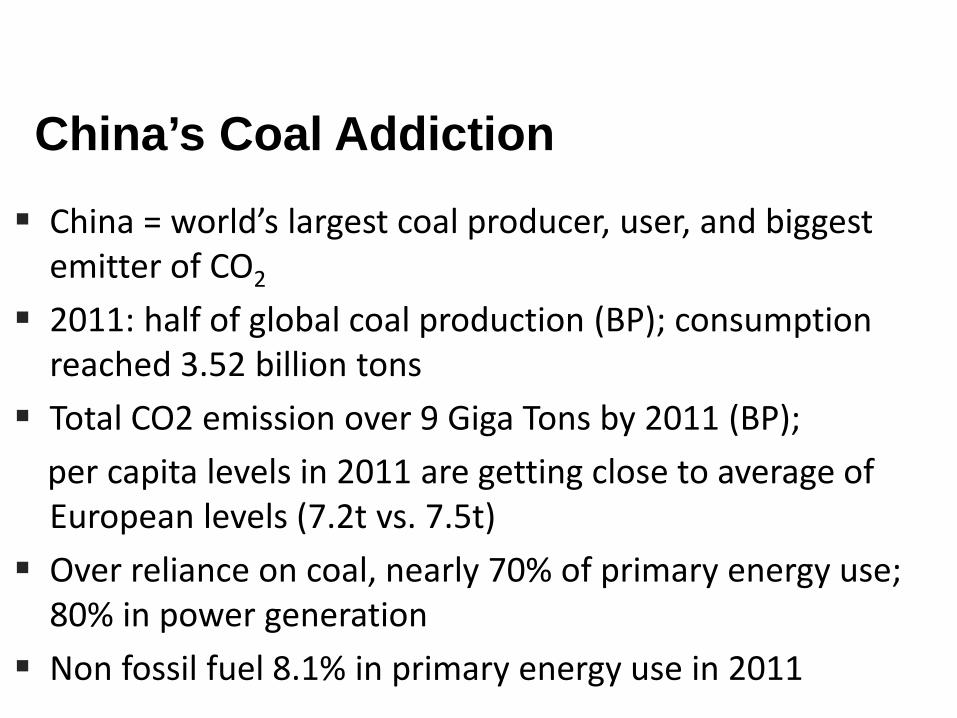
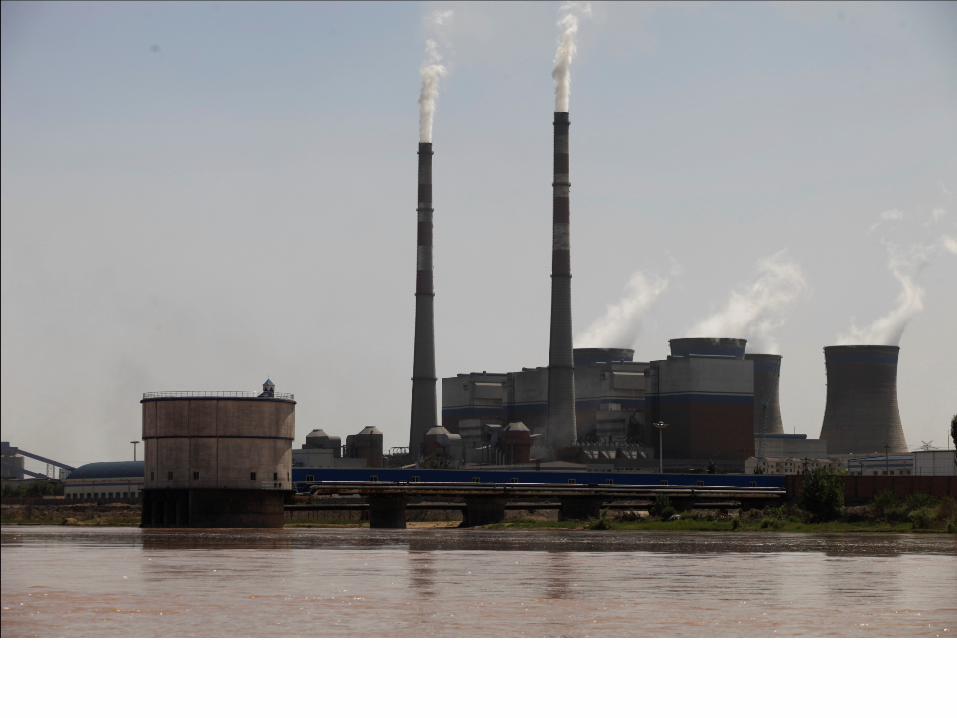
China’s Coal Addiction China = world’s largest coal producer, user, and biggest
emitter of CO2 2011: half of global coal production (BP); consumption
reached 3.52 billion tons Total CO2 emission over 9 Giga Tons by 2011 (BP); per capita levels in 2011 are getting close to average of
European levels (7.2t vs. 7.5t) Over reliance on coal, nearly 70% of primary energy use;
80% in power generation Non fossil fuel 8.1% in primary energy use in 2011
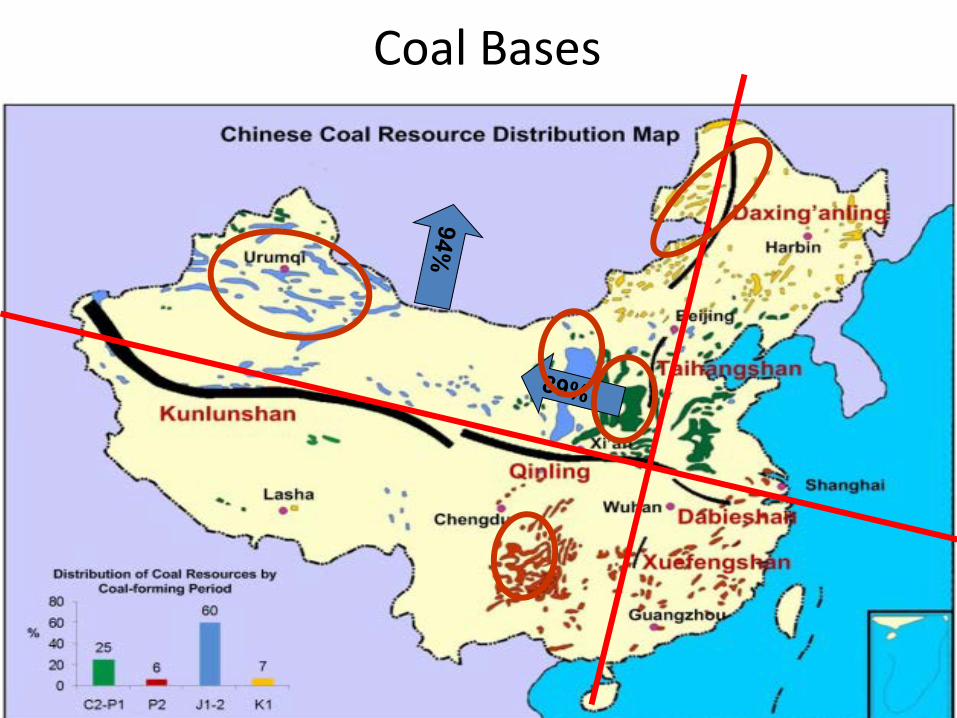
Coal Bases
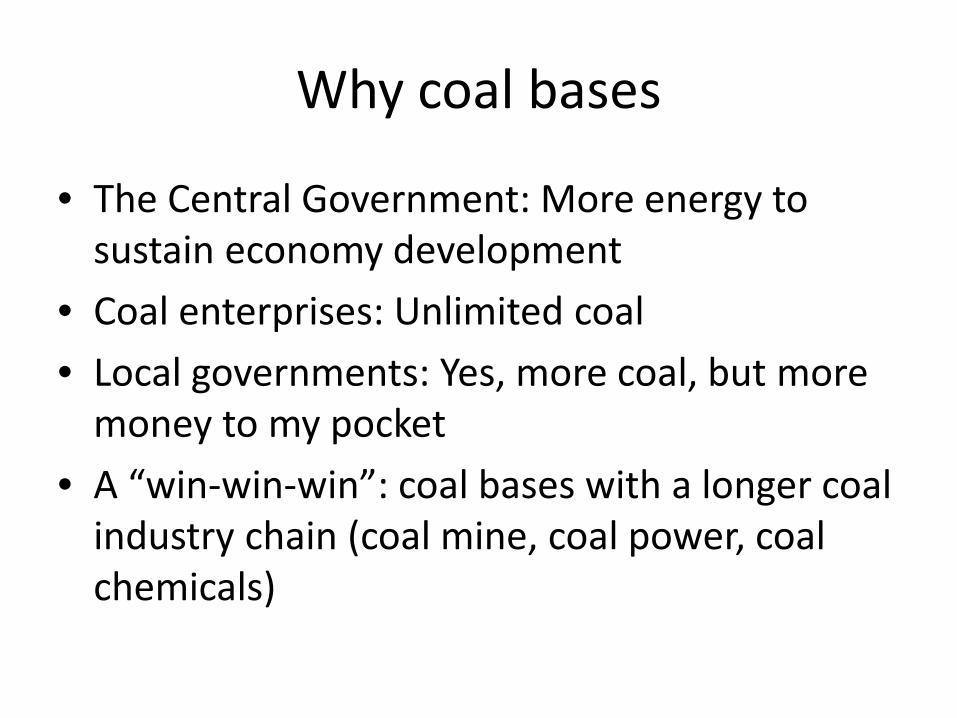
Why coal bases
• The Central Government: More energy to sustain economy development
• Coal enterprises: Unlimited coal • Local governments: Yes, more coal, but more
money to my pocket • A “win-win-win”: coal bases with a longer coal
industry chain (coal mine, coal power, coal chemicals)
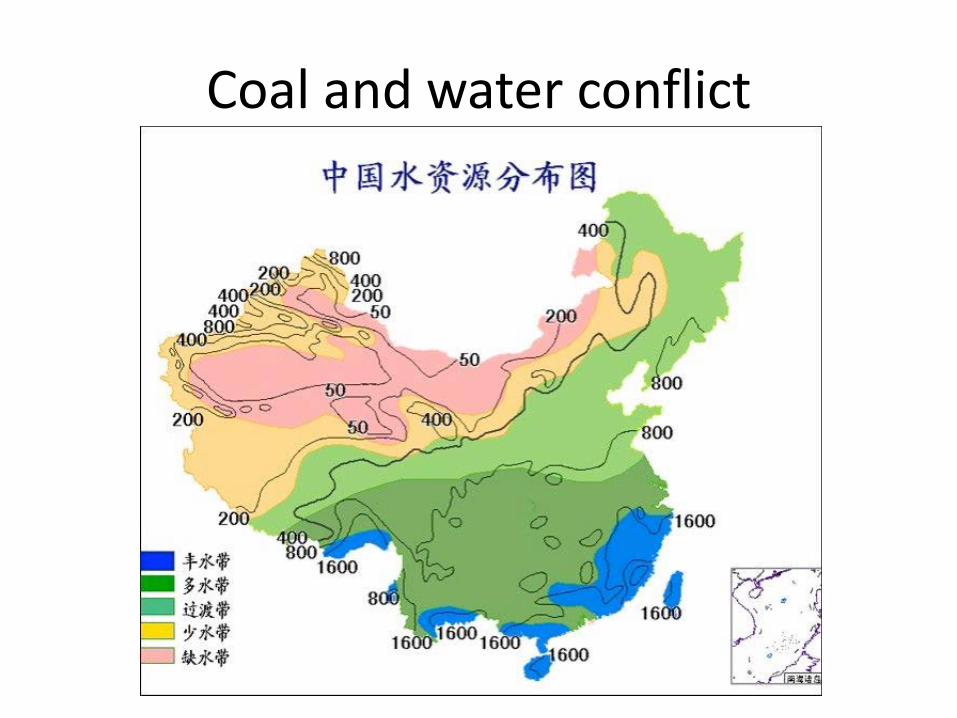
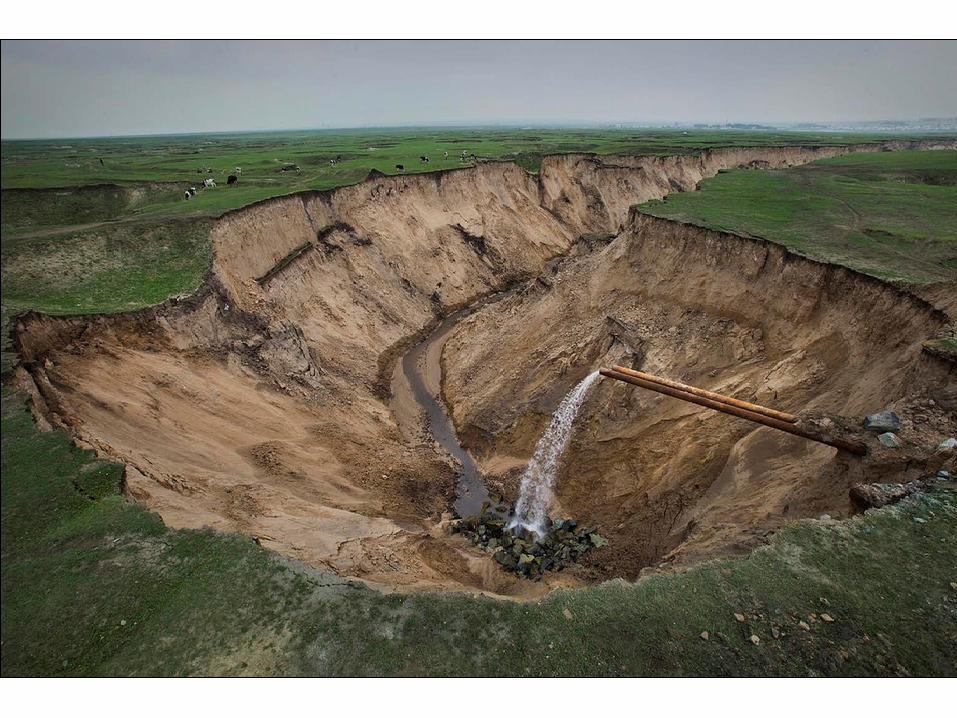
Coal and water conflict
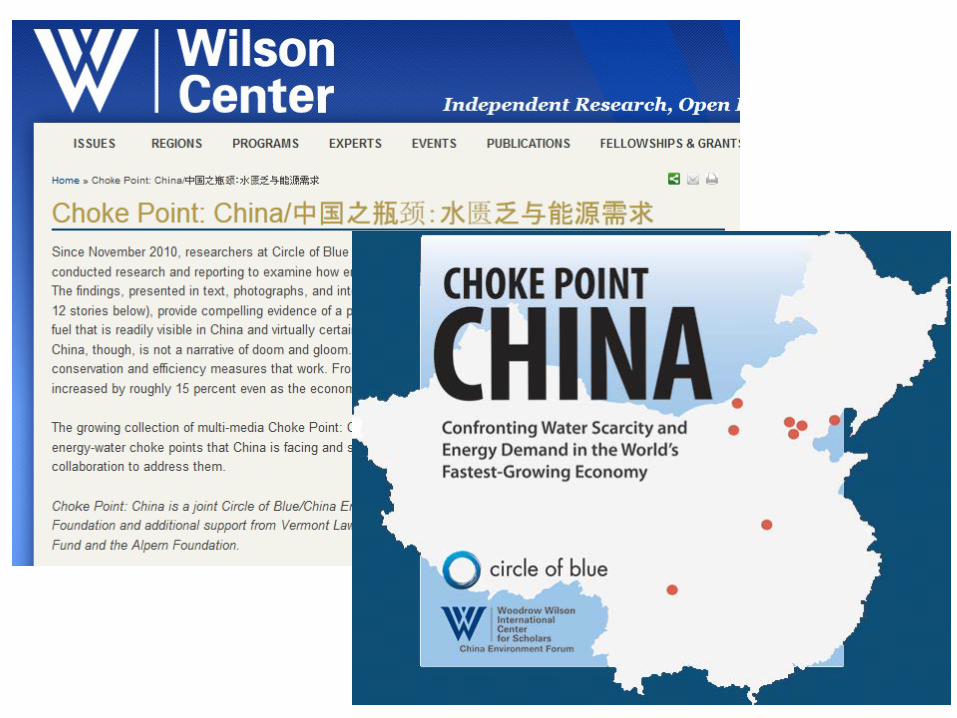
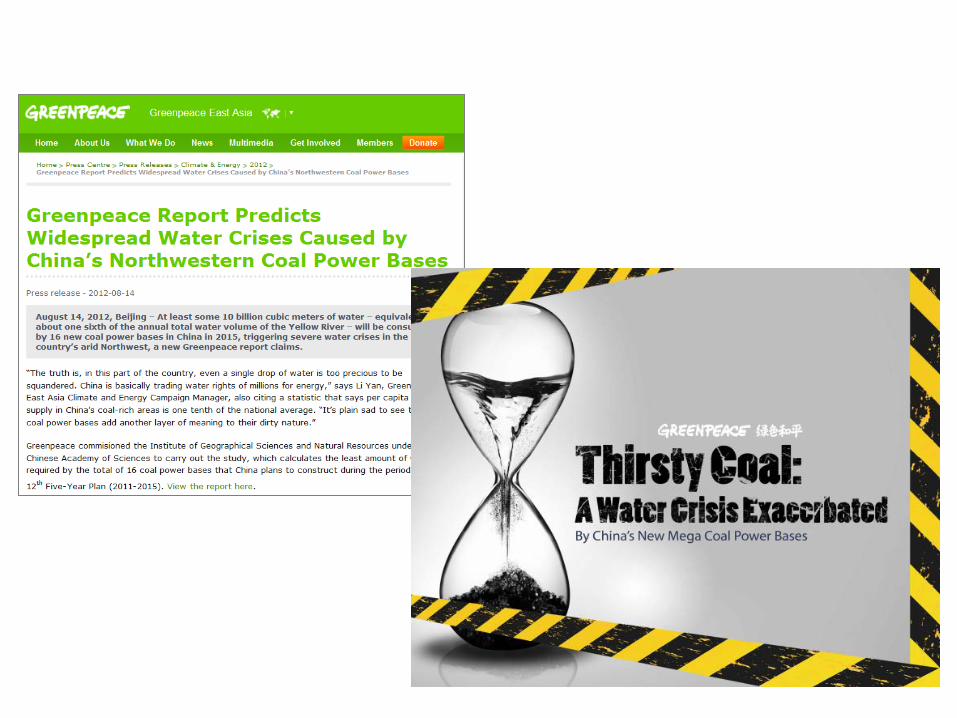
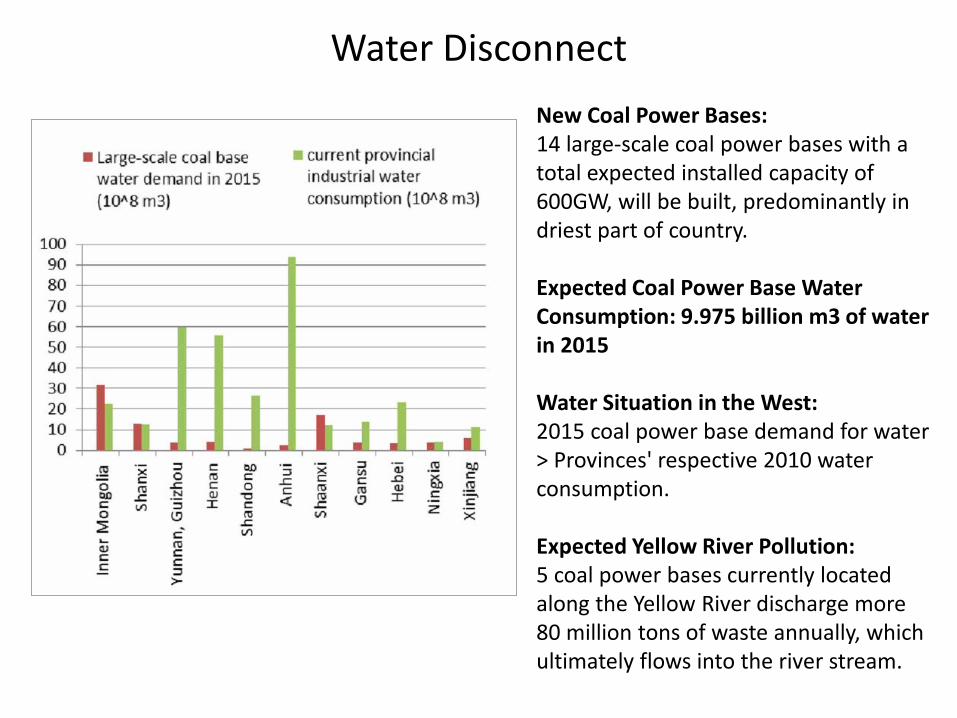
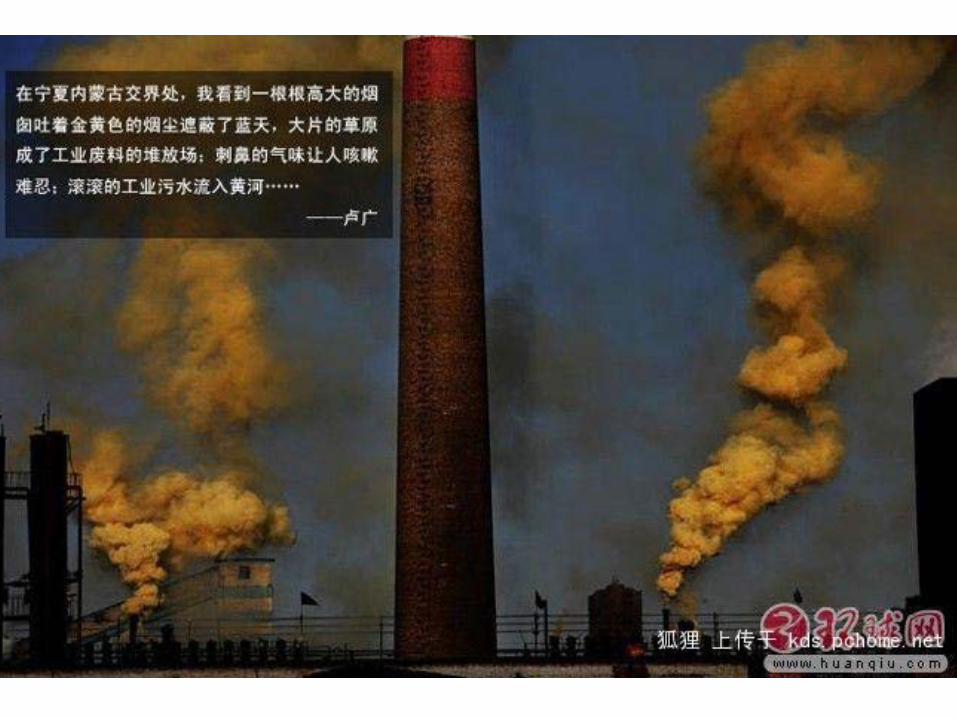
Water Disconnect New Coal Power Bases: 14 large-scale coal power bases with a total expected installed capacity of 600GW, will be built, predominantly in driest part of country. Expected Coal Power Base Water Consumption: 9.975 billion m3 of water in 2015 Water Situation in the West: 2015 coal power base demand for water > Provinces' respective 2010 water consumption. Expected Yellow River Pollution: 5 coal power bases currently located along the Yellow River discharge more 80 million tons of waste annually, which ultimately flows into the river stream.
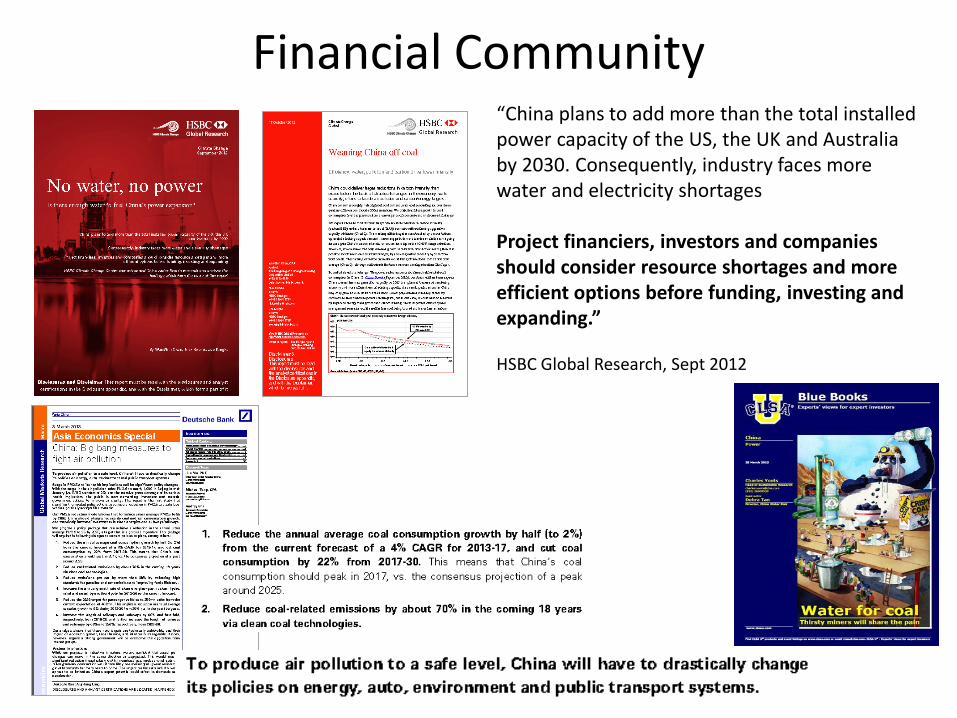
Financial Community “China plans to add more than the total installed power capacity of the US, the UK and Australia by 2030. Consequently, industry faces more water and electricity shortages Project financiers, investors and companies should consider resource shortages and more efficient options before funding, investing and expanding.” HSBC Global Research, Sept 2012
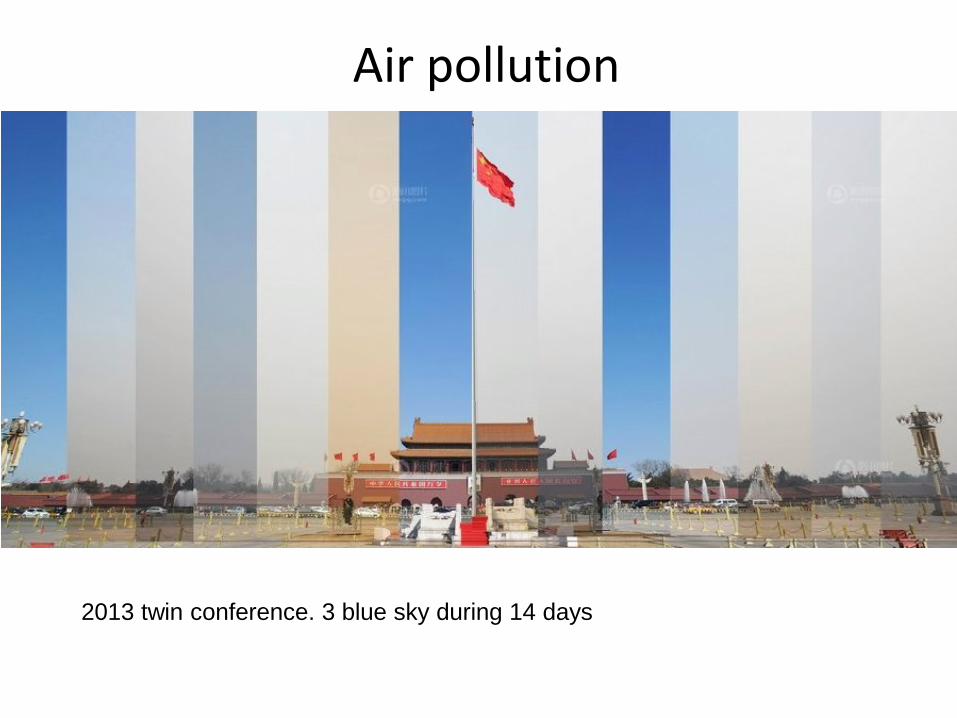
2013 twin conference. 3 blue sky during 14 days
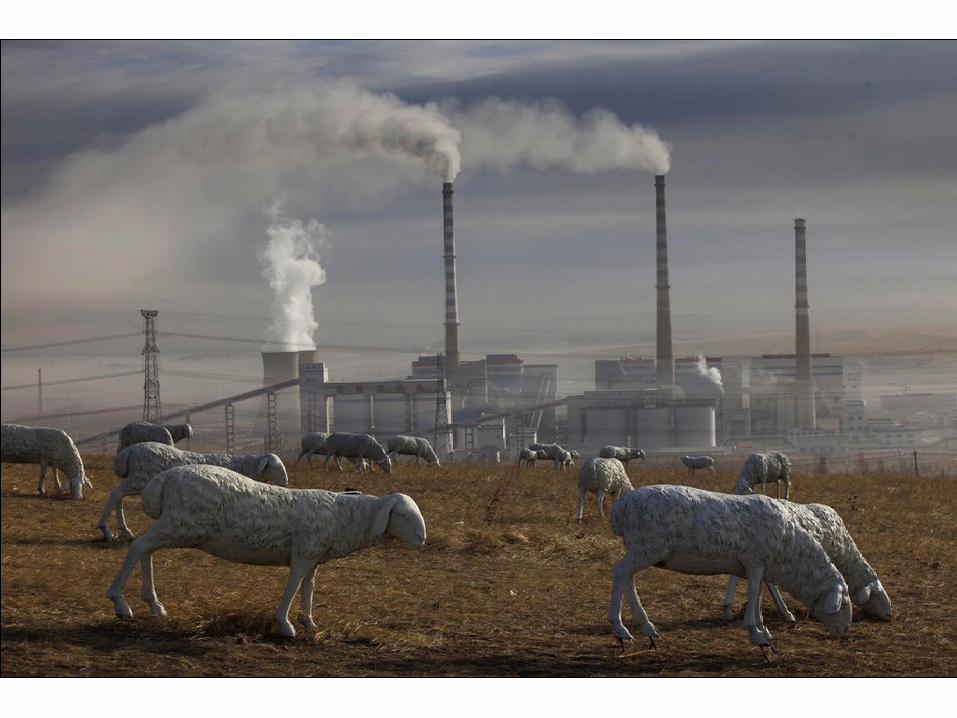
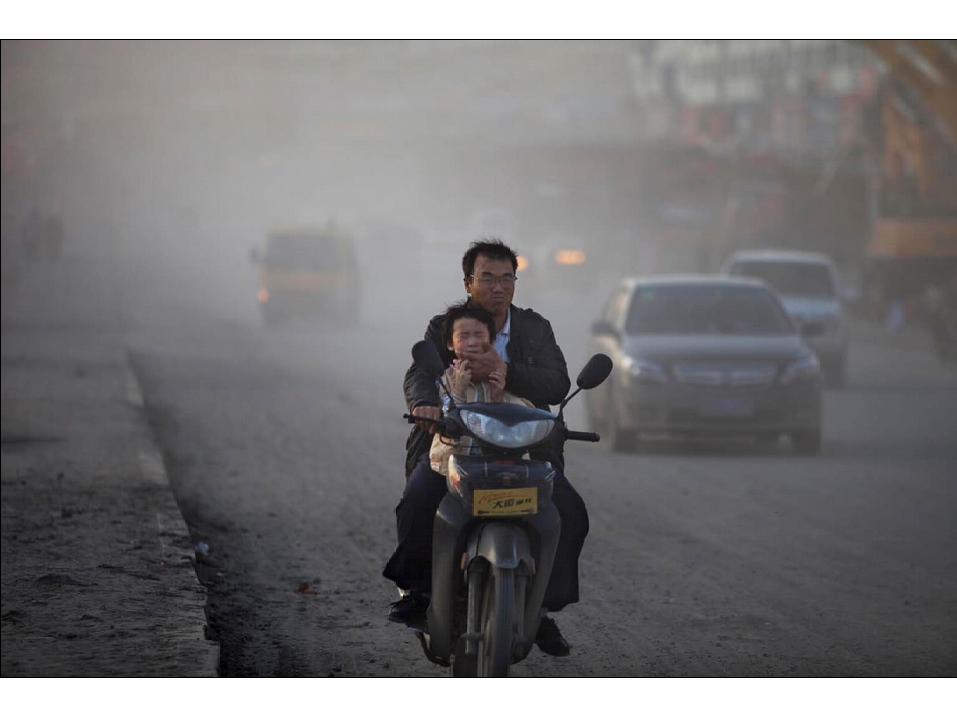
Air pollution
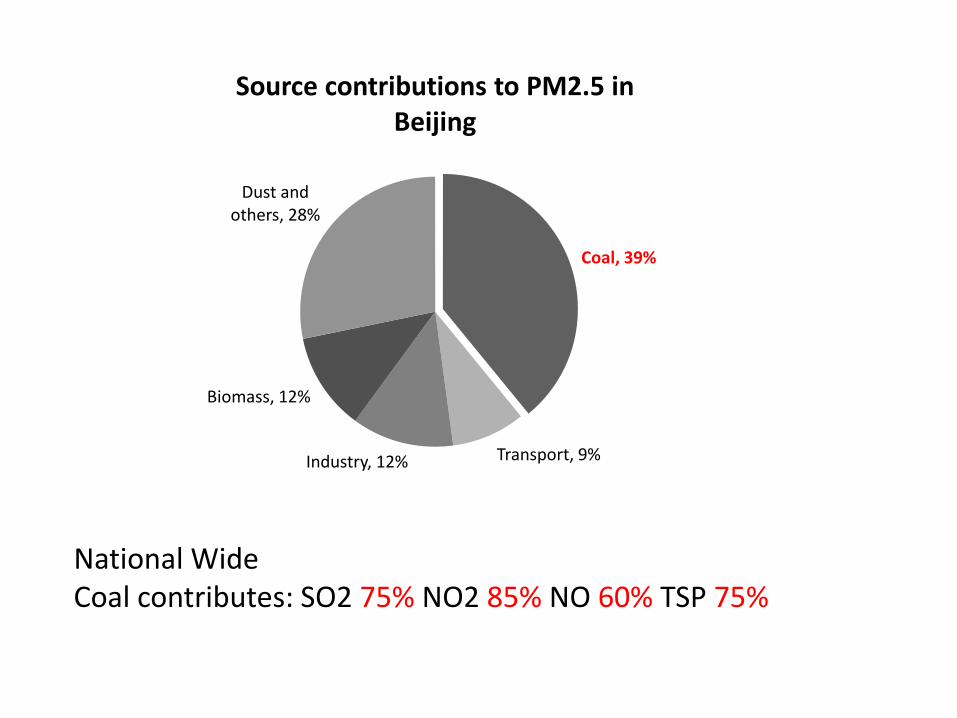
Coal, 39%
Transport, 9% Industry, 12%
Biomass, 12%
Dust and others, 28%
Source contributions to PM2.5 in Beijing
National Wide Coal contributes: SO2 75% NO2 85% NO 60% TSP 75%
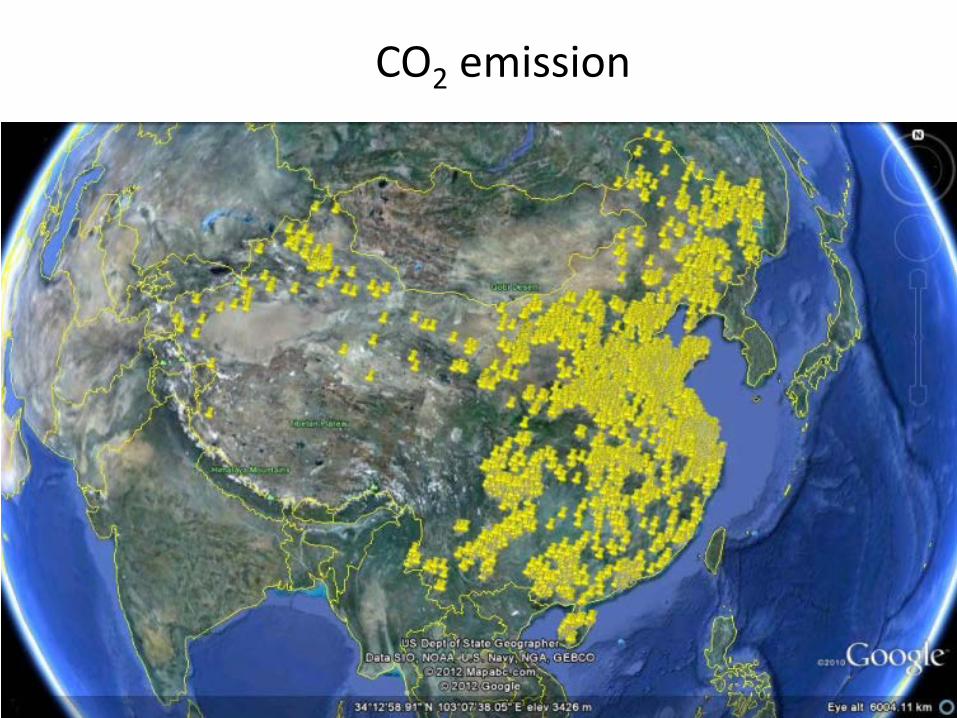
CO2 emission
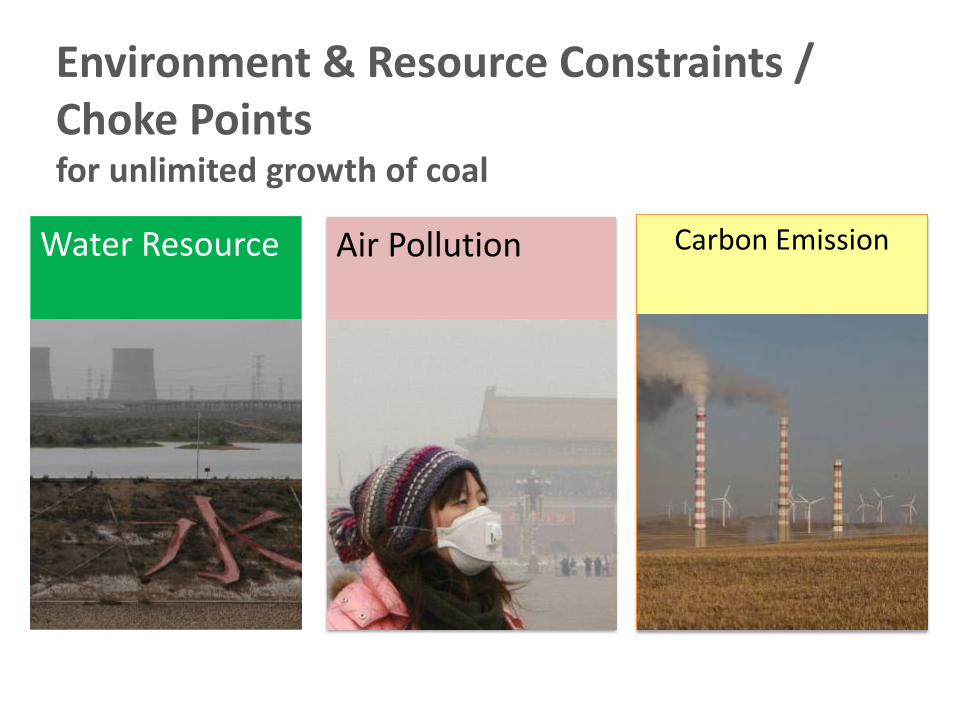
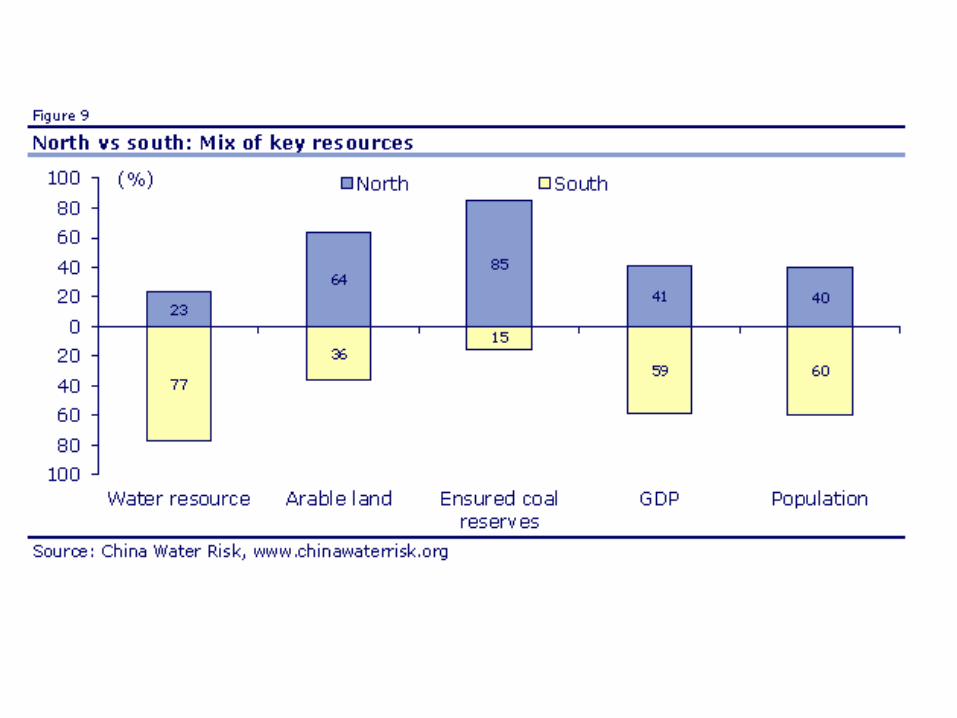
Environment & Resource Constraints / Choke Points for unlimited growth of coal
Water Resource Air Pollution Carbon Emission
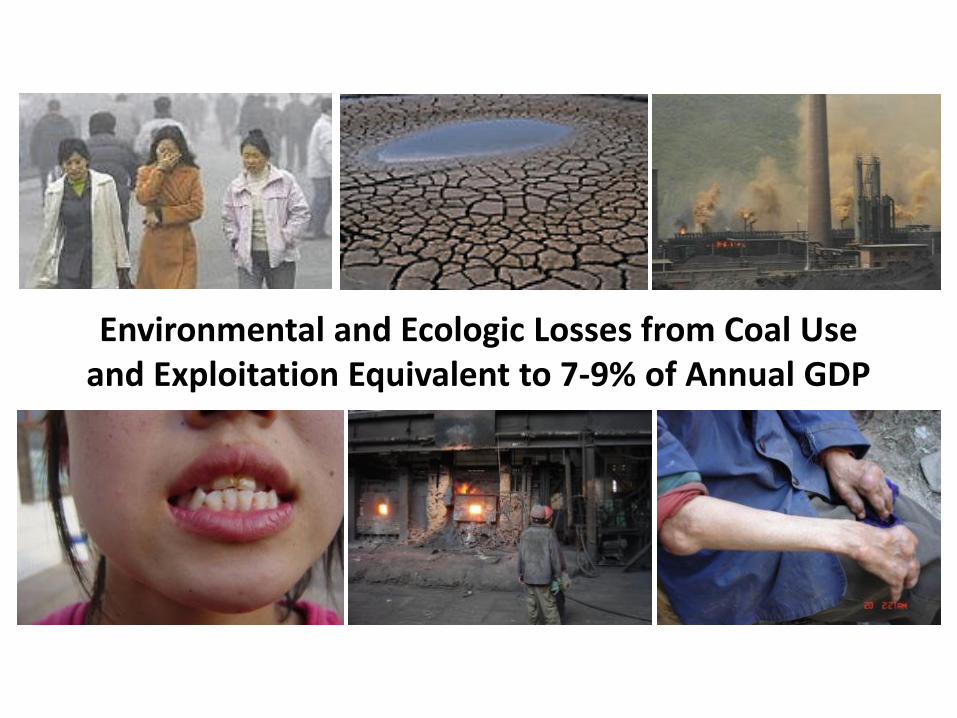
Environmental and Ecologic Losses from Coal Use and Exploitation Equivalent to 7-9% of Annual GDP
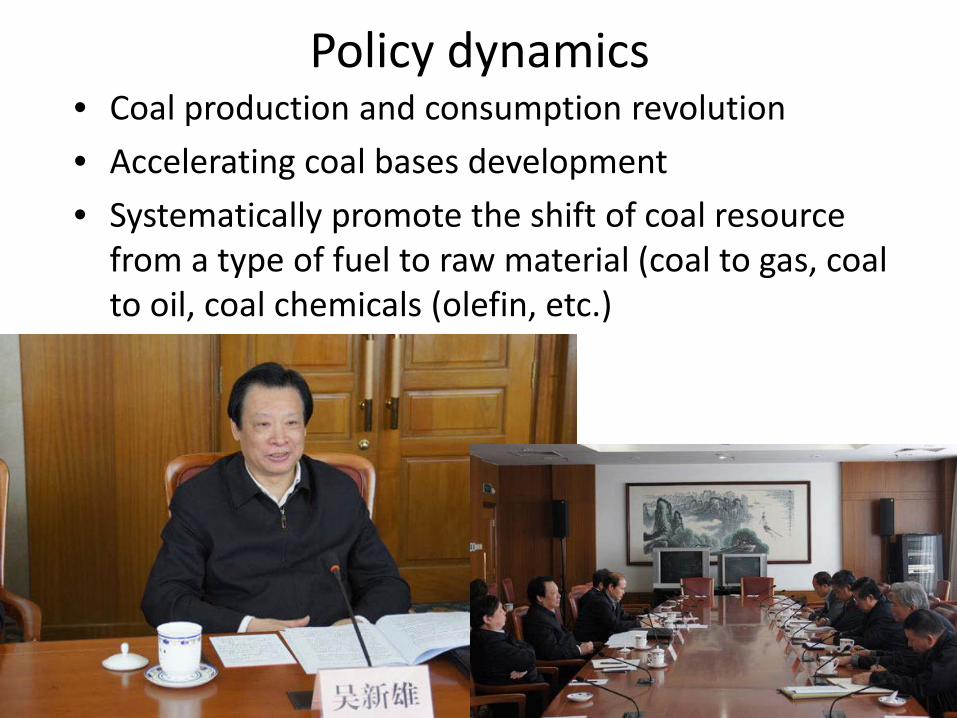
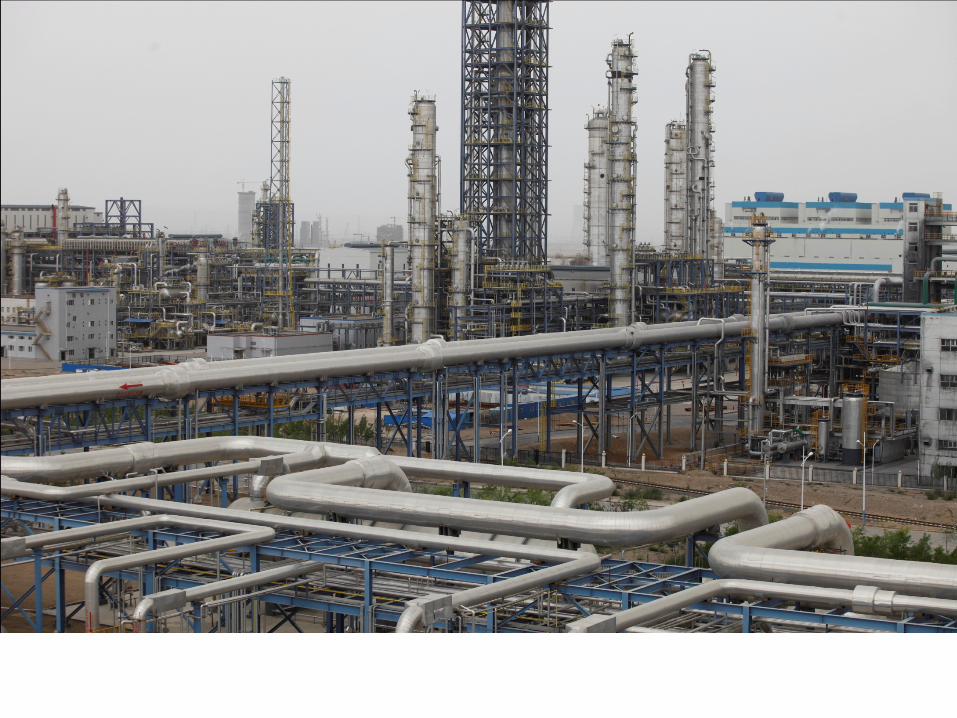
Policy dynamics • Coal production and consumption revolution • Accelerating coal bases development • Systematically promote the shift of coal resource
from a type of fuel to raw material (coal to gas, coal to oil, coal chemicals (olefin, etc.)
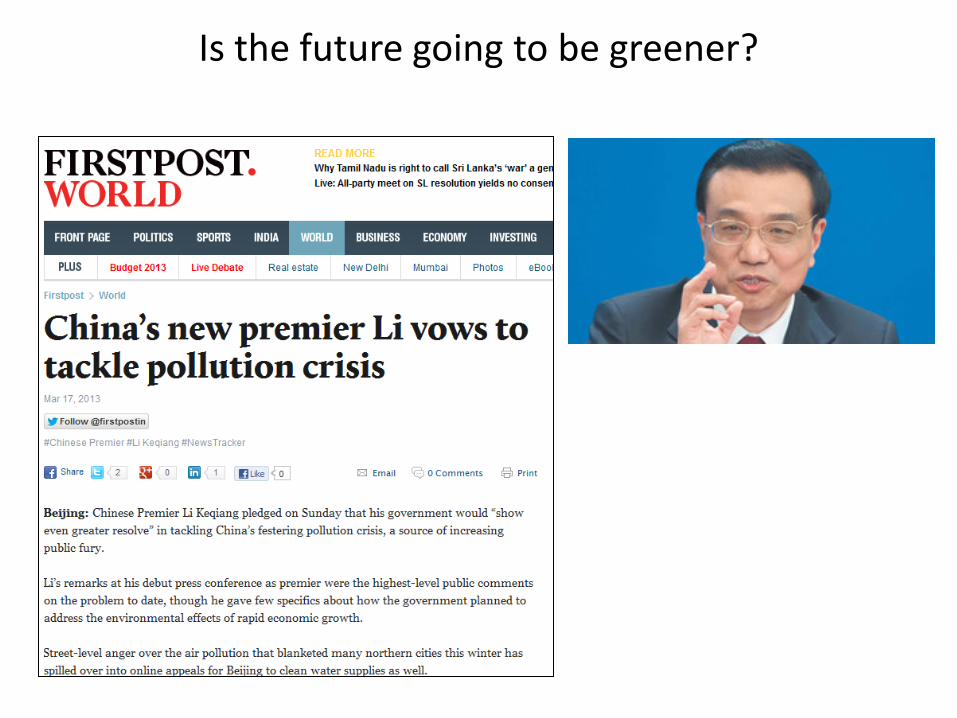
Is the future going to be greener?
A coal cap?
Key Highlights
2 announced “allocated” caps: • Primary energy consumption cap:
– 4 billion metric tons of coal equivalent by 2015
• Total Power use cap: – 6.15 trillion kilowatt-hours in 2015
Repeat of previous targets: 2015 carbon intensity target: 16% drop from 2010 2015 energy intensity target: 17% drop from 2010 2020 carbon intensity target: 40 – 45% from 2005 levels
for 13th FYP: energy cap, but not coal cap
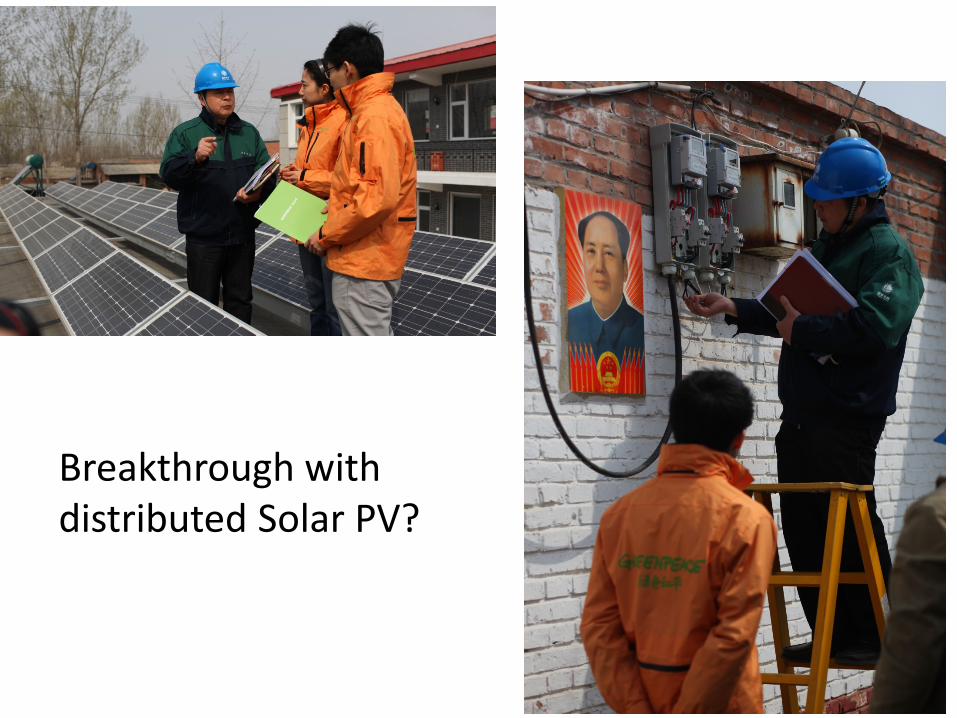
Breakthrough with distributed Solar PV?
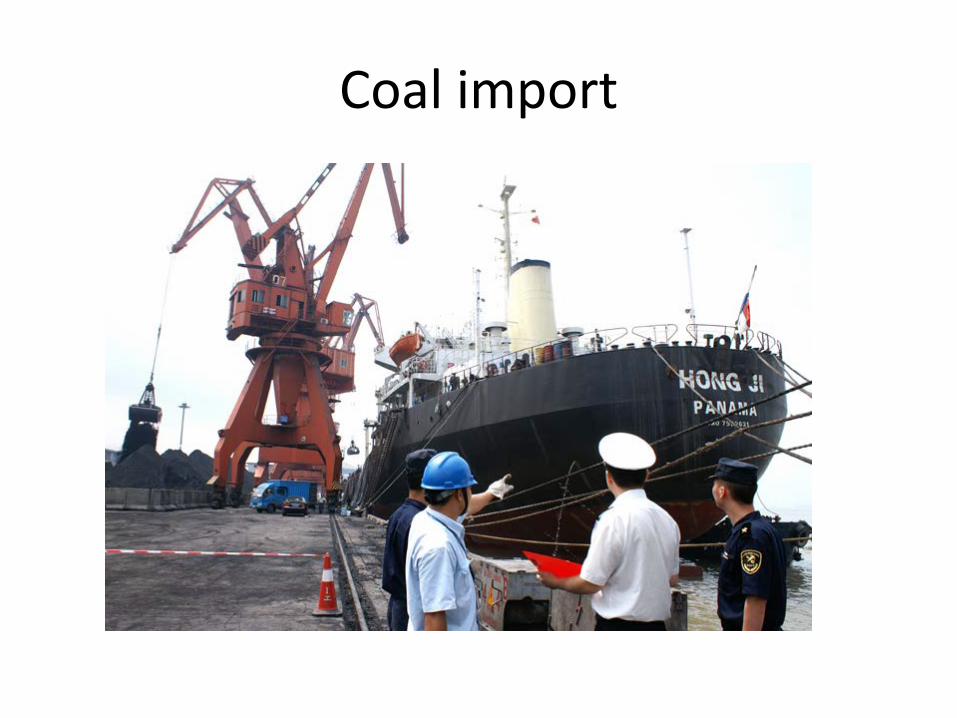
Coal import
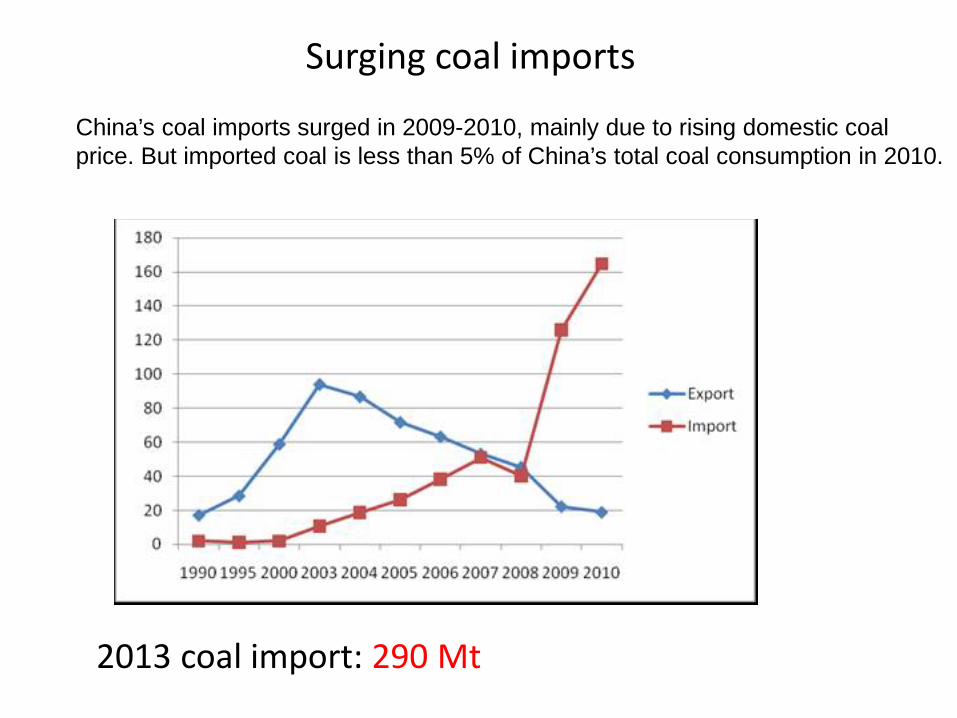
Surging coal imports
China’s coal imports surged in 2009-2010, mainly due to rising domestic coal price. But imported coal is less than 5% of China’s total coal consumption in 2010.
2013 coal import: 290 Mt
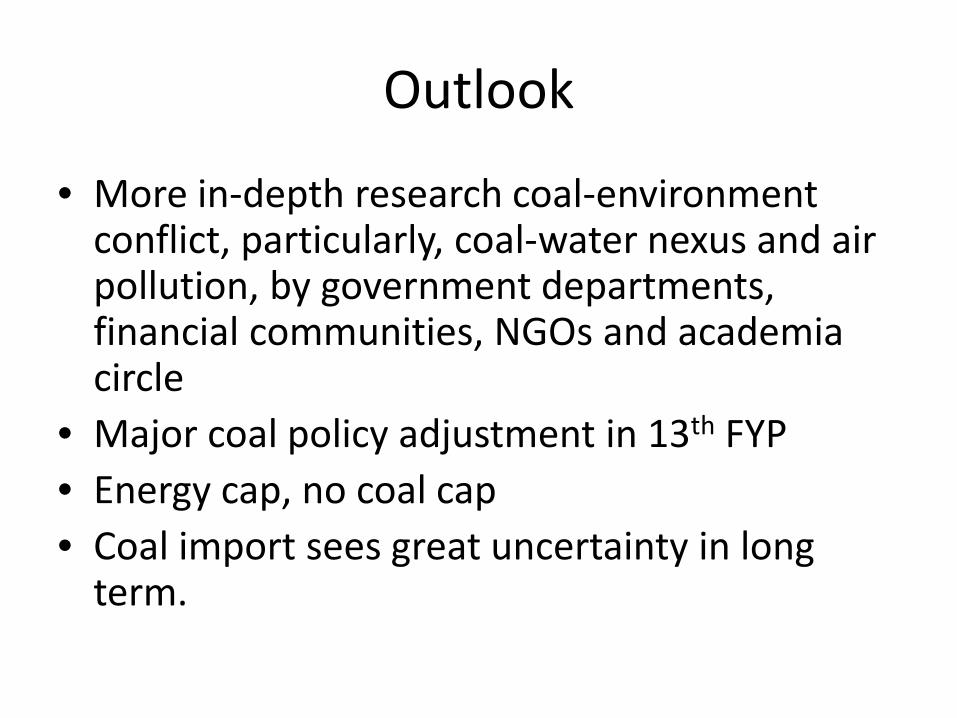
Outlook
• More in-depth research coal-environment conflict, particularly, coal-water nexus and air pollution, by government departments, financial communities, NGOs and academia circle
• Major coal policy adjustment in 13th FYP • Energy cap, no coal cap • Coal import sees great uncertainty in long
term.
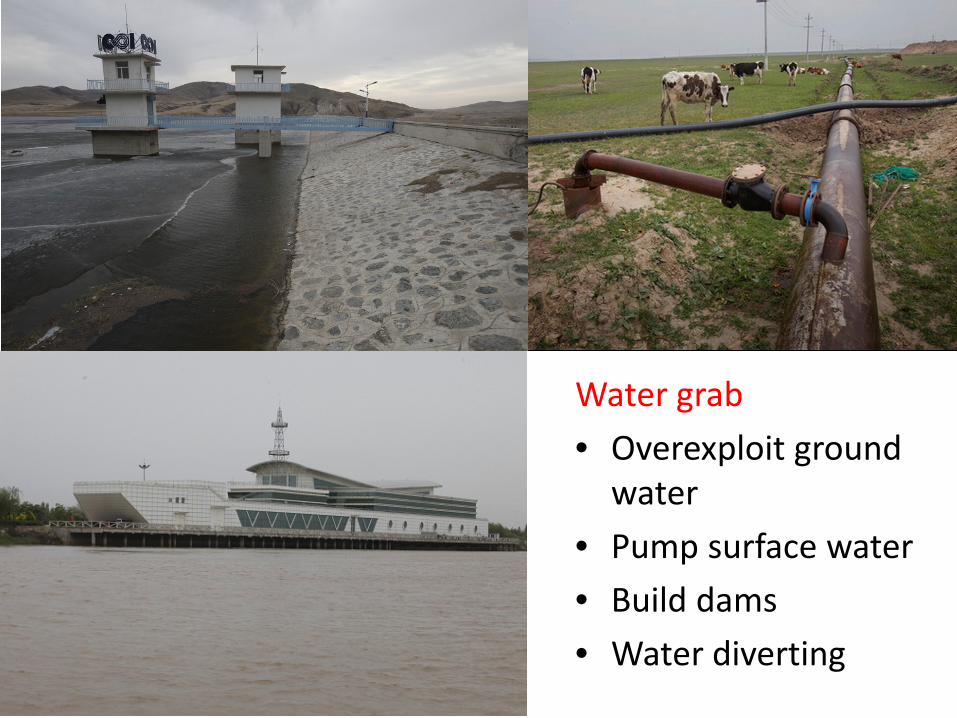
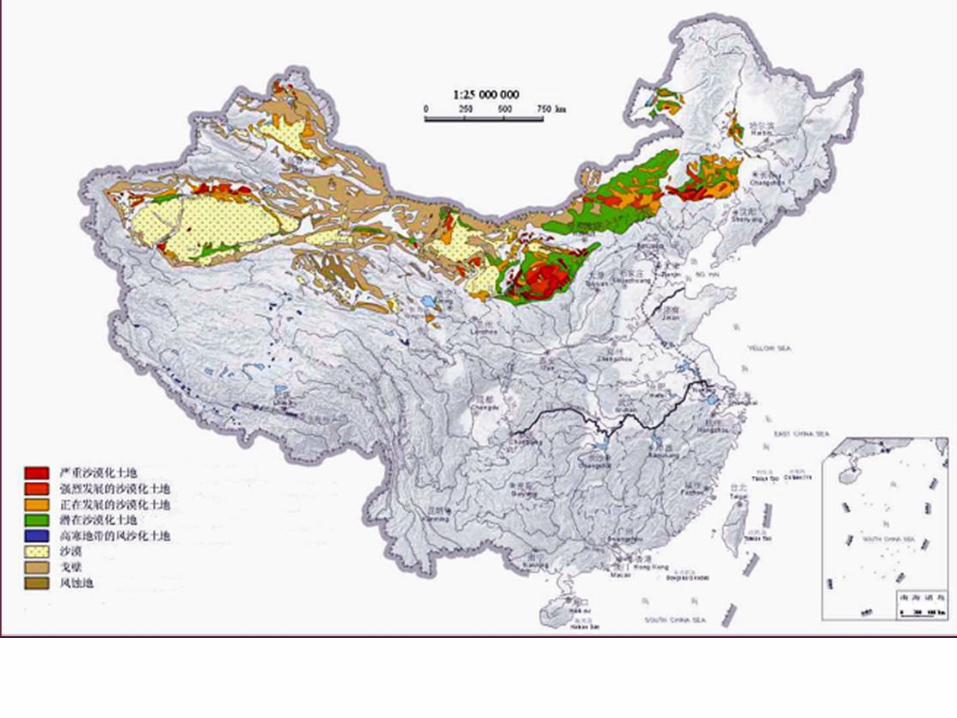
Water grab • Overexploit ground
water • Pump surface water • Build dams • Water diverting
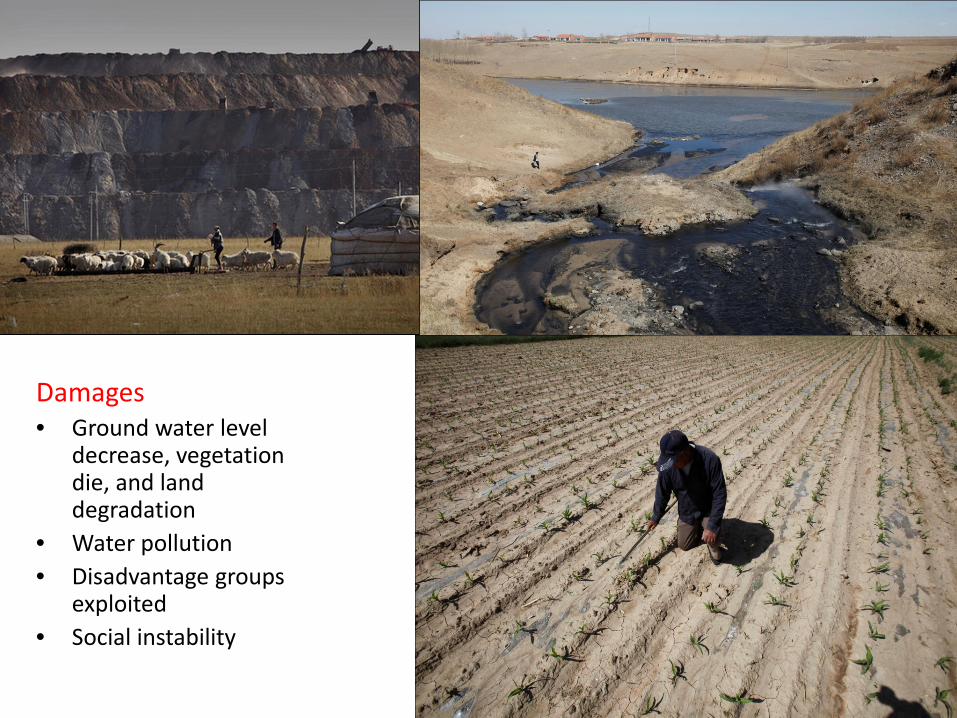
Damages • Ground water level
decrease, vegetation die, and land degradation
• Water pollution • Disadvantage groups
exploited • Social instability