Embed Size (px)
Citation preview

03.10.2018
1
Coal Combustion and Biomass Conversion for Modern Power Generation
Dr David Smith
ASTT Conference 2018
© Doosan Babcock Limited 2018. All rights reserved.
Meeting Increasingly Stringent Emissions Regulations for Coal Fired Power Plants
Emissions limits for Coal Fired Power Plants – status and trends
Boiler and emission controls technologies – current state-of-the-art
Focus on combustion technology for coal and biomass conversions

03.10.2018
2
1328 GW OF NEW PLANT ORDERED
SINCE 2000
New Build Coal Fired Power Plant TrendsPower Plant Orders > 250MW
Rest of world orders 2010-16
NEARLY 40% FROM COAL
All coal fired power plant orders for unit sizes above 250MWe (Gross)[Raw data from McCoy Power Reports]
119GW OF NEW PLANT ORDERED
2015-16, BUT DECLINING
IEA
New Build Coal Fired Power Plant TrendsReducing Stack Emissions Limits
Pollutant IED /
European Standard
World Bank (WB)
IFC, (1)
CHINAGB 13223-
2011TURKEY INDONESIA INDIA3,4
SOUTH KOREA2
100 / 3 (300 / 3) 16 / 3
NOx 150 mg/Nm3 200 mg/Nm3100 mg/Nm3
(6) 200 mg/Nm3 750 mg/m3 (10)(300 mg/Nm3)100 mg/Nm3
164 mg/Nm3
(80 ppm)
SO2 150 mg/Nm3 200 mg/Nm3100 mg/Nm3
(6)(9) 200 mg/Nm3 750 mg/m3 (10)(200 mg/Nm3)100 mg/Nm3
228.8 mg/Nm3
(80 ppm)
PM 10 mg/Nm3 30 mg/Nm3 30 mg/Nm3 (8) 30 mg/Nm3
100 mg/m3 (10)
(50 mg/Nm3)30 mg/Nm3
20 mg/Nm3
Not defined / 0 03 mg/Nm³HG Not defined /
0.03 mg/Nm³ (5)Not defined 0.03 mg/Nm³
(7) Not defined Not defined 0,03 mg/Nm³ Not defined
mg/Nm3 = milligrams per normal cubic meter at 6%O2 , 273,15°K and 1.013 bar except Indonesia – note 101. Emission guidelines from World Bank IFC, 2008 Environmental,
Health, and Safety Guidelines. (for DA areas (DA = DegradatedAirshed = poor air quality)).
2. Generation capacity > 500MWe, from 1st Jan 2005 to 2016
3. Values in brackets 2004 – 2016) 4. Bold values for new plant after Jan 01 2017 Plant > 500MWe5. From German Regulation / 13. BimSchV, 6. Increased to 200 in certain provinces.7. From 20158. Reduced to 20 for certain regions.9. Reduced to 50 for certain regions.10. mg/Nm3 = milligrams per normal cubic meter at 7%O2 25°C and 1.013 bar.

03.10.2018
3
Future Ultra-Low Emission Limits
Drive to even lower emission limits for NOx, SOx and PM –eg new South Korean limits:
PM – 5 mg/Nm3
New Build Coal Fired Power Plant TrendsReducing Stack Emissions Limits
SO2 – 25ppm (71.5 mg/Nm3)
NO2 – 15ppm (30.8 mg/Nm3)
PM2.5
In most countries particulate matter from coal fired power plant is not distinguished by size at the stack, but may be distinguished in ambient air.
PM2.5 concern because of possibility for deep penetration to lungsto lungs.
PM2.5 classified as primary and secondary:
Primary is filterable fine particulate matter (eg fly-ash)
Secondary is formed by reactions of other pollutants (egSOx, NOx, NH3)
Doosan State-of-the-Art Technologies for Boilers and Emission Controls

03.10.2018
4
Highest efficiency achieved via steam cycle optimisation by a combination of:
USC steam parameters at turbine inlet
Regenerative feedwater heating to increase boiler feed water temperature
Ultra-Supercritical Boiler Technologies for High Efficiency
FUTURE NEW UTILITY SCALEPLANT WILL BEincrease boiler feed water temperature
Condenser pressure / LP Turbine last stage blade optimisation
Emission reduction resulting from higher efficiency is substantial:
PLANT WILL BE SUPERCRITICAL
Parameter SupercriticalUltra-
SupercriticalMain Steam Pressure / Temperature
245 bar / 565 C 280 bar* / 600 C
All coal fired power plant orders for unit sizes above 250MWe (Gross)[Raw data from McCoy Power Reports]
Temperature Reheat Steam Pressure / Temperature
40 bar / 565 C 60 bar** / 610 C
Net Plant Efficiency (% LHV)
41.8 44.0
Emissions (CO2
SO2, NOx, PM) Base -5%
*280 bar ≈ 4060 psi**60 bar ≈ 870 psi
Ultra-Supercritical Boiler Technologies for High Efficiency
What happens when we use higher temperature and pressure?
When water is above 221 bar and 374C we no longer have any phase change between water and steam – we just have a continuous change in j gdensity as the fluid is heated
Because there is no phase change we can no longer use a traditional ‘natural circulation’ type boiler and we instead use a ‘once-through’ boiler
‘SPIRAL’ FURNACE

03.10.2018
5
Ultra-Supercritical Boiler Technologies for High Efficiency
2016201520142011
GHECO ONE THAILAND SHINBORYEONG S KOREAO G G S OAIN SOKHNA, EGYPT
2 x 650MWSH 540℃/ RH 540℃ 265 atgMazout Oil
GHECO-ONE, THAILAND
1 x 700MWSH 569℃/ RH 569℃ 255 atgSub-bituminous Coal
SHINBORYEONG, S. KOREA
2 x 1000MWSH 613℃/ RH 624℃ 274 atgSub-Bituminous and Bituminous Coals
YEONG HEUNG 5,6, S. KOREA
2 x 870MWSH 569℃/ RH 596℃ 251 atgSub-Bituminous and Bituminous Coals
EVOLUTION IN STEAM CONDITIONS
First 1000 MW USC Boiler in Korea
Name of Plant Shinboryeong #1,2
Capacity 1,000MW x 2
Country KOREA
Customer KOMIPOCustomer KOMIPO
Contract Award Nov. 2011
CODJun. 2017 (Under Commissioning)
Fuel Sub-bituminous Coal HHV = 5,600 kcal/kgMoisture = 17% , Ash = 7.8%
PC Boiler (Opposed firing)
Sep. 2014
Gross MW Net MW
Mar. 2017
Type of boiler
PC Boiler (Opposed firing)Ultra Supercritical PressureOnce-Thru Balanced Draft
Steam Condition SH 613℃/ RH 624℃, 274atg
Emissions (Stack)
NOx: 35ppmSOx: 50ppmPM: 15mg/Nm3
Unit #1 (21st Mar. 2017)
Unit #2 (21st Mar. 2017)
Gross MW Net MW
03.10.2018
6
Ultra-Supercritical Boiler Technologies for High EfficiencyBoiler Features – 1000 MW Design
Proven Two pass arrangement (Pendent and Horizontal)
Once-Through boiler technology with proven
Stable RH steamt t t ltechnology with proven
lower spiral wall tube and upper vertical wall tube
High performance Low NOx burner And OFA
temperature controlfor wide range coals withflue gas bias damper –higher efficiency at lower load
Vertical millswith dynamic classifiers
Proven capability for rapid starting with two shift operation- 2 Axial FD fans- 2 Axial ID fans- 2 Axial PA fans- 2 Trisector AHs
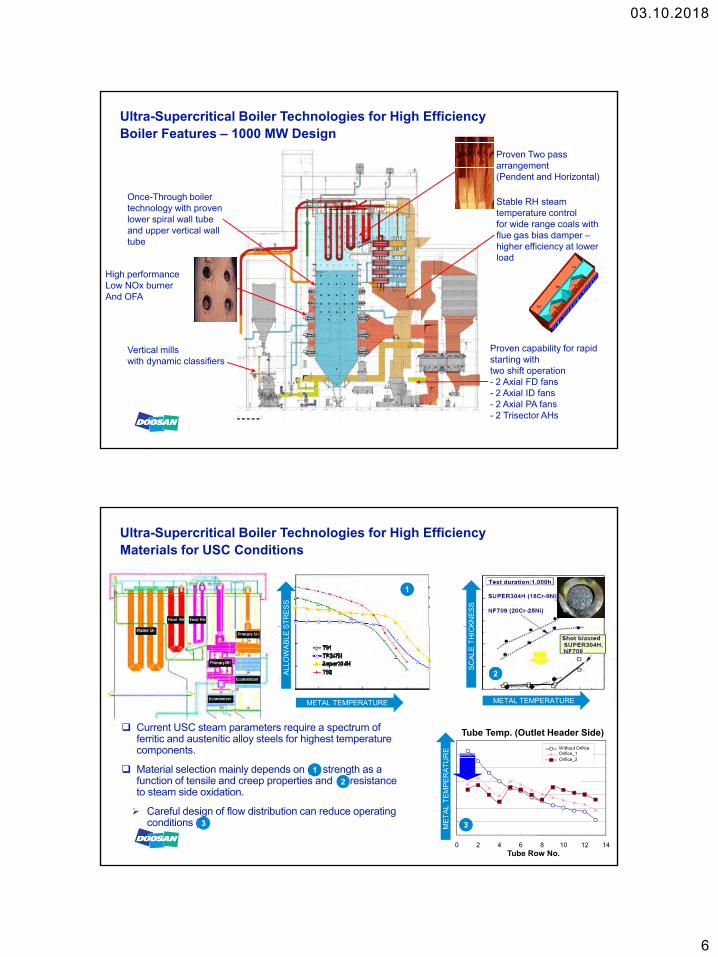
Ultra-Supercritical Boiler Technologies for High EfficiencyMaterials for USC Conditions
11
KN
ES
S
ST
RE
SS
680C)
Tube Temp. (Outlet Header Side) Current USC steam parameters require a spectrum of ferritic and austenitic alloy steels for highest temperature
t
22
SC
ALE
TH
ICK
METAL TEMPERATUREMETAL TEMPERATURE
ALL
OW
AB
LE S
610
620
630
640
650
660
670
0 2 4 6 8 10 12 14Tube Row No.
Mea
n M
etal
Tem
p.(
deg
Without OrificeOrifice_1Orifice_2
components.
Material selection mainly depends on (1) strength as a function of tensile and creep properties and 2) resistance to steam side oxidation.
Careful design of flow distribution can reduce operating conditions (3) 33
1
2
3 ME
TA
L T
EM
PE
RA
TU
RE

03.10.2018
7
Primary NOx Control: Low-NOx Combustion
System
State-of-the-Art Emissions Controls TechnologiesTypical Arrangement on Modern Plant
Secondary NOx
Flue Gas Desulphurisation
and Gas-Gas Heatercontrol: SCR
Electro-staticPrecipitator or Bag
Filter
: OFA Port: Burner
State-of-the-Art Emissions Controls TechnologiesPrimary NOx Control
TYPICAL COAL RANGE FOR NEW ASIAN PROJECT
ON
TE
NT
TYPICAL ORIGINAL DESIGN RANGE FOR UK PLANT
Front : 3 x 6 BurnersRear : 3 x 6 Burners
HIGHER HEATING VALUE
FIX
ED
CA
RB
ON
CO
Project fuel ranges become ever wider to ensure flexibility to accommodate changes in international coal sourcing.
Mature low NOx combustion systems deliver primary NOxreduction
Current performance expectation circa 200 to 300 mg/Nm3 NOx with <3% Carbon in Ash
03.10.2018
8
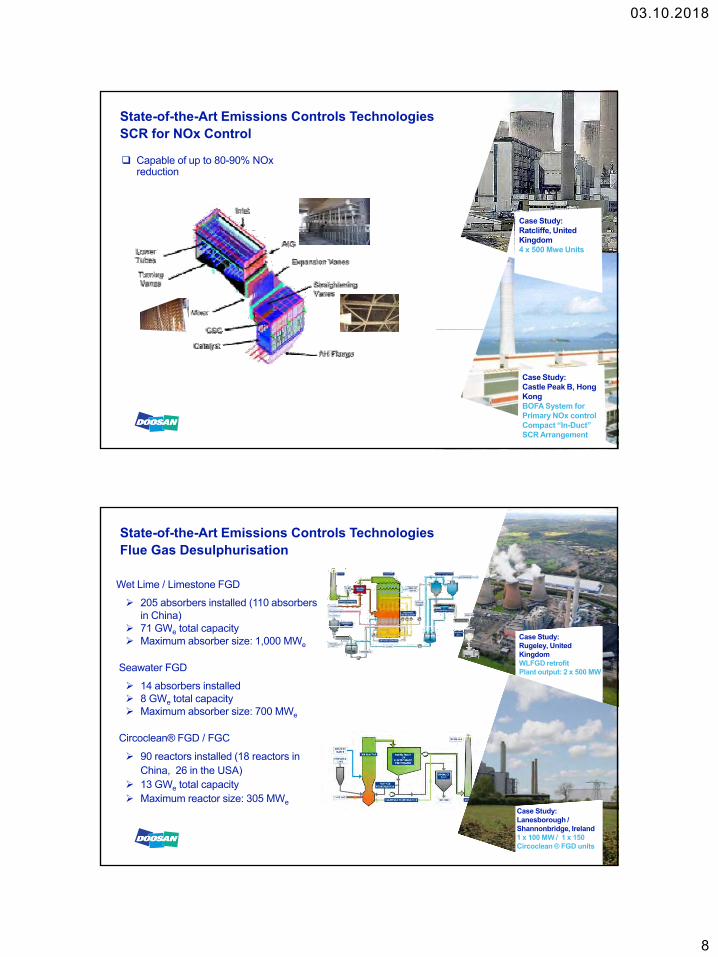
State-of-the-Art Emissions Controls TechnologiesSCR for NOx Control
Capable of up to 80-90% NOxreduction
Case Study:Ratcliffe, United Kingdom 4 x 500 Mwe Units
Case Study:Castle Peak B, Hong KongBOFA System for Primary NOx controlCompact “In-Duct” SCR Arrangement
State-of-the-Art Emissions Controls TechnologiesFlue Gas Desulphurisation
Wet Lime / Limestone FGD
205 absorbers installed (110 absorbers in China)
71 GW total capacityCase Study:Rugeley, United Kingdom WLFGD retrofit Plant output: 2 x 500 MW
71 GWe total capacity Maximum absorber size: 1,000 MWe
Seawater FGD
14 absorbers installed 8 GWe total capacity Maximum absorber size: 700 MWe
Circoclean® FGD / FGC
Case Study:Lanesborough / Shannonbridge, Ireland 1 x 100 MW / 1 x 150Circoclean ® FGD units
90 reactors installed (18 reactors in China, 26 in the USA)
13 GWe total capacity Maximum reactor size: 305 MWe

03.10.2018
9
Combustion Technology for Coal
Fuel Rank (ASTM)
SA
NT
HR
AC
ITE
TU
MIN
OU
S/
BIT
UM
INO
US
LIG
NIT
ES
UB
-BIT

03.10.2018
10
Combustion SystemLow NOx Combustion
Control the availability of Oxygen to the combustion process
Reduce peak temperatures in combustion zone
Fuel NOx preferentially goes to N2 C b i h d CO i !
BURNOUTZONEλ=1.2
Carbon in ash and CO increase!
Low NOx Burner
Ignition and flame stability High rate of de-volatilisation to get
Nitrogen out of fuel quickly Segregate air from fuel to control the rate
of NOx formationT5, F1 - VID 00128-20130124-1146.3gp
BURNERZONEλ=0.85
Combustion System Development Approach
Development Timescale 18-24 Months

03.10.2018
11
Combustion System Development Approach
½ or ¾ Geometric scaled models Pumice to represent pulverised coal Characterise outlet distribution and
pressure drop Indication of fuel drop out and erosive wear Indication of fuel drop-out and erosive wear Validation of CFD models
Combustion System Development Approach
03.10.2018
12
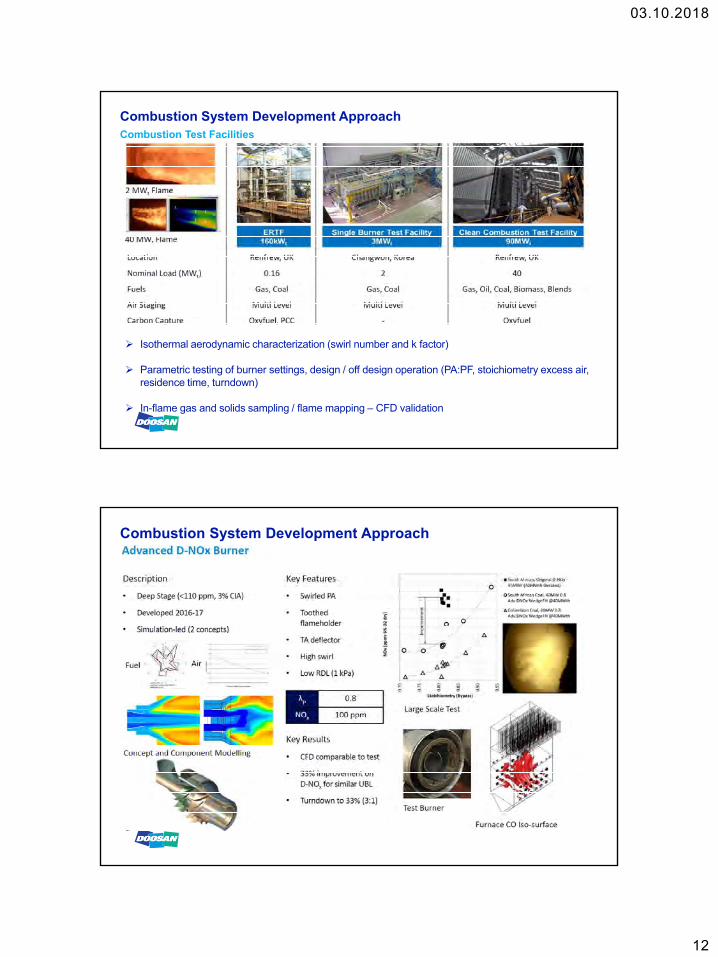
Combustion System Development ApproachCombustion Test Facilities
Isothermal aerodynamic characterization (swirl number and k factor)
Parametric testing of burner settings, design / off design operation (PA:PF, stoichiometry excess air, residence time, turndown)
In-flame gas and solids sampling / flame mapping – CFD validation
Combustion System Development Approach

03.10.2018
13
Biomass Conversion of Coal Plant
How Does a Switch to Biomass Control Emissions?
Conventional Pollutants Biomass has lower levels of pollutant causing elements such as sulphur and nitrogen
Biomass burns with a cooler flame reducing NOx
Carbon Dioxide Biomass is renewable
Biomass can lead to net carbon removal from the atmosphere in combination with CCS
CCS Carbon capture & storage

03.10.2018
14
Coal use 1990 Coal use 2015 Biomass
Sulphur % ar 1.5 0.5 0.01
Nitrogen % ar 1.4 1.2 0.11
Ash % ar 15 10 0.6
How Does a Switch to Biomass Control Emissions?
Chlorine % ar 0.3 0.02 0.01
Cleaner fuels = lower emissions
Coal use 1990 Coal use 2015 Biomass Equipment Reason for effect
SO2 mg/Nm3 3750 1250 25 No FGD Fuel S ratio
Typical values for UK marketar is “as received” All emissions at standard 6% O2 dry conditions
NOx mg/Nm3 650 500 200 Low NOx burners Fuel ratio & cooler flame
Dust mg/Nm3 50 35 ~20 ESP Fuel ratio & efficiency
HCl mg/Nm3 400 25 15 No FGD Fuel Cl ratio & CaO in ash
Coal Biomass
CO2 is renewable Emitted CO2 g/kWh, net
825 140
Lynemouth Power Station: a Good Candidate for Biomass
Closure at the end of 2015 due to lack of SOx and NOx controls to meet IED TNP limits
Biomass conversion offered a way to meet emissions limits because biomass is cleaner
Power station was becoming uneconomic due to rising price of carbon
Biomass conversion offered a way to avoid the carbon floor price because the fuel is renewable
Biomass is an expensive fuel and efficiency is important
North Sea cooling, upgraded turbines & condensers; despite moderate size and steam conditions probably UK’s most efficient coal station
Benefit of a CfD from the UK government of £105/MWh, ratified by EC, for 10 year period
Drive to maximise availability, efficiency and power output and extend life
3x140 MWe size made logistics manageable Helped gain EC approval
Power station can reuse most of the systems and components which have good residual life
Reducing capital cost for green electricity
CfD Contract for DifferenceEC European Commission
03.10.2018
15
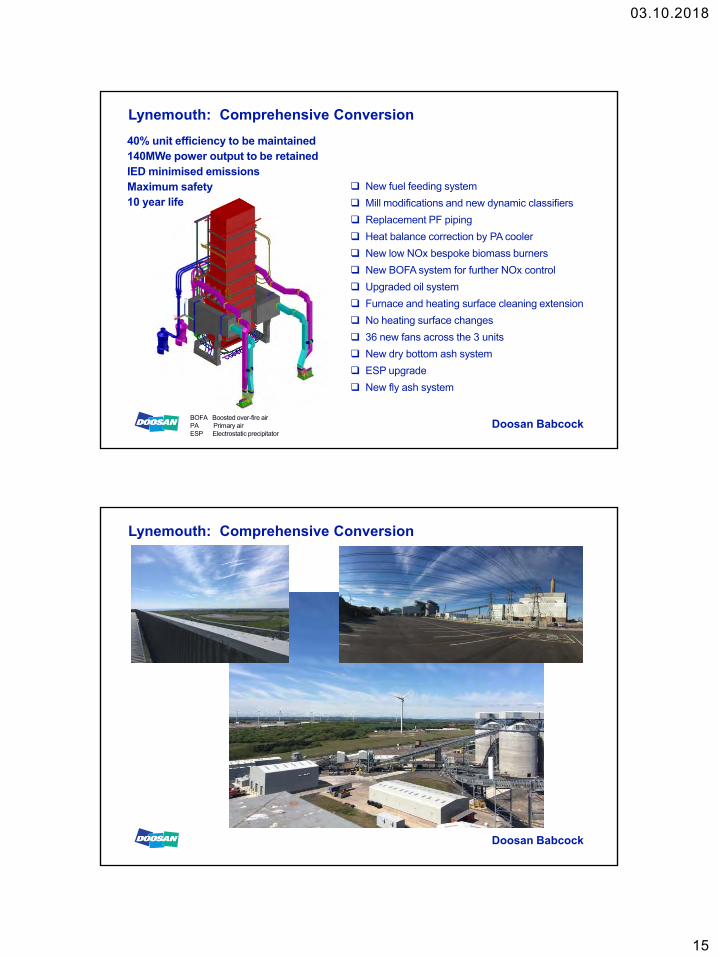
Lynemouth: Comprehensive Conversion
New fuel feeding system
Mill modifications and new dynamic classifiers
40% unit efficiency to be maintained140MWe power output to be retainedIED minimised emissionsMaximum safety10 year life
Replacement PF piping
Heat balance correction by PA cooler
New low NOx bespoke biomass burners
New BOFA system for further NOx control
Upgraded oil system
Furnace and heating surface cleaning extension
No heating surface changes
Doosan Babcock
36 new fans across the 3 units
New dry bottom ash system
ESP upgrade
New fly ash system
BOFA Boosted over-fire airPA Primary airESP Electrostatic precipitator
Lynemouth: Comprehensive Conversion
Doosan Babcock
03.10.2018
16
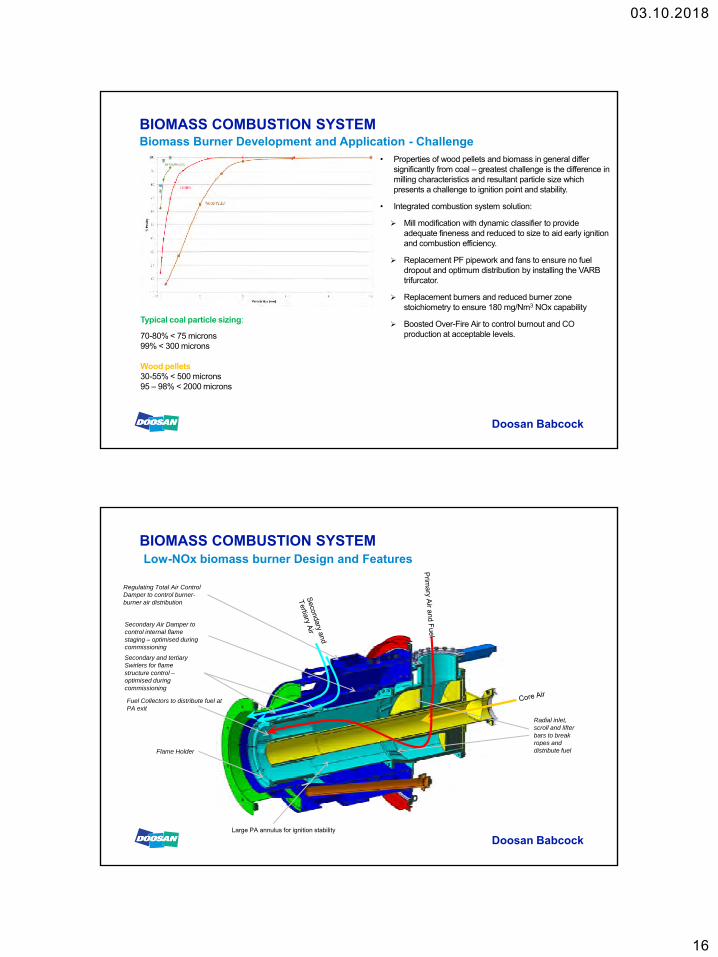
BIOMASS COMBUSTION SYSTEMBiomass Burner Development and Application - Challenge
• Properties of wood pellets and biomass in general differ significantly from coal – greatest challenge is the difference in milling characteristics and resultant particle size which presents a challenge to ignition point and stability.
• Integrated combustion system solution:
Typical coal particle sizing:
g y
Mill modification with dynamic classifier to provide adequate fineness and reduced to size to aid early ignition and combustion efficiency.
Replacement PF pipework and fans to ensure no fuel dropout and optimum distribution by installing the VARB trifurcator.
Replacement burners and reduced burner zone stoichiometry to ensure 180 mg/Nm3 NOx capability
Boosted Over-Fire Air to control burnout and CO
Doosan Babcock
70-80% < 75 microns99% < 300 microns
Wood pellets30-55% < 500 microns95 – 98% < 2000 microns
production at acceptable levels.
BIOMASS COMBUSTION SYSTEMLow-NOx biomass burner Design and Features
Regulating Total Air Control Damper to control burner-burner air distribution
Secondary Air Damper to Secondary Air Damper to control internal flame staging – optimised during commissioning
Secondary and tertiary Swirlers for flame structure control –optimised during commissioning
Fuel Collectors to distribute fuel at PA exit
Radial inlet, scroll and lifter bars to break ropes and
Doosan Babcock
pdistribute fuelFlame Holder
Large PA annulus for ignition stability

03.10.2018
17
BIOMASS COMBUSTION SYSTEMBoosted Over Fire Air
Arch
Burnout Residence 1.0s Nose
Boosted Over Fire Air Stoichiometry 1.15 full load
Burner Zone Stoichiometry ~0.9 full load
Average Staged Residence Time for NOx
Time<1.
5s
Arch
Doosan Babcock
Front Side
BOFA
Velocity Magnitude (m/s) BOFA Mass Fraction (%)
• Boosted OFA achieves generous staged residence time for NOxcontrol whilst also giving sufficient burn-out residence time to control combustion efficiency.
• Anticipated NCV loss 0.5% and CO < 250 mg/Nm3
• BOFA Port velocity 80 m/s with front and side-wall ports position optimised via CFD mixing study.
BIOMASS COMBUSTION SYSTEMFuel Delivery
New Dynamic Classifier
Target Fineness:
Retained Original scheme of 3 lines per mill with trifurcators
Increased transport velocityg55% < 0.5 mm98% < 2mm
New Cone to distribute fuel
Extended Fuel Inlet Pipe
Block centre hole of roller to
Increased transport velocity to avoid PF drop out
Doosan Babcock
Higher velocity throat
eliminate hold-up
VARB
03.10.2018
18
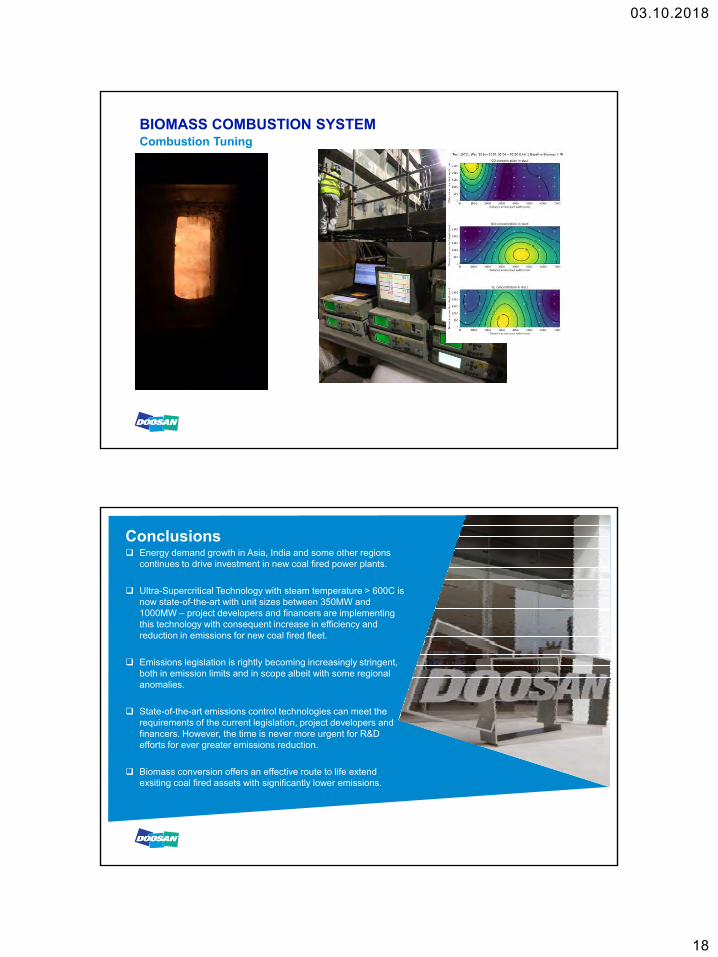
BIOMASS COMBUSTION SYSTEMCombustion Tuning
Conclusions Energy demand growth in Asia, India and some other regions
continues to drive investment in new coal fired power plants.
Ultra-Supercritical Technology with steam temperature > 600C is now state-of-the-art with unit sizes between 350MW and 1000MW – project developers and financers are implementing this technology with consequent increase in efficiency andthis technology with consequent increase in efficiency and reduction in emissions for new coal fired fleet.
Emissions legislation is rightly becoming increasingly stringent, both in emission limits and in scope albeit with some regional anomalies.
State-of-the-art emissions control technologies can meet the requirements of the current legislation, project developers and financers. However, the time is never more urgent for R&D efforts for ever greater emissions reductionefforts for ever greater emissions reduction.
Biomass conversion offers an effective route to life extend exsiting coal fired assets with significantly lower emissions.

03.10.2018
19
Thank you
Questions?
BIOMASS COMBUSTION SYSTEMBiomass Burner Development and Application
20152011 2017
TILBURY
Single Stage
IRONBRIDGE
Single Stage
M difi d R bt B
DRAX
Two Stage
M difi d MK III B
CCTF
Low NOx Two Stage
Yeong Dong 1
Low NOx Two Stage
C i f
Doosan Babcock
Modified MK III Burner
- Reduced CA tube size to reduce PA velocity via PA annulus area increase
Modified Robtas Burner
- Reduced CA tube size 9 to 6 in to reduce PA annular velocity to 20 m/s via PA annulus area increase
- Modifications to fuel delivery (removal of collectors, straighteners and lifter bars) to generate stable ignition
Modified MK III Burner
- Reduced PA velocity
- Single air register
Verification of optimised MK III burner for two-stage Biomass firing:
- Large PA annulus
- Dual register design
- 45-50% NOx reduction
Conversion of 125MW plant with downshot fired boiler