Embed Size (px)
Citation preview
8/3/2019 Coagulation Study
http://slidepdf.com/reader/full/coagulation-study 1/57
8/3/2019 Coagulation Study
http://slidepdf.com/reader/full/coagulation-study 2/57
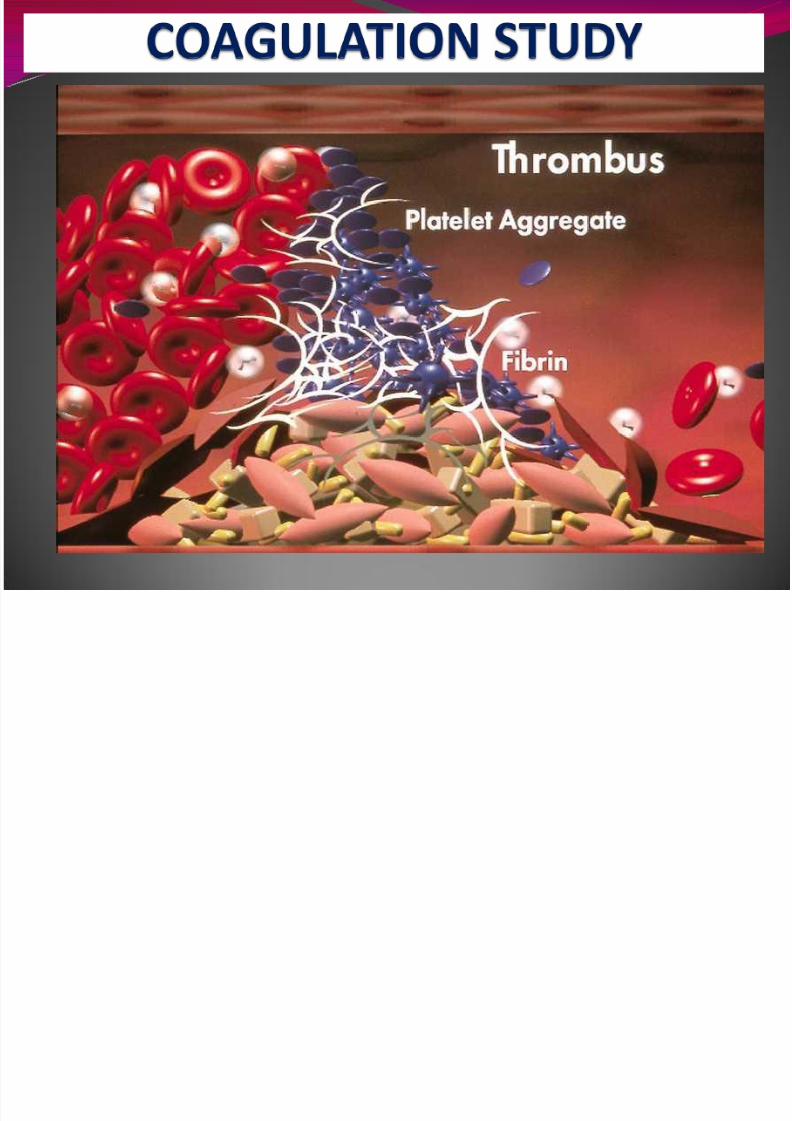
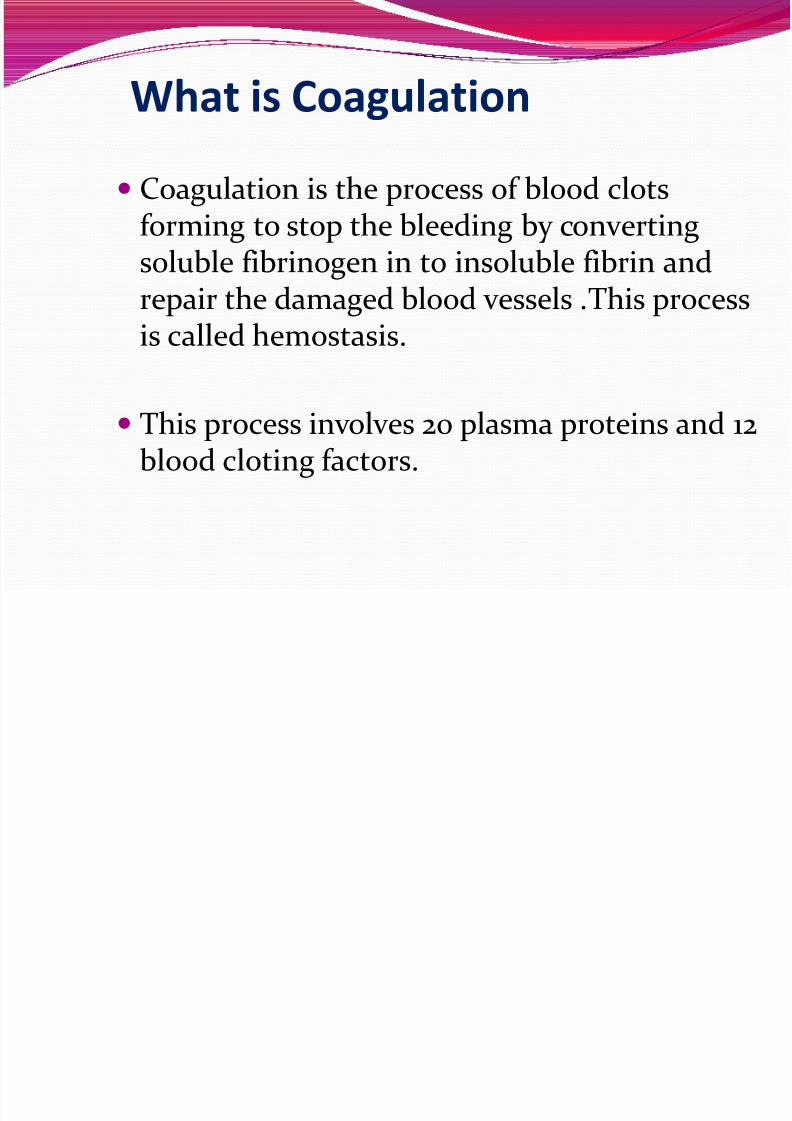
What is Coagulation
Coagulation is the process of blood clotsforming to stop the bleeding by converting
soluble fibrinogen in to insoluble fibrin andrepair the damaged blood vessels .This processis called hemostasis.
This process involves 20 plasma proteins and 12blood cloting factors.
8/3/2019 Coagulation Study
http://slidepdf.com/reader/full/coagulation-study 3/57
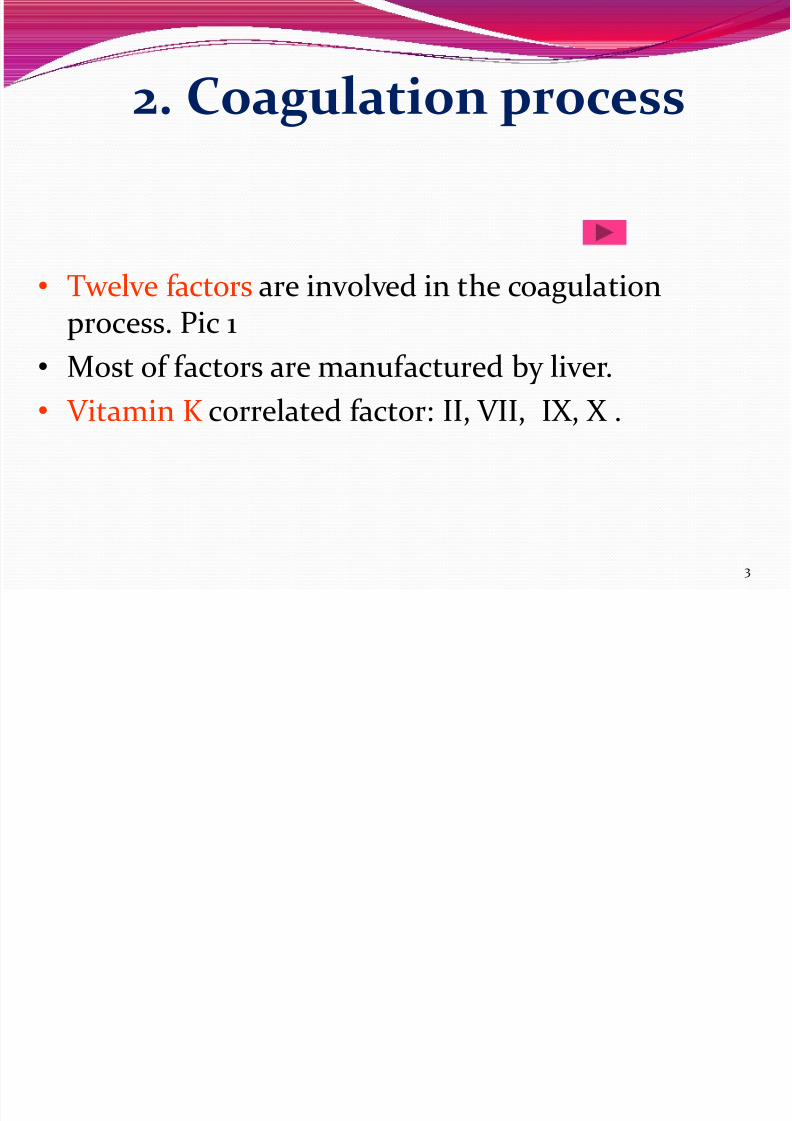
2. Coagulation process
3
• Twelve factors are involved in the coagulationprocess. Pic 1
• Most of factors are manufactured by liver.
• Vitamin K correlated factor: II, VII, IX, X .

8/3/2019 Coagulation Study
http://slidepdf.com/reader/full/coagulation-study 4/57

8/3/2019 Coagulation Study
http://slidepdf.com/reader/full/coagulation-study 5/57
8/3/2019 Coagulation Study
http://slidepdf.com/reader/full/coagulation-study 6/57
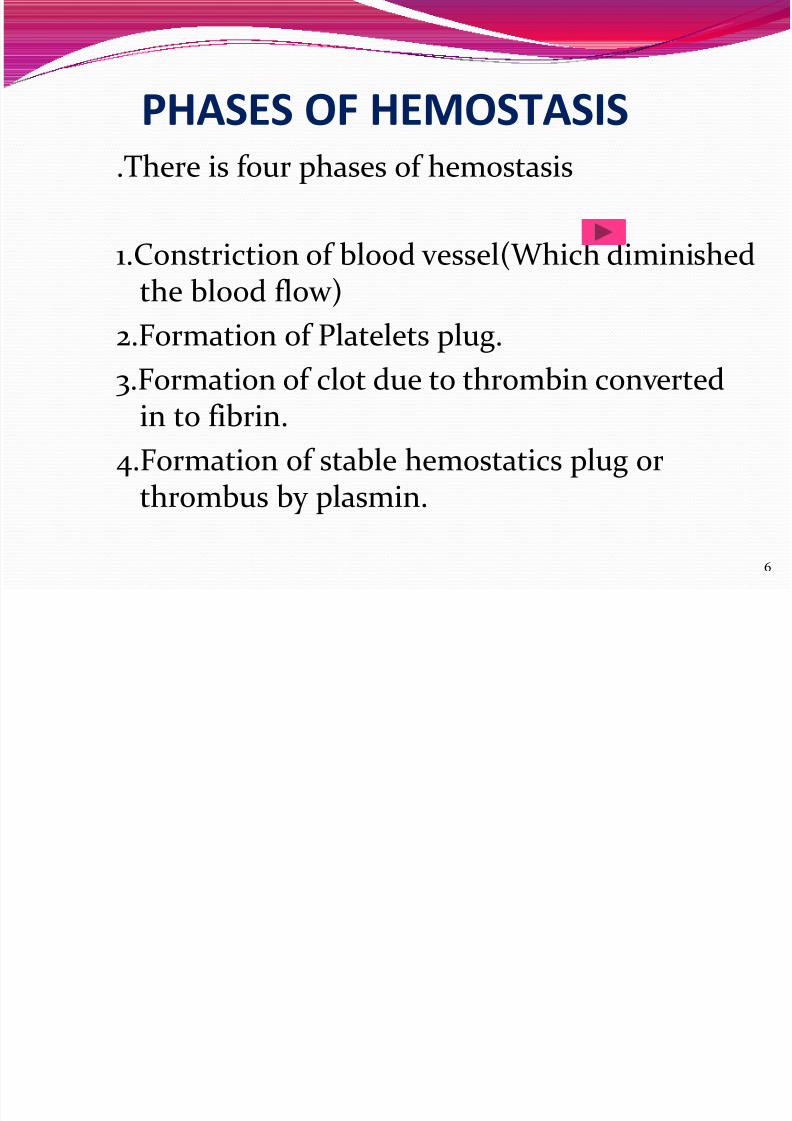
PHASES OF HEMOSTASIS.There is four phases of hemostasis
1.Constriction of blood vessel(Which diminishedthe blood flow)
2.Formation of Platelets plug.
3.Formation of clot due to thrombin converted
in to fibrin.4.Formation of stable hemostatics plug or
thrombus by plasmin.
6
8/3/2019 Coagulation Study
http://slidepdf.com/reader/full/coagulation-study 7/57
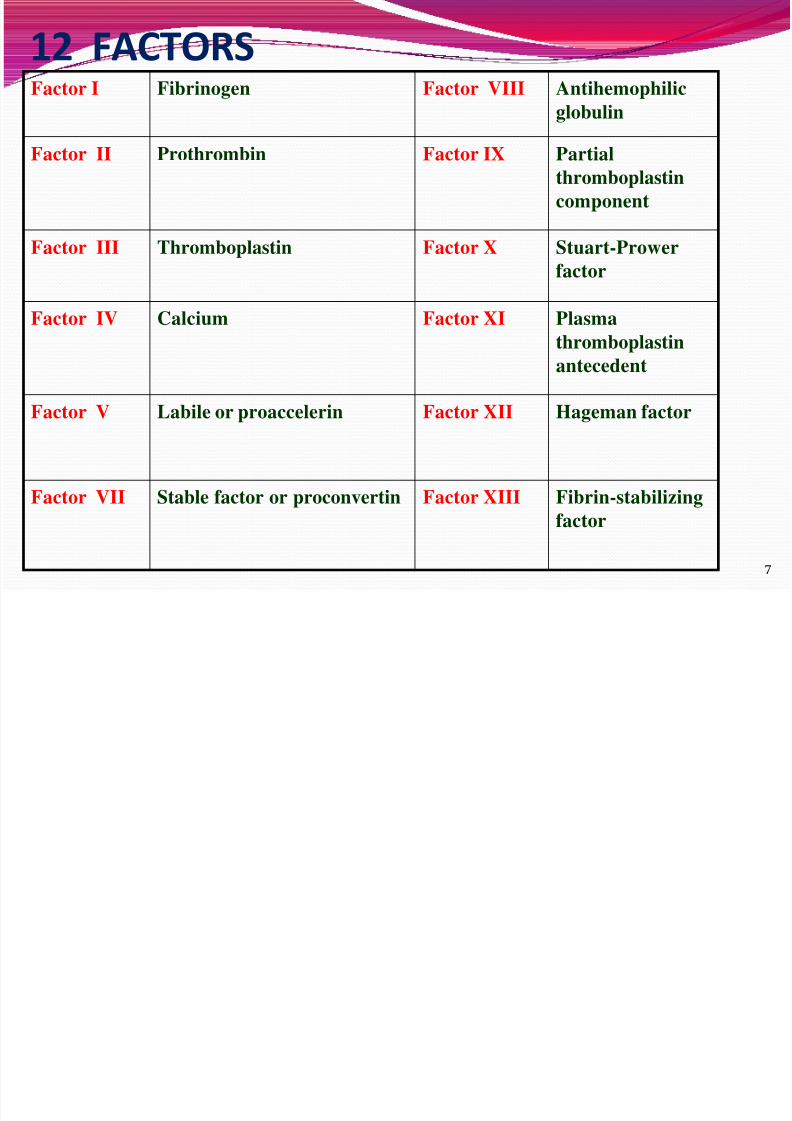
12 FACTORS
7
Factor I Fibrinogen Factor VIII Antihemophilic
globulin
Factor II Prothrombin Factor IX Partial
thromboplastin
component
Factor III Thromboplastin Factor X Stuart-Prower
factor
Factor IV Calcium Factor XI Plasma
thromboplastin
antecedent
Factor V Labile or proaccelerin Factor XII Hageman factor
Factor VII Stable factor or proconvertin Factor XIII Fibrin-stabilizing
factor
8/3/2019 Coagulation Study
http://slidepdf.com/reader/full/coagulation-study 8/57
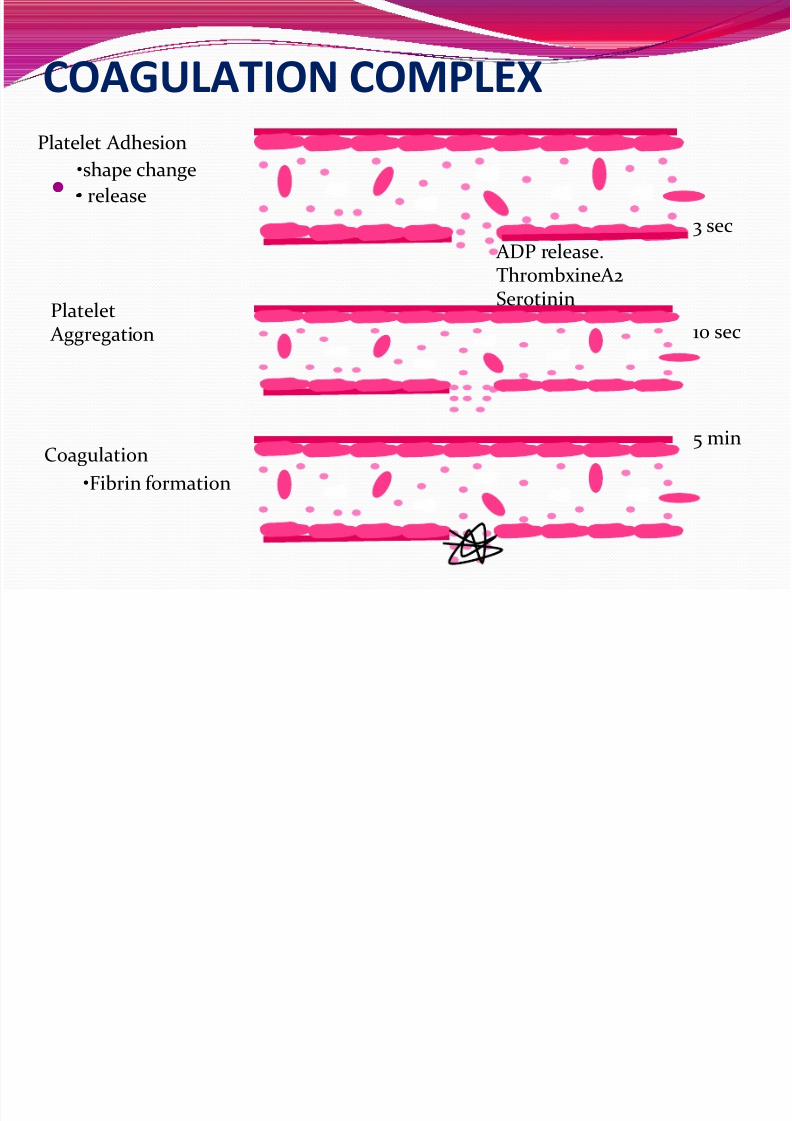
COAGULATION COMPLEX
.
Platelet Adhesion•shape change
• release
ADP release.
ThrombxineA2Serotinin
Platelet Aggregation
Coagulation
•Fibrin formation
3 sec
10 sec
5 min
8/3/2019 Coagulation Study
http://slidepdf.com/reader/full/coagulation-study 9/57
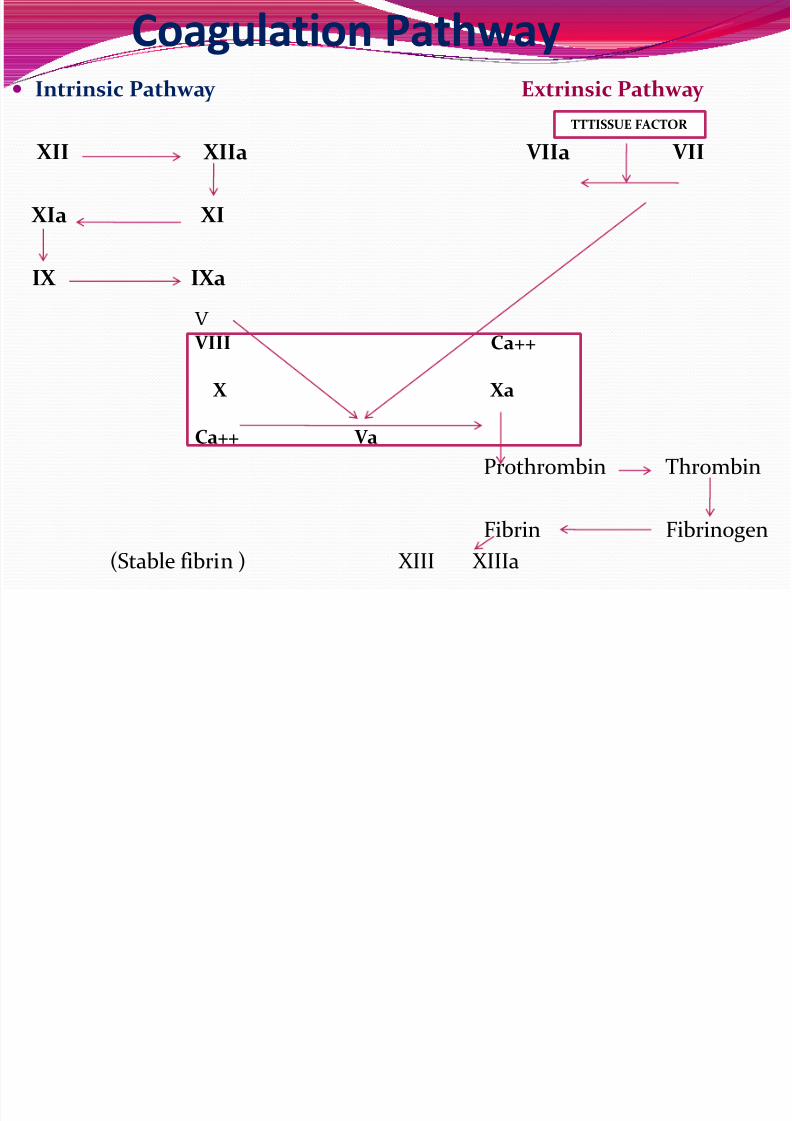
Coagulation Pathway Intrinsic Pathway Extrinsic Pathway
XII XIIa VIIa VII
XIa XI
IX IXa
Prothrombin Thrombin
Fibrin Fibrinogen
(Stable fibrin ) XIII XIIIa
TTTISSUE FACTOR
V VIII Ca++
X Xa
Ca++ Va
8/3/2019 Coagulation Study
http://slidepdf.com/reader/full/coagulation-study 10/57
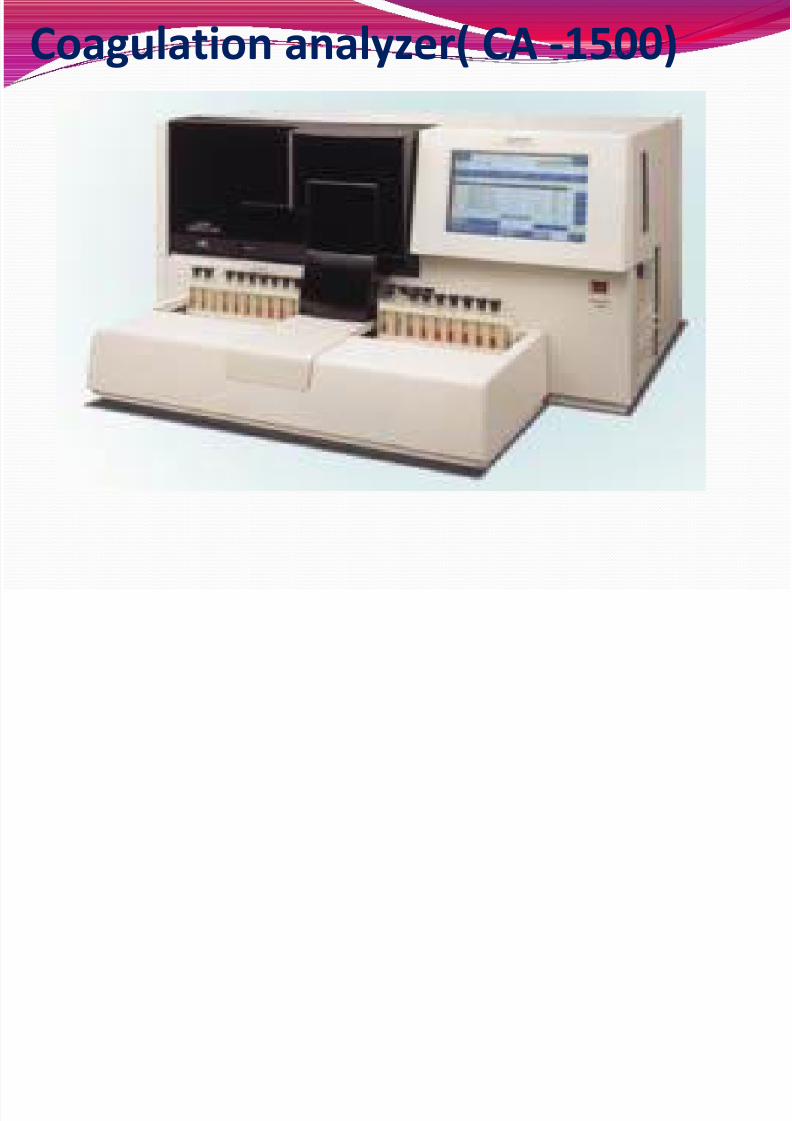
Coagulation analyzer( CA -1500)
8/3/2019 Coagulation Study
http://slidepdf.com/reader/full/coagulation-study 11/57
Principle
Analyzer worked on three Principle.
1.Clotting Method.
2.Chromogenic Method.
3. Immunology Method.
8/3/2019 Coagulation Study
http://slidepdf.com/reader/full/coagulation-study 12/57
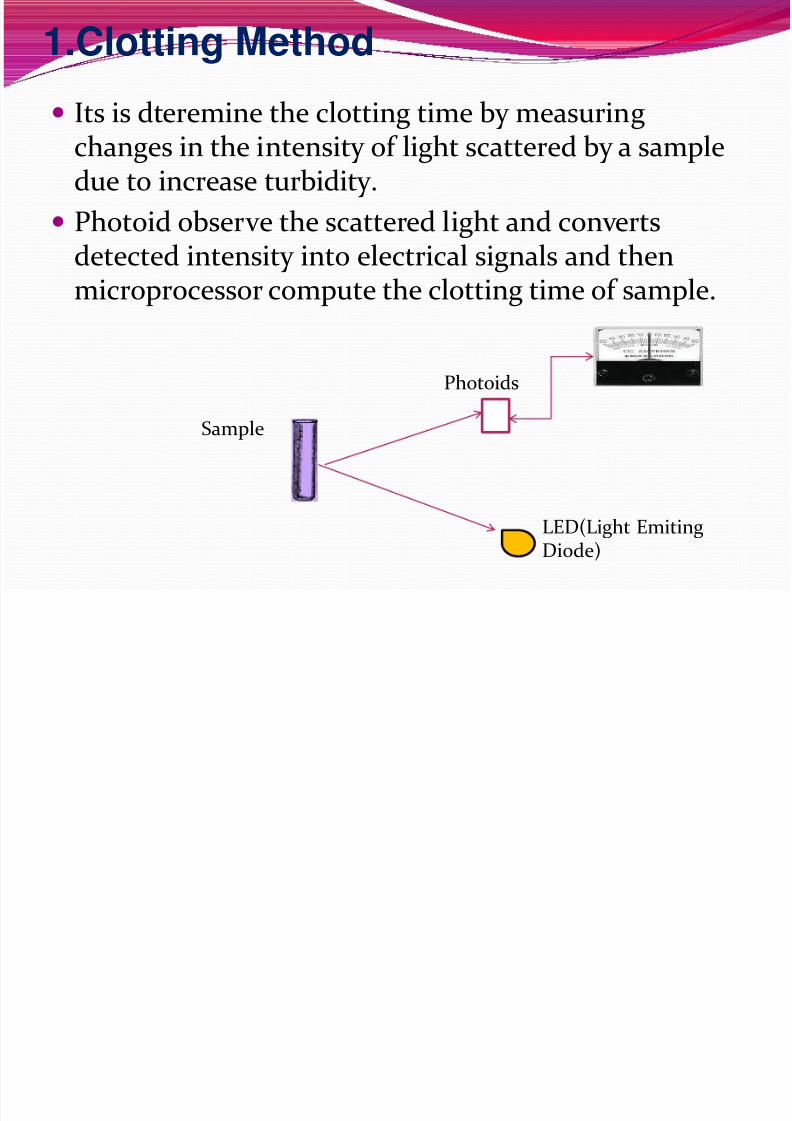
1.Clotting Method
Its is dteremine the clotting time by measuring
changes in the intensity of light scattered by a sampledue to increase turbidity.
Photoid observe the scattered light and convertsdetected intensity into electrical signals and thenmicroprocessor compute the clotting time of sample.
Sample
Photoids
LED(Light Emiting
Diode)
8/3/2019 Coagulation Study
http://slidepdf.com/reader/full/coagulation-study 13/57
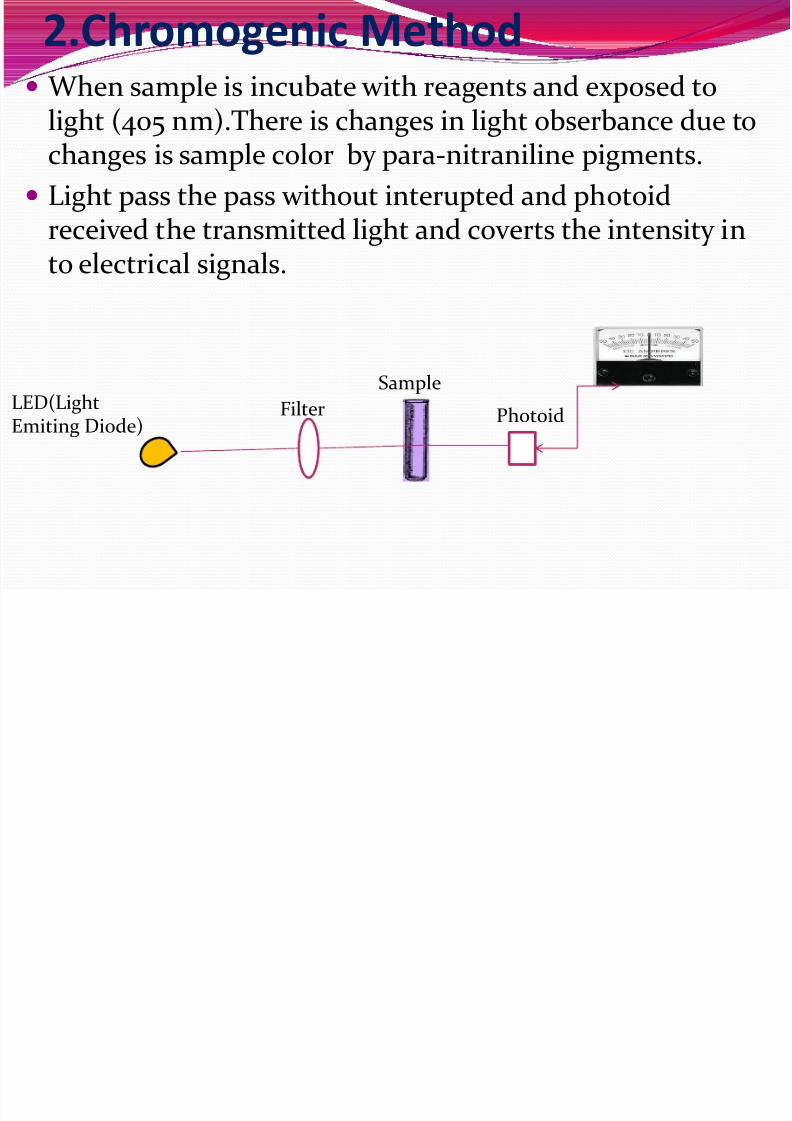
2.Chromogenic Method When sample is incubate with reagents and exposed to
light (405 nm).There is changes in light obserbance due tochanges is sample color by para-nitraniline pigments.
Light pass the pass without interupted and photoidreceived the transmitted light and coverts the intensity in
to electrical signals.
Sample
PhotoidFilterLED(LightEmiting Diode)
8/3/2019 Coagulation Study
http://slidepdf.com/reader/full/coagulation-study 14/57
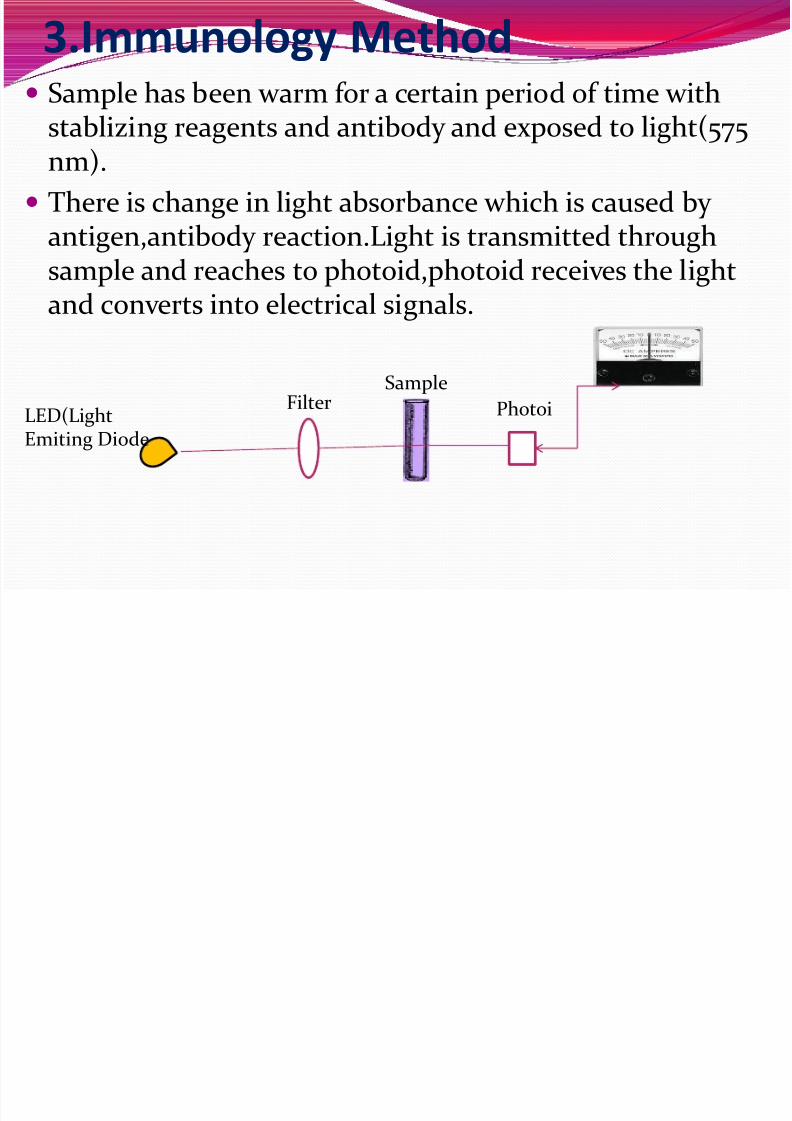
3.Immunology Method Sample has been warm for a certain period of time with
stablizing reagents and antibody and exposed to light(575nm).
There is change in light absorbance which is caused by antigen,antibody reaction.Light is transmitted through
sample and reaches to photoid,photoid receives the lightand converts into electrical signals.
LED(LightEmiting Diode
FilterSample
Photoi
8/3/2019 Coagulation Study
http://slidepdf.com/reader/full/coagulation-study 15/57
Clinical approach for bleeding
disorder
1.The patients who have to go under major surjery.
2.Patients who have history of spontaneousbleeding
After trauma or surgery.
3.The hemorrahagic disorders are either inheritedor acquired.
8/3/2019 Coagulation Study
http://slidepdf.com/reader/full/coagulation-study 16/57
Sreening for bleeding disorders
1.Bleeding time
2.Clotting time 3.Prothrombin time
4.Partial thromboplastin time
5.Fibrinogen determination
8/3/2019 Coagulation Study
http://slidepdf.com/reader/full/coagulation-study 17/57
Procedure for sample collection 1.Venous sample should be collected in (light blue
tube)3.2% sodium citrate of ratio is 1:9.
Centrifuge the blood specimen 1500 x g for 15minutes at room temperature.
2.Reject sample if collect in 3.8 % sodium citrarate.
3.Needle size should be 20-25 gauze to prevent
cloting or hemolysis. 4.Visisble hemolysis sample should be rejected.
5.Test must be performed with in 4 hour,s of collection.
8/3/2019 Coagulation Study
http://slidepdf.com/reader/full/coagulation-study 18/57
1.Bleeding Time.( Ivy’s Method)
This is a test that measures the speed at whichsmall blood vessels close off to stop bleeding (thecondition of the blood vessels) and plateletfunction
18 1
8/3/2019 Coagulation Study
http://slidepdf.com/reader/full/coagulation-study 19/57
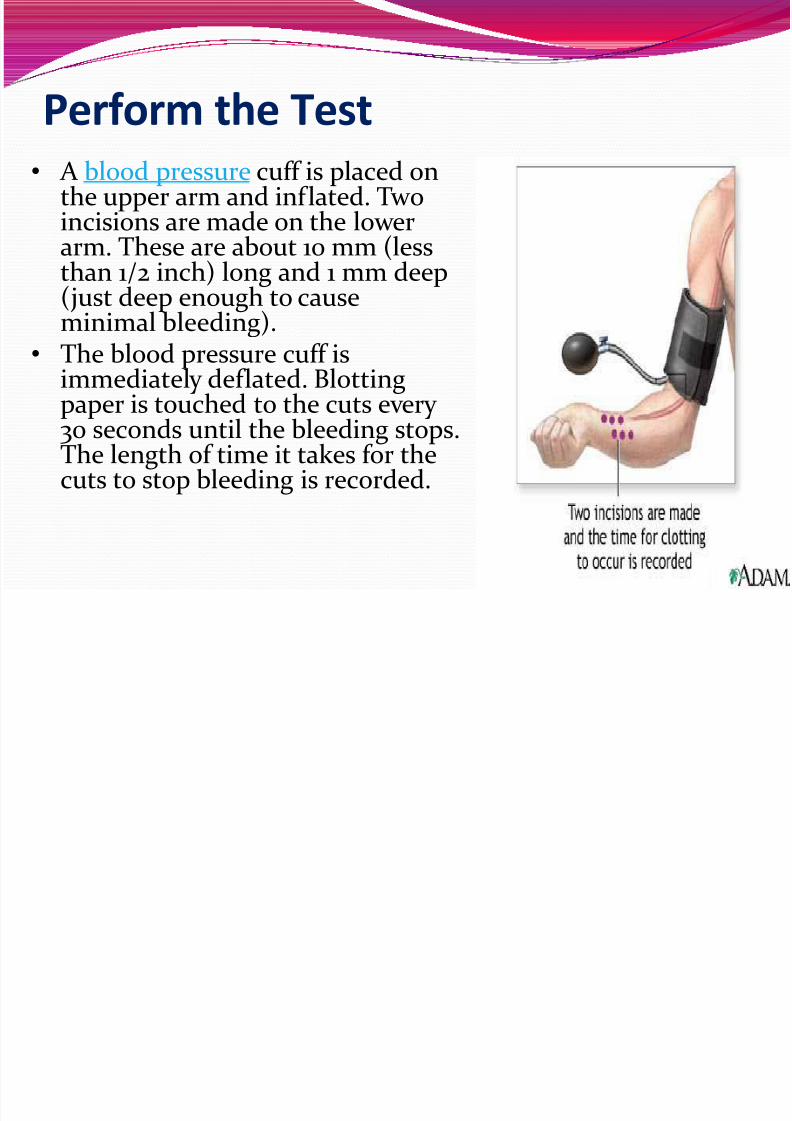
Perform the Test
• A blood pressure cuff is placed onthe upper arm and inflated. Twoincisions are made on the lowerarm. These are about 10 mm (less
than 1/2 inch) long and 1 mm deep(just deep enough to causeminimal bleeding).
• The blood pressure cuff isimmediately deflated. Blotting
paper is touched to the cuts every 30 seconds until the bleeding stops.The length of time it takes for thecuts to stop bleeding is recorded.
8/3/2019 Coagulation Study
http://slidepdf.com/reader/full/coagulation-study 20/57
Normal Values
The bleeding stops within 1 to 9 minutes (what isconsidered normal varies from lab to lab,depending on how the test is measured).
8/3/2019 Coagulation Study
http://slidepdf.com/reader/full/coagulation-study 21/57
Elevated Values A vascular (blood vessel) defect
Thrombocytopenia (low platelets)
Severe liver disease Von Willebrand's disease
Drugs that may increase bleeding times include
dextran, indomethacin, and salicylates (includingaspirin).
DIC
Aplastic anaemia.
8/3/2019 Coagulation Study
http://slidepdf.com/reader/full/coagulation-study 22/57
CT (Clotting Time)Capillary or Wright
Principle Blood is collected in a capillary tube after finger
prick and the stop watch is started.The formation of
fibrin string is noted by breaking the capillary tubeafter every 30 seconds of intervals and the time isnoted at the first appearance of the fibrin string.
Normal Range
4 – 10 minutes
8/3/2019 Coagulation Study
http://slidepdf.com/reader/full/coagulation-study 23/57
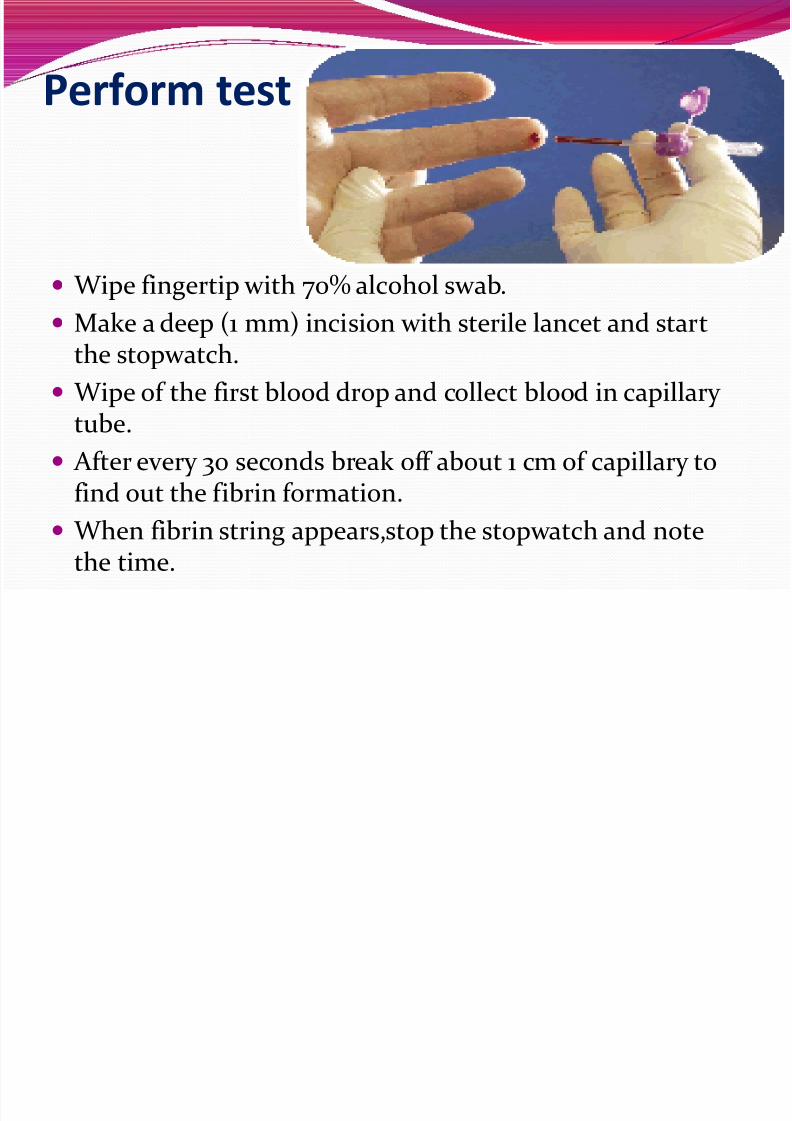
Perform test
Wipe fingertip with 70% alcohol swab. Make a deep (1 mm) incision with sterile lancet and start
the stopwatch.
Wipe of the first blood drop and collect blood in capillary
tube. After every 30 seconds break off about 1 cm of capillary to
find out the fibrin formation.
When fibrin string appears,stop the stopwatch and note
the time.
8/3/2019 Coagulation Study
http://slidepdf.com/reader/full/coagulation-study 24/57
Elevated Values
This is generally used in severe clotting disorder.
1.Any deficiency of Factor. 2.Or hyperheparinemia.
8/3/2019 Coagulation Study
http://slidepdf.com/reader/full/coagulation-study 25/57
3. Prothrombin Time PT measure the factors in Extrinsic way such as
Factors II,V, VII and X II, VII , IX, X, are manufactured by liver and
required Vitamin K.
PT alse used to measure the effectiveness of thecoumarin type of anticoagulation drugs, such as warfarin.
Principal of the Method
The coagulation process is triggered by incubationof plasma with the optimal amount of thromboplastin with calcium.The time to
formation of the fibrin clot is then measured.
8/3/2019 Coagulation Study
http://slidepdf.com/reader/full/coagulation-study 26/57
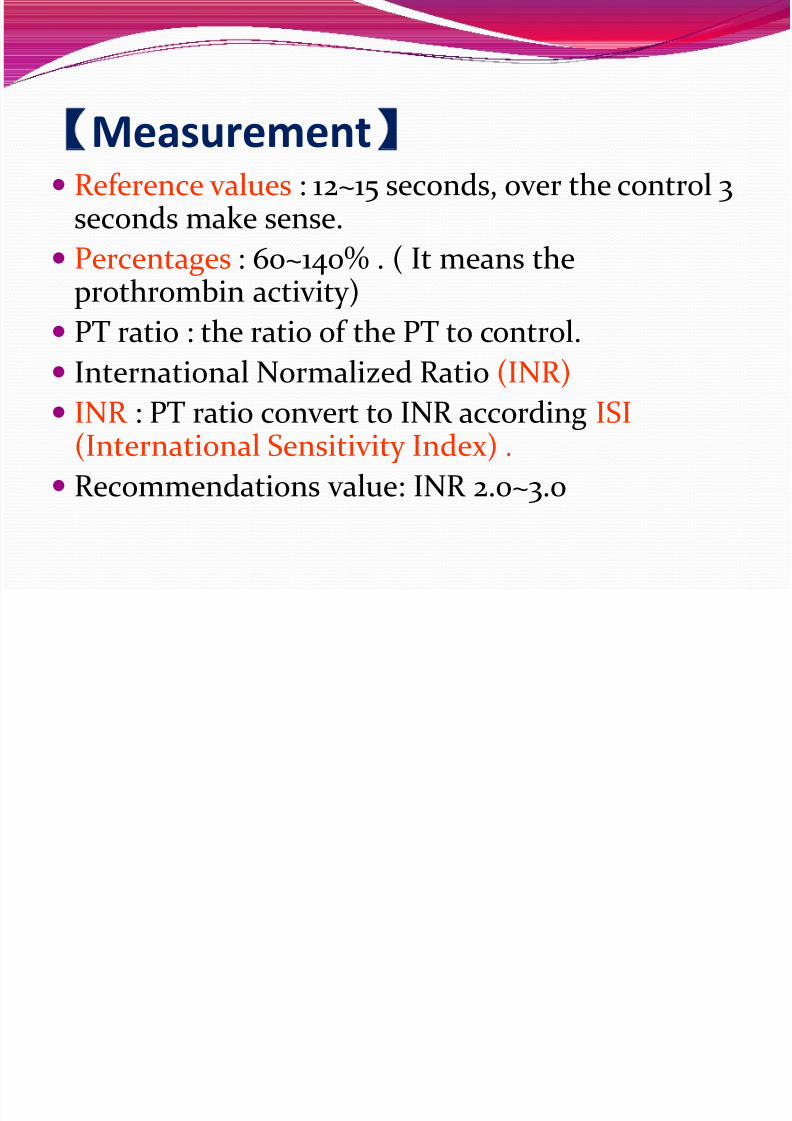
【Measurement】 Reference values : 12~15 seconds, over the control 3seconds make sense.
Percentages : 60~140% . ( It means theprothrombin activity)
PT ratio : the ratio of the PT to control.
International Normalized Ratio (INR)
INR : PT ratio convert to INR according ISI(International Sensitivity Index) .
Recommendations value: INR 2.0~3.0
8/3/2019 Coagulation Study
http://slidepdf.com/reader/full/coagulation-study 27/57
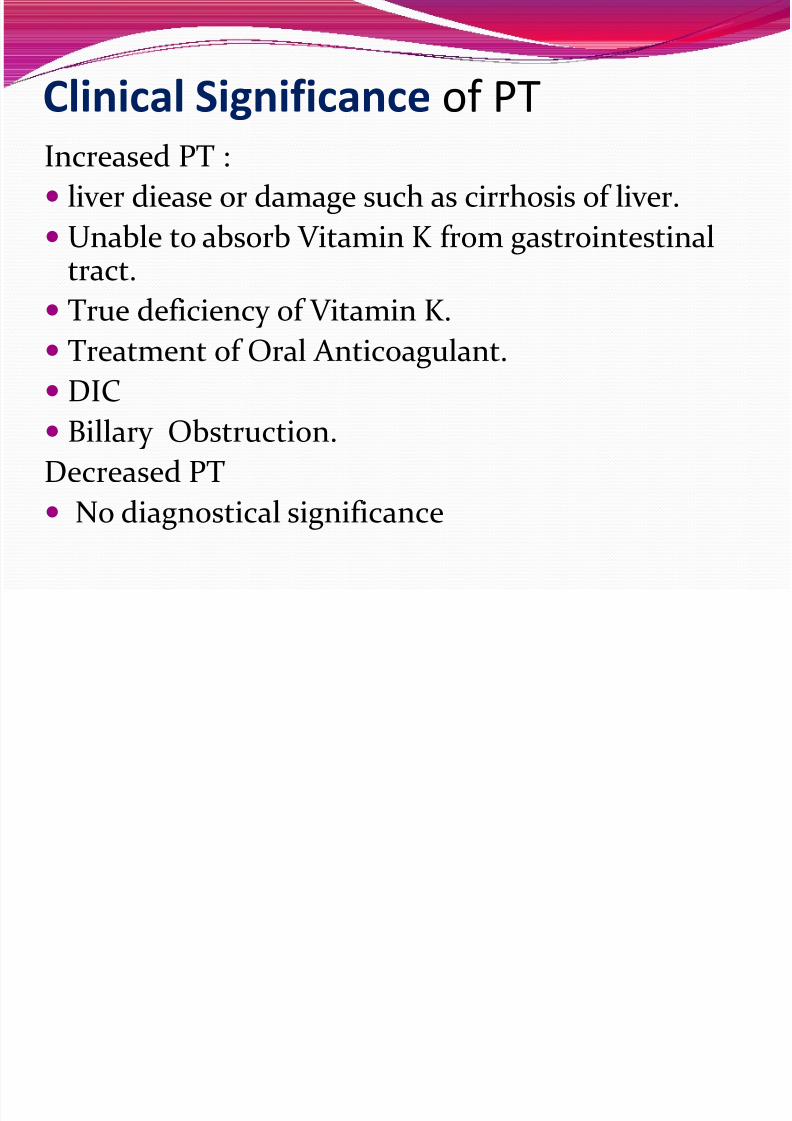
Clinical Significance of PT
Increased PT :
liver diease or damage such as cirrhosis of liver.
Unable to absorb Vitamin K from gastrointestinal
tract. True deficiency of Vitamin K.
Treatment of Oral Anticoagulant.
DIC
Billary Obstruction.
Decreased PT
No diagnostical significance
8/3/2019 Coagulation Study
http://slidepdf.com/reader/full/coagulation-study 28/57
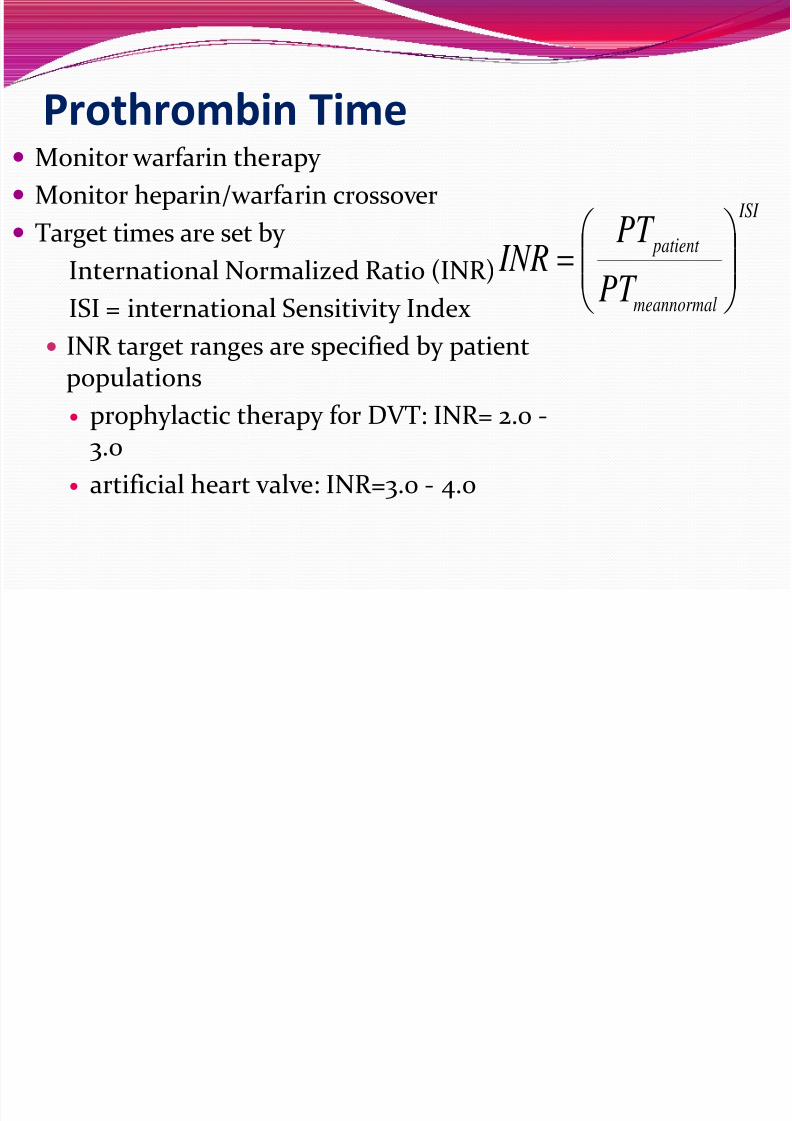
Prothrombin Time Monitor warfarin therapy
Monitor heparin/warfarin crossover
Target times are set by
International Normalized Ratio (INR)ISI = international Sensitivity Index
INR target ranges are specified by patientpopulations
prophylactic therapy for DVT: INR= 2.0 -3.0
artificial heart valve: INR=3.0 - 4.0
ISI
meannormal
patient
PT
PT INR
8/3/2019 Coagulation Study
http://slidepdf.com/reader/full/coagulation-study 29/57
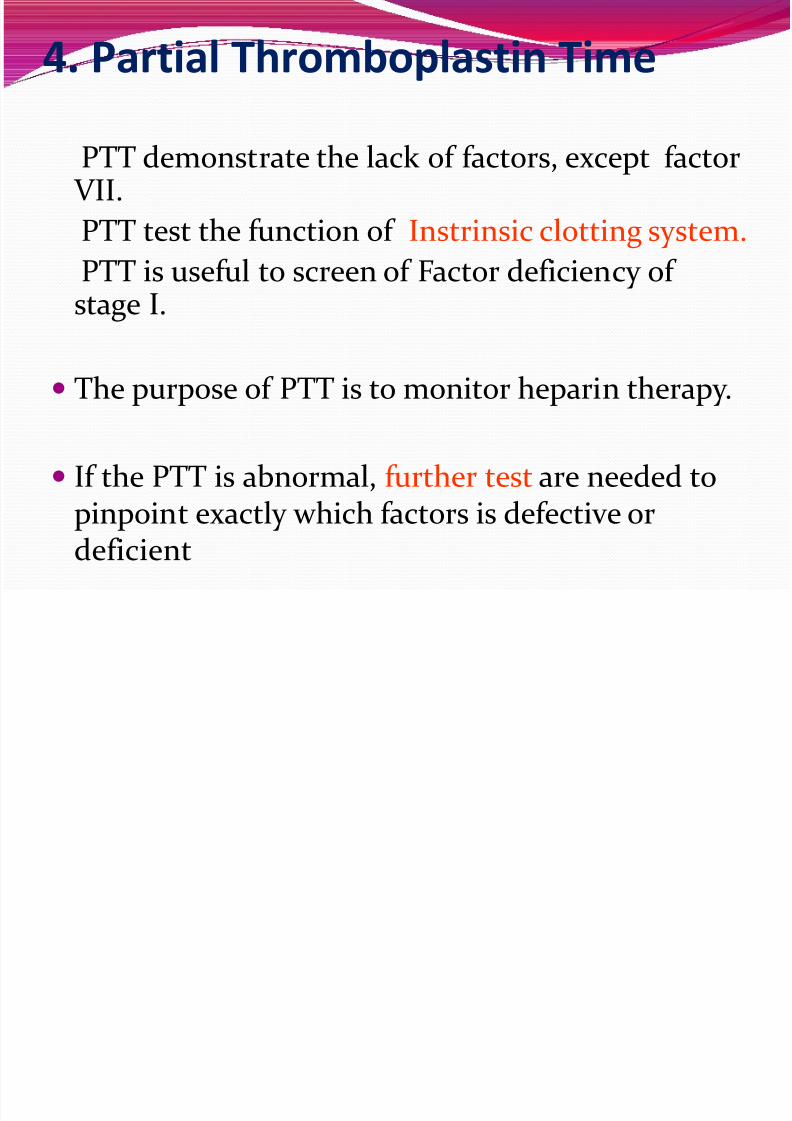
4. Partial Thromboplastin Time
PTT demonstrate the lack of factors, except factor VII.
PTT test the function of Instrinsic clotting system.
PTT is useful to screen of Factor deficiency of stage I.
The purpose of PTT is to monitor heparin therapy.
If the PTT is abnormal, further test are needed topinpoint exactly which factors is defective or
deficient
8/3/2019 Coagulation Study
http://slidepdf.com/reader/full/coagulation-study 30/57
Principle of the method Factors of the intrinsic coagulation system are
activated by incubating the plasma with theoptimal amount of phospholipids and surfaceactivator.The addition of calcium ions triggers the
coagulation process,and the clotting time is thenmeasured
Reference value: 22~34 seconds
8/3/2019 Coagulation Study
http://slidepdf.com/reader/full/coagulation-study 31/57
Clinical Significance in PTTIncrease PTT
Lack of factor VIII------Hemophilia A
Lack of factor IX------ Hemophilia B DIC
Presence of non-specific inhibitor lupus likeanticoagulant.
In patient receiving oral anticoagulant.
Decrease PTT
No diagnostical significance
8/3/2019 Coagulation Study
http://slidepdf.com/reader/full/coagulation-study 32/57
Determination of Fibrinogen
Fibrinogen (Factor I ) determination gives ideaabout coagulation stage 3 defects.
Fibrinogen is a plasma protein which is convertedfrom a soluble protein to an insoluble polymer by
the action of thrombin resulting in the formationfibrin clot.
Principle
Reference Range
200 to 400 mg/dl
8/3/2019 Coagulation Study
http://slidepdf.com/reader/full/coagulation-study 33/57
Clinical significance
Depressed Value are formed
Acquired hypofibrinogenemia.
Congenital hypofibrinogenemia.
Elevated Values
Hyperfibrinogenemia
Cardiovascular disease.
8/3/2019 Coagulation Study
http://slidepdf.com/reader/full/coagulation-study 34/57
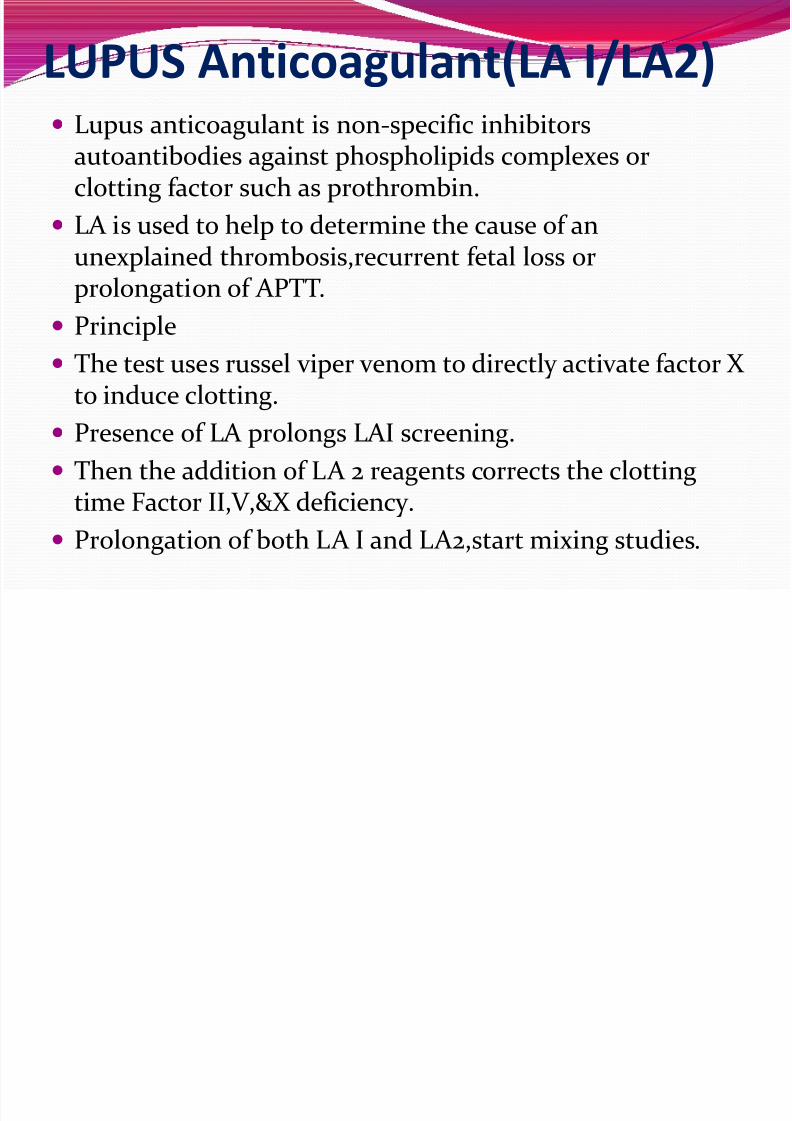
LUPUS Anticoagulant(LA I/LA2) Lupus anticoagulant is non-specific inhibitors
autoantibodies against phospholipids complexes orclotting factor such as prothrombin.
LA is used to help to determine the cause of anunexplained thrombosis,recurrent fetal loss or
prolongation of APTT. Principle
The test uses russel viper venom to directly activate factor X to induce clotting.
Presence of LA prolongs LAI screening.
Then the addition of LA 2 reagents corrects the clottingtime Factor II,V,&X deficiency.
Prolongation of both LA I and LA2,start mixing studies.
8/3/2019 Coagulation Study
http://slidepdf.com/reader/full/coagulation-study 35/57
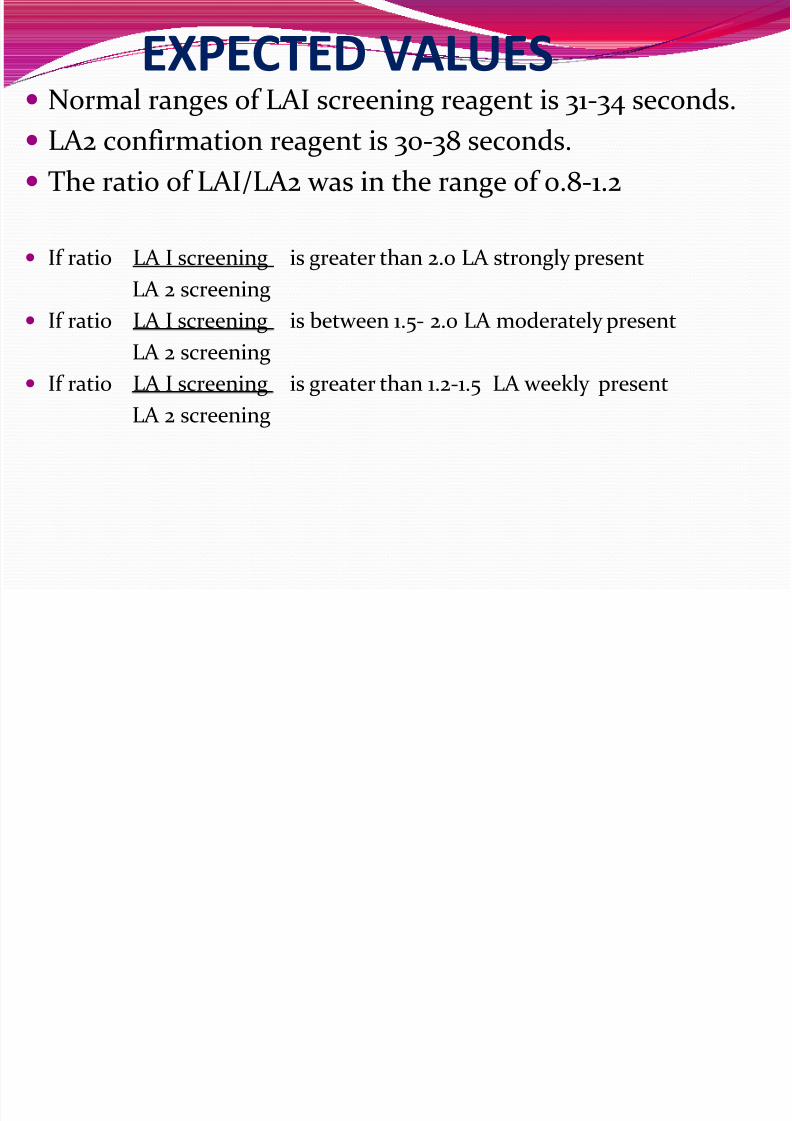
EXPECTED VALUES Normal ranges of LAI screening reagent is 31-34 seconds.
LA2 confirmation reagent is 30-38 seconds. The ratio of LAI/LA2 was in the range of 0.8-1.2
If ratio LA I screening is greater than 2.0 LA strongly present
LA 2 screening
If ratio LA I screening is between 1.5- 2.0 LA moderately present
LA 2 screening
If ratio LA I screening is greater than 1.2-1.5 LA weekly present
LA 2 screening
8/3/2019 Coagulation Study
http://slidepdf.com/reader/full/coagulation-study 36/57
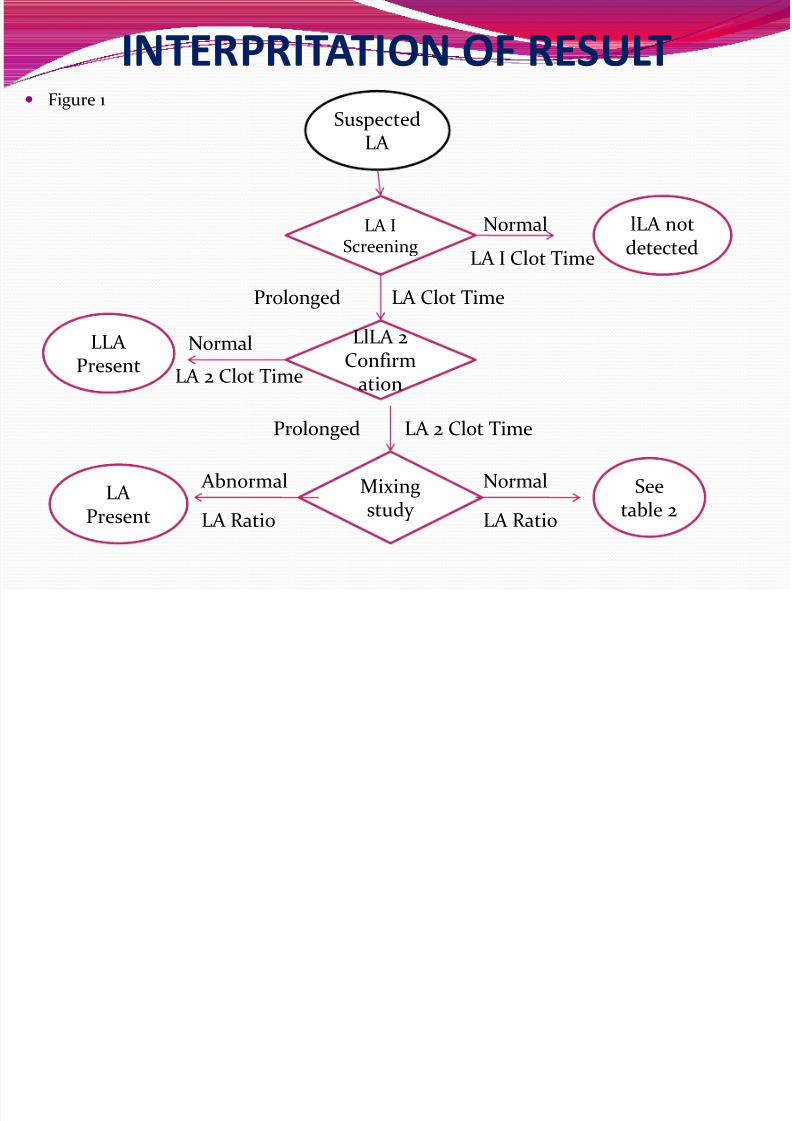
INTERPRITATION OF RESULT Figure 1
Suspected
LA
LA IScreening
LlLA 2Confirm
ation
Mixingstudy
lLA notdetected
Seetable 2
LA Present
LLA Present
Normal
LA I Clot Time
Normal
LA 2 Clot Time
Abnormal
LA Ratio
Normal
LA Ratio
LA Clot TimeProlonged
LA 2 Clot TimeProlonged
8/3/2019 Coagulation Study
http://slidepdf.com/reader/full/coagulation-study 37/57
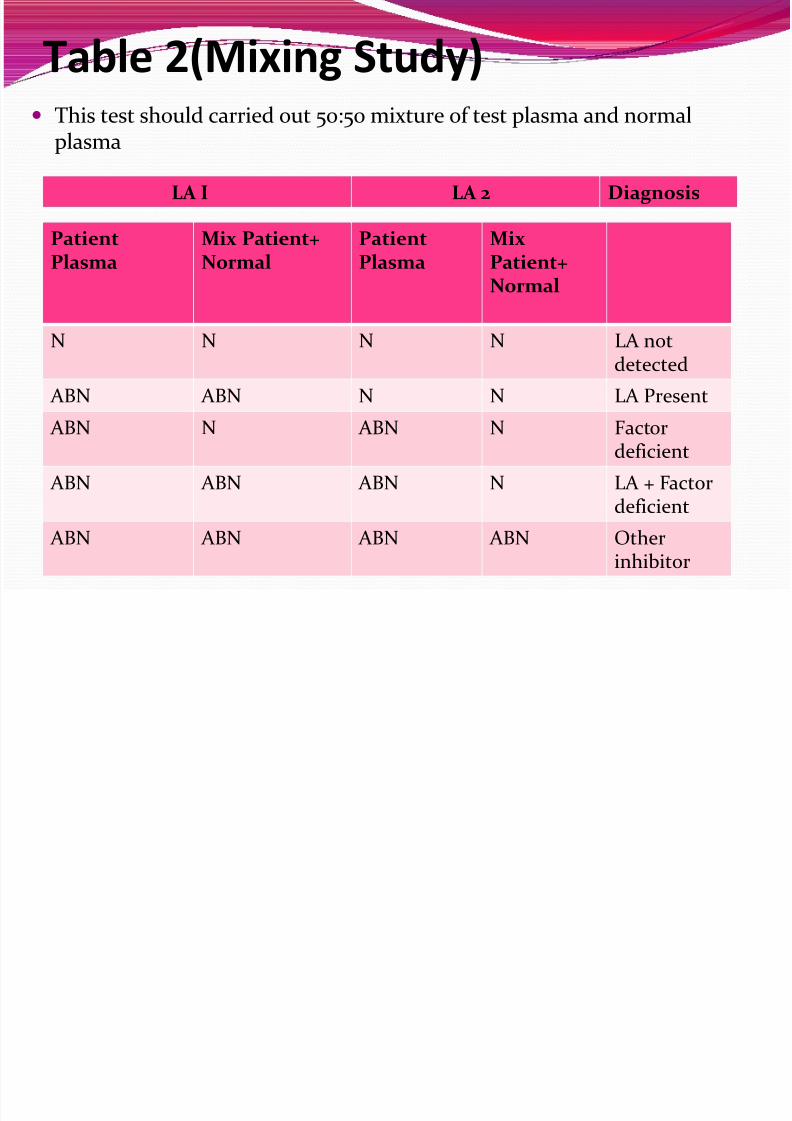
Table 2(Mixing Study) This test should carried out 50:50 mixture of test plasma and normal
plasma
LA I LA 2 Diagnosis
PatientPlasma
Mix Patient+Normal
PatientPlasma
MixPatient+
Normal
N N N N LA notdetected
ABN ABN N N LA Present
ABN N ABN N Factordeficient
ABN ABN ABN N LA + Factordeficient
ABN ABN ABN ABN Other
inhibitor
8/3/2019 Coagulation Study
http://slidepdf.com/reader/full/coagulation-study 38/57
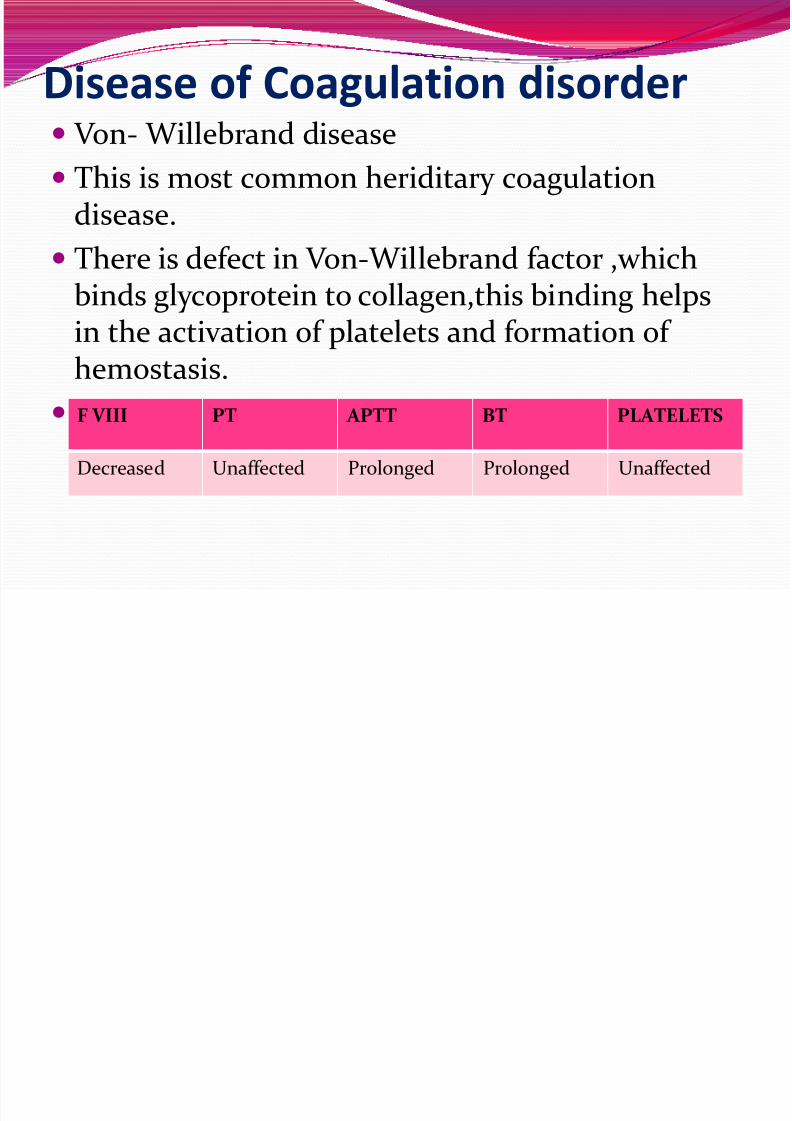
Disease of Coagulation disorder
Von- Willebrand disease This is most common heriditary coagulation
disease.
There is defect in Von-Willebrand factor ,whichbinds glycoprotein to collagen,this binding helpsin the activation of platelets and formation of hemostasis.
Factor VIII is also done to know thisdeficiency.(because it is bond with vWF.F VIII PT APTT BT PLATELETS
Decreased Unaffected Prolonged Prolonged Unaffected
8/3/2019 Coagulation Study
http://slidepdf.com/reader/full/coagulation-study 39/57
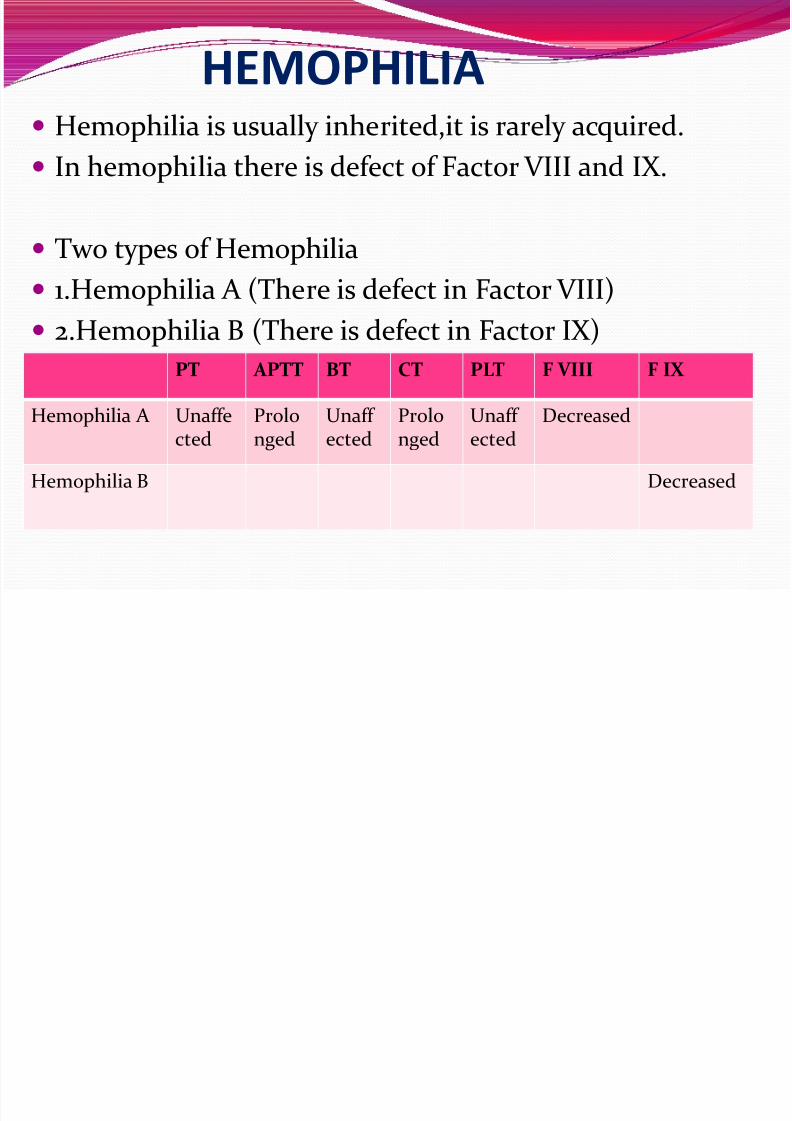
HEMOPHILIA Hemophilia is usually inherited,it is rarely acquired.
In hemophilia there is defect of Factor VIII and IX.
Two types of Hemophilia
1.Hemophilia A (There is defect in Factor VIII) 2.Hemophilia B (There is defect in Factor IX)
PT APTT BT CT PLT F VIII F IX
Hemophilia A Unaffected Prolonged Unaff ected Prolonged Unaff ected Decreased
Hemophilia B Decreased
8/3/2019 Coagulation Study
http://slidepdf.com/reader/full/coagulation-study 40/57
CORRECTION STUDIES
Principle
Unexplained prolongation of the PT and aPTT can
be investigated with simple correction tests by mixing the patient plasma with normalplasma,adsorbed plasma or with aged serum.
Correction indicates a possible factor deficiency
where as failure to correct,suggests the presence of inhibitors,lupus anticoagulant etc.
R t
8/3/2019 Coagulation Study
http://slidepdf.com/reader/full/coagulation-study 41/57
Reagents
The reagents which can be used for mixing test areas follows.
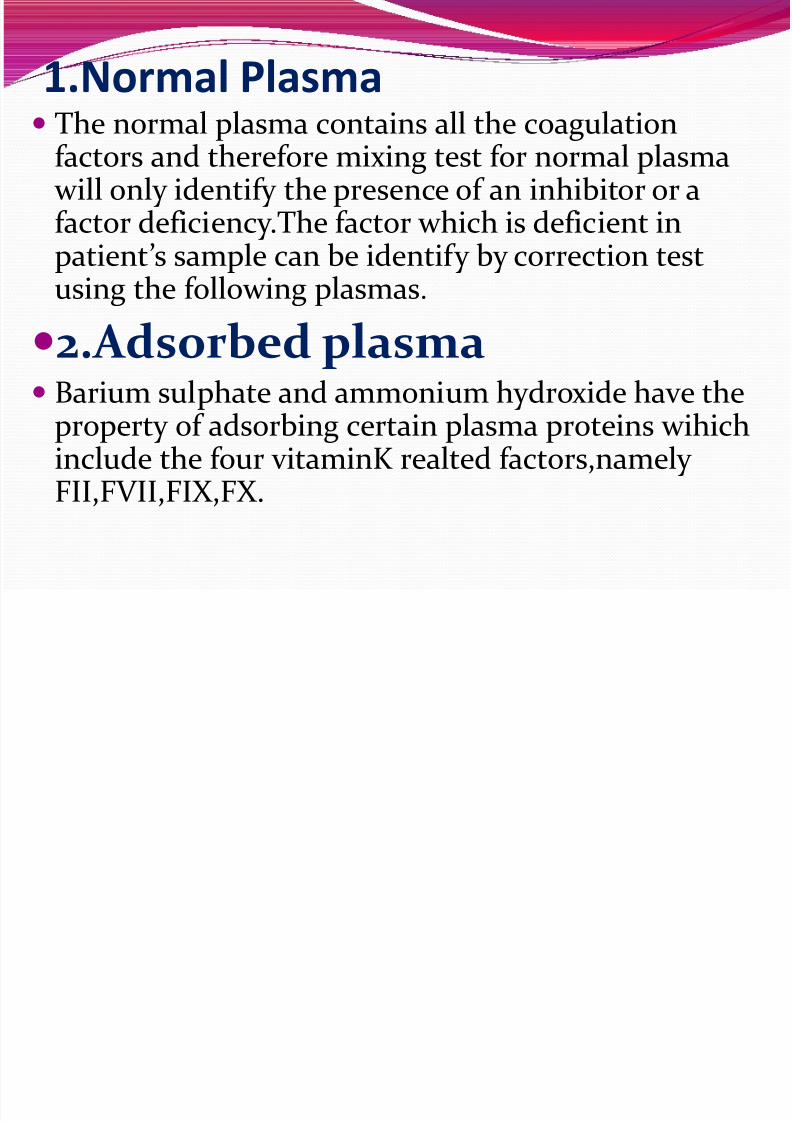
1.Normal Plasma
2.Adsorbed Plasma
3.Aged serum
Factor VIII deficient plasma
Factor IX deficient Plasma
The abnormal PT and aPTT test are repeated onequal volume of mixture (50:50) of additive andtest Plasma.
8/3/2019 Coagulation Study
http://slidepdf.com/reader/full/coagulation-study 42/57
8/3/2019 Coagulation Study
http://slidepdf.com/reader/full/coagulation-study 43/57
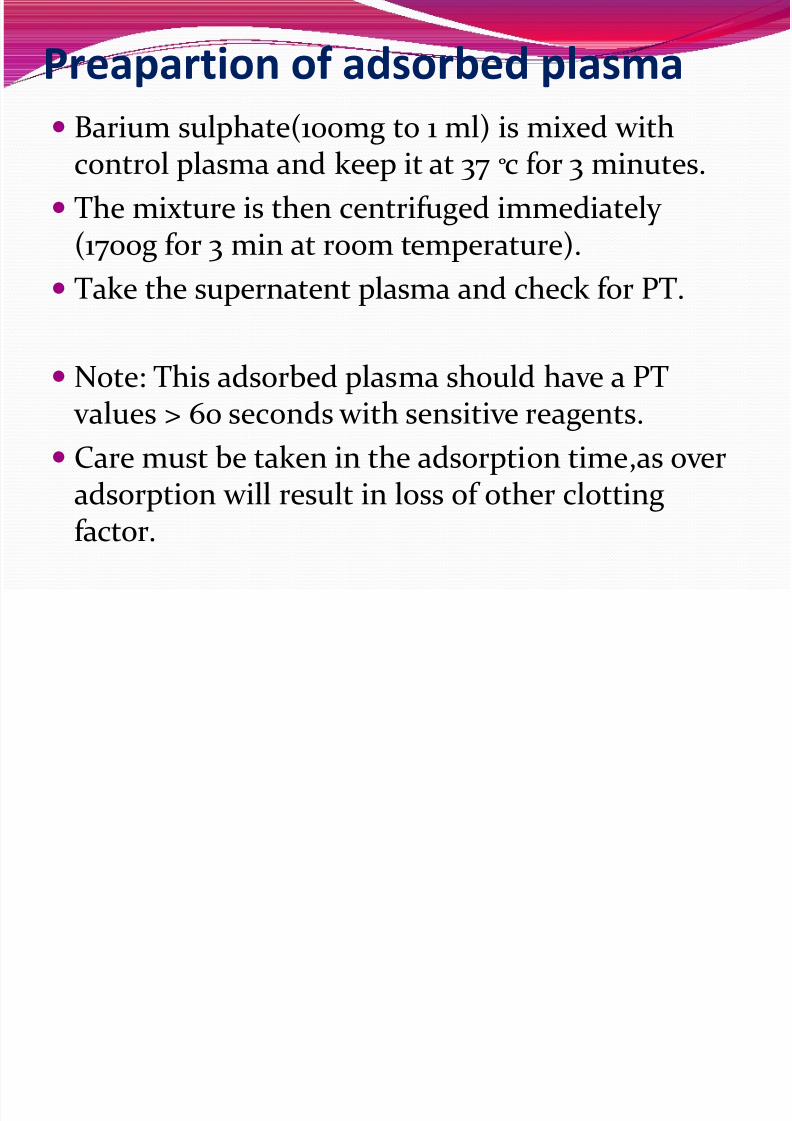
Barium sulphate(100mg to 1 ml) is mixed withcontrol plasma and keep it at 37 c̊ for 3 minutes.
The mixture is then centrifuged immediately (1700g for 3 min at room temperature).
Take the supernatent plasma and check for PT.
Note: This adsorbed plasma should have a PT
values > 60 seconds with sensitive reagents. Care must be taken in the adsorption time,as over
adsorption will result in loss of other clottingfactor.
Preapartion of adsorbed plasma
8/3/2019 Coagulation Study
http://slidepdf.com/reader/full/coagulation-study 44/57
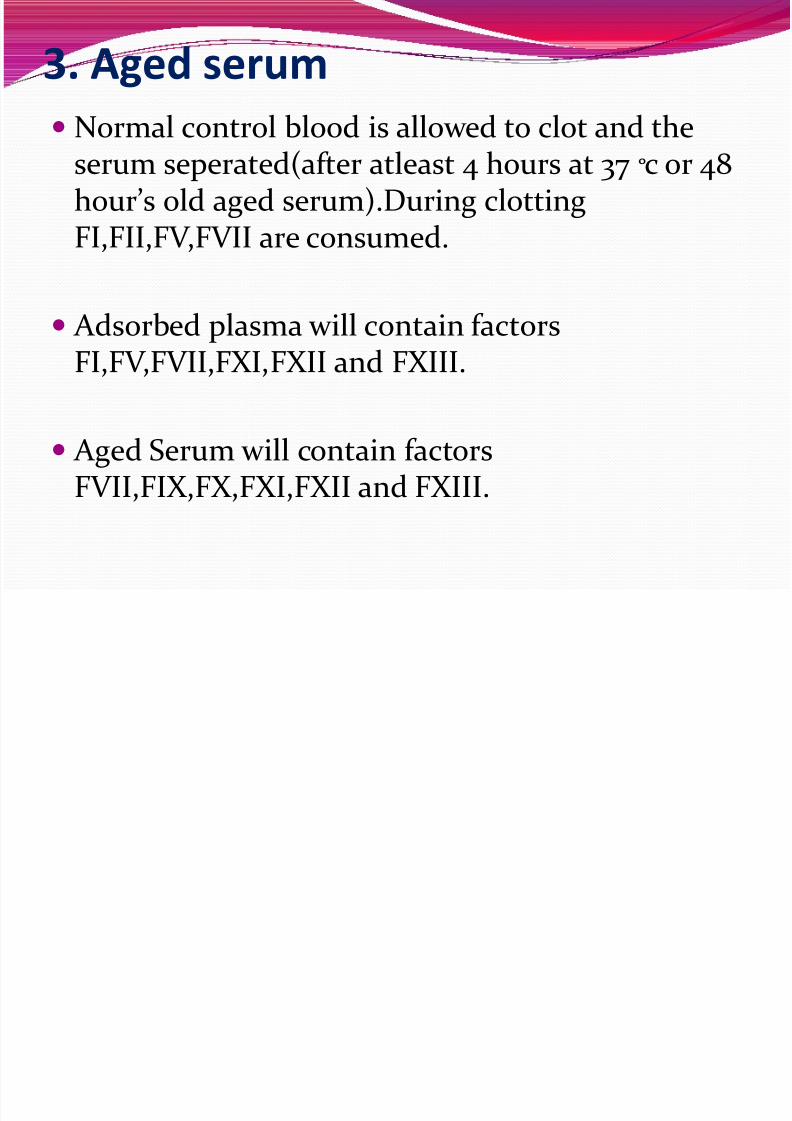
3. Aged serum
Normal control blood is allowed to clot and theserum seperated(after atleast 4 hours at 37 c̊ or 48hour’s old aged serum).During clottingFI,FII,FV,FVII are consumed.
Adsorbed plasma will contain factorsFI,FV,FVII,FXI,FXII and FXIII.
Aged Serum will contain factorsFVII,FIX,FX,FXI,FXII and FXIII.
8/3/2019 Coagulation Study
http://slidepdf.com/reader/full/coagulation-study 45/57
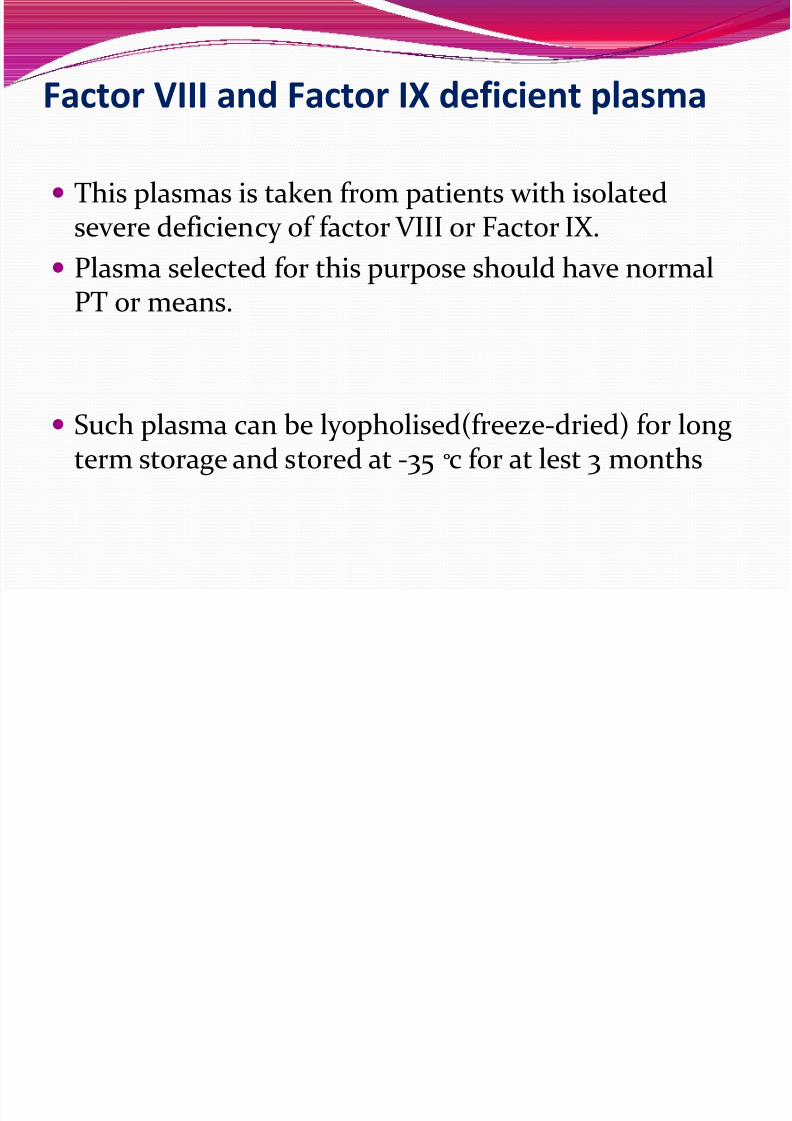
Factor VIII and Factor IX deficient plasma
This plasmas is taken from patients with isolatedsevere deficiency of factor VIII or Factor IX.
Plasma selected for this purpose should have normalPT or means.
Such plasma can be lyopholised(freeze-dried) for longterm storage and stored at -35 c̊ for at lest 3 months
8/3/2019 Coagulation Study
http://slidepdf.com/reader/full/coagulation-study 46/57
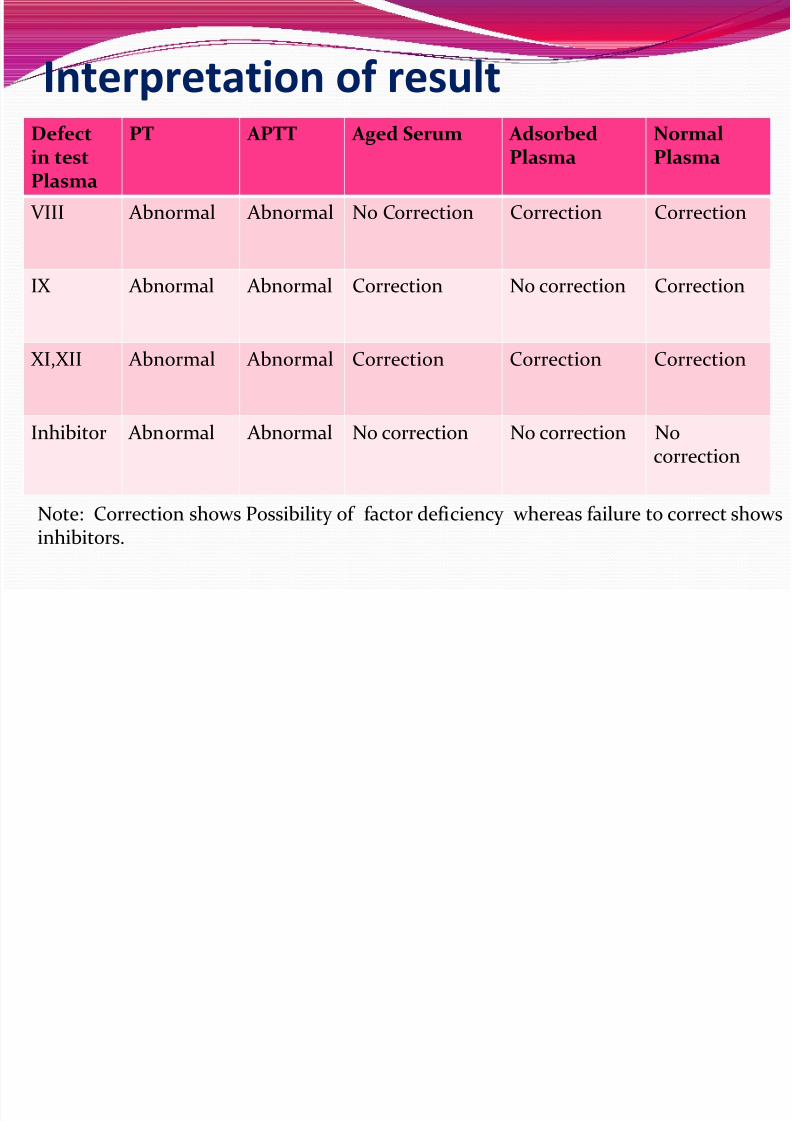
Interpretation of resultDefectin testPlasma
PT APTT Aged Serum AdsorbedPlasma
NormalPlasma
VIII Abnormal Abnormal No Correction Correction Correction
IX Abnormal Abnormal Correction No correction Correction
XI,XII Abnormal Abnormal Correction Correction Correction
Inhibitor Abnormal Abnormal No correction No correction Nocorrection
Note: Correction shows Possibility of factor deficiency whereas failure to correct showsinhibitors.
8/3/2019 Coagulation Study
http://slidepdf.com/reader/full/coagulation-study 47/57
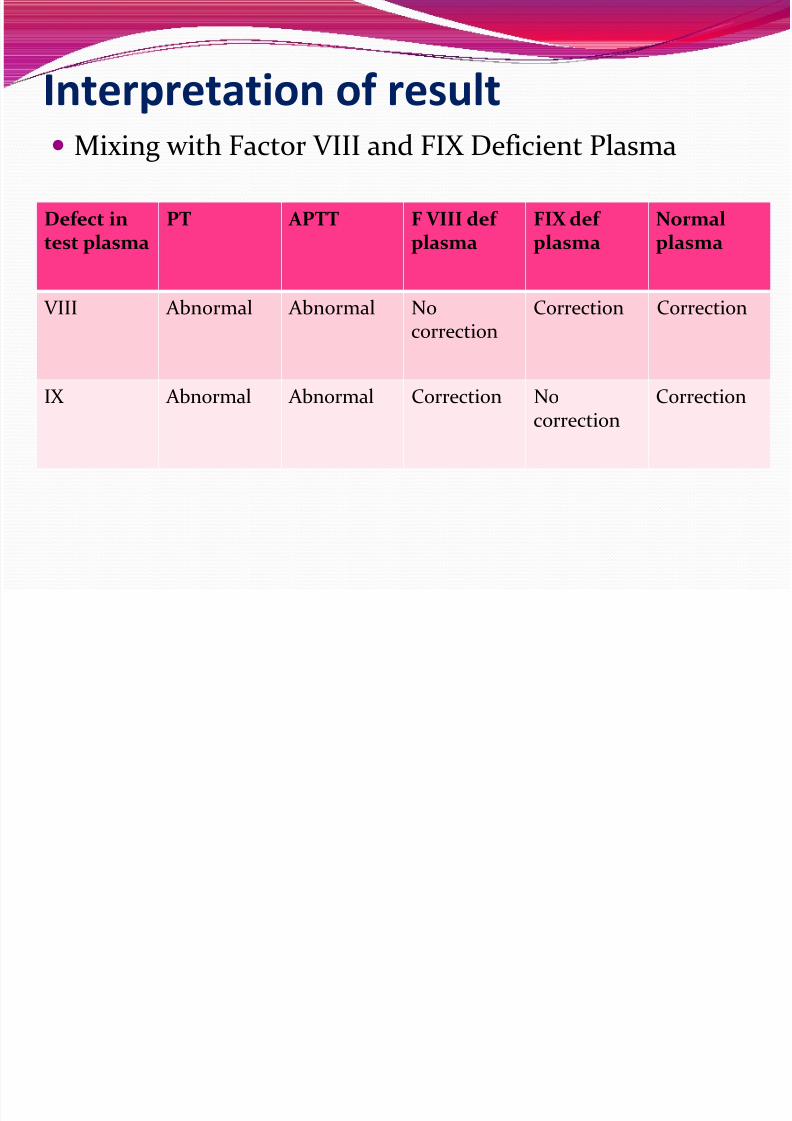
Interpretation of result
Mixing with Factor VIII and FIX Deficient Plasma
Defect intest plasma
PT APTT F VIII def plasma
FIX def plasma
Normalplasma
VIII Abnormal Abnormal Nocorrection
Correction Correction
IX Abnormal Abnormal Correction No
correction
Correction

8/3/2019 Coagulation Study
http://slidepdf.com/reader/full/coagulation-study 48/57
Thank You

8/3/2019 Coagulation Study
http://slidepdf.com/reader/full/coagulation-study 49/57

8/3/2019 Coagulation Study
http://slidepdf.com/reader/full/coagulation-study 50/57

8/3/2019 Coagulation Study
http://slidepdf.com/reader/full/coagulation-study 51/57

8/3/2019 Coagulation Study
http://slidepdf.com/reader/full/coagulation-study 52/57

8/3/2019 Coagulation Study
http://slidepdf.com/reader/full/coagulation-study 53/57

8/3/2019 Coagulation Study
http://slidepdf.com/reader/full/coagulation-study 54/57

8/3/2019 Coagulation Study
http://slidepdf.com/reader/full/coagulation-study 55/57

8/3/2019 Coagulation Study
http://slidepdf.com/reader/full/coagulation-study 56/57

8/3/2019 Coagulation Study
http://slidepdf.com/reader/full/coagulation-study 57/57


![POINT OF CARE COAGULATION TESTING - BloodFinal] Point of... · November 2014 Guidance for Australian Health Providers POINT OF CARE COAGULATION TESTING CASE STUDY The Prince Charles](https://img.pdfslide.us/doc/110x75/5c65882809d3f2b26e8cd2df/point-of-care-coagulation-testing-blood-final-point-of-november-2014-guidance.jpg)