Embed Size (px)
Citation preview
Ž .Chemical Geology 145 1998 233–248
CO fluxes from mid-ocean ridges, arcs and plumes2
Bernard Marty a,) ,1, Igor N. Tolstikhin a,b
a Centre de Recherches Petrographiques et Geochimiques, Rue Notre-Dame des PauÕres, B.P. 20, 54501 VandoeuÕre Cedex, France´ ´b Geological Institute, Kola Scientific Centre, Russian Academy of Sciences, Apatity 184200, Russian Federation
Received 20 September 1996; accepted 8 May 1997
Abstract
Estimates of CO emissions at spreading centres, convergent margins, and plumes have been reviewed and upgraded2
using observed CO r 3He ratios in magmatic volatiles, 3He content estimates in the magmatic sources, and magma2
emplacement rates in the different tectonic settings. The effect of volatile fractionation during magma degassing,Ž .investigated using new rare gas and CO abundances determined simultaneously for a suite of Mid-Ocean Ridge MOR2
basalt glasses, is not the major factor controlling the spread of data, which mainly result from volatile heterogeneity in theŽ . 12mantle source. The computed C flux at ridges 2.2"0.9 =10 molra, is essentially similar to previous estimates based on
a more restricted data base. Variation of the C flux in the past can be simply scaled to that of spreading rate since thecomputed C depends mainly on the volatile content of the mantle source, which can be considered constant during the last108 a. The flux of CO from arcs may be approximated using the CO r 3He ratios of volcanic gases at arcs and the magma2 2
emplacement rate, assuming that the 3He content of the mantle end-member is that of the MORB source. The resulting fluxis ;2.5=1012 molra, with approx. 80% of carbon being derived from the subducting plate. The flux of CO from plumes,2
based on time-averaged magma production rates and on estimated contributions of geochemical sources to plumemagmatism, is F3=1012 molra. Significant enhancements of the CO flux from plumes might have occurred in the past2
during giant magma emplacements, depending on the duration of these events, although the time-integrated effect does notappear important. The global magmatic flux of CO into the atmosphere and the hydrosphere is found to be 6=1012
2Ž . 12molra, with a range of 4–10 =10 molra. Improvement on the precision of this estimate is linked to a better
understanding of the volatile inventory at arcs on one hand, and on the dynamics of plumes and their mantle sourcecontribution on the other hand. q 1998 Elsevier Science B.V. All rights reserved.
Keywords: Carbon cycle; Mantle; Flux; Plumes; Arcs
1. Introduction
The rate of CO degassing from the Earth is2
considered to be a major factor controlling the partial
) Corresponding author. Tel.: q33 8359-4222; Fax: q338351-1798; E-mail: [email protected]
1 Also at: Ecole Nationale Superieure de Geologie, 94 Avenue´ ´De Lattre de Tassigny, 54001 Nancy Cedex, France.
pressure of atmospheric CO over geological time,2
and therefore the long-term variation of climateŽ .Berner et al., 1983 . The amount of gas transferredfrom a given reservoir into the atmosphere depends
Ž .on: 1 the rate of melt production in this reservoir;Ž .2 the abundance of volatile species in reservoir
Ž .rocks and related melts; and 3 the degree of meltdegassing. Consequently, the flux of CO from the2
solid Earth might have fluctuated in the past follow-
0009-2541r98r$19.00 q 1998 Elsevier Science B.V. All rights reserved.Ž .PII S0009-2541 97 00145-9
( )B. Marty, I.N. TolstikhinrChemical Geology 145 1998 233–248234
Ž .ing: 1 changes in the spreading rate of lithosphericplates, resulting in variations of the flux of mantle-
Ž .derived CO at mid-ocean ridges MOR and of the2
flux of subduction-derived CO at convergent mar-2Ž .gins; and 2 variation of the frequency and volume
Ž .of plume-derived lava emissions PLUME originat-ing deep in the mantle.
It is of fundamental importance to evaluate quan-titatively the relationship between CO degassing2
and magmatism. MOR volcanism represents morethan 60% of the total volume of lavas erupted at theEarth’s surface and is potentially a major source ofCO . The MOR lava eruption rate is known from the2
age–distance relationship of divergent plates and theMOR CO flux can be computed if the initial C2
content of oceanic basalts is evaluated. The difficultyof this approach is that CO solubility in magmas is2
low and this species is quantitatively degassed dur-ing eruptions, even in the case of oceanic basaltserupting under hydrostatic pressure. Hence the Ccontent of the original magmas cannot be directlymeasured as in the case of non-volatile trace ele-ments, and so must be reconstructed from observedresidual, isotopically fractionated, carbon in oceanicbasalts, necessitating a number of assumptions to bemade. The CO r 3He ratios in MOR hydrothermal2
fluids and rocks allow to constrain the CO emission2
rate from MOR volcanism because the flux of 3HeŽfrom ridges has been estimated Craig et al., 1975;
Welhan and Craig, 1983; Jean-Baptiste, 1992; Farley. 3et al., 1995 . CO r He in hydrothermal fluids at2
ŽMOR are available for only three locations Welhan.and Craig, 1983; Des Marais and Moore, 1984 , and
Ž . Ž .Des Marais 1985 and Marty and Jambon 1987proposed to use CO r 3He values of MOR basalt2
Ž . 3glasses MORB as proxies for CO r He ratios at2
ridge crest emissions, increasing considerably thenumber of CO r 3He data sets. This approach was2
Ž . Ž .questioned by Gerlach 1991 and Trull et al. 1993who argued that a slight difference in CO and He2
solubilities could cause a significant source of errorin the calculated emission rate at ridges as a conse-quence of CO –He fractionation during pre-eruptive2
degassing.ŽThe CO flux of subaerial volcanoes both arc-2
.and plume-type is generally estimated by extrapolat-Ž .ing the measured volatile fluxes of few individual
volcanoes to the total number of presently active
volcanoes. Contrary to the case of MOR volcanismwhich has not significantly varied in volume rate onthe time scale of 1–10 Ma, present-day emissions ofsubaerial volcanism can hardly be extrapolated overgeological periods as episodic emissions of particu-
Ž .larly volatile-rich or active or both volcanoes couldhave significantly increased the flux of volcanic CO2
in the past. Active geothermal systems may alsoŽsupply a considerable amount of CO Irwin and2.Barnes, 1980; Seward and Kerrick, 1996 , but their
contribution remains to be quantified. Further mea-surements on active volcanoes allow improvement ofthese estimates, but are limited by the requirement ofa safe access to eruptive vents and plumes. Satelliteremote sensing significantly improves the number ofobservations and their reliability, especially in thecase of cataclysmic eruptions such as the recent onesfrom Pinatubo and Rabaul, but the major limitationadvocated above, the connection between past andpresent activities, remains inescapable.
The role of plumes is even less constrained. Thepresent-day CO flux from plume volcanism appears2
low and comparable to that of arc volcanismŽGerlach, 1991; Allard, 1992; Marty and Le Cloarec,
.1992 . However, it is probable that major pulses ofplume-related volcanic episodes which have pro-
Ž .duced continental flood basalts CFB and large ig-Ž .neous provinces LIP in the Cretaceous and in the
Tertiary produced large-scale emissions of CO , the2
impacts of which on the climate are controversialŽCaldeira and Rampino, 1990, 1991; Larson, 1991a,b;
.Heller et al., 1996 . Quantification of these emis-sions requires a good geochronological control of thetime interval during which these events took place,and knowledge of the initial volatile content ofplume-derived magmas.
The first aim of this contribution is to review CO2
fluxes and their uncertainties in the different tectonicenvironments. Secondly, the effect of magma de-gassing on He–CO fractionation is quantitatively2
evaluated using new CO and rare gas data, allowing2
a more detailed evaluation of the CO flux at ridges2
to be made. Thirdly, the C content in the uppermantle feeding MOR magmatism is estimated, allow-ing to link the flux of CO at ridges to the rate of2
spreading at mid-ocean ridges. Fourthly, the flux ofCO at convergent margins is derived from the2
volume of mantle-derived magmas and the contribu-
( )B. Marty, I.N. TolstikhinrChemical Geology 145 1998 233–248 235
tion of the slab at arcs and scaled to the MORspreading rate. Finally, the latest developments inrare gas systematics are used to constrain the fractionof volatiles, including C, uprising from deep regionsin the mantle.
2. Carbon flux at mid-ocean ridges
2.1. C and 3He fluxes at MOR: a reÕiew
Estimates of CO emission rates at MOR based2
on C content and isotopic ratios in MORB glassesŽ . 12are very variable from 0.5–0.9 =10 molra
Ž . 12 ŽGerlach, 1991 up to 13=10 molra Javoy et al.,.1982 . The approach based on carbon calibration to
3He requires determination of Cr 3He ratios at MOR.3 ŽFig. 1 includes Cr He data for MORB glasses bulk
.fraction , in which case CO and He have been2
determined separately in different laboratoriesŽandror using separate extractions Des Marais, 1985;
Marty and Jambon, 1987; Kingsley and Schilling,. Ž1995 , and hydrothermal fluid data Welhan and
Craig, 1983; Des Marais and Moore, 1984; Gerlach,. Ž .1991 . Gerlach 1991 noted that preferential de-
gassing of He with respect to CO could explain2
lower Cr 3He ratios in hydrothermal fluids. Consid-ering all data as a single population, the median
3 9 Ž .CO r He ratio is 2.2=10 ns26 , with a stan-29'Ž .dard deviation 2sr n of 0.7=10 , similar to theŽ .early estimate of Marty and Jambon 1987 based on
a more restricted data base.The present-day flux of 3He has been estimated at
1000"250 molra, using a single box oceanic modelŽ .Craig et al., 1975; Welhan and Craig, 1983 . Jean-
Ž . 3Baptiste 1992 proposed a significantly lower Heflux of 400–660 molra based on a three-ocean basin
Ž .model. However, Farley et al. 1995 recently inte-grated 3He data in a global oceanic circulation modeland proposed a 3He flux similar to the one originallysuggested by Craig and co-workers. Thus the valueof the 3He flux depends critically on the oceanicmodel adopted and is subject to change in the futurewhen models become more sophisticated. For a mean3He flux of 1000"250 molra, and using the me-dian Cr 3He given above, the carbon flux at ridges
Ž . 12becomes 2.2"0.9 =10 molra.
2.2. CrHe fractionation in MORB?
MORB glasses have variable volatile contents,due to, e.g., variable vesicle density and previousdegassing, and it is uncertain if CO and He concen-2
trations measured separately, as is the case of part ofthe data compiled in Fig. 1, are representative of themantle volatile composition. Simultaneous analysisof CO and He, together with Ar and N , allows to2 2
circumvent the problem of volatile heterogeneity andŽto gain information on fractional degassing Marty,
.1995; Marty et al., 1995 . In the latter case the4 40 ) Ž 4radiogenic Her Ar ratio where He is produced
by the decay of U and Th, and 40Ar ) is produced by40 .the decay of K in the upper mantle can be antici-
Ž .pated from KrU Jochum et al., 1983 and ThrUŽ .O’Nions and McKenzie, 1993 ratios in the MORBsource. 4 Her 40Ar ) ratios observed in MORB aregenerally higher than the computed upper mantle
Ž .ratio of 3 "1 , possibly reflecting previous loss ofAr which is less soluble than He in silicate meltsŽ .Jambon et al., 1986 . Assuming that such loss fol-
Ž .lows a Raleigh distillation Marty, 1995 , then anyfractionation effect between two volatiles can bescaled to the 4 Her 40Ar ) ratio and the initial ratiobetween two volatile species, e.g., CO and 3He, can2
be computed according to:
CO CO2 2s3 3ž / ž /He Heinit obs
=
Ž .1y K rKHe CO 2w x4 40 ) Ž .1y K rKHer Ar He ArŽ .obs
4 40 )Her ArŽ . init
1Ž .
3where K , K and K are, respectively, theHe CO Ar2
solubility coefficients equal to 2.5=10y11 mol gy1
hPay1, 9.0=10y12 mol gy1 hPay1 and 2.6=10y12
mol gy1 hPay1, for He, CO and Ar in tholeiitic2Žmelt e.g., Jambon et al., 1986; Holloway and Blank,.1994 .
Ž .In our analysis Table 1 , we have taken intoaccount chemical variation among MORB. It is now
Ž .well established that some of MORB N-MORB areŽdepleted e.g., low K content, depletion in light Rare
87 86 .Earth Elements, Srr Sr-0.7026 and best repre-sent the depleted upper mantle, whereas other MORB
( )B. Marty, I.N. TolstikhinrChemical Geology 145 1998 233–248236
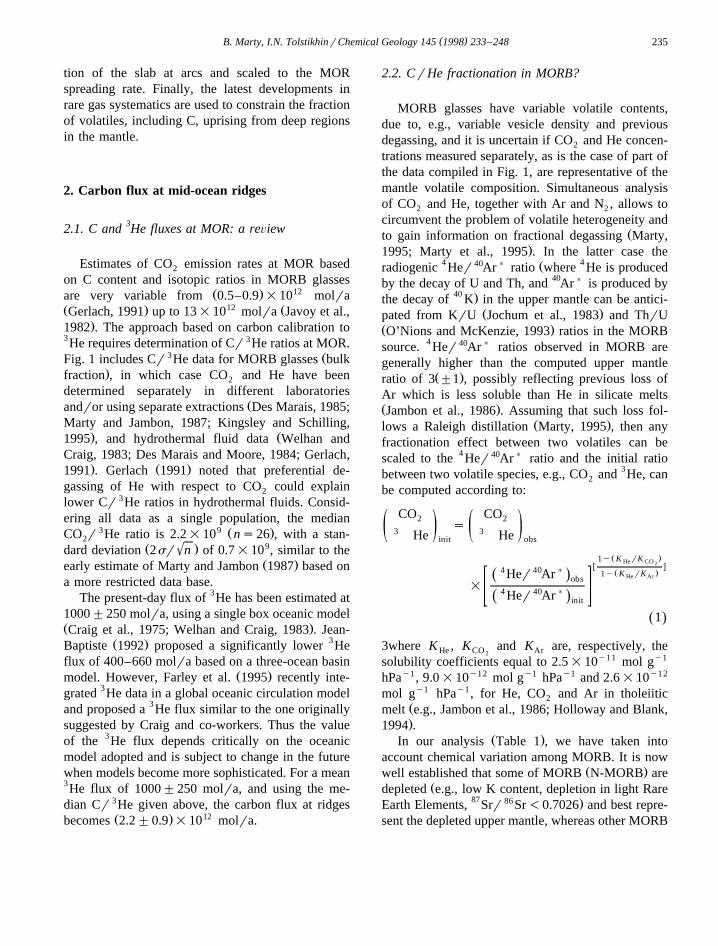
3 Ž y9 . Ž .Fig. 1. CO r He ratios =10 in rocks and fluids from various tectonic contexts. MORB. Data whole-rock data are from Des Marais2Ž . Ž . Ž . Ž . 3 41985 , Marty and Jambon 1987 , Javoy and Pineau 1991 and Kingsley and Schilling 1995 . All samples show Her He within 8"1
Ž 3 4 y6 . 3 4Ra where Ra is the atmospheric Her He value of 1.38=10 . PLUMES. Only samples showing Her He ratios higher than those ofŽ . Ž .MORB )9 Ra are represented. Fluids comprise fumaroles from the Hengill area, Iceland axis of the graben; Marty et al., 1991 , the
Ž . Ž .Piton de la Fournaise volcano, Reunion Island Dolomieu crater; Marty et al., 1993a and Kilauea Sulphur Bank; Craig and Lupton, 1976 .´Ž . ŽHydrothermal fluids are represented by hot springs in the Cirque de Cilaos, Reunion Marty et al., 1993a and in Yellowstone Mud´
3 4 . Ž .Volcano, where the highest Her He ratios were recorded; Craig et al., 1978 . Loihi fluid data are from Craig et al. 1987 . Rock data areŽ . Ž . Ž .from Marty and Jambon 1987 and references therein Loihi seamount , Trull et al. 1993; Reunion and Hawaiian xenoliths , Marty et al.´
Ž . Ž .1996; Red Sea basalts at 188N and B. Marty Galapagos submarine glasses, unpublished data . ARCS. Subduction-type gases areŽ . Ž .represented by fumaroles and volcanic gases in the temperature range 95–8808C. Data are from Marty et al. 1989 , Varekamp et al. 1992 ,
Ž . Ž . Ž . Ž .Allard 1992 , Sano and Marty 1995 and Sano and Williams 1996 . High temperature )5008C may be more representative of magmaticvolatiles as interactions with underground aquifers are less likely than for low-temperature gases. However, both sets of CO r 3He ratios are2
indistinguishable, suggesting that low-temperature interactions are not responsible for the spread of data. The median value is ;8 times thatof N-MORB, and ;3 times that of plumes, a clear evidence that subducted plates contribute C to arc volcanism.
Ž . ŽE-MORB are termed enriched e.g., enrichment in87 86 . Žlight Rare Earth Elements, Srr Sr)0.7026 e.g.,
.Le Roex, 1987 . The origin of such enrichment is
generally attributed to long-term recycling of crustalmaterial to the upper mantle. Volatiles such as Cmay be potentially subject to such enrichment, given
( )B. Marty, I.N. TolstikhinrChemical Geology 145 1998 233–248 237
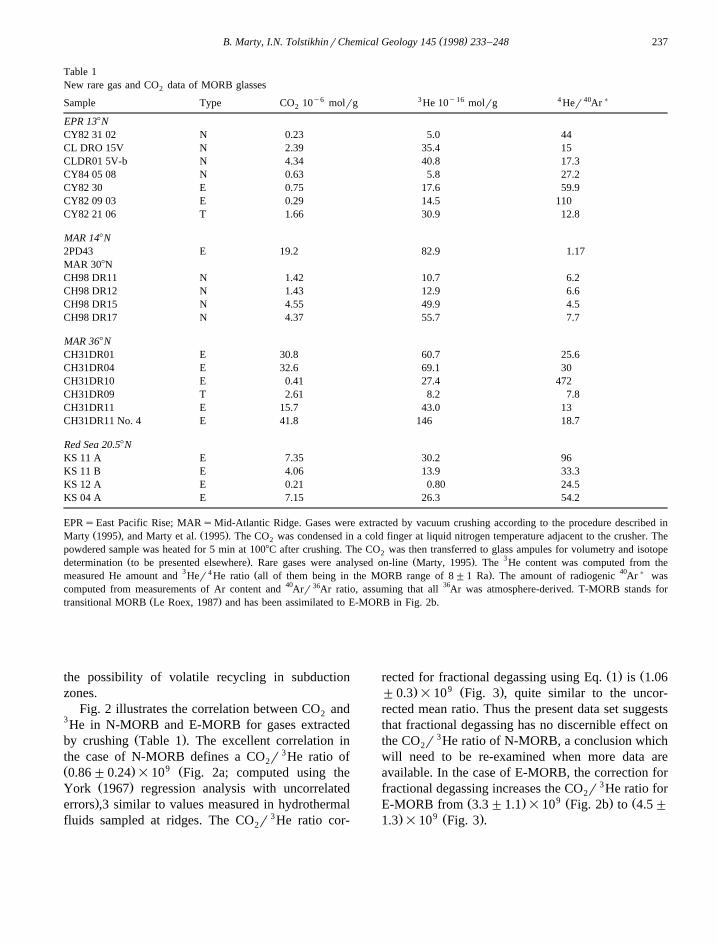
Table 1New rare gas and CO data of MORB glasses2
y6 3 y16 4 40 )Sample Type CO 10 molrg He 10 molrg Her Ar2
EPR 138NCY82 31 02 N 0.23 5.0 44CL DRO 15V N 2.39 35.4 15CLDR01 5V-b N 4.34 40.8 17.3CY84 05 08 N 0.63 5.8 27.2CY82 30 E 0.75 17.6 59.9CY82 09 03 E 0.29 14.5 110CY82 21 06 T 1.66 30.9 12.8
MAR 148N2PD43 E 19.2 82.9 1.17MAR 308NCH98 DR11 N 1.42 10.7 6.2CH98 DR12 N 1.43 12.9 6.6CH98 DR15 N 4.55 49.9 4.5CH98 DR17 N 4.37 55.7 7.7
MAR 368NCH31DR01 E 30.8 60.7 25.6CH31DR04 E 32.6 69.1 30CH31DR10 E 0.41 27.4 472CH31DR09 T 2.61 8.2 7.8CH31DR11 E 15.7 43.0 13CH31DR11 No. 4 E 41.8 146 18.7
Red Sea 20.58NKS 11 A E 7.35 30.2 96KS 11 B E 4.06 13.9 33.3KS 12 A E 0.21 0.80 24.5KS 04 A E 7.15 26.3 54.2
EPRsEast Pacific Rise; MARsMid-Atlantic Ridge. Gases were extracted by vacuum crushing according to the procedure described inŽ . Ž .Marty 1995 , and Marty et al. 1995 . The CO was condensed in a cold finger at liquid nitrogen temperature adjacent to the crusher. The2
powdered sample was heated for 5 min at 1008C after crushing. The CO was then transferred to glass ampules for volumetry and isotope2Ž . Ž . 3determination to be presented elsewhere . Rare gases were analysed on-line Marty, 1995 . The He content was computed from the
3 4 Ž . 40)measured He amount and Her He ratio all of them being in the MORB range of 8"1 Ra . The amount of radiogenic Ar was
computed from measurements of Ar content and 40Arr 36Ar ratio, assuming that all 36Ar was atmosphere-derived. T-MORB stands forŽ .transitional MORB Le Roex, 1987 and has been assimilated to E-MORB in Fig. 2b.
the possibility of volatile recycling in subductionzones.
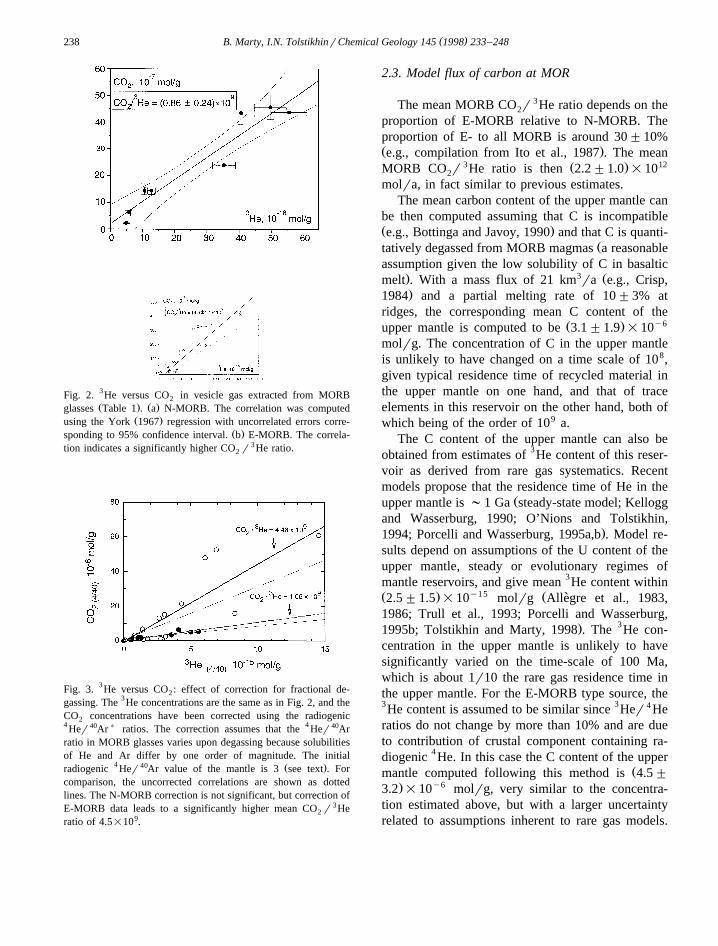
Fig. 2 illustrates the correlation between CO and23He in N-MORB and E-MORB for gases extracted
Ž .by crushing Table 1 . The excellent correlation inthe case of N-MORB defines a CO r 3He ratio of2Ž . 9 Ž0.86"0.24 =10 Fig. 2a; computed using the
Ž .York 1967 regression analysis with uncorrelated.errors ,3 similar to values measured in hydrothermal
fluids sampled at ridges. The CO r 3He ratio cor-2
Ž . Žrected for fractional degassing using Eq. 1 is 1.06. 9 Ž ."0.3 =10 Fig. 3 , quite similar to the uncor-
rected mean ratio. Thus the present data set suggeststhat fractional degassing has no discernible effect onthe CO r 3He ratio of N-MORB, a conclusion which2
will need to be re-examined when more data areavailable. In the case of E-MORB, the correction forfractional degassing increases the CO r 3He ratio for2
Ž . 9 Ž . ŽE-MORB from 3.3"1.1 =10 Fig. 2b to 4.5". 9 Ž .1.3 =10 Fig. 3 .
( )B. Marty, I.N. TolstikhinrChemical Geology 145 1998 233–248238
Fig. 2. 3He versus CO in vesicle gas extracted from MORB2Ž . Ž .glasses Table 1 . a N-MORB. The correlation was computed
Ž .using the York 1967 regression with uncorrelated errors corre-Ž .sponding to 95% confidence interval. b E-MORB. The correla-
tion indicates a significantly higher CO r 3He ratio.2
Fig. 3. 3He versus CO : effect of correction for fractional de-2
gassing. The 3He concentrations are the same as in Fig. 2, and theCO concentrations have been corrected using the radiogenic24 Her 40Ar ) ratios. The correction assumes that the 4 Her 40Arratio in MORB glasses varies upon degassing because solubilitiesof He and Ar differ by one order of magnitude. The initial
4 40 Ž .radiogenic Her Ar value of the mantle is 3 see text . Forcomparison, the uncorrected correlations are shown as dottedlines. The N-MORB correction is not significant, but correction ofE-MORB data leads to a significantly higher mean CO r 3He2
ratio of 4.5=109.
2.3. Model flux of carbon at MOR
The mean MORB CO r 3He ratio depends on the2
proportion of E-MORB relative to N-MORB. Theproportion of E- to all MORB is around 30"10%Ž .e.g., compilation from Ito et al., 1987 . The mean
3 Ž . 12MORB CO r He ratio is then 2.2"1.0 =102
molra, in fact similar to previous estimates.The mean carbon content of the upper mantle can
be then computed assuming that C is incompatibleŽ .e.g., Bottinga and Javoy, 1990 and that C is quanti-
Žtatively degassed from MORB magmas a reasonableassumption given the low solubility of C in basaltic
. 3 Žmelt . With a mass flux of 21 km ra e.g., Crisp,.1984 and a partial melting rate of 10"3% at
ridges, the corresponding mean C content of theŽ . y6upper mantle is computed to be 3.1"1.9 =10
molrg. The concentration of C in the upper mantleis unlikely to have changed on a time scale of 108,given typical residence time of recycled material inthe upper mantle on one hand, and that of traceelements in this reservoir on the other hand, both ofwhich being of the order of 109 a.
The C content of the upper mantle can also beobtained from estimates of 3He content of this reser-voir as derived from rare gas systematics. Recentmodels propose that the residence time of He in the
Župper mantle is ;1 Ga steady-state model; Kelloggand Wasserburg, 1990; O’Nions and Tolstikhin,
.1994; Porcelli and Wasserburg, 1995a,b . Model re-sults depend on assumptions of the U content of theupper mantle, steady or evolutionary regimes ofmantle reservoirs, and give mean 3He content withinŽ . y15 Ž2.5"1.5 =10 molrg Allegre et al., 1983,`1986; Trull et al., 1993; Porcelli and Wasserburg,
. 31995b; Tolstikhin and Marty, 1998 . The He con-centration in the upper mantle is unlikely to havesignificantly varied on the time-scale of 100 Ma,which is about 1r10 the rare gas residence time inthe upper mantle. For the E-MORB type source, the3He content is assumed to be similar since 3Her 4 Heratios do not change by more than 10% and are dueto contribution of crustal component containing ra-diogenic 4 He. In this case the C content of the upper
Žmantle computed following this method is 4.5". y63.2 =10 molrg, very similar to the concentra-
tion estimated above, but with a larger uncertaintyrelated to assumptions inherent to rare gas models.
( )B. Marty, I.N. TolstikhinrChemical Geology 145 1998 233–248 239
Although imprecise, this estimate has the advantageto be valid on a time scale of 107–108 a, andtherefore applicable to the C cycle from the Meso-zoic to the present.
3. Carbon flux at convergent margins
3.1. PreÕious estimates
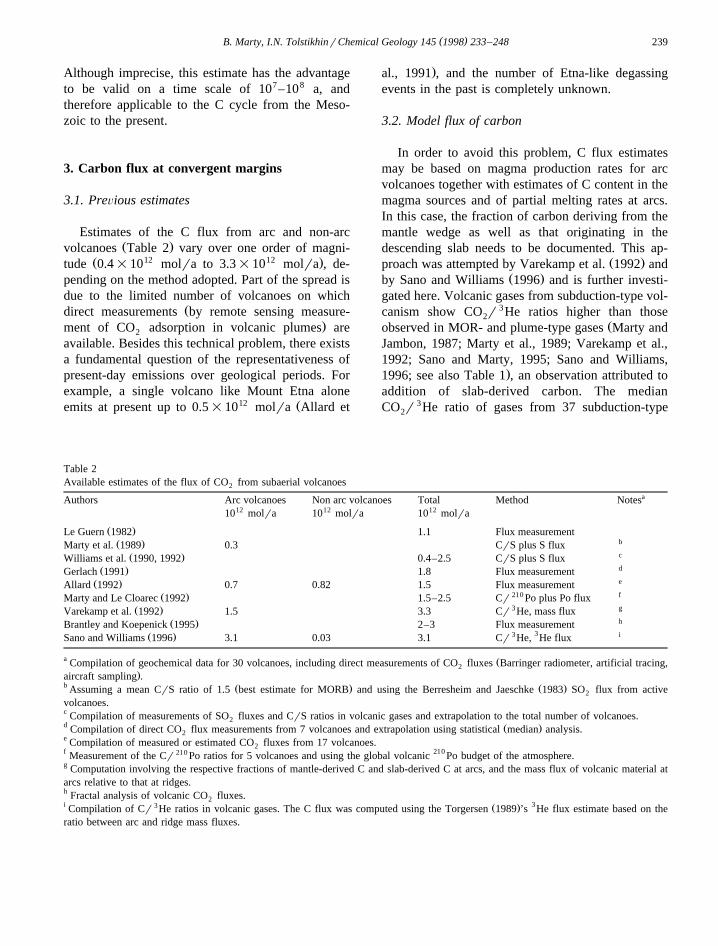
Estimates of the C flux from arc and non-arcŽ .volcanoes Table 2 vary over one order of magni-
Ž 12 12 .tude 0.4=10 molra to 3.3=10 molra , de-pending on the method adopted. Part of the spread isdue to the limited number of volcanoes on which
Ždirect measurements by remote sensing measure-.ment of CO adsorption in volcanic plumes are2
available. Besides this technical problem, there existsa fundamental question of the representativeness ofpresent-day emissions over geological periods. Forexample, a single volcano like Mount Etna alone
12 Žemits at present up to 0.5=10 molra Allard et
.al., 1991 , and the number of Etna-like degassingevents in the past is completely unknown.
3.2. Model flux of carbon
In order to avoid this problem, C flux estimatesmay be based on magma production rates for arcvolcanoes together with estimates of C content in themagma sources and of partial melting rates at arcs.In this case, the fraction of carbon deriving from themantle wedge as well as that originating in thedescending slab needs to be documented. This ap-
Ž .proach was attempted by Varekamp et al. 1992 andŽ .by Sano and Williams 1996 and is further investi-
gated here. Volcanic gases from subduction-type vol-canism show CO r 3He ratios higher than those2
Žobserved in MOR- and plume-type gases Marty andJambon, 1987; Marty et al., 1989; Varekamp et al.,1992; Sano and Marty, 1995; Sano and Williams,
.1996; see also Table 1 , an observation attributed toaddition of slab-derived carbon. The medianCO r 3He ratio of gases from 37 subduction-type2
Table 2Available estimates of the flux of CO from subaerial volcanoes2
aAuthors Arc volcanoes Non arc volcanoes Total Method Notes12 12 1210 molra 10 molra 10 molra
Ž .Le Guern 1982 1.1 Flux measurementbŽ .Marty et al. 1989 0.3 CrS plus S fluxcŽ .Williams et al. 1990, 1992 0.4–2.5 CrS plus S fluxdŽ .Gerlach 1991 1.8 Flux measurementeŽ .Allard 1992 0.7 0.82 1.5 Flux measurement
210 fŽ .Marty and Le Cloarec 1992 1.5–2.5 Cr Po plus Po flux3 gŽ .Varekamp et al. 1992 1.5 3.3 Cr He, mass flux
hŽ .Brantley and Koepenick 1995 2–3 Flux measurement33 iŽ .Sano and Williams 1996 3.1 0.03 3.1 Cr He, He flux
a ŽCompilation of geochemical data for 30 volcanoes, including direct measurements of CO fluxes Barringer radiometer, artificial tracing,2.aircraft sampling .
b Ž . Ž .Assuming a mean CrS ratio of 1.5 best estimate for MORB and using the Berresheim and Jaeschke 1983 SO flux from active2
volcanoes.c Compilation of measurements of SO fluxes and CrS ratios in volcanic gases and extrapolation to the total number of volcanoes.2d Ž .Compilation of direct CO flux measurements from 7 volcanoes and extrapolation using statistical median analysis.2e Compilation of measured or estimated CO fluxes from 17 volcanoes.2f Measurement of the Cr 210 Po ratios for 5 volcanoes and using the global volcanic 210 Po budget of the atmosphere.g Computation involving the respective fractions of mantle-derived C and slab-derived C at arcs, and the mass flux of volcanic material atarcs relative to that at ridges.h Fractal analysis of volcanic CO fluxes.2i 3 Ž . 3Compilation of Cr He ratios in volcanic gases. The C flux was computed using the Torgersen 1989 ’s He flux estimate based on theratio between arc and ridge mass fluxes.
( )B. Marty, I.N. TolstikhinrChemical Geology 145 1998 233–248240
Ž . Ž . 9 Žvolcanoes Fig. 1 is 11.0"3.3 =10 ns37,' .median value, uncertainty as 2sr n , similar to a
Ž .previous estimate made by Sano and Williams 1996 ,and about five times higher than the mean MORratio. This difference suggests the proportion ofmetamorphic carbon relative to total carbon to beapproximately 80%, in agreement with the conclu-
Ž .sions of Varekamp et al. 1992 , Sano and MartyŽ . Ž .1995 and Sano and Williams 1996 .
The flux of carbon at subduction zones can becomputed according to:
3 3 y1w xf sf = He = Cr He =r 2Ž .Ž .umC ,arc arc arcarc
where f is the flux of magmas and r is thearc arc
mean partial melting rate at arcs. The range of extentof partial melting is inferred to be 10–25% fromconsideration of major subduction systems in the
Ž .world Plank and Langmuir, 1988 . The best avail-able estimate of the rate of magma emplacement ataccreting plate margins is 0.5"0.1 km3ra for vol-
3 Žcanism, and 2.5–8.0 km ra for plutonism Crisp,.1984 . If we consider only the rate of lava produc-
tion, we obtain a mean f of 1.5=1011 molra.C,arc
This figure is significantly lower than that derivedŽ .from volcanic emissions Table 2 . If we now in-
clude plutonism, then the flux of C at arcs becomes;2.5=1012 molra. As for previous estimates, theuncertainty pertinent to this approach is considerable.Having said that, there are a number of points whichmerit consideration.
First, the flux of carbon computed in the presentwork using the mass flux of lavas is an order ofmagnitude lower than the volcanic flux. Only whenplutonism is included is the correct order of magni-tude obtained, suggesting that considerably moremagma outgasses CO at depth than that seen erupt-2
Ž .ing Allard et al., 1991, 1994 . It also agrees with theidea that magma underplating is a significant source
Žof volatiles contributing to the atmosphere O’Nions.and Oxburgh, 1988; Hilton et al., 1993 .
Second, the CO flux at convergent margins ap-2
pears to be comparable to that at divergent margins,Žbut with different origin for carbon mantle-derived
.for the former, mainly exogenic for the latter .We would like to emphasise at this stage that all
methods listed in this section, including ours, yield Cflux estimates for arcs which are not better definedthan at best a factor of 2. Progress in this domain
may arise from a better knowledge of magmaticprocesses at arcs as well as from direct volatile
Žanalysis in magmas at depth e.g., in melt inclusions.trapped in mafic minerals .
4. Carbon flux from plumes
4.1. ObserÕations
Two different lines of observations suggest lowvolatile flux from plumes. Direct observations ofhydrothermal activity at the top of the most activepresent-day plume-type volcano, Loihi Seamount,
Ž .Hawaii Craig et al., 1987; Koreda et al., 1988documented a very low 3He flux. The amount of
Ž .warm 308C water which penetrates on the south-western rim of the summit Loihi crater and furtherflows downward is so small that a reasonably reli-
Žable estimate of the helium flux is not possible H..Craig, pers. commun, 1995 . This is in sharp contrast
with the powerful hydrothermal activity at the EastŽ .Pacific Rise Craig et al., 1975 and several other
MOR hydrothermal manifestations. Moreover,worldwide observations of 3He excesses in seawater,together with recent modelling on mantle 3He fluxshows mid-ocean ridges to be the dominant source of
Ž .mantle He Farley et al., 1995 .For non-arc subaerial volcanism, and therefore
Ž .including plume-type volcanoes, Allard 1992 esti-mates the flux of 3He at 160–240 molra, a factor of5 lower than the 3He flux at spreading centres and,for PLUME-type volcanoes alone, probably an order
3 Žof magnitude lower than the He flux at MOR in thecompilation of Allard, Mount Etna, which does not
Ž .show PLUME-type He Marty et al., 1991 , supplies3 .;58 mol Hera .
4.2. Mass flux
There are several estimates of the rate of magma-tism at MOR and PLUME developed on ocean platesŽParsons, 1982; Reymer and Schubert, 1984; Crisp,
.1984 and all of them result in a MORrPLUMEŽ .mass ratio of ;10. For example, Crisp 1984 in-
Ž .ferred a PLUME magma emplacement rate of 5–715 Ž 3=10 gra 1.8–2.4 km ra; to be compared with a
( )B. Marty, I.N. TolstikhinrChemical Geology 145 1998 233–248 241
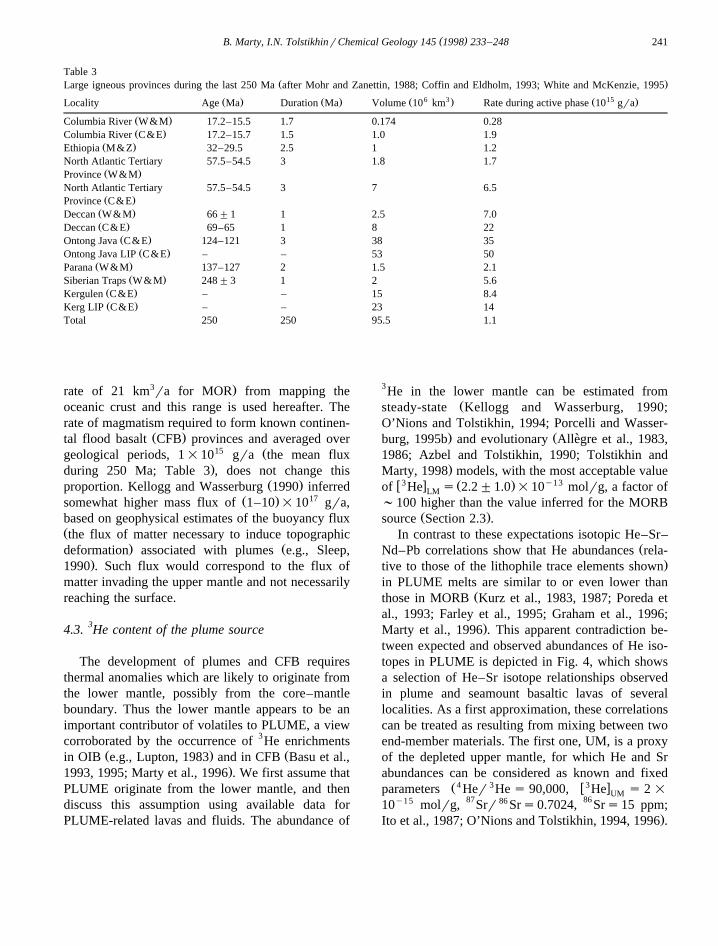
Table 3Ž .Large igneous provinces during the last 250 Ma after Mohr and Zanettin, 1988; Coffin and Eldholm, 1993; White and McKenzie, 1995
6 3 15Ž . Ž . Ž . Ž .Locality Age Ma Duration Ma Volume 10 km Rate during active phase 10 gra
Ž .Columbia River W&M 17.2–15.5 1.7 0.174 0.28Ž .Columbia River C&E 17.2–15.7 1.5 1.0 1.9
Ž .Ethiopia M&Z 32–29.5 2.5 1 1.2North Atlantic Tertiary 57.5–54.5 3 1.8 1.7
Ž .Province W&MNorth Atlantic Tertiary 57.5–54.5 3 7 6.5
Ž .Province C&EŽ .Deccan W&M 66"1 1 2.5 7.0Ž .Deccan C&E 69–65 1 8 22
Ž .Ontong Java C&E 124–121 3 38 35Ž .Ontong Java LIP C&E – – 53 50
Ž .Parana W&M 137–127 2 1.5 2.1Ž .Siberian Traps W&M 248"3 1 2 5.6
Ž .Kergulen C&E – – 15 8.4Ž .Kerg LIP C&E – – 23 14
Total 250 250 95.5 1.1
3 .rate of 21 km ra for MOR from mapping theoceanic crust and this range is used hereafter. Therate of magmatism required to form known continen-
Ž .tal flood basalt CFB provinces and averaged over15 Žgeological periods, 1=10 gra the mean flux.during 250 Ma; Table 3 , does not change this
Ž .proportion. Kellogg and Wasserburg 1990 inferredŽ . 17somewhat higher mass flux of 1–10 =10 gra,
based on geophysical estimates of the buoyancy fluxŽthe flux of matter necessary to induce topographic
. Ždeformation associated with plumes e.g., Sleep,.1990 . Such flux would correspond to the flux of
matter invading the upper mantle and not necessarilyreaching the surface.
4.3. 3He content of the plume source
The development of plumes and CFB requiresthermal anomalies which are likely to originate fromthe lower mantle, possibly from the core–mantleboundary. Thus the lower mantle appears to be animportant contributor of volatiles to PLUME, a viewcorroborated by the occurrence of 3He enrichments
Ž . Žin OIB e.g., Lupton, 1983 and in CFB Basu et al.,.1993, 1995; Marty et al., 1996 . We first assume that
PLUME originate from the lower mantle, and thendiscuss this assumption using available data forPLUME-related lavas and fluids. The abundance of
3He in the lower mantle can be estimated fromŽsteady-state Kellogg and Wasserburg, 1990;
O’Nions and Tolstikhin, 1994; Porcelli and Wasser-. Žburg, 1995b and evolutionary Allegre et al., 1983,`
1986; Azbel and Tolstikhin, 1990; Tolstikhin and.Marty, 1998 models, with the most acceptable value
w3 x Ž . y13of He s 2.2"1.0 =10 molrg, a factor ofLM
;100 higher than the value inferred for the MORBŽ .source Section 2.3 .
In contrast to these expectations isotopic He–Sr–ŽNd–Pb correlations show that He abundances rela-
.tive to those of the lithophile trace elements shownin PLUME melts are similar to or even lower than
Žthose in MORB Kurz et al., 1983, 1987; Poreda etal., 1993; Farley et al., 1995; Graham et al., 1996;
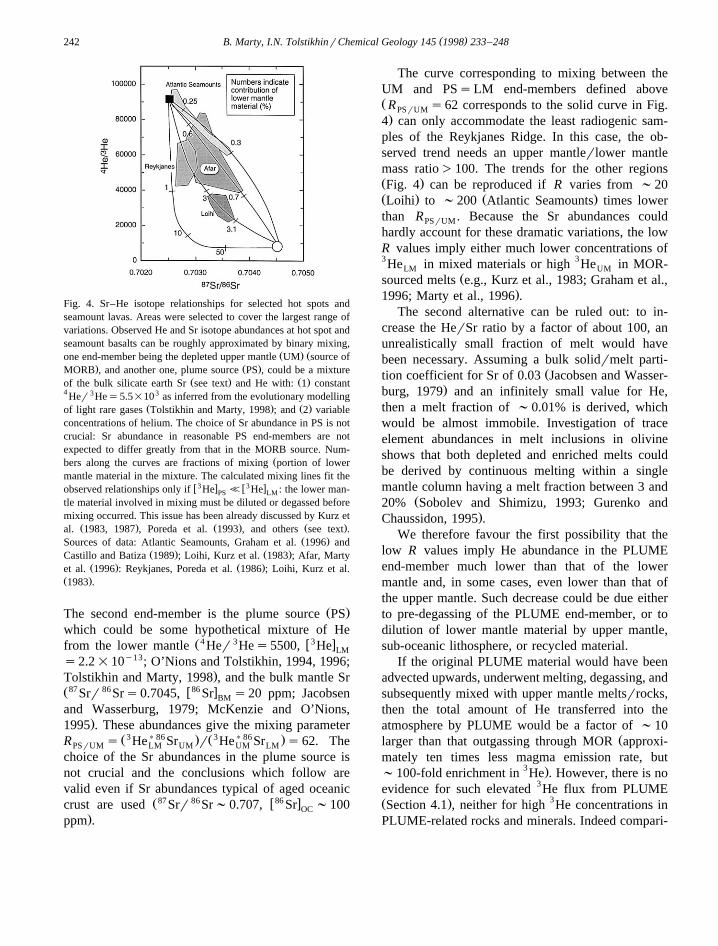
.Marty et al., 1996 . This apparent contradiction be-tween expected and observed abundances of He iso-topes in PLUME is depicted in Fig. 4, which showsa selection of He–Sr isotope relationships observedin plume and seamount basaltic lavas of severallocalities. As a first approximation, these correlationscan be treated as resulting from mixing between twoend-member materials. The first one, UM, is a proxyof the depleted upper mantle, for which He and Srabundances can be considered as known and fixed
Ž4 3 w3 xparameters Her He s 90,000, He s 2 =UM
10y15 molrg, 87Srr 86 Srs0.7024, 86Srs15 ppm;.Ito et al., 1987; O’Nions and Tolstikhin, 1994, 1996 .
( )B. Marty, I.N. TolstikhinrChemical Geology 145 1998 233–248242
Fig. 4. Sr–He isotope relationships for selected hot spots andseamount lavas. Areas were selected to cover the largest range ofvariations. Observed He and Sr isotope abundances at hot spot andseamount basalts can be roughly approximated by binary mixing,
Ž . Žone end-member being the depleted upper mantle UM source of. Ž .MORB , and another one, plume source PS , could be a mixture
Ž . Ž .of the bulk silicate earth Sr see text and He with: 1 constant4 Her 3Hes5.5=103 as inferred from the evolutionary modelling
Ž . Ž .of light rare gases Tolstikhin and Marty, 1998 ; and 2 variableconcentrations of helium. The choice of Sr abundance in PS is notcrucial: Sr abundance in reasonable PS end-members are notexpected to differ greatly from that in the MORB source. Num-
Žbers along the curves are fractions of mixing portion of lowermantle material in the mixture. The calculated mixing lines fit the
w3 x w3 xobserved relationships only if He < He : the lower man-PS LM
tle material involved in mixing must be diluted or degassed beforemixing occurred. This issue has been already discussed by Kurz et
Ž . Ž . Ž .al. 1983, 1987 , Poreda et al. 1993 , and others see text .Ž .Sources of data: Atlantic Seamounts, Graham et al. 1996 and
Ž . Ž .Castillo and Batiza 1989 ; Loihi, Kurz et al. 1983 ; Afar, MartyŽ . Ž .et al. 1996 : Reykjanes, Poreda et al. 1986 ; Loihi, Kurz et al.
Ž .1983 .
Ž .The second end-member is the plume source PSwhich could be some hypothetical mixture of He
Ž4 3 w3 xfrom the lower mantle Her Hes5500, He LM
s2.2=10y13; O’Nions and Tolstikhin, 1994, 1996;.Tolstikhin and Marty, 1998 , and the bulk mantle Sr
Ž87 86 w86 xSrr Srs0.7045, Sr s20 ppm; JacobsenBM
and Wasserburg, 1979; McKenzie and O’Nions,.1995 . These abundances give the mixing parameter
Ž3 ) 86 . Ž3 ) 86 .R s He Sr r He Sr s 62. ThePSrUM LM UM UM LM
choice of the Sr abundances in the plume source isnot crucial and the conclusions which follow arevalid even if Sr abundances typical of aged oceanic
Ž87 86 w86 xcrust are used Srr Sr;0.707, Sr ;100OC.ppm .
The curve corresponding to mixing between theUM and PSsLM end-members defined aboveŽR s62 corresponds to the solid curve in Fig.PSrUM.4 can only accommodate the least radiogenic sam-
ples of the Reykjanes Ridge. In this case, the ob-served trend needs an upper mantlerlower mantlemass ratio)100. The trends for the other regionsŽ .Fig. 4 can be reproduced if R varies from ;20Ž . Ž .Loihi to ;200 Atlantic Seamounts times lowerthan R . Because the Sr abundances couldPSrUM
hardly account for these dramatic variations, the lowR values imply either much lower concentrations of3He in mixed materials or high 3He in MOR-LM UM
Žsourced melts e.g., Kurz et al., 1983; Graham et al.,.1996; Marty et al., 1996 .
The second alternative can be ruled out: to in-crease the HerSr ratio by a factor of about 100, anunrealistically small fraction of melt would havebeen necessary. Assuming a bulk solidrmelt parti-
Žtion coefficient for Sr of 0.03 Jacobsen and Wasser-.burg, 1979 and an infinitely small value for He,
then a melt fraction of ;0.01% is derived, whichwould be almost immobile. Investigation of traceelement abundances in melt inclusions in olivineshows that both depleted and enriched melts couldbe derived by continuous melting within a singlemantle column having a melt fraction between 3 and
Ž20% Sobolev and Shimizu, 1993; Gurenko and.Chaussidon, 1995 .
We therefore favour the first possibility that thelow R values imply He abundance in the PLUMEend-member much lower than that of the lowermantle and, in some cases, even lower than that ofthe upper mantle. Such decrease could be due eitherto pre-degassing of the PLUME end-member, or todilution of lower mantle material by upper mantle,sub-oceanic lithosphere, or recycled material.
If the original PLUME material would have beenadvected upwards, underwent melting, degassing, andsubsequently mixed with upper mantle meltsrrocks,then the total amount of He transferred into theatmosphere by PLUME would be a factor of ;10
Žlarger than that outgassing through MOR approxi-mately ten times less magma emission rate, but
3 .;100-fold enrichment in He . However, there is noevidence for such elevated 3He flux from PLUMEŽ . 3Section 4.1 , neither for high He concentrations inPLUME-related rocks and minerals. Indeed compari-
( )B. Marty, I.N. TolstikhinrChemical Geology 145 1998 233–248 243
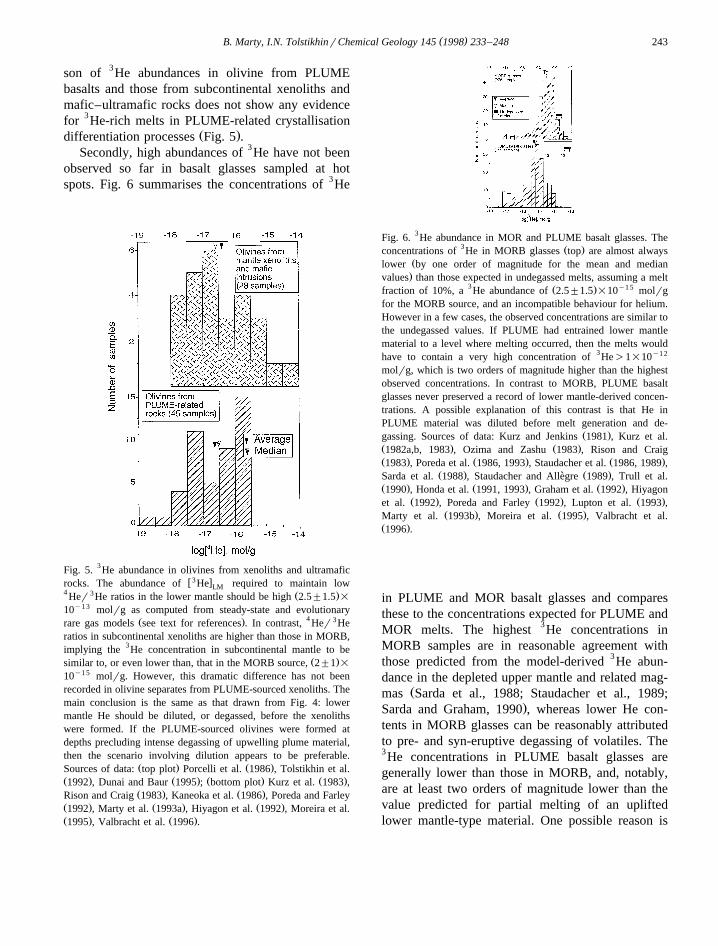
son of 3He abundances in olivine from PLUMEbasalts and those from subcontinental xenoliths andmafic–ultramafic rocks does not show any evidencefor 3He-rich melts in PLUME-related crystallisation
Ž .differentiation processes Fig. 5 .Secondly, high abundances of 3He have not been
observed so far in basalt glasses sampled at hotspots. Fig. 6 summarises the concentrations of 3He
Fig. 5. 3He abundance in olivines from xenoliths and ultramaficw3 xrocks. The abundance of He required to maintain lowLM
4 3 Ž .Her He ratios in the lower mantle should be high 2.5"1.5 =
10y13 molrg as computed from steady-state and evolutionaryŽ . 4 3rare gas models see text for references . In contrast, Her He
ratios in subcontinental xenoliths are higher than those in MORB,implying the 3He concentration in subcontinental mantle to be
Ž .similar to, or even lower than, that in the MORB source, 2"1 =
10y15 molrg. However, this dramatic difference has not beenrecorded in olivine separates from PLUME-sourced xenoliths. Themain conclusion is the same as that drawn from Fig. 4: lowermantle He should be diluted, or degassed, before the xenolithswere formed. If the PLUME-sourced olivines were formed atdepths precluding intense degassing of upwelling plume material,then the scenario involving dilution appears to be preferable.
Ž . Ž .Sources of data: top plot Porcelli et al. 1986 , Tolstikhin et al.Ž . Ž . Ž . Ž .1992 , Dunai and Baur 1995 ; bottom plot Kurz et al. 1983 ,
Ž . Ž .Rison and Craig 1983 , Kaneoka et al. 1986 , Poreda and FarleyŽ . Ž . Ž .1992 , Marty et al. 1993a , Hiyagon et al. 1992 , Moreira et al.Ž . Ž .1995 , Valbracht et al. 1996 .
Fig. 6. 3He abundance in MOR and PLUME basalt glasses. The3 Ž .concentrations of He in MORB glasses top are almost always
Žlower by one order of magnitude for the mean and median.values than those expected in undegassed melts, assuming a melt
3 Ž . y1 5fraction of 10%, a He abundance of 2.5"1.5 =10 molrgfor the MORB source, and an incompatible behaviour for helium.However in a few cases, the observed concentrations are similar tothe undegassed values. If PLUME had entrained lower mantlematerial to a level where melting occurred, then the melts wouldhave to contain a very high concentration of 3He)1=10y12
molrg, which is two orders of magnitude higher than the highestobserved concentrations. In contrast to MORB, PLUME basaltglasses never preserved a record of lower mantle-derived concen-trations. A possible explanation of this contrast is that He inPLUME material was diluted before melt generation and de-
Ž .gassing. Sources of data: Kurz and Jenkins 1981 , Kurz et al.Ž . Ž .1982a,b, 1983 , Ozima and Zashu 1983 , Rison and CraigŽ . Ž . Ž .1983 , Poreda et al. 1986, 1993 , Staudacher et al. 1986, 1989 ,
Ž . Ž .Sarda et al. 1988 , Staudacher and Allegre 1989 , Trull et al.`Ž . Ž . Ž .1990 , Honda et al. 1991, 1993 , Graham et al. 1992 , Hiyagon
Ž . Ž . Ž .et al. 1992 , Poreda and Farley 1992 , Lupton et al. 1993 ,Ž . Ž .Marty et al. 1993b , Moreira et al. 1995 , Valbracht et al.
Ž .1996 .
in PLUME and MOR basalt glasses and comparesthese to the concentrations expected for PLUME andMOR melts. The highest 3He concentrations inMORB samples are in reasonable agreement withthose predicted from the model-derived 3He abun-dance in the depleted upper mantle and related mag-
Žmas Sarda et al., 1988; Staudacher et al., 1989;.Sarda and Graham, 1990 , whereas lower He con-
tents in MORB glasses can be reasonably attributedto pre- and syn-eruptive degassing of volatiles. The3He concentrations in PLUME basalt glasses aregenerally lower than those in MORB, and, notably,are at least two orders of magnitude lower than thevalue predicted for partial melting of an upliftedlower mantle-type material. One possible reason is
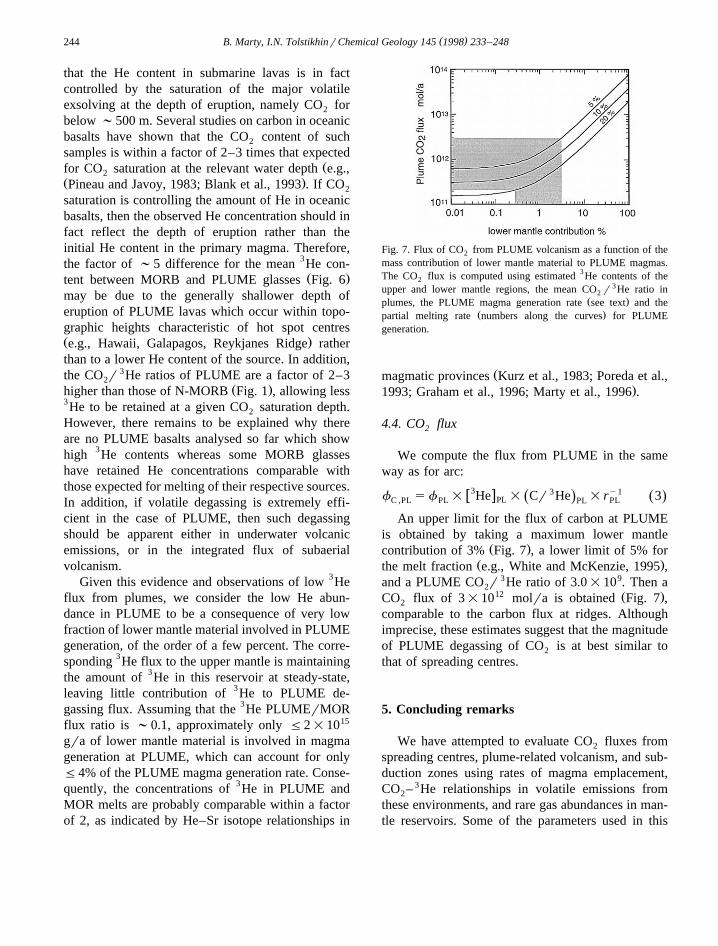
( )B. Marty, I.N. TolstikhinrChemical Geology 145 1998 233–248244
that the He content in submarine lavas is in factcontrolled by the saturation of the major volatileexsolving at the depth of eruption, namely CO for2
below ;500 m. Several studies on carbon in oceanicbasalts have shown that the CO content of such2
samples is within a factor of 2–3 times that expectedŽfor CO saturation at the relevant water depth e.g.,2
Ž .Pineau and Javoy, 1983; Blank et al., 1993 . If CO2
saturation is controlling the amount of He in oceanicbasalts, then the observed He concentration should infact reflect the depth of eruption rather than theinitial He content in the primary magma. Therefore,the factor of ;5 difference for the mean 3He con-
Ž .tent between MORB and PLUME glasses Fig. 6may be due to the generally shallower depth oferuption of PLUME lavas which occur within topo-graphic heights characteristic of hot spot centresŽ .e.g., Hawaii, Galapagos, Reykjanes Ridge ratherthan to a lower He content of the source. In addition,the CO r 3He ratios of PLUME are a factor of 2–32
Ž .higher than those of N-MORB Fig. 1 , allowing less3He to be retained at a given CO saturation depth.2
However, there remains to be explained why thereare no PLUME basalts analysed so far which showhigh 3He contents whereas some MORB glasseshave retained He concentrations comparable withthose expected for melting of their respective sources.In addition, if volatile degassing is extremely effi-cient in the case of PLUME, then such degassingshould be apparent either in underwater volcanicemissions, or in the integrated flux of subaerialvolcanism.
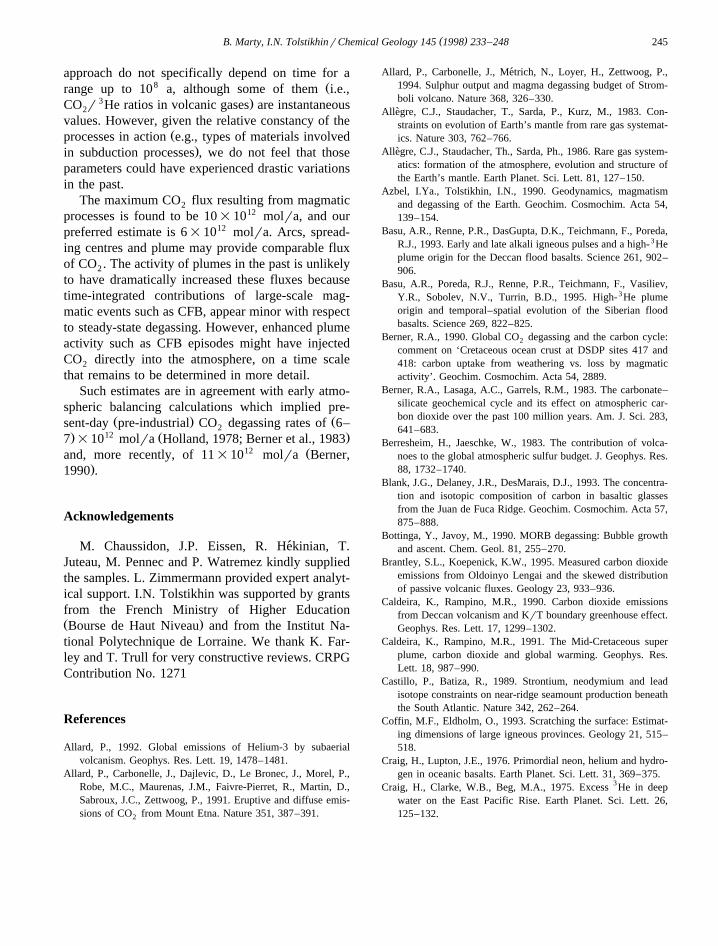
Given this evidence and observations of low 3Heflux from plumes, we consider the low He abun-dance in PLUME to be a consequence of very lowfraction of lower mantle material involved in PLUMEgeneration, of the order of a few percent. The corre-sponding 3He flux to the upper mantle is maintainingthe amount of 3He in this reservoir at steady-state,leaving little contribution of 3He to PLUME de-gassing flux. Assuming that the 3He PLUMErMORflux ratio is ;0.1, approximately only F2=1015
gra of lower mantle material is involved in magmageneration at PLUME, which can account for onlyF4% of the PLUME magma generation rate. Conse-quently, the concentrations of 3He in PLUME andMOR melts are probably comparable within a factorof 2, as indicated by He–Sr isotope relationships in
Fig. 7. Flux of CO from PLUME volcanism as a function of the2
mass contribution of lower mantle material to PLUME magmas.The CO flux is computed using estimated 3He contents of the2
upper and lower mantle regions, the mean CO r 3He ratio in2Ž .plumes, the PLUME magma generation rate see text and the
Ž .partial melting rate numbers along the curves for PLUMEgeneration.
Žmagmatic provinces Kurz et al., 1983; Poreda et al.,.1993; Graham et al., 1996; Marty et al., 1996 .
4.4. CO flux2
We compute the flux from PLUME in the sameway as for arc:
3 3 y1w xf sf = He = Cr He =r 3Ž .Ž .PLC ,PL PL PLPL
An upper limit for the flux of carbon at PLUMEis obtained by taking a maximum lower mantle
Ž .contribution of 3% Fig. 7 , a lower limit of 5% forŽ .the melt fraction e.g., White and McKenzie, 1995 ,
and a PLUME CO r 3He ratio of 3.0=109. Then a212 Ž .CO flux of 3=10 molra is obtained Fig. 7 ,2
comparable to the carbon flux at ridges. Althoughimprecise, these estimates suggest that the magnitudeof PLUME degassing of CO is at best similar to2
that of spreading centres.
5. Concluding remarks
We have attempted to evaluate CO fluxes from2
spreading centres, plume-related volcanism, and sub-duction zones using rates of magma emplacement,CO – 3He relationships in volatile emissions from2
these environments, and rare gas abundances in man-tle reservoirs. Some of the parameters used in this
( )B. Marty, I.N. TolstikhinrChemical Geology 145 1998 233–248 245
approach do not specifically depend on time for a8 Žrange up to 10 a, although some of them i.e.,
3 .CO r He ratios in volcanic gases are instantaneous2
values. However, given the relative constancy of theŽprocesses in action e.g., types of materials involved
.in subduction processes , we do not feel that thoseparameters could have experienced drastic variationsin the past.
The maximum CO flux resulting from magmatic2
processes is found to be 10=1012 molra, and ourpreferred estimate is 6=1012 molra. Arcs, spread-ing centres and plume may provide comparable fluxof CO . The activity of plumes in the past is unlikely2
to have dramatically increased these fluxes becausetime-integrated contributions of large-scale mag-matic events such as CFB, appear minor with respectto steady-state degassing. However, enhanced plumeactivity such as CFB episodes might have injectedCO directly into the atmosphere, on a time scale2
that remains to be determined in more detail.Such estimates are in agreement with early atmo-
spheric balancing calculations which implied pre-Ž . Žsent-day pre-industrial CO degassing rates of 6–2
. 12 Ž .7 =10 molra Holland, 1978; Berner et al., 198312 Žand, more recently, of 11=10 molra Berner,
.1990 .
Acknowledgements
M. Chaussidon, J.P. Eissen, R. Hekinian, T.´Juteau, M. Pennec and P. Watremez kindly suppliedthe samples. L. Zimmermann provided expert analyt-ical support. I.N. Tolstikhin was supported by grantsfrom the French Ministry of Higher EducationŽ .Bourse de Haut Niveau and from the Institut Na-tional Polytechnique de Lorraine. We thank K. Far-ley and T. Trull for very constructive reviews. CRPGContribution No. 1271
References
Allard, P., 1992. Global emissions of Helium-3 by subaerialvolcanism. Geophys. Res. Lett. 19, 1478–1481.
Allard, P., Carbonelle, J., Dajlevic, D., Le Bronec, J., Morel, P.,Robe, M.C., Maurenas, J.M., Faivre-Pierret, R., Martin, D.,Sabroux, J.C., Zettwoog, P., 1991. Eruptive and diffuse emis-sions of CO from Mount Etna. Nature 351, 387–391.2
Allard, P., Carbonelle, J., Metrich, N., Loyer, H., Zettwoog, P.,´1994. Sulphur output and magma degassing budget of Strom-boli volcano. Nature 368, 326–330.
Allegre, C.J., Staudacher, T., Sarda, P., Kurz, M., 1983. Con-`straints on evolution of Earth’s mantle from rare gas systemat-ics. Nature 303, 762–766.
Allegre, C.J., Staudacher, Th., Sarda, Ph., 1986. Rare gas system-`atics: formation of the atmosphere, evolution and structure ofthe Earth’s mantle. Earth Planet. Sci. Lett. 81, 127–150.
Azbel, I.Ya., Tolstikhin, I.N., 1990. Geodynamics, magmatismand degassing of the Earth. Geochim. Cosmochim. Acta 54,139–154.
Basu, A.R., Renne, P.R., DasGupta, D.K., Teichmann, F., Poreda,R.J., 1993. Early and late alkali igneous pulses and a high-3Heplume origin for the Deccan flood basalts. Science 261, 902–906.
Basu, A.R., Poreda, R.J., Renne, P.R., Teichmann, F., Vasiliev,Y.R., Sobolev, N.V., Turrin, B.D., 1995. High-3He plumeorigin and temporal–spatial evolution of the Siberian floodbasalts. Science 269, 822–825.
Berner, R.A., 1990. Global CO degassing and the carbon cycle:2
comment on ‘Cretaceous ocean crust at DSDP sites 417 and418: carbon uptake from weathering vs. loss by magmaticactivity’. Geochim. Cosmochim. Acta 54, 2889.
Berner, R.A., Lasaga, A.C., Garrels, R.M., 1983. The carbonate–silicate geochemical cycle and its effect on atmospheric car-bon dioxide over the past 100 million years. Am. J. Sci. 283,641–683.
Berresheim, H., Jaeschke, W., 1983. The contribution of volca-noes to the global atmospheric sulfur budget. J. Geophys. Res.88, 1732–1740.
Blank, J.G., Delaney, J.R., DesMarais, D.J., 1993. The concentra-tion and isotopic composition of carbon in basaltic glassesfrom the Juan de Fuca Ridge. Geochim. Cosmochim. Acta 57,875–888.
Bottinga, Y., Javoy, M., 1990. MORB degassing: Bubble growthand ascent. Chem. Geol. 81, 255–270.
Brantley, S.L., Koepenick, K.W., 1995. Measured carbon dioxideemissions from Oldoinyo Lengai and the skewed distributionof passive volcanic fluxes. Geology 23, 933–936.
Caldeira, K., Rampino, M.R., 1990. Carbon dioxide emissionsfrom Deccan volcanism and KrT boundary greenhouse effect.Geophys. Res. Lett. 17, 1299–1302.
Caldeira, K., Rampino, M.R., 1991. The Mid-Cretaceous superplume, carbon dioxide and global warming. Geophys. Res.Lett. 18, 987–990.
Castillo, P., Batiza, R., 1989. Strontium, neodymium and leadisotope constraints on near-ridge seamount production beneaththe South Atlantic. Nature 342, 262–264.
Coffin, M.F., Eldholm, O., 1993. Scratching the surface: Estimat-ing dimensions of large igneous provinces. Geology 21, 515–518.
Craig, H., Lupton, J.E., 1976. Primordial neon, helium and hydro-gen in oceanic basalts. Earth Planet. Sci. Lett. 31, 369–375.
Craig, H., Clarke, W.B., Beg, M.A., 1975. Excess 3He in deepwater on the East Pacific Rise. Earth Planet. Sci. Lett. 26,125–132.
( )B. Marty, I.N. TolstikhinrChemical Geology 145 1998 233–248246
Craig, H., Lupton, J.E., Welhan, J.A., Poreda, R., 1978. Heliumisotope ratios in Yellowstone and Lassen Park volcanic gases.Geophys. Res. Lett. 5, 897–900.
Craig, H., Welhan, J.A., Hilton, D.R., 1987. Hydrothermal ventsin Loihi caldera: Alvin results. Eos Trans. 68, 1553.
Crisp, J.A., 1984. Rates of magma emplacement and volcanicoutput. J. Volcanol. Geotherm. Res. 20, 177–211.
Des Marais, D.J., 1985. Carbon exchange between the mantle andthe crust, and its effect upon the atmosphere: today comparedto Archean time. Geophys. Monogr. 32, 602–611.
Des Marais, D.J., Moore, J.G., 1984. Carbon and its isotopes inmid-ocean ridge basaltic glasses. Earth Planet. Sci. Lett. 69,43–57.
Dunai, T.J., Baur, H., 1995. Helium, neon and argon systematicsof the European subcontinental mantle: Implications for itsgeochemical evolution. Geochim. Cosmochim. Acta 59,2767–2783.
Farley, K.A., Maier-Reimer, E., Schlosser, P., Broecker, W.S.,1995. Constraints on mantle 3He fluxes and deep-sea circula-tion from an oceanic general circulation model. J. Geophys.
Ž .Res. 100 B3 , 3829–3839.Gerlach, T.M., 1991. Present-day CO emissions from volcanos.2
Eos Trans. 72, 249–255.Graham, D.W., Jenkins, W.J., Schilling, J.-G., Thompson, G.,
Kurz, M., Humphris, E., 1992. Helium isotope geochemistryof mid-ocean ridge basalts from the South Atlantic. EarthPlanet. Sci. Lett. 110, 133–147.
Graham, D.W., Castillo, P.R., Lupton, J.E., Batiza, R., 1996.Highly correlated He and Sr isotope ratios in South Atlanticnear-ridge seamounts and implication for mantle dynamics.Earth Planet. Sci. Lett., in press.
Gurenko, A.A., Chaussidon, M., 1995. Enriched and depletedprimitive melts included in olivine from Icelandic tholeiites:Origin by continuous melting in a single mantle column.Geochim. Cosmochim. Acta 59, 2905–2917.
Heller, P.L., Anderson, D.L., Angevine, C.L., 1996. Is the MiddleCretaceous pulse of rapid sea-floor spreading real or neces-sary?. Geology 24, 491–494.
Hilton, D.R., Hammerschmidt, K., Teufel, S., Friedrichsen, H.,1993. Helium isotope characteristics of Andean geothermalfluids and lavas. Earth Planet. Sci. Lett. 120, 265–282.
Hiyagon, H., Ozima, M., Marty, B., Zashu, Z., Sakai, H., 1992.Noble gases in submarine glasses from mid-oceanic ridges andLoihi seamount: Constraints on the early history of the earth.Geochim. Cosmochim. Acta 56, 1301–1316.
Holland, H.D., 1978. The Chemistry of the Atmosphere andOceans. John Wiley, New York, 351 pp.
Holloway, J.R., Blank, J.G., 1994. Application of experimentalresults to C–O–H species in natural melts. In: Carroll, M.R.,
Ž .Holloway, J.R. Eds. , Volatiles in Magmas. Rev. Mineral. 30,187–225.
Honda, M., McDougall, I., Patterson, D.B., Doulgeris, A., Clague,D., 1991. Possible solar noble gas component in Hawaiianbasalts. Nature 349, 149–151.
Honda, M., McDougall, I., Patterson, D.B., Doulgeris, A., Lague,D.A., 1993. Noble gases in submarine pillow basalt glasses
from Loihi and Kilauea, Hawaii: A solar component in theearth. Geochim. Cosmochim. Acta 57, 859–874.
Irwin, W.P., Barnes, I., 1980. Tectonic relations of carbon dioxideŽ .discharges and earthquakes. J. Geophys. Res. 85 B6 , 3115–
3121.Ito, E., White, W.M., Gopel, C., 1987. The O, Sr, Nd and Pb¨
isotope geochemistry of MORB. Chem. Geol. 62, 157–176.Jacobsen, S.B., Wasserburg, G.J., 1979. The mean age of mantle
and crustal reservoirs. J. Geophys. Res. 84, 7411–7427.Jambon, A., Weber, H., Braun, O., 1986. Solubilities of He, Ne,
Ar, Kr and Xe in a basalts melt in the range 1250–16008C:Geochemical implications. Geochim. Cosmochim. Acta 50,401–408.
Javoy, M., Pineau, F., 1991. The volatiles record of a ‘popping’rock from the Mid-Atlantic Ridge at 148N: chemical andisotopic composition of gas trapped in the vesicles. EarthPlanet. Sci. Lett. 107, 598–611.
Javoy, M., Pineau, F., Allegre, C.J., 1982. Carbon geodynamic`cycle. Nature 300, 171–173.
Jean-Baptiste, P., 1992. Helium-3 distribution in the deep worldŽ .ocean. In: Rozanski, K. Ed. , Isotopes of Noble Gases as
Tracers in Environmental Studies. International Atomic En-ergy Agency, Vienna, pp. 219–240.
Jochum, K.P., Hofmann, A.W., Ito, E., Seufert, H.M., White,W.H., 1983. K, U and Th in Mid-Ocean Ridge Basalt glassesand heat production, KrU and KrRb in the mantle. Nature306, 431–436.
Kaneoka, I., Takaoka, N., Upton, B.G.J., 1986. Noble gas system-atics in basalts and a dunite nodule from Reunion and GrandComore Islands, Indian Ocean. Chem. Geol. 59, 35–42.
Kellog, L., Wasserburg, J.G., 1990. The role of plumes in mantlehelium fluxes. Earth Planet. Sci. Lett. 99, 276–289.
Kingsley, R.H., Schilling, J.G., 1995. Carbon in Mid-AtlanticRidge basalt glasses from 288N to 638N: evidence for acarbon-rich Azores mantle plume. Earth Planet. Sci. Lett. 129,31–53.
Koreda, M., Igarashi, G., Ozima, M., 1988. Noble gases inhydrothermal plumes of Loihi Seamount. Earth Planet. Sci.Lett. 87, 266–272.
Kurz, M.D., Jenkins, W.J., 1981. The distribution of helium inoceanic basalt glasses. Earth. Planet. Sci. Lett. 53, 41–54.
Kurz, M.D., Jenkins, W.J., Schilling, J.G., Hart, S.R., 1982a.Helium isotopic variations in the mantle beneath the centralNorth Atlantic Ocean. Earth Planet. Sci. Lett. 58, 1–14.
Kurz, M.D., Jenkins, W.J., Hart, S.R., 1982b. Helium isotopicsystematics of oceanic islands and mantle heterogeneity. Na-ture 297, 43–47.
Kurz, M.D., Jenkins, W.J., Hart, S.R., Clague, D., 1983. Heliumisotopic variations in volcanic rocks from Loihi seamount andthe Island of Hawaii. Earth Planet. Sci. Lett. 66, 388–406.
Kurz, M.D., Garcia, M.O., Frey, F.A., O’Brien, P.A., 1987.Temporal helium isotopic variations within Hawaiian volca-noes: Basalts from Mauna Loa and Heleakala. Geochim. Cos-mochim. Acta 51, 2905–2914.
Larson, R.L., 1991a. Geological consequence of superplumes.Geology 19, 963–966.
( )B. Marty, I.N. TolstikhinrChemical Geology 145 1998 233–248 247
Larson, R.L., 1991b. Latest pulse of the Earth: evidence for aMid-Cretaceous superplume. Geology 19, 547–550.
Le Guern, F., 1982. Les debits de CO et de SO volcaniques´ 2 2
dans l’atmosphere. Bull. Volcanol. 45, 197–202.`Le Roex, A.P., 1987. Source regions of Mid-Ocean Ridge Basalts:
evidence for enrichment processes. In: Menzies, M.A.,Ž .Hawkesworth, C.J. Eds. , Mantle Metasomatism. Acad. Press
Geol. Series, pp. 389–422.Lupton, J., 1983. Terrestrial inert gases: isotope tracer studies and
clues to primordial components in the mantle. Ann. Rev. EarthPlanet. Sci. 11, 371–414.
Marty, B., 1995. Nitrogen content of the mantle inferred fromN –Ar correlation in oceanic basalts. Nature 377, 326–329.2
Marty, B., Jambon, A., 1987. Cr 3He in volatile fluxes from thesolid Earth: Implications for carbon geodynamics. Earth Planet.Sci. Lett. 83, 16–26.
Marty, B., Le Cloarec, M.F., 1992. Helium-3 and CO fluxes2
from subaerial volcanoes estimated from Polonium-210 emis-sions. J. Volcanol. Geotherm. Res. 53, 67–72.
Marty, B., Jambon, A., Sano, Y., 1989. Helium isotopes and CO2
in volcanic gases of Japan. Chem. Geol. 76, 25–40.Marty, B., Gunnlaugsson, E., Jambon, A., Oskarsson, N., Ozima,
M., Pineau, F., Torssander, P., 1991. Gas geochemistry ofgeothermal fluids, the Hengill area, southwest rift zone ofIceland. Chem. Geol. 91, 207–225.
Marty, B., Meynier, V., Nicolini, E., Griesshaber, E., Toutain,J.P., 1993a. Geochemistry of gas emanations: a case study ofthe Reunion Hot Spot, Indian Ocean. Appl. Geochem. 8,´141–152.
Marty, B., Approva, I., Barrat, J.-A.A., Deniel, C., Vellutini, P.,Vidal, Ph., 1993b. He, Ar, Sr, Nd and Pb isotopes in volcanicrocks from Afar: Evidence for a primitive mantle componentand constraints on magmatic sources. Geochem. J. 27, 219–228.
Marty, B., Lenoble, M., Vassard, N., 1995. Nitrogen, helium andargon in basalt: a static mass spectrometry study. Chem. Geol.120, 183–195.
Marty, B., Pik, R., Yirgu, G., 1996. Helium isotopic variations inEthiopian plume lavas: nature of magmatic sources and limiton lower mantle contribution. Earth Planet. Sci. Lett.
Mohr, P., Zanettin, B., 1988. The Ethiopian flood basalt province.Ž .In: McDougall, J.D. Ed. , Continental Flood Basalts. Kluwer,
Dordrecht, pp. 63–110.Moreira, M., Staudacher, Th., Sarda, Ph., Schilling, J.-G., Allegre,`
C.J., 1995. A primitive plume neon component in MORB: theŽ .Shona ridge-anomaly, South Atlantic 51–528S . Earth Planet.
Sci. Lett. 133, 367–377.O’Nions, R.K., McKenzie, D., 1993. Estimates of mantle tho-
riumruranium ratios from Th, U and Pb isotope abundances inbasaltic melts. Philos. Trans. R. Soc. London A 342, 65–77.
O’Nions, R.K., Oxburgh, E.R., 1988. Helium, volatile fluxes andthe development of the continental crust. Earth Planet. Sci.Lett. 90, 331–347.
O’Nions, R.K., Tolstikhin, I.N., 1994. Behaviour and residencetimes of lithophile and rare gas tracers in the upper mantle.Earth Planet. Sci. Lett. 124, 131–138.
O’Nions, R.K., Tolstikhin, I.N., 1996. Limits on the mass flux
between lower and upper mantle and stability of layering.Earth Planet. Sci. Lett. 139, 213–222.
Ozima, M., Zashu, S., 1983. Noble gases in submarine pillowvolcanic glasses. Earth Planet. Sci. Lett. 62, 24–40.
Parsons, B., 1982. Causes and consequences of the relation be-tween area and age of the ocean floor. J. Geophys. Res. 87Ž .B1 , 289–302.
Pineau, F., Javoy, M., 1983. Carbon isotopes in mid oceanic ridgebasalts. Earth Planet. Sci. Lett. 62, 239–257.
Plank, T., Langmuir, C.H., 1988. An evaluation of the globalvariations in the major element chemistry of arc basalts. EarthPlanet. Sci. Lett. 90, 349–370.
Porcelli, D., Wasserburg, G.J., 1995a. Mass transfer of xenonthrough a steady-state upper mantle. Geochim. Cosmochim.Acta 59, 1991–2007.
Porcelli, D., Wasserburg, G.J., 1995b. Mass transfer of helium,neon, argon and xenon through a steady-state upper mantle.Geochim. Cosmochim. Acta 59, 4921–4937.
Porcelli, D.R., O’Nions, R.K., O’Reilly, S.Y., 1986. Helium andstrontium isotopes in ultramafic xenoliths. Chem. Geol. 54,237–249.
Poreda, R.J., Farley, K.A., 1992. Rare gases in Samoan xenoliths.Earth Planet. Sci. Lett. 113, 129–144.
Poreda, R., Schilling, J.-G., Craig, H., 1986. Helium and hydro-gen isotopes in ocean-ridge basalts north and south of Iceland.Earth Planet. Sci. Lett. 78, 1–17.
Poreda, R.J., Shilling, J.-G., Craig, H., 1993. Helium isotoperatios in Easter microplate basalts. Earth Planet. Sci. Lett. 119,319–329.
Reymer, A., Schubert, G., 1984. Phanerozoic addition rates to thecontinental crust and crustal growth. Tectonics 3, 63–78.
Rison, W., Craig, H., 1983. Helium isotopes and mantle volatilesin Loihi Seamount and Hawaiian Island basalts and xenoliths.Earth Planet. Sci. Lett. 66, 407–426.
Sano, Y., Marty, B., 1995. Origin of carbon in fumarolic gas fromŽ .island arcs. Chem. Geol. Isot. Geosci. Sect. 119, 265–274.
Sano, Y., Williams, S.N., 1996. Fluxes of mantle and subductedcarbon along convergent plate boundaries. Geophys. Res. Lett.23, 2749–2752.
Sarda, P., Graham, D., 1990. Mid-ocean ridge popping rocks:implications for degassing at ridge crests. Earth Planet. Sci.Lett. 97, 268–289.
Sarda, P., Staudacher, T., Allegre, C.J., 1988. Neon isotopes in`submarine basalts. Earth Planet. Sci. Lett. 91, 73–88.
Seward, T.M., Kerrick, D.M., 1996. Hydrothermal CO emission2
from the Taupo Volcanic zone, New Zealand. Earth Planet.Sci. Lett. 139, 105–113.
Sleep, N.H., 1990. Hotspots and mantle plumes: some phe-nomenology. J. Geophys. Res. 95, 6715–6736.
Sobolev, A.V., Shimizu, N., 1993. Ultra-depleted primary meltincluded in an olivine from the Mid-Atlantic Ridge. Nature363, 151–154.
Staudacher, Th., Allegre, C.J., 1989. Noble gases in glass samples`from Tahiti: Teahitia, Rocard and Mehetia. Earth Planet. Sci.Lett. 93, 210–222.
Staudacher, T., Kurz, M.D., Allegre, C.J., 1986. New noble-gas`data on glass samples from Loihi seamount and Hualalai and
( )B. Marty, I.N. TolstikhinrChemical Geology 145 1998 233–248248
on dunites samples from Loihi and Reunion Island. Chem.Geol. 56, 193–205.
Staudacher, Th., Sarda, Ph., Richardson, S.H., Allegre, C.J., Sanga,`I., Dmitriev, L.V., 1989. Noble gases in basalt glasses from aMid-Atlantic ridge topographic high at 140N: Geodynamicconsequences. Earth Planet. Sci. Lett. 96, 119–133.
Tolstikhin, I.N., Marty, B., 1998. The evolution of terrestrialvolatiles: a view from helium, neon, argon and nitrogenisotope modelling. Chem. Geol. 147, in press.
Tolstikhin, I.N., Dokuchaeva, V.S., Kamensky, I.L., Amelin,Yu.A., 1992. Juvenile helium in ancient rocks, II. U–He,K–Ar, Sm–Nd, and Rb–Sr systematics in the Monche Pluton:3Her 4 He ratios frozen in uranium-free ultramafic rocks.Geochim. Cosmochim. Acta. 56, 987–999.
Torgersen, T., 1989. Terrestrial helium degassing fluxes and theatmospheric helium budget: implications with respect to thedegassing processes of the continental crust. Chem. Geol.Ž .Isot. Geosci. Sect. 79, 1–14.
Trull, T.W., Perfit, M.R., Kurz, M., 1990. He and Sr constraintson subduction contributions to Woodlark basin volcanism,Solomon Islands. Geochim. Cosmochim. Acta 54, 441–453.
Trull, T., Nadeau, S., Pineau, F., Polve, M., Javoy, M., 1993.´C–He systematics in hot spot xenoliths: implications for man-tle carbon contents and carbon recycling. Earth Planet. Sci.Lett. 118, 43–64.
Valbracht, P.J., Honda, M., Matsumoto, T., Mattielli, N., Mc-Dougall, I., Ragettli, R., Weis, D., 1996. Helium, neon andargon isotope systematics in Kerguelen ultramafic xenoliths:implication for mantle source signatures. Earth Planet. Sci.Lett. 138, 29–38.
Varekamp, J.C., Kreulen, R., Poorter, R.P.E., Van Bergen, M.I.,1992. Carbon sources in arc volcanism, with implications forthe carbon cycle. Terra Nova 4, 363–373.
Welhan, T.A., Craig, H., 1983. Methane, hydrogen and helium inhydrothermal fluids at 218N on the East Pacific Rise. In: Pona,
Ž .P.A., Bostrom, K., Laubier, L., Smith, K.L. Jr. Eds. , Hy-drothermal Processes of Sea-floor Spreading Centers. Plenum,New York, pp. 391–409.
White, R.S., McKenzie, D., 1995. Mantle plumes and floodŽ .basalts. J. Geophys. Res. 100 B9 , 17543–17585.
Williams, S.N., Schaeffer, S.J., Calvache, V.M.L., Lopez, D.,1990. Carbon dioxide emission to the atmosphere by volcanos.Geol. Soc. Am. Abstr. Progr. 22, A195.
Williams, S.N., Schaeffer, S.J., Calvache, V.M.L., Lopez, D.,1992. Global carbon dioxide emission to the atmosphere byvolcanoes. Geochim. Cosmochim. Acta 56, 1765–1770.
York, D., 1967. The best isochron. Earth Planet. Sci. Lett. 2,479–482.