Embed Size (px)
Citation preview

1
Co-Optimization of Fuels & Engines Efficiency Merit Function for Spark-Ignition Engines
Revisions and Improvements Based on FY16–17 Research
January 2018

CO-OPTIMIZATION OF FUELS & ENGINES EFFICIENCY MERIT FUNCTION FOR SPARK-IGNITION ENGINES
ii
About the Co-Optimization of Fuels & Engines Initiative This is one of a series of reports produced as a result of the Co-Optimization of Fuels & Engines (Co-Optima) initiative, a Department of Energy (DOE)–sponsored effort initiated to simultaneously investigate advanced engine designs and the enabling fuel properties. This first-of-its-kind effort is designed to provide American industry with the scientific underpinnings needed to maximize vehicle performance and efficiency and leverage domestic fuel resources, leading to greater transportation energy affordability, reliability, and security.
Co-Optima brings together DOE’s Office of Energy Efficiency & Renewable Energy (EERE), 9 national laboratories, 13 universities, and numerous industry and government stakeholders in a collaboration exploring solutions with potential for near-term improvements to the types of fuels and engines found in most vehicles currently on the road, as well as to the development of revolutionary engine technologies for a longer-term, higher-impact series of solutions.
In addition to the EERE Vehicle Technologies and Bioenergy Technologies Offices, the Co-Optima team includes representatives from the National Renewable Energy Laboratory and Argonne, Idaho, Lawrence Berkeley, Lawrence Livermore, Los Alamos, Oak Ridge, Pacific Northwest, and Sandia National Laboratories. More details on the project—as well as the full series of reports—can be found at www.energy.gov/fuel-engine-co-optimization.
Availability This report is available electronically at no cost from SciTech Connect: http:/www.osti.gov/scitech.
Citation Please cite this report as follows.
Miles, Paul. “Efficiency Merit Function for Spark Ignition Engines: Revisions and Improvements Based on FY16–17 Research.” Technical Report. U.S. Department of Energy, Washington, DC. 2018. DOE/GO-102018-5041.
Note This report was prepared as an account of work sponsored by an agency of the United States government. Neither the United States government nor any agency thereof, nor any of their employees, makes any warranty, express or implied, or assumes any legal liability or responsibility for the accuracy, completeness, or usefulness of any information, apparatus, product, or process disclosed, or represents that its use would not infringe privately owned rights. Reference herein to any specific commercial product, process, or service by trade name, trademark, manufacturer, or otherwise does not necessarily constitute or imply its endorsement, recommendation, or favoring by the United States government or any agency thereof. The views and opinions of authors expressed herein do not necessarily state or reflect those of the United States government or any agency thereof.
This report is disseminated by the Department of Energy. As such, the document was prepared in compliance with Section 515 of the Treasury and General Government Appropriations Act for
CO-OPTIMIZATION OF FUELS & ENGINES EFFICIENCY MERIT FUNCTION FOR SPARK-IGNITION ENGINES
iii
Fiscal Year 2001 (Public Law No. 106-554) and information quality guidelines issued by the Department of Energy. Though this report does not constitute “influential” information, as that term is defined in DOE’s information quality guidelines or the Office of Management and Budget’s Information Quality Bulletin for Peer Review (Bulletin), as detailed on the Acknowledgments page, the report was reviewed both internally and externally prior to publication.
Report Contributors and Roles Lead Author Paul Miles, Sandia National Laboratories
Contributing Authors/Technical Teams Autoignition and Heat of Vaporization
• Christopher Kolodziej, Argonne National Laboratory
• Magnus Sjöberg, Sandia National Laboratories
• Scott Sluder, Oak Ridge National Laboratory
• Jim Szybist, Oak Ridge National Laboratory
• David Vuilleumier, Sandia National Laboratories
• Brad Zigler, National Renewable Energy Laboratory (Team Lead)
Laminar Flame Speed • Christopher Kolodziej, Argonne National Laboratory (Team Lead)
• Magnus Sjöberg, Sandia National Laboratories
• Jim Szybist, Oak Ridge National Laboratory
• David Vuilleumier, Sandia National Laboratories
• Scott Wagnon, Lawrence Livermore National Laboratory
Low Speed Pre-Ignition Derek Splitter, Oak Ridge National Laboratory (Team Lead)
Catalyst Warmup • Joshua Pihl, Oak Ridge National Laboratory (Team Lead)
• Todd Toops, Oak Ridge National Laboratory
Particulate Matter • Melanie Debusk, Oak Ridge National Laboratory
• Matthew Ratcliff, National Renewable Energy Laboratory (Team Lead)
• Magnus Sjöberg, Sandia National Laboratories
• John Storey, Oak Ridge National Laboratory
CO-OPTIMIZATION OF FUELS & ENGINES EFFICIENCY MERIT FUNCTION FOR SPARK-IGNITION ENGINES
iv
Acknowledgments This report and the work described were sponsored by the U.S. Department of Energy (DOE) Bioenergy Technologies Office (BETO) and Vehicle Technologies Office (VTO) under the DOE Co-Optimization of Fuels and Engines Initiative. The authors gratefully acknowledge the support and direction of Alicia Lindauer at BETO, Kevin Stork at VTO, the Co-Optima leadership team, and Reuben Sarkar, former Deputy Assistant Secretary for Transportation.
The following U.S. Department of Energy Office of Energy Efficiency and Renewable Energy (EERE) officials and managers played important roles in establishing the project concept, advancing implementation, and providing ongoing guidance.
DOE Office of Energy Efficiency and Renewable Energy • Steven Chalk, Deputy Assistant Secretary for Transportation
Bioenergy Technologies Office • Jonathan Male, Director • Alicia Lindauer, Technology Manager • Borka Kostova, Technology Manager
Vehicle Technologies Office • Michael Berube, Director • Gurpreet Singh, Program Manager, Advanced Combustion Engines Program • Kevin Stork, Technology Manager, Fuel Technologies • Mike Weismiller, Technology Manager
National Laboratory Project Management Team • John Farrell (Technical Monitor), National Renewable Energy Laboratory • John Holladay, Pacific Northwest National Laboratory • Chris Moen, Sandia National Laboratories • Robert Wagner, Oak Ridge National Laboratory
This report was reviewed by: • John Farrell, National Renewable Energy Laboratory • Daniel Gaspar, Pacific Northwest National Laboratory • John Holladay, Pacific Northwest National Laboratory • Robert McCormick, National Renewable Energy Laboratory • Chris Moen, Sandia National Laboratories • Robert Wagner, Oak Ridge National Laboratory
CO-OPTIMIZATION OF FUELS & ENGINES EFFICIENCY MERIT FUNCTION FOR SPARK-IGNITION ENGINES
v
Table of Contents List of Figures ............................................................................................................................................ vi
List of Tables ............................................................................................................................................. vii
Abbreviations and Acronyms ................................................................................................................. viii
Variables and Derived Quantities ............................................................................................................ x
Executive Summary .................................................................................................................................. xi
1. Introduction and Background ............................................................................................................ 1
2. The Efficiency Merit Function ............................................................................................................. 1 2.1 Fuel Property Evaluation and Benchmark Fuel Properties .................................................... 1 2.2. Metric of Autoignition—RON and Sensitivity ............................................................................ 2 2.3 Heat of Vaporization ..................................................................................................................... 4 2.4 Laminar Flame Speed .................................................................................................................. 5
2.4.1. Origins of the Laminar Flame Speed Term in the Boosted SI Merit Function ........ 5 2.4.2 Flame Speed Impact on EGR Dilution Tolerance ......................................................... 6 2.4.3 Efficiency Increase from Exhaust Gas Recirculation ................................................... 7 2.4.4 Flame Speed Efficiency Increase .................................................................................... 7 2.4.5 Baseline Gasoline Laminar Flame Speed ..................................................................... 8 2.4.6 Additional Considerations ................................................................................................ 9
2.4.6.1 Effects of Laminar Flame Speed Under Non-Dilute Conditions ......................... 9 2.4.6.2 Programmatic Observations and Recommendations ........................................ 9
2.5 Low Speed Pre-Ignition ............................................................................................................. 10 2.6 Particulate Matter ...................................................................................................................... 14 2.7 Catalyst Warmup ....................................................................................................................... 17
3. References ......................................................................................................................................... 20
4. Bibliography ....................................................................................................................................... 24
Appendix A. Additional Details on Individual Merit Function Terms ............................................... 26 A.1 Additional Material Describing RON and Sensitivity (Szybist and Vuilleumier) ............... 26 A.2 K-Factor Discussion (Szybist and Vuilleumier) ...................................................................... 29
A.2.1 K-Factor Value ................................................................................................................. 29 A.2.2 K-Factor Shortcomings .................................................................................................. 29 A.2.3 Additional References ................................................................................................... 30
A.3 Discussion of HoV Term (Sjöberg and Vuilleumier) .............................................................. 31 A.4. Updated HoV Terms .................................................................................................................. 34
A.4.1 HoV Catalyst Protection Term (Ratcliff and Szybist) ................................................. 34 A.4.2 Additional Reference for HoV Catalyst Protection Term Discussion ...................... 36
A.5 Supplemental Material Related to Particulate Matter Index ............................................. 36 A.5.1 PM Emission Regulations ............................................................................................. 36 A.5.2 Fuel Properties and Chemistry ..................................................................................... 37 A.5.3 Additional Particulate Matter References .................................................................. 40

CO-OPTIMIZATION OF FUELS & ENGINES EFFICIENCY MERIT FUNCTION FOR SPARK-IGNITION ENGINES
vi
List of Figures Figure 1. Knock-limited combustion phasing as a function of OI (Szybist and Splitter 2017). ............ 3
Figure 2. Increased dilution tolerance with higher-LFS fuels (Fuels 5 & 4) allowed increased engine ITE. ....................................................................................................................................... 7
Figure 3. Measured in-cylinder pressure for SPI events relative to typical combustion events and variability. ...................................................................................................................................... 10
Figure 4. ASTM D86 results of the molecules from Table 1 at 25% by mass with gasoline, and neat gasoline. ............................................................................................................................... 12
Figure 5. Box and scatter plot of peak cylinder pressure, box represents interquartile range, whiskers represent outliers, data binned by 20-bar increments. ................................................ 12
Figure 6. Histogram of location of peak cylinder pressure for SPI cycles relative to mean peak pressure location, histogram binned by 5 crank angles. ............................................................. 13
Figure 7. Measured SPI trend as a function of LFV150 (bars) compared to estimated SPI trend using the LFV150 approach (grey line), data normalized to maximum LFV150 value ................... 14
Figure 8. Engine efficiency effects of the PM Control term. .............................................................. 16
Figure A.1. Knock-limited combustion phasing of Co-Optima core fuels and RD5-87 over a range of conditions for both steady-state and transient operation. ............................................ 26
Figure A.2. Knock-limited combustion phasing as a function of OI. .................................................. 27
Figure A.3. OI K-factors at 100 kPa intake pressure, 30°C intake temperature, and knock-limited operation. .............................................................................................................. 27
Figure A.4. Net thermal efficiencies at steady state, knock-limited conditions. ............................... 28
Figure A.5. Pressure-temperature trajectory of the unburned gas and the resultant K value. Note that, by definition, KRON = 0, and KMON = 1. .................................................................... 30
Figure A.6. For throttled stoichiometric SI operation, the main AHRR profiles are identical for RD3-87 gasoline and E85 blended from RD3-87. Spark-to-main combustion delays (inflammation times) are also identical and ST = -14°CA was used for both fuels. The inherent higher flame speed of E85 compensates for the lower reactant temperatures. ITE of gasoline = 31.71%, ITE of E85 = 32.73%. ......................................................................... 32
Figure A.7. For N2-diluted (simulated EGR) stoichiometric operation, the main AHRR is not |affected by addition of 30% ethanol to certification gasoline. Also, the inflammation time remains independent of ethanol addition. ITE of Gasoline = 31.94%, ITE of E30 = 32.47%. Absolute gain = 0.53%, relative gain = 1.66%. ............................................................................ 32
Figure A.8. The HoV required to achieve a certain amount of relative gain of thermal efficiency. .. 33
Figure A.9. Comparisons of HoV Term 1 and Term 2 values for an E10 baseline, E85, and hypothetical matched HoV but low-AFR fuel. ............................................................................... 34
Figure A.10. Exhaust temperature for E85 and reformulated gasoline as functions of compression ratio for wide open throttle (WOT) and throttled operating conditions. ................ 34
CO-OPTIMIZATION OF FUELS & ENGINES EFFICIENCY MERIT FUNCTION FOR SPARK-IGNITION ENGINES
vii
Figure A.11. Comparison of enrichment for isooctane, B88E10-R93 and B88E50-R105 at 12:1 CR and 3,500 rpm (adapted from Stein et al. [2012]). ...................................................... 35
Figure A.12. Engine efficiency impacts for PM control with 500-bar fuel pressure versus a GPF. ............................................................................................................................................ 37
Figure A.13. Comparison of PMI predictions of PM at 2,500 rpm and 13 bar net IMEP (Condition A) with those at 1,500 rpm and 10 bar net IMEP (Condition D). ............................... 38
Figure A.14. Steady-state (red triangles) and cumulative cold-start (blue squares) soot production with the three core Co-Optima fuels, plus cold-start soot emissions for five additional fuels. ............................................................................................................................ 39
Figure A.15. Engine-out PM data for Co-Optima core fuels. .............................................................. 40
List of Tables Table 1. Molecules Blended at 25% by Mass with Haltermann EEE Tier II
Premium Grade Gasoline ............................................................................................................. 11
Table A.1. Thermal Efficiency Gains per Increase in Fuel OI, Both on an Absolute and Relative Basis ......................................................................................................... 28
CO-OPTIMIZATION OF FUELS & ENGINES EFFICIENCY MERIT FUNCTION FOR SPARK-IGNITION ENGINES
viii
Abbreviations and Acronyms AFR air-to-fuel ratio
AHRR apparent heat-release rate
ASSERT Analysis of Sustainability, Scale, Economics, Risk, and Trade
BETO Bioenergy Technologies Office
BOB blendstock for oxygenate blending
CARB California Air Resources Board
cm/s centimeters per second
DBE double bond equivalent
DI direct injection
DOE U.S. Department of Energy
EEE electrical, electronic, and electromechanical
EGR exhaust gas recirculation
EPA U.S. Environmental Protection Agency
Exx a gasoline-ethanol blend with xx% ethanol by volume
FACE Fuels for Advanced Combustion Engines
FBP fuel boiling point
FTP Federal Test Procedure
GDI gasoline direct injection
GPF gasoline particulate filter
HoV heat of vaporization
IMEP indicated mean effective pressure
ITE indicated thermal efficiency
kg kilogram
kJ kilojoule
CO-OPTIMIZATION OF FUELS & ENGINES EFFICIENCY MERIT FUNCTION FOR SPARK-IGNITION ENGINES
ix
LEV low emissions vehicle
LFS laminar flame speed
LFV liquid fuel volume
LHV lower heating value
LO light off
mg milligram
MJ megajoule
MON motor octane number
OI octane index
ON octane number
PM particulate matter
PMI particulate matter index
RON research octane number
rpm revolutions per minute
S sensitivity
SI spark ignition
SPI stochastic pre-ignition
TWC three-way catalyst
Txx the temperature at which xx% of a fuel sample is evaporated
vol% percent by volume
VTO Vehicle Technologies Office
WOT wide open throttle

CO-OPTIMIZATION OF FUELS & ENGINES EFFICIENCY MERIT FUNCTION FOR SPARK-IGNITION ENGINES
x
Variables and Derived Quantities afr air/fuel ratio
f fuel consumption rate
fC fuel consumption rate during cold start
FFTP fuel consumed during the entire FTP cycle
fH fuel consumption rate during hot start
H(x) Heaviside step function
K coefficient multiplying sensitivity in the octane index
LFV150 liquid fuel volume remaining at a temperature of 150°C
OI octane index
Pi blendstock properties
PMI particulate matter index
Pu pressure in the unburned gas
S octane sensitivity
SL flame speed
Tc,90 catalyst light-off temperature
tLO time to achieve catalyst light-off
Tu temperature in the unburned gas
ul, SL laminar flame speed
ΔFLO fuel penalty during cold start
ΔP pressure rise from stochastic pre-ignition events
γ ratio of specific heats
CO-OPTIMIZATION OF FUELS & ENGINES EFFICIENCY MERIT FUNCTION FOR SPARK-IGNITION ENGINES
xi
Executive Summary Early in fiscal year 2016 (FY16), a fuel efficiency “merit function” was developed to provide a simple tool to evaluate the potential thermal efficiency benefits of various fuels when multiple fuel properties or performance metrics are changing simultaneously. This tool was intended to help the Co-Optima High Performance Fuels and the ASSERT (Analysis of Sustainability, Scale, Economics, Risk, and Trade) teams better understand fuel–engine interactions. It also has proven to be useful for evaluating various fuel candidates, however, and provides a useful framework for capturing and summarizing results from multiple projects within the Co-Optima Fuel Properties and Advanced Engine Development research portfolios. The objective of this report is to collect pertinent research results from FY16 and the first half of FY17, and to integrate them into an improved merit function.
Since commencing the Co-Optima initiative, the team has made significant progress in refining the merit function. Coefficients defining the sensitivity of engine efficiency to fuel properties have been refined, new properties or metrics of fuel performance have been defined, terms have been modified to incorporate additional physics, new terms have been added to the merit function, and other terms have been removed based on a better understanding of their uncertainties. As was done previously, the merit function has been developed such that its numerical value corresponds to the relative efficiency benefit that can be achieved when fuels and engines are co-optimized.
The benchmark fuel used for comparison—the properties of which are embedded in the merit function—remains unchanged: an anti-knock index of 87 E10 gasoline with a research octane number (RON) of 91 and a motor octane number (MON) of 83, giving a sensitivity (S = RON - MON) of 8. Assuming that an ethanol mole fraction of 0.21 yields a heat of vaporization (HoV) of 415 kJ/kg, a flame speed (SL) of 46 centimeters per second (cm/s), a lower heating value (LHV) of 42 MJ/kg, a particulate matter index (PMI) of 1.4, and a stoichiometric air-fuel ratio (AFR) of 14.0. The merit function is intended to be evaluated using the properties of the final, blended fuel, as indicated by the subscript mix.
The revised merit function is:
( )[ ]( )mixcconvc
mixmix
mixL
mixmix
mixmix
mixmix
TTCPMIPMIH
scmS
kgkJAFRHoV
kgkJAFRHoVkgkJON
SKRONMerit
,90,,90,1008.0
)4.1(5.07.06.14.5
])/[46(2.15
)))1][0.14/(]/[415())1/(((6.1
)))1][0.14/(]/[415())1/(((]//[085.06.1
)8(6.1
)91(
−°+
−+−−
−+
+−−++
+−−+⋅+
−−
−=
−
CO-OPTIMIZATION OF FUELS & ENGINES EFFICIENCY MERIT FUNCTION FOR SPARK-IGNITION ENGINES
xii
Significant changes to the original merit function are as follows.
• Terms representing the benefits of high RON and octane sensitivity (S) are unchanged, but a value for K of -1.25 is recommended—reflecting the fact that anti-knock behavior along the peak torque curve constrains compression ratio and impacts efficiency over the full map.
• Terms capturing the impact of fuel HoV now capture the impact of concurrent changes to the stoichiometric air-fuel ratio.
• The sensitivity of engine efficiency to the laminar flame speed (SL) is lower, based on new data from two projects that better capture the impacts of SL on dilute, stoichiometric, homogeneous spark ignition (SI) combustion.
• The physics of the PMI term have been revisited and the term revised, though it retains much of its original form.
• A new term (ΔFLO) for the fuel economy penalty associated with cold-start strategies promoting catalyst light-off is included.
• The term reflecting the impact of the fuel distillation curve on stochastic pre-ignition (SPI) phenomena has been removed, despite the clear relevance of SPI to the fuel-efficiency benefits that can be achieved by engine downspeeding and downsizing. Significant additional research characterizing both physical property and chemical structure impacts is needed to put this term on firmer ground.
In addition to further research into the impact of fuel properties on SPI, several additional areas for future research have been identified. These areas include previously unconsidered phenomena where fuel properties can be expected to impact engine efficiency, investigations of existing fuel properties or performance metrics where current understanding limits the utility of the merit function, and definition and characterization of new fuel performance properties or metrics where existing ones have proven inadequate. Specific projects that would address these issues include the following.
• Investigating a more rigorous metric to characterize fuel autoignition resistance; RON, MON, and the current octane index (OI) construct all have proven to be flawed.
• Continuing work to unravel the interactions between the fuel HoV and auto-ignition resistance metrics such as RON. Interactions between HoV and laminar flame speed also are poorly understood.
• Characterizing the fuel savings enabled by high HoV fuels at high loads due to reduced need for enrichment to control exhaust gas temperature.
• Gaining a better understanding of dilution effects—including lean mixtures—on laminar flame speed. Performing both engine experiments and developing better modeling capabilities. There is a particular need to develop improved laminar flame speed blending models. Additional work also is required to evaluate the impacts of laminar flame speed on non-dilute SI combustion.
CO-OPTIMIZATION OF FUELS & ENGINES EFFICIENCY MERIT FUNCTION FOR SPARK-IGNITION ENGINES
xiii
• Filling the knowledge gaps related to correlation of PMI with gasoline particulate filter loading and increased backpressure—and subsequent impacts on engine efficiency. Improvements to PMI that correct for HoV effects and oxygenate soot chemistry also are needed.
• Characterizing fuel chemistry and property effects on cold-start, catalyst-out PM emissions, which appear to deviate from PMI predictions.
• Testing and quantifying fuel-catalyst interactions and their impact on fuel consumption during the catalyst warm-up period.

CO-OPTIMIZATION OF FUELS & ENGINES EFFICIENCY MERIT FUNCTION FOR SPARK-IGNITION ENGINES
1
1. Introduction and Background To assist in making an initial down-selection of promising fuel blendstock candidates, it is useful to define a fuel “merit function.” This tool is intended to help understand which fuel properties offer the greatest potential engine efficiency improvements and to help systematically rank blendstock candidates when several fuel properties are varying simultaneously. The merit function is focused solely on how fuel properties affect engine efficiency. Although pollutant emissions, vehicle cost, environmental and infrastructure considerations, production potential, and various societal impacts also are important, these factors are considered within a broader evaluation using other analysis tools.
The merit function described here is applicable only to fuel blendstocks targeted at stoichiometric, spark-ignition (SI) engines operating in conventional flame propagation combustion modes (hereafter referred to as “Boosted SI” blendstocks). Although this is a second revision to the merit function, the merit function remains incomplete and subject to further revision and improvement. In particular, analysis of the uncertainty in the sensitivity of engine efficiency to each of the terms, and hence the confidence one should have in the final “merit,” is required. Continuing to clarify and quantify engine-fuel interactions and improve the estimation of a fuel’s merit is one of the central objectives of the research currently being performed by the Advanced Engine Development and Fuel Properties teams. Accordingly, the formulation presented here should be viewed as a first approximation requiring considerable refinement as the state of knowledge progresses.
2. The Efficiency Merit Function 2.1 Fuel Property Evaluation and Benchmark Fuel Properties The merit of a blendstock is assessed by the efficiency gain achieved when blended with a baseline fuel representative of a current “regular” gasoline grade. This grade is assumed to have a research octane number (RON) of 91 and a motor octane number (MON) of 83, giving a sensitivity (S = RON - MON) of 8 and anti-knock index ((RON + MON)/2) of 87. Also, assuming a baseline fuel ethanol content of 10 vol% yields a heat of vaporization (HoV) of 415 kilojoules per kilogram (kJ/kg), a flame speed of 46 centimeters per second (cm/s), an LHV of 42 megajoules per kilogram (MJ/kg), a particulate matter index (PMI) of 1.4, and a stoichiometric air-fuel ratio (AFR) of 14.0. The ethanol mole fraction is approximately 0.21 when calculated with a liquid molar volume ratio of 0.42 (see Anderson et al. [2012]). Such a fuel could be produced by blending ethanol with a petroleum-based blendstock for oxygenate blending (BOB) with a RON = 84, a MON = 79, a HoV = 350 kJ/kg, a flame speed of 44 cm/s, an LHV of 43.8 MJ/kg, and a PMI of 1.5.
The merit function is written as a linear combination of the blended fuel properties that are expected to exert a significant impact on efficiency. Blending models that allow the prediction of mixture properties still are being developed; accordingly, it is proposed that a simple linear model be adopted based on the fuel mixture blendstock properties (Pi) and the mole fraction of each blendstock (χi).

CO-OPTIMIZATION OF FUELS & ENGINES EFFICIENCY MERIT FUNCTION FOR SPARK-IGNITION ENGINES
2
ii
imix PP ∑= χ
Much of the nonlinearity in mixture properties, such as mixture RON, is removed when the mixture properties are computed based on mole fraction rather than mass fraction or volume fraction. It is anticipated that with this formulation the mole fraction of the blendstock can reflect realistic estimates of potential production volume developed by the Analysis of Sustainability, Scale, Economics, Risk, and Trade (ASSERT) team.
The revised merit function is as follows.
( )[ ]( )mixcconvc
mixmix
mixL
mixmix
mixmix
mixmix
TTCPMIPMIH
scmS
kgkJAFRHoV
kgkJAFRHoVkgkJON
SKRONMerit
,90,,90,1008.0
)4.1(5.07.06.14.5
])/[46(2.15
)))1][0.14/(]/[415())1/(((6.1
)))1][0.14/(]/[415())1/(((]//[085.06.1
)8(6.1
)91(
−°+
−+−−
−+
+−−++
+−−+⋅+
−−
−=
−
H(x) represents the Heaviside step function. The numerical value of the merit function corresponds to the relative efficiency benefit of the fuel blend being examined in comparison to a baseline AKI 87 E10 gasoline. Each of the terms and the variables they contain are described in greater detail in the following sections.
2.2. Metric of Autoignition—RON and Sensitivity Fuel octane is a measure of its knock resistance. Here Kalghatgi (2001) is followed and the octane index (OI) is used to characterize a fuel’s effective octane rating.
KSRONOI −=
where S is the fuel octane sensitivity (RON – MON) and K is an engine-dependent constant that depends on design parameters and operating conditions. Increasing OI enables the engine compression ratio to be raised, leading to a greater thermodynamic efficiency. Even at a fixed compression ratio, however, an increased OI allows engine operation at mid to high loads with a greater knock-limited spark advance, also resulting in higher efficiency.
Determining the impact of OI on engine efficiency is not straightforward, as it encompasses both engine design parameters as well as details of the engine operating conditions within the speed/load map. Here the two-step approach of Chow et al. (2014) and Leone et al. (2015) among others is followed. First, assume that an increase in OI of three points allows an increase in engine compression ratio of 1 which, in turn, results in an average increase in efficiency of about 1.6%. Due to the increased efficiency and improved knock-limited performance, the
CO-OPTIMIZATION OF FUELS & ENGINES EFFICIENCY MERIT FUNCTION FOR SPARK-IGNITION ENGINES
3
engine produces higher torque and can be downsized, resulting in additional efficiency improvements. This efficiency boot-strapping effect of downsizing is expected to differ between naturally aspirated and boosted engines, but using an additional efficiency multiplier of 1.2 represents an average expected gain. Consequently, an increase in OI of 3 leads to an expected increase in efficiency of 1.9% or, equivalently, an increase in OI of 1.6 leads to an efficiency increase of 1%.
Normalization of the terms in the merit function related to OI (RON and S) by the factor 1.6 therefore makes their value correspond to the expected percentage increase in efficiency. Note that this efficiency increase is an expected “average” over the speed-load map. When coupled with Autonomie-like modeling to deduce the associated fuel economy improvement, previous work has applied the efficiency increase uniformly over the engine speed-load map (Chow et al. 2014).
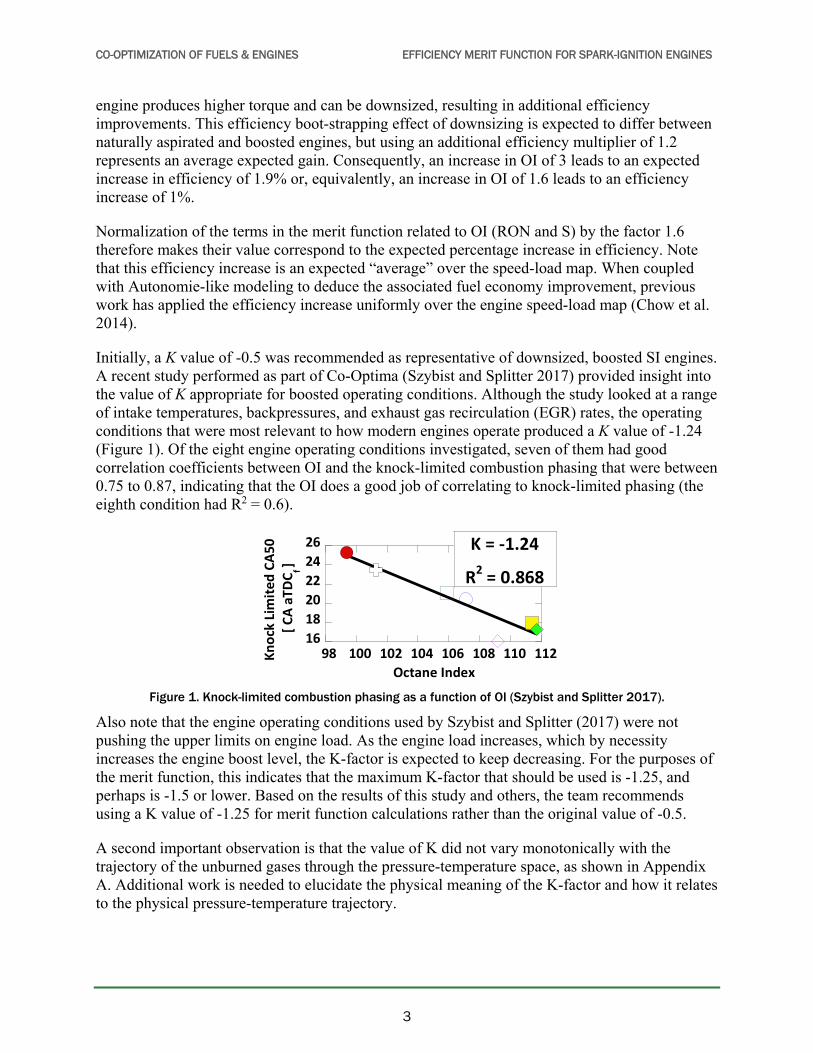
Initially, a K value of -0.5 was recommended as representative of downsized, boosted SI engines. A recent study performed as part of Co-Optima (Szybist and Splitter 2017) provided insight into the value of K appropriate for boosted operating conditions. Although the study looked at a range of intake temperatures, backpressures, and exhaust gas recirculation (EGR) rates, the operating conditions that were most relevant to how modern engines operate produced a K value of -1.24 (Figure 1). Of the eight engine operating conditions investigated, seven of them had good correlation coefficients between OI and the knock-limited combustion phasing that were between 0.75 to 0.87, indicating that the OI does a good job of correlating to knock-limited phasing (the eighth condition had R2 = 0.6).
Figure 1. Knock-limited combustion phasing as a function of OI (Szybist and Splitter 2017).
Also note that the engine operating conditions used by Szybist and Splitter (2017) were not pushing the upper limits on engine load. As the engine load increases, which by necessity increases the engine boost level, the K-factor is expected to keep decreasing. For the purposes of the merit function, this indicates that the maximum K-factor that should be used is -1.25, and perhaps is -1.5 or lower. Based on the results of this study and others, the team recommends using a K value of -1.25 for merit function calculations rather than the original value of -0.5.
A second important observation is that the value of K did not vary monotonically with the trajectory of the unburned gases through the pressure-temperature space, as shown in Appendix A. Additional work is needed to elucidate the physical meaning of the K-factor and how it relates to the physical pressure-temperature trajectory.
161820222426
98 100 102 104 106 108 110 112Knoc
k Li
mite
d CA
50
[ CA
aTD
C f ]
Octane Index
K = -1.24
R2 = 0.868
CO-OPTIMIZATION OF FUELS & ENGINES EFFICIENCY MERIT FUNCTION FOR SPARK-IGNITION ENGINES
4
2.3 Heat of Vaporization Knock can be mitigated both through the inherent chemical autoignition resistance of a fuel represented by the OI, or by charge cooling. For direct-injection (DI) engines, the in-cylinder vaporization process reduces the charge temperature and can thus potentially provide improved efficiency through knock mitigation. Leone et al. (2015) provides additional background and a recent review.
There is a lack of consensus in the literature regarding the magnitude of the impact of charge cooling from fuel vaporization. A comprehensive, multi-cylinder engine study has indicated that for ethanol fractions of less than 30%, there is a negligible impact of HoV on knock limited spark advance and brake thermal efficiency at low to moderate loads when RON and MON are held constant (Leone et al. 2015). In contrast, Kasseris and Heywood (2012) report that increased HoV increases the effective octane rating at a rate of about 0.15 octane number (ON)/ethanol vol%, and that the rate of increase is approximately linear in ethanol fraction. Still other studies provide evidence that the effect of HoV is at least partially included in the RON test (Stein et al. 2012, Foong et al. 2013) and might not need to be accounted for separately.
The work by Foong et al. indicated that for ethanol fractions of less than about 40%, increasing HoV increases a fuel’s effective octane rating at a rate of only about 40% of the rate for ethanol blends of 40%. Studies with Cooperative Fuels Research engines, both by Foong et al. and within Co-Optima (Kolodziej et al. 2016), have indicated the effect of ethanol HoV on octane rating to be 0.015 to 0.06 ON/ethanol vol%, or in terms of fuel HoV 0.002 to 0.01 ON per kJ/kg. This sensitivity to HoV is significantly less than described by Kasseris and Heywood. Continuing work at Argonne National Laboratory using the Cooperative Fuels Research engine is expanding on previous work in an effort to provide a better understanding of the relationship between HoV and RON.
The issue is further complicated by the expectation that the fuel sensitivity impacts the effectiveness of vaporization cooling. Collaborative work performed by Oak Ridge National Laboratory and the National Renewable Energy Laboratory (Sluder et al. 2016) studying ethanol blends concluded that the impact of HoV is largely included as a thermal component of the octane sensitivity, S. Subsequent Co-Optima research, however, has determined that even with matched S, HoV might have additional knock mitigation potential. National Renewable Energy Laboratory researchers showed that, for fuels with matched RON and S but different HoVs, there was no difference in knock tendency at low intake-manifold temperature, but there was a substantial advantage at higher intake-manifold temperatures. A similar trend was observed in research conducted at Oak Ridge National Laboratory using the Co-Optima core fuels. Work at both the National Renewable Energy Laboratory and Oak Ridge National Laboratory is in alignment in that, for low intake-manifold temperatures, HoV is largely or completely accounted for by S. At greater intake-manifold temperature, however, HoV provides additional knock mitigation. Although low intake-manifold and intake valve closing temperatures at high load is typically preferable, this might not always be possible. In particular, at high engine speeds when engine breathing becomes less efficient, the higher trapped residuals act to increase the intake valve closing temperature. Recent work from Shell has also shown an impact of HoV, even when S is held constant (Janssen et al. 2016). The full implications of these findings are not fully understood, but do warrant further study.

CO-OPTIMIZATION OF FUELS & ENGINES EFFICIENCY MERIT FUNCTION FOR SPARK-IGNITION ENGINES
5
Until further clarification is obtained, the position is maintained that a fuel’s effective OI is impacted only modestly by HoV, and increases at a rate of about 0.01 ON per kJ/kg of HoV. This is equivalent to 0.06 ON/ethanol vol% (cf 0.16 ON/ethanol vol% adopted by Leone et al. (2015) for blends with ethanol fractions greater than 40%).
Heat of vaporization also impacts engine efficiency through other mechanisms. Here, the analysis largely relied on Jung et al. (2013). This research found that vaporization cooling increased the thermal efficiency of a throttled DI engine by about 4.2% between E0 and E85 or 1% for an increase in HoV of ~130 kJ/kg. This increase was due to reduced hydrocarbon and carbon monoxide emissions (~22%), increased pumping work (~-8%), and the HoV/LHV ratio1 (~50%). The balance primarily is due to reduced heat transfer. The estimate is likely conservative due to the relatively large displacement of the test engine compared to an expected downsized engine displacement.
The HoV terms in the initial version of the merit function do not account for changes in the stoichiometric AFR associated with different fuels. A lower AFR leads to greater cooling per unit mass of stoichiometric mixture; this is not captured by assessing the HoV of the fuel alone. Accordingly, both terms in the merit function describing the impact of HoV have been reformulated to account for the thermal mass of the mixture. Just as with the previous HoV term, the numerator of the second HoV term has been modified to account for differences in the stoichiometric AFR between fuels, and the denominator has been adjusted down to 15.38.
Although considerations are limited as to how HoV impacts engine efficiency, HoV can also have other important impacts on engine operation, such as cold-start behavior and differences in the degree of enrichment needed for catalyst protection. Both Szybist and Splitter (2017) and Stein et al. (2012) demonstrate that differences in HoV and combustion phasing can result in changes in exhaust temperature that can result in significant changes to the need for catalyst protection at conditions near peak torque. This effect is difficult to incorporate into the merit function because it strongly depends on the engine hardware system and the calibration. Some engines might not regularly operate at conditions where the HoV will mean the difference between enrichment and stoichiometric conditions, but other engine configurations cold operate there frequently. It therefore is recommended that this factor be taken into account when modeling individual systems in greater fidelity.
2.4 Laminar Flame Speed 2.4.1. Origins of the Laminar Flame Speed Term in the Boosted SI Merit Function It is known that fuels with higher laminar flame speed (LFS) also have higher EGR dilution tolerance before the combustion becomes unstable (Caton 2013). Therefore, an LFS term was included in the Boosted SI merit function to describe the potential engine indicated thermal efficiency (ITE) advantages of fuels with higher LFS under highly EGR dilute operating conditions. The current focus is to refine the effect of fuel LFS on highly dilute stoichiometric SI
1 The HoV/LHV ratio enters in due to the fact that the fuel HoV detracts from the measured LHV, but is energy that is available for free in an engine application.
CO-OPTIMIZATION OF FUELS & ENGINES EFFICIENCY MERIT FUNCTION FOR SPARK-IGNITION ENGINES
6
combustion efficiency through expanded dilution operation. Further investigations would be required to examine the effects of LFS at lower levels of EGR dilution, including no dilution and under lean or stratified SI combustion (Co-Optima advanced compression ignition).
In the work by Farrell et al. (2003), LFS measurements in a constant volume combustion chamber were reported for seven fuels in air over a range of equivalence ratios (ϕ = 0.55 – 1.3) at elevated temperature (450 K) and pressure (3 bar) initial conditions. Cycle-averaged gains in relative thermal efficiency for a vehicle operated in a lean-burn DI mode then were reported against peak LFS (φ = 1.1 – 1.3) for the fuels. Low aromatic content fuels increased relative ITE by ~1% per 2 cm/s LFS increase, and high aromatic content fuels increased relative ITE by ~1% per 4 cm/s LFS increase. The merit function term for LFS currently assigns the average response, that is, a 1% relative ITE per 3 cm/s LFS increase from a “typical” gasoline baseline LFS of 46 cm/s.
Original Merit Function Term (FY16):
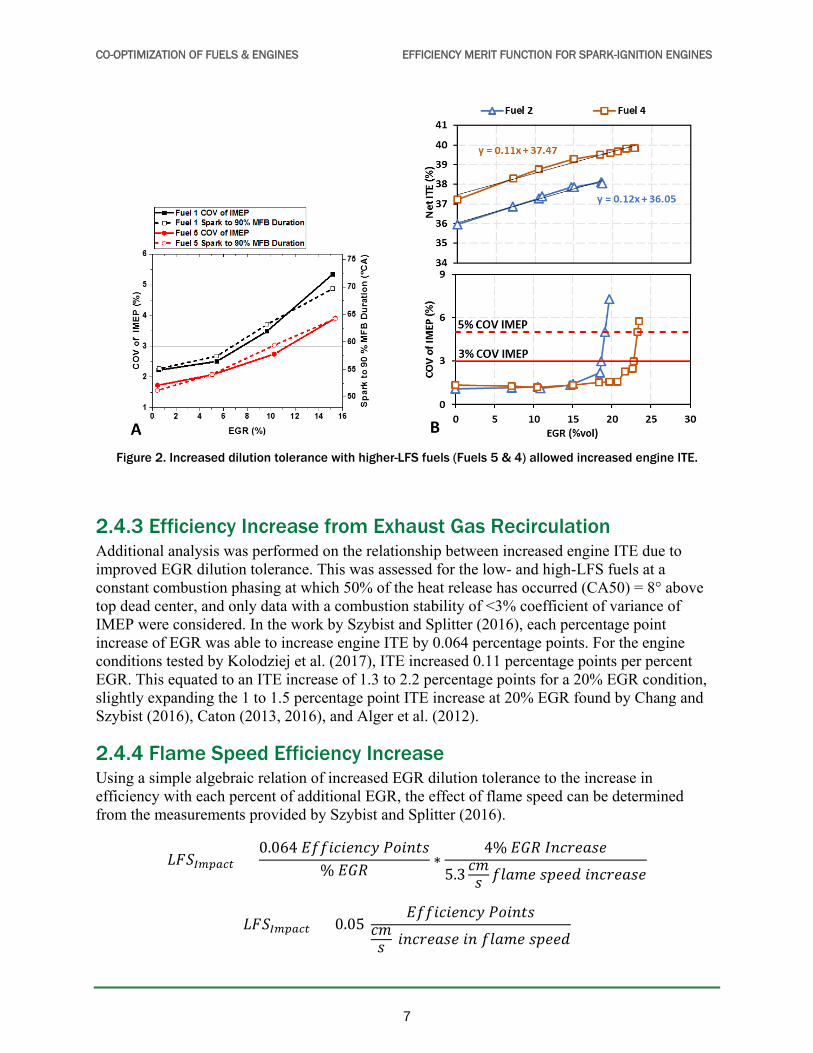
2.4.2 Flame Speed Impact on EGR Dilution Tolerance Two separate engine projects within Co-Optima have quantified the extended dilution tolerance of SI combustion with fuels of higher LFS. The increased dilution tolerance was assessed at 3% coefficient of variance of indicated mean effective pressure (IMEP) for low- and high-LFS fuels composed of pure components (iso-octane, n-heptane, toluene, ethanol). The LFS of the fuel blends has been calculated both using a Le Chatelier energy and molar-weighted mixing law (Sileghem et al. 2012) at peak LFS (Φ = 1.1) and stoichiometric chemical kinetic modeling in Chemkin (a software tool developed by Sandia National Laboratories and Reaction Design to solve chemical kinetics problems), both at initial conditions of 1 atm and 358 K. At 2,000 revolutions per minute (rpm) and 3.5 bar gross IMEP, Szybist and Splitter (2016) observed a 50% relative increase (8% to 12%) in EGR dilution tolerance (Figure 2) when fuel LFS increased from 45 cm/s (Fuel 1) to 50.3 cm/s (Fuel 5). At 1,500 rpm and 5.6 bar net IMEP, Kolodziej et al. (2017) also observed a 4% increase in EGR dilution tolerance (18.6% to 22.8%) when fuel LFS increased from 45.7 cm/s (Fuel 2) to 52.1 cm/s (Fuel 4). This enabled the higher LFS fuel (Fuel 4) to obtain an additional 0.3 percentage points of ITE.
3])/[46(
6− scmS mixL
CO-OPTIMIZATION OF FUELS & ENGINES EFFICIENCY MERIT FUNCTION FOR SPARK-IGNITION ENGINES
7
Figure 2. Increased dilution tolerance with higher-LFS fuels (Fuels 5 & 4) allowed increased engine ITE.
2.4.3 Efficiency Increase from Exhaust Gas Recirculation Additional analysis was performed on the relationship between increased engine ITE due to improved EGR dilution tolerance. This was assessed for the low- and high-LFS fuels at a constant combustion phasing at which 50% of the heat release has occurred (CA50) = 8° above top dead center, and only data with a combustion stability of <3% coefficient of variance of IMEP were considered. In the work by Szybist and Splitter (2016), each percentage point increase of EGR was able to increase engine ITE by 0.064 percentage points. For the engine conditions tested by Kolodziej et al. (2017), ITE increased 0.11 percentage points per percent EGR. This equated to an ITE increase of 1.3 to 2.2 percentage points for a 20% EGR condition, slightly expanding the 1 to 1.5 percentage point ITE increase at 20% EGR found by Chang and Szybist (2016), Caton (2013, 2016), and Alger et al. (2012).
2.4.4 Flame Speed Efficiency Increase Using a simple algebraic relation of increased EGR dilution tolerance to the increase in efficiency with each percent of additional EGR, the effect of flame speed can be determined from the measurements provided by Szybist and Splitter (2016).
𝐿𝐿𝐿𝐿𝑆𝑆𝐼𝐼𝐼𝐼𝐼𝐼𝐼𝐼𝐼𝐼𝐼𝐼 = 0.064 𝐸𝐸𝐸𝐸𝐸𝐸𝐸𝐸𝐸𝐸𝐸𝐸𝐸𝐸𝐸𝐸𝐸𝐸𝐸𝐸 𝑃𝑃𝑃𝑃𝐸𝐸𝐸𝐸𝑃𝑃𝑃𝑃
% 𝐸𝐸𝐸𝐸𝐸𝐸∗
4% 𝐸𝐸𝐸𝐸𝐸𝐸 𝐼𝐼𝐸𝐸𝐸𝐸𝐼𝐼𝐸𝐸𝐼𝐼𝑃𝑃𝐸𝐸
5.3 𝐸𝐸𝑐𝑐𝑃𝑃 𝐸𝐸𝑓𝑓𝐼𝐼𝑐𝑐𝐸𝐸 𝑃𝑃𝑠𝑠𝐸𝐸𝐸𝐸𝑠𝑠 𝐸𝐸𝐸𝐸𝐸𝐸𝐼𝐼𝐸𝐸𝐼𝐼𝑃𝑃𝐸𝐸
𝐿𝐿𝐿𝐿𝑆𝑆𝐼𝐼𝐼𝐼𝐼𝐼𝐼𝐼𝐼𝐼𝐼𝐼 = 0.05 𝐸𝐸𝐸𝐸𝐸𝐸𝐸𝐸𝐸𝐸𝐸𝐸𝐸𝐸𝐸𝐸𝐸𝐸𝐸𝐸 𝑃𝑃𝑃𝑃𝐸𝐸𝐸𝐸𝑃𝑃𝑃𝑃
𝐸𝐸𝑐𝑐𝑃𝑃 𝐸𝐸𝐸𝐸𝐸𝐸𝐼𝐼𝐸𝐸𝐼𝐼𝑃𝑃𝐸𝐸 𝐸𝐸𝐸𝐸 𝐸𝐸𝑓𝑓𝐼𝐼𝑐𝑐𝐸𝐸 𝑃𝑃𝑠𝑠𝐸𝐸𝐸𝐸𝑠𝑠
CO-OPTIMIZATION OF FUELS & ENGINES EFFICIENCY MERIT FUNCTION FOR SPARK-IGNITION ENGINES
8
Flame speed also can be determined from the measurements for the engine, fuels, and operating conditions provided by Kolodziej et al.
𝐿𝐿𝐿𝐿𝑆𝑆𝐼𝐼𝐼𝐼𝐼𝐼𝐼𝐼𝐼𝐼𝐼𝐼 = 0.11 𝐸𝐸𝐸𝐸𝐸𝐸𝐸𝐸𝐸𝐸𝐸𝐸𝐸𝐸𝐸𝐸𝐸𝐸𝐸𝐸 𝑃𝑃𝑃𝑃𝐸𝐸𝐸𝐸𝑃𝑃𝑃𝑃
% 𝐸𝐸𝐸𝐸𝐸𝐸∗
4.1% 𝐸𝐸𝐸𝐸𝐸𝐸 𝐼𝐼𝐸𝐸𝐸𝐸𝐼𝐼𝐸𝐸𝐼𝐼𝑃𝑃𝐸𝐸
6.45 𝐸𝐸𝑐𝑐𝑃𝑃 𝐸𝐸𝑓𝑓𝐼𝐼𝑐𝑐𝐸𝐸 𝑃𝑃𝑠𝑠𝐸𝐸𝐸𝐸𝑠𝑠 𝐸𝐸𝐸𝐸𝐸𝐸𝐼𝐼𝐸𝐸𝐼𝐼𝑃𝑃𝐸𝐸
𝐿𝐿𝐿𝐿𝑆𝑆𝐼𝐼𝐼𝐼𝐼𝐼𝐼𝐼𝐼𝐼𝐼𝐼 = 0.07 𝐸𝐸𝐸𝐸𝐸𝐸𝐸𝐸𝐸𝐸𝐸𝐸𝐸𝐸𝐸𝐸𝐸𝐸𝐸𝐸 𝑃𝑃𝑃𝑃𝐸𝐸𝐸𝐸𝑃𝑃𝑃𝑃
𝐸𝐸𝑐𝑐𝑃𝑃 𝐸𝐸𝐸𝐸𝐸𝐸𝐼𝐼𝐸𝐸𝐼𝐼𝑃𝑃𝐸𝐸 𝐸𝐸𝐸𝐸 𝐸𝐸𝑓𝑓𝐼𝐼𝑐𝑐𝐸𝐸 𝑃𝑃𝑠𝑠𝐸𝐸𝐸𝐸𝑠𝑠
These calculations are given in terms of absolute increased engine ITE, so it is necessary to convert to relative gains in ITE—common with the other terms of the merit function—by dividing by the ITE of the base 0% EGR condition. For the data from Szybist and Splitter (2016), dividing by a base ITE of 27% and converting to relative percent (multiplying by 100) provides 0.179% relative ITE increase per centimeter per second (cm/s) increase in LFS. Applying this same approach to the data by Kolodziej et al. 2017—which had a base ITE of 37.2%—provides 0.19 relative ITE increase per centimeter per second increase in LFS. Taking the reciprocal of this value calculates the appropriate denominator of the LFS merit function term as in the range of 5.27 (Kolodziej et al. 2017) to 5.6 (per Szybist and Splitter, 2016), or an average of 5.4 between the two studies. This change reduces the impact of the original LFS efficiency merit function and can be seen in the equation below. Until more information is available, it is recommended that the initial conditions of the LFS of the fuel mixture (SLmix) be stoichiometric at 1 atm and 358 K.
Revised Merit Function Term (FY17)
(𝑆𝑆𝐿𝐿 𝐼𝐼𝑚𝑚𝑚𝑚 − 46 �𝐸𝐸𝑐𝑐𝑃𝑃 �)5.4
2.4.5 Baseline Gasoline Laminar Flame Speed Literature measurements of LFS typically vary significantly regarding initial mixture equivalence ratio and thermodynamic conditions, posing a challenge to establish a baseline gasoline LFS value using existing measurements. One approach to resolving the scarcity of common measurement conditions is to adopt power-law scaling correlations (e.g., Dugger and Graab [1953] or Metghalchi and Keck [1982]).
ul(Tu, Pu) = ul,0 �Tu
Tu,0�α
�Pu
Pu,0�β
Here, 𝑢𝑢𝑙𝑙 denotes the LFS at a specific unburned gas temperature, 𝑇𝑇𝑢𝑢, and pressure, 𝑃𝑃𝑢𝑢. A reference LFS, 𝑢𝑢𝑙𝑙,0, and corresponding conditions, 𝑇𝑇𝑢𝑢,0 and 𝑃𝑃𝑢𝑢,0, can be used with a fuel-dependent exponent for temperature scaling, 𝛼𝛼, and a separate exponent for pressure scaling, 𝛽𝛽. Using this scaling law could be one way to assess a fuel’s LFS at actual engine temperatures and pressures.

CO-OPTIMIZATION OF FUELS & ENGINES EFFICIENCY MERIT FUNCTION FOR SPARK-IGNITION ENGINES
9
Another difference between reported LFS measurements is whether they have been corrected for flame stretch. In the original reference by Farrell et al. (2003), there was no correction for stretch. It has also been common in comparing fuel LFS and engine performance to only consider a fuel’s peak LFS, which typically occurs at richer conditions (1.1 – 1.2 Φ) than engine operation. There also might be a need to consider how exhaust gas dilution could affect comparisons of LFS between fuels. Detailed or, when necessary, reduced chemical kinetic mechanisms easily can provide insight into high-pressure conditions, both internal and external EGR, and fuel blending behavior that are relevant to Boosted SI engines. Some combination of actual LFS measurements (for validation) and chemical kinetic modeling could provide the greatest insight.
At this time, there is not enough understanding of the appropriate baseline fuel LFS and conditions to suggest a modification. Therefore, the baseline LFS of 46 cm/s remains in use for now, largely because it compares well with the calculated LFSs of the “low-LFS fuels” tested by Szybist and Splitter (2016) and Kolodziej et al. (2017).
2.4.6 Additional Considerations 2.4.6.1 Effects of Laminar Flame Speed Under Non-Dilute Conditions Although strong evidence has been presented that increased fuel LFS enables increased SI dilution tolerance and therefore increased engine ITE, it is not clear whether the effects of fuel LFS are measurable for non-dilute SI combustion. It is well known that adding ethanol to a fuel blend increases its LFS, but at the same time also increases the fuel’s HoV. Increased fuel evaporative cooling reduces cylinder temperatures and the fuel’s LFS simultaneously. Investigations of non-dilute SI combustion between E0 gasoline and E85 gasoline at constant combustion phasing by Sjöberg and Vuilleumier (described in Appendix A) have shown that the increased HoV of ethanol (cooling effect that reduces LFS) can perfectly counteract the increased LFS of the mixture. Farrell et al. (2003) claimed that increased fuel LFS caused increased engine ITE. However, the magnitude of the ITE increase is difficult to see solely through comparing the rates of heat release between the fuels. Ayala and Heywood (2007) investigated significant increases to mixture LFS by also introducing hydrogen. However, no gain in ITE was detected for stoichiometric non-dilute SI engine operation.
2.4.6.2 Programmatic Observations and Recommendations The work in the first 18 months of the Co-Optima initiative significantly improved the understanding of the impacts of fuel LFS on increased ITE under dilute stoichiometric SI engine operation. Testing revealed small variations between studies at two engine operating conditions. Testing the effects of fuel LFS at other engine speeds and loads of the engine operating map now is needed. Past testing focused on fuel blends of well-characterized components: iso-octane, n-heptane, toluene, and ethanol. Presently, what is needed is an understanding the relationships of fuel LFS and engine efficiency for new fuel candidates identified within the Co-Optima program from various chemical families.
It is necessary to better understand the effects of EGR dilution on the measured and simulated LFS of pure components, blends, and gasolines. This includes a more representative LFS value of a baseline E10 gasoline for the merit function. Also needed is work to build LFS fuel blending models for various hydrocarbons.
CO-OPTIMIZATION OF FUELS & ENGINES EFFICIENCY MERIT FUNCTION FOR SPARK-IGNITION ENGINES
10
Testing of fuel LFS effects on engine ITE is also required outside of stoichiometric SI combustion at the EGR dilution limit. In addition to non-dilute stoichiometric conditions, testing the effects of fuel LFS on lean and stratified SI combustion is of great interest. It could produce different results from those observed so far.
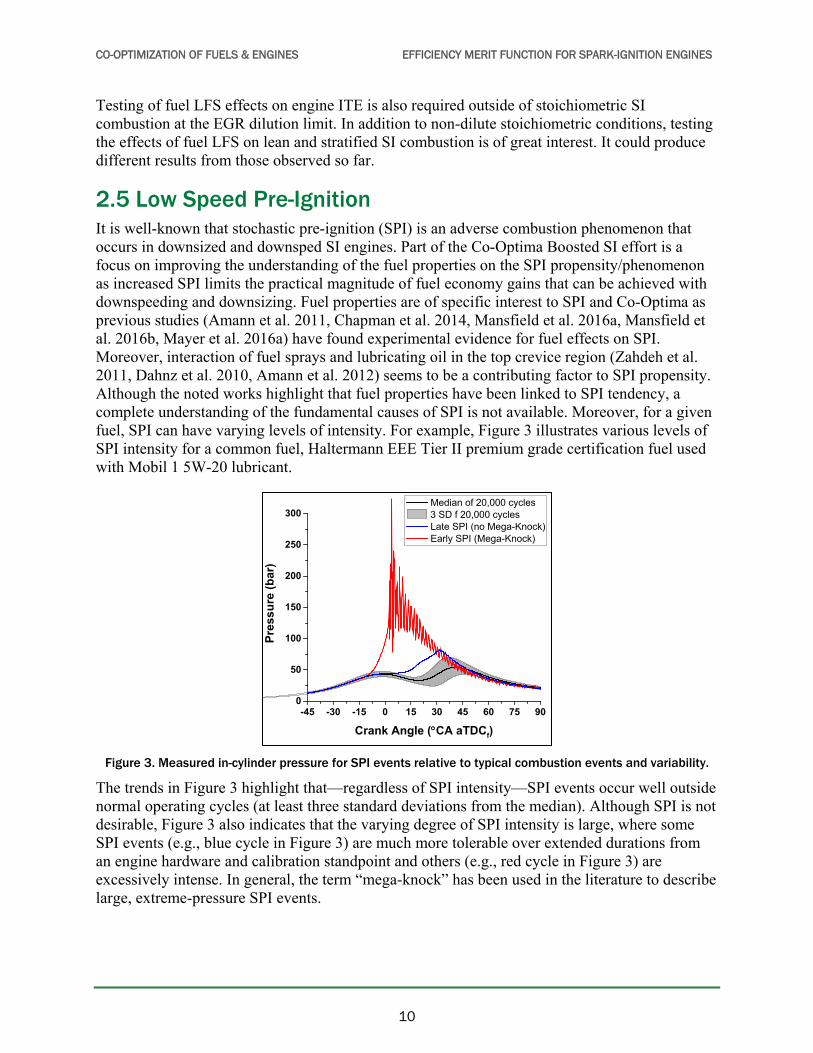
2.5 Low Speed Pre-Ignition It is well-known that stochastic pre-ignition (SPI) is an adverse combustion phenomenon that occurs in downsized and downsped SI engines. Part of the Co-Optima Boosted SI effort is a focus on improving the understanding of the fuel properties on the SPI propensity/phenomenon as increased SPI limits the practical magnitude of fuel economy gains that can be achieved with downspeeding and downsizing. Fuel properties are of specific interest to SPI and Co-Optima as previous studies (Amann et al. 2011, Chapman et al. 2014, Mansfield et al. 2016a, Mansfield et al. 2016b, Mayer et al. 2016a) have found experimental evidence for fuel effects on SPI. Moreover, interaction of fuel sprays and lubricating oil in the top crevice region (Zahdeh et al. 2011, Dahnz et al. 2010, Amann et al. 2012) seems to be a contributing factor to SPI propensity. Although the noted works highlight that fuel properties have been linked to SPI tendency, a complete understanding of the fundamental causes of SPI is not available. Moreover, for a given fuel, SPI can have varying levels of intensity. For example, Figure 3 illustrates various levels of SPI intensity for a common fuel, Haltermann EEE Tier II premium grade certification fuel used with Mobil 1 5W-20 lubricant.
Figure 3. Measured in-cylinder pressure for SPI events relative to typical combustion events and variability.
The trends in Figure 3 highlight that—regardless of SPI intensity—SPI events occur well outside normal operating cycles (at least three standard deviations from the median). Although SPI is not desirable, Figure 3 also indicates that the varying degree of SPI intensity is large, where some SPI events (e.g., blue cycle in Figure 3) are much more tolerable over extended durations from an engine hardware and calibration standpoint and others (e.g., red cycle in Figure 3) are excessively intense. In general, the term “mega-knock” has been used in the literature to describe large, extreme-pressure SPI events.
-45 -30 -15 0 15 30 45 60 75 900
50
100
150
200
250
300
Pres
sure
(bar
)
Crank Angle (°CA aTDCf)
Median of 20,000 cycles 3 SD f 20,000 cycles
Late SPI (no Mega-Knock) Early SPI (Mega-Knock)

CO-OPTIMIZATION OF FUELS & ENGINES EFFICIENCY MERIT FUNCTION FOR SPARK-IGNITION ENGINES
11
To explore the effects and limits of SPI within Co-Optima, an initial quantification of the effects of SPI on fuel economy was estimated using the literature studies cited above. These works indicated that increased fuel boiling points tended to increase SPI propensity. Based on the literature, the SPI propensity was quantified in the Boosted SI merit function by the term LFV150 (liquid fuel volume remaining at a temperature of 150°C) as defined below, where F is the ASTM D86 measured boiling curve in percent volume and the integration limits are from 302°F (150°C) to the final fuel boiling point (FBP).
LFV150 = � FFBP
302∗ dv
The integration limits were based on the literature study of Mayer et al. (2016a), which explored ethanol-gasoline and non-ethanol-gasoline fuels with varying boiling curves. Note that the LFV150 term does not directly affect engine efficiency; however, it applies a weighting factor to the fuel boiling curve based on the ASTM D86 test. Moreover, the LFV150 approach has no quantification/differentiation of SPI magnitude, and instead only predicts number count.
To explore the effects of boiling point on SPI, a parametric study of fuel molecular type was conducted using the molecules in Table 1.
Table 1. Molecules Blended at 25% by Mass with Haltermann EEE Tier II Premium Grade Gasoline
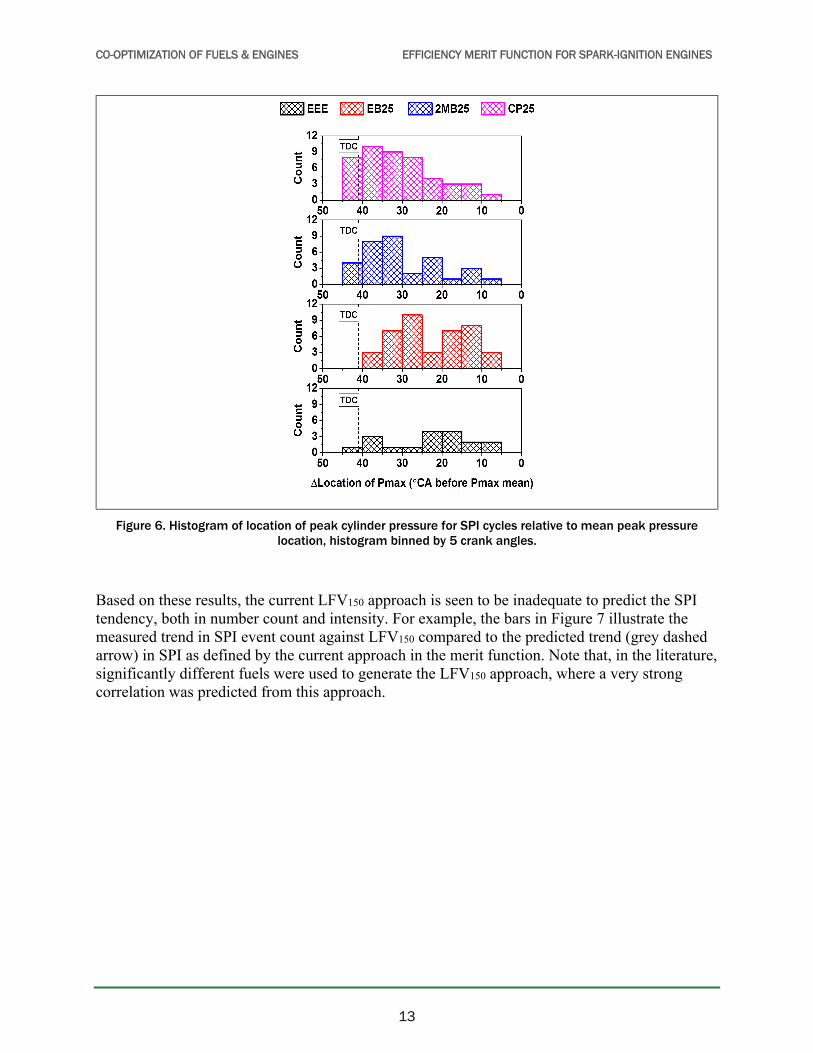
The resulting ASTM D86 distillation curve for blends of the molecules from Table 1 at a 25% blend rate with Haltermann EEE is presented in Figure 4. Applying the LFV150 approach of the original merit function to the fuels in Figure 4 results in fuel EEE having the highest predicted SPI tendency of all fuels. The measurements of SPI tendency shown in Figure 5 and Figure 6, however, illustrate that the EEE fuel had the lowest measured SPI tendency, when both the SPI intensity ΔP and the phasing of the maximum pressure are considered. ΔP is defined as the following.
∆P ≡ P𝐼𝐼𝐼𝐼𝑚𝑚,SPI − P𝐼𝐼𝐼𝐼𝑚𝑚,median
Compound Structure BP, °C (°F)
RON (-)
HoV (kJ/kg)
ethylbenzene 136°C (277°F)
101 394
cyclopentanone 131°C (268°F)
98 506
2- methyl-1butanol
127.5 °C (261.5 °F)
101 611

CO-OPTIMIZATION OF FUELS & ENGINES EFFICIENCY MERIT FUNCTION FOR SPARK-IGNITION ENGINES
12
Figure 4. ASTM D86 results of the molecules from Table 1 at 25% by mass with gasoline, and neat gasoline.
Figure 5. Box and scatter plot of peak cylinder pressure, box represents interquartile range, whiskers represent outliers, data binned by 20-bar increments.
0 20 40 60 80 100
100
150
200
250
300
350
400
Tem
pera
ture
(F)
Fuel Boiled (%)
EEE CP25 2MB25 CP25
150°C
0
100
200
300
400
500
600
700
∆P
(bar
)
EEE EB25 2MB25 CP25
CO-OPTIMIZATION OF FUELS & ENGINES EFFICIENCY MERIT FUNCTION FOR SPARK-IGNITION ENGINES
13
Figure 6. Histogram of location of peak cylinder pressure for SPI cycles relative to mean peak pressure location, histogram binned by 5 crank angles.
Based on these results, the current LFV150 approach is seen to be inadequate to predict the SPI tendency, both in number count and intensity. For example, the bars in Figure 7 illustrate the measured trend in SPI event count against LFV150 compared to the predicted trend (grey dashed arrow) in SPI as defined by the current approach in the merit function. Note that, in the literature, significantly different fuels were used to generate the LFV150 approach, where a very strong correlation was predicted from this approach.

CO-OPTIMIZATION OF FUELS & ENGINES EFFICIENCY MERIT FUNCTION FOR SPARK-IGNITION ENGINES
14
Figure 7. Measured SPI trend as a function of LFV150 (bars) compared to estimated SPI trend using the
LFV150 approach (grey line), data normalized to maximum LFV150 value
Based on the current results and experiments, the current term describing the impact of LFV150 on SPI and fuel efficiency should be modified. The current LFV150 term seems to be inadequate to predict SPI intensity and number count. Moreover, the current results suggest that there could be significant molecular effects impacting the SPI number count and intensity. For example, the CP25 fuel (25% cyclopentanone + 75% Haltermann EEE) had the earliest SPI event occurrence, highest SPI event number, widest ΔP range, and strongest ΔP magnitude, yet CP25 had the lowest LFV150. Moreover, the EB25 fuel (25% ethylbenzene + 75% Haltermann EEE) had a greater number of SPI events as compared to EEE, but many of the events were small in magnitude. Interestingly, EB25 had a bimodal SPI trend where SPI events seemed to be clustered as small or large (i.e., mega-knock) in magnitude.
Based on these findings, the LFV150 term has been removed from the merit function despite its clear potential impact on the fuel economy gains that can be achieved via downsizing and downspeeding. Further research is required to correctly predict both SPI event frequency and intensity, as well as capture the impacts of molecular structure on SPI.
2.6 Particulate Matter The need to control particulate matter (PM) and particle number emissions can negatively impact SI engine efficiency. The most significant impact arises from the addition of a gasoline particulate filter (GPF). A GPF degrades engine efficiency by two means that arise from the attendant increases in exhaust backpressure, higher pumping losses, and greater potential for knock. The last effect is the result of increased retention of hot residuals in the combustion chamber. The consequences of this can range from more frequent application of spark retard to selection of lower compression ratio. Either will reduce engine efficiency; however, recent studies indicate that the impact on vehicle fuel consumption over drive test cycles is minor (Mamakos 2011, Chan et al. 2013, Kern et al. 2014, Mamakos et al. 2013). A caveat is that the impact of more frequent application of spark retard is tempered by the fact that most drive cycles include substantial operating time under much less demanding conditions.
0 20 40 60 80 1000
10
20
30
40
50
60 EEE EB25 2MB25 CP25
SPI e
vent
cou
nt (#
)
LFV150 normalized to max LFV150 (%)
Literature
Trend
CO-OPTIMIZATION OF FUELS & ENGINES EFFICIENCY MERIT FUNCTION FOR SPARK-IGNITION ENGINES
15
The determining factors for requiring a GPF depend on the confluence of PM emission regulations, the efficacy of combustion systems to control PM formation, and fuel properties, particularly late distillation behavior, level of C10+ aromatics, and probably HoV. The overarching assumptions made in defining the PM control term for the merit function are the following.
• A 1-mg/mile PM emission regulation.
• Original equipment manufacturers are motivated to increase engine efficiency and meet this PM regulation without GPFs; they will therefore continue to improve gasoline direct injection (GDI) combustion systems to minimize PM formation.
• The PMI is the best available fuel property for quantifying fuel effects on PM emissions (important caveats are discussed in the Fuel Properties and Chemistry section in Appendix A).
The PM Control term in the merit function is based on the Heaviside function H(x), which is a form of step function between zero and one. In this case, the presumptions are that given a PM emission regulatory target, and some state of combustion system refinement to control PM, a fuel property that quantifies soot-forming potential can be used to trigger the step function.
The updated PM Control merit function term is the following.
− 𝐻𝐻(𝑃𝑃𝑃𝑃𝐼𝐼 − 1.6)[0.7 + 0.5(𝑃𝑃𝑃𝑃𝐼𝐼 − 1.4)]
Here, the fuel property PMI is the step function trigger, such that if PMI < 1.6 then H(x) = 0, meaning that no GPF is required and therefore engine efficiency is not degraded. If PMI ≥ 1.6, then H(x) = 1 and engine efficiency is degraded by the amount dictated by the other factors in the PM Control term. Because certification gasoline is used to determine compliance with emission regulations, the literature was surveyed for PMI data of these fuels. The PMIs for certification gasolines range from about 1.4 to 1.8 (Aikawa et al. 2010, Sobotowski et al. 2015, California Air Resources Board [CARB] 2017). Thus, PMI = 1.6 is selected as the step function trigger level for requiring a GPF.
The other factors in the PM Control term represent:
• A 0.7% engine efficiency loss from increased backpressure of the GPF (including some lifetime averaged loading of ash); and
• An additional 0.5% efficiency loss per unit increase in PMI from increased backpressure arising from fuels with PMIs higher than that of the merit function’s baseline fuel (PMI = 1.4).
Unfortunately, there is a dearth of data characterizing backpressure effects on engine efficiency in terms suitable for the merit function. The available data are presented as changes in fuel consumption over various vehicle test cycles, so they are far removed from the constrained engine efficiency focus of the merit function. The analysis of Mamakos et al. (2013) concluded that, over the vehicle lifetime, greater backpressure from the GPF increases fuel consumption by 0.5% to 1.5%, plus 0.17% for GPF regeneration, summing to a 0.67% increase in fuel consumption. The Mamakos analysis also cites a study by Mikulic et al. (2010), however, which
CO-OPTIMIZATION OF FUELS & ENGINES EFFICIENCY MERIT FUNCTION FOR SPARK-IGNITION ENGINES
16
reported fuel consumption increases of 2% to 3% at high vehicle speeds. Until better data and analyses are available, a conservative assumption was made that engine efficiency will be reduced by 0.7% from ash-loaded GPF backpressure. An efficiency loss for GPF regeneration is not explicitly included because it is assumed regeneration will happen passively during periods of deceleration when fuel cut-off and throttle control can be used to elevate the oxygen concentration for burning out soot in the GPF.
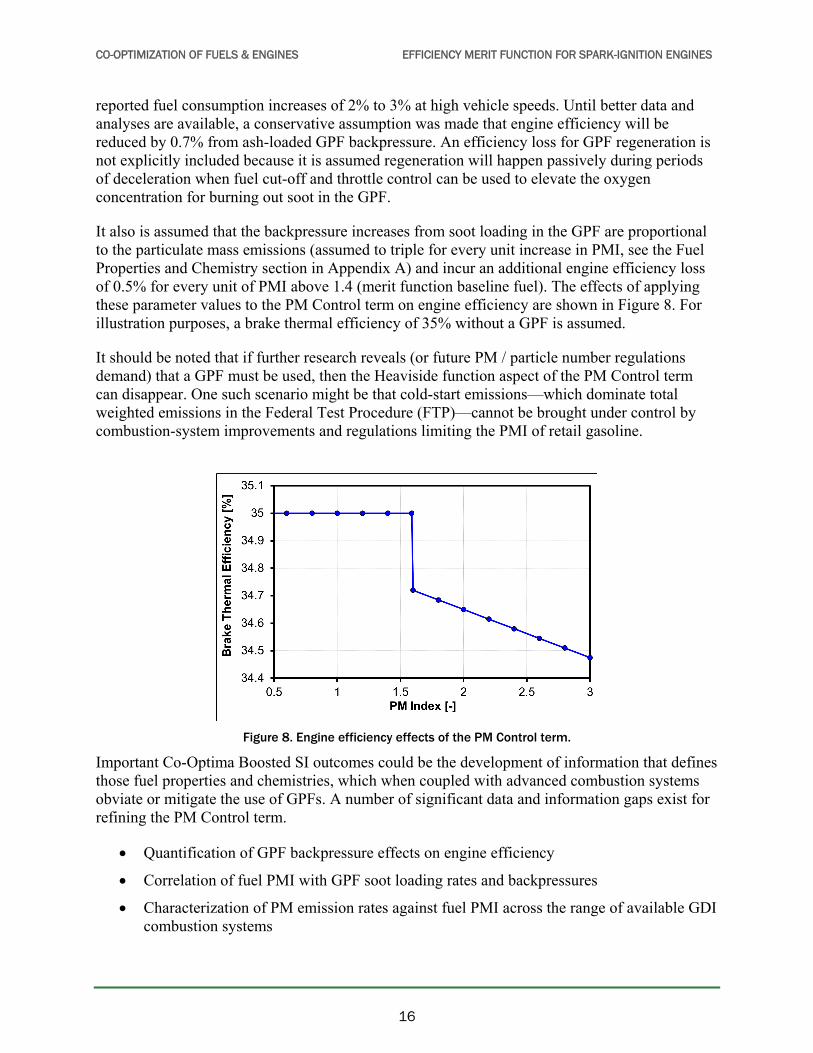
It also is assumed that the backpressure increases from soot loading in the GPF are proportional to the particulate mass emissions (assumed to triple for every unit increase in PMI, see the Fuel Properties and Chemistry section in Appendix A) and incur an additional engine efficiency loss of 0.5% for every unit of PMI above 1.4 (merit function baseline fuel). The effects of applying these parameter values to the PM Control term on engine efficiency are shown in Figure 8. For illustration purposes, a brake thermal efficiency of 35% without a GPF is assumed.
It should be noted that if further research reveals (or future PM / particle number regulations demand) that a GPF must be used, then the Heaviside function aspect of the PM Control term can disappear. One such scenario might be that cold-start emissions—which dominate total weighted emissions in the Federal Test Procedure (FTP)—cannot be brought under control by combustion-system improvements and regulations limiting the PMI of retail gasoline.
Figure 8. Engine efficiency effects of the PM Control term.
Important Co-Optima Boosted SI outcomes could be the development of information that defines those fuel properties and chemistries, which when coupled with advanced combustion systems obviate or mitigate the use of GPFs. A number of significant data and information gaps exist for refining the PM Control term.
• Quantification of GPF backpressure effects on engine efficiency
• Correlation of fuel PMI with GPF soot loading rates and backpressures
• Characterization of PM emission rates against fuel PMI across the range of available GDI combustion systems
CO-OPTIMIZATION OF FUELS & ENGINES EFFICIENCY MERIT FUNCTION FOR SPARK-IGNITION ENGINES
17
• Characterization of fuel chemistry and property effects on cold-start, catalyst-out PM emissions, which appear to deviate from PMI predictions
• Improvements to PMI that correct for HoV and oxygenate soot chemistry
2.7 Catalyst Warmup All modern SI engines sold in the United States run with a nominally stoichiometric AFR to enable compliance with U.S. Environmental Protection Agency (EPA) emissions regulations through the use of three-way catalysts (TWCs) for exhaust aftertreatment. Three-way catalysts are extremely effective at removing criteria pollutants (oxides of nitrogen, non-methane organic gases, carbon monoxide) from the exhaust of a properly calibrated engine and aftertreatment system at typical SI engine exhaust temperatures. However, TWCs do not work effectively when they are at ambient temperatures. The TWC temperature must exceed a certain threshold—commonly referred to as the light-off temperature—before the catalytic oxidation and reduction reactions required to convert criteria pollutants to nitrogen, carbon dioxide, and water become active. The majority of the criteria pollutants emitted by modern vehicles equipped with SI engines are released during the cold-start period immediately after the engine is turned on (Kessels et al. 2010).
To achieve emissions compliance, engine operation during cold start must be carefully optimized to heat the TWC above the light-off temperature as quickly as possible. Three-way catalyst heating typically is achieved through injection of extra fuel and delayed spark timing, which effectively dumps extra heat into the exhaust system to rapidly increase the temperature of the TWC. Although such strategies are necessary to meet emissions regulations, they also incur a fuel penalty because the engine is not operating under optimal conditions for high efficiency during the cold-start process (Kessels et al. 2010, Anderson et al. 2014). The magnitude of the fuel penalty depends on how long it takes for the catalyst to achieve light-off: increased light-off temperatures require more time under the cold-start strategy, resulting in a larger fuel penalty.
Data from the EPA FTP driving cycles provide one method for estimating the fuel penalty associated with catalyst heating during cold-start operation. The FTP is divided into three sections. The first section begins with a cold start. The third section is identical to the first, but because it is run shortly after the first and second sections are completed, it is considered a “hot” start. Comparing the fuel consumption rate for the first and third sections of the FTP allows for calculation of the fuel penalty during cold start.
∆𝐿𝐿𝐿𝐿𝐿𝐿 = � (𝐸𝐸𝐶𝐶 − 𝐸𝐸𝐻𝐻)
𝐼𝐼𝐿𝐿𝐿𝐿
0
Where tLO is the time required for the TWC to achieve light-off during the cold-start portion of the cycle, fC is the fuel consumption rate during the cold start, and fH is the fuel consumption rate during the hot start. Understanding how the catalyst-heating fuel penalty relates to overall engine efficiency requires normalization of the fuel penalty to overall fuel consumption. This can be accomplished by dividing the catalyst heating fuel penalty by the total fuel consumed during the entire FTP cycle.
CO-OPTIMIZATION OF FUELS & ENGINES EFFICIENCY MERIT FUNCTION FOR SPARK-IGNITION ENGINES
18
∆𝐿𝐿𝐿𝐿𝐿𝐿𝐿𝐿𝐹𝐹𝑇𝑇𝑃𝑃
=∫ (𝐸𝐸𝐶𝐶 − 𝐸𝐸𝐻𝐻)𝐼𝐼𝐿𝐿𝐿𝐿0
∫ 𝐸𝐸𝐼𝐼𝐹𝐹𝐹𝐹𝐹𝐹0
Assuming that the difference between the cold-start fuel consumption rate and the hot-start fuel consumption rate is approximately constant during catalyst light-off, this expression simplifies to:
∆𝐿𝐿𝐿𝐿𝐿𝐿𝐿𝐿𝐹𝐹𝑇𝑇𝑃𝑃
=∫ ∆𝐸𝐸𝐿𝐿𝐿𝐿𝐼𝐼𝐿𝐿𝐿𝐿0
∫ 𝐸𝐸𝐼𝐼𝐹𝐹𝐹𝐹𝐹𝐹0
≅∆𝐸𝐸𝐿𝐿𝐿𝐿𝑃𝑃𝐿𝐿𝐿𝐿𝐿𝐿𝐹𝐹𝑇𝑇𝑃𝑃
where ∆fLO is the difference between cold-start and hot-start fuel consumption rates.
Changing the fuel composition will change the composition of the unburned and partially burned organic gases emitted from the engine. Different organic gases can have different catalytic reactivities, therefore changing fuel consumption can impact the light-off temperature of the TWC, the time required to reach light-off, and the fuel penalty associated with catalyst heating.
The difference in fractional fuel penalty for two different fuels can be expressed as:
∆𝐿𝐿𝐿𝐿𝐿𝐿,𝐼𝐼𝑐𝑐𝑐𝑐𝑐𝑐
𝐿𝐿𝐹𝐹𝑇𝑇𝑃𝑃,𝐼𝐼𝑐𝑐𝑐𝑐𝑐𝑐−∆𝐿𝐿𝐿𝐿𝐿𝐿,𝐶𝐶𝐶𝐶
𝐿𝐿𝐹𝐹𝑇𝑇𝑃𝑃,𝐶𝐶𝐶𝐶=∆𝐸𝐸𝐿𝐿𝐿𝐿,𝐼𝐼𝑐𝑐𝑐𝑐𝑐𝑐𝑃𝑃𝐿𝐿𝐿𝐿,𝐼𝐼𝑐𝑐𝑐𝑐𝑐𝑐
𝐿𝐿𝐹𝐹𝑇𝑇𝑃𝑃,𝐼𝐼𝑐𝑐𝑐𝑐𝑐𝑐−∆𝐸𝐸𝐿𝐿𝐿𝐿,𝐶𝐶𝐶𝐶𝑃𝑃𝐿𝐿𝐿𝐿,𝐶𝐶𝐶𝐶
𝐿𝐿𝐹𝐹𝑇𝑇𝑃𝑃,𝐶𝐶𝐶𝐶
where conv denotes conventional and CB stands for a Co-Optima blend. Assuming that the cold-start fuel penalty and the total fuel consumed during the FTP are the same for the two fuels, this expression can be further simplified to the following.
∆𝐿𝐿𝐿𝐿𝐿𝐿,𝐼𝐼𝑐𝑐𝑐𝑐𝑐𝑐 − ∆𝐿𝐿𝐿𝐿𝐿𝐿,𝐶𝐶𝐶𝐶
𝐿𝐿𝐹𝐹𝑇𝑇𝑃𝑃=∆𝐸𝐸𝐿𝐿𝐿𝐿𝐿𝐿𝐹𝐹𝑇𝑇𝑃𝑃
�𝑃𝑃𝐿𝐿𝐿𝐿,𝐼𝐼𝑐𝑐𝑐𝑐𝑐𝑐 − 𝑃𝑃𝐿𝐿𝐿𝐿,𝐶𝐶𝐶𝐶�
Note that the second assumption (total fuel consumed over the FTP is the same for both fuels) gets worse as the co-optimization process gets better and fuel composition begins to have a stronger effect on engine efficiency. Because the goal of the merit function is to evaluate potential fuel blendstocks and blends in the absence of running an FTP cycle on every fuel, the assumption will be used here. At this point, the difference in fractional fuel penalty is expressed in terms of time to achieve light-off for the two different fuels. This light-off time is a function of the light-off temperature for a given fuel over the TWC.
∆𝐿𝐿𝐿𝐿𝐿𝐿,𝐼𝐼𝑐𝑐𝑐𝑐𝑐𝑐 − ∆𝐿𝐿𝐿𝐿𝐿𝐿,𝐶𝐶𝐶𝐶
𝐿𝐿𝐹𝐹𝑇𝑇𝑃𝑃=∆𝐸𝐸𝐿𝐿𝐿𝐿𝐿𝐿𝐹𝐹𝑇𝑇𝑃𝑃
�𝑔𝑔�𝑇𝑇𝐼𝐼,90,𝐼𝐼𝑐𝑐𝑐𝑐𝑐𝑐� − 𝑔𝑔�𝑇𝑇𝐼𝐼,90,𝐶𝐶𝐶𝐶��
The exact form of the dependence of light-off time on light-off temperature is still under investigation, and likely depends on the cold-start strategy of a particular vehicle. If a linear dependence is assumed—which is a reasonable assumption during the early portion of the cold-

CO-OPTIMIZATION OF FUELS & ENGINES EFFICIENCY MERIT FUNCTION FOR SPARK-IGNITION ENGINES
19
start process (Kessels et al. 2010)—however, then the difference in fractional fuel penalty for catalyst heating simplifies to the following.
∆𝐿𝐿𝐿𝐿𝐿𝐿,𝐼𝐼𝑐𝑐𝑐𝑐𝑐𝑐 − ∆𝐿𝐿𝐿𝐿𝐿𝐿,𝐶𝐶𝐶𝐶
𝐿𝐿𝐹𝐹𝑇𝑇𝑃𝑃=∆𝐸𝐸𝐿𝐿𝐿𝐿𝐿𝐿𝐹𝐹𝑇𝑇𝑃𝑃
�𝛼𝛼𝑇𝑇𝐼𝐼,90,𝐼𝐼𝑐𝑐𝑐𝑐𝑐𝑐 − 𝛼𝛼𝑇𝑇𝐼𝐼,90,𝐶𝐶𝐶𝐶� =∆𝐸𝐸𝐿𝐿𝐿𝐿𝐿𝐿𝐹𝐹𝑇𝑇𝑃𝑃
𝛼𝛼�𝑇𝑇𝐼𝐼,90,𝐼𝐼𝑐𝑐𝑐𝑐𝑐𝑐 − 𝑇𝑇𝐼𝐼,90,𝐶𝐶𝐶𝐶�
Multiplying the difference in fractional fuel penalty by 100 places it on a percentage basis. Thus, the current form of the merit function term associated with catalyst light-off is as follows.
+100∆𝐸𝐸𝐿𝐿𝐿𝐿𝐿𝐿𝐹𝐹𝑇𝑇𝑃𝑃
𝛼𝛼�𝑇𝑇𝐼𝐼,90,𝐼𝐼𝑐𝑐𝑐𝑐𝑐𝑐 − 𝑇𝑇𝐼𝐼,90,𝐶𝐶𝐶𝐶�
Work is currently in progress to evaluate the various constants in the expression. Based on preliminary analyses of FTP data collected on a light-duty gasoline vehicle, approximately 120 seconds are required to achieve TWC light-off, which occurs at roughly 250°C.
𝛼𝛼 =120 𝑃𝑃𝐸𝐸𝐸𝐸250°𝐶𝐶
= 0.48𝑃𝑃𝐸𝐸𝐸𝐸°𝐶𝐶
The fuel penalty associated with the 120-second cold start is equal to roughly 2% of the total fuel used during the FTP.
100∆𝐸𝐸𝐿𝐿𝐿𝐿𝐿𝐿𝐹𝐹𝑇𝑇𝑃𝑃
𝛼𝛼 = 1002%
120 𝑃𝑃𝐸𝐸𝐸𝐸�0.48
𝑃𝑃𝐸𝐸𝐸𝐸°𝐶𝐶� = 0.008 °𝐶𝐶−1
The preliminary form of the Boosted SI merit function term for gaseous emissions evaluates to the following.
+ 0.008 °𝐶𝐶−1�𝑇𝑇𝐼𝐼,90,𝐼𝐼𝑐𝑐𝑐𝑐𝑐𝑐 − 𝑇𝑇𝐼𝐼,90,𝐶𝐶𝐶𝐶�
Note that the constant terms are subject to revision with future analysis and experiments.
Based on the analysis and assumptions described above, the merit function term associated with gaseous emissions control simplifies to a simple difference between the catalytic light-off temperature (Tc,90) of a candidate fuel and the Tc,90 of a conventional fuel. Synthetic exhaust flow reactor systems can be used to reproducibly and inexpensively measure the Tc,90 of a particular fuel blend or component over a particular catalyst formulation. A standard protocol for making such measurements has been developed by the U.S. DRIVE Advanced Combustion and Emission Control Tech Team (U.S. DRIVE 2016). Measurements of the Tc,90 parameters therefore can be made using readily available equipment and protocols to support practical calculation of the merit function term. Members of the Co-Optima team also are considering how to handle blend effects in predicting light-off behavior and fuel penalty for realistic fuel blends based on the Tc,90 of individual fuel components.

CO-OPTIMIZATION OF FUELS & ENGINES EFFICIENCY MERIT FUNCTION FOR SPARK-IGNITION ENGINES
20
3. References Aikawa, K., T. Sakurai, and J. J. Jetter. 2010. “Development of a Predictive Model for Gasoline Vehicle Particulate Matter Emissions.” SAE International Journal of Fuels and Lubricants 3(2):610–622.
Alger, T., B. Mangold, C. Roberts, and J. Gingrich. 2012. “The Interaction of Fuel Anti-Knock Index and Cooled EGR on Engine Performance and Efficiency.” SAE International Journal of Engines 5(3):1229–1241. doi: 10.4271/2012-01-1149.
Amann, M., D. Mehta, and T. Alger. 2011. “Engine Operating Condition and Gasoline Fuel Composition Effects on Low-Speed Pre-Ignition in High-Performance Spark-Ignited Gasoline Engines.” SAE International Journal of Fuels and Lubricants 4(1):274–285. doi: 10.4271/2011-01-0342.
Amann, M., T. Alger, B. Westmoreland, and A. Rothmaier. 2012. “The Effects of Piston Crevices and Injection Strategy on Low-Speed Pre-Ignition in Boosted SI Engines.” SAE International Journal of Engines 5(3):1216–1228. doi: 10.4271/2012-01-1148.
Anderson, J.E., T.G. Leone, M.H. Shelby, T.J. Wallington, J.J. Bizub, M. Foster, M.G. Lynskey, and D. Polovina. 2012. “Octane Numbers of Ethanol-Gasoline Blends: Measurements and Novel Estimation Method from Molar Composition.” SAE Technical Paper 2012-01-1274. doi: 10.4271/2012-01-1274.
Anderson, J., E. Rask, H. Lohse-Busch, and S. Miers. 2014. “A Comparison of Cold-Start Behavior and its Impact on Fuel Economy for Advanced Technology Vehicles.” SAE International Journal of Fuels and Lubricants 7(2):427–435. doi:10.4271/2014-01-1375.
Ayala, F.A., and J.B. Heywood. 2007. “Lean SI Engines: The Role of Combustion Variability in Defining Lean Limits.” SAE Technical Paper 2007-24-0030. doi: 10.4271/2007-24-0030.
California Air Resources Board (CARB). 2017. California’s Advanced Clean Cars Midterm Review. Appendix J: Vehicle PM Emission Control Technology Assessment. January 18, 2017. https://www.arb.ca.gov/msprog/acc/mtr/appendix_j.pdf.
Caton, J. 2013. “A Comparison of Lean Operation and Exhaust Gas Recirculation: Thermodynamic Reasons for the Increases of Efficiency.” SAE Technical Paper 2013-01-0266. doi: 10.4271/2013-01-0266.
Caton, J. 2016. An Introduction to Thermodynamic Cycle Simulations for Internal Combustion Engines. West Sussex, UK: Wiley.
Chan, T., E. Meloche, J. Kubsh, R. Brezny, D. Rosenblatt, and G. Rideout. 2013. “Impact of Ambient Temperature on Gaseous and Particle Emissions from a Direct Injection Gasoline Vehicle and its Implications on Particle Filtration.” SAE International Journal of Fuels and Lubricants 6(2):350–371.
CO-OPTIMIZATION OF FUELS & ENGINES EFFICIENCY MERIT FUNCTION FOR SPARK-IGNITION ENGINES
21
Chang, Y., and J. Szybist.2016. “Fuel Effects on Combustion with EGR Dilution in Spark Ignited Engines.” Proceedings of the 2016 Central States Section of the Combustion Meeting, May 2016.
Chapman, E., R. Davis, W. Studzinski, and P. Geng. 2014. “Fuel Octane and Volatility Effects on the Stochastic Pre-Ignition Behavior of a 2.0L Gasoline Turbocharged DI Engine.” SAE International Journal of Fuels and Lubricants 7(2):379–389. doi: 10.4271/2014-01-1226.
Chow, E.W., J.B. Heywood, and R.L. Speth. 2014. “Benefits of a Higher Octane Standard Gasoline for the U.S. Light-Duty Vehicle Fleet.” SAE Technical Paper 2014-01-1961. doi: 10.4271/2014-01-1961.
Dahnz, C., K.M. Han, U. Spicher, M. Magar, R. Schießl, and U. Maas. 2010. “Investigations on Pre-Ignition in Highly Supercharged SI Engines.” SAE International Journal of Engines 3(1):214–224. doi: 10.4271/2010-01-0355.
Dugger, G.L., and D.D. Graab. 1953. “Flame Velocities of Hydrocarbon-Oxygen-Nitrogen Mixtures.” International Symposium on Combustion 4:302–310.
Farrell, J. T., W. Weissman, R.J. Johnston, J. Nishimura, T. Ueda, and Y. Iwashita. 2003. “Fuel Effects on SIDI Efficiency and Emissions.” SAE Technical Paper 2003-01-3186.
Foong, T.M., Morganti, K.J., Brear, M.J., da Silva, G., Yi, Y., and Dryer, F.L. 2013. “The Effect of Charge Cooling on the RON of Ethanol/Gasoline Blends.” SAE International Journal of Fuels and Lubricants 6(1):34–43. doi: 10.4271/2013-01-0886.
Janssen, A., F. Balthasar, C. Balzer, C. Wang, K. Wilbrand, W. Warnecke, and J. Cadu. 2016. “The Role of High Octane Fuels in Future Mobility—A Technical Review.” 25th Aachen Colloquium on Automobile and Engine Technology, Aachen, Germany.
Jung, H.H., M.H. Shelby, C. E. Newman, and R.A. Stein. 2013. “Effect of Ethanol on Part Load Thermal Efficiency and CO2 Emissions of SI Engines.” SAE International Journal of Engines 6(1):456–469. doi:10.4271/2013-01-1634.
Kalghatgi, G.T. 2001. “Fuel Anti-Knock Quality—Part I. Engine Studies.” SAE Technical Paper 2001-01-3584, doi: 10.4271/2001-01-3584.
Kasseris, E., and J.B. Heywood. 2012. “Charge Cooling Effects on Knock Limits in SI DI Engines Using Gasoline/Ethanol Blends: Part 2-Effective Octane Numbers.” SAE International Journal of Fuels and Lubricants 5(2):844–854. doi: 10.4271/2012-01-1284.
Kern, B., S. Spiess, and J.M. Richter. 2014. “Comprehensive Gasoline Exhaust Gas Aftertreatment, an Effective Measure to Minimize the Contribution of Modern Direct Injection Engines to Fine Dust and Soot Emissions?” SAE Technical Paper 2014-01-1513. doi: 10.4271/2014-01-1513.
Kessels, J.T.B.A., D.L. Foster, and W.A.J. Bleuanus. 2010. “Fuel Penalty Comparison for (Electrically) Heated Catalyst Technology.” Oil & Gas Science and Technology—Rev. IFP 65(1):47–54.

CO-OPTIMIZATION OF FUELS & ENGINES EFFICIENCY MERIT FUNCTION FOR SPARK-IGNITION ENGINES
22
Kolodziej, C.P., Wallner, T., Ickes, A., and Choi, S. 2016. “Studies of Research Octane Number (RON) and Heat of Vaporization (HoV).” Annual Report to the Vehicle Technologies Office Fuels and Lubricants Technology Program.
Kolodziej, C.P., M. Pamminger, J. Sevik, T. Wallner, S.W. Wagnon, and W.J. Pitz. 2017. “Effects of Fuel Laminar Flame Speed Compared to Engine Tumble Ratio, Ignition Energy, and Injection Strategy on Lean and EGR Dilute Spark Ignition Combustion.” SAE International Journal of Fuels and Lubricants 10(1) 82–94. doi:10.4271/2017-01-0671.
Leone, T.G., J.E. Anderson, R.S. Davis, A. Iqbal, R.A. Reese, M.H. Shelby, and W.M. Studzinski. 2015. “The Effect of Compression Ratio, Fuel Octane Rating, and Ethanol Content on Spark-Ignition Engine Efficiency.” Environmental Science & Technology 49(18):10778–10789.
Mamakos, A. 2011. “Feasibility of Introducing Particulate Filters on Gasoline Direct Injection Vehicles.” European Commission Joint Research Center—Institute for Energy and Transport: Ispra, Italy.
Mamakos, A., N. Steininger, G. Martini, P. Dilara, and Y. Drossinos. 2013. “Cost Effectiveness of Particulate Filter Installation on Direct Injection Gasoline Vehicles.” Atmospheric Environment 77:16–23. doi.org/10.1016/j.atmosenv.2013.04.063.
Mansfield, A.B., E. Chapman, and K. Briscoe. 2016a. “Effect of Market Variations in Gasoline Composition on Aspects of Stochastic Pre-Ignition.” Fuel (184):390–400. doi: 10.1016/j.fuel.2016.07.010.
Mansfield, A.B., E. Chapman, and K. Briscoe. 2016b. “Impact of Fuel Octane Rating and Aromatic Content on Stochastic Pre-Ignition.” SAE Technical Paper 2016-01-0721. doi: 10.4271/2016-01-0721.
Mayer, M., P. Hofmann, B. Geringer, J. Williams, and J. Moss, 2016a. “Influence of Different Fuel Properties and Gasoline—Ethanol Blends on Low-Speed Pre-Ignition in Turbocharged Direct Injection Spark Ignition Engines.” SAE International Journal of Engines 9(2). doi: 10.4271/2016-01-0719.
Mayer, M., Hofmann, P., Geringer, B., Williams, J., Moss, J., and Kapus, P. 2016b. “Influence of Different Oil Properties on Low-Speed Pre-Ignition in Turbocharged Direct Injection Spark Ignition Engines.” SAE Technical Paper 2016-01-0718. doi:10.4271/2016-01-0718.
Metghalchi, M., and J.C. Keck. 1982. “Burning Velocities of Mixtures with Methanol, Isooctane, and Indolene at High Pressure and Temperature.” Combustion and Flame 48:191–210.
Mikulic, I., H. Koelman, S. Majkowski, and P. Vosejpka. 2010. “A Study about Particle Filter Application on a State-of the-Art Homogeneous Turbocharged 2L DI Gasoline Engine.” Aachener Kolloquium Fahrzeug und Motorentechnik. https://circabc.europa.eu/webdav/CircaBC/GROW/automotive/Library/commission_expert/ vehicle_emissions/109th_meeting_2011/Dow_AC_Kolloquium_final%20(2).pdf.

CO-OPTIMIZATION OF FUELS & ENGINES EFFICIENCY MERIT FUNCTION FOR SPARK-IGNITION ENGINES
23
Sileghem, L., J. Vancoillie, J. Demuynck, J. Galle, and S. Verhelst. 2012. “Alternative Fuels for Spark-Ignition Engines: Mixing Rules for the Laminar Burning Velocity of Gasoline-Alcohol Blends.” Energy Fuels 26:4721–4727.
Sluder, C.S., J.P. Szybist, R.L. McCormick, M.A. Ratcliff, and B.T. Zigler, 2016. “Exploring the Relationship Between Octane Sensitivity and Heat-of-Vaporization.” SAE International Journal of Fuels and Lubricants 9(1). doi: 10.4271/2016-01-0836.
Sobotowski, R.A., A.D. Butler, and Z. Guerra. 2015. “A Pilot Study of Fuel Impacts on PM Emissions from Light-Duty Gasoline Vehicles.” SAE International Journal of Fuels and Lubricants 8(1):214–233.
Stein, R.A., D. Polovina, K. Roth, M. Foster, M. Lynskey, T. Whiting, J.E. Anderson, M.H. Shelby, T.G. Leone, and S. Vandergriend. 2012. “Effect of Heat of Vaporization, Chemical Octane, and Sensitivity on Knock Limit for Ethanol‒Gasoline Blends.” SAE International Journal of Fuels and Lubricants 5(2):823–843.
Szybist, J., and D. Splitter. 2016. “Effects of Fuel Composition on EGR Dilution Tolerance in Spark Ignited Engines.” SAE International Journal of Engines 9(2):819–831. doi:10.4271/2016-01-0715.
Szybist, J., and D. Splitter. 2017. “Fuel-Specific Effects on High-Load Knock Propensity with and Without EGR in a Stoichiometric SI Engine.” Presentation at the Advanced Engine Combustion Program Review meeting. February 2017. Sandia National Laboratories: Livermore, CA.
U.S. DRIVE Advanced Combustion and Emission Control Technical Team. 2016. “Aftertreatment Protocols for Catalyst Characterization and Performance Evaluation: Low Temperature Oxidation Catalyst Test Protocol.” www.cleers.org/acec-lowt/.
Zahdeh, A., P. Rothenberger, W. Nguyen, M. Anbarasu, S. Schmuck-Soldan, J. Schaefer, and T. Goebel. 2011. “Fundamental Approach to Investigate Pre-Ignition in Boosted SI Engines.” SAE International Journal of Engines 4(1): 246–273. doi: 10.4271/2011-01-0340.

CO-OPTIMIZATION OF FUELS & ENGINES EFFICIENCY MERIT FUNCTION FOR SPARK-IGNITION ENGINES
24
4. Bibliography Dahnz, C., and U. Spicher. 2010. “Irregular Combustion in Supercharged Spark Ignition Engines—Pre-Ignition and Other Phenomena.” International Journal of Engine Research 11(6):4 85–498. doi:10.1243/14680874JER609.
Dingle, S., A. Cairns, H. Zhao, J. Williams, O. Williams, and R. Ali. 2014. “Lubricant Induced Pre-Ignition in an Optical SI Engine.” SAE Technical Paper 2014-01-1222. doi: 10.4271/2014-01-1222.
Fletcher, K.A., L. Dingwell, K. Yang, W.Y. Lam, and J.P. Styer. 2016. “Engine Oil Additive Impacts on Low Speed Pre-Ignition.” SAE International Journal of Fuels and Lubricants 9(3). doi: 10.4271/2016-01-2277.
Haenel, P., P. Seyfried, H. Kleeberg, and D. Tomazic, 2011. “Systematic Approach to Analyze and Characterize Pre-Ignition Events in Turbocharged Direct-Injected Gasoline Engines.” SAE Technical Paper 2011-01-0343. doi: 10.4271/2011-01-0343.
Leone, T.G., E.D. Olin, J.E. Anderson, H.H. Jung, M.H. Shelby, and R.A. Stein. 2014. “Effects of Fuel Octane Rating and Ethanol Content on Knock, Fuel Economy, and CO2 for a Turbocharged DI Engine.” SAE International Journal of Fuels and Lubricants 7(1): 9–28.
Okada, Y., S. Miyashita, Y. Izumi, and Y. Hayakawa. 2014. “Study of Low-Speed Pre-Ignition in Boosted Spark Ignition Engine.” SAE International Journal of Engines 7(2): 584–594. doi: 10.4271/2014-01-1218.
Peters, N., Kerschgens, B., and Paczko, G. 2013. “Super-Knock Prediction Using a Refined Theory of Turbulence.” SAE International Journal of Engines 6(2): 953–967. doi:10.4271/2013-01-1109.
Qi, Y., Y. Xu, Z. Wang, and J. Wang. 2014. “The Effect of Oil Intrusion on Super Knock in Gasoline Engine.” SAE Technical Paper 2014-01-1224. doi:10.4271/2014-01-1224.
Ritchie, A., D. Boese, and A.W. Young. 2016. “Controlling Low-Speed Pre-Ignition in Modern Automotive Equipment Part 3: Identification of Key Additive Component Types and Other Lubricant Composition Effects on Low-Speed Pre-Ignition.” SAE International Journal of Engines, 9(2):832–840. doi:10.4271/2016-01-0717.
Wang, Z., Y. Qi, H. Liu, Y. Long, and J.X. Wang. 2015. “Experimental Study on Pre-Ignition and Super-Knock in Gasoline Engine Combustion with Carbon Particle at Elevated Temperatures and Pressures.” SAE Technical Paper 2015-01-0752. doi:10.4271/2015-01-0752.
Welling, O., N. Collings, J. Williams, and J. Moss. 2014. “Impact of Lubricant Composition on Low-Speed Pre-Ignition.” SAE Technical Paper 2014-01-1213. doi:10.4271/2014-01-1213.
Welling, O., J. Moss, J. Williams, and N. Collings. 2014. “Measuring the Impact of Engine Oils and Fuels on Low-Speed Pre-Ignition in Downsized Engines.” SAE International Journal of Fuels and Lubricants 7(1):1–8. doi:10.4271/2014-01-1219.
CO-OPTIMIZATION OF FUELS & ENGINES EFFICIENCY MERIT FUNCTION FOR SPARK-IGNITION ENGINES
25
Whitby, R. D. 2015. “Engine Oils and Low-Speed Pre-Ignition.” Tribology & Lubrication Technology. 71(9).
Zaccardi, J. M., and D. Escudie. 2015. “Overview of the Main Mechanisms Triggering Low-Speed Pre-Ignition in Spark-Ignition Engines.” International Journal of Engine Research. 16(2):152–165. doi: 10.1177/1468087414530965.
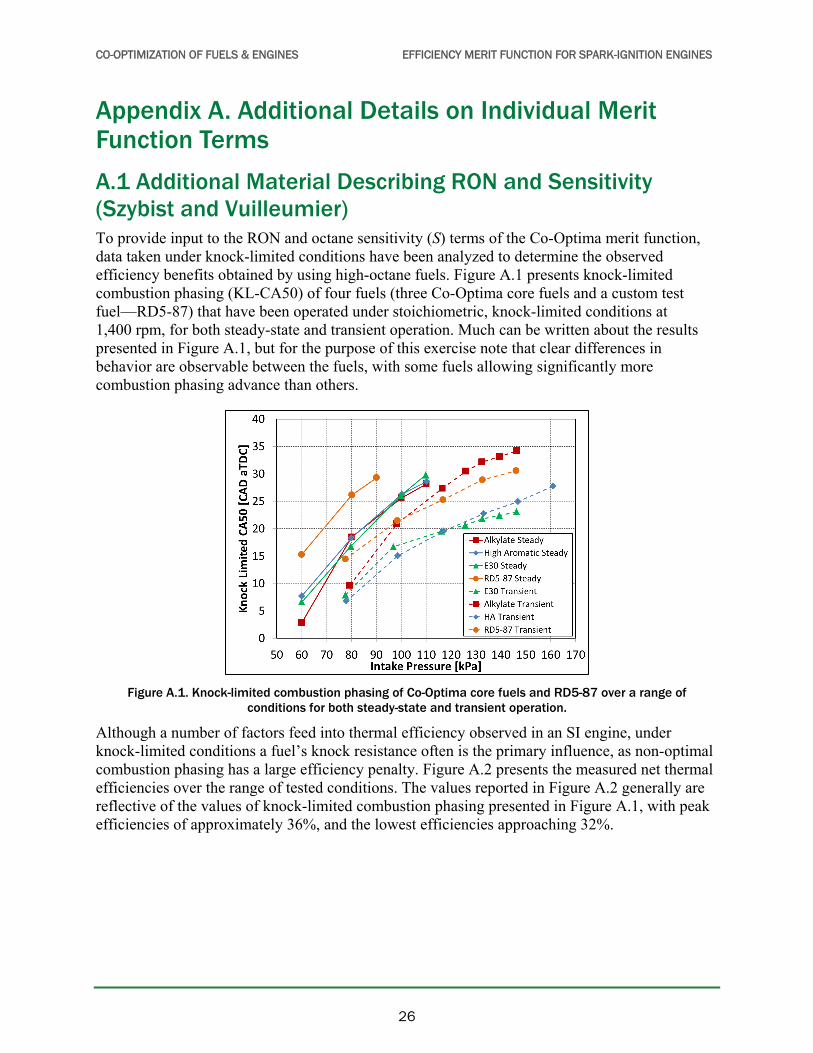
CO-OPTIMIZATION OF FUELS & ENGINES EFFICIENCY MERIT FUNCTION FOR SPARK-IGNITION ENGINES
26
Appendix A. Additional Details on Individual Merit Function Terms A.1 Additional Material Describing RON and Sensitivity (Szybist and Vuilleumier) To provide input to the RON and octane sensitivity (S) terms of the Co-Optima merit function, data taken under knock-limited conditions have been analyzed to determine the observed efficiency benefits obtained by using high-octane fuels. Figure A.1 presents knock-limited combustion phasing (KL-CA50) of four fuels (three Co-Optima core fuels and a custom test fuel—RD5-87) that have been operated under stoichiometric, knock-limited conditions at 1,400 rpm, for both steady-state and transient operation. Much can be written about the results presented in Figure A.1, but for the purpose of this exercise note that clear differences in behavior are observable between the fuels, with some fuels allowing significantly more combustion phasing advance than others.
Figure A.1. Knock-limited combustion phasing of Co-Optima core fuels and RD5-87 over a range of
conditions for both steady-state and transient operation.
Although a number of factors feed into thermal efficiency observed in an SI engine, under knock-limited conditions a fuel’s knock resistance often is the primary influence, as non-optimal combustion phasing has a large efficiency penalty. Figure A.2 presents the measured net thermal efficiencies over the range of tested conditions. The values reported in Figure A.2 generally are reflective of the values of knock-limited combustion phasing presented in Figure A.1, with peak efficiencies of approximately 36%, and the lowest efficiencies approaching 32%.

CO-OPTIMIZATION OF FUELS & ENGINES EFFICIENCY MERIT FUNCTION FOR SPARK-IGNITION ENGINES
27
Figure A.2. Knock-limited combustion phasing as a function of OI.
To evaluate the benefits of more autoignition-resistant fuels in SI engines, an appropriate metric for fuel reactivity was needed. As the Co-Optima Core Fuels all share a RON of approximately 98, it is clear from examining Figure A.1 under which regimes the RON rating is a good indicator of performance, or perhaps more importantly, conditions at which RON does not appropriately describe fuel knock–resistance. For this reason, an OI framework was adopted, and with the addition of RD5-87 to the fuels matrix, which has a RON of 92.1 and an S of 7.3, it was possible to use linear regressions to calculate OI K-factors over a range of conditions. These K-factors are plotted as a function of intake pressure in Figure A.3. This figure indicates that, under steady-state conditions, a K range of 0 to 0.5 was explored, and under transient condition, a range of K values from -0.25 to -2.35 was explored. This wide range of operating conditions allowed for an assessment of the efficiency benefits of high autoignition–resistant fuels under different regimes, ranging from heated and throttled to cold and boosted “beyond RON” conditions.
Figure A.3. OI K-factors at 100 kPa intake pressure, 30°C intake temperature, and knock-limited operation.

CO-OPTIMIZATION OF FUELS & ENGINES EFFICIENCY MERIT FUNCTION FOR SPARK-IGNITION ENGINES
28
Using the K-factors determined for each operating point, the OI value of each fuel was calculated for each operating point. Then the net thermal efficiency was plotted against the OI value for each operating condition, as shown in Figure A.4. As seen in this figure, the values for thermal efficiency versus OI fell into three groups. The first group encompasses most of the data and represents operating conditions with K values from -0.85 to 0.5. The other three groups of data correspond to K values of -2.35, -2.05, and -1.7. Best fit lines were determined for the four groups of data, and the slopes of these lines, which indicate thermal efficiency gain versus OI, were extracted and are presented in Table A.1. In addition to the absolute gains in thermal efficiency, all results were normalized to the lowest efficiency result at each operating condition. These results are also included in Table A.1.
Figure A.4. Net thermal efficiencies at steady state, knock-limited conditions.
Table A.1 shows that there is no significant trend between efficiency gains for different operating conditions, considering that the last three groups of data comprise a small number of samples which therefore are susceptible to significant errors in the slope computations. The lack of any clear outliers, however, is reassuring.
Table A.1. Thermal Efficiency Gains per Increase in Fuel OI, Both on an Absolute and Relative Basis
K Range
Relative Thermal Efficiency Gain (%) per Octane Index Unit (-)
Relative Thermal Efficiency Gain (%) per OI Unit (-) multiplied by 1.1 (for
downsizing/ boosting effects)
Merit Function Relative Efficiency Gain per OI Unit
K = -0.85: 0.5 0.48 0.53
K = -1.7 0.33 0.37
K = -2.05 0.41 0.45 0.625
K = -2.35 0.36 0.39
Average 0.39 0.43

CO-OPTIMIZATION OF FUELS & ENGINES EFFICIENCY MERIT FUNCTION FOR SPARK-IGNITION ENGINES
29
Table A.1 indicates that the measured efficiency increases are similar to, though lower than, the efficiency term used in the merit function. The merit function increase, however, accounts for both compression ratio increases allowed by higher-octane fuels, as well as additional downsizing, which reduces throttling losses across the operating space. These differences between the performed experiments and the intent of the merit function term offer an explanation for the observed differences.
A.2 K-Factor Discussion (Szybist and Vuilleumier) A.2.1 K-Factor Value A recent study performed as part of Co-Optima (Szybist and Splitter 2017) provided insight into the K-factor for boosted operating conditions. The engine was operated under stoichiometric conditions with a constant air flow rate at 2,000 rpm, and the K-factor was calculated using a multi-variable linear regression analysis with the seven fuels investigated. The study looked at a range of intake temperature, backpressure, and EGR conditions, the operating conditions that were most relevant to how modern engines operate produced a K value of -1.24, as discussed above.
It should also be noted that the engine operating conditions in Szybist and Splitter (2017) are not pushing the upper limits. The engine load investigated was between 14.5 and 19.0 bar IMEP, depending on combustion phasing. Many production engines have engine loads that can output 25 bar IMEP, with some engines under development approaching 30 bar IMEP. As the engine load increases—which by necessity increases the engine boost level—the K-factor is expected to keep decreasing. Thus, for the purposes of the merit function, this indicates that the maximum K-factor that should be used is -1.25, and perhaps as low as -1.5 or less.
Additional dynamometer and vehicle studies have measured K-factors of high-load conditions for modern, boosted, directly injected engines. Prakash et al. (2016), who measured K values of engines in vehicles using knock-limited acceleration tests, found K values ranging from -0.6 to -0.9 for the DI turbocharged engine that was tested. Remmert et al. (2014) performed knock-limited combustion phasing tests on a dynamometer using a highly boosted (maximum load ~ 35 bar BMEP) SI engine. Using this engine, K-factors ranging from -0.2 to -1.14 were reported, at high load and medium engine speed.
It should also be noted that although dynamometer studies are preferable for determining K values due to their ability to fix a specific operating condition rather than vehicle acceleration tests, which move across an engine’s operating space, dynamometer studies typically are not conducted at maximum power conditions, but rather at high-load, low- or medium-engine speed. Theory indicates that higher engine speeds trend towards higher K-factors than lower engine speeds; thus, when estimating octane appetites of future engines from dynamometer results, it is important to consider how representative of peak power the tested conditions are.
A.2.2 K-Factor Shortcomings In a recent Co-Optima work, Szybist and Splitter (2017) found the distribution of the K-factor to be bimodal. That is, in some cases it was found to be < -1, and in other cases it was found to be near zero. The OI and K-factor theory is that the K-factor is an indication of the trajectory of the
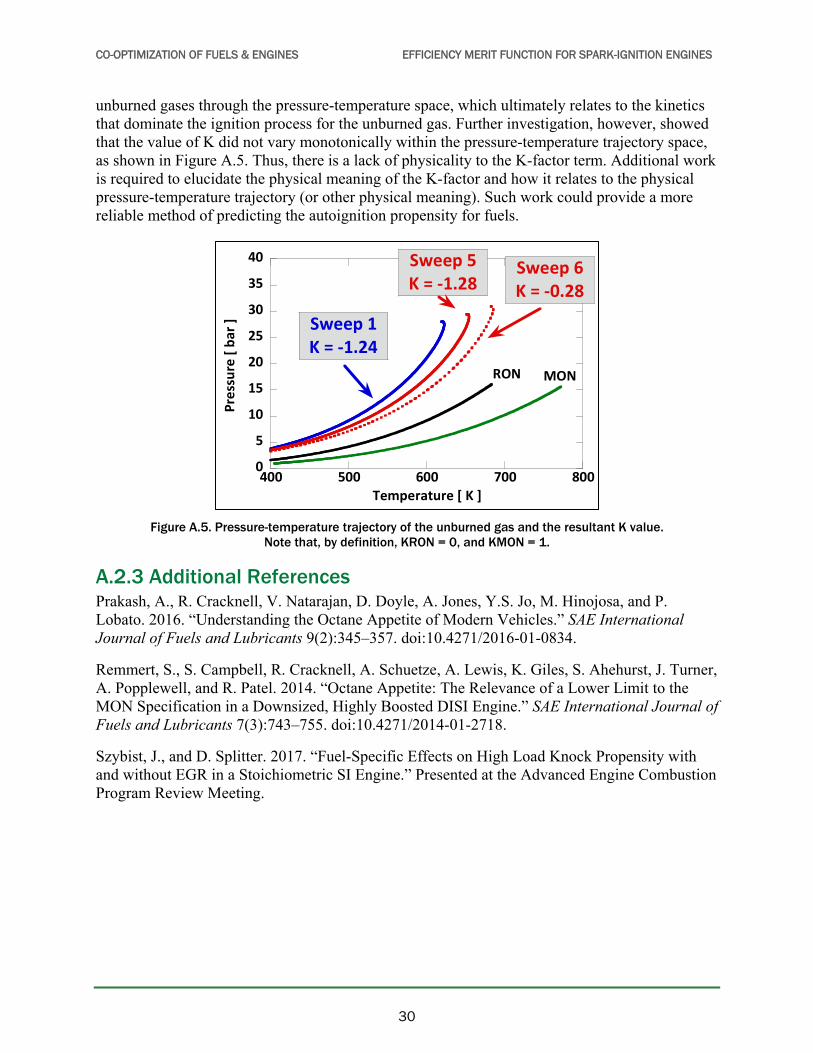
CO-OPTIMIZATION OF FUELS & ENGINES EFFICIENCY MERIT FUNCTION FOR SPARK-IGNITION ENGINES
30
unburned gases through the pressure-temperature space, which ultimately relates to the kinetics that dominate the ignition process for the unburned gas. Further investigation, however, showed that the value of K did not vary monotonically within the pressure-temperature trajectory space, as shown in Figure A.5. Thus, there is a lack of physicality to the K-factor term. Additional work is required to elucidate the physical meaning of the K-factor and how it relates to the physical pressure-temperature trajectory (or other physical meaning). Such work could provide a more reliable method of predicting the autoignition propensity for fuels.
Figure A.5. Pressure-temperature trajectory of the unburned gas and the resultant K value.
Note that, by definition, KRON = 0, and KMON = 1.
A.2.3 Additional References Prakash, A., R. Cracknell, V. Natarajan, D. Doyle, A. Jones, Y.S. Jo, M. Hinojosa, and P. Lobato. 2016. “Understanding the Octane Appetite of Modern Vehicles.” SAE International Journal of Fuels and Lubricants 9(2):345–357. doi:10.4271/2016-01-0834.
Remmert, S., S. Campbell, R. Cracknell, A. Schuetze, A. Lewis, K. Giles, S. Ahehurst, J. Turner, A. Popplewell, and R. Patel. 2014. “Octane Appetite: The Relevance of a Lower Limit to the MON Specification in a Downsized, Highly Boosted DISI Engine.” SAE International Journal of Fuels and Lubricants 7(3):743–755. doi:10.4271/2014-01-2718.
Szybist, J., and D. Splitter. 2017. “Fuel-Specific Effects on High Load Knock Propensity with and without EGR in a Stoichiometric SI Engine.” Presented at the Advanced Engine Combustion Program Review Meeting.
0
5
10
15
20
25
30
35
40
400 500 600 700 800
Pres
sure
[ ba
r ]
Temperature [ K ]
RON MON
Sweep 1K = -1.24
Sweep 5K = -1.28
Sweep 6K = -0.28

CO-OPTIMIZATION OF FUELS & ENGINES EFFICIENCY MERIT FUNCTION FOR SPARK-IGNITION ENGINES
31
A.3 Discussion of HoV Term (Sjöberg and Vuilleumier)This discussion aims to shed light on the validity of the second HoV term of the merit function. This term is intended to capture the effect of the HoV on thermal efficiency for engine operation that is not knock-limited.
130])kg/kJ[415HoV(Merit mix −
=
Here, it is not questioned whether 415 kJ/kg is the ideal baseline value for an E10 gasoline. Instead, the focus is on the value of the denominator, which effectively determines the relative efficiency merit of a change of HoV. In this form, the equation shows that an increase of HoV of 130 kJ/kg raises the thermal efficiency by 1% on a relative basis. This number was based on the results found by Jung et al. (2013).
Increased HoV leads to increased charge cooling associated with vaporization of the fuel, in particular for directly injected engines. This affects the combustion in several ways that influence the thermal efficiency. Here, the following are considered:
• Reduced temperatures during compression, combustion, and expansion increase theeffective λ, which improves the thermodynamic cycle efficiency.
• Reduced temperatures during compression, combustion, and expansion decrease thedriving force for heat-transfer losses to combustion-chamber walls, which improvesthe thermodynamic cycle efficiency.
• Reduced temperatures during combustion can slow deflagration and heat-releaserate, which can increase burn duration and reduce the thermodynamic cycle efficiency.
In addition, increased HoV will reduce the measured LHV of the fuel due to the heat required for the phase change from liquid to gas. This could be a challenge from the perspective of fair energy accounting for a well-to-wheel analysis, but is not be discussed here.
Ethanol-gasoline blends can be particularly suitable for studying the effect of HoV on the thermal efficiency of an SI engine. This is because ethanol addition leads to a strong increase of the HoV. At the same time, ethanol addition increases the inherent flame speed to counteract any heat release rate slowing due HoV cooling alone. This counterbalancing effect can be observed in the Sandia National Laboratories (Sandia) DISI engine (see Figure A.6, Figure A.7), which used direct injection of fuel during the intake stroke for the examples below. As such, the combined effects of 1 and 2 above are studied without having to correct for effects caused by changes of the burn duration.
The HoV was not measured for these fuel blends. Here, it is assumed that the HoV for gasoline is 350 kJ/kg and estimate the HoV of the blends based on the HoV for ethanol, which is 900 kJ/kg. The relative efficiency gains for these two examples in Figure A.6 and Figure A.7 are plotted in Figure A.8.
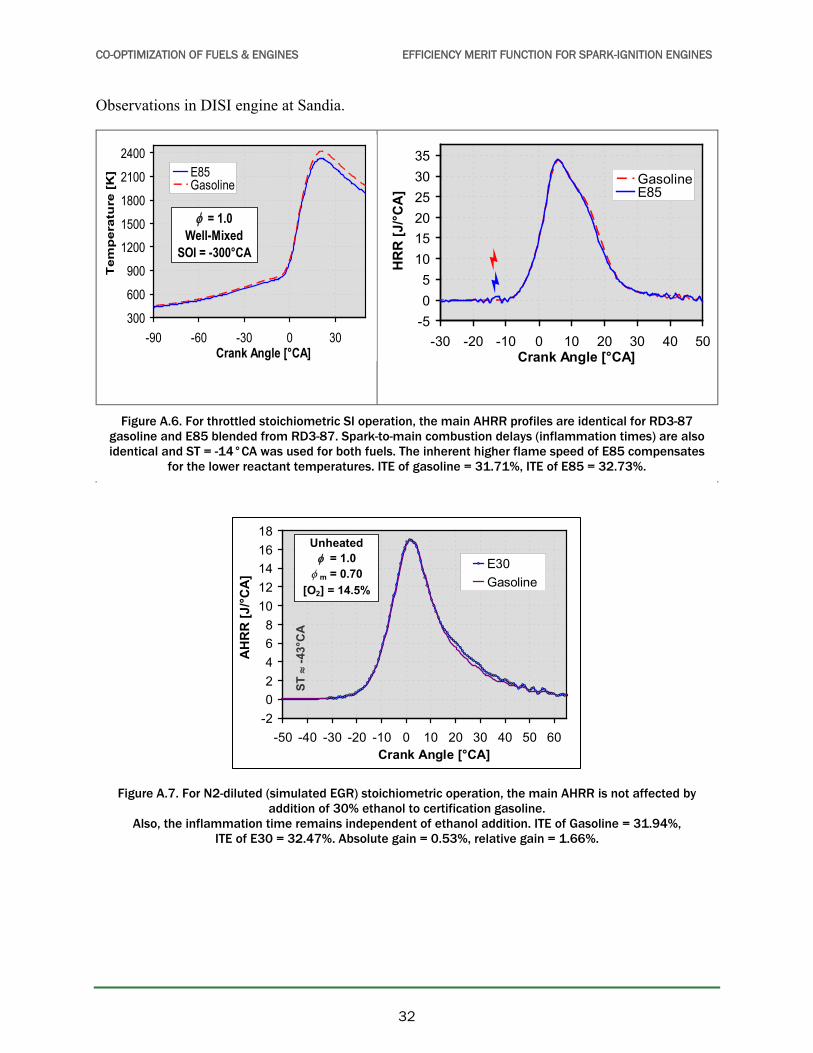
CO-OPTIMIZATION OF FUELS & ENGINES EFFICIENCY MERIT FUNCTION FOR SPARK-IGNITION ENGINES
32
Observations in DISI engine at Sandia.
Figure A.6. For throttled stoichiometric SI operation, the main AHRR profiles are identical for RD3-87 gasoline and E85 blended from RD3-87. Spark-to-main combustion delays (inflammation times) are also identical and ST = -14°CA was used for both fuels. The inherent higher flame speed of E85 compensates
for the lower reactant temperatures. ITE of gasoline = 31.71%, ITE of E85 = 32.73%.
Figure A.7. For N2-diluted (simulated EGR) stoichiometric operation, the main AHRR is not affected by addition of 30% ethanol to certification gasoline.
Also, the inflammation time remains independent of ethanol addition. ITE of Gasoline = 31.94%, ITE of E30 = 32.47%. Absolute gain = 0.53%, relative gain = 1.66%.
-202468
1012141618
-50 -40 -30 -20 -10 0 10 20 30 40 50 60Crank Angle [°CA]
AH
RR
[J/°C
A]
E30Gasoline
Unheatedφ = 1.0
φ m = 0.70[O2] = 14.5%
ST ≈
-43°
CA
300
600
900
1200
1500
1800
2100
2400
-90 -60 -30 0 30Crank Angle [°CA]
Tem
per
atu
re [
K] E85
Gasoline
φ = 1.0Well-Mixed
SOI = -300°CA
-505
101520253035
-30 -20 -10 0 10 20 30 40 50Crank Angle [°CA]
HR
R [J
/°CA
]
GasolineE85

CO-OPTIMIZATION OF FUELS & ENGINES EFFICIENCY MERIT FUNCTION FOR SPARK-IGNITION ENGINES
33
Figure A.8. The HoV required to achieve a certain amount of relative gain of thermal efficiency.
With a linear fit through these data points, the analysis of these four combinations of fuels and dilution levels indicates that an increase of HoV by 147 kJ/kg is required to achieve 1% relative increase of the thermal efficiency. This is remarkably similar to the 130 value of the original formulation of the merit function. Given the few data points available, there is no statistical justification to adjust the number 130 in the denominator.
It should be noted, however, that the stoichiometric air-to-fuel ratio (AFR) decreases with ethanol content of the fuel. The original merit function does not correct for changes of the AFR between fuels and has been reformulated to account for the heat of vaporization of a stoichiometric mixture. A lower AFR leads to greater cooling per unit mass of mixture; this is not captured by assessing the HoV of the fuel alone. The rate of 0.01 ON per kJ/kgfuel of HoV used in the original merit function is consequently now expressed as 0.085 ON per kJ/kgmix. The aforementioned terms represent the change in ON per change in HoV of the fuel (∂ON/∂HoVfuel), or HoV of the mixture mass (∂ON/∂HoVmix), respectively. Therefore, the ratio of these rates is not equal to the AFR, as might be expected by a cursory review of the change to the HoV terms, but rather to the rate of change of HoV of the fuel divided by the rate of change of the HoV of the mixture (∂HoVfuel/∂HoVmix). This ratio of rates is equal to approximately 8.5 when evaluated for the mid-level gasoline-ethanol blends that form the literature basis for this term.
To maintain consistency, both terms describing the HoV effects have been reformulated to account for AFR. Because a correction factor for AFR is added, the value of 130 is adjusted down to 15.2 in the second term related to HoV to be consistent with the data of Jung et al. (2013). A comparison of the original and the modified merit function formulations is shown in Figure A.9. Note that the nearly exclusive use of ethanol-gasoline blends for assessing the effects of charge cooling on engine performance points to the need for further work in this area.
y = 146.60x + 327.11R2 = 0.97
350
450
550
650
750
850
0.0 0.5 1.0 1.5 2.0 2.5 3.0 3.5Rel. Gain of Thermal Eff. [%]
Hea
t of V
apor
izat
ion
[kJ/
kg]
Rel. Eff. Gain [%]Linear (Rel. Eff. Gain [%])
Unheatedφ = 1.0
E85
E30Gasoline
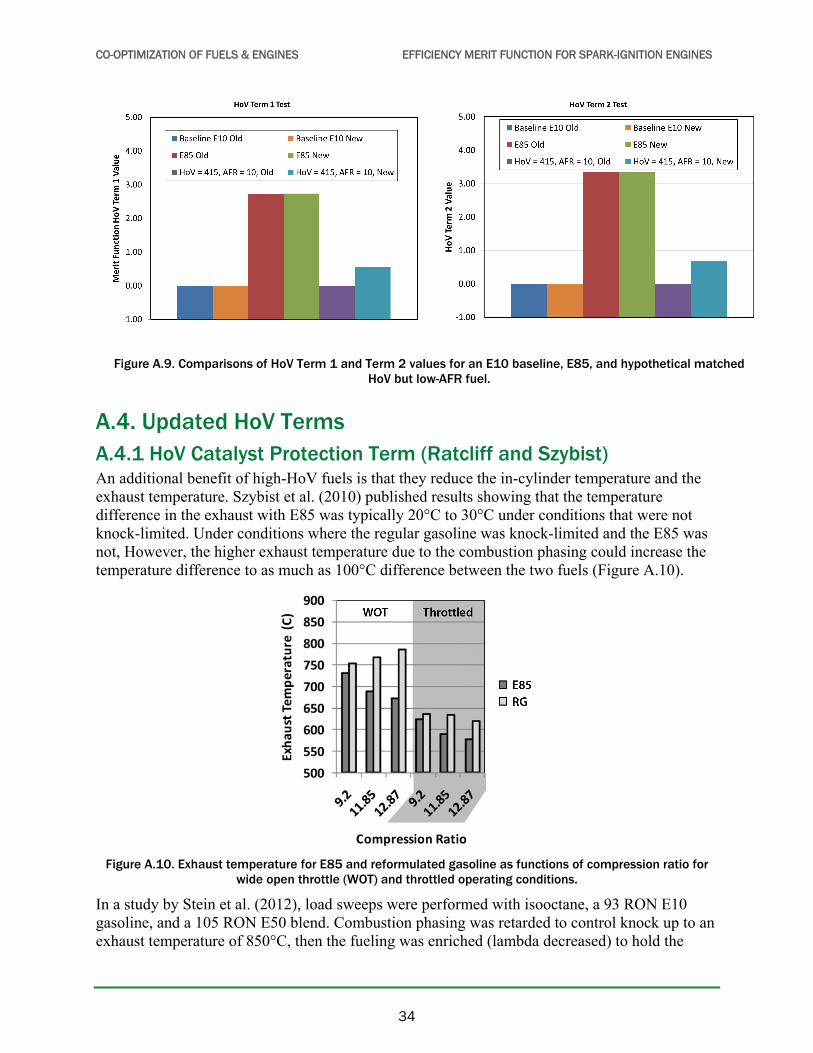
CO-OPTIMIZATION OF FUELS & ENGINES EFFICIENCY MERIT FUNCTION FOR SPARK-IGNITION ENGINES
34
Figure A.9. Comparisons of HoV Term 1 and Term 2 values for an E10 baseline, E85, and hypothetical matched HoV but low-AFR fuel.
A.4. Updated HoV Terms A.4.1 HoV Catalyst Protection Term (Ratcliff and Szybist) An additional benefit of high-HoV fuels is that they reduce the in-cylinder temperature and the exhaust temperature. Szybist et al. (2010) published results showing that the temperature difference in the exhaust with E85 was typically 20°C to 30°C under conditions that were not knock-limited. Under conditions where the regular gasoline was knock-limited and the E85 was not, However, the higher exhaust temperature due to the combustion phasing could increase the temperature difference to as much as 100°C difference between the two fuels (Figure A.10).
Figure A.10. Exhaust temperature for E85 and reformulated gasoline as functions of compression ratio for
wide open throttle (WOT) and throttled operating conditions.
In a study by Stein et al. (2012), load sweeps were performed with isooctane, a 93 RON E10 gasoline, and a 105 RON E50 blend. Combustion phasing was retarded to control knock up to an exhaust temperature of 850°C, then the fueling was enriched (lambda decreased) to hold the

CO-OPTIMIZATION OF FUELS & ENGINES EFFICIENCY MERIT FUNCTION FOR SPARK-IGNITION ENGINES
35
exhaust temperature constant. Figure A.11 shows that when fuel enrichment began near 12 bar net IMEP for isooctane, the exhaust temperature for 105 RON E50 was about 100°C cooler. This was the direct result of significantly advanced combustion phasing allowed by 105 RON E50, owing to the combined effects of its higher RON and octane sensitivity (S). The much higher HoV of the E50 blend likely contributed as well. At 9 bar net IMEP with identical combustion phasing, the exhaust temperature from 105 RON E50 was ≈ 25°C cooler than from isooctane. In this case, the temperature difference resulted solely from the E50’s higher HoV.
Figure A.11. Comparison of enrichment for isooctane, B88E10-R93 and B88E50-R105 at 12:1 CR and
3,500 rpm (adapted from Stein et al. [2012]).
The results of these two studies are well aligned. Thus, under conditions where the exhaust temperature is approaching the limits of the emission controls system, the higher HoV fuel could be the difference between requiring fuel enrichment and remaining under stoichiometric conditions.
In its current form, this effect from high HoV fuels is difficult to incorporate into the merit function because so much of this depends on the engine hardware system and the calibration. Some engines might not regularly operate at conditions where the HoV makes the difference between enrichment and stoichiometric conditions, but other engine configurations could operate there frequently. This should be taken into account when modeling individual systems in greater fidelity.

CO-OPTIMIZATION OF FUELS & ENGINES EFFICIENCY MERIT FUNCTION FOR SPARK-IGNITION ENGINES
36
A.4.2 Additional Reference for HoV Catalyst Protection Term Discussion Szybist, J., M. Foster, W. Moore, K. Confer, A. Youngquist, and R. Wagner. 2010. “Investigation of Knock Limited Compression Ratio of Ethanol Gasoline Blends.” SAE Technical Paper 2010-01-0619, doi:10.4271/2010-01-0619.
A.5 Supplemental Material Related to Particulate Matter Index A.5.1 PM Emission Regulations The EPA’s Tier 3 PM regulation of 3 mg/mile (down from 10 mg/mile) began phase-in in 2017 with full implementation scheduled for 2021. CARB has a stricter Low Emissions Vehicle (LEV) III regulation of 1 mg/mile that phases in between 2025 and 2028. Historically, EPA often follows CARB’s lead on emission regulations. It is conservatively assumed that EPA will adopt the 1-mg/mile standard sometime after 2025 and use this as a basis for tuning the PM Control term.
The challenge in applying any PM emission regulation to the merit function is that U.S. emission regulations are based on vehicle-level testing with the FTP75 driving cycle, which is several steps removed from the merit function’s focus on fuel property effects on maximum engine efficiency. At this time, no definitive study has been identified from which it can be concluded or deduced that current technology GDI vehicles tested with gasoline having a PMI > x will require a GPF to meet a given emission regulation. The limited data available (Aikawa et al. 2010, Sobotowski et al. 2015) suggest that a very low PMI of about 1 is required to meet 1 mg/mile of PM with a GDI-powered vehicle. Given that vanishingly few retail gasolines have PMI values this low (Aikawa et al. 2010) it might be concluded that all vehicles will require a GPF. The referenced studies used early GDI technology, however, and original equipment manufacturers are continuing to improve the combustion systems to minimize PM formation. CARB’s recent technology review (CARB 2017) concludes that combustion system improvements will allow many light-duty vehicles to meet 1 mg/mile PM by 2025 without a GPF.
Continued development of GDI combustion systems is reducing PM emissions, and the improvements will probably allow most original equipment manufacturers to meet EPA’s PM regulation of 3 mg/mile without a GPF. Minimizing PM formation depends primarily on avoidance of liquid fuel deposition and rapid spray breakup, evaporation, and air mixing. Examples of technology improvements toward these objectives include:
• Piezoelectric injectors that allow multiple, shorter injections that reduce spray penetration length and therefore reduce spray impingement on combustion chamber surfaces
• Intake ports and combustion chambers designed for spray-guided injection that further reduces spray impingement
• Higher fuel pressures coupled with injector nozzles that improve spray breakup and resist deposit formation
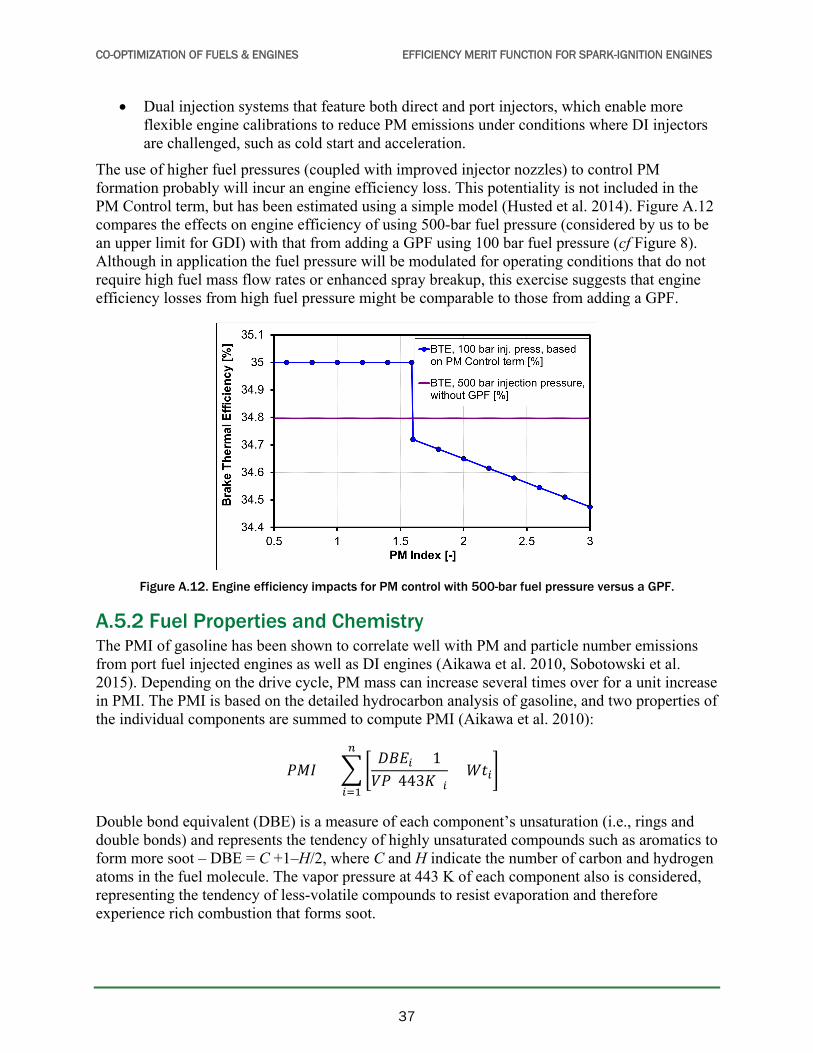
CO-OPTIMIZATION OF FUELS & ENGINES EFFICIENCY MERIT FUNCTION FOR SPARK-IGNITION ENGINES
37
• Dual injection systems that feature both direct and port injectors, which enable more flexible engine calibrations to reduce PM emissions under conditions where DI injectors are challenged, such as cold start and acceleration.
The use of higher fuel pressures (coupled with improved injector nozzles) to control PM formation probably will incur an engine efficiency loss. This potentiality is not included in the PM Control term, but has been estimated using a simple model (Husted et al. 2014). Figure A.12 compares the effects on engine efficiency of using 500-bar fuel pressure (considered by us to be an upper limit for GDI) with that from adding a GPF using 100 bar fuel pressure (cf Figure 8). Although in application the fuel pressure will be modulated for operating conditions that do not require high fuel mass flow rates or enhanced spray breakup, this exercise suggests that engine efficiency losses from high fuel pressure might be comparable to those from adding a GPF.
Figure A.12. Engine efficiency impacts for PM control with 500-bar fuel pressure versus a GPF.
A.5.2 Fuel Properties and Chemistry The PMI of gasoline has been shown to correlate well with PM and particle number emissions from port fuel injected engines as well as DI engines (Aikawa et al. 2010, Sobotowski et al. 2015). Depending on the drive cycle, PM mass can increase several times over for a unit increase in PMI. The PMI is based on the detailed hydrocarbon analysis of gasoline, and two properties of the individual components are summed to compute PMI (Aikawa et al. 2010):
𝑃𝑃𝑃𝑃𝐼𝐼 = ��(𝐷𝐷𝐷𝐷𝐸𝐸𝑚𝑚 + 1)𝑉𝑉𝑃𝑃(443𝐾𝐾)𝑚𝑚
× 𝑊𝑊𝑃𝑃𝑚𝑚�𝑐𝑐
𝑚𝑚=1
Double bond equivalent (DBE) is a measure of each component’s unsaturation (i.e., rings and double bonds) and represents the tendency of highly unsaturated compounds such as aromatics to form more soot – DBE = C +1–H/2, where C and H indicate the number of carbon and hydrogen atoms in the fuel molecule. The vapor pressure at 443 K of each component also is considered, representing the tendency of less-volatile compounds to resist evaporation and therefore experience rich combustion that forms soot.
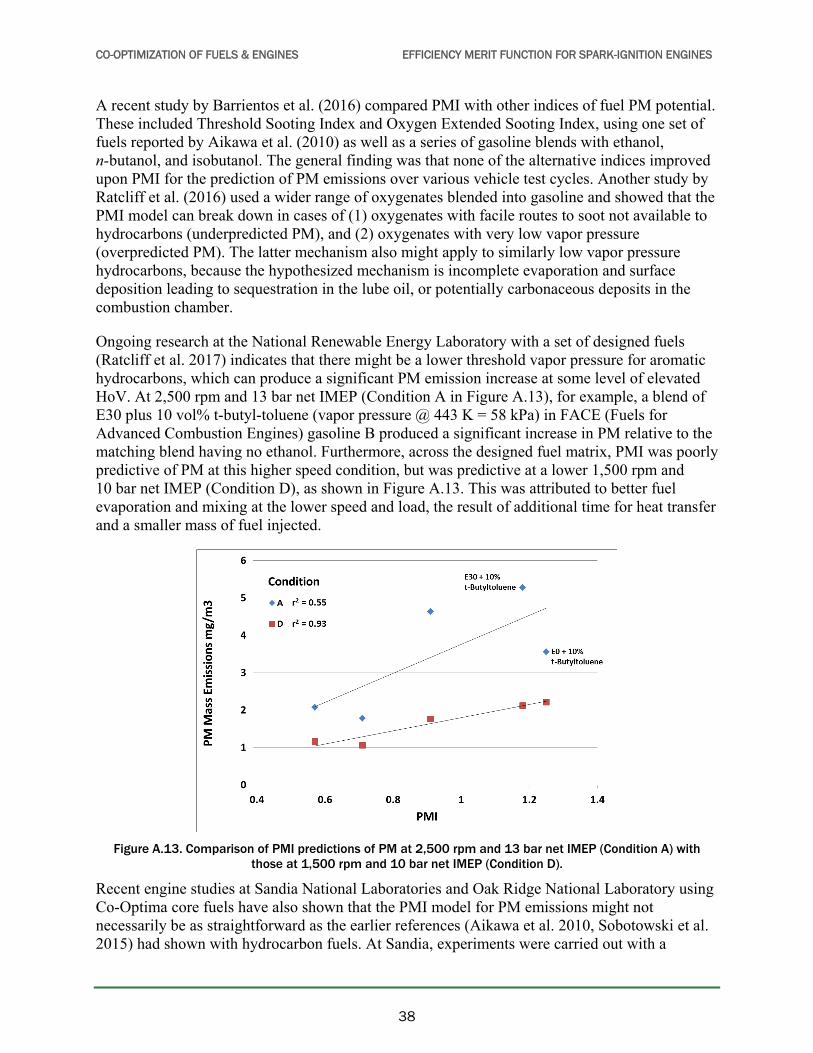
CO-OPTIMIZATION OF FUELS & ENGINES EFFICIENCY MERIT FUNCTION FOR SPARK-IGNITION ENGINES
38
A recent study by Barrientos et al. (2016) compared PMI with other indices of fuel PM potential. These included Threshold Sooting Index and Oxygen Extended Sooting Index, using one set of fuels reported by Aikawa et al. (2010) as well as a series of gasoline blends with ethanol, n-butanol, and isobutanol. The general finding was that none of the alternative indices improved upon PMI for the prediction of PM emissions over various vehicle test cycles. Another study by Ratcliff et al. (2016) used a wider range of oxygenates blended into gasoline and showed that the PMI model can break down in cases of (1) oxygenates with facile routes to soot not available to hydrocarbons (underpredicted PM), and (2) oxygenates with very low vapor pressure (overpredicted PM). The latter mechanism also might apply to similarly low vapor pressure hydrocarbons, because the hypothesized mechanism is incomplete evaporation and surface deposition leading to sequestration in the lube oil, or potentially carbonaceous deposits in the combustion chamber.
Ongoing research at the National Renewable Energy Laboratory with a set of designed fuels (Ratcliff et al. 2017) indicates that there might be a lower threshold vapor pressure for aromatic hydrocarbons, which can produce a significant PM emission increase at some level of elevated HoV. At 2,500 rpm and 13 bar net IMEP (Condition A in Figure A.13), for example, a blend of E30 plus 10 vol% t-butyl-toluene (vapor pressure @ 443 K = 58 kPa) in FACE (Fuels for Advanced Combustion Engines) gasoline B produced a significant increase in PM relative to the matching blend having no ethanol. Furthermore, across the designed fuel matrix, PMI was poorly predictive of PM at this higher speed condition, but was predictive at a lower 1,500 rpm and 10 bar net IMEP (Condition D), as shown in Figure A.13. This was attributed to better fuel evaporation and mixing at the lower speed and load, the result of additional time for heat transfer and a smaller mass of fuel injected.
Figure A.13. Comparison of PMI predictions of PM at 2,500 rpm and 13 bar net IMEP (Condition A) with
those at 1,500 rpm and 10 bar net IMEP (Condition D).
Recent engine studies at Sandia National Laboratories and Oak Ridge National Laboratory using Co-Optima core fuels have also shown that the PMI model for PM emissions might not necessarily be as straightforward as the earlier references (Aikawa et al. 2010, Sobotowski et al. 2015) had shown with hydrocarbon fuels. At Sandia, experiments were carried out with a
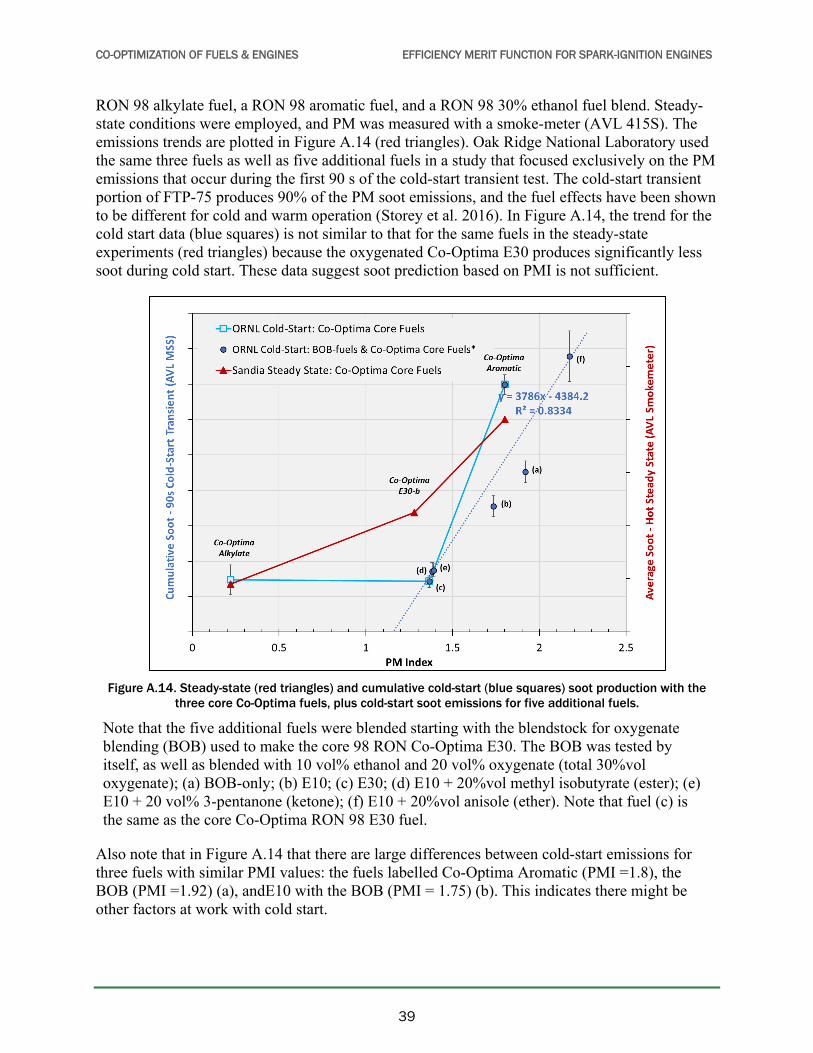
CO-OPTIMIZATION OF FUELS & ENGINES EFFICIENCY MERIT FUNCTION FOR SPARK-IGNITION ENGINES
39
RON 98 alkylate fuel, a RON 98 aromatic fuel, and a RON 98 30% ethanol fuel blend. Steady-state conditions were employed, and PM was measured with a smoke-meter (AVL 415S). The emissions trends are plotted in Figure A.14 (red triangles). Oak Ridge National Laboratory used the same three fuels as well as five additional fuels in a study that focused exclusively on the PM emissions that occur during the first 90 s of the cold-start transient test. The cold-start transient portion of FTP-75 produces 90% of the PM soot emissions, and the fuel effects have been shown to be different for cold and warm operation (Storey et al. 2016). In Figure A.14, the trend for the cold start data (blue squares) is not similar to that for the same fuels in the steady-state experiments (red triangles) because the oxygenated Co-Optima E30 produces significantly less soot during cold start. These data suggest soot prediction based on PMI is not sufficient.
Figure A.14. Steady-state (red triangles) and cumulative cold-start (blue squares) soot production with the
three core Co-Optima fuels, plus cold-start soot emissions for five additional fuels.
Note that the five additional fuels were blended starting with the blendstock for oxygenate blending (BOB) used to make the core 98 RON Co-Optima E30. The BOB was tested by itself, as well as blended with 10 vol% ethanol and 20 vol% oxygenate (total 30%vol oxygenate); (a) BOB-only; (b) E10; (c) E30; (d) E10 + 20%vol methyl isobutyrate (ester); (e) E10 + 20 vol% 3-pentanone (ketone); (f) E10 + 20%vol anisole (ether). Note that fuel (c) is the same as the core Co-Optima RON 98 E30 fuel.
Also note that in Figure A.14 that there are large differences between cold-start emissions for three fuels with similar PMI values: the fuels labelled Co-Optima Aromatic (PMI =1.8), the BOB (PMI =1.92) (a), andE10 with the BOB (PMI = 1.75) (b). This indicates there might be other factors at work with cold start.
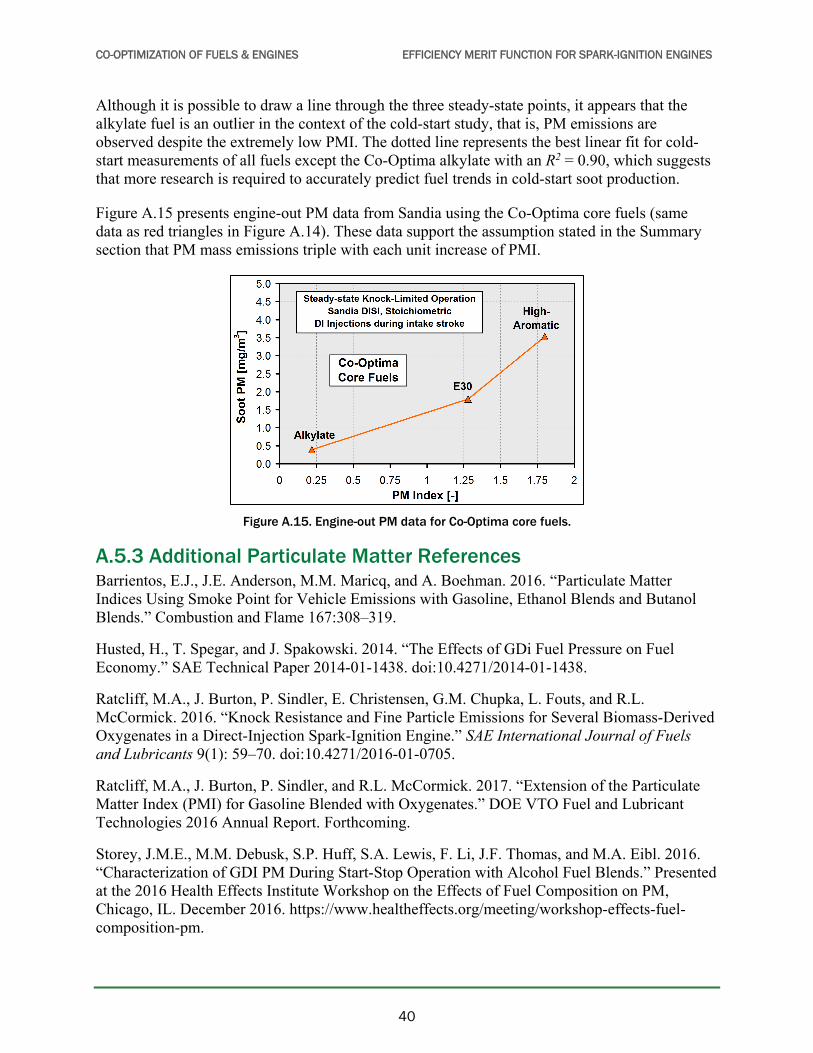
CO-OPTIMIZATION OF FUELS & ENGINES EFFICIENCY MERIT FUNCTION FOR SPARK-IGNITION ENGINES
40
Although it is possible to draw a line through the three steady-state points, it appears that the alkylate fuel is an outlier in the context of the cold-start study, that is, PM emissions are observed despite the extremely low PMI. The dotted line represents the best linear fit for cold-start measurements of all fuels except the Co-Optima alkylate with an R2 = 0.90, which suggests that more research is required to accurately predict fuel trends in cold-start soot production.
Figure A.15 presents engine-out PM data from Sandia using the Co-Optima core fuels (same data as red triangles in Figure A.14). These data support the assumption stated in the Summary section that PM mass emissions triple with each unit increase of PMI.
Figure A.15. Engine-out PM data for Co-Optima core fuels.
A.5.3 Additional Particulate Matter References Barrientos, E.J., J.E. Anderson, M.M. Maricq, and A. Boehman. 2016. “Particulate Matter Indices Using Smoke Point for Vehicle Emissions with Gasoline, Ethanol Blends and Butanol Blends.” Combustion and Flame 167:308–319.
Husted, H., T. Spegar, and J. Spakowski. 2014. “The Effects of GDi Fuel Pressure on Fuel Economy.” SAE Technical Paper 2014-01-1438. doi:10.4271/2014-01-1438.
Ratcliff, M.A., J. Burton, P. Sindler, E. Christensen, G.M. Chupka, L. Fouts, and R.L. McCormick. 2016. “Knock Resistance and Fine Particle Emissions for Several Biomass-Derived Oxygenates in a Direct-Injection Spark-Ignition Engine.” SAE International Journal of Fuels and Lubricants 9(1): 59–70. doi:10.4271/2016-01-0705.
Ratcliff, M.A., J. Burton, P. Sindler, and R.L. McCormick. 2017. “Extension of the Particulate Matter Index (PMI) for Gasoline Blended with Oxygenates.” DOE VTO Fuel and Lubricant Technologies 2016 Annual Report. Forthcoming.
Storey, J.M.E., M.M. Debusk, S.P. Huff, S.A. Lewis, F. Li, J.F. Thomas, and M.A. Eibl. 2016. “Characterization of GDI PM During Start-Stop Operation with Alcohol Fuel Blends.” Presented at the 2016 Health Effects Institute Workshop on the Effects of Fuel Composition on PM, Chicago, IL. December 2016. https://www.healtheffects.org/meeting/workshop-effects-fuel-composition-pm.

CO-OPTIMIZATION OF FUELS & ENGINES EFFICIENCY MERIT FUNCTION FOR SPARK-IGNITION ENGINES
https://energy.gov/eere/bioenergy/co-optimization-fuels-engines DOE/GO-102018-5041