Embed Size (px)
Citation preview

2020 Farm Management Competition Report
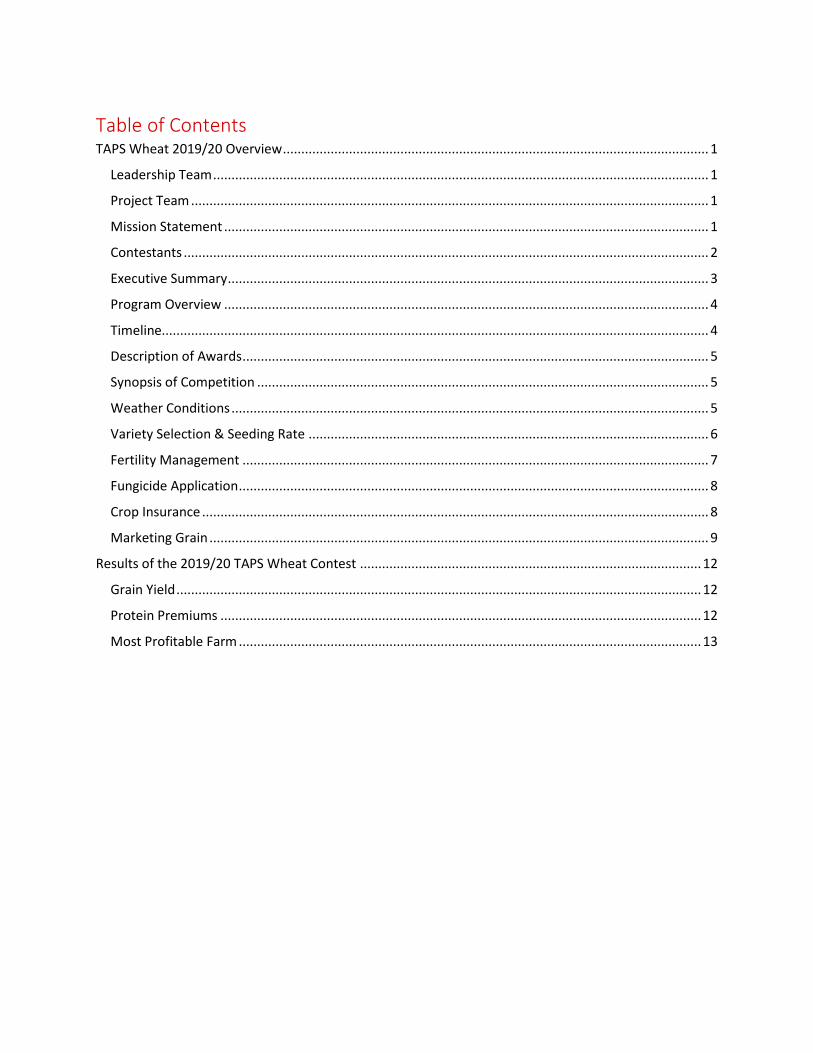
Table of Contents TAPS Wheat 2019/20 Overview .................................................................................................................... 1
Leadership Team ....................................................................................................................................... 1
Project Team ............................................................................................................................................. 1
Mission Statement .................................................................................................................................... 1
Contestants ............................................................................................................................................... 2
Executive Summary ................................................................................................................................... 3
Program Overview .................................................................................................................................... 4
Timeline..................................................................................................................................................... 4
Description of Awards ............................................................................................................................... 5
Synopsis of Competition ........................................................................................................................... 5
Weather Conditions .................................................................................................................................. 5
Variety Selection & Seeding Rate ............................................................................................................. 6
Fertility Management ............................................................................................................................... 7
Fungicide Application ................................................................................................................................ 8
Crop Insurance .......................................................................................................................................... 8
Marketing Grain ........................................................................................................................................ 9
Results of the 2019/20 TAPS Wheat Contest ............................................................................................. 12
Grain Yield ............................................................................................................................................... 12
Protein Premiums ................................................................................................................................... 12
Most Profitable Farm .............................................................................................................................. 13

1
TAPS Wheat 2019/20 Overview
Leadership Team Cody Creech Assistant Professor: Dryland Cropping Systems
Panhandle Research and Extension Center
Department of Agronomy and Horticulture
University of Nebraska-Lincoln
Email: [email protected]
Phone: (308) 632-1266
Jessica Groskopf Extension Educator
Panhandle Research and Extension Center
University of Nebraska-Lincoln
Email: [email protected]
Phone: 308-632-1247
Daran Rudnick Assistant Professor: Irrigation Management Specialist
West Central Research and Extension Center
Department of Biological Systems Engineering
University of Nebraska-Lincoln
Email: [email protected]
Phone: (308) 696-6709
Krystle Rhoades TAPS Program Manager
University of Nebraska -Lincoln
Email: [email protected]
Matt Stockton Associate Professor: Agricultural Economist
West Central Research and Extension Center
Department of Agricultural Economics
University of Nebraska-Lincoln
Email: [email protected]
Phone: (308) 696-6713
Chuck Burr Extension Educator
West Central Research and Extension Center
University of Nebraska-Lincoln
Email: [email protected]
Phone: (308) 696-6783
Robert Tigner Extension Educator
West Central Research and Extension Center
University of Nebraska-Lincoln
Email: [email protected]
Phone: (308) 696-6734
Project Team Amanda Easterly Stephen Geu Research Assistant Professor Dryland Crops Research Technician
Louise Lorent Brittany Fulton Communications Associate Extension Assistant
Mission Statement To fully engage agriculturalists, scientists, educators, students, and industry in an innovative endeavor,
to TAP into the University of Nebraska’s potential to facilitate and create an environment for all
stakeholders to work together in finding solutions through innovation, entrepreneurialism, technological
adoption, new managerial applications, improved techniques and cutting edge methodologies for farms,
farm businesses, and farm families to maintain profitability, sustainability, and productivity.
2
Contestants
Thank you Nebraska Wheat Board for your support of this competition!

3
Executive Summary The TAPS wheat contest was created out of the need to incorporate and engage agricultural research,
agricultural technology, industry, and producers in an interactive real-world way to increase
productivity, sustainability, and profitability. TAPS is an acronym that stands for Testing Ag Performance
Solutions. With the many challenges related and faced by agricultural production there is a need for a
deeper level of engagement among all the stakeholders. Not surprisingly, many entities have
contributed in many different ways, to the program’s development. The University of Nebraska-Lincoln
Research and Extension personnel and facilities act as the common ground and hosts the program. This
structure provides the needed oversite and neutrality needed to maintain a healthy objective
environment for producers, researchers, and industry suppliers to innovate, test, adopt, learn about and
develop new technologies, try new management practices and techniques and make the needed
adjustments in the efficient and profitable production of hard red winter wheat.
This is the TAPS wheat contest inaugural year and was a year of learning, growing, and overcoming
obstacles. The TAPS program is based on a competitive model where participants (individuals and/or
groups) compete in the production and marketing of wheat. Each team or farm competes for three
possible awards, the most prestigious being the most profitable farm, followed by an efficiency for
nitrogen use award, and finally an award for productivity (highest yield). Competitors make many input
and management choices which include, crop insurance selection, planting choices of both population
and variety, all marketing decisions, fertilizer timing, amount, and type, and fungicides. Unlike a typical
yield contest the close proximity of competing team’s farms allow for comparisons of management
decisions among teams competing on the same soil and conditions. Opportunities for stakeholders to
meet and discuss outcomes, challenges, and to share their experiences are a large part of the contest.
Due to COVID-19 restrictions, this valuable interaction and learning opportunity was not available. We
look forward to a new year where communication, learning, and innovation are enhanced by continuous
communication and direct yearlong interaction of all those involved in the program as well as the
publication and sharing of the project results and take-home lessons which are shared year-round.
This program’s design has many benefits including; 1) University researchers and extension
professionals are in direct competition with farmers under real world conditions, 2) Farmers are able to
explore new production and marketing methods and serve as role models and teachers, and 3) The
industry people become observers of technology application and its many interactions leading to further
development of technology making all three groups an active part of the innovative and problem solving
team.
We thank all those who have actively participated and given of their time and efforts. We look forward
to what the second year of the contest will bring and anticipate the discovery of many new friends,
innovations, and solutions that come from such an effort.
Sincerely,
TAPS Leadership Team
4
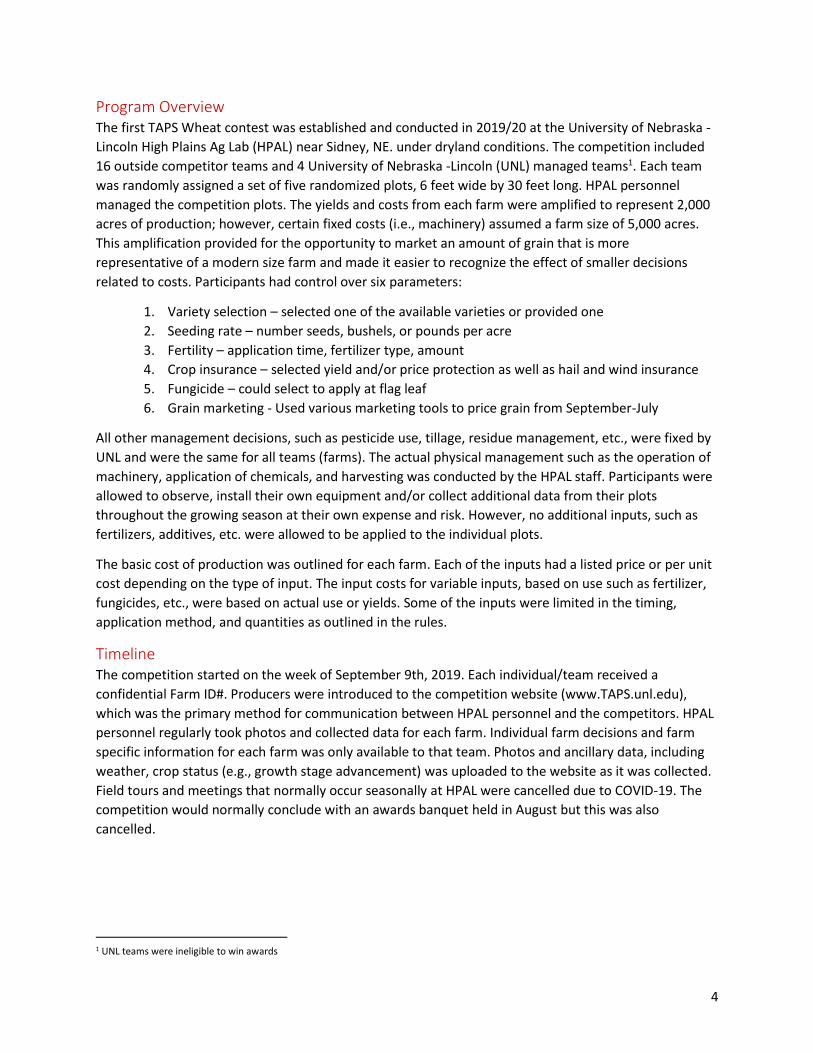
Program Overview The first TAPS Wheat contest was established and conducted in 2019/20 at the University of Nebraska -
Lincoln High Plains Ag Lab (HPAL) near Sidney, NE. under dryland conditions. The competition included
16 outside competitor teams and 4 University of Nebraska -Lincoln (UNL) managed teams1. Each team
was randomly assigned a set of five randomized plots, 6 feet wide by 30 feet long. HPAL personnel
managed the competition plots. The yields and costs from each farm were amplified to represent 2,000
acres of production; however, certain fixed costs (i.e., machinery) assumed a farm size of 5,000 acres.
This amplification provided for the opportunity to market an amount of grain that is more
representative of a modern size farm and made it easier to recognize the effect of smaller decisions
related to costs. Participants had control over six parameters:
1. Variety selection – selected one of the available varieties or provided one
2. Seeding rate – number seeds, bushels, or pounds per acre
3. Fertility – application time, fertilizer type, amount
4. Crop insurance – selected yield and/or price protection as well as hail and wind insurance
5. Fungicide – could select to apply at flag leaf
6. Grain marketing - Used various marketing tools to price grain from September-July
All other management decisions, such as pesticide use, tillage, residue management, etc., were fixed by
UNL and were the same for all teams (farms). The actual physical management such as the operation of
machinery, application of chemicals, and harvesting was conducted by the HPAL staff. Participants were
allowed to observe, install their own equipment and/or collect additional data from their plots
throughout the growing season at their own expense and risk. However, no additional inputs, such as
fertilizers, additives, etc. were allowed to be applied to the individual plots.
The basic cost of production was outlined for each farm. Each of the inputs had a listed price or per unit
cost depending on the type of input. The input costs for variable inputs, based on use such as fertilizer,
fungicides, etc., were based on actual use or yields. Some of the inputs were limited in the timing,
application method, and quantities as outlined in the rules.
Timeline The competition started on the week of September 9th, 2019. Each individual/team received a
confidential Farm ID#. Producers were introduced to the competition website (www.TAPS.unl.edu),
which was the primary method for communication between HPAL personnel and the competitors. HPAL
personnel regularly took photos and collected data for each farm. Individual farm decisions and farm
specific information for each farm was only available to that team. Photos and ancillary data, including
weather, crop status (e.g., growth stage advancement) was uploaded to the website as it was collected.
Field tours and meetings that normally occur seasonally at HPAL were cancelled due to COVID-19. The
competition would normally conclude with an awards banquet held in August but this was also
cancelled.
1 UNL teams were ineligible to win awards

5
Description of Awards The competition had three awards, 1) Most Profitable Farm, 2) Highest Input Use Efficiency, and 3)
Greatest Grain Yield. Cash awards of $2,000, $1,000, and $500 (minus penalty) were granted for each
competition winner. All awards were accompanied with an honorary plaque. Description of each award
is presented below.
1. Most Economically Profitable ($2,000) – included average yield from each team’s five plots minus any
hail damage assessed and amplified to 2,000 acres, marketing decisions, and costs of production
(variable and fixed) based on the UNL budget costs and the teams prescribed management choices.
2. Highest Input Use Efficiency ($1,000)
𝐸𝑓𝑓𝑖𝑐𝑖𝑒𝑛𝑐𝑦 𝐼𝑛𝑑𝑒𝑥 =𝐺𝑟𝑎𝑖𝑛 𝑦𝑖𝑒𝑙𝑑 × 𝑃𝑟𝑜𝑡𝑒𝑖𝑛 𝑁𝑖𝑡𝑟𝑜𝑔𝑒𝑛 𝐶𝑜𝑛𝑡𝑒𝑛𝑡)
[𝐴𝑏𝑜𝑣𝑒𝑔𝑟𝑜𝑢𝑛𝑑 𝑁𝑖𝑡𝑟𝑜𝑔𝑒𝑛 𝑈𝑝𝑡𝑎𝑘𝑒 𝑜𝑓 𝑈𝑛𝑓𝑒𝑟𝑡𝑖𝑙𝑖𝑧𝑒𝑑 𝑇𝑟𝑒𝑎𝑡𝑚𝑒𝑛𝑡
+ 𝐹𝑒𝑟𝑡𝑖𝑙𝑖𝑧𝑒𝑟 𝑁𝑖𝑡𝑟𝑜𝑔𝑒𝑛]
3. Greatest Grain Yield ($500 × % of Possible Profit) - Adjusted by the winner’s percent of total possible
profit. Total possible profit is the range of difference between the most and least profitable farms.
Synopsis of Competition The inaugural year of the wheat contest provided many challenges and opportunities for growth.
Getting the teams organized and preparing seed on a short timeframe delayed planting. This resulted in
minimal growth and tillering going into the winter. Further compounding issues was mechanical issues
with the drill that resulted in shallow seeding of the wheat. The slow developing wheat with root crowns
near the soil surface were exposed to extreme freeze events in the early spring that caused significant
injury to the plants and reduced stands. Combined with drought conditions, yields were reduced
significantly.
COVID-19 limitations reduced our ability to collect data during the growing season and host in-person
events. These events are the highlight of the contest and we look forward to being able to interact again
and have face-to-face events in 2021.
Weather Conditions Normal precipitation was available at the beginning of the contest. Following above average rainfall in
March, dry conditions persisted through the remainder of the contest (Figure 1). Adequate early-season
precipitation was not sufficient to overcome the dryness and hot temperatures that occurred during
flowering and grain fill.
The area suffered from a couple of extreme freeze events after the wheat had broken dormancy. As the
wheat was greening up and starting to tiller, these freeze events turned all exposed vegetation brown
and reduced stands. The result of this setback was fewer tillers and a later maturing wheat crop.
Ultimately, the combination of delayed maturity and heat during the critical grain fill stage reduced
yields considerably.

6
Figure 1. Precipitation patterns at HPAL in 2019 and 2020 vs. 73-year averages.
Variety Selection & Seeding Rate Participants were responsible for selecting their own variety. Participants had the option of selecting a
variety offered by UNL personnel or they could supply their own seed. HPAL does not have the ability to
treat seed, but contestants were allowed to use treated seed. If treated seed was used, the cost was
accounted for in the total profitability.
Participants selected a seeding rate using any method they preferred (pounds per acre, seeds per acre,
seeds per foot of row, or bushels per acre). Plots were seeded using a no-till drill with a 12-inch row
spacing.
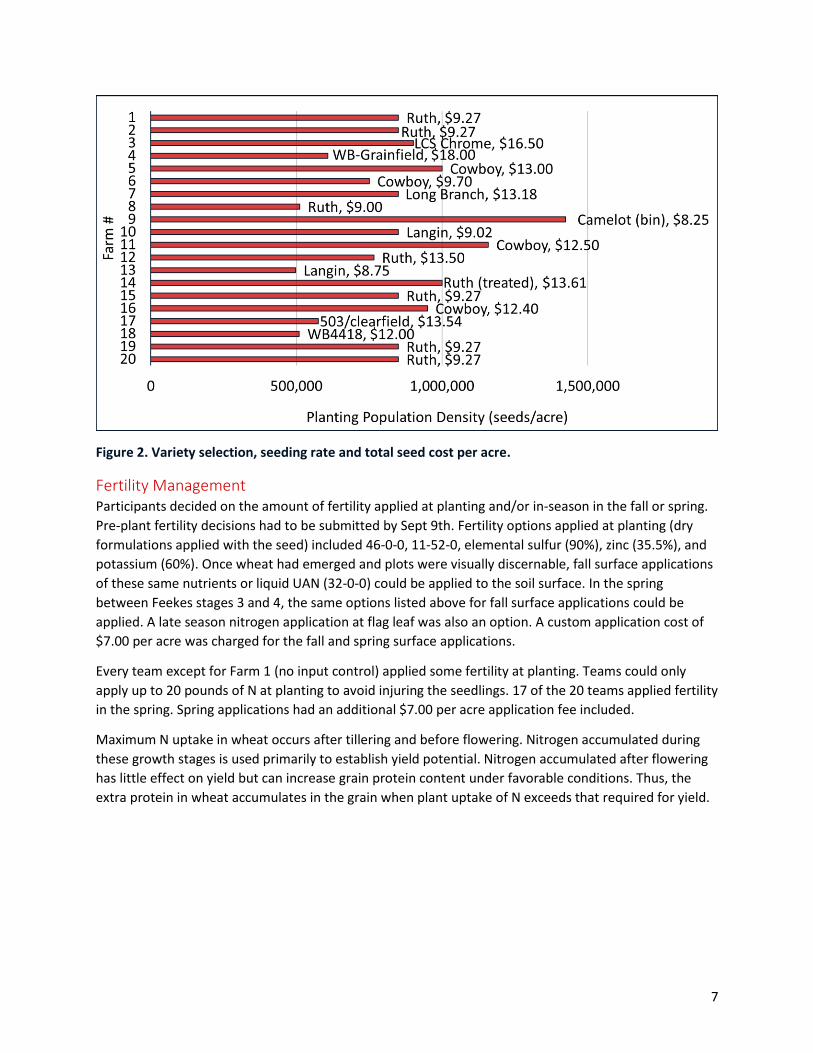
Cowboy and Ruth, two varieties developed by public universities, were the most selected varieties for
the contest (by 4 and 8 contestants, respectively). Only one contestant chose an herbicide resistant
variety (AP503 Clearfield). Seeding rate ranged between 608,147 seeds per acre to 1,424,700 seeds per
acre and averaged 830,134 seeds per acre. Median seeding rate was 850,000 seeds per acre. Only one
contestant chose to use treated seed (Farm #14, variety Ruth). Total seed cost per acre ranged from
$8.25/acre (Camelot at 1,474,700 seeds/acre) to $18.00/acre (WB-Grainfield at 608,147 seeds/acre) and
averaged $11/acre.
0.000.501.001.502.002.503.003.504.004.50
Pre
cip
itat
ion
(in
)
Aug2019
Sep2019
Oct2019
Nov2019
Dec2019
Jan2020
Feb2020
Mar2020
Apr2020
May2020
Jun2020
Jul2020
MonthlyPrecipitat
ion4.00 1.65 0.29 0.76 0.33 0.18 0.57 2.34 0.57 2.11 1.62 1.25
73 YearAverage
Precipitation
1.94 1.40 0.90 0.46 0.32 0.29 0.36 0.91 1.63 2.98 3.13 2.56
Monthly Precipitation 73 Year Average Precipitation
7
Figure 2. Variety selection, seeding rate and total seed cost per acre.
Fertility Management Participants decided on the amount of fertility applied at planting and/or in-season in the fall or spring.
Pre-plant fertility decisions had to be submitted by Sept 9th. Fertility options applied at planting (dry
formulations applied with the seed) included 46-0-0, 11-52-0, elemental sulfur (90%), zinc (35.5%), and
potassium (60%). Once wheat had emerged and plots were visually discernable, fall surface applications
of these same nutrients or liquid UAN (32-0-0) could be applied to the soil surface. In the spring
between Feekes stages 3 and 4, the same options listed above for fall surface applications could be
applied. A late season nitrogen application at flag leaf was also an option. A custom application cost of
$7.00 per acre was charged for the fall and spring surface applications.
Every team except for Farm 1 (no input control) applied some fertility at planting. Teams could only
apply up to 20 pounds of N at planting to avoid injuring the seedlings. 17 of the 20 teams applied fertility
in the spring. Spring applications had an additional $7.00 per acre application fee included.
Maximum N uptake in wheat occurs after tillering and before flowering. Nitrogen accumulated during
these growth stages is used primarily to establish yield potential. Nitrogen accumulated after flowering
has little effect on yield but can increase grain protein content under favorable conditions. Thus, the
extra protein in wheat accumulates in the grain when plant uptake of N exceeds that required for yield.

8
Figure 3. Spring and fall fertility cost including application fee, labels indicate total cost per acre.
Fungicide Application Participants had the option to select a fungicide application in the fall, early spring, and/or when the flag
leaf was visible. Participants were made aware of available fungicides for each application timing. A
custom application cost of $7.00 per acre was charged for the fall and spring surface applications.
Due to the dry conditions, low yield expectations, and low disease pressure, no contestants chose to
apply a fungicide this year.
Crop Insurance Participants had the opportunity to select from three types of crop insurance policies, a range of
coverage levels, the unit type (i.e., size of the insured parcel: optional or enterprise) and an additional
coverage option. Participants could also choose to purchase hail and wind insurance. Available types of
policies were: Revenue Protection, Revenue Protection with Harvest Price Exclusion or Yield Protection.
Available coverage levels were: 60, 65, 70, 75, or 80%. Participants could also select the “Added Price
Option” (APO). Premiums were set on September 16th and were sent out to teams. These rates were
from the HPAL farm, with an estimated Actual Production History (APH) of 43 bushels per acre. APO
rates were also available upon request. Insurance choices were finalized by September 30.
Seven teams purchased crop insurance. All seven chose a Revenue Protection policy at the 70% or 75%
coverage level. Three teams selected enterprise units, the remaining four selected optional units. Two
farms purchased APO Coverage. No farms purchased hail and wind insurance.
Revenue Protection policies use futures markets to determine the price portion of the revenue
calculation. Price information is collected twice, first being the “projected price” before planting, the
second price being the “harvest price”. These prices are used to calculate the “revenue guarantee” and
the “revenue to count” which are both important components in determining whether an indemnity will
be paid to the producer. The revenue guarantee is calculated by taking the APH, multiplied by the
9
producer’s selected coverage level and then by the projected price. Under a Revenue Protection policy,
if the harvest price is higher than the projected price, the revenue guarantee is recalculated using the
harvest price. Revenue to count is calculated by multiplying the harvest price by the actual yield of the
farm. Crop insurance indemnity payments are made if the revenue to count falls below the revenue
guarantee.
Revenue Guarantee = APH X Coverage Level X MAX (Projected Price OR Harvest Price)
Revenue to Count = Harvest Price X Actual Yield
Crop Insurance Indemnity Payment = Revenue Guarantee – Revenue to Count
Winter wheat prices for Revenue Protection policies are based on the Kansas City September Hard Red
Winter Wheat futures contract (KEU20 for 2020). The projected price is the average of the contract from
8/15/2019 to 9/14/2019. The harvest price is the average of the futures contract from7/1/2020 to
7/31/2020. For 2020, the projected price was $4.48 per bushel and the harvest price is $4.45 per bushel.
With an APH of 43 bushels per acre, the Revenue Guarantee for the 75% coverage level was $144.48 per
acre, and the 70% coverage level was $134.85 per acre.
An additional selection farms had to make was to purchase enterprise units or optional units. Optional
units allow the policy holder to break land into smaller pieces, based on different production practices
or USDA FSA Farm Serial Number (FSN). Enterprise units allow the farm to insure all of a crop in a county
under a single policy. Enterprise Unit premiums will cost less as the insured parcel is a summation of
fields, resulting in less variability than insuring fields individually. Enterprise units will therefore have a
lower probability of triggering a crop insurance indemnity payment. The decision between optional units
and enterprise units outside of the competition, largely depends on the size of the farm, and how
spread out the fields are and the individual’s perception of whether a hail event will occur.
Farms could also purchase an APO policy, which is a supplemental insurance product that covers a
bushel shortfall at harvest. For this contest, participants could buy an additional $0.52 per bushel of
yield protection.
Premiums for farms who purchased insurance policies ranged from $2.00 per acre to $9.00 per acre,
depending on the coverage selection. Purchasing crop insurance proved to be a wise choice this year, as
farms experienced poor yields. Insurance indemnity payments ranged from $19.29 to $66.32 per acre.
Marketing Grain All marketing choices had to be made between September 10, 2019 and July 31, 2020. The simulated
production is the actual plot yields adjusted to an acre basis multiplied by 2,000. The simulated total was
adjusted for any losses observed during the growing season. The APH for the simulated farms for
planning and marketing purposes was 43 bushels per acre, making the total expected yield of 86,000
bushels of grain for each simulated farm. Final farm productivity was calculated based on the average of
the five plots managed according to each teams’ specifications. Total quantity marketed was limited to a
good faith estimate of total production. Any speculative (i.e. futures or options contracts exceeding the
anticipated yield) profits were subtracted from total profits to estimate the farm’s simulated profit, so
that all farms could be judged on an equal basis.

10
Any contracts or sales had to be reported at the time of initiation, including delivery, price, time, date,
and place and any other conditions related to the event needed to verify and validate the price and
quantity sold. (Transactions were dated and time stamped within 24 hours of being submitted on the
website. Once submitted, transactions were final and non-negotiable.)
Sale types were limited to the methods listed below.
- Spot (Cash) Sales: This is the cash sale at harvest or before the final date of July 31, 2020.
- Forward Contract: Contract cash price for July delivery at any location that offers new crop
prices and any number of bushels. If the contestant forward contracted more bushels than
produced (due to hail, wind, etc.) a $0.10 per bushel buy-back fee for the oversold bushels was
assessed.
- Basis Contract with Delivery at Harvest: Used to set basis for number of bushels at a given
location for July delivery. Price per bushel (futures price for July) is set at a different time. In this
case, once a basic contract is made, any July futures price between when basis contract is made
and July 31, 2020, last day to trade July wheat futures settlement price will become the default
price if no other is chosen.
- Simple Hedge to Arrive (no roll over etc.): Allows the seller to lock in the futures market portion
of a cash grain contract. This is usually done with the local elevator. Any number of bushels may
be contracted and are tied to a specific delivery point at the time of harvest. Any Basis not
determined before harvest will be charged at the harvest basis on July 31, 2020.
- Special Contracts-Allows the seller to price bushels using local elevator special contracts, i.e.
Seasonal Average ($.05/bu fee), ProHedge ($.10/bu fee).
Futures and presales were legitimate alternatives and had the same stipulations of being reported as
cash sales. All transactions had to be completed and specified at the time of harvest. Any unsold grain
was “sold” for the cash price posted by Scoular Grain in Sidney on August 1, 2020. All forward contracts
and future contracts had to be completed or terminated by July 31, 2020.
Market Conditions
On average, 50 percent of U.S. wheat production is exported. This dependence on a global consumer,
combined with several global competitors makes the U.S. wheat market very responsive to changes in
global production and consumption. The variability created by changing global supply and demand
conditions, leaves the July Kansas City Hard Red Winter Wheat Contract without a reliable historical
seasonal price pattern. Unlike corn and soybeans, Hard Red Winter Wheat does not have a timeframe
that consistently produces a market rally. This fact has both positive and negative connotations. Without
historically seasonally consistent price movement, producers are left to look for pricing opportunities
year-round. While at the same time this lack of seasonality removes some of the market predictability
making it harder to gauge what a “good” price might be. Therefore, wheat producers must be more
attuned with the market throughout the year to take advantage of any opportunity to price their wheat.
At the start of this competition, global news largely drove wheat prices on a strong upward trend. From
September 2019 through March 2020 as USDA World Agriculture Supply and Demand Estimate (WASDE)
reports estimated global ending stocks for wheat below 290 million metric tons (MMT). The worldwide
COVID-19 pandemic had both positive and negative effects on the winter wheat market. As the futures
price of crude oil dropped, so did wheat and other cereal grains in February and early March. The
market bounced back from these declines in the middle of March until the middle of May as the
11
demand for grain in storage surged. The market then tipped downward into harvest, as the May WASDE
estimated global ending stocks above 300 MMT.
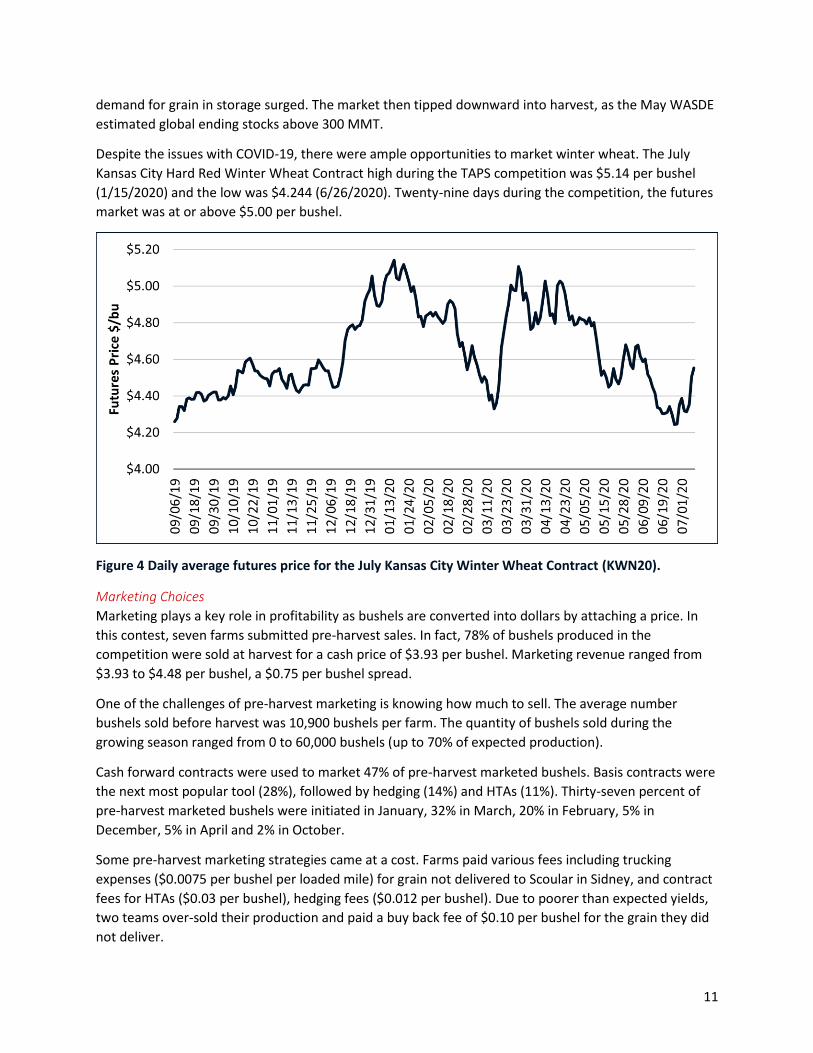
Despite the issues with COVID-19, there were ample opportunities to market winter wheat. The July
Kansas City Hard Red Winter Wheat Contract high during the TAPS competition was $5.14 per bushel
(1/15/2020) and the low was $4.244 (6/26/2020). Twenty-nine days during the competition, the futures
market was at or above $5.00 per bushel.
Figure 4 Daily average futures price for the July Kansas City Winter Wheat Contract (KWN20).
Marketing Choices
Marketing plays a key role in profitability as bushels are converted into dollars by attaching a price. In
this contest, seven farms submitted pre-harvest sales. In fact, 78% of bushels produced in the
competition were sold at harvest for a cash price of $3.93 per bushel. Marketing revenue ranged from
$3.93 to $4.48 per bushel, a $0.75 per bushel spread.
One of the challenges of pre-harvest marketing is knowing how much to sell. The average number
bushels sold before harvest was 10,900 bushels per farm. The quantity of bushels sold during the
growing season ranged from 0 to 60,000 bushels (up to 70% of expected production).
Cash forward contracts were used to market 47% of pre-harvest marketed bushels. Basis contracts were
the next most popular tool (28%), followed by hedging (14%) and HTAs (11%). Thirty-seven percent of
pre-harvest marketed bushels were initiated in January, 32% in March, 20% in February, 5% in
December, 5% in April and 2% in October.
Some pre-harvest marketing strategies came at a cost. Farms paid various fees including trucking
expenses ($0.0075 per bushel per loaded mile) for grain not delivered to Scoular in Sidney, and contract
fees for HTAs ($0.03 per bushel), hedging fees ($0.012 per bushel). Due to poorer than expected yields,
two teams over-sold their production and paid a buy back fee of $0.10 per bushel for the grain they did
not deliver.

12
Results of the 2019/20 TAPS Wheat Contest
Grain Yield Harvest occurred when the majority of varieties neared 12% moisture content. Any wheat over 13.5%
was docked using a standard dockage scale. Individual wheat farm grain yields ranged from 15.3 (Farm
17) to 29.2 bu/acre (Farm 5) with an average of 21.3 bu/acre. Grain yield was most highly correlated
with variety selection followed by seeding rate. Varieties well adapted to the region and the growing
conditions experienced did well. Popular varieties such as Ruth and Cowboy performed well. Teams that
also selected higher seeding rates benefited because late planting and spring freezes reduced tillering.
Thus, higher seeding rates were better able to mitigate some of those negative effects. Overall, yields
were much lower than expected due to growing conditions. Moving forward, carefully consider varieties
that are better adapted to handle drought conditions since we are likely to stay in a dry pattern for a
while.
Figure 5. Actual grain yield (bu/acre)
Protein Premiums One of the unique aspects of Hard Red Winter Wheat production, is the potential for additional revenue
through protein premiums. Over the past seven years, the average protein percentage of the U.S. Hard
Red Winter Wheat crop has been on a downward trend according to the U.S. Wheat Associates Annual
Crop Quality Reports. Higher protein Hard Red Winter Wheat is desired for milling. Thus, there is a
demand for high protein Hard Red Winter Wheat despite rising global ending stocks for the commodity.
This has prompted many grain buyers to implement premiums and discounts for Hard Red Winter
Wheat based on grain protein levels. This year, the elevator paid $0.03 per bushel, per 0.20% of protein
above 11% with a max premium of $0.30 per bushel. Bushels had to meet the minimum test weight of
58 pounds per bushel in order to qualify for the premium.

13
Due to adequate fertility programs and low yields, protein content was high this year for all teams.
However, only one team (Farm 5) qualified for the protein premium, meeting the test weight
requirement. This resulted in an additional $0.30 per bushel for this team.
Figure 6. Grain protein content corrected to 14% moisture.
Most Profitable Farm Farm profitability is a balance of controlling costs, productivity, and marketing. With these three factors,
there exists many different combinations of achieving profitability. For this contest, productivity was the
limiting factor with yields to be approximately half the farms expected APH. Due to low commodity
prices, controlling costs while maximizing yield was of the upmost importance when determining the
most profitable farm. The top three in the most profitable farms, were the three lowest cost per bushel
producers.
The most profitable team, Farm 5, had the lowest cost per actual bushel produced at $10.65 per bushel,
but was the 5th highest cost per acre. Team 5 invested in a successful fertility program that resulted in
the highest yield of the contest. Although they did not pre-harvest market any bushels, their protein
content, and 58.5 pound test weight awarded them with a premium of $0.30 per bushel.
Farm 16 boasted the 4th highest cost per acre, but like Farm 5, their investment paid off resulting in the
2nd highest yield. Although they did not receive a protein premium, they were more aggressive in
marketing. They had marketed 20,000 bushels, or 38% of their actual production before harvest
resulting in an average price $4.10 per bushel. They also purchased an optional unit revenue protection
policy at the 70% coverage level, which provided an additional $0.98 per bushel.

14
Farm 1 was a UNL managed farm, used to illustrate zero fertility applications. 2 It ranked third in the
profitability standings, as it was the lowest cost per acre at $244.23 and the eighth highest yield at 22.2
bushels per acre. This farm did not do any marketing or purchase an insurance policy.
Farm 12 was the 4th highest yielding farm with the 7th lowest cost of production. This farm did not pre-
harvest market any grain but did purchase an optional unit revenue protection policy at the 70%
coverage level without APO. This insurance policy selection provided an additional $1.08 per bushel.
Farm 14 had the third highest yield, but this yield came at an expense. This team ranked 17th in cost per
bushel produced. This farm did not purchase any crop insurance or pre-harvest market any grain.
All farms in the contest had a loss per bushel ranging from -$6.42 to -$14.46 per bushel. Figure 7 shows
the profitability ranking of each farm.
Figure 7 Net farm income per bushel
2 UNL teams were ineligible to win awards.

15
2019/20 TAPS Wheat Award Winners3
Most Profitable
• Farm #5, Kansas State University
• Farm #16, Nebraska College of Technical Agriculture (NCTA)
• Farm #12 Brent Shaw Highest Yield
• Farm #5, Kansas State University
• Farm #16, Nebraska College of Technical Agriculture (NCTA)
• Farm #14, Tyson Narjes
3 Due to a research error, we were unable to calculate the highest input use efficient team. Contestants 1, 2, 15, 19, 20 were managed by the University of Nebraska – Lincoln and are ineligible for awards.
Follow UsUNL TAPS
@UNL_TAPS
taps.unl.eduSubscribe to our digital newsletter at
taps.unl.edu/subscribe