Embed Size (px)
Citation preview
Co-Existence of S-Band Radar and 4G Mobile Networks
Dr. Steffen Heuel
Technology Manager Aerospace & Defense
Test & Measurement Division
Rohde & Schwarz Munich, Germany
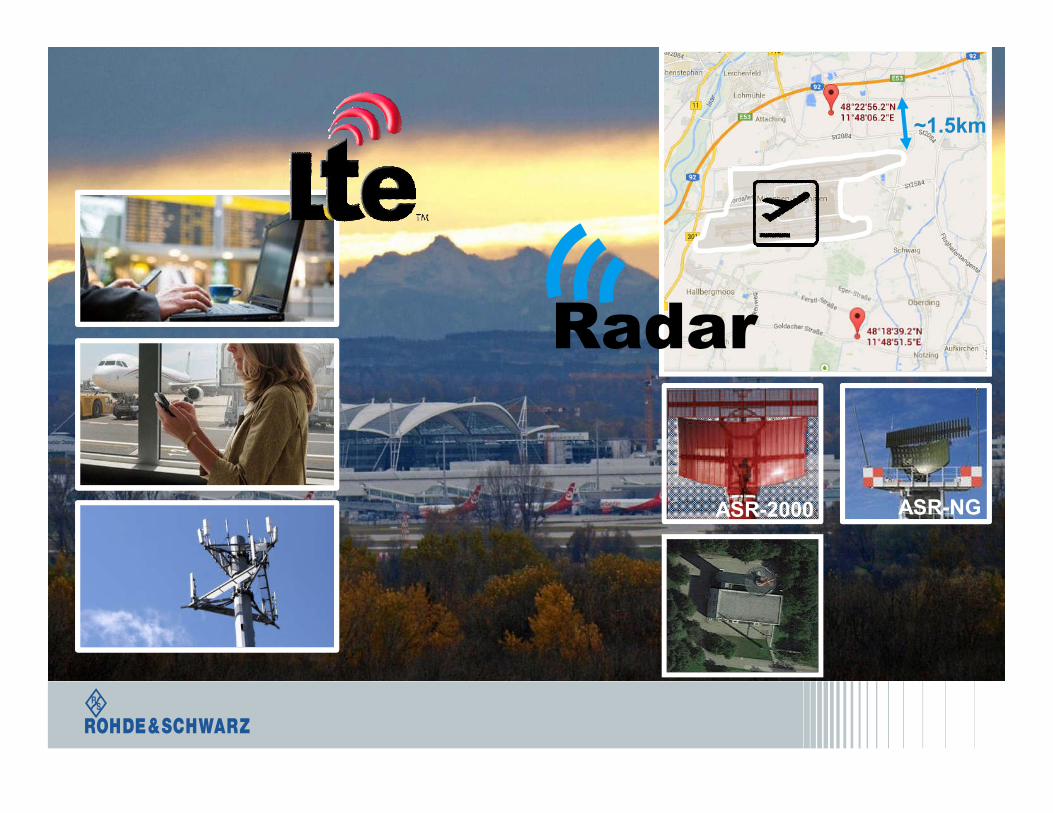
ASR-NG
Radar
ASR-2000
~1.5km
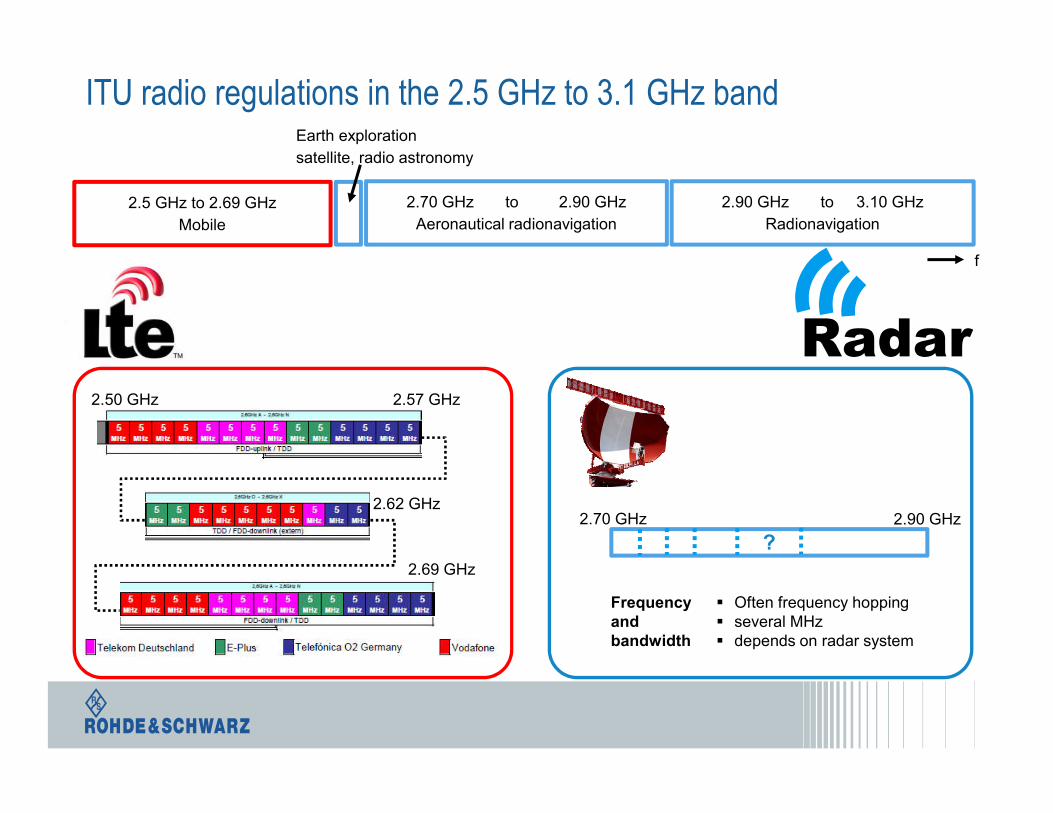
ITU radio regulations in the 2.5 GHz to 3.1 GHz band
2.70 GHz to 2.90 GHz
Aeronautical radionavigation
f
2.5 GHz to 2.69 GHz
Mobile
Earth exploration
satellite, radio astronomy
2.90 GHz to 3.10 GHz
Radionavigation
Frequency and bandwidth
Often frequency hopping several MHz depends on radar system
2.70 GHz 2.90 GHz
2.50 GHz
2.69 GHz
2.62 GHz
2.57 GHz
Radar
?
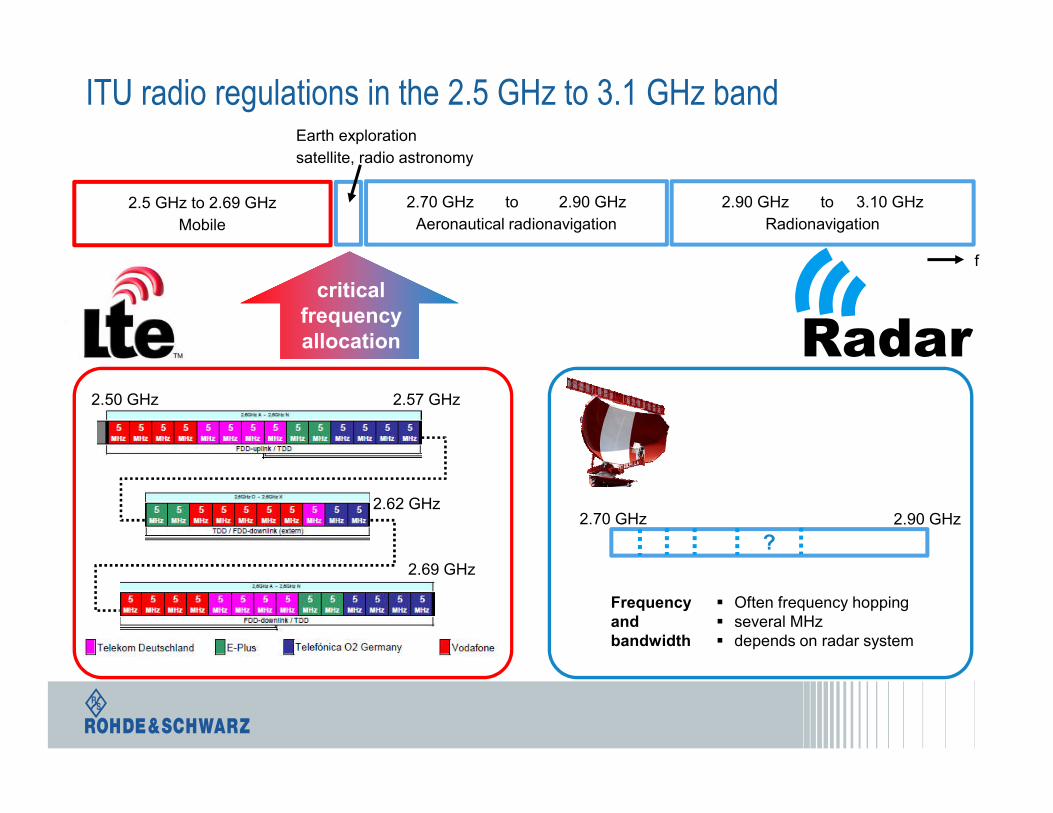
ITU radio regulations in the 2.5 GHz to 3.1 GHz band
2.70 GHz to 2.90 GHz
Aeronautical radionavigation
f
2.5 GHz to 2.69 GHz
Mobile
Earth exploration
satellite, radio astronomy
2.90 GHz to 3.10 GHz
Radionavigation
Frequency and bandwidth
Often frequency hopping several MHz depends on radar system
2.50 GHz
2.69 GHz
2.62 GHz
2.57 GHz
2.70 GHz 2.90 GHz
Radar
?
critical frequency allocation

LTE Networks and Radar Systems
Russia
Japan
Taiwan
Hong KongIndia
New Zealand
Sri Lanka
Saudi Arabia
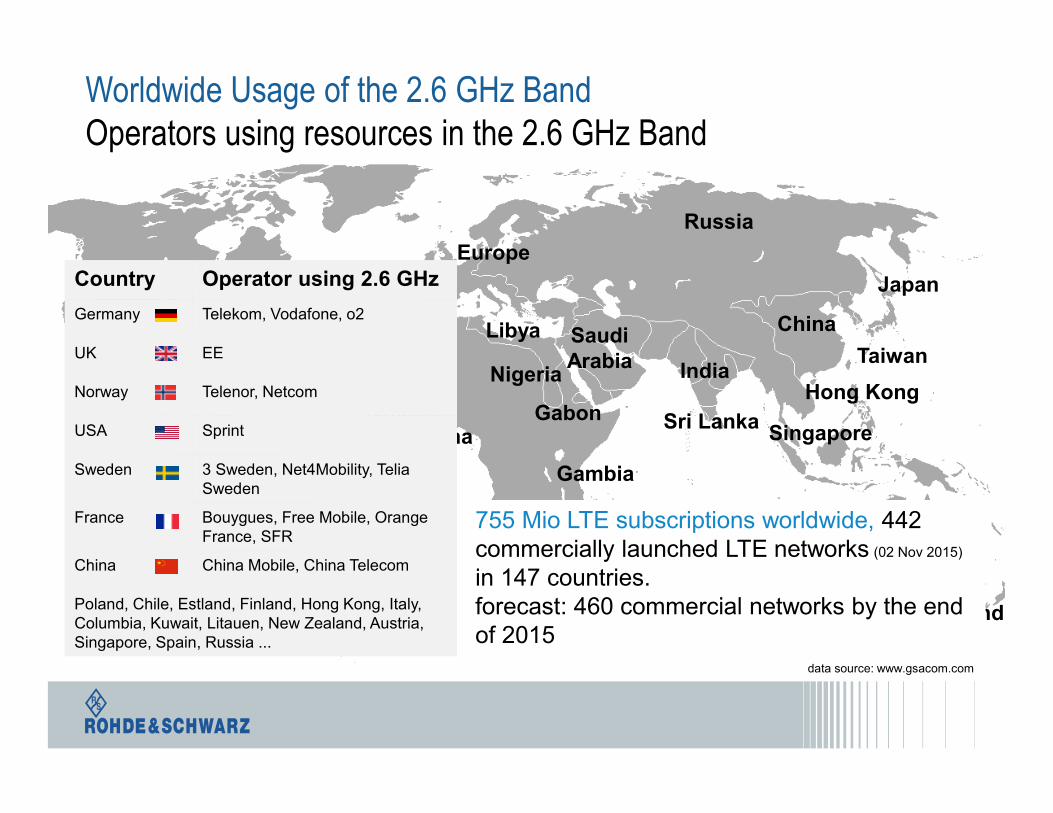
Worldwide Usage of the 2.6 GHz BandOperators using resources in the 2.6 GHz Band
South Africa
Gambia
Gabon
Nigeria
Libya
Europe
America
Brazil
GuineaGhana
China
Singapore
data source: www.gsacom.com
Country Operator using 2.6 GHz
Germany Telekom, Vodafone, o2
UK EE
Norway Telenor, Netcom
USA Sprint
Sweden 3 Sweden, Net4Mobility, TeliaSweden
France Bouygues, Free Mobile, Orange France, SFR
China China Mobile, China Telecom
Poland, Chile, Estland, Finland, Hong Kong, Italy, Columbia, Kuwait, Litauen, New Zealand, Austria, Singapore, Spain, Russia ...
755 Mio LTE subscriptions worldwide, 442 commercially launched LTE networks (02 Nov 2015)
in 147 countries. forecast: 460 commercial networks by the end of 2015
755 Mio LTE subscriptions worldwide, 442 commercially launched LTE networks (02 Nov 2015)
in 147 countries. forecast: 460 commercial networks by the end of 2015
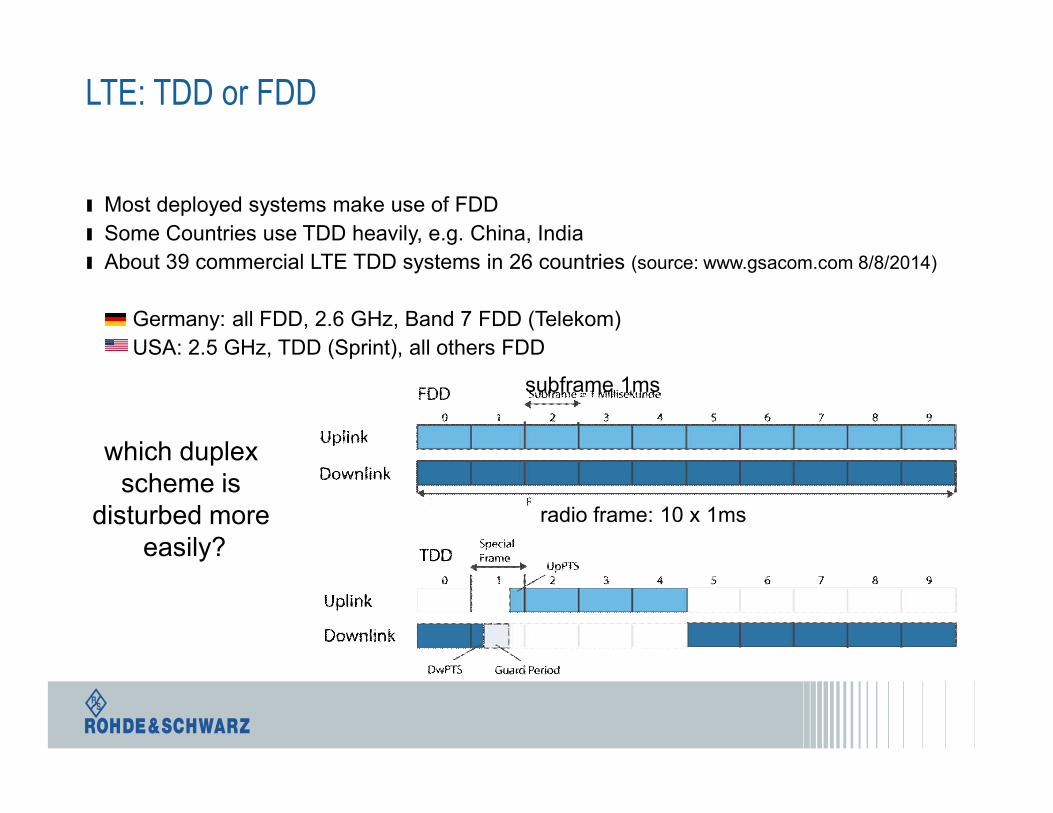
LTE: TDD or FDD
ı Most deployed systems make use of FDD
ı Some Countries use TDD heavily, e.g. China, India
ı About 39 commercial LTE TDD systems in 26 countries (source: www.gsacom.com 8/8/2014)
Germany: all FDD, 2.6 GHz, Band 7 FDD (Telekom)
USA: 2.5 GHz, TDD (Sprint), all others FDD
subframe 1ms
radio frame: 10 x 1ms
which duplex scheme is
disturbed more easily?
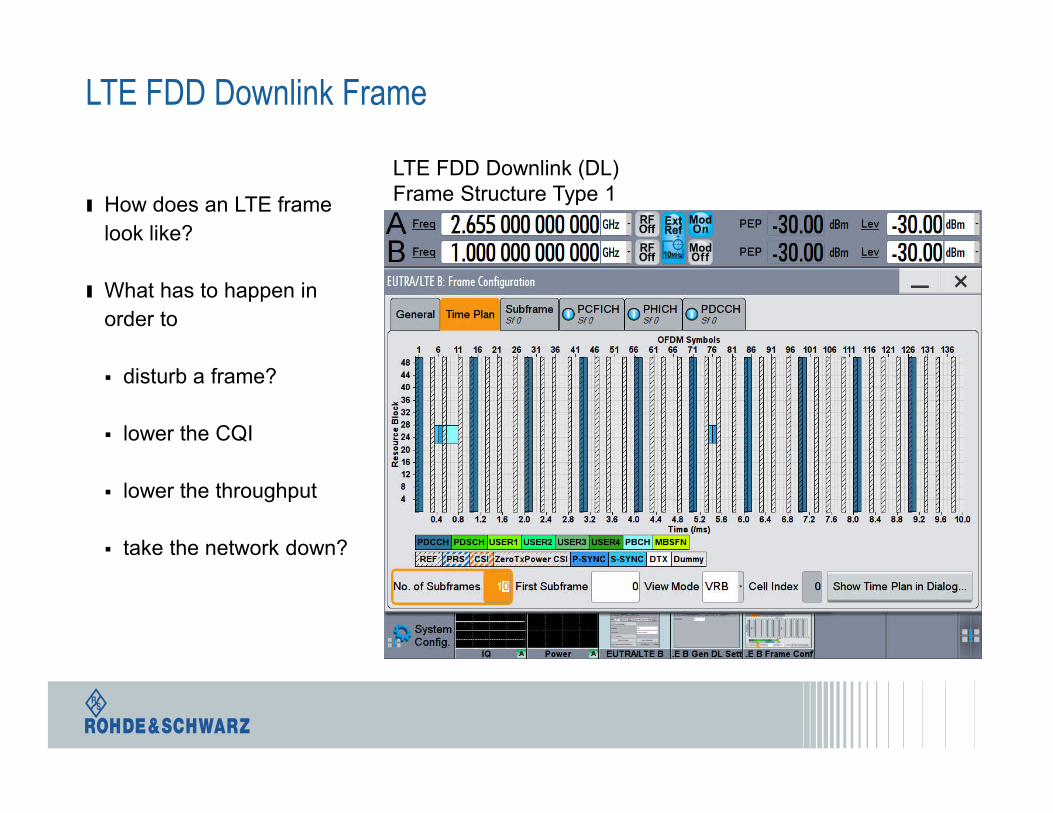
LTE FDD Downlink Frame
ı How does an LTE frame
look like?
ı What has to happen in
order to
disturb a frame?
lower the CQI
lower the throughput
take the network down?
LTE FDD Downlink (DL)Frame Structure Type 1
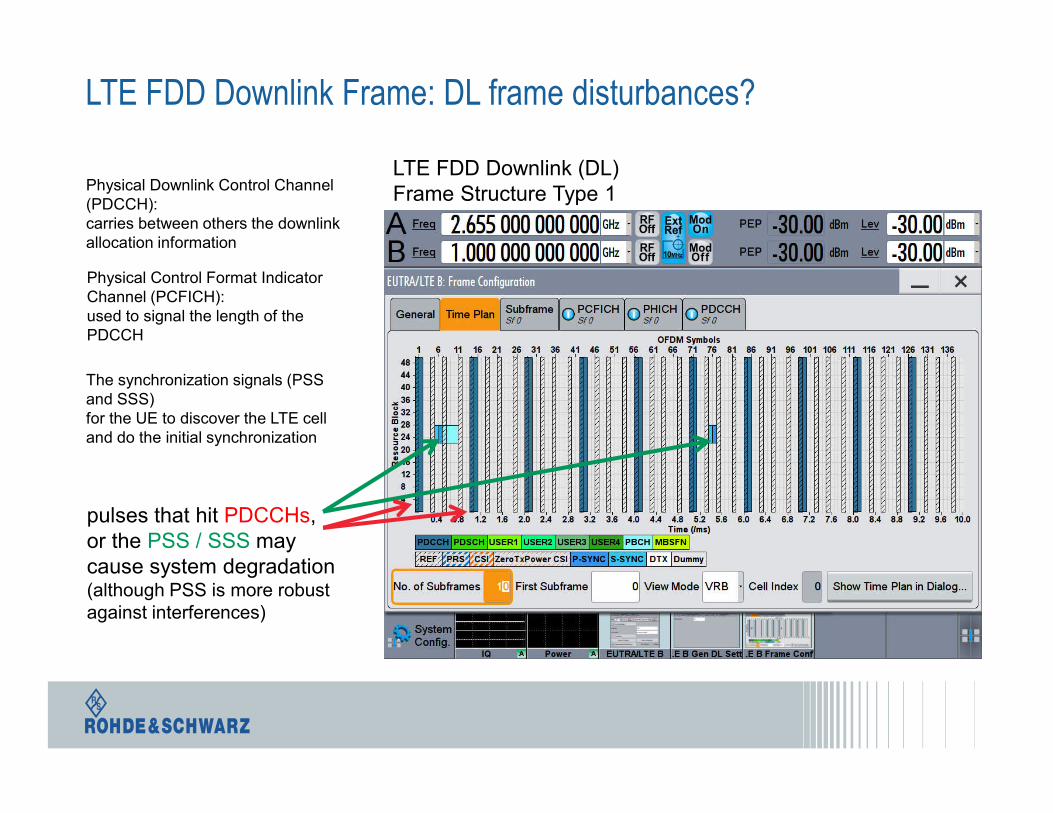
LTE FDD Downlink Frame: DL frame disturbances?
Physical Downlink Control Channel (PDCCH):carries between others the downlink allocation information
Physical Control Format Indicator Channel (PCFICH):used to signal the length of the PDCCH
The synchronization signals (PSS and SSS) for the UE to discover the LTE cell and do the initial synchronization
pulses that hit PDCCHs,or the PSS / SSS may cause system degradation (although PSS is more robust against interferences)
LTE FDD Downlink (DL)Frame Structure Type 1
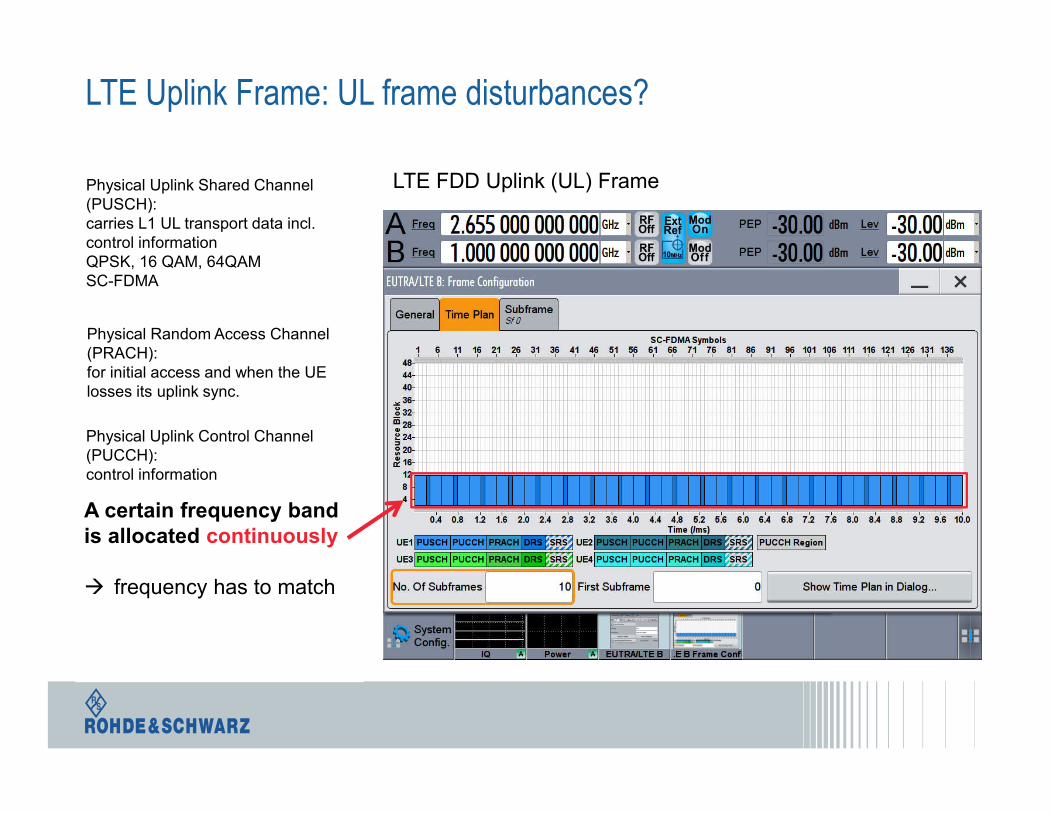
LTE Uplink Frame: UL frame disturbances?
LTE FDD Uplink (UL) FramePhysical Uplink Shared Channel (PUSCH):carries L1 UL transport data incl. control informationQPSK, 16 QAM, 64QAMSC-FDMA
Physical Random Access Channel (PRACH):for initial access and when the UE losses its uplink sync.
Physical Uplink Control Channel (PUCCH): control information
Sounding reference signals (SRS) used by the enodeB to estimate the uplink channel conditions
Reference signals (RS) used by the enodeB to estimate the uplink channel to decode the terminal uplink transmission
A certain frequency band is allocated continuously
frequency has to match
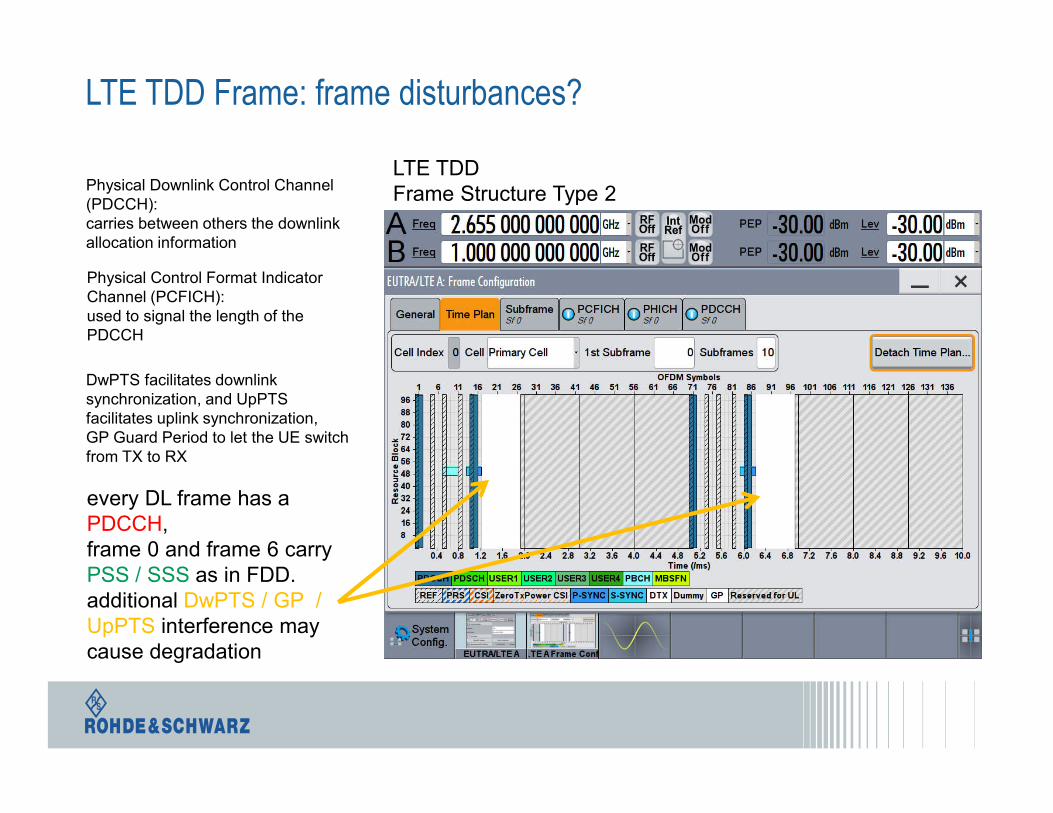
LTE TDD Frame: frame disturbances?
Physical Downlink Control Channel (PDCCH):carries between others the downlink allocation information
Physical Control Format Indicator Channel (PCFICH):used to signal the length of the PDCCH
DwPTS facilitates downlink synchronization, and UpPTSfacilitates uplink synchronization,GP Guard Period to let the UE switch from TX to RX
LTE TDD Frame Structure Type 2
every DL frame has a PDCCH, frame 0 and frame 6 carry PSS / SSS as in FDD.additional DwPTS / GP / UpPTS interference may cause degradation
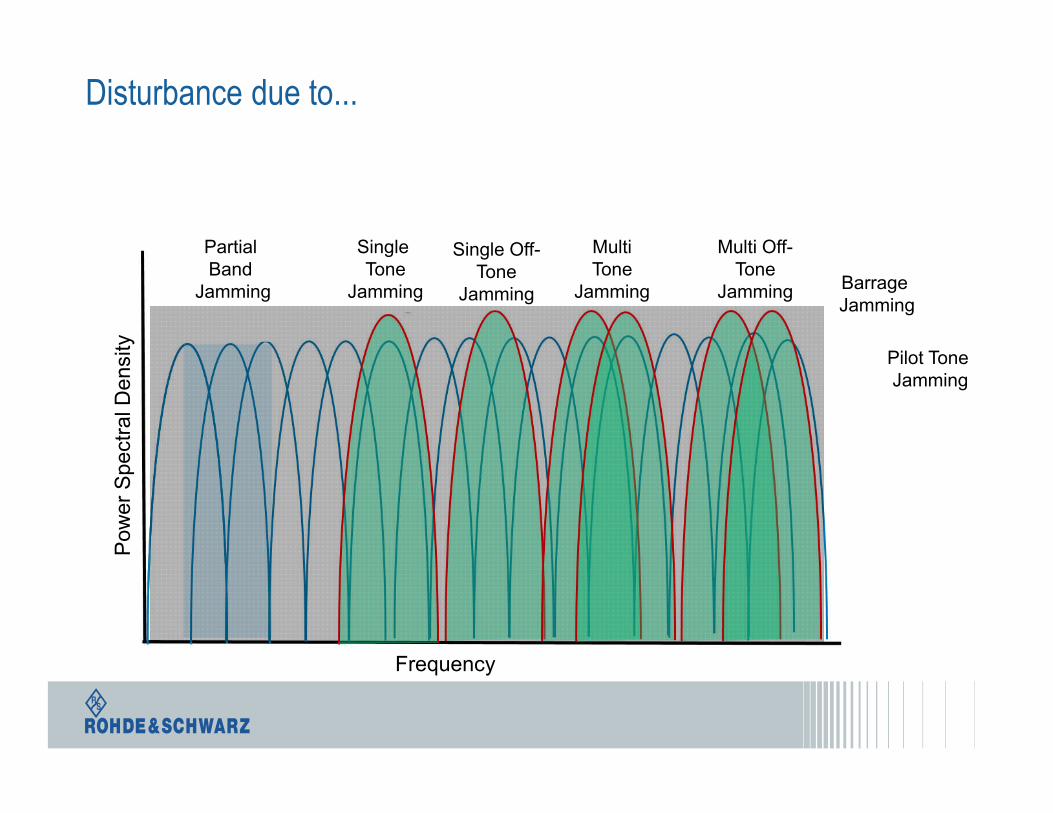
Disturbance due to...
Frequency
Pow
er
Spe
ctr
al D
ensity
Partial Band
Jamming
Single Tone
Jamming
Single Off-Tone
Jamming
Multi Off-Tone
Jamming
MultiTone
Jamming Barrage Jamming
Pilot Tone Jamming
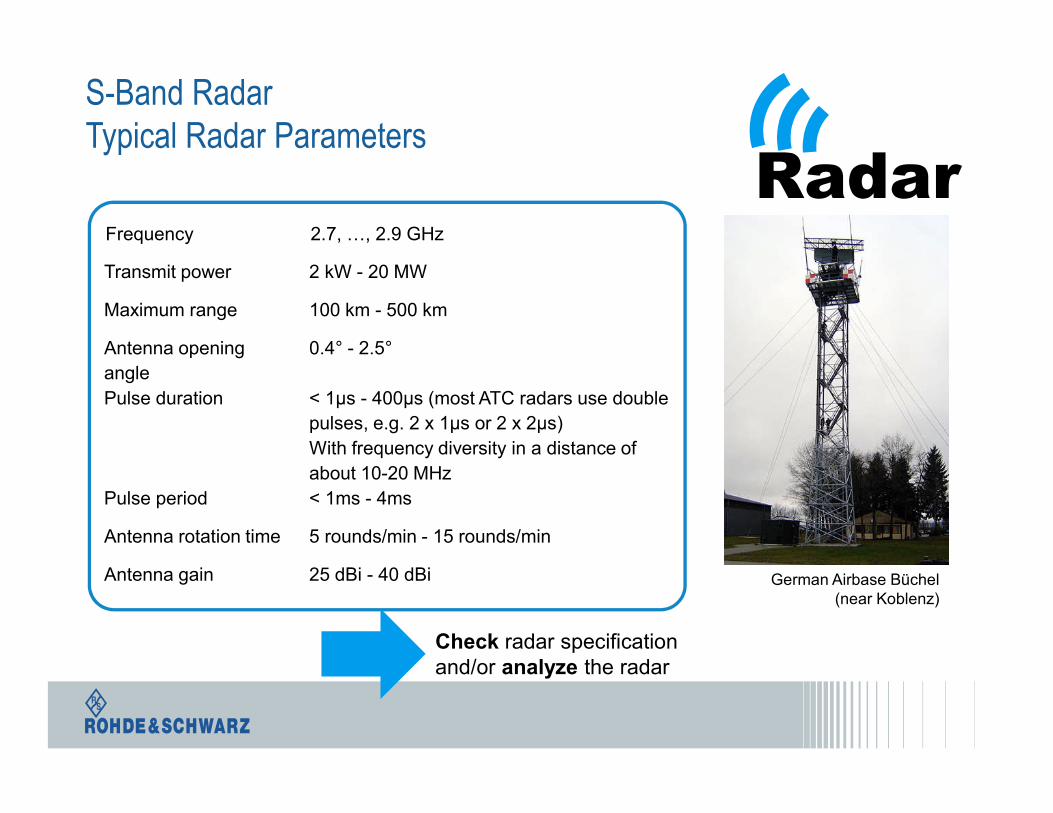
S-Band RadarTypical Radar Parameters
Frequency 2.7, …, 2.9 GHz
Transmit power 2 kW - 20 MW
Maximum range 100 km - 500 km
Antenna opening
angle
0.4° - 2.5°
Pulse duration < 1µs - 400µs (most ATC radars use double
pulses, e.g. 2 x 1µs or 2 x 2µs)
With frequency diversity in a distance of
about 10-20 MHz
Pulse period < 1ms - 4ms
Antenna rotation time 5 rounds/min - 15 rounds/min
Antenna gain 25 dBi - 40 dBi
Radar
German Airbase Büchel(near Koblenz)
Check radar specification and/or analyze the radar
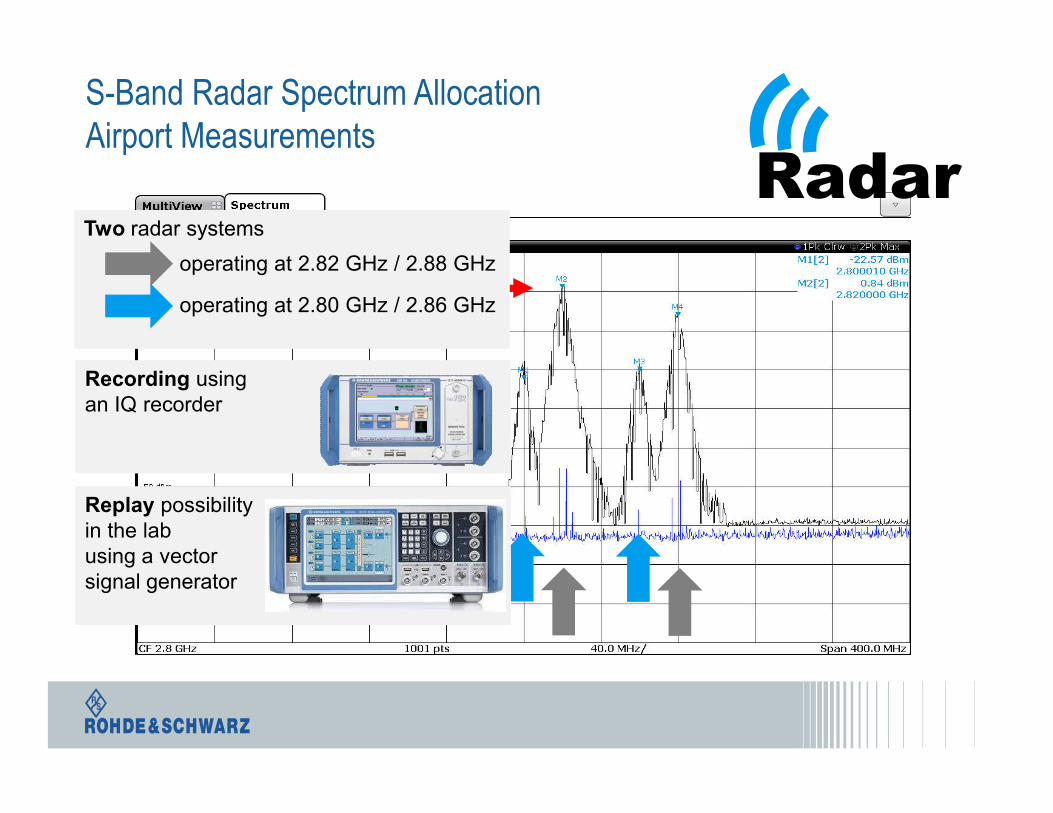
S-Band Radar Spectrum AllocationAirport Measurements
Radar
0.84 dBm
Two radar systems
operating at 2.82 GHz / 2.88 GHz
operating at 2.80 GHz / 2.86 GHz
Two radar systems
operating at 2.82 GHz / 2.88 GHz
operating at 2.80 GHz / 2.86 GHz
Recording usingan IQ recorderRecording usingan IQ recorder
Replay possibilityin the labusing a vector signal generator
Replay possibilityin the labusing a vector signal generator
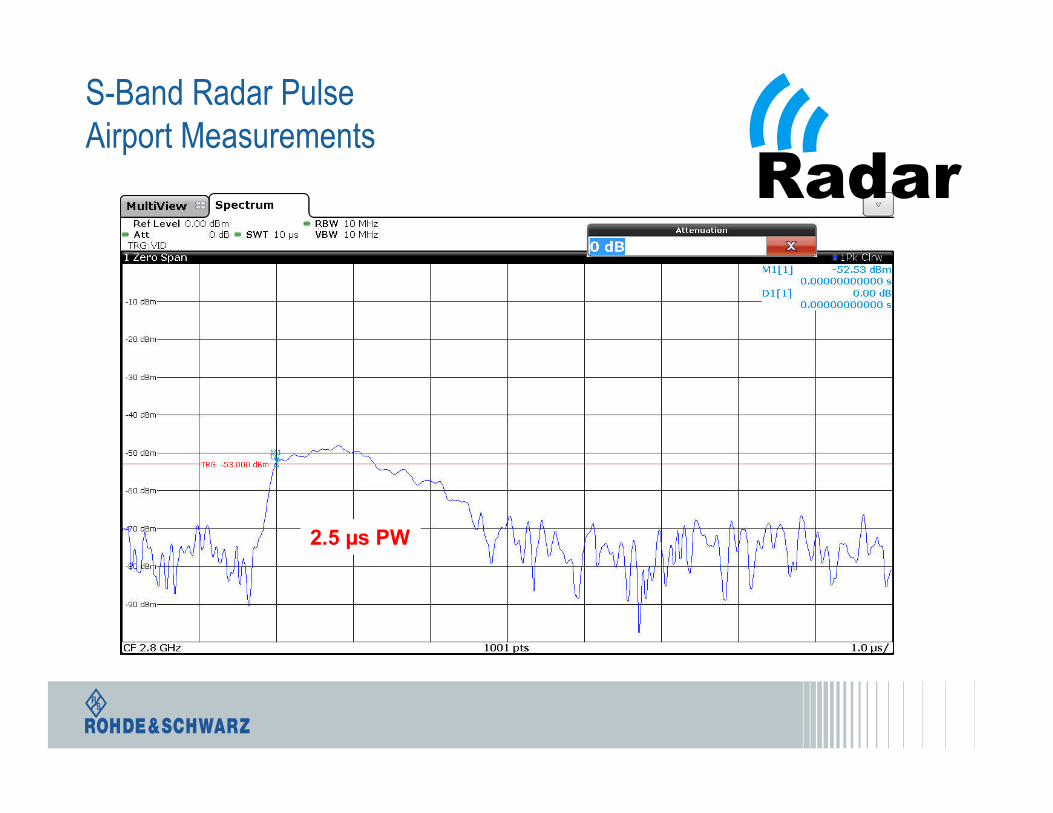
S-Band Radar Pulse Airport Measurements
Radar
2.5 µs PW
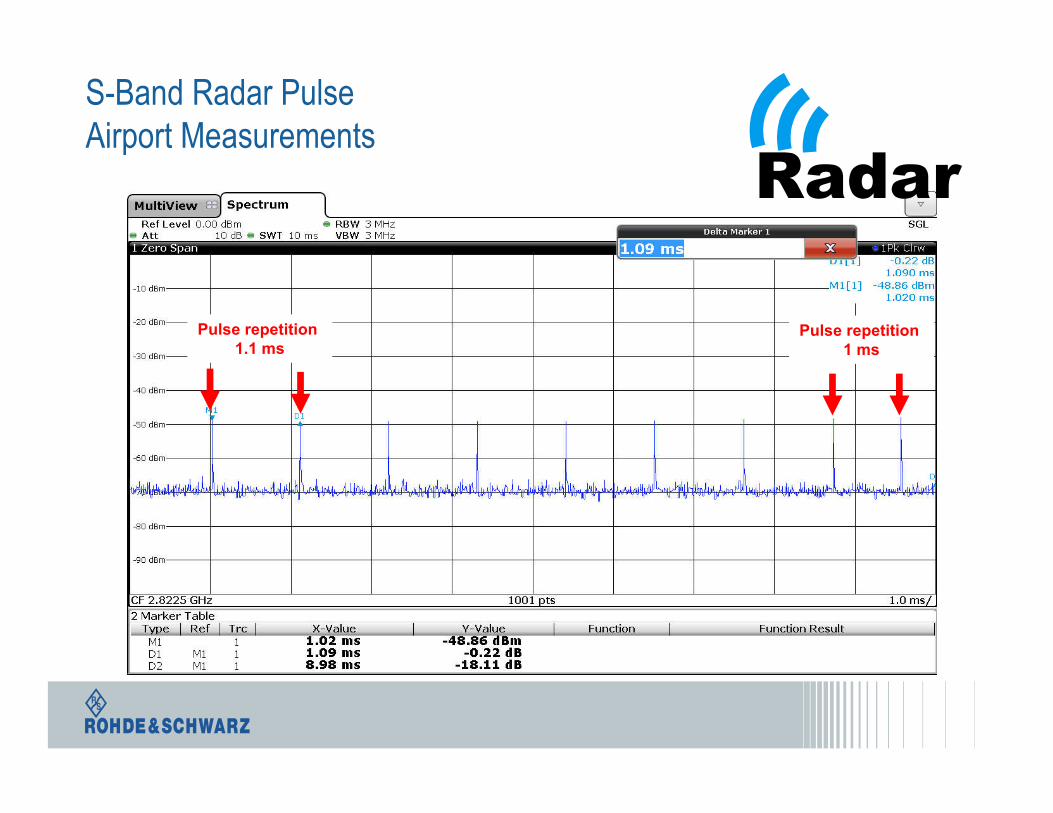
S-Band Radar Pulse Airport Measurements
Radar
Pulse repetition 1.1 ms
Pulse repetition 1 ms

S-Band Radar Pulse Airport Measurements
Pulse repetition 1.1 ms
Pulse repetition about 1 ms
TDD (frame structure Type 2)special subframes:
DwPTS Downlink Pilot TimeslotGP Guard PeriodUpPTS Uplink Pilot Timeslot
Radar
FDD (frame structure Type 1)
radio frame: 10 mssubframe: 1 msslot: 0.5 ms

Interference Scenarios
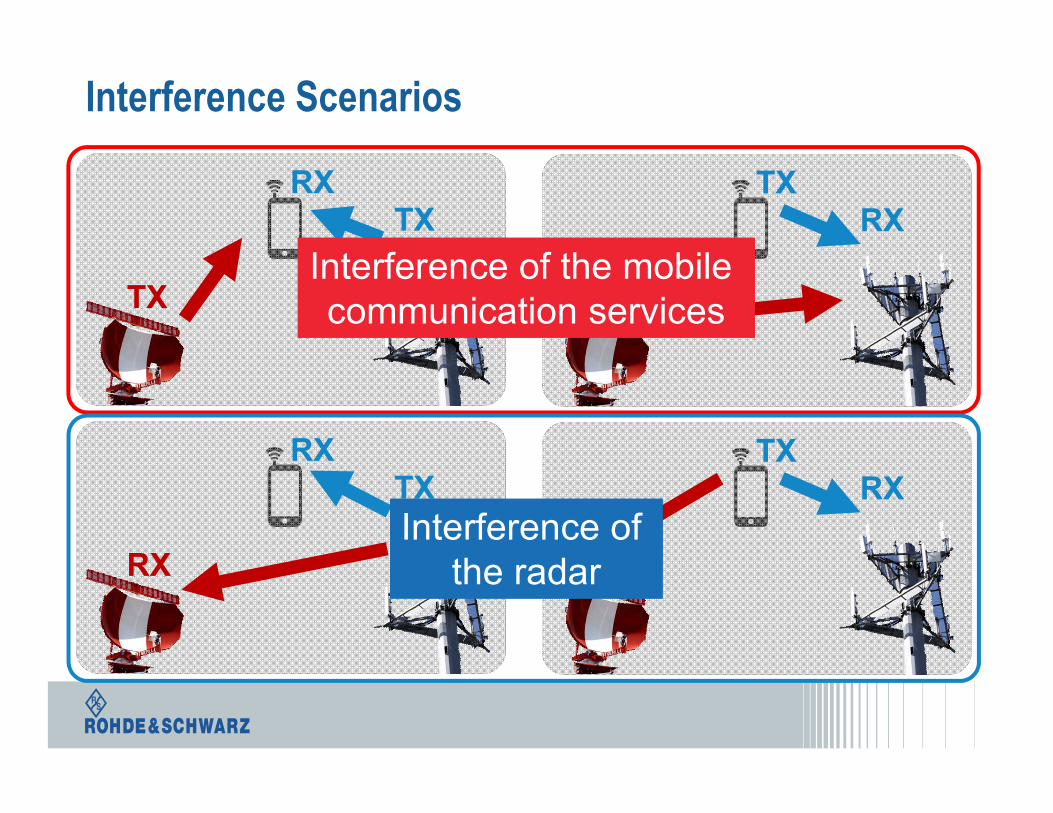
Interference Scenarios
RXTX
TX
TX
TX
RX
RX
RX
TXTX
RX
RX
Interference of the mobile communication services
Interference of the mobile communication services
Interference of the radar
Interference of the radar
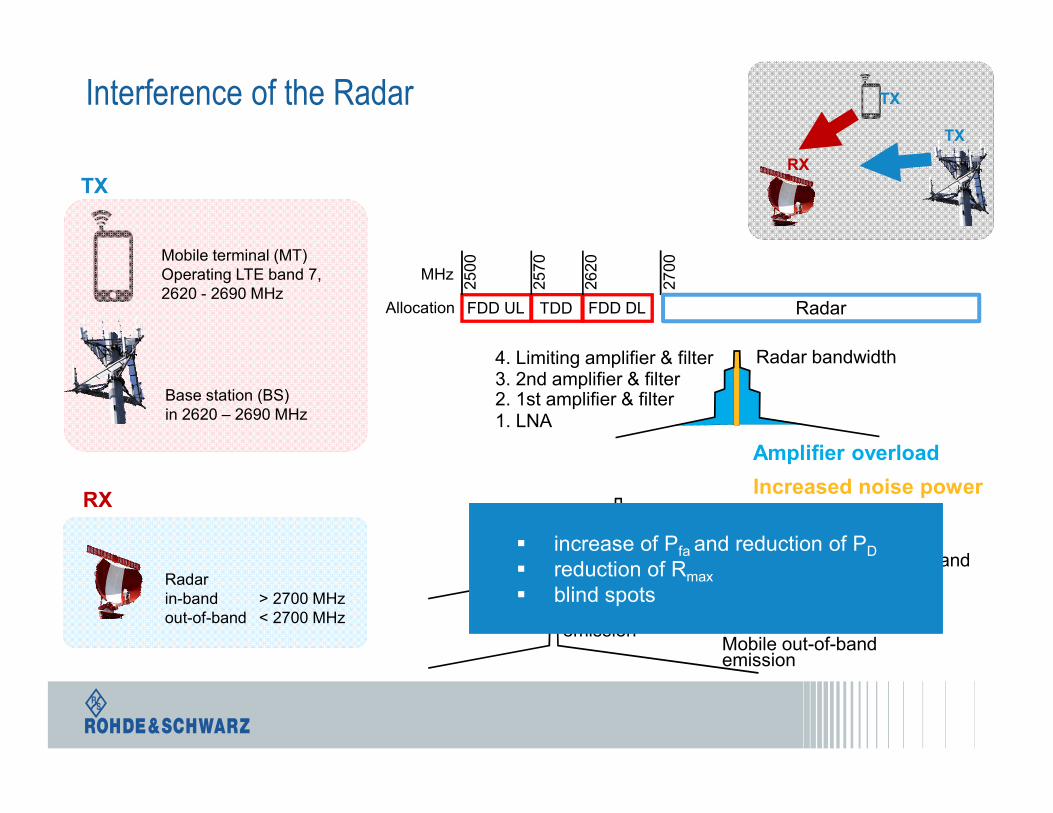
Interference of the Radar
Mobile terminal (MT)Operating LTE band 7, 2620 - 2690 MHz
Radarin-band > 2700 MHzout-of-band < 2700 MHz
Base station (BS)in 2620 – 2690 MHz
TX
RX
TX
TX
RX
FDD UL TDD FDD DL Radar
25
00
MHz
25
70
26
20
27
00
Allocation
Radar bandwidth
Base stationin-band emission
Base station out-of-bandemission
Mobilein-band emission
Mobile out-of-bandemission
4. Limiting amplifier & filter3. 2nd amplifier & filter2. 1st amplifier & filter1. LNA
Amplifier overload
Increased noise power
Radar
increase of Pfa and reduction of PD
reduction of Rmax
blind spots
increase of Pfa and reduction of PD
reduction of Rmax
blind spots

Interference of the Mobile Service
Mobile terminal (MT)in-band < 2690 MHzout-of-band > 2690 MHz
Radar2700 MHz to 2900 MHz
Base station (BS)in-band < 2690 MHzout-of-band > 2690 MHz
RX
TX
RX
RX
TX
FDD UL TDD FDD DL Radar
25
00
MHz
25
70
26
20
27
00
Allocation
Radarin-band emission
Radar out-of-bandemission
Radar
Increased noise power
2. BPF & amplifier1. BPF & LNA Amplifier overload
signal and synchronization loss throughput reduction signal and synchronization loss throughput reduction
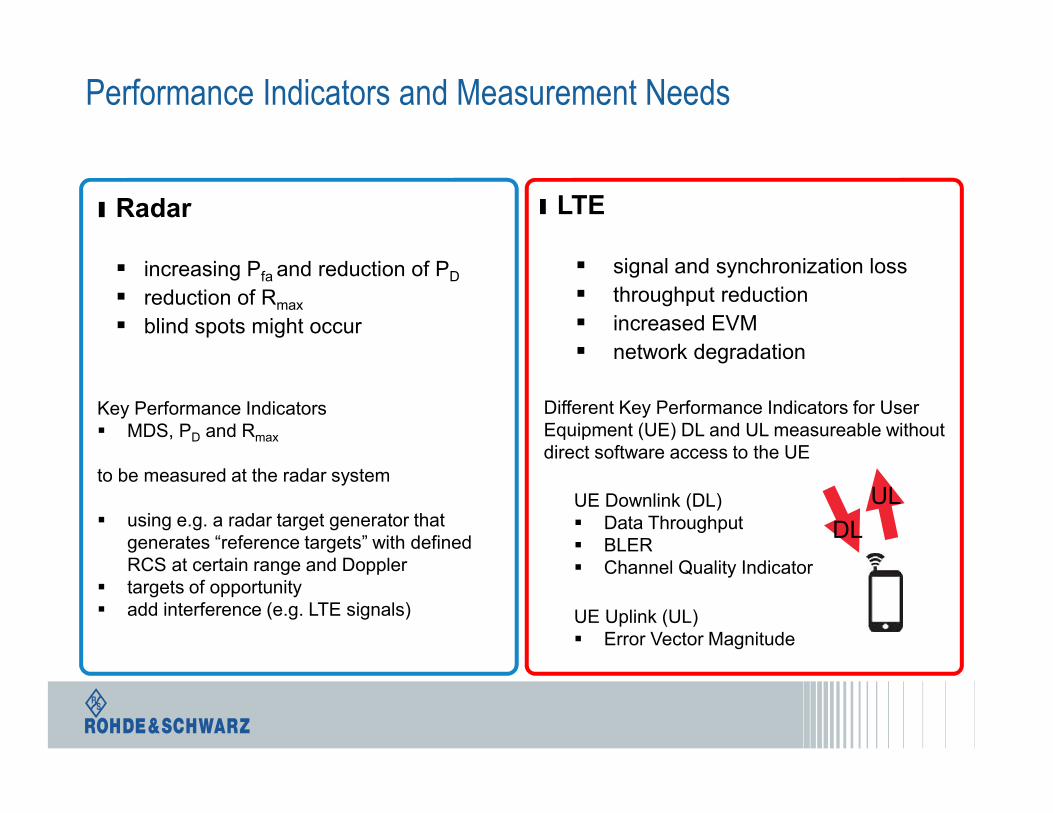
Performance Indicators and Measurement Needs
ı Radar
increasing Pfa and reduction of PD
reduction of Rmax
blind spots might occur
ı LTE
signal and synchronization loss
throughput reduction
increased EVM
network degradation
UE Downlink (DL) Data Throughput BLER Channel Quality Indicator
UE Uplink (UL) Error Vector Magnitude
Different Key Performance Indicators for User Equipment (UE) DL and UL measureable without direct software access to the UE
<
DL
UL
Key Performance Indicators MDS, PD and Rmax
to be measured at the radar system
using e.g. a radar target generator that generates “reference targets” with defined RCS at certain range and Doppler
targets of opportunity add interference (e.g. LTE signals)
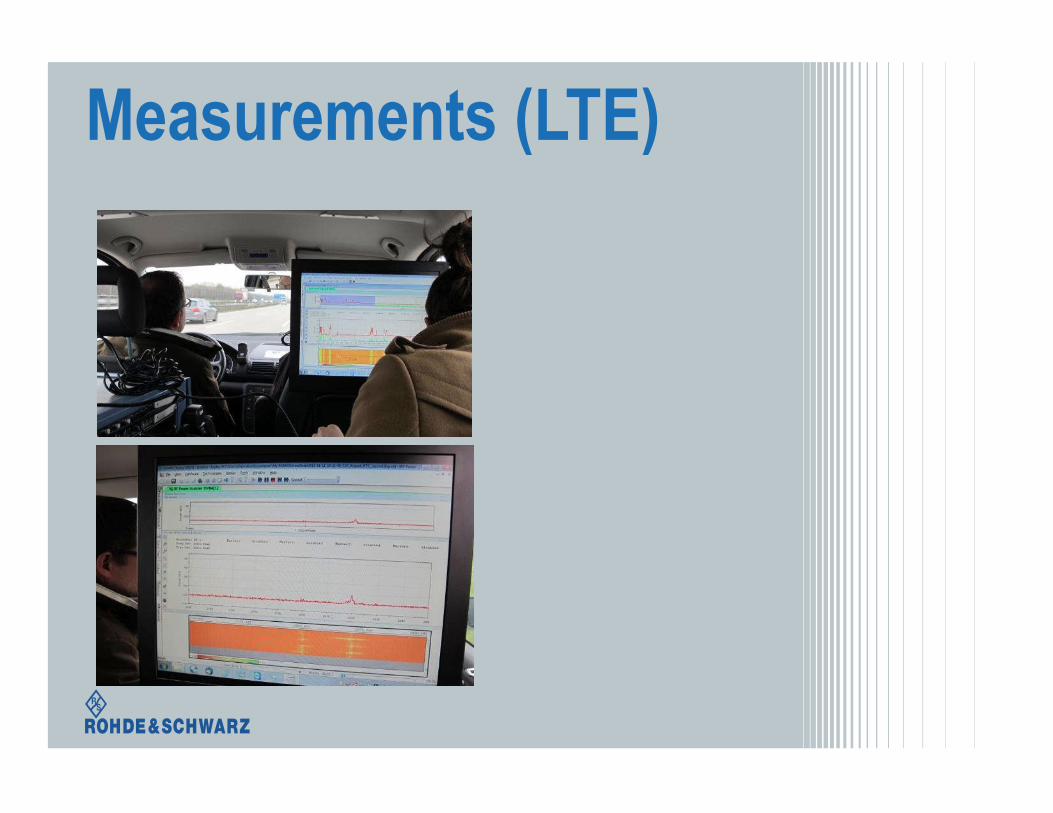
Measurements (LTE)
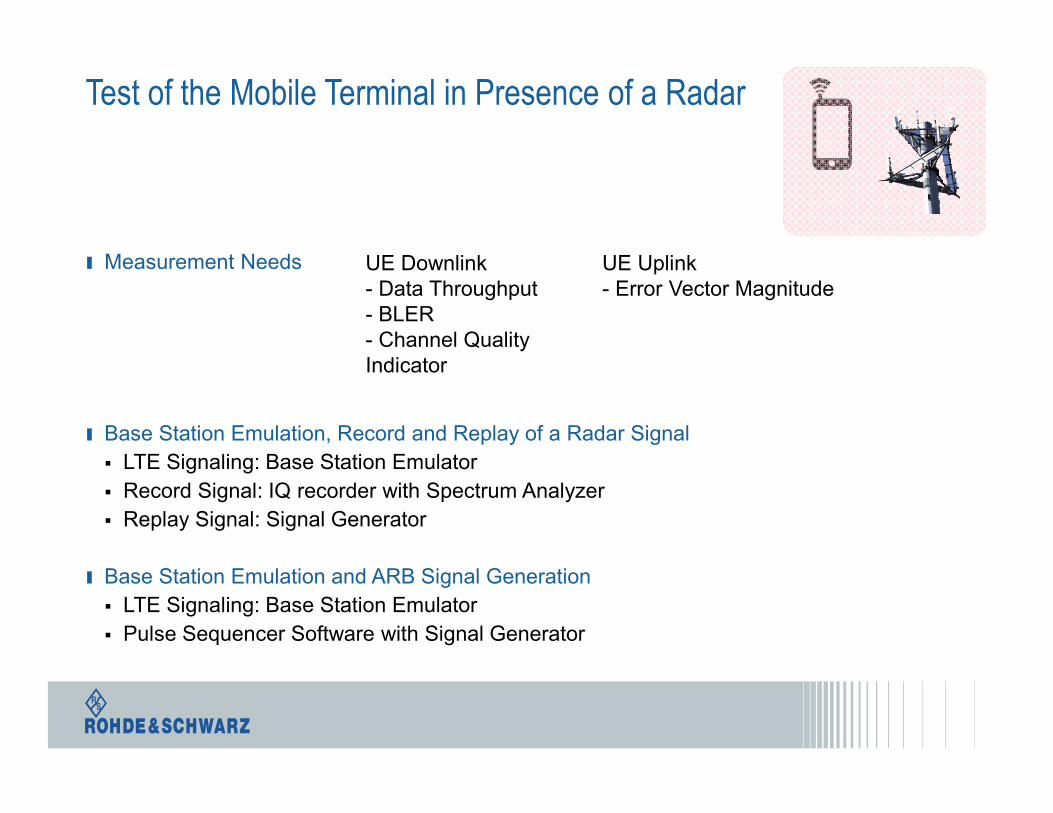
Test of the Mobile Terminal in Presence of a Radar
ı Measurement Needs
ı Base Station Emulation, Record and Replay of a Radar Signal
LTE Signaling: Base Station Emulator
Record Signal: IQ recorder with Spectrum Analyzer
Replay Signal: Signal Generator
ı Base Station Emulation and ARB Signal Generation
LTE Signaling: Base Station Emulator
Pulse Sequencer Software with Signal Generator
UE Downlink- Data Throughput- BLER - Channel Quality Indicator
UE Uplink- Error Vector Magnitude
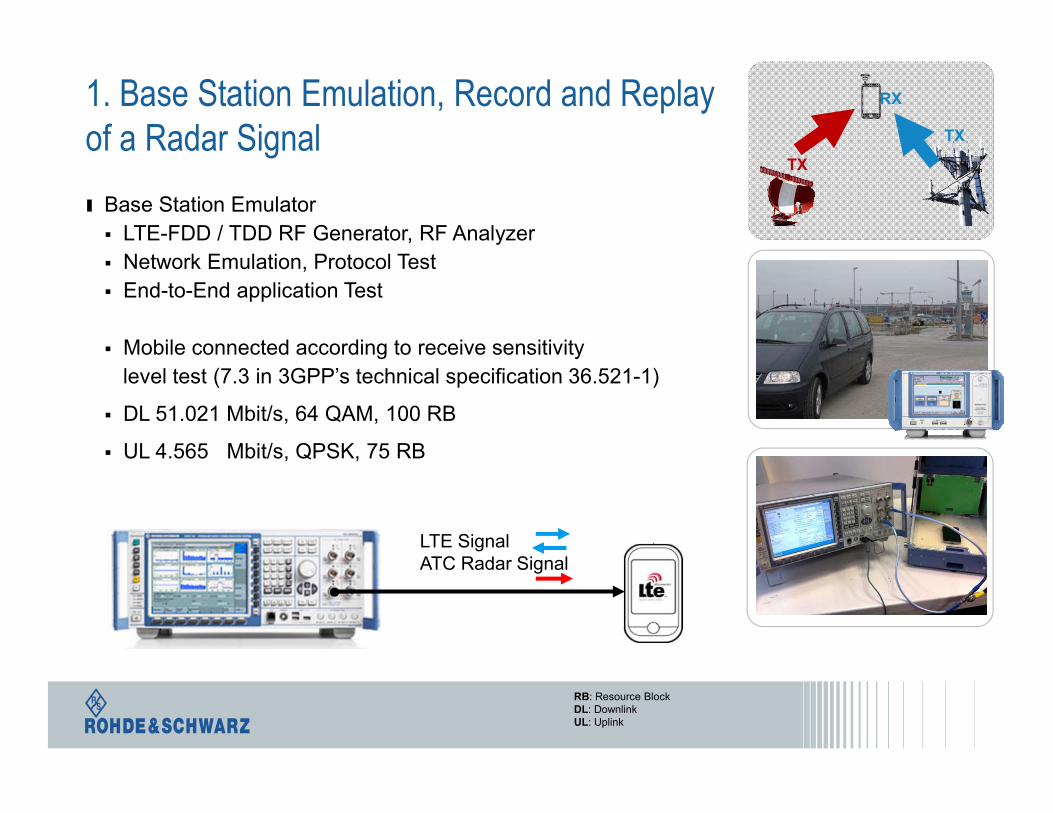
ı Base Station Emulator
LTE-FDD / TDD RF Generator, RF Analyzer
Network Emulation, Protocol Test
End-to-End application Test
Mobile connected according to receive sensitivity
level test (7.3 in 3GPP’s technical specification 36.521-1)
DL 51.021 Mbit/s, 64 QAM, 100 RB
UL 4.565 Mbit/s, QPSK, 75 RB
RX
TX
TX
1. Base Station Emulation, Record and Replay of a Radar Signal
LTE Signal ATC Radar Signal
RB: Resource BlockDL: DownlinkUL: Uplink

LTE Throughput MeasurementNo radar present
RX
TX
LTE Signal
LTE base stationRS EPRE:-104.5 dBm/15kHz CQI of 5-6
Mobile terminalMax power (+23 dBm)Follow wideband
RS EPRE: energy per resource element (EPRE) of the reference signal (RS)CQI: Channel Quality Indicator
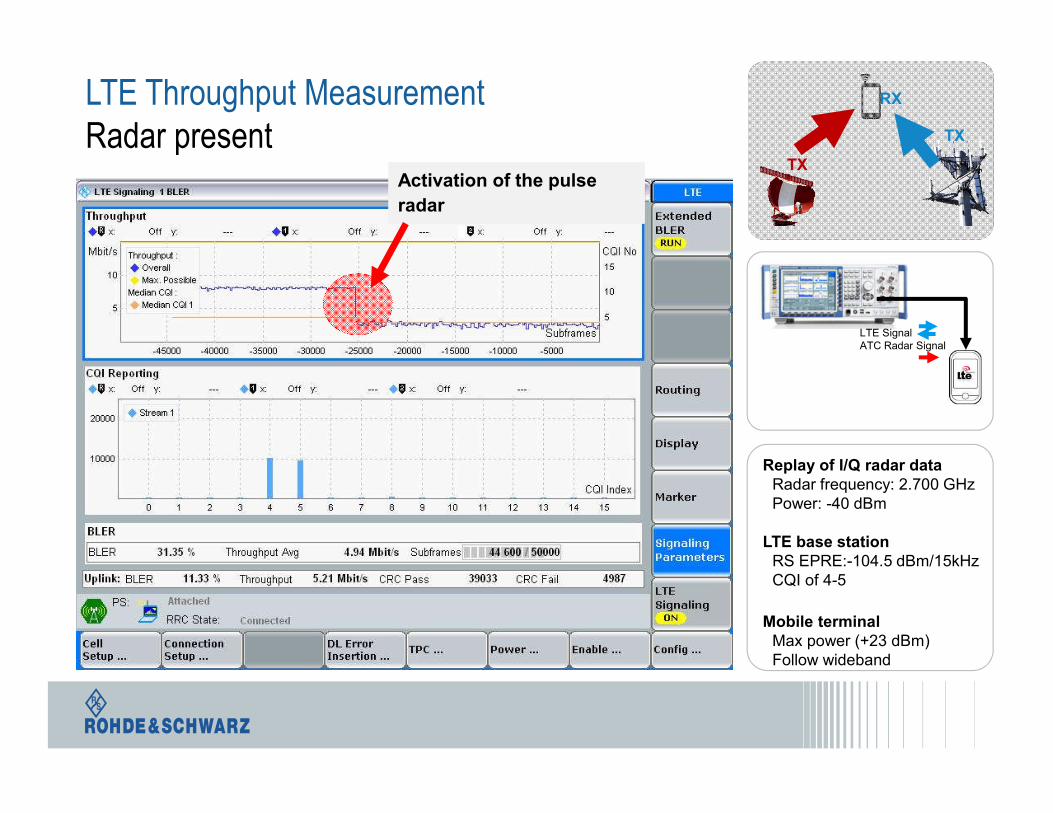
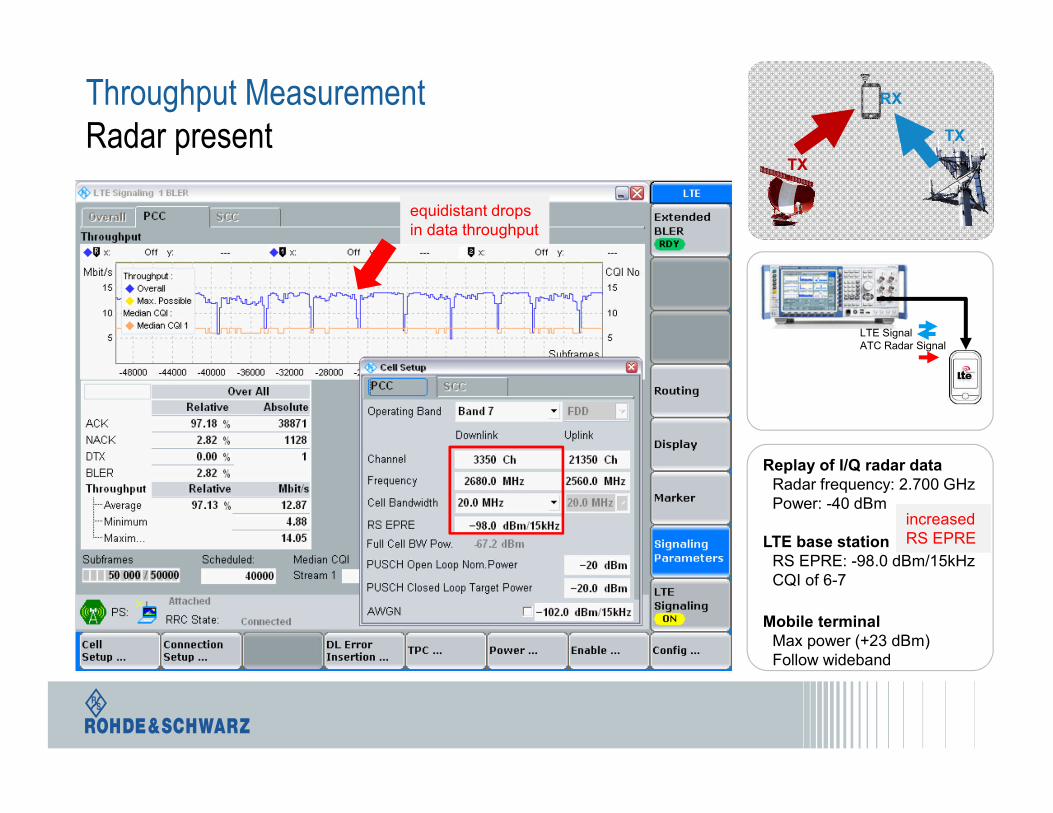
LTE Throughput MeasurementRadar present
Replay of I/Q radar dataRadar frequency: 2.700 GHzPower: -40 dBm
LTE base stationRS EPRE:-104.5 dBm/15kHz CQI of 4-5
Mobile terminalMax power (+23 dBm)Follow wideband
Activation of the pulse
radar
Activation of the pulse
radar
LTE Signal ATC Radar Signal
RX
TX
TX
Throughput MeasurementRadar present
LTE Signal ATC Radar Signal
RX
TX
TX
Replay of I/Q radar dataRadar frequency: 2.700 GHzPower: -40 dBm
LTE base stationRS EPRE: -98.0 dBm/15kHz CQI of 6-7
Mobile terminalMax power (+23 dBm)Follow wideband
increased RS EPRE increased RS EPRE
equidistant drops in data throughputequidistant drops in data throughput
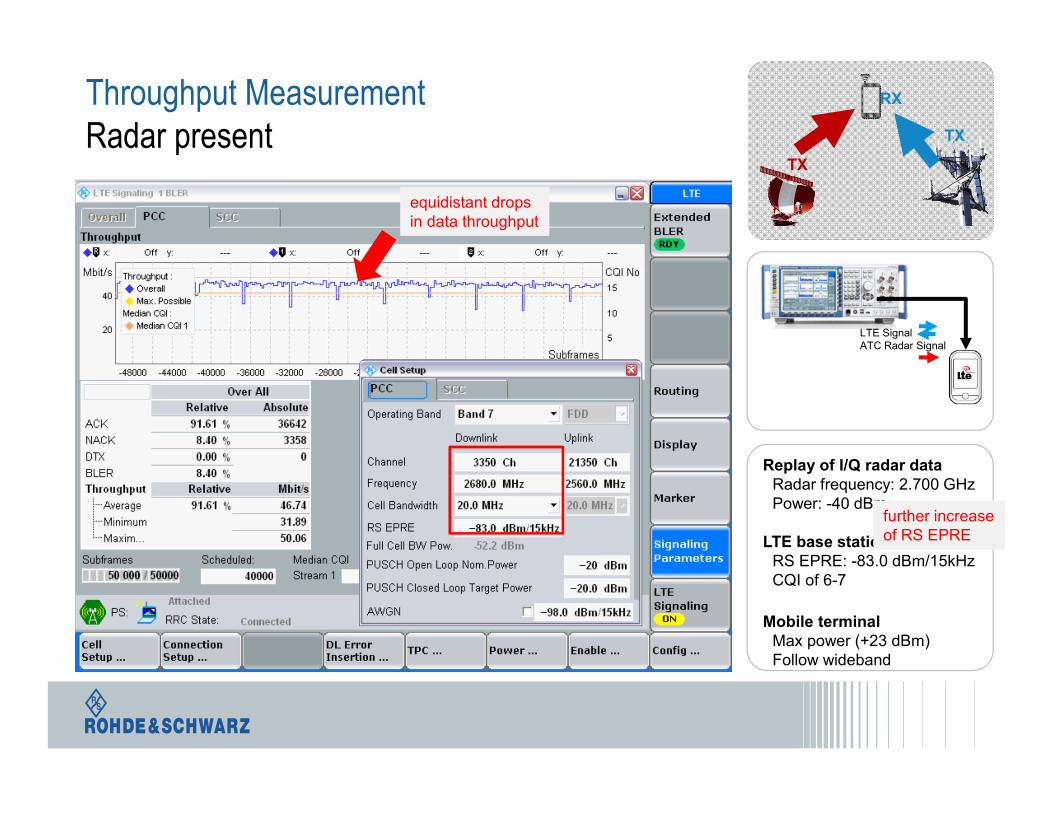
Throughput MeasurementRadar present
LTE Signal ATC Radar Signal
RX
TX
TX
Replay of I/Q radar dataRadar frequency: 2.700 GHzPower: -40 dBm
LTE base stationRS EPRE: -83.0 dBm/15kHz CQI of 6-7
Mobile terminalMax power (+23 dBm)Follow wideband
further increaseof RS EPRE further increaseof RS EPRE
equidistant drops in data throughputequidistant drops in data throughput
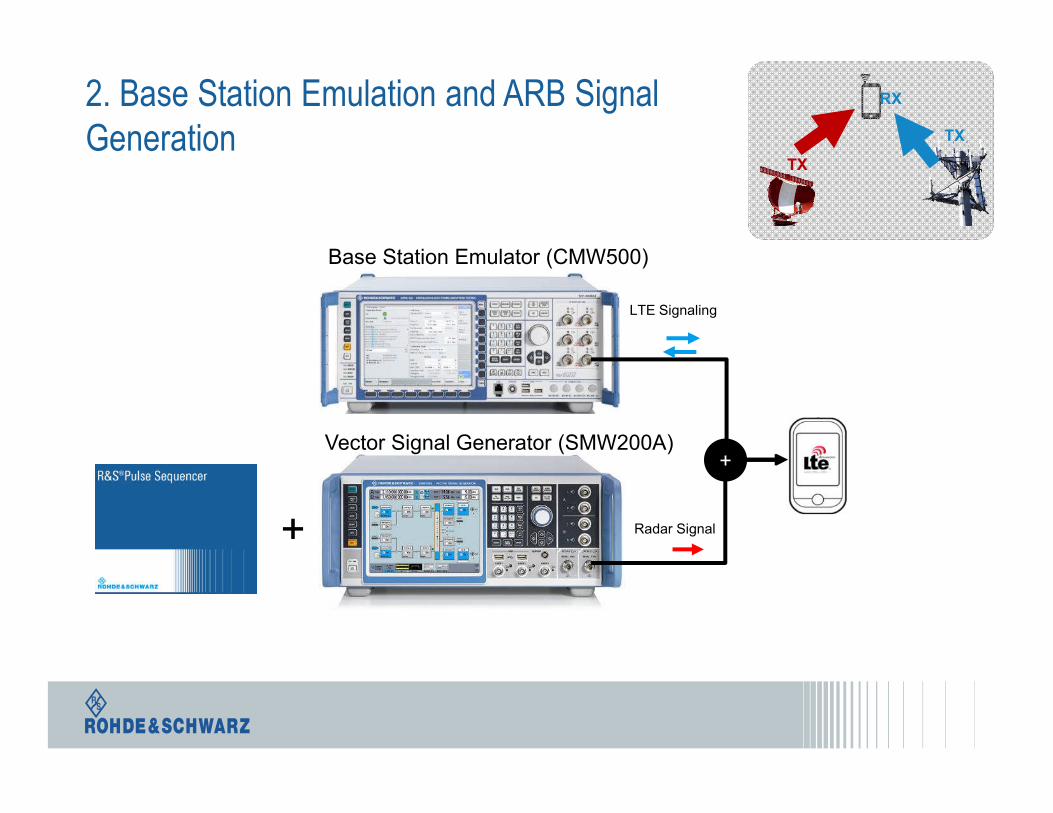
2. Base Station Emulation and ARB Signal Generation
RX
TX
TX
LTE Signaling
Base Station Emulator (CMW500)
Vector Signal Generator (SMW200A)+
Radar Signal+
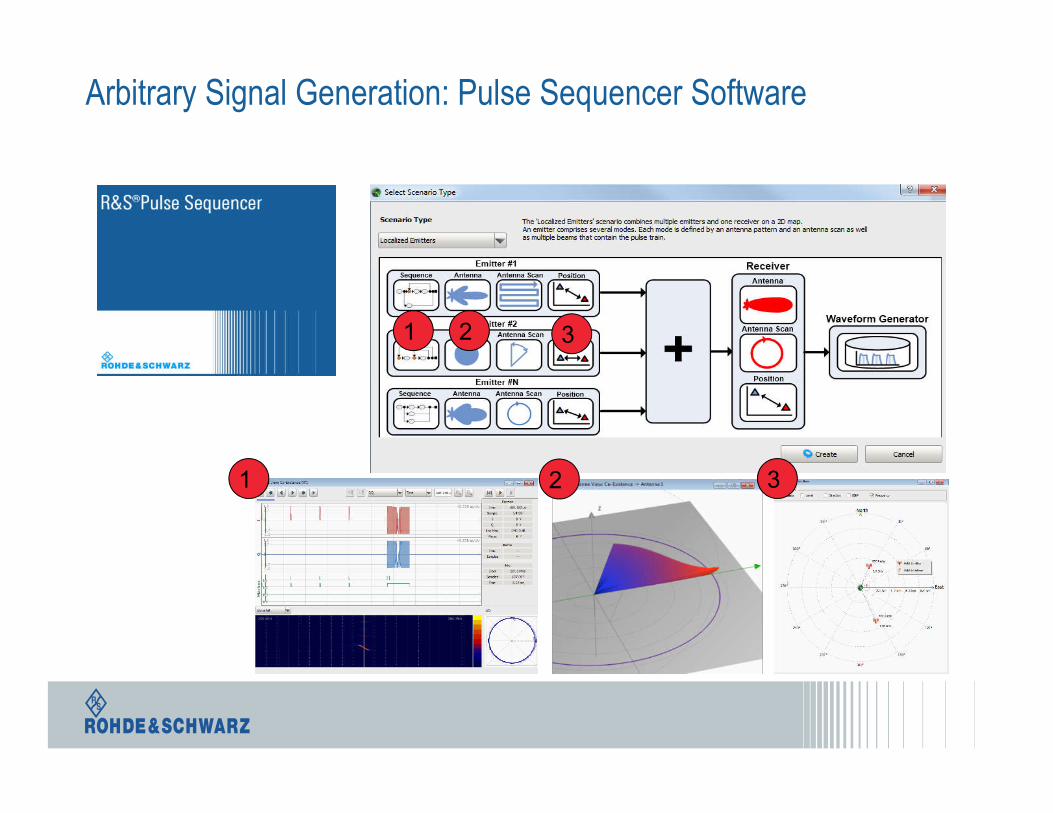
Arbitrary Signal Generation: Pulse Sequencer Software
1
1
2
2 3
3
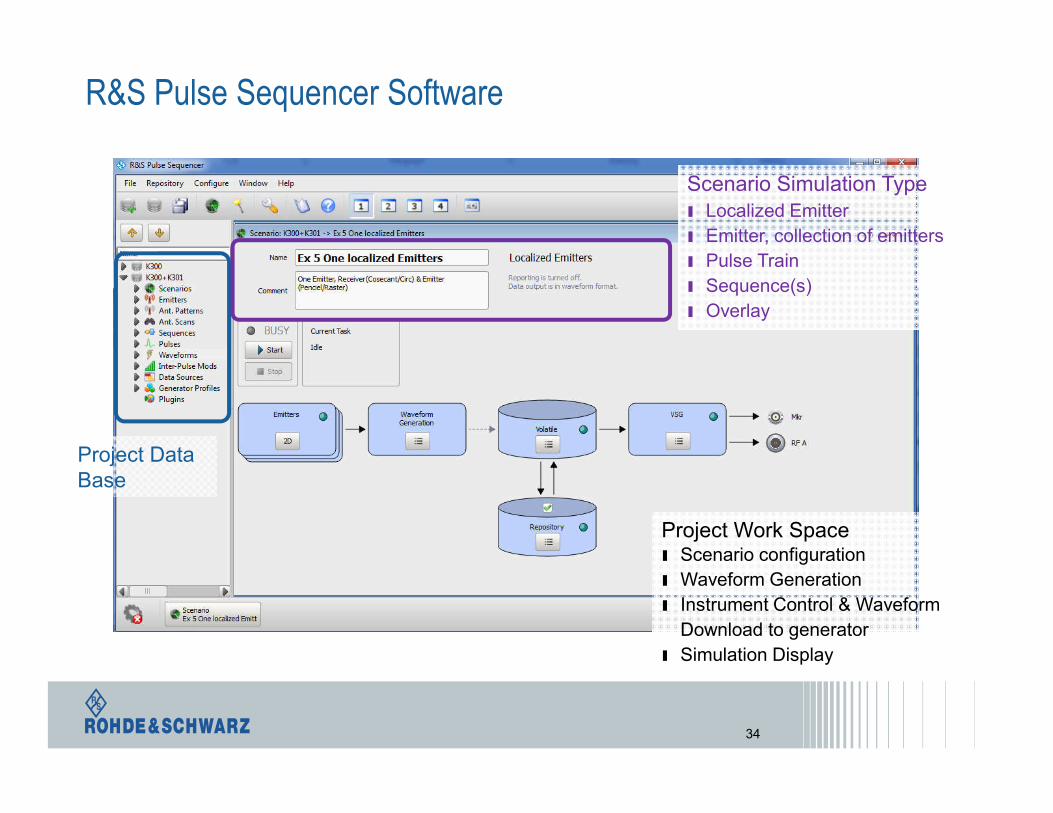
R&S Pulse Sequencer Software
Project Data Base
Project Work Spaceı Scenario configuration
ı Waveform Generation
ı Instrument Control & Waveform
Download to generator
ı Simulation Display
Scenario Simulation Typeı Localized Emitter
ı Emitter, collection of emitters
ı Pulse Train
ı Sequence(s)
ı Overlay
34
Powerful Sequencer & Inter Pulse Modulation
35
Simple Loop and Pulse Trains
with repetition of same pulse
Loop with e.g. 2 pulses and
customized static phase offset,
amplitude offset,PRI, frequency
offset, delay per pulse …
Nested loop
Two signals in parallel at
the same time
Single Pulse, multiple pulses
or inter pulse modulationor or
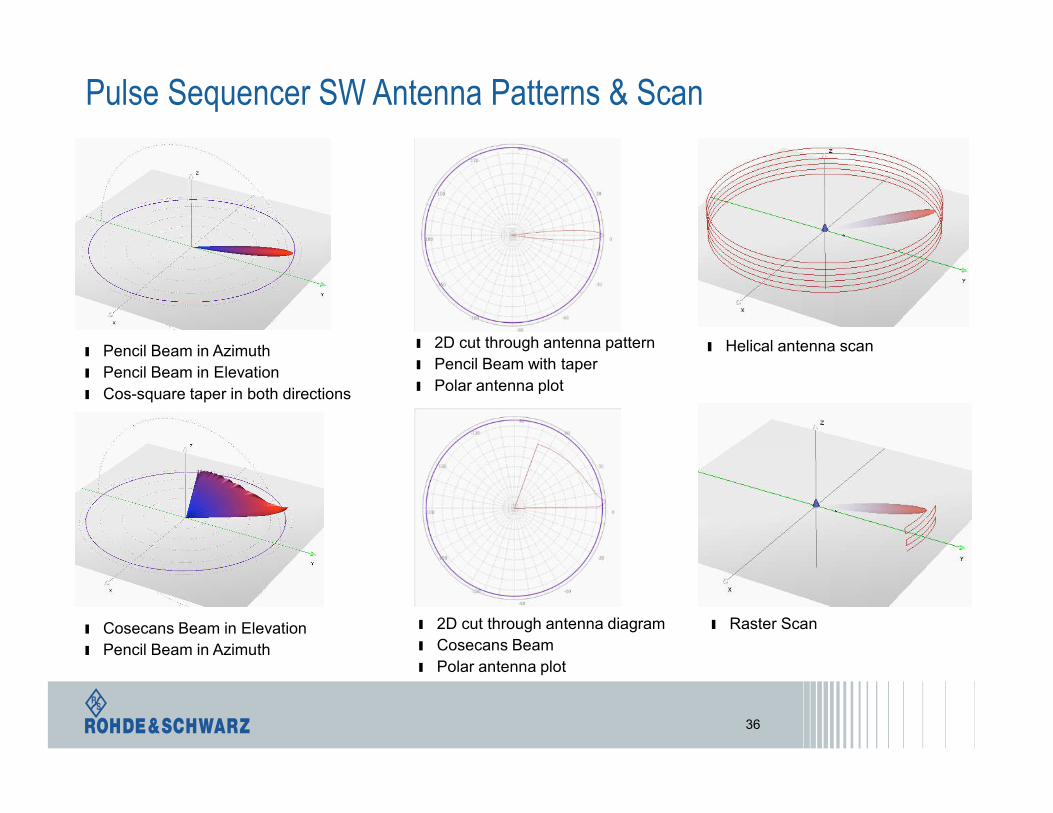
Pulse Sequencer SW Antenna Patterns & Scan
36
ı Cosecans Beam in Elevation
ı Pencil Beam in Azimuth
ı Pencil Beam in Azimuth
ı Pencil Beam in Elevation
ı Cos-square taper in both directions
ı Helical antenna scan
ı Raster Scan
ı 2D cut through antenna pattern
ı Pencil Beam with taper
ı Polar antenna plot
ı 2D cut through antenna diagram
ı Cosecans Beam
ı Polar antenna plot
37
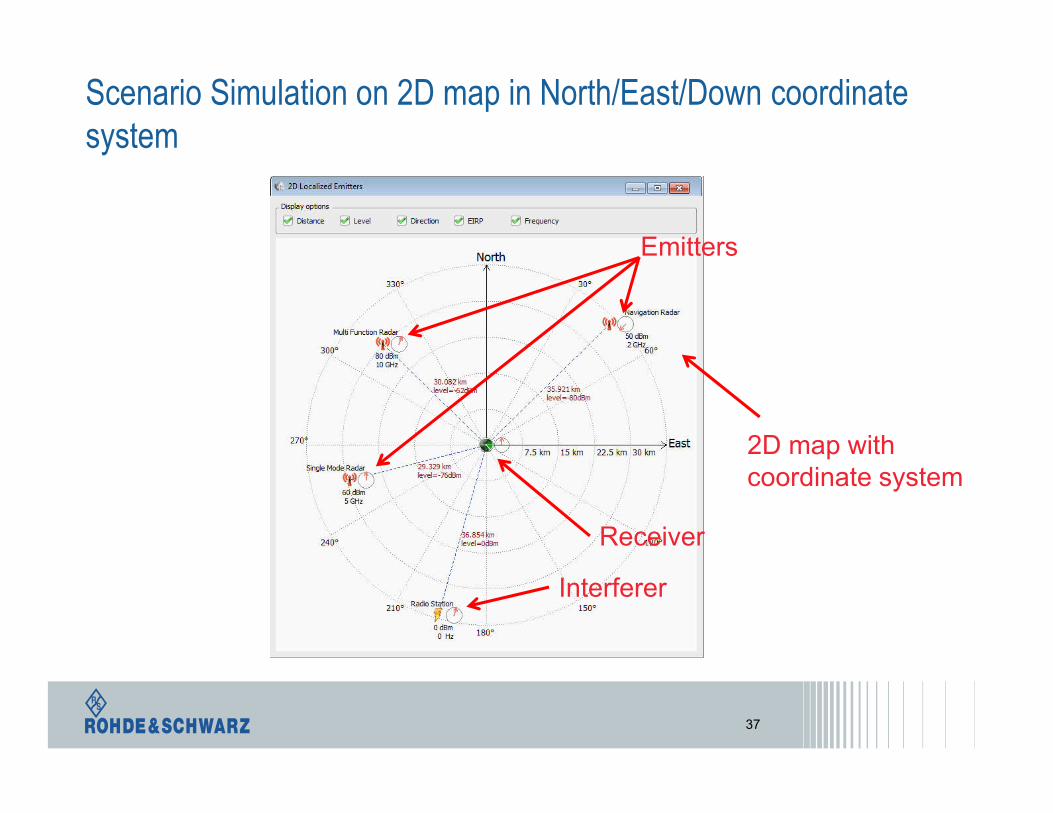
Scenario Simulation on 2D map in North/East/Down coordinate system
Interferer
Receiver
Emitters
2D map with coordinate system
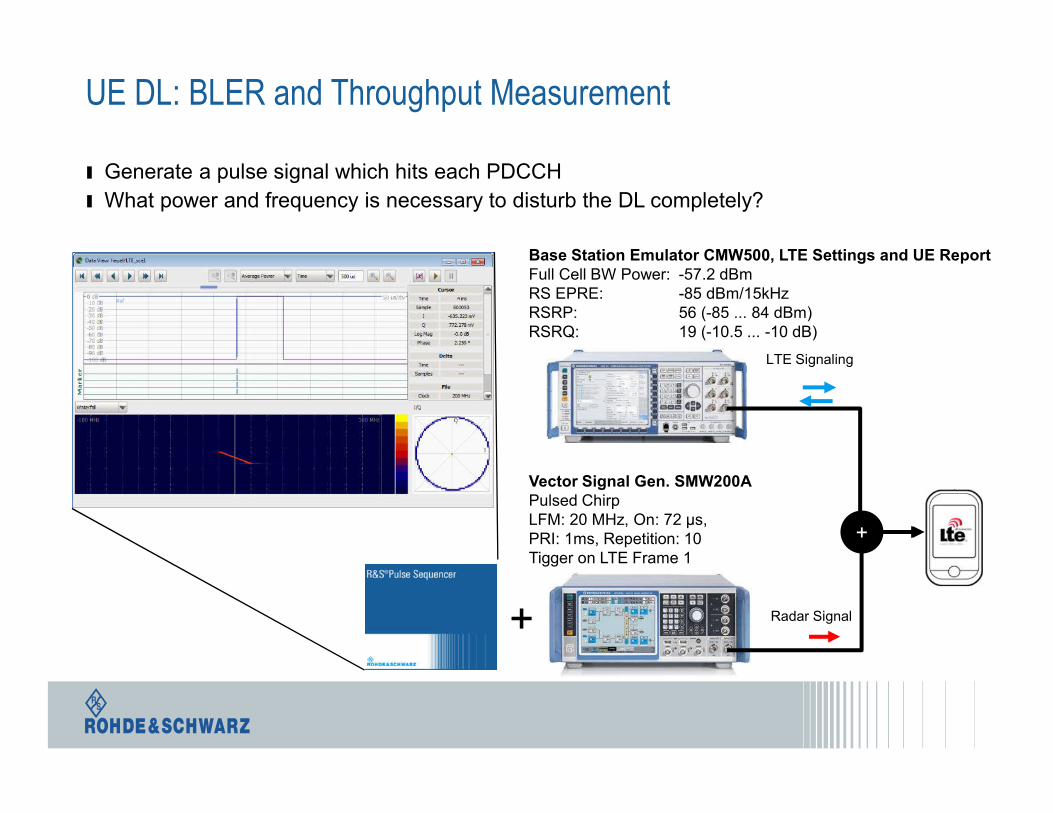
UE DL: BLER and Throughput Measurement
LTE Signaling
Base Station Emulator CMW500, LTE Settings and UE ReportFull Cell BW Power: -57.2 dBmRS EPRE: -85 dBm/15kHzRSRP: 56 (-85 ... 84 dBm)RSRQ: 19 (-10.5 ... -10 dB)
Vector Signal Gen. SMW200APulsed Chirp LFM: 20 MHz, On: 72 µs, PRI: 1ms, Repetition: 10Tigger on LTE Frame 1
+
Radar Signal+
ı Generate a pulse signal which hits each PDCCH
ı What power and frequency is necessary to disturb the DL completely?
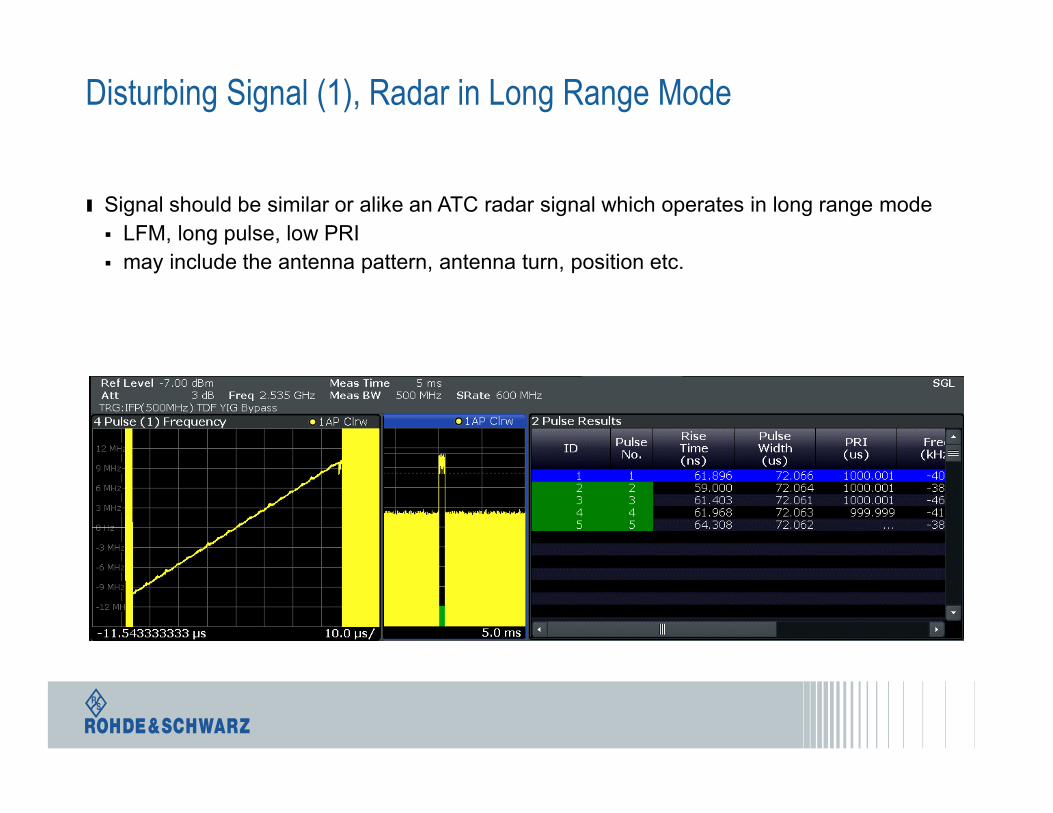
Disturbing Signal (1), Radar in Long Range Mode
ı Signal should be similar or alike an ATC radar signal which operates in long range mode
LFM, long pulse, low PRI
may include the antenna pattern, antenna turn, position etc.
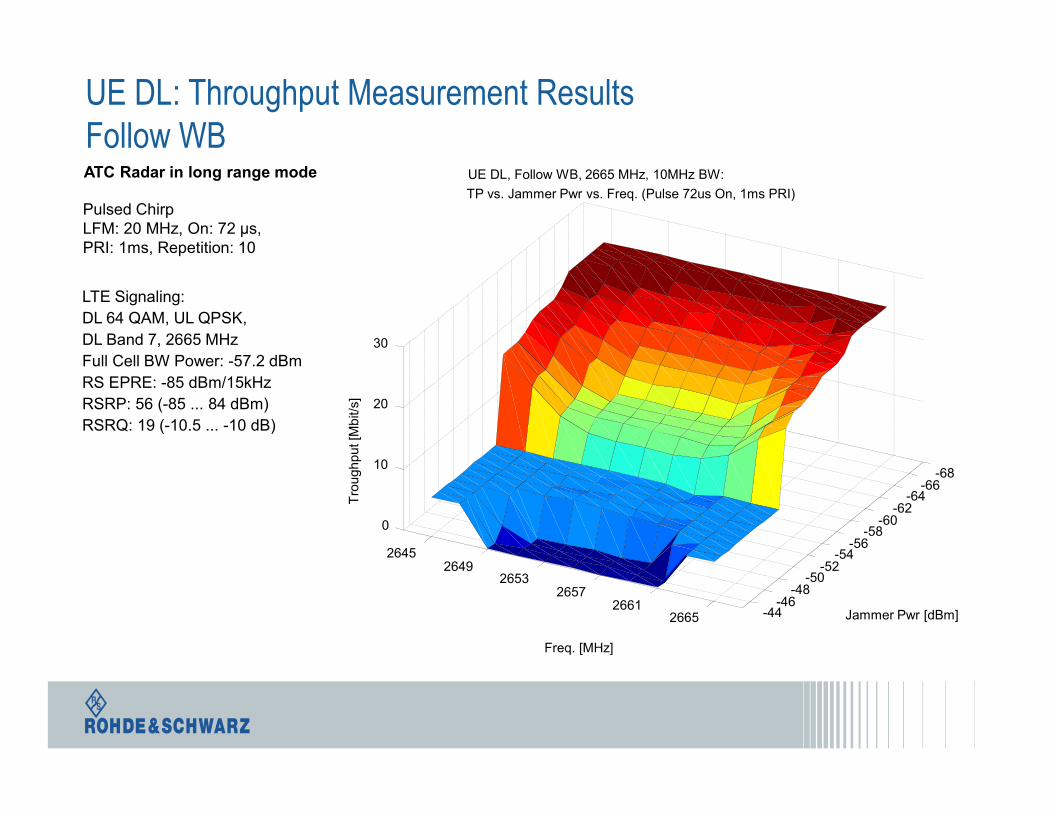
UE DL: Throughput Measurement ResultsFollow WB
-68-66
-64-62
-60-58
-56-54
-52-50
-48-46
-44
26452649
26532657
26612665
0
10
20
30
Jammer Pwr [dBm]
UE DL, Follow WB, 2665 MHz, 10MHz BW:
TP vs. Jammer Pwr vs. Freq. (Pulse 72us On, 1ms PRI)
Freq. [MHz]
Tro
ughput [M
bit/
s]
LTE Signaling:
DL 64 QAM, UL QPSK,
DL Band 7, 2665 MHz
Full Cell BW Power: -57.2 dBm
RS EPRE: -85 dBm/15kHz
RSRP: 56 (-85 ... 84 dBm)
RSRQ: 19 (-10.5 ... -10 dB)
Pulsed Chirp LFM: 20 MHz, On: 72 µs, PRI: 1ms, Repetition: 10
ATC Radar in long range mode
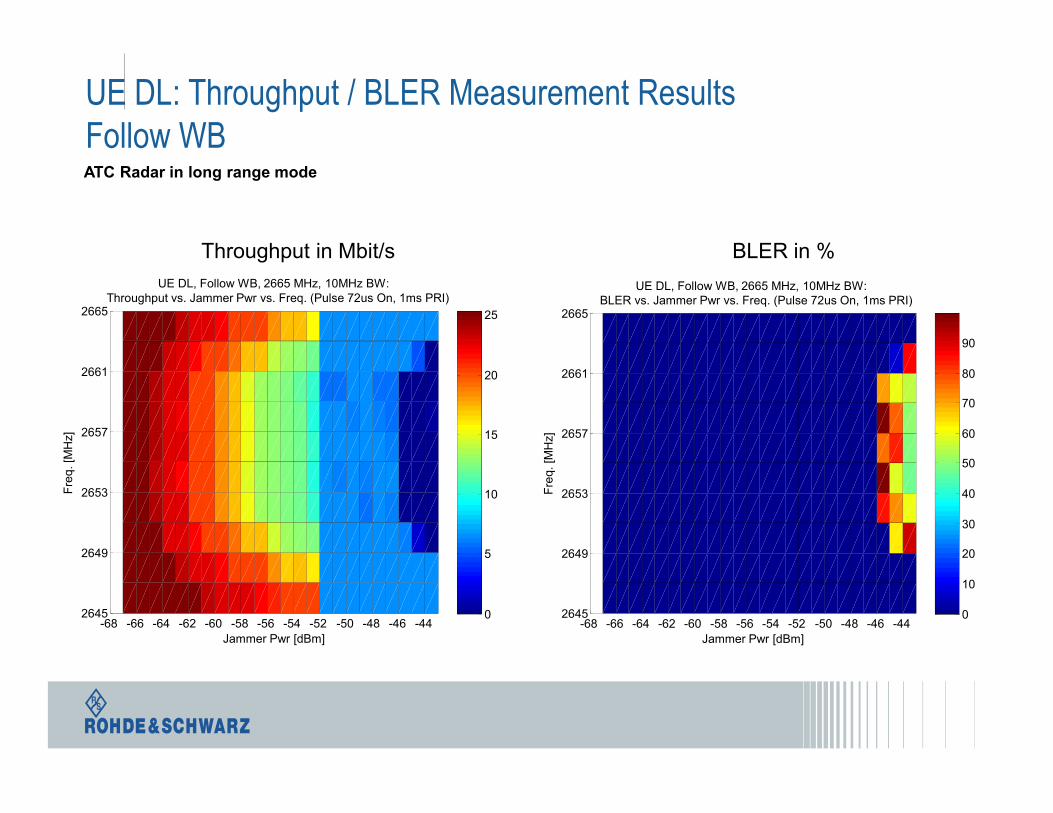
UE DL: Throughput / BLER Measurement ResultsFollow WB
Throughput in Mbit/s BLER in %
-68 -66 -64 -62 -60 -58 -56 -54 -52 -50 -48 -46 -442645
2649
2653
2657
2661
2665
UE DL, Follow WB, 2665 MHz, 10MHz BW:Throughput vs. Jammer Pwr vs. Freq. (Pulse 72us On, 1ms PRI)
Jammer Pwr [dBm]
Fre
q. [M
Hz]
0
5
10
15
20
25
-68 -66 -64 -62 -60 -58 -56 -54 -52 -50 -48 -46 -442645
2649
2653
2657
2661
2665
UE DL, Follow WB, 2665 MHz, 10MHz BW: BLER vs. Jammer Pwr vs. Freq. (Pulse 72us On, 1ms PRI)
Jammer Pwr [dBm]
Fre
q.
[MH
z]
0
10
20
30
40
50
60
70
80
90
ATC Radar in long range mode
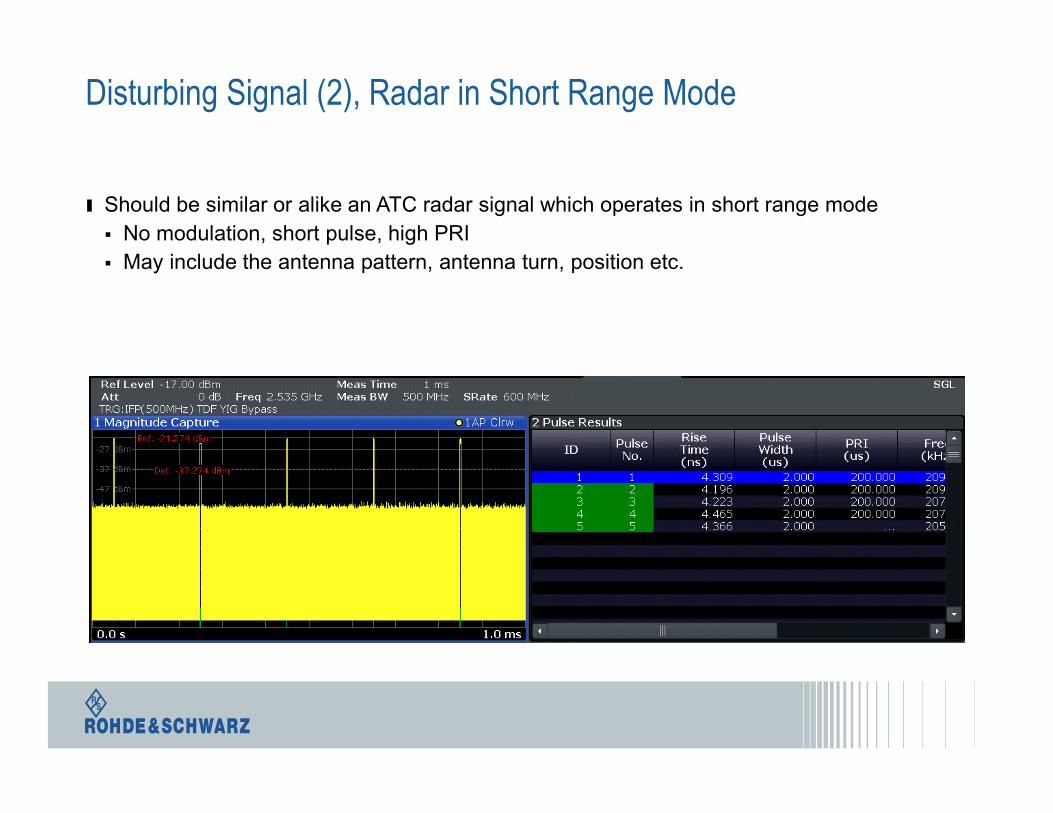
Disturbing Signal (2), Radar in Short Range Mode
ı Should be similar or alike an ATC radar signal which operates in short range mode
No modulation, short pulse, high PRI
May include the antenna pattern, antenna turn, position etc.
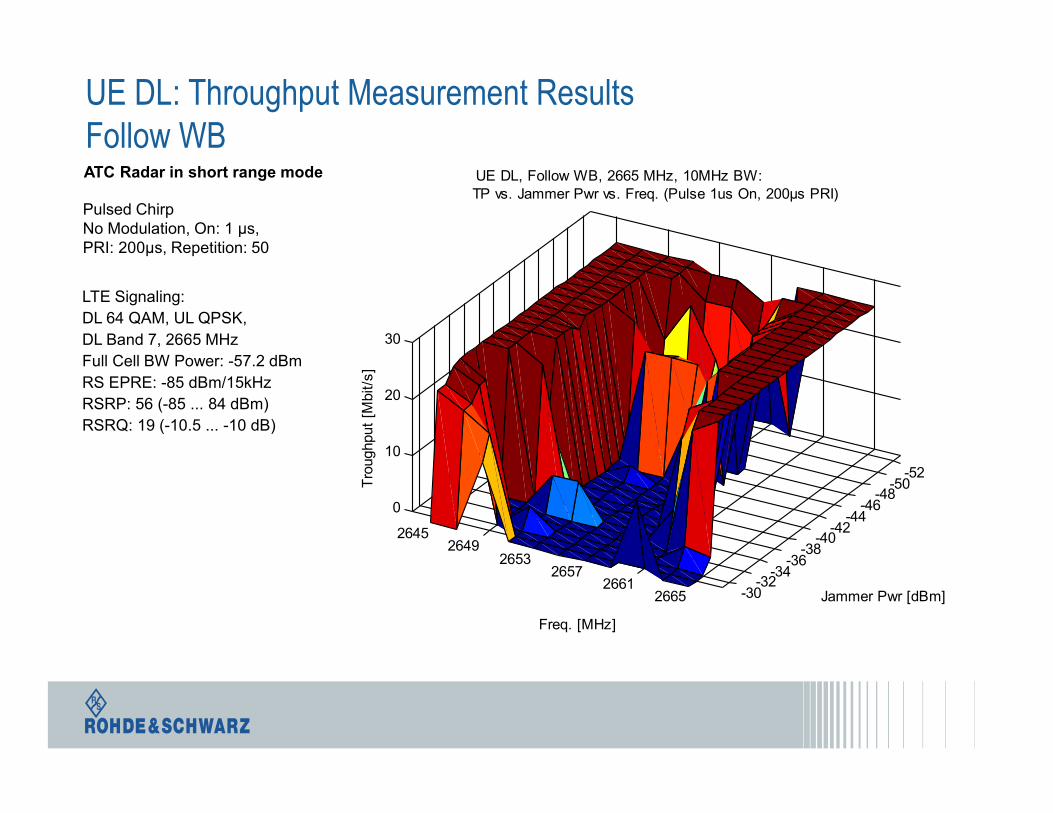
UE DL: Throughput Measurement ResultsFollow WB
-52-50
-48-46
-44-42
-40-38
-36-34
-32-30
26452649
26532657
26612665
0
10
20
30
Jammer Pwr [dBm]
UE DL, Follow WB, 2665 MHz, 10MHz BW: TP vs. Jammer Pwr vs. Freq. (Pulse 1us On, 200µs PRI)
Freq. [MHz]
Tro
ughput
[Mbit/s
]
LTE Signaling:
DL 64 QAM, UL QPSK,
DL Band 7, 2665 MHz
Full Cell BW Power: -57.2 dBm
RS EPRE: -85 dBm/15kHz
RSRP: 56 (-85 ... 84 dBm)
RSRQ: 19 (-10.5 ... -10 dB)
Pulsed Chirp No Modulation, On: 1 µs, PRI: 200µs, Repetition: 50
ATC Radar in short range mode
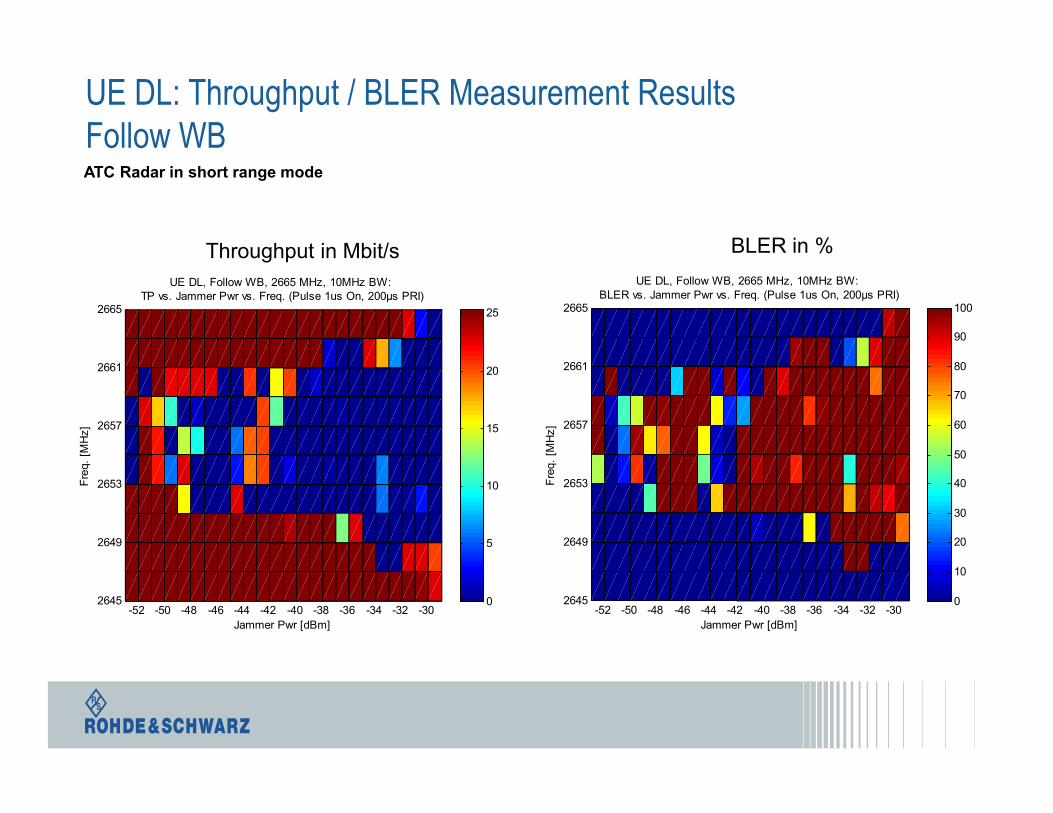
UE DL: Throughput / BLER Measurement ResultsFollow WB
-52 -50 -48 -46 -44 -42 -40 -38 -36 -34 -32 -302645
2649
2653
2657
2661
2665
UE DL, Follow WB, 2665 MHz, 10MHz BW: TP vs. Jammer Pwr vs. Freq. (Pulse 1us On, 200µs PRI)
Jammer Pwr [dBm]
Fre
q.
[MH
z]
0
5
10
15
20
25
-52 -50 -48 -46 -44 -42 -40 -38 -36 -34 -32 -302645
2649
2653
2657
2661
2665
UE DL, Follow WB, 2665 MHz, 10MHz BW: BLER vs. Jammer Pwr vs. Freq. (Pulse 1us On, 200µs PRI)
Jammer Pwr [dBm]
Fre
q.
[MH
z]
0
10
20
30
40
50
60
70
80
90
100
Throughput in Mbit/s BLER in %
ATC Radar in short range mode
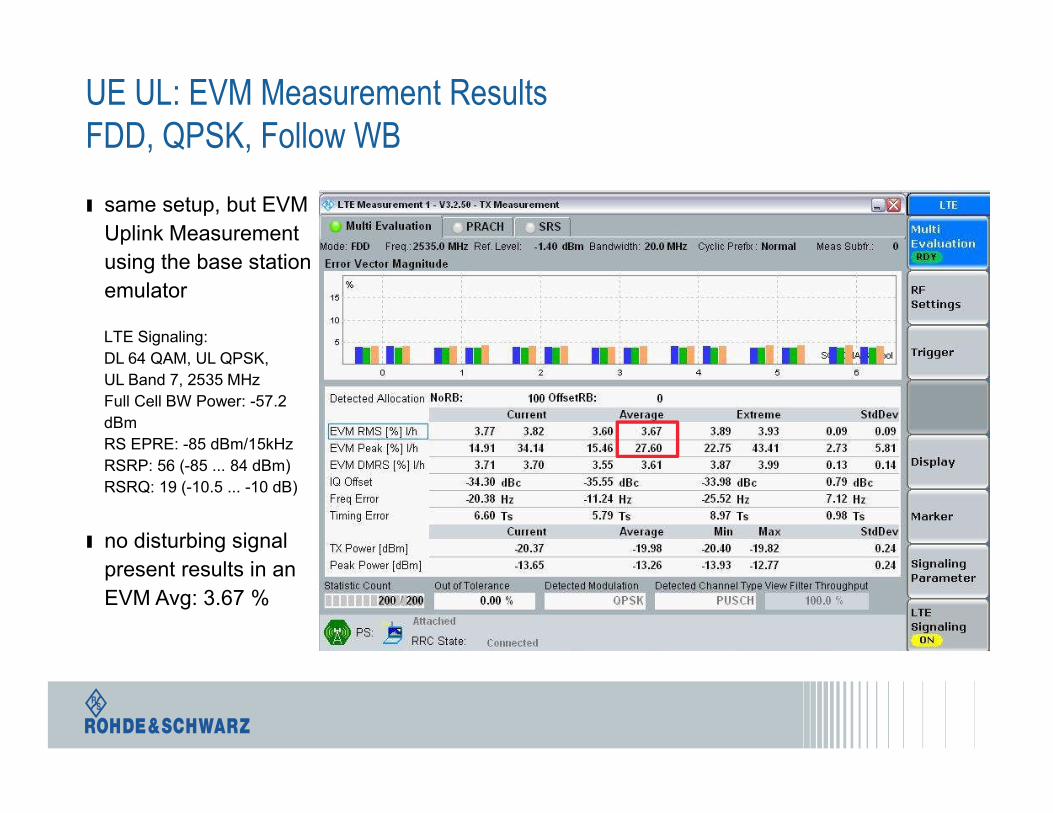
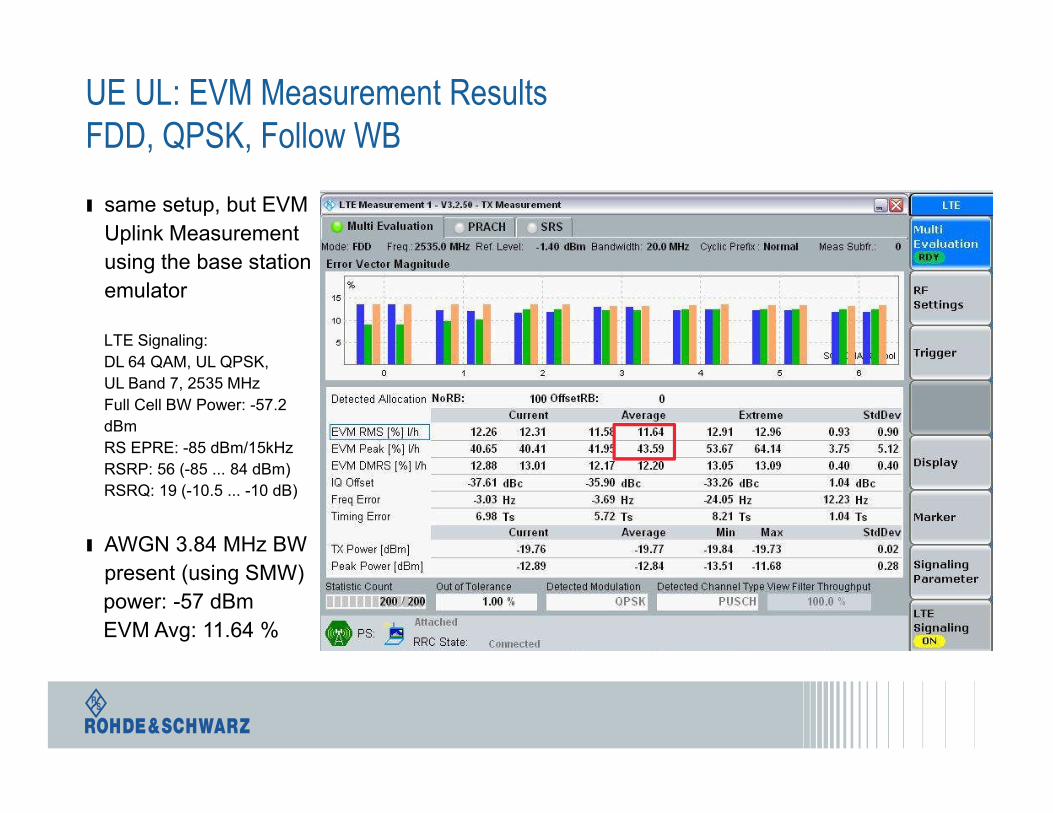
ı same setup, but EVM
Uplink Measurement
using the base station
emulator
LTE Signaling:
DL 64 QAM, UL QPSK,
UL Band 7, 2535 MHz
Full Cell BW Power: -57.2
dBm
RS EPRE: -85 dBm/15kHz
RSRP: 56 (-85 ... 84 dBm)
RSRQ: 19 (-10.5 ... -10 dB)
ı no disturbing signal
present results in an
EVM Avg: 3.67 %
UE UL: EVM Measurement ResultsFDD, QPSK, Follow WB
ı same setup, but EVM
Uplink Measurement
using the base station
emulator
LTE Signaling:
DL 64 QAM, UL QPSK,
UL Band 7, 2535 MHz
Full Cell BW Power: -57.2
dBm
RS EPRE: -85 dBm/15kHz
RSRP: 56 (-85 ... 84 dBm)
RSRQ: 19 (-10.5 ... -10 dB)
ı AWGN 3.84 MHz BW
present (using SMW)
power: -57 dBm
EVM Avg: 11.64 %
UE UL: EVM Measurement ResultsFDD, QPSK, Follow WB

UE UL: EVM Measurement ResultsFDD, QPSK, Follow WB
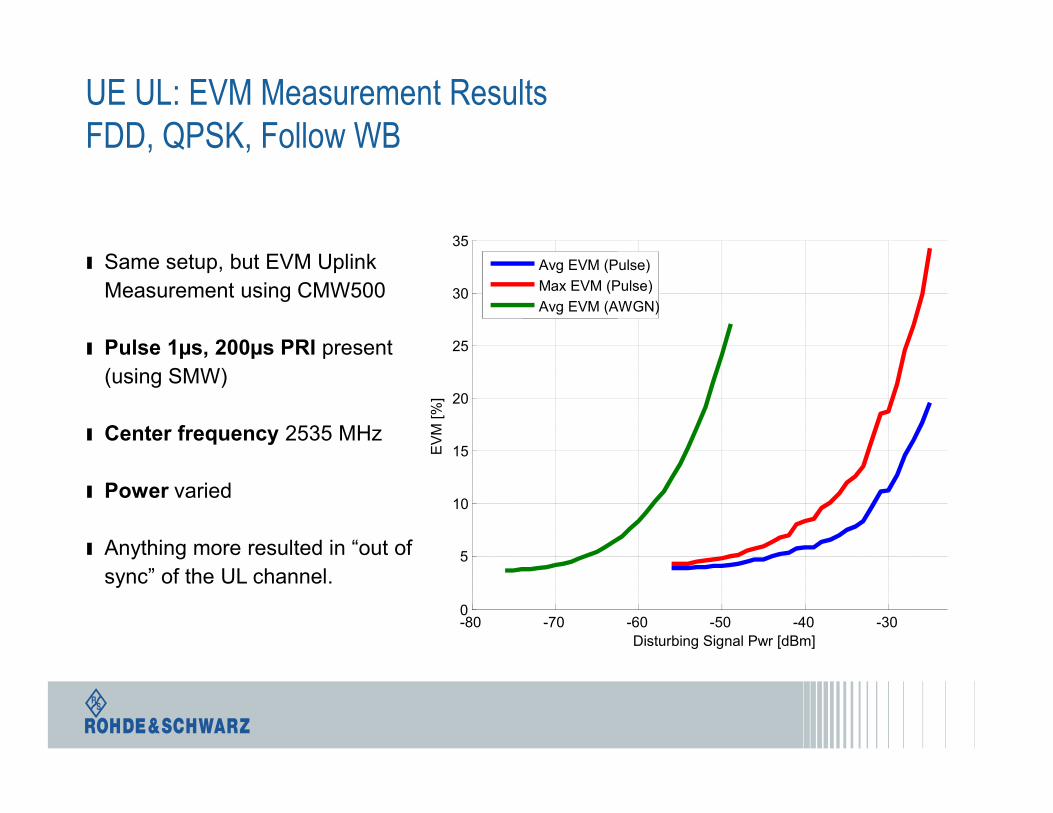
ı Same setup, but EVM Uplink
Measurement using CMW500
ı AWGN 20 MHz BW present (using
Vector Signal Generator)
ı Center frequency 2535 MHz
ı Power varied from -78 to -48 dBm
ı Anything more than -48 dBm
AWGN power resulted in “out of
sync” of the UL channel.
-80 -75 -70 -65 -60 -55 -50 -450
5
10
15
20
25
30
EV
M [
%]
Noise Power [dBm]
UE UL: EVM vs. Noise Pwr (AWGN 20 MHz BW)
Avg
UE UL: EVM Measurement ResultsFDD, QPSK, Follow WB
ı Same setup, but EVM Uplink
Measurement using CMW500
ı Pulse 1µs, 200µs PRI present
(using SMW)
ı Center frequency 2535 MHz
ı Power varied
ı Anything more resulted in “out of
sync” of the UL channel.
-80 -70 -60 -50 -40 -300
5
10
15
20
25
30
35
EV
M [
%]
Disturbing Signal Pwr [dBm]
Avg EVM (Pulse)
Max EVM (Pulse)
Avg EVM (AWGN)
Measurement Setups to test the Radar
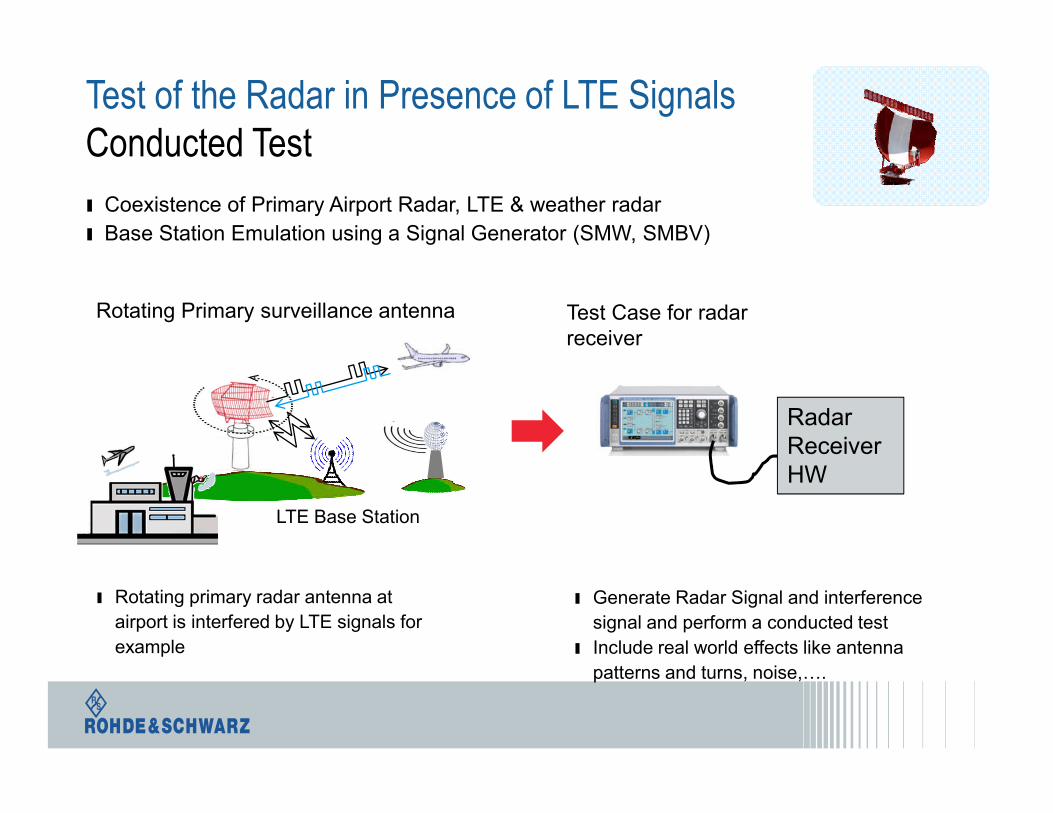
Test of the Radar in Presence of LTE SignalsConducted Test
ı Coexistence of Primary Airport Radar, LTE & weather radar
ı Base Station Emulation using a Signal Generator (SMW, SMBV)
Rotating Primary surveillance antenna
LTE Base Station
ı Rotating primary radar antenna at
airport is interfered by LTE signals for
example
Radar ReceiverHW
ı Generate Radar Signal and interference
signal and perform a conducted test
ı Include real world effects like antenna
patterns and turns, noise,….
Test Case for radarreceiver

Test of the Radar in Presence of LTE SignalsConducted Test using Pulse Sequencer
2D Map for gaming area
(drag & drop positioning of players)
Sequence(s)
Frequency Offset
Antenna Pointing
2D gaming area
Beam
Emitter N
Mode 1
Emitter 2 Emitter 1
Mode 1Mode 1
BeamBeam
Antenna Pattern & ScanAntenna Pattern & ScanAntenna Pattern & Scan
ı Receiver
ı Interferer
ı Emitters
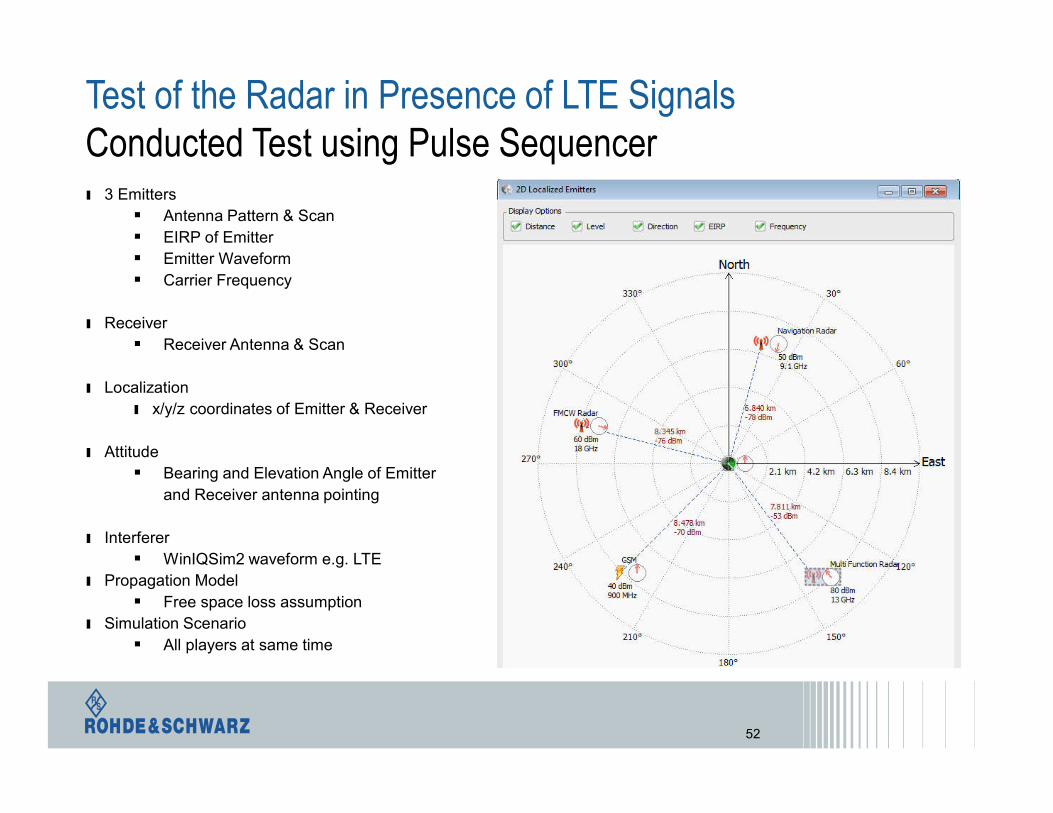
Test of the Radar in Presence of LTE SignalsConducted Test using Pulse Sequencer
52
ı 3 Emitters
Antenna Pattern & Scan
EIRP of Emitter
Emitter Waveform
Carrier Frequency
ı Receiver
Receiver Antenna & Scan
ı Localization
ı x/y/z coordinates of Emitter & Receiver
ı Attitude
Bearing and Elevation Angle of Emitter
and Receiver antenna pointing
ı Interferer
WinIQSim2 waveform e.g. LTE
ı Propagation Model
Free space loss assumption
ı Simulation Scenario
All players at same time
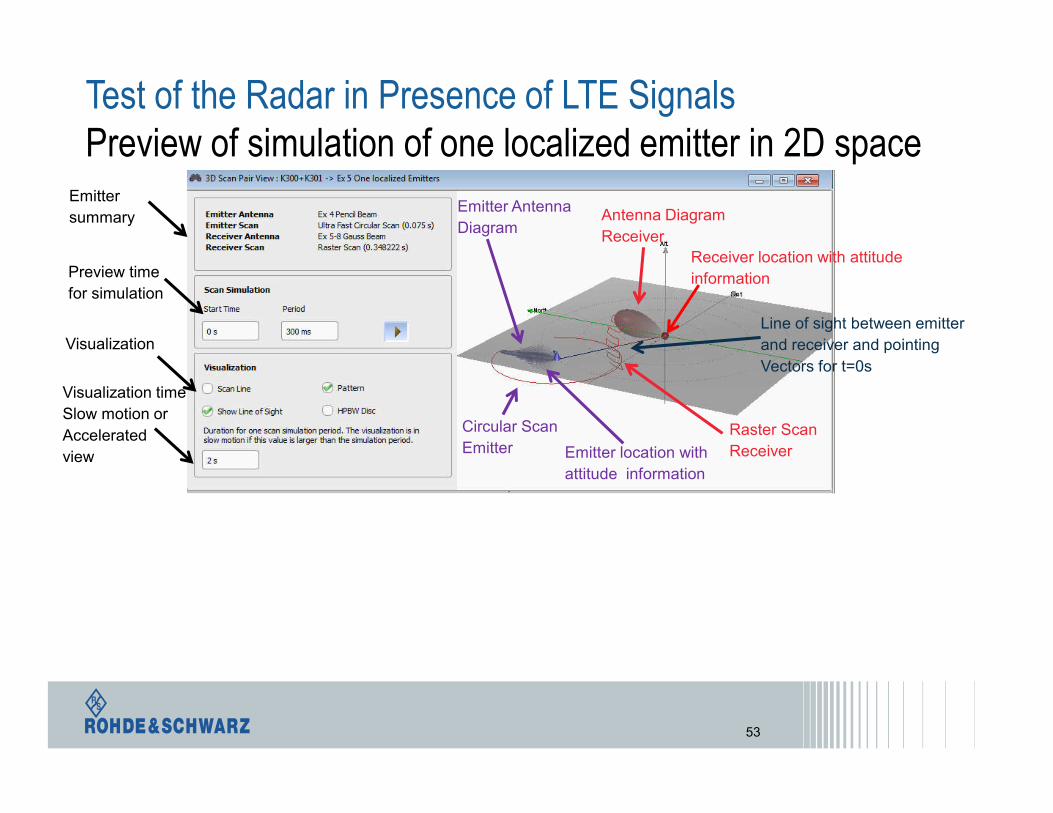
Test of the Radar in Presence of LTE Signals Preview of simulation of one localized emitter in 2D space
53
Line of sight between emitter
and receiver and pointing
Vectors for t=0s
Antenna Diagram
Receiver
Raster Scan
Receiver
Receiver location with attitude
information
Circular Scan
Emitter
Emitter Antenna
Diagram
Emitter location with
attitude information
Preview of normalized receive antenna output signal amplitude
Preview time
for simulation
Emitter
summary
Visualization
Visualization time
Slow motion or
Accelerated
view
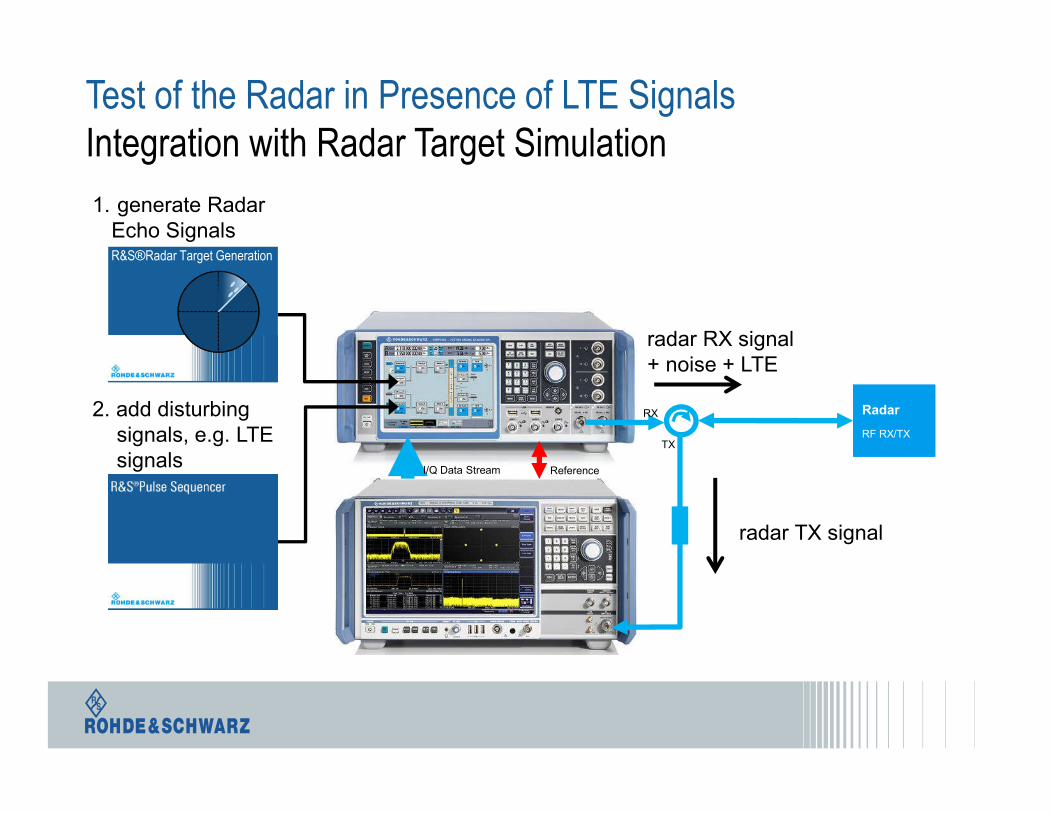
Test of the Radar in Presence of LTE SignalsIntegration with Radar Target Simulation
I/Q Data Stream Reference
Radar
RF RX/TX
RX
TX
R&S®Radar Target Generation
1. generate Radar Echo Signals
2. add disturbing signals, e.g. LTE signals
radar TX signal
radar RX signal+ noise + LTE
55
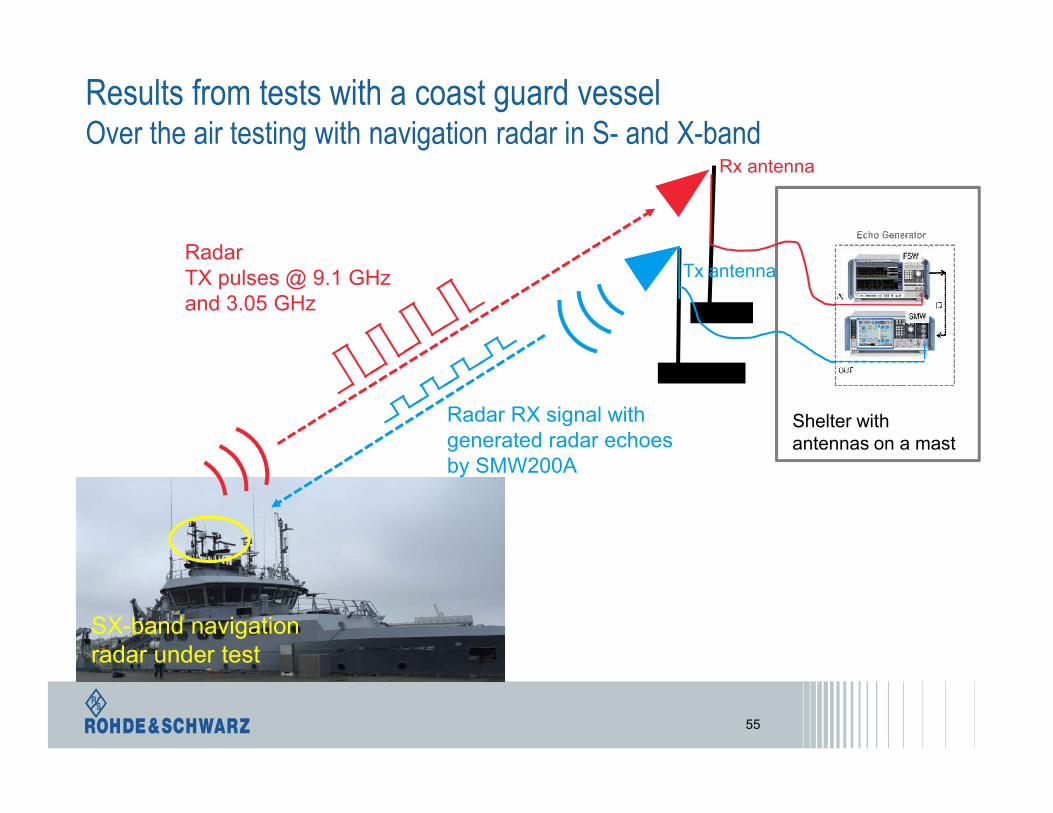
Results from tests with a coast guard vesselOver the air testing with navigation radar in S- and X-band
SX-band navigationradar under test
Shelter withantennas on a mast
Tx antenna
Rx antenna
Radar TX pulses @ 9.1 GHzand 3.05 GHz
Radar RX signal with generated radar echoesby SMW200A
56
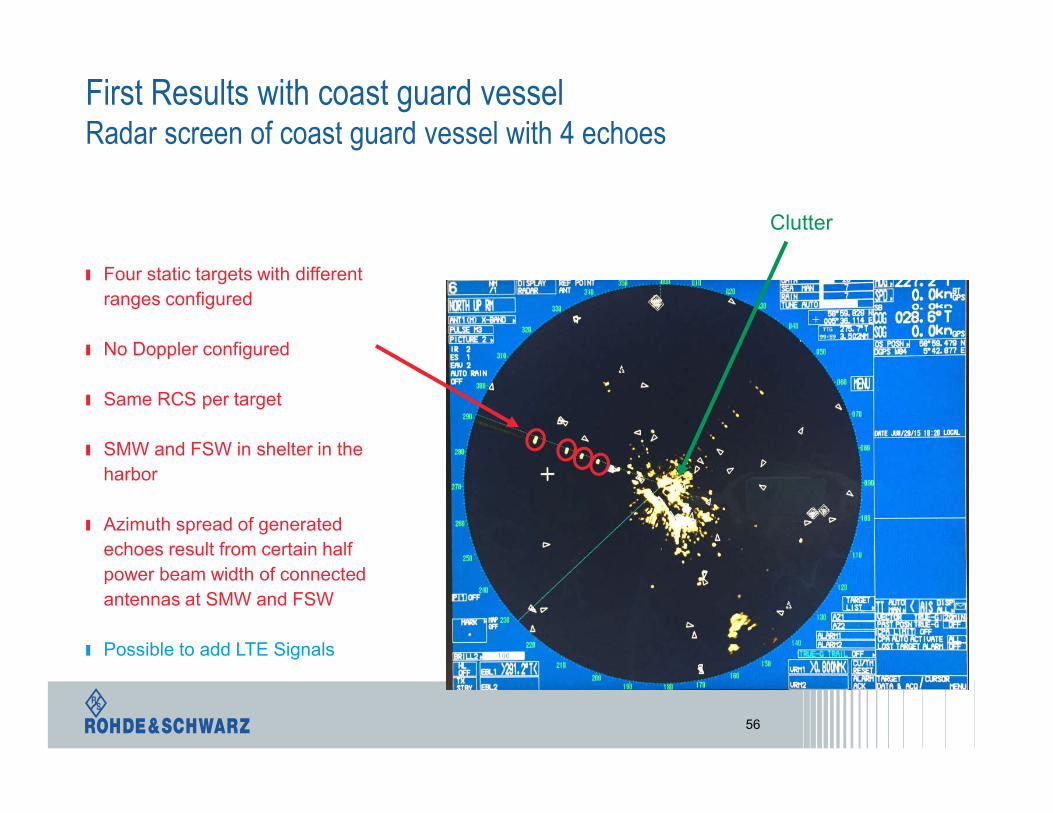
First Results with coast guard vesselRadar screen of coast guard vessel with 4 echoes
ı Four static targets with different
ranges configured
ı No Doppler configured
ı Same RCS per target
ı SMW and FSW in shelter in the
harbor
ı Azimuth spread of generated
echoes result from certain half
power beam width of connected
antennas at SMW and FSW
ı Possible to add LTE Signals
Clutter
RX
TX
-10 dBm
-20 dBm
-30 dBm
-40 dBm
-50 dBm
-60 dBm
-70 dBm
-80 dBm
-90 dBm
SWT 15ms
1AP
Clrw
Ext
Ref 0.00 dBm
CF 115.0 MHz Span 120.0 MHz
Tx Channel Standard: NONE
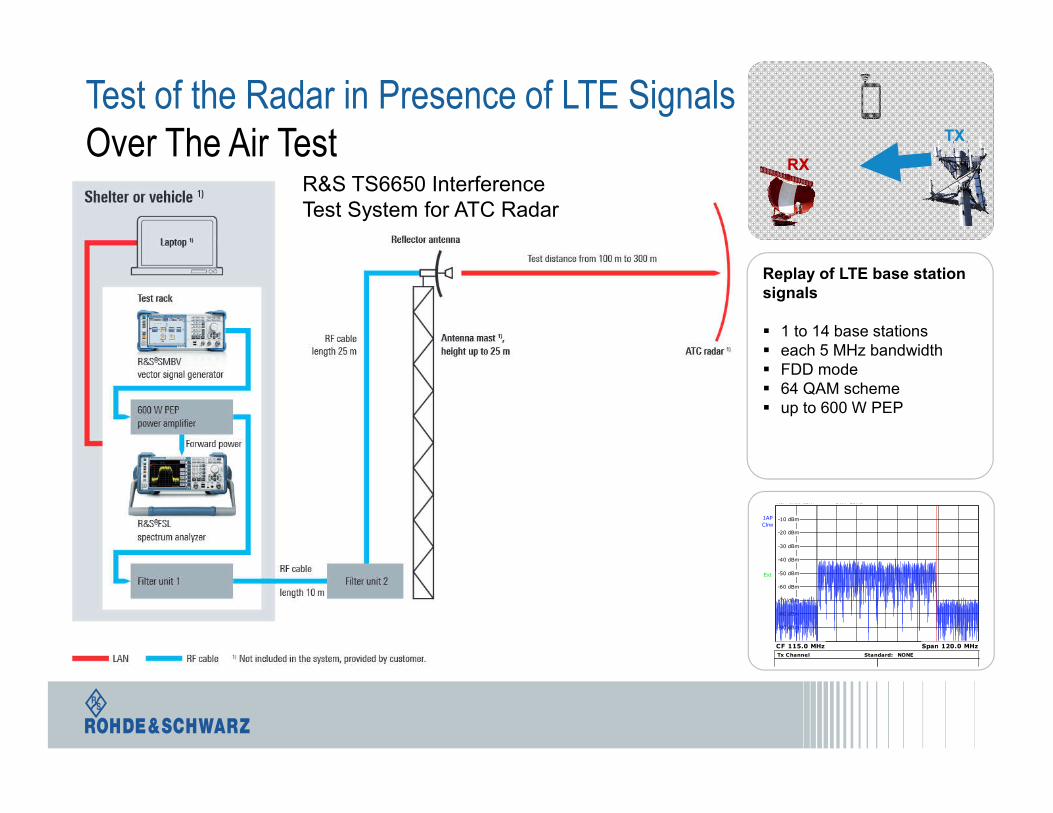
Replay of LTE base station signals
1 to 14 base stations each 5 MHz bandwidth FDD mode 64 QAM scheme up to 600 W PEP
R&S TS6650 Interference Test System for ATC Radar
Test of the Radar in Presence of LTE SignalsOver The Air Test
RX
TX
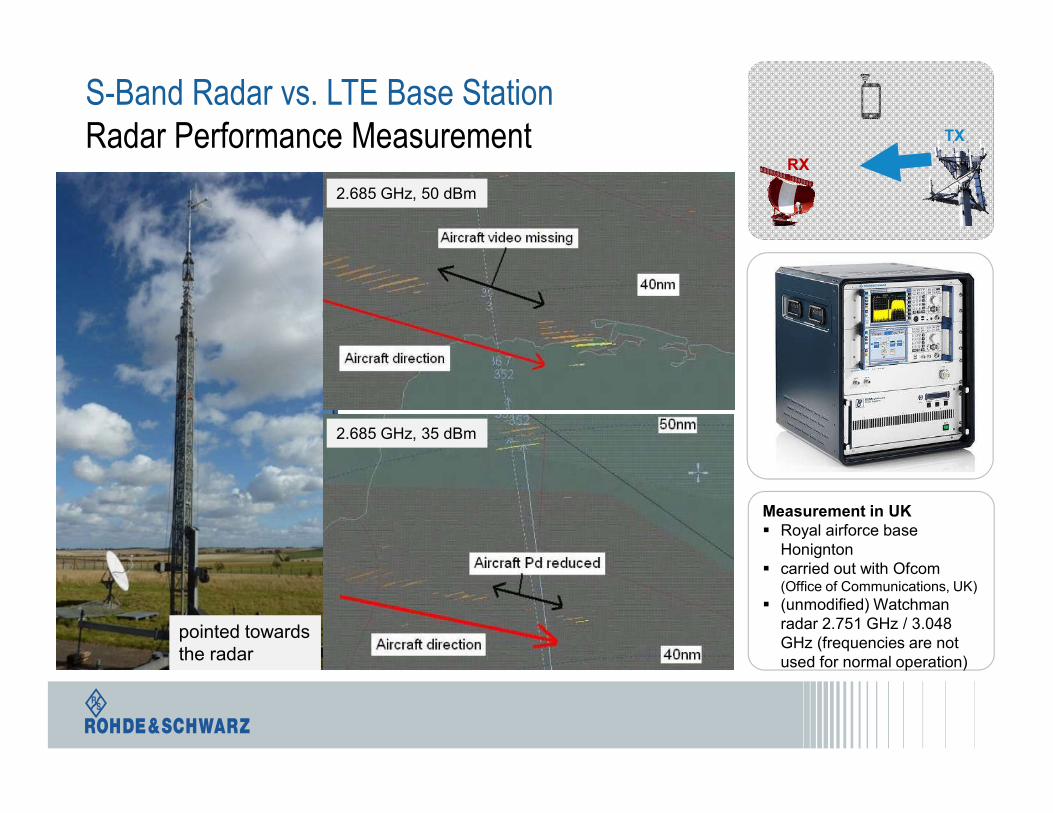
Measurement in UK Royal airforce base
Honignton carried out with Ofcom
(Office of Communications, UK)
(unmodified) Watchman radar 2.751 GHz / 3.048 GHz (frequencies are not used for normal operation)
S-Band Radar vs. LTE Base Station Radar Performance Measurement
2.685 GHz, 35 dBm
2.685 GHz, 50 dBm
pointed towardsthe radar
Summary
ı LTE Networks and S-Band Radar
ı Interference Scenarios
ı Measurements Possibilities
LTE Base Station Emulator + Record and Replay
LTE Base Station Emulator + Pulse Sequencer Software
Radar Target Generation
ı Measurement Results
LTE Mobiles operating at 2.6 GHz with 20 MHz bandwidth
throughput reduction, BLER increase, CQI decrease
S-Band ATC Radar
reduced probability of detection and reduced maximum range