Embed Size (px)
Citation preview

NEBRASKA
MIGRANT EDUCATION PROGRAM
Nebraska Department of Education Comprehensive Needs Assessment
2015

1
Thanks to the Nebraska CNA Update Committee
The following individuals gave freely of their time, expertise, and resources to participate as members of the Nebraska CNA Update Committee.
Nebraska Department of Education (NDE) Representatives Dr. Mary Ann Losh – Leadership Council, Nebraska Department Education Sue Henry – Education Specialist, Nebraska Department of Education Lindsay Ickes – Education Specialist, Nebraska Department of Education Deb Romanek – Mathematics, Nebraska Department of Education Terri Schuster – Title III/ELL Assessment, Nebraska Department of Education
Diane Kvasnicka, Early Childhood Education, Nebraska Department of Education
MEP Directors/Staff
Cheryl Feeken, Program Coordinator (Crete) Dee Condon, MEP Director (ESU #7 ‐ Columbus) Larianne Polk, ESU Administrator (ESU #7 ‐ Columbus) Danielle Waite, Statewide MEP Data Coordinator (ESU #7 ‐ Columbus) Kiowa Rogers, MEP Director (ESU #13 ‐ Scottsbluff) Jamie Garner, MEP Director, Staff Development (ESU #15 ‐ McCook) Veronica Estevez, MEP State PAC, MEP Quality Control (ESU #15 ‐ McCook) Amanda Levos, ELL and Migrant Services Coordinator (Grand Island) Alan Ehlers, MEP Director, Superintendent (Madison) Susan Mayberger, MEP Director, Coordinator of ESL and Refugee (Omaha) Suzanne Wetzel, ESL/Migrant Teacher Trainer (Omaha) MEP Students and Parents Migrant Parents (sample of parents interviewed/surveyed) Migrant Secondary Students and Out‐of‐School Youth (sample interviewed/surveyed) Facilitators Dr. Susan Durón – Consultant, META Associates Cari Semivan – Consultant, CS Consulting
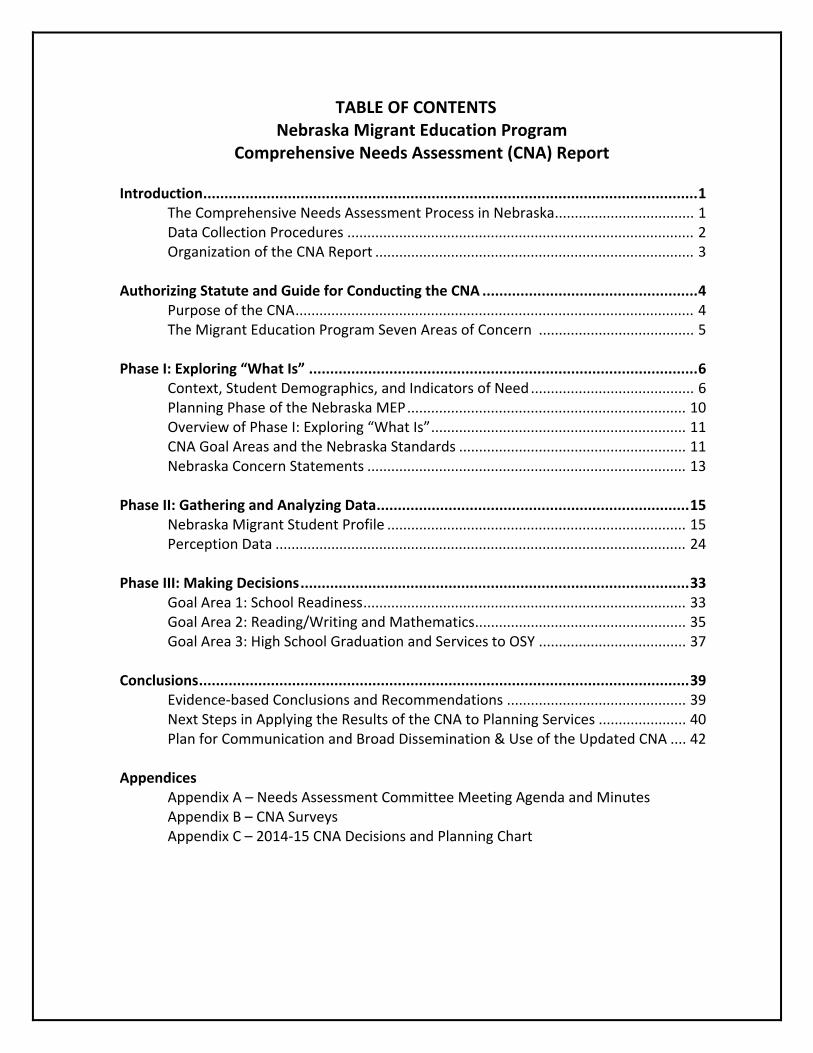
TABLE OF CONTENTS Nebraska Migrant Education Program
Comprehensive Needs Assessment (CNA) Report
Introduction ..................................................................................................................... 1 The Comprehensive Needs Assessment Process in Nebraska ................................... 1 Data Collection Procedures ....................................................................................... 2 Organization of the CNA Report ................................................................................ 3 Authorizing Statute and Guide for Conducting the CNA ................................................... 4 Purpose of the CNA .................................................................................................... 4 The Migrant Education Program Seven Areas of Concern ....................................... 5
Phase I: Exploring “What Is” ............................................................................................ 6
Context, Student Demographics, and Indicators of Need ......................................... 6 Planning Phase of the Nebraska MEP ...................................................................... 10 Overview of Phase I: Exploring “What Is” ................................................................ 11 CNA Goal Areas and the Nebraska Standards ......................................................... 11 Nebraska Concern Statements ................................................................................ 13 Phase II: Gathering and Analyzing Data .......................................................................... 15
Nebraska Migrant Student Profile ........................................................................... 15 Perception Data ....................................................................................................... 24 Phase III: Making Decisions ............................................................................................ 33
Goal Area 1: School Readiness ................................................................................. 33 Goal Area 2: Reading/Writing and Mathematics ..................................................... 35 Goal Area 3: High School Graduation and Services to OSY ..................................... 37 Conclusions .................................................................................................................... 39 Evidence‐based Conclusions and Recommendations ............................................. 39
Next Steps in Applying the Results of the CNA to Planning Services ...................... 40 Plan for Communication and Broad Dissemination & Use of the Updated CNA .... 42 Appendices
Appendix A – Needs Assessment Committee Meeting Agenda and Minutes Appendix B – CNA Surveys Appendix C – 2014‐15 CNA Decisions and Planning Chart

List of Acronyms and Abbreviations
ABE Adult Basic Education AYP Adequate Yearly Progress CAMP College Assistance Migrant Program CBO Community‐Based Organization CLC 21st Century Community Learning Centers COE Certificate of Eligibility CNA Comprehensive Needs Assessment DIBELS Dynamic Indicators of Basic Early Literacy Skills DOB Date of Birth ECE Early Childhood Education ELDA English Language Development Assessment ELL English Language Learner ESEA Elementary and Secondary Education Act ESL English as a Second Language ESU Educational Service Unit FERPA Family Educational Rights and Privacy Act FTE Full Time Equivalent GED General Equivalency Diploma GR Grade HEP High School Equivalency Program HS High School ID&R Identification and Recruitment IDEA Individuals with Disabilities Education Act IEP Individualized Education Plan KDG Kindergarten (also abbreviated as K) LAS Language Assessment Scales LEA Local Education Agency LEP Limited English Proficient LOA Local Operating Agency MEP Migrant Education Program MIS2000 Nebraska’s data record transfer/retrieval system MSIX Migrant Student Information Exchange System NCLB No Child Left Behind Act of 2001 NDE Nebraska Department of Education NE Nebraska NeSA Nebraska State Accountability NRG Non Regulatory Guidance NRT Norm‐Reference Test OME Office of Migrant Education OSY Out‐of‐school Youth

PAC Parent Advisory Council PALS Preschool Ability Language Screening PASS Portable Assisted Study Sequence PFS Priority for Services PK Pre‐Kindergarten QAD Qualifying Arrival Date PPVT Peabody Picture Vocabulary Test RE Resident Only RTI Response to Intervention SAY Secondary‐aged Youth SDP Service Delivery Plan SPED Special Education SY School Year

1 | P a g e
INTRODUCTION The Comprehensive Needs Assessment Process in Nebraska The goal of the Nebraska Migrant Education Program (MEP) is to provide leadership to the field regarding programs and services that promote academic excellence and equity for the migrant students and youth of Nebraska. To achieve this goal, the Nebraska MEP strives to create conditions which empower educators working with migrant children to collaborate in designing programs which build upon student strengths, eliminate barriers, provide continuity of education, and produce levels of performance for migrant students that meet or exceed those of the general student population. The Nebraska MEP helps migrant children and youth overcome challenges of mobility, frequent absences, late enrollment into school, social isolation, and other difficulties associated with a migratory life, so they can succeed in school. Furthermore, the Nebraska MEP must give priority for services to migrant children and youth who are failing, or most at risk of failing to meet the state’s content and performance standards, and whose education has been interrupted during the regular school year. While there is considerable flexibility in using MEP funds, they must be used to address the unmet needs of migrant children that result from migrant children’s lifestyle to permit them to participate effectively in school. The children of migrant, mobile agricultural workers and fishers often have needs that are different from those of the English learner (EL) population due to high poverty, high mobility, and interrupted schooling. This fact makes it necessary to understand the needs of the migrant population as distinct from the EL population and design services (through the service delivery planning process) that meet those unique needs. In order to better understand and articulate the specific services that the Nebraska MEP should target to migrant children and youth and their families, a comprehensive assessment of needs was once again completed as part of a thorough review of the entire statewide MEP. A Comprehensive Needs Assessment (CNA) was conducted, as required, to review and improve the overall design of the Nebraska MEP. Specifically, the CNA aims to: Identify and assess “the unique educational needs of migratory children that result from
the children’s migratory lifestyle” and other needs that must be met in order for migratory children to participate effectively in school (ESEA, Section 1304, 34 CFR 200.83 (a)(2)(i,ii)):
Guide the overall design of the MEP on a statewide basis; Help local operating agencies and the SEA prioritize needs of migrant children; and Provide the basis for the SEA to subgrant MEP funds.
The Nebraska CNA will guide future programming and policy decisions to ensure that the program’s resources are directed at the most needed and most effective services for migrant children and youth and their families.

2 | P a g e
The CNA process used in Nebraska followed the three‐phase implementation model (see Exhibit 1) suggested by the Office of Migrant Education (OME). This model, along with the suggested implementation guide framework, was modified to fit the specific needs of the Nebraska CNA process. The Nebraska process included both the assessment of needs and the identification of potential solutions at the three levels that follow.
Level #1: Service Receivers (i.e., migrant students and parents) Level #2: Service Providers and Policymakers (i.e., State and local MEP staff) Level #3: Resources (i.e., the system that facilitates or impedes the efforts of MEP staff)
Data Collection Procedures LEA subgrantees compile data based on the educational record and perceived needs of every migratory child enrolled in their programs and enter that data into MIS2000. In addition to the LEA data, considerable needs assessment information is generated in homebase states and transferred to Nebraska through MSIX. Examples of data received from homebase states include age‐appropriate grade placement of Nebraska migrant students, information on the number of migrant students not meeting grade level proficiency, language proficiency determinations, and state assessment results. In addition, various other data collection methods were employed to assess needs and identify solutions. These methods included: surveys conducted with MEP site directors, MEP staff, recruiters, and migrant students
and parents; reviews of State assessment results in reading and mathematics with comparisons made
between migrant students and non‐migrant peers; reports on achievement and credit accrual toward high school graduation generated
through MSIX; reports on preschool student achievement of readiness skills as measured by school
readiness assessments; and
Exhibit 1 Three-phase Model for CNA
3 | P a g e
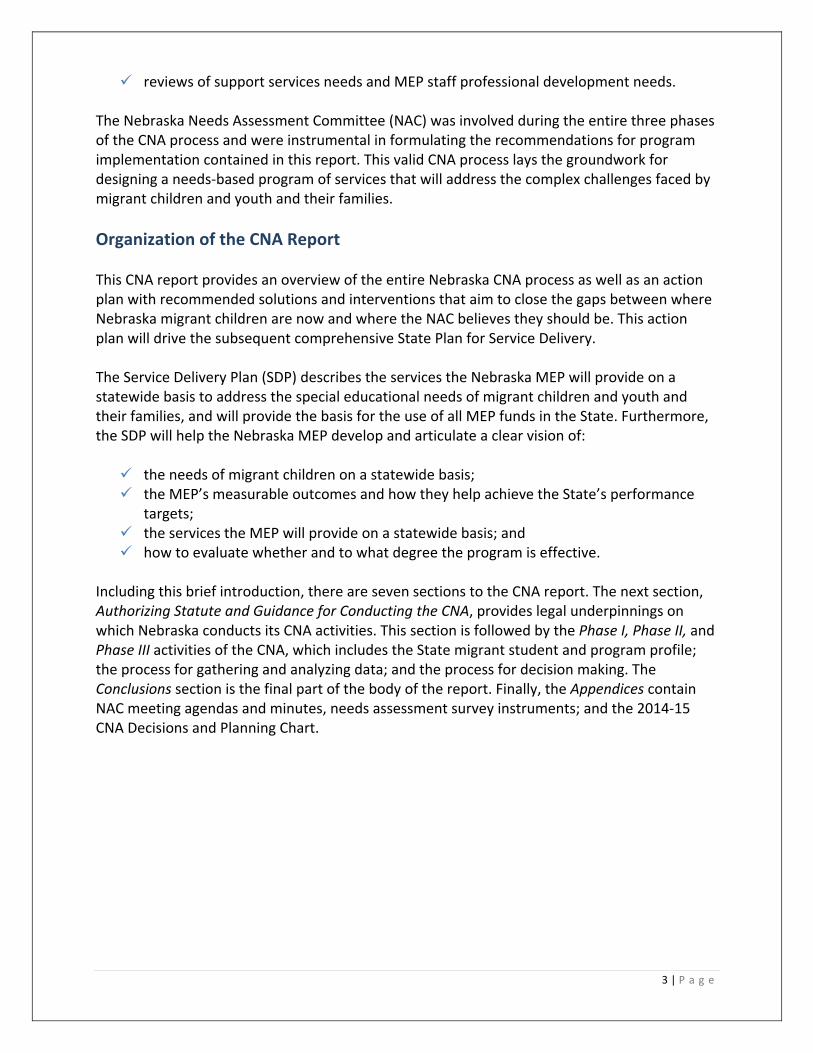
reviews of support services needs and MEP staff professional development needs. The Nebraska Needs Assessment Committee (NAC) was involved during the entire three phases of the CNA process and were instrumental in formulating the recommendations for program implementation contained in this report. This valid CNA process lays the groundwork for designing a needs‐based program of services that will address the complex challenges faced by migrant children and youth and their families.
Organization of the CNA Report This CNA report provides an overview of the entire Nebraska CNA process as well as an action plan with recommended solutions and interventions that aim to close the gaps between where Nebraska migrant children are now and where the NAC believes they should be. This action plan will drive the subsequent comprehensive State Plan for Service Delivery. The Service Delivery Plan (SDP) describes the services the Nebraska MEP will provide on a statewide basis to address the special educational needs of migrant children and youth and their families, and will provide the basis for the use of all MEP funds in the State. Furthermore, the SDP will help the Nebraska MEP develop and articulate a clear vision of: the needs of migrant children on a statewide basis; the MEP’s measurable outcomes and how they help achieve the State’s performance
targets; the services the MEP will provide on a statewide basis; and how to evaluate whether and to what degree the program is effective.
Including this brief introduction, there are seven sections to the CNA report. The next section, Authorizing Statute and Guidance for Conducting the CNA, provides legal underpinnings on which Nebraska conducts its CNA activities. This section is followed by the Phase I, Phase II, and Phase III activities of the CNA, which includes the State migrant student and program profile; the process for gathering and analyzing data; and the process for decision making. The Conclusions section is the final part of the body of the report. Finally, the Appendices contain NAC meeting agendas and minutes, needs assessment survey instruments; and the 2014‐15 CNA Decisions and Planning Chart.

4 | P a g e
AUTHORIZING STATUTE AND GUIDANCE FOR
CONDUCTING THE CNA
A Migrant Education Program (MEP) Comprehensive Needs Assessment (CNA) is required by the Office of Migrant Education of the U.S. Department of Education under Section 1306 of the Elementary and Secondary Education Act, reauthorized as the No Child Left Behind Act of 2001 (NCLB), Title I Part C, Section 1304(1) and 2(2). States must address the special educational needs of migratory children in accordance with a comprehensive State plan that: is integrated with other programs under the NCLB and may be submitted as part of the
State consolidated application; provides that migratory children will have an opportunity to meet the same challenging
State academic content standards and challenging State student academic achievement standards that all children are expected to meet;
specifies measurable program goals and outcomes; encompasses the full range of services that are available for migrant children from
appropriate local, State, and Federal educational programs; is the product of joint planning among such local, State, and Federal programs, including
programs under Part A, early childhood programs, and language instruction programs; and
provides for the integration of available MEP services with other Federal‐, State‐, or locally‐operated programs.
The CNA must be periodically reviewed and revised, as necessary, to reflect changes in the State’s strategies and programs provided under NCLB.
Purpose of the CNA The State MEP has flexibility in implementing the CNA through its local operating agencies, except that funds must be used to meet the identified needs of migrant children that result from their migratory lifestyle. The purpose of the CNA is to: 1) focus on ways to permit migrant children with priority for services (PFS) to participate effectively in school; and 2) meet migrant student needs not addressed by services available from other Federal or non‐Federal programs. Policy guidance issued by OME states that needs assessments must be conducted annually and use the best information available. The needs assessment serves as the blueprint for establishing statewide priorities for local procedures and provides a basis for the State to allocate funds to local operating agencies. The CNA should take a systematic approach that progresses through a defined series of phases, involving key stakeholders such as migrant parents and students (as appropriate), educators and administrators of programs that serve migrant students, content area experts, and other individuals critical to ensuring commitment and follow‐up.
5 | P a g e
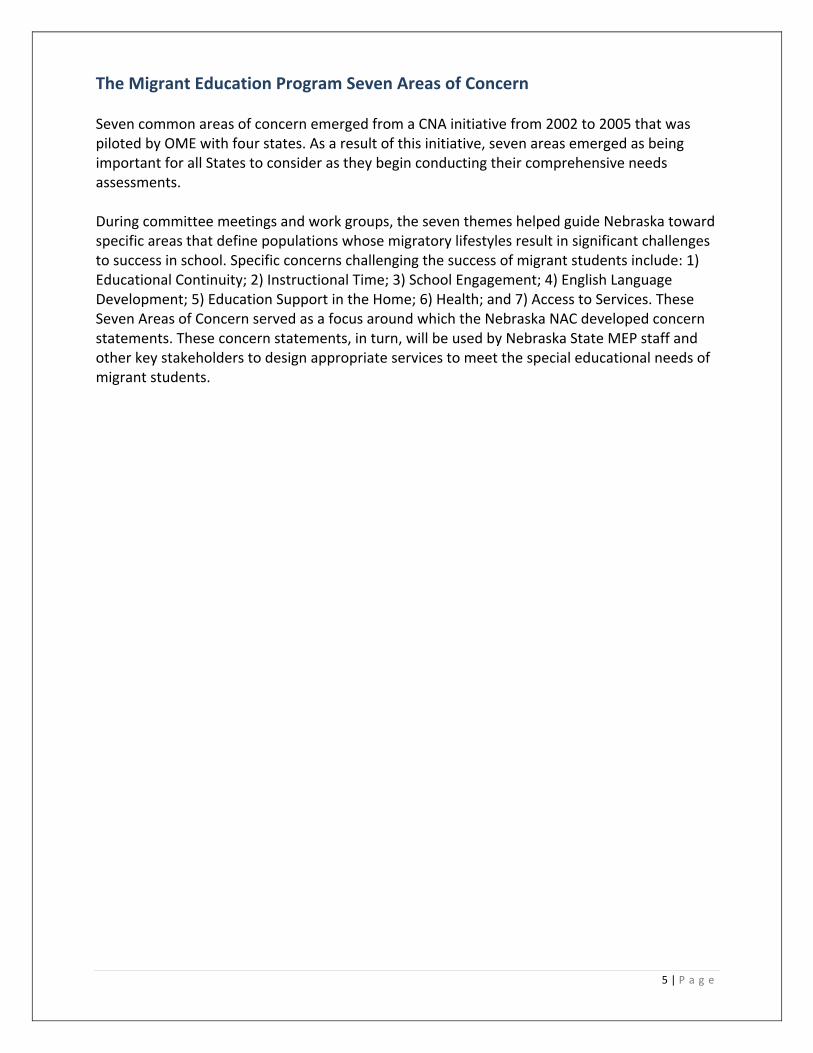
The Migrant Education Program Seven Areas of Concern Seven common areas of concern emerged from a CNA initiative from 2002 to 2005 that was piloted by OME with four states. As a result of this initiative, seven areas emerged as being important for all States to consider as they begin conducting their comprehensive needs assessments. During committee meetings and work groups, the seven themes helped guide Nebraska toward specific areas that define populations whose migratory lifestyles result in significant challenges to success in school. Specific concerns challenging the success of migrant students include: 1) Educational Continuity; 2) Instructional Time; 3) School Engagement; 4) English Language Development; 5) Education Support in the Home; 6) Health; and 7) Access to Services. These Seven Areas of Concern served as a focus around which the Nebraska NAC developed concern statements. These concern statements, in turn, will be used by Nebraska State MEP staff and other key stakeholders to design appropriate services to meet the special educational needs of migrant students.

6 | P a g e
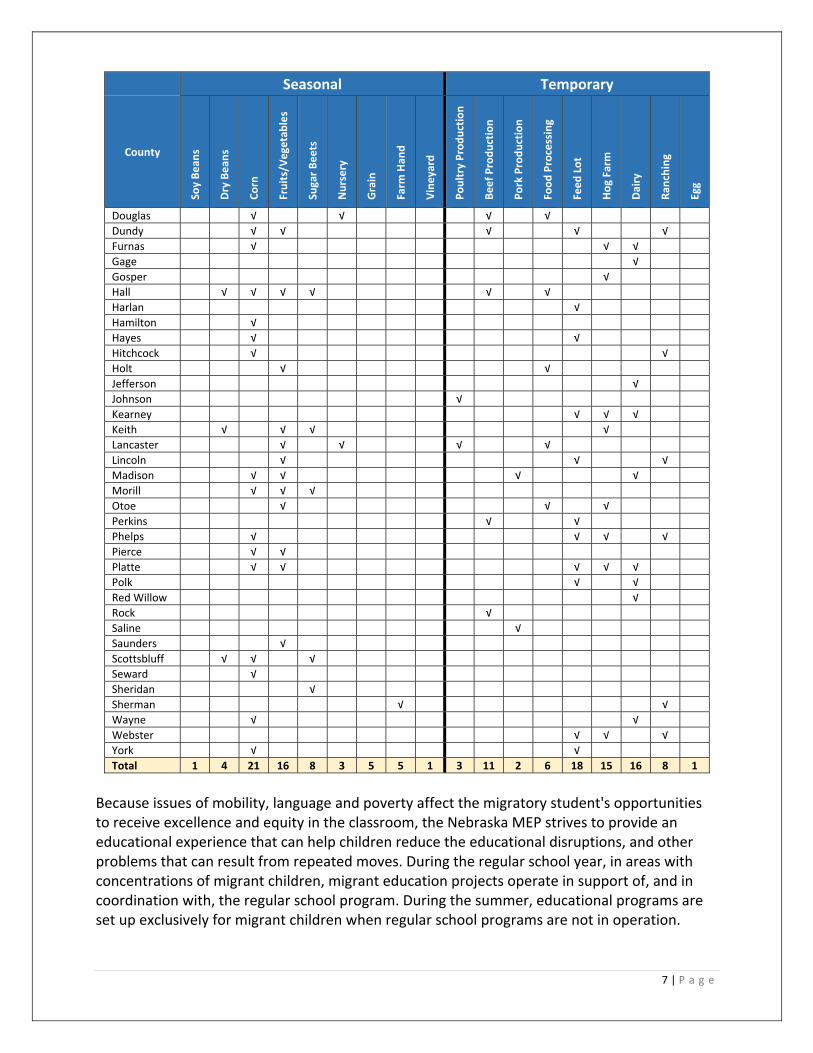
PHASE I: EXPLORING “WHAT IS” Context, Student Demographics, and Indicators of Need Prior to the first Needs Assessment Committee (NAC) meeting, a profile of migrant students, demographics, and achievement was compiled from state data sources including Nebraska MEP Annual Evaluation Reports for the past few years, new 2013‐14 data submitted to the evaluator, Consolidated State Performance Reports for the past few years, and the Nebraska Identification and Recruitment Handbook. The profile helped the NAC gain an understanding of the characteristics and unique challenges experienced by the migrant student population in Nebraska. In addition, the NAC provided information about the context of migratory work in the State of Nebraska. In addition to migrant students migrating within the State of Nebraska, the majority of Nebraska’s migrant students migrate from Mexico, Texas, California, Colorado, Iowa, and Florida (in that order). The work encountered by migrant families is varied. Qualifying agricultural and fishing activities cover a broad spectrum of crops and industries. Below are the seasonal and temporary qualifying activities by county in Nebraska. Only the counties with activities are listed. Seasonal/temporary activities occurring the most include corn (21 counties), feed lots (18 counties), fruits/vegetables and dairy (16 counties), and hog farms (15 counties).
Exhibit 2 Nebraska Qualifying Activities by County
Seasonal Temporary
County
Soy Bean
s
Dry Bean
s
Corn
Fruits/Vegetables
Sugar Beets
Nursery
Grain
Farm
Han
d
Vineyard
Poultry Production
Beef Production
Pork Production
Food Processing
Feed Lot
Hog Farm
Dairy
Ran
ching
Egg
Adams √ √ √ √
Antelope √ √ √
Box Butte √ √ √ √ √ √ √
Brown √ √ √
Buffalo √ √ √ √ √ √
Butler √
Cedar √ √
Chase √ √ √ √ √ √
Cheyenne √
Clay √ √ √
Colfax √ √ √ √
Cuming √
Custer √ √ √
Dakota √
Dawes √
Dawson √ √ √ √ √ √
Dixon √ √ √ √ √
7 | P a g e
Seasonal Temporary
County
Soy Bean
s
Dry Bean
s
Corn
Fruits/Vegetables
Sugar Beets
Nursery
Grain
Farm
Han
d
Vineyard
Poultry Production
Beef Production
Pork Production
Food Processing
Feed Lot
Hog Farm
Dairy
Ran
ching
Egg
Douglas √ √ √ √
Dundy √ √ √ √ √
Furnas √ √ √
Gage √
Gosper √
Hall √ √ √ √ √ √
Harlan √
Hamilton √
Hayes √ √
Hitchcock √ √
Holt √ √
Jefferson √
Johnson √
Kearney √ √ √
Keith √ √ √ √
Lancaster √ √ √ √
Lincoln √ √ √
Madison √ √ √ √
Morill √ √ √
Otoe √ √ √
Perkins √ √
Phelps √ √ √ √
Pierce √ √
Platte √ √ √ √ √
Polk √ √
Red Willow √
Rock √
Saline √
Saunders √
Scottsbluff √ √ √
Seward √
Sheridan √
Sherman √ √
Wayne √ √
Webster √ √ √
York √ √
Total 1 4 21 16 8 3 5 5 1 3 11 2 6 18 15 16 8 1
Because issues of mobility, language and poverty affect the migratory student's opportunities to receive excellence and equity in the classroom, the Nebraska MEP strives to provide an educational experience that can help children reduce the educational disruptions, and other problems that can result from repeated moves. During the regular school year, in areas with concentrations of migrant children, migrant education projects operate in support of, and in coordination with, the regular school program. During the summer, educational programs are set up exclusively for migrant children when regular school programs are not in operation.

8 | P a g e
The Nebraska MEP provides services to migrant students through 14 year‐round projects, with half of the projects providing an extended day component during the regular school year. Local sites implementing MEP projects include the following 14 sites. 1. Alliance 2. Crete 3. ESU #7 ‐ Columbus 4. ESU #13 –
Scottsbluff 5. ESU #15 – McCook 6. Fremont 7. Grand Island 8. Hastings 9. Lexington 10. Madison 11. Norfolk 12. Omaha 13. South Sioux City 14. Wakefield Projects provide instructional and support services aligned with the SDP and the CNA within the three goal areas of reading/writing and mathematics, school readiness, and graduation from high school and services to OSY. The primary components of the Nebraska MEP include academic services, supportive and supplemental services, parent involvement, interstate coordination, ID&R, and professional development, which are guided by the program applications/sub‐granting process, CNA, SDP, and the program evaluation. INSTRUCTIONAL SERVICES ‐ During the regular school year, migrant students are provided with a wide range of instructional services including the following:
Regular Year Supplementary Instructional Services
Math Tutoring Preschool
Reading Tutoring GED Preparation
Secondary Credit Accrual ESL Instruction
Other Instructional Services Distance Learning
Science and Social Studies Instruction Prevention Education
During the summer, migrant students are provided with a wide range of instructional services that include those listed below.
Summer Supplementary Instructional Services
Summer School GED Preparation
Math Instruction Preschool
Reading Instruction ESL Instruction
Secondary Credit Accrual Distance Learning
Other Instructional Services Services to OSY
Exhibit 3 Map of Nebraska’s MEP Sites

9 | P a g e
Summer Supplementary Instructional Services
Science/Social Studies Instruction Services to Binational Students
Prevention Education
SUPPORT SERVICES ‐ Supportive services are provided to migrant students to eliminate barriers that traditionally get in the way of school success. Support focuses on leveraging existing services during both the summer and regular year program. Support and supplemental services include collaboration with other agencies and referrals of migrant children from birth to age 21 to programs and supportive services. Examples of services include health services (medical and dental screening and referrals), instructional supplies, information and training on nutrition, translations and interpretations, advocacy and outreach, transportation, services to OSY, and family literacy programs. The needs‐based support services provided to students throughout the year are listed in the chart below.
Support Services
Referrals Youth Leadership Instructional Supplies
Career Counseling Life Skills Extended Learning Opportunities
Guidance Counseling Health Screenings Pre‐GED Programs
Transportation Health Services Interpreting/Translating
INTER/INTRASTATE COORDINATION ‐ Because migrant students move frequently, a central function of the MEP is to reduce the effects of educational disruption by removing barriers to their educational achievement. The MEP has been, and continues to be, a leader in coordinating resources and providing integrated services to migrant children and their families. MEP projects have also developed a wide array of strategies that enable schools that serve the same migrant students to communicate and coordinate with one another. In Nebraska, inter/intrastate collaboration focuses on the following activities:
providing year round ID&R;
participating as a partner state in the Math CIG;
participating in the OSY CIG;
serving as the lead state for the Binational/Technology CIG;
participating in the Binational Migrant Education Initiative (BMEI);
participating in the Binational Migrant Teacher Exchange;
coordinating secondary education coursework (e.g., PASS, NovaNET, University of Texas‐UT curriculum);
participating in MSIX to transfer education and health data to participating states;
coordinating secondary credit accrual with counselors and educators in other states in which students are enrolled; and
attending inter‐ and intra‐state migrant education meetings.
As part of the NCLB requirements for Title I, Part C, every State must set its priorities for services; likewise, every MEP in every State is required to maintain a list of eligible migrant students, migrant students served, and migrant students designated as having Priority for Services (PFS). Determining which migrant students are PFS is put into place through the SDP

10 | P a g e
as part of the State activity in which Nebraska sets its performance goals, targets, and benchmarks to ensure the appropriate delivery of migrant student services. The definition for PFS described below is used to determine if migrant child or youth will be considered as PFS and serves as the PFS number used in the MEP funding formula. Migrant children identified as PFS are those who (1) are failing, or most at risk of failing, to meet Nebraska’s challenging State academic content and student achievement standards, and (2) whose education has been interrupted during the regular school year (MEP sites are asked to indicate with a check mark in the MIS2000 database). According to the instructions outlined by the Nebraska MEP, migrant children coded as PFS should be given priority for services. Students considered at risk may have one or more of the following risk factors:
Credit deficient
Retained
Individual Education Plan (IEP)
Limited English proficient
Not proficient on state assessments
Out‐of‐school youth
Modal grade
Poor attendance
Reading deficient
Pre‐kindergarten not served Planning Phase of the Nebraska CNA The Nebraska CNA was designed to develop an understanding of the unique educational needs and educationally‐related needs of Nebraska migrant students, youth, and families. Not only does this analysis of needs provide a foundation for the future direction of the Nebraska MEP through the Comprehensive State Service Delivery Plan, but it also supports the overall continuous improvement and quality assurance processes of the Nebraska MEP and the overall State Plan. The needs analysis was adapted to the resources and structures available in the State. The Preparation Phase of the Nebraska CNA involved two major objectives:
1. Garner a sense of commitment to the needs assessment in all levels of the Nebraska Migrant Education Program; and
2. Gain an assurance that decision makers will follow‐up by using the findings in an appropriate and timely manner.
The Nebraska Migrant Education Program staff assisted in the development of the CNA by CS Consulting. The State MEP management plan defined the structure for the NAC, delineated various roles and responsibilities, and contained a calendar of meeting dates and timelines for tasks to be completed. The Nebraska NAC was charged with 1) guiding the needs assessment process; 2) setting priorities; and 3) making policy recommendations and internal process decisions that affect planning and implementation. NAC members reflect a broad range of stakeholders that include state personnel, state MEP staff, site directors, teachers, content area experts, recruiters, data specialists, migrant parents, and migrant students. After NAC membership was solidified, the MEP Director implemented the final step in management planning, the logistical plan. CNA Update meetings were

11 | P a g e
developed specifying the requirements for the meetings, meeting goals, and the anticipated activities. The tasks for the meetings were laid out in an Implementation Guide.
Overview of Phase I: Exploring “What Is” The purpose of Phase I was to: 1) investigate what already is known about the special educational needs of migrant students, youth, and families in Nebraska; 2) determine the focus and scope of the CNA; and 3) gain commitment for all stages of the CNA including the use of the findings for program planning and implementation. The term special educational needs describes educationally‐related needs that result from a migratory lifestyle that must be met in order for migrant children to participate effectively in school. The CNA process: Includes both needs identification and the assessment of potential solutions; Addresses all relevant goals established for migrant children to ensure migrant children
have the opportunity to meet the same challenging standards as their peers; Identifies the needs of migrant children at a level useful for program design purposes; Collects data from appropriate target groups; and Examines needs data disaggregated by key subgroups.
Again, the primary purpose of the CNA is to guide the overall design of the Nebraska MEP on a statewide basis as well as to assure that the findings of the CNA are folded into the Comprehensive State Plan for Service Delivery. The Service Delivery Plan (SDP) is designed to help the Nebraska MEP develop and articulate a clear vision of: 1) the needs of Nebraska migrant children; 2) the Nebraska MEP’s measurable program outcomes and how they help achieve the State’s performance targets; 3) the services the Nebraska MEP will provide on a statewide basis; and 4) how to evaluate whether and to what degree the program is effective.
CNA Goal Areas and the Nebraska Standards During the NAC meetings on November 5, 2014 and February 11, 2015, the Committee addressed the following: The CNA planning cycle and the roles/responsibilities of the NAC; Existing data and information to make determinations about the needs of migrant
students; Goal areas for the MEP and preliminary concern statements; and Decisions on next steps in the planning cycle.
The NAC reviewed the goal areas originally established by OME. It then indicated how the needs of Nebraska migrant students fit within these broad categories and combined areas of need that NAC practitioners and content area experts found necessary. The Nebraska Standards provide a guide to delivering challenging and meaningful content to students that prepares them for success in life. In consideration of State standards and OME recommendations for the CNA, the three goal areas established by the NAC follow:

12 | P a g e
Goal 1: School Readiness Goal 2: Reading/Writing and Mathematics Goal 3: High School Graduation and Services to OSY Upon agreeing to these three goals for improving Nebraska migrant student achievement, each goal was explored in relation to the Seven Areas of Concern established by OME and ensured that concerns and solutions aligned both with the Nebraska Standards and the concerns typically associated with frequent migrancy. The seven recommended areas of concern and the Nebraska context for these concerns are described below. 1. Educational Continuity—Because migrant students often are forced to move during the
regular school year and experience interruptions due to absences, students tend to encounter a lack of educational continuity. Nebraska migrant students may move from rural to more urban areas during the course of the year and experience differences in curriculum, expectations, articulation of skills, and other differences in school settings. The cumulative impact of educational discontinuity is daunting. Efforts to overcome this pattern of incoherence are needed to strengthen educational continuity.
2. Time for Instruction—Mobility also impacts the amount of time students spend in class and their attendance patterns. Such decreases in the time students spend engaged in learning leads to lower levels of achievement. Identifying methods for ameliorating the impact of family mobility and delays in enrollment procedures is essential.
3. School Engagement—Various factors relating to migrancy impact student engagement in school. Students may have difficulty relating the school experience to the experience of day‐to‐day subsistence in rural areas. Those moving into different areas may encounter cultural misunderstandings and bias because of moving into a community where many do not share their background.
4. English Language Development—English language development is critical for academic success. Typically about 40% of Nebraska’s migrant students are considered English learners (ELs). The MEP must find avenues to supplement the difficulties faced by migrant students in the process of learning English due to their unique lifestyle, while not supplanting Title III activities.
5. Education Support in the Home—Home environment often is associated with a child’s success in school, reflecting exposure to reading materials, a broad vocabulary, and educational games and puzzles. Such resources reflect parent educational background and socio‐economic status. While many migrant parents value education for their children, they may not always know how to support their children in a manner consistent with school expectations nor have the means to offer an educationally rich home environment.
6. Health—Good health is a basic need that migrant students often do not possess. The compromised dental and nutritional status of migrant children is well documented. They have higher proportions of acute and chronic health problems and exhibit higher childhood and infant mortality rates than those experienced by their non‐migrant peers. Migrant

13 | P a g e
children are at greater risk than other children due to injuries at camp sites, lack of access to health care facilities, and poverty. Families often need assistance in addressing health problems that interfere with the student’s ability to learn.
7. Access to Services—The many rural and isolated locations in which migrant students live in Nebraska often decreases access to educational and educationally‐related services to which migrant children and their families are entitled. Because migrant students and their families move often, often times speak a language other than English, and travel to isolated locations, they often do not have access to the same programs and learning materials available to most other students in the nation.
Nebraska Concern Statements During the CNA Update meeting, the NAC reviewed their previously‐developed concern statements in each of the three goal areas, updated the statements based on additional data and input, and categorized needs according to the seven concern areas. The development of the concern statements followed an eight‐step protocol as well as specific criteria on how to write the statements. The final concern statements, in order of importance as ranked by the committee, are listed in Exhibit 4.
Exhibit 4 Nebraska Concern Statements
Goal 1: School Readiness Area of Concern
1‐1 We are concerned that migrant preschoolers, especially English learners (ELs), do not have access to free, quality early childhood programs and therefore do not have the school readiness skills to be prepared for kindergarten and beyond
EC, IT, AS, ELD
1‐2 We are concerned that migrant children encounter barriers to school readiness including, but not limited to, lack of medical/dental care, and lack of transportation
H, AS, IT
1‐3 We are concerned that migrant preschool children in short term (i.e., summer) and non‐school programs are not receiving needs‐based school readiness services due to a lack of a quick, available assessment
EC, IT
1‐4 We are concerned that while migrant parents value education for their children, they may not know the importance of a preschool education, or have the skills/access to resources to support their children in a manner consistent with school expectations and academic success
AS, ESH, EC, IT
Goal 2: Reading/Writing and Mathematics Area of Concern
2‐1 We are concerned that migrant students, especially English learners/ PFS students, have gaps in their education that lead to skill deficiencies and lower proficiency rates on state reading and math assessments.
EC, IT, SE, ELD
2‐2 We are concerned that MEP and school staff (i.e., daytime classroom teachers, classified staff, office staff) lack the skills and strategies to support the unique educational needs, cultural identity, language, and life experiences of migrant students and their parents
SE, ELD
2‐3 We are concerned that migrant parents lack skills to help their children develop educational skills at home and lack access to academic supports (i.e., materials, literature, literacy supports, technology, and community service providers)
AS, ESH

14 | P a g e
2‐4 We are concerned that migrant students have unmet support services needs such as medical/ dental care, mental health services, and transportation that impact participation in school and MEP services which has a direct impact on attendance and academic achievement
H, AS, IT
2‐5 We are concerned that migrant students are not participating in migrant‐funded extended academic learning opportunities
AS, EC, IT
Goal 3: High School Graduation and Services to OSY Area of Concern
3‐1 We are concerned that MEP staff lack knowledge of skills and strategies for engaging and supporting secondary students and OSY
SE
3‐2 We are concerned that migrant secondary students, especially ELs/PFS students, have a lack of information about credits, grades, and academic accomplishments resulting in a lower graduation rate than their peers due to mobility, school district priorities, and inappropriate strategies
EC, IT, SE, ELD
3‐3 We are concerned that OSY are not aware of the MEP instructional services available to obtain their educational goals, or credits and competencies needed for graduation due to mobility, or the constraints of school districts
SE, IT, AS, EC
3‐4 We are concerned that migrant secondary students, OSY, and parents lack knowledge of options after high school including postsecondary education and career opportunities
SE, AS, ESH
3‐5 We are concerned that migrant secondary students and OSY have unmet support services needs such as counseling, health care, and mental health services that result in a lack of social and emotional skills needed to be successful in school and in the workplace
SE
Areas of Concern: EC=Educational Continuity; IT=Instructional Time; SE=School Engagement; ELD=English language development; ESH=Educational Support in the Home; H=Health; AS=Access to Services

15 | P a g e
PHASE II: GATHERING AND ANALYZING DATA
In the second phase of the CNA process, the key objectives were to build a comprehensive understanding of the gaps between Nebraska migrant students and all other students in the State and post solutions based on achievement and perceptional data. Three broad categories of Nebraska migrant student data were targeted: 1) demographic data; 2) achievement data; and 3) stakeholder perception data. Demographic and achievement data were drawn from MIS2000 (the state migrant student database), the Consolidated State Performance Report (CSPR), and the 2012‐13 and 2013‐14 Annual Evaluations of the Nebraska MEP. Perception data were collected from migrant staff and parents via surveys. A copy of the data collection instruments can be found in Appendix A. The Nebraska Migrant Student Profile found below and all other data included in this CNA has been updated to include the most recent data from 2013‐14.
Nebraska Migrant Student Profile
Exhibit 5 Nebraska MEP Student Profile (data from 2013‐14)
Data Element Statistic
1 Total Number of Eligible Migrant Students (ages 0‐21) 5,429
2 Migrant Students Classified as Having Priority for Services (PFS) 1,247 (23%)
3 Migrant Students Classified as Limited English Proficient (LEP) 1,876 (35%)
4 Migrant Students Classified as Having a Disability under Part B/C of the IDEA 244 (4%)
5 Migrant Students with a Qualifying Arrival Date (QAD) within 12 months of the last day of the performance period
1,386 (26%)
6 Migrant Out‐of‐School Youth (OSY) 313 (6%)
7 Migrant Students Served during the Performance Period 3,523 (65%)
8 Instructional Services Received During the Performance Period 1,140 (32%)
9 Support Services Received During the Performance Period 3,459 (98%)
10 Counseling Services Received During the Performance Period 492 (14%)
11 Referred Services Received During the Performance Period 1,234 (35%)
12 Migrant Students Served during the Regular School Year 2,793 (51%)
13 PFS Migrant Students Served during the Regular School Year 839 (67%)
14 Migrant Students Served during the Summer 1,732 (32%)
15 PFS Migrant Students Served during the Summer 342 (27%)
16 Migrant Student Graduation Rate (Non‐migrant rate is 89.7%) 73.3%
17 PFS Migrant Student Graduation Rate 51.7%
18 Non‐PFS Migrant Student Graduation Rate 73.9%
19 Migrant Student Dropout Rate (Non‐migrant rate is 1.11%) 2.04%
20 PFS Migrant Student Dropout Rate 1.38%
21 Non‐PFS Migrant Student Dropout Rate 2.49%
22 Percent of Migrant Students in grades K‐8 Scoring Proficient or Above on the NeSA‐Reading (Note: All students 77%)
48%
23 Percent of Non‐PFS Migrant Students in grades K‐8 Scoring Proficient or Above on the NeSA‐Reading
54%

16 | P a g e
Data Element Statistic
24 Percent of PFS Migrant Students in grades K‐8 Scoring Proficient or Above on the NeSA‐Reading
33%
25 Percent of Migrant Students in grades K‐8 Scoring Proficient or Above on the NeSA‐Math (Note: All students 71%)
46%
26 Percent of Non‐PFS Migrant Students in grades K‐8 Scoring Proficient or Above on the NeSA‐Math
51%
27 Percent of PFS Migrant Students in grades K‐8 Scoring Proficient or Above on the NeSA‐Math
31%
Needs assessment data were collected from the 14 LEA subgrantees; MEP staff, student, and parent needs assessment surveys; and Nebraska MEP databases. Needs assessment data include: 1) qualifying arrival date (QAD) and other demographic data; 2) academic skills test results; 3) state standards‐based assessment results; 4) secondary credit accrual needs; 5) MEP support service needs; 6) professional development needs; and 7) parent/family needs. Migrant Student Demographics One factor closely related to school failure is mobility. Nebraska gathered information on the QAD of migrant students. During 2013‐14, the Nebraska MEP identified 5,429 migrant children, students, and youth. Of these students, 1,386 (26%) had a QAD that occurred within 12 months from the last day of the performance period, and 919 students (17%) had a QAD that occurred during the regular school year within the performance period. As in previous years, OSY and children birth to age two had the highest percentage of QADs in this performance period. Migrant student demographics show that 23% were classified as having priority for services (PFS), 35% were limited English proficient (LEP), and 4% qualify for the Special Education Program (SPED). Thirty‐five percent (35%) of the eligible migrant students were in grades K‐5, 23% were age zero to five (not in kindergarten), 17% were in high school, 14% were in middle school, 6% were OSY, 5% were Resident‐only students, and <1% was considered ungraded.
Exhibit 6 Demographics of Migrant Students by Grade Level
Total
PFS LEP IDEA QAD w/in 12 months
QAD DuringReg Year
Grade Eligible # % # % # % # % # %
Birth‐2 295 ‐‐ ‐‐ ‐‐ ‐‐ 2 1% 151 51% 107 36%
Age 3‐5 949 169 18% 99 10% 26 3% 290 31% 191 20%
K 343 80 23% 184 54% 12 3% 63 18% 56 16%
1 300 74 25% 163 54% 13 4% 41 14% 34 11%
2 360 94 26% 200 56% 17 5% 58 16% 45 13%
3 327 91 28% 174 53% 16 5% 50 15% 47 14%
4 314 91 29% 161 51% 18 6% 43 14% 38 12%
5 263 74 28% 116 44% 21 8% 51 19% 45 17%
6 265 67 25% 129 49% 23 9% 38 14% 33 12%
7 249 64 26% 92 37% 25 10% 42 17% 38 15%
8 262 77 29% 100 38% 19 7% 46 18% 39 15%
9 291 94 32% 126 43% 18 6% 56 19% 51 18%

17 | P a g e
Total
PFS LEP IDEA QAD w/in 12 months
QAD DuringReg Year
Grade Eligible # % # % # % # % # %
10 218 68 31% 92 42% 10 5% 38 17% 33 15%
11 227 53 23% 109 48% 9 4% 22 10% 19 8%
12 163 43 26% 91 56% 8 5% 14 9% 13 8%
UG 9 4 44% 5 56% 1 11% 3 33% 3 33%
OSY 313 84 27% 13 4% 1 1% 128 41% 91 29%
RE* 281 20 7% 22 8% 5 2% 252 90% 35 12%
Total 5,429 1,247 23% 1,876 35% 244 4% 1,386 26% 919 17% Source: CSPR Part II School Year 2013‐14 *RE=Resident Only students arrive/depart during the summer months, not enrolled in a NE school district
Following is a graphic display of the eligible migrant youth at each of the 14 project sites. Omaha is the largest project in Nebraska, followed closely by ESU 7 (Columbus).
Exhibit 7 2013‐14 Local Project Migrant Child Count Totals
Exhibit 8 shows that 2,793 migrant students (51% of all migrant students eligible) were served during the regular school year, and 1,732 migrant students (32% of all migrant students eligible) were served during the summer. Two‐thirds of the PFS students (67%) were served during the regular school year, and 27% were served during the summer.
‐100 100 300 500 700 900 1100 1300
Wakefield
Madison
AllianceNorfolk
Fremont
S Sioux City
ESU 15Crete
Lincoln
Hastings
Grand IslandLexington
ESU 13
ESU 7
Omaha
# Migrant Students

18 | P a g e
Exhibit 8 Migrant Students Served during the Regular School Year and Summer
Regular School Year Summer
All Migrant Students PFS All Migrant Students PFS
Grade Eligible
Served
Total # PFS
Served Served Total Served
# % # % Eligible # % # PFS # %
Birth‐2 295 116 39% ‐‐ ‐‐ ‐‐ 295 63 21% ‐‐ ‐‐ ‐‐
Age 3‐5 949 342 36% 169 104 62% 949 251 26% 169 41 24%
K 343 182 53% 80 47 59% 343 138 40% 80 23 29%
1 300 156 52% 74 53 72% 300 114 38% 74 18 24%
2 360 359 99% 94 67 71% 360 137 38% 94 29 31%
3 327 187 57% 91 65 71% 327 131 40% 91 33 36%
4 314 178 57% 91 63 69% 314 114 36% 91 26 29%
5 263 175 67% 74 51 69% 263 94 36% 74 25 34%
6 265 134 51 67 49 73% 265 107 40% 67 19 28%
7 249 144 58 64 48 75% 249 80 32% 64 16 25%
8 262 128 49 77 50 65% 262 94 36% 77 24 31%
9 291 139 48 94 65 69% 291 110 38% 94 34 36%
10 218 139 64 68 52 76% 218 77 35% 68 15 22%
11 227 129 57 53 37 70% 227 75 33% 53 10 19%
12 163 155 95 43 27 63% 163 22 13% 43 6 14%
UG 9 5 56% 4 0 ‐‐ 9 6 67% 4 1 25%
OSY 313 113 36% 84 45 54% 313 68 22% 84 15 18%
RE* 281 12 4% 20 12 100% 281 51 81% 20 2 10%
Total 5,429 2,793 51% 1,247 839 67% 5,429 1,732 32% 1,247 342 27% Source: CSPR School Year 2013‐14 & Nebraska MEP Database
*RE=Resident Only students arrive/depart during the summer months, not enrolled in a NE school district
Exhibit 9 shows the unduplicated number of migrant children that received MEP‐funded instructional or support services during the performance period. Results show that 65% of all 5,429 eligible migrant students were served during 2013‐14. More than three‐fourths of all the PFS students (78%) were served during the performance period. Twenty‐one percent (21%) of all eligible migrant students received instructional services during the performance period. Of those receiving instruction, 66% received reading instruction, and 76% received math instruction.
Exhibit 9 Migrant Students Served during the Performance Period
All Migrant Students PFS Received Instructional Services
Grade Eligible
Served Total # PFS
Served Any
Instruction Reading
Instruction Math
Instruction
# % # % # % # % # %
Birth‐2 295 140 47% ‐‐ ‐‐ ‐‐ 4 1% 4 100% 2 50%
Age 3‐5 949 532 56% 169 121 72% 195 21% 144 74% 135 69%
K 343 246 72% 80 59 74% 111 32% 74 67% 88 79%
1 300 205 68% 74 55 74% 109 36% 74 68% 79 72%
2 360 251 70% 94 75 80% 122 34% 79 65% 91 75%
3 327 240 73% 91 76 84% 119 36% 78 66% 98 82%
4 314 225 72% 91 72 79% 100 32% 62 62% 76 76%

19 | P a g e
All Migrant Students PFS Received Instructional Services
Grade Eligible
Served Total # PFS
Served Any
Instruction Reading
Instruction Math
Instruction
# % # % # % # % # %
5 263 178 68% 74 60 81% 81 31% 47 58% 74 91%
6 265 197 74% 67 54 81% 72 27% 40 56% 65 90%
7 249 174 70% 64 50 78% 52 21% 45 87% 48 92%
8 262 191 73% 77 60 78% 37 14% 30 81% 36 97%
9 291 229 79% 94 78 83% 37 13% 22 59% 28 76%
10 218 164 75% 68 59 87% 16 7% 11 69% 12 75%
11 227 183 81% 53 40 75% 23 10% 12 52% 8 35%
12 163 115 71% 43 30 70% 10 6% 8 80% 8 80%
UG 9 9 100% 4 1 25% 3 33% 0 ‐‐ 2 67%
OSY 313 166 53% 84 54 64% 41 25% 14 34% 12 29%
RE* 281 75 27% 20 20 100% 8 11% 5 63% 3 38%
Total 5,429 3,523 65% 1,247 967 78% 1,140 21% 749 66% 865 76% Source: CSPR School Year 2013‐14
*RE=Resident Only students arrive/depart during the summer months, not enrolled in a NE school district
Needs Related to Reading and Math Achievement The following tables show the number/percent of migrant students scoring proficient or above (P/A) on the NeSA Reading and Math assessments compared to non‐migrant students and the 2013‐14 State Performance Target. Nebraska refers to proficient as “Meets the Standards” and above proficient as “Exceeds the Standards”.
Exhibit 10 Number/Percent of Migrant Students Scoring Proficient/Above on the 2014 NeSA‐R Compared to the State Performance Targets
Grade Levels
PFS Status
# Tested
% MigrantStudents
Scoring P/A
13‐14 StatePerformance
Target Diff
(+/‐%)
% Non‐MigrantStudents
Scoring P/A
3
PFS 63 54% ‐46%
Non‐PFS 170 62% 100% ‐38% 79%
Total 233 60% ‐40%
4
PFS 70 44% ‐56%
Non‐PFS 157 64% 100% ‐36% 78%
Total 227 58% ‐42%
5
PFS 57 40% ‐60%
Non‐PFS 144 53% 100% ‐47% 77%
Total 201 49% ‐51%
6
PFS 46 22% ‐78%
Non‐PFS 150 54% 100% ‐46% 79%
Total 196 46% ‐54%
7
PFS 51 18% ‐82%
Non‐PFS 131 57% 100% ‐43% 81%
Total 182 46% ‐54%
8
PFS 49 24% ‐76%
Non‐PFS 142 52% 100% ‐48% 78%
Total 191 45% ‐55%
11 PFS 46 15% ‐85%

20 | P a g e
Grade Levels
PFS Status
# Tested
% MigrantStudents
Scoring P/A
13‐14 StatePerformance
Target Diff
(+/‐%)
% Non‐MigrantStudents
Scoring P/A
Non‐PFS 129 33% 100% ‐67% 70%
Total 175 29% ‐71%
PFS 382 33% ‐67%
All Non‐PFS 1,023 54% 100% ‐44% 77%
All 1,405 48% ‐52%
Migrant students were 52% short of the Nebraska State Performance Target (100%) for reading proficiency. PFS students were 67% short of the target and non‐PFS students were 44% short of the target. The 2013‐14 target was also not met by migrant students for any of the seven grade levels (differences ranged from ‐36% to ‐85%). Largest differences were seen for PFS 11th grade students (‐85%); PFS 7th grade students (‐82%); PFS 6th graders (‐78%); and PFS 8th graders (‐76%). In addition, for all grade levels, fewer PFS migrant students scored P/A than non‐PFS migrant students (‐8% [grade 3]; ‐13% [grade 5]; ‐18% [grade 11]; ‐20% [grade 4]; ‐28% [grade 8] ‐32% [grade 6]; ‐39% [grade 7]). Below is a graphic display of the differences in the percent of PFS, non‐PFS, and non‐migrant students scoring P/A on the 2014 NeSA‐R.
Exhibit 11 Comparison of 2014 NeSA‐Reading Results
Migrant Student Performance on Performance Indicator 1.2: The percentage of students at or above the proficient level each year on the state assessment in math.
Exhibit 12 Number/Percent of Migrant Students Scoring Proficient/Above on the 2014 NeSA‐M Compared to the State Performance Targets
Grade Levels
PFS Status
# Tested
% MigrantStudents
Scoring P/A
13‐14 StatePerformance
Target Diff
(+/‐%)
% Non‐MigrantStudents
Scoring P/A
3
PFS 67 39% ‐61%
Non‐PFS 173 58% 100% ‐42% 76%
Total 240 53% ‐47%
4 PFS 72 49% ‐51%
Non‐PFS 158 62% 100% ‐38% 77%
60 58
49 46 46 45
29
4854
4440
2218
2415
33
62 64
53 54 5752
33
54
79 78 77 79 81 7870
77
3 4 5 6 7 8 11 ALL
All Migrant PFS Non PFS Non Migrant
21 | P a g e
Grade Levels
PFS Status
# Tested
% MigrantStudents
Scoring P/A
13‐14 StatePerformance
Target Diff
(+/‐%)
% Non‐MigrantStudents
Scoring P/A
Total 230 57% ‐43%
5
PFS 58 45% ‐55%
Non‐PFS 146 57% 100% ‐43% 76%
Total 204 53% ‐47%
6
PFS 50 24% ‐76%
Non‐PFS 151 49% 100% ‐51% 72%
Total 201 43% ‐57%
7
PFS 55 18% ‐82%
Non‐PFS 134 60% 100% ‐40% 72%
Total 189 48% ‐52%
8
PFS 54 20% ‐80%
Non‐PFS 146 36% 100% ‐64% 66%
Total 200 32% ‐68%
11
PFS 51 16% ‐84%
Non‐PFS 129 34% 100% ‐66% 61%
Total 180 29% ‐71%
PFS 407 31% ‐69%
All Non‐PFS 1,037 51% 100% ‐49% 71%
All 1,444 46% ‐54%
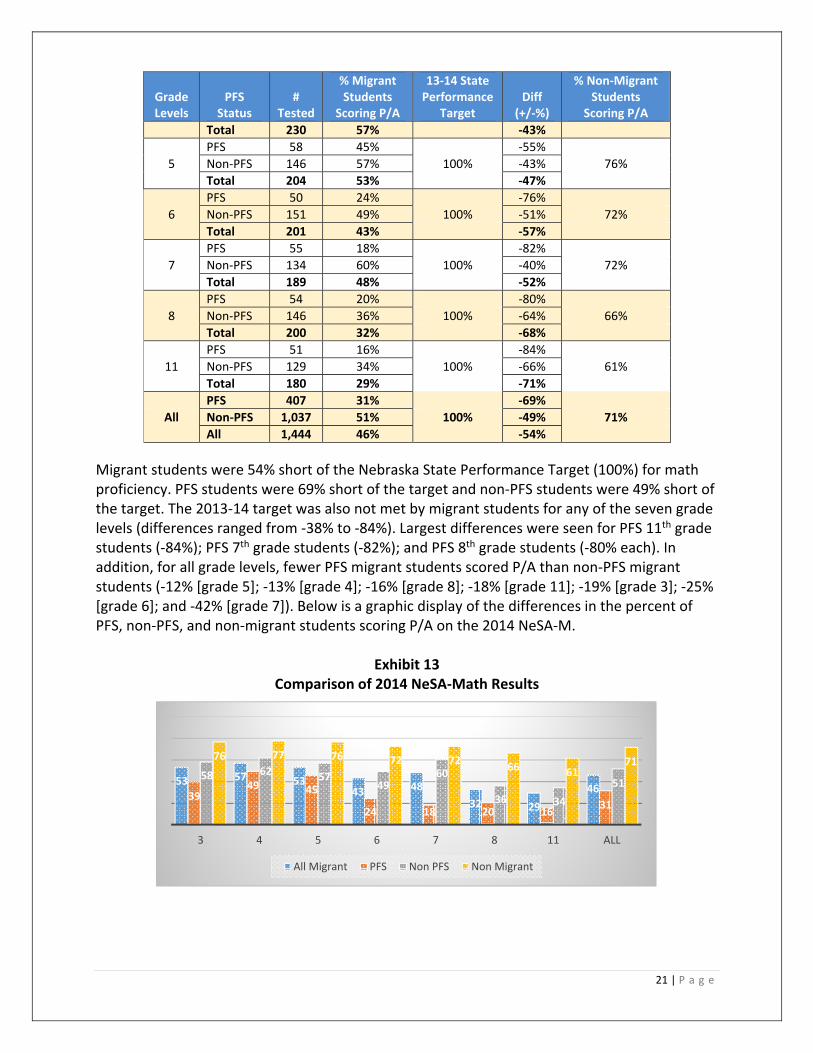
Migrant students were 54% short of the Nebraska State Performance Target (100%) for math proficiency. PFS students were 69% short of the target and non‐PFS students were 49% short of the target. The 2013‐14 target was also not met by migrant students for any of the seven grade levels (differences ranged from ‐38% to ‐84%). Largest differences were seen for PFS 11th grade students (‐84%); PFS 7th grade students (‐82%); and PFS 8th grade students (‐80% each). In addition, for all grade levels, fewer PFS migrant students scored P/A than non‐PFS migrant students (‐12% [grade 5]; ‐13% [grade 4]; ‐16% [grade 8]; ‐18% [grade 11]; ‐19% [grade 3]; ‐25% [grade 6]; and ‐42% [grade 7]). Below is a graphic display of the differences in the percent of PFS, non‐PFS, and non‐migrant students scoring P/A on the 2014 NeSA‐M.
Exhibit 13 Comparison of 2014 NeSA‐Math Results
53 57 5343 48
32 29
4639
49 45
24 18 20 1631
58 62 5749
60
36 34
51
76 77 76 72 7266 61
71
3 4 5 6 7 8 11 ALL
All Migrant PFS Non PFS Non Migrant

22 | P a g e
Needs of Preschool‐age Migrant Children Preschool migrant students receiving MEP services were assessed with school readiness assessments such as Teaching Strategies GOLD, PALS, and PPVT. After receiving instruction, only 35% of the 57 students assessed scored below proficient on these assessments. Needs Related to Secondary Credit Accrual The consequences of mobility are harsh for high school students. Early spring departure and late fall entry remain major obstacles to migrant students accruing high school credits toward graduation. This is especially true for Nebraska’s inter/intrastate secondary migrant students. In a statewide assessment of need, it was determined that 16% of the 608 secondary migrant students in grades 10‐12 in Nebraska were credit deficient. MEP Support Services Needs Support services are provided to migrant students to eliminate barriers that traditionally get in the way of school success. Support services include collaboration with other agencies and referrals of migrant children from birth to age 21 to programs and supportive services. The services include, but are not limited to, health services (medical and dental screening and referral), the provision of school/instructional supplies, information and training on nutrition, translations and interpretations, advocacy and outreach, transportation, connecting with OSY, and parent involvement. All students receiving a service from the MEP received a support service of some type during the regular term and/or summer. Exhibit 14 shows the number and percent of migrant students receiving support services during 2013‐14, including counseling and referrals to instructional and instructionally‐related services funded by a non‐MEP program/organization that they would not have otherwise received without efforts supported by MEP funds.
Exhibit 14 Number of Students Receiving Support Services during 2013‐14
#
ReceivedSupport Services
Received Counseling
Received Referral
Grade Served N % N % N %
0‐2 140 140 100% 10 7% 68 49%
Age 3‐5 532 528 99% 32 6% 220 41%
K 246 245 100% 30 12% 78 32%
1 205 202 99% 33 16% 75 37%
2 251 236 94% 22 9% 75 30%
3 240 236 98% 26 11% 78 33%
4 225 219 97% 32 14% 72 32%
5 178 176 99% 20 11% 60 34%
6 197 195 99% 27 14% 65 33%
7 174 165 95% 17 10% 56 32%
8 191 189 99% 31 16% 66 35%

23 | P a g e
#
ReceivedSupport Services
Received Counseling
Received Referral
Grade Served N % N % N %
9 229 223 97% 50 22% 65 28%
10 164 163 99% 49 30% 52 32%
11 183 184 101% 53 29% 51 28%
12 115 113 98% 30 26% 28 24%
UG 9 7 78% 0 ‐‐ 3 33%
OSY 148 148 100% 22 15% 79 53%
RE* 96 90 94% 8 8% 43 45%
Total 3,523 3,459 98% 492 14% 1,234 35% *RE=Resident Only students arrive/depart during the summer months, not enrolled in a NE school district
Exhibit 15 shows the specific support services received by migrant students and youth during 2013‐14. Results show that more than 2,300 migrant students/youth received materials during the year, more than 1,200 received referrals to community agencies and programs, more than 1,150 received interpretation and translation services, and more than 900 received transportation. Other support services provided included counseling, extended day programming, nutrition, health services, youth leadership programs, life skills training, family literacy programming, clothing, tutoring, Pre‐GED instruction, and high school equivalency program instruction and support.
Exhibit 15 Support Services Received by Migrant Students/Youth
0 500 1000 1500 2000 2500
HS Equivalency ProgramPreGEDTutoring
OtherClothing
Family LiteracyLife Skills
Youth LeadershipHealth Services
NutritionExtended Day Programming
Guidance CounselingTransportation
Translation/InterpretationReferralsMaterials
# Students/Youth

24 | P a g e
Perception Data
During 2013‐14, 348 MEP staff (site directors, teachers, paraprofessionals, non‐instructional staff) responded to local CNA surveys that asked them to indicate needs related to instruction, support services, professional development, and parent training. The distribution of staff responses within each area are displayed in Exhibits 16‐19.
For instructional needs, the largest number of staff indicated a need for supplemental reading (76% of staff), summer school (68% of staff), and supplemental math (66% of staff). The support services most needed included books/materials/supplies (63% of staff), health services (58% of staff), and locating community resources (55% of staff). Most staff indicated that parents needed additional training for increasing family literacy (87% of staff), helping with homework (76% of staff), and identifying community resources (61% of staff). Professional development topics needed most included reading/literacy strategies (68% of staff) and involving migrant parents (67% of staff).
Exhibit 16 Staff Perceptions of Instructional Services Most Needed (Percent Responding)
Exhibit 17
Staff Perceptions of Support Services Most Needed (Percent Responding)
5
9
25
34
43
52
66
68
76
0 10 20 30 40 50 60 70 80 90 100
Other Content
PASS/Other HS Programs
OSY Services
Prekindergarten
In‐School Tutoring
Extended Day Tutoring
Math
Summer School
Reading
22
23
24
24
34
42
55
58
63
0 10 20 30 40 50 60 70 80 90 100
Counseling for HS Students
OSY Services
Clothing
Postsecondary/Career Counseling
Transportation
Nutrition Services
Locating Community Resources
Health Services
Books/materials/supplies

25 | P a g e
Exhibit 18 Staff Perceptions of Parent Training Needs
Exhibit 19
Staff Perceptions of their Professional Development Needs
MEP Staff Suggestions on 2013‐14 Staff Surveys
MEP will benefit with a meeting every month. An assistant to help students with homework. Sometimes parents cannot give help to their children because of the language barrier or work. (Alliance)
More math and reading accommodations/resources support. (Alliance)
Continue to support family education/literacy as this makes a huge impact on student outcomes and success. Partner better with existing adult education programs to provide services for families and OSY. (Crete)
Seek alternative funding sources to provide educational materials and resources. Improved cell phones because we are now using them at our home office. (Scottsbluff)
More training and strategic planning on evidence‐based reading and math practices. (Scottsbluff)
Provide transportation to students that stay after‐school for help. (McCook)
Provide professional development to the staff in order to be able to provide a better service to the students. (Grand Island)
Provide workshops about time management, organization, good listening skills between parents and students. (Grand Island)
9
23
25
30
31
32
52
53
67
68
0 10 20 30 40 50 60 70 80 90 100
Program Evaluation
Program Planning
ID&R
Health/Medical/Dental
Student Assessment
Curriculum & Instruction
ESL Strategies
Math Strategies
Involving Migrant Parents
Reading/Literacy Strategies
44
47
61
76
87
0 10 20 30 40 50 60 70 80 90 100
Postsecondary/Career/Workforce Readiness
Keeping Your Child Safe
Identifying Community Resources
Helping with Homework
Increasing Family Literacy
26 | P a g e
Possibly have PD for all MEP staff – including our instructional staff, paras, teachers, and facilitators. (Grand Island)
More training on how to help families with resources and other available services. (Lexington)
More recruiters, faster processing for COEs, and fewer restrictions on purchases and activities with families. (Hastings)
More training for instructional staff. (Omaha)
Expand Avenue Scholars partnership. (Omaha)
We need more money in order to meet the needs of our migrant families. (Omaha)
Additional funds to provide parents with ESL classes. (South Sioux City)
More MEP programs to more regional settings with area meetings and inservice at our meeting. (Wakefield)
Recruiter Suggestions on 2013‐14 Recruiter Surveys
Have a Facebook page for the MEP.
Book bags
Have a meeting inviting all principals from Nebraska to do networking.
Do more massive recruitment.
NDE involvement at a statewide level to ensure migrant student screening processes (registration, enrollment) used by the schools are adequate and can identify potentially eligible students. Not all schools screen out these families. Develop standard questions across the State.
Have more webinars or training on ID&R. Communicate changes made to the migrant program.
During 2013‐14, 214 migrant secondary students (N=179) and OSY (N=35) responded to local CNA surveys that asked them to indicate their learning needs. The distribution of student/OSY responses within each area is displayed in Exhibit 20. Students and OSY indicated that their greatest needs were related to help with their studies (86% of students), information about options after graduation (85% of students), instruction on basic financial tasks (79% of students), and more help learning English (78% of students).

27 | P a g e
Exhibit 20 Secondary Students/OSY Perceptions of their Academic Learning Needs (Percent Responding)
During 2013‐14, 222 migrant parents responded to local CNA surveys that asked them to indicate needs related to instructional services, support services, and parent involvement/ training topics. The distribution of parent responses within each area are displayed in Exhibits 21‐23. For instructional needs, the largest number of parents indicated a need for reading/ literacy help (65% of parents), summer school (58% of parents), and math help (52% of parents). The support services most needed included books/materials/supplies (49% of parents) and interpreting/translating (48% of parents). Most parents indicated that they needed training to learn how to help their children with homework (57% of parents).
Exhibit 21 Parent Perceptions of Instructional Services Most Needed by their Children
35
35
36
38
46
52
58
59
61
61
63
64
78
79
85
86
0 10 20 30 40 50 60 70 80 90 100
Help with coursework for HS credits
Want information on benefits of staying in school
Want to learn about social health issues
Help with preparing for end‐of‐course assessments
Help with enrolling in career/tech ed programs
Need for support services
Want to learn about paying for college
Help with improving my English language skills
Help with improving academic skills
Help with learning about career options
More help to earn HS credits
Want to learn about preparing for college
More help with learning English
More instruction in basic financial tasks
More information about options after graduation
More help with my studies
5
8
9
10
12
13
14
17
35
52
58
65
0 10 20 30 40 50 60 70 80 90 100
GED
Programs for OSY
Info on NE Education System
Drop‐out Prevention
Instructional Technology
HS Credit Programs
Graduation/Career Activities
Preschool Programs
English language instruction
Mathematics
Summer Programs
Reading/Literacy

28 | P a g e
Exhibit 22
Parent Perceptions of Support Services Most Needed (Percent Responding)
Exhibit 23
Parent Perceptions of their Training Needs
Parent Suggestions on 2013‐14 Parent Surveys
Alliance An after‐school program (2 responses)
We need more programs for preschool children.
My child needs help with homework afterschool.
For the teachers to be more social with the parents.
More leadership opportunities.
Continue helping migrant families in everything that our children can accomplish academically
Have the program continue, this program has been very helpful for my family.
5
9
13
14
16
18
19
23
24
27
37
48
49
0 10 20 30 40 50 60 70 80 90 100
Information for OSY
Information on 0‐4 year old services
Community Referrals
Career/Postsecondary Information
Mentoring for Students
Locating Resources
Health Referrals
Parenting Education
How to help my child with reading and math
Counseling for Students
Transportation
Interpreting/Translating
Books/materials/supplies
6
13
17
18
18
23
24
31
41
46
57
0 10 20 30 40 50 60 70 80 90 100
Services for Binational Migrant Students
Parent Rights/School Practices
Options after HS
Community Resources
School Readiness
Increasing Family Literacy
Health/nutrition in the home
Promoting HS Graduation
Ways to help with reading and math
School Safety
Helping with Homework

29 | P a g e
Crete We would like more books.
Continue helping those in need. (4 responses)
Provide us with more training on how to help our children. (2 responses)
Please give us more activities that we can do with our children.
More books in English and Spanish.
Continue the parent meetings, they help us a lot. Thank you for showing us how to be better parents.
More parent activities.
Continue helping my child improve because sometimes they have a hard time in school.
ESU #7 (Columbus)
No Parent Surveys submitted
ESU #13 (Scottsbluff)
That the program continue helping people and that the parents support the program. Thank you.
ESU #15 (McCook)
Come twice a week.
Don’t discontinue the program. It helped my daughter a lot.
Continue the program, we need more help.
We need a summer program. (3 responses)
Homework help during the regular school year.
To apply a variety of strategies to help students learn English.
More interpreting at the school during parent/teacher conferences.
Help with translations.
More academic activities in the after‐school program.
Fremont No suggestions on parent surveys
Grand Island
Please continue helping us and continue the program.
Have these parent meetings more often.
Continue with the support that you provide our children so that more children can go on to college.
Continue having parent meetings, they are very important for us.
Continue helping families with the education of their children.
I wish that the school would remind us of the day that they have Imagine Learning.
Hastings Make us aware of programs to help Latinos
It has much to offer. I appreciate all the attention that you are providing the community and our children.
Bring back the Sonrisa Dental Program for children ages 15‐18.
Continue supporting the Hispanic community because your help is very useful for our families.
More books to check out for reading at home or activities for parents to do with their children at home.
Lexington We loved getting help with GED and parenting classes.
I would like to see more programs that help like transportation, programs for special needs students, and meetings to help them support their family.

30 | P a g e
More parent training so we can be more involved with our children and be able to help them more.
Madison No Parent Surveys submitted
Norfolk Help with homework
More books for the children. (2 responses)
Keep on helping my daughter with reading and math.
I would love to learn English to help my child. (2 responses)
We need a computer at home.
Books in Spanish.
There should be a Spanish program.
More reading instruction.
More time to work with the students. (3 responses)
I would like to know more about the program.
Give more homework help to 3rd and 4th graders.
Omaha More activities for children.
Continue the program. It has helped our children learn math programs.
To learn more English.
I want my child to improve math and speaking.
My child needs to improve speaking English and reading.
South Sioux City
English classes for parents. Classes with the school nurse about diseases.
Help parents with English classes and workshops on identifying children’s allergies. Talks on nutrition in school.
Please consider English classes, health classes, computer classes, and classes to help our children in middle school and high school.
Provide English classes to parents so they can teach their children.
I would like to see the program have English teachers.
Keep working the way you do to help us become better people and parents.
Wakefield No suggestions on parent surveys
Parent Suggestions from 2013‐14 PAC Meetings
After‐school programs where we can learn and help our children.
By showing us how to be better parents interacting with our children in different activities.
By showing us how to help our children with their studies.
Continue with what you’re doing helping our children learn English.
Dental services for adults.
English classes for adults (2 responses)
Expand the English program ‐ some parents were not able to participate because there was no more room.
Give us more information or special classes on how to better educate our children.
Help me learn English and help my child and family.
Help my children learn English.

31 | P a g e
Help us with school supplies.
Help with filling out school forms.
Home visits
How to help my child at home and school with reading.
How to help our children go to college.
I need a computer as I do not have the money to buy one to help my child with online homework.
The best way to help my daughter go to college so she continues her education to motivate her to study.
I would like to have an interpreter at school and have a tutor for my child.
I would like to learn more about how to teach my child.
How to educate our children and how to treat adolescents and pre‐adolescents.
Improving the quality of our education as parents with our children.
It would be good if you could continue helping our kids after they finish high school.
Learning English and how to answer my child’s questions.
Medical services.
More family activities for helping our children.
More help with homework.
More pointers on how to help our children thrive in school
Provide information about deadlines to apply for scholarships
Provide more books to read at home.
Show us more on how to teach our children.
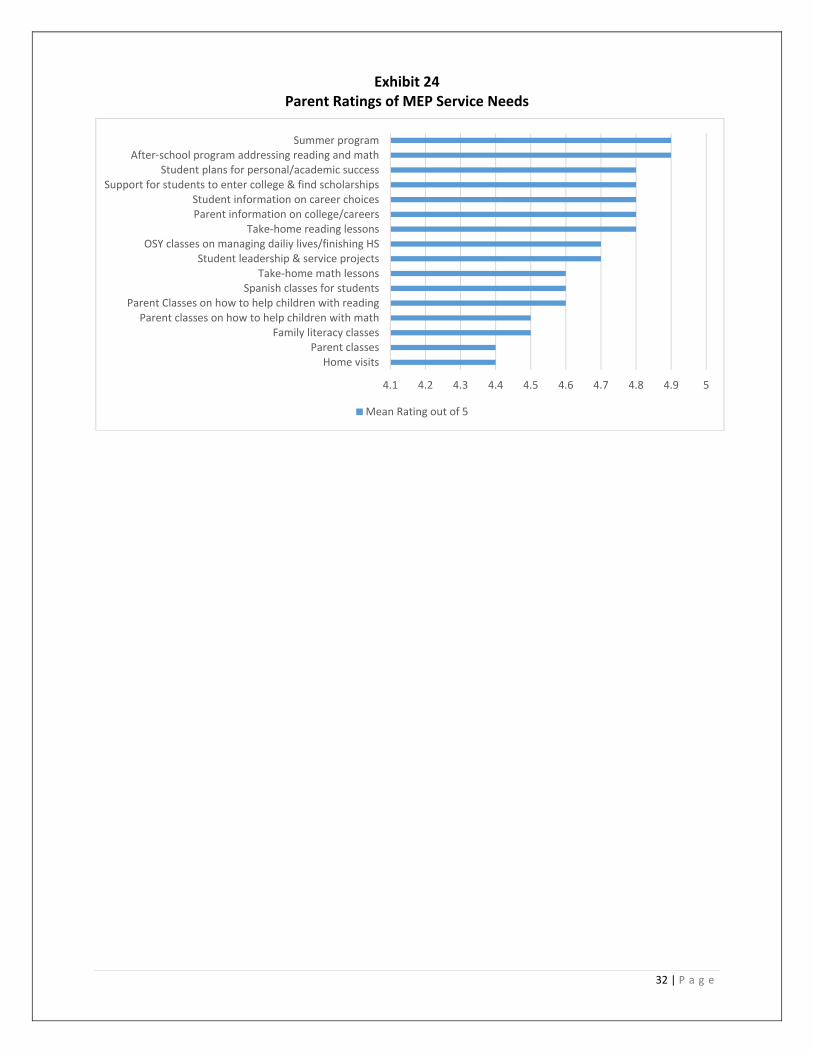
Tips on how to help my children do well in school. (3 responses) On the following page are ratings assigned by parents from Hastings on a questionnaire completed at a PAC meeting in July 2014 that asked them to rate their MEP service needs. Ratings are based on a 5‐point scale where 1=not very important and 5=very important. Highest rated was a summer program and after‐school tutoring in reading and math (mean ratings of 4.9 out of 5.0 each).
32 | P a g e
Exhibit 24 Parent Ratings of MEP Service Needs
4.1 4.2 4.3 4.4 4.5 4.6 4.7 4.8 4.9 5
Home visitsParent classes
Family literacy classesParent classes on how to help children with math
Parent Classes on how to help children with readingSpanish classes for students
Take‐home math lessonsStudent leadership & service projects
OSY classes on managing dailiy lives/finishing HSTake‐home reading lessons
Parent information on college/careersStudent information on career choices
Support for students to enter college & find scholarshipsStudent plans for personal/academic success
After‐school program addressing reading and mathSummer program
Mean Rating out of 5

33 | P a g e
PHASE III: MAKING DECISIONS In the third phase of the Comprehensive Needs Assessment process, the key objective was to review data and develop viable conclusions and recommendations that will be used to set criteria for the development of the Service Delivery Plan. The objectives of the second Needs Assessment Committee Update meeting were to: Revise and approve concern statements Develop needs statements describing the magnitude of the needs for migrant students Draft solutions for concerns Rank concerns for focus during service delivery planning Revise and approve draft CNA table of contents
The following section offers the final recommendations for concerns, data sources for the concerns, needs indicators and statements, and the solutions made by the NAC. Concerns are listed in rank order under each Goal Area. The NAC used the following criteria to rank concerns: Magnitude in the gaps between “what is” and “what should be” Critical nature of the need Special needs of PFS students Degree of difficulty in addressing the need Risks/consequences of ignoring the need External factors such as state and district priorities and goals
The committee identified possible solutions which the SDP update committee will use for the development of strategies during the SDP planning process. The solutions are general guidelines based on the examination of migrant student needs. The development of solutions was guided by the following questions:
What does the research say about effective strategies, programs, or interventions? Where has this solution been implemented and was it successful? What are the challenges? How can solutions be customized for Nebraska?
Goal Area 1: SCHOOL READINESS
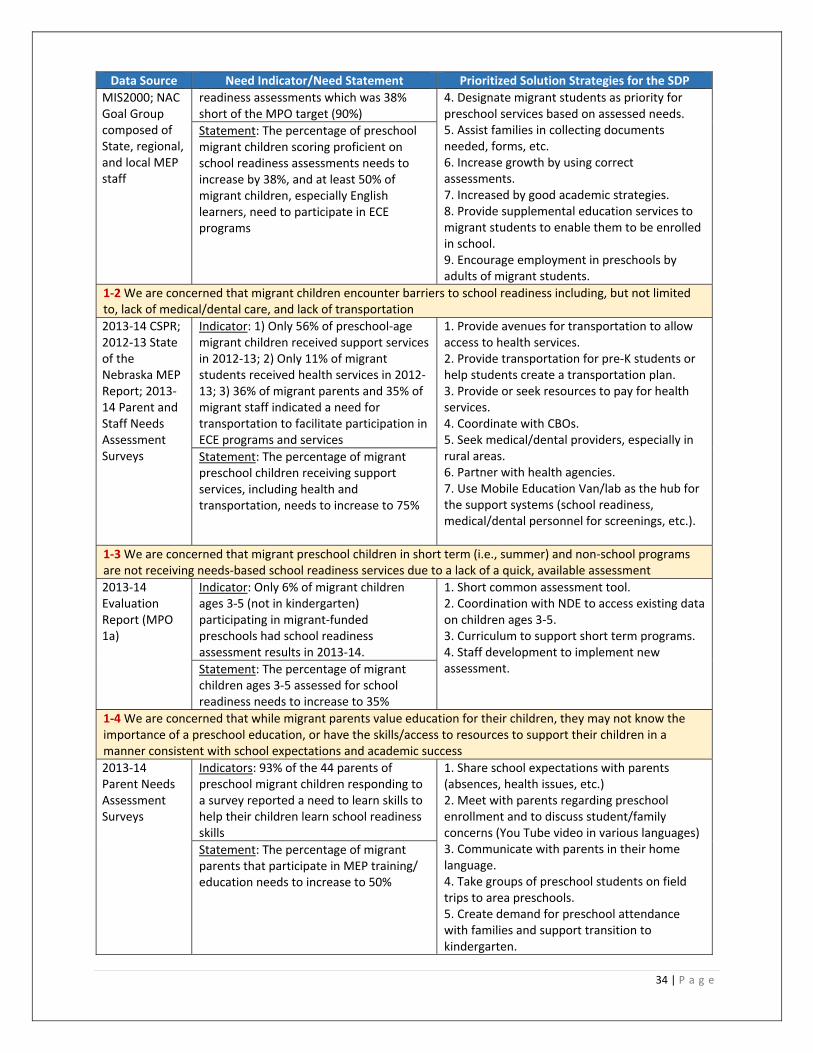
Data Source Need Indicator/Need Statement Prioritized Solution Strategies for the SDP
1‐1 We are concerned that migrant preschoolers, especially English learners (ELs), do not have access to free, quality early childhood programs and therefore do not have the school readiness skills to be prepared for kindergarten and beyond
Teaching Strategies GOLD, PPVT, and PALS assessment results;
Indicator: 1) Only 30% of preschool migrant children participated in an ECE program (14% MEP‐funded, 16% non‐MEP‐funded); 2) only 52% of migrant children attending migrant‐funded preschools scored proficient on school
1. Help parents with preschool enrollment.2. Partner with Head Start and local school districts to provide center‐based preschool services to migrant preschool children. 3. Measure growth by using a standard assessment.
34 | P a g e
Data Source Need Indicator/Need Statement Prioritized Solution Strategies for the SDP
MIS2000; NAC Goal Group composed of State, regional, and local MEP staff
readiness assessments which was 38% short of the MPO target (90%)
4. Designate migrant students as priority for preschool services based on assessed needs. 5. Assist families in collecting documents needed, forms, etc. 6. Increase growth by using correct assessments. 7. Increased by good academic strategies. 8. Provide supplemental education services to migrant students to enable them to be enrolled in school. 9. Encourage employment in preschools by adults of migrant students.
Statement: The percentage of preschool migrant children scoring proficient on school readiness assessments needs to increase by 38%, and at least 50% of migrant children, especially English learners, need to participate in ECE programs
1‐2 We are concerned that migrant children encounter barriers to school readiness including, but not limited to, lack of medical/dental care, and lack of transportation
2013‐14 CSPR; 2012‐13 State of the Nebraska MEP Report; 2013‐14 Parent and Staff Needs Assessment Surveys
Indicator: 1) Only 56% of preschool‐age migrant children received support services in 2012‐13; 2) Only 11% of migrant students received health services in 2012‐13; 3) 36% of migrant parents and 35% of migrant staff indicated a need for transportation to facilitate participation in ECE programs and services
1. Provide avenues for transportation to allow access to health services. 2. Provide transportation for pre‐K students or help students create a transportation plan. 3. Provide or seek resources to pay for health services. 4. Coordinate with CBOs. 5. Seek medical/dental providers, especially in rural areas. 6. Partner with health agencies. 7. Use Mobile Education Van/lab as the hub for the support systems (school readiness, medical/dental personnel for screenings, etc.).
Statement: The percentage of migrant preschool children receiving support services, including health and transportation, needs to increase to 75%
1‐3 We are concerned that migrant preschool children in short term (i.e., summer) and non‐school programs are not receiving needs‐based school readiness services due to a lack of a quick, available assessment
2013‐14 Evaluation Report (MPO 1a)
Indicator: Only 6% of migrant children ages 3‐5 (not in kindergarten) participating in migrant‐funded preschools had school readiness assessment results in 2013‐14.
1. Short common assessment tool. 2. Coordination with NDE to access existing data on children ages 3‐5. 3. Curriculum to support short term programs. 4. Staff development to implement new assessment. Statement: The percentage of migrant
children ages 3‐5 assessed for school readiness needs to increase to 35%
1‐4 We are concerned that while migrant parents value education for their children, they may not know the importance of a preschool education, or have the skills/access to resources to support their children in a manner consistent with school expectations and academic success
2013‐14 Parent Needs Assessment Surveys
Indicators: 93% of the 44 parents of preschool migrant children responding to a survey reported a need to learn skills to help their children learn school readiness skills
1. Share school expectations with parents (absences, health issues, etc.) 2. Meet with parents regarding preschool enrollment and to discuss student/family concerns (You Tube video in various languages) 3. Communicate with parents in their home language. 4. Take groups of preschool students on field trips to area preschools. 5. Create demand for preschool attendance with families and support transition to kindergarten.
Statement: The percentage of migrant parents that participate in MEP training/ education needs to increase to 50%
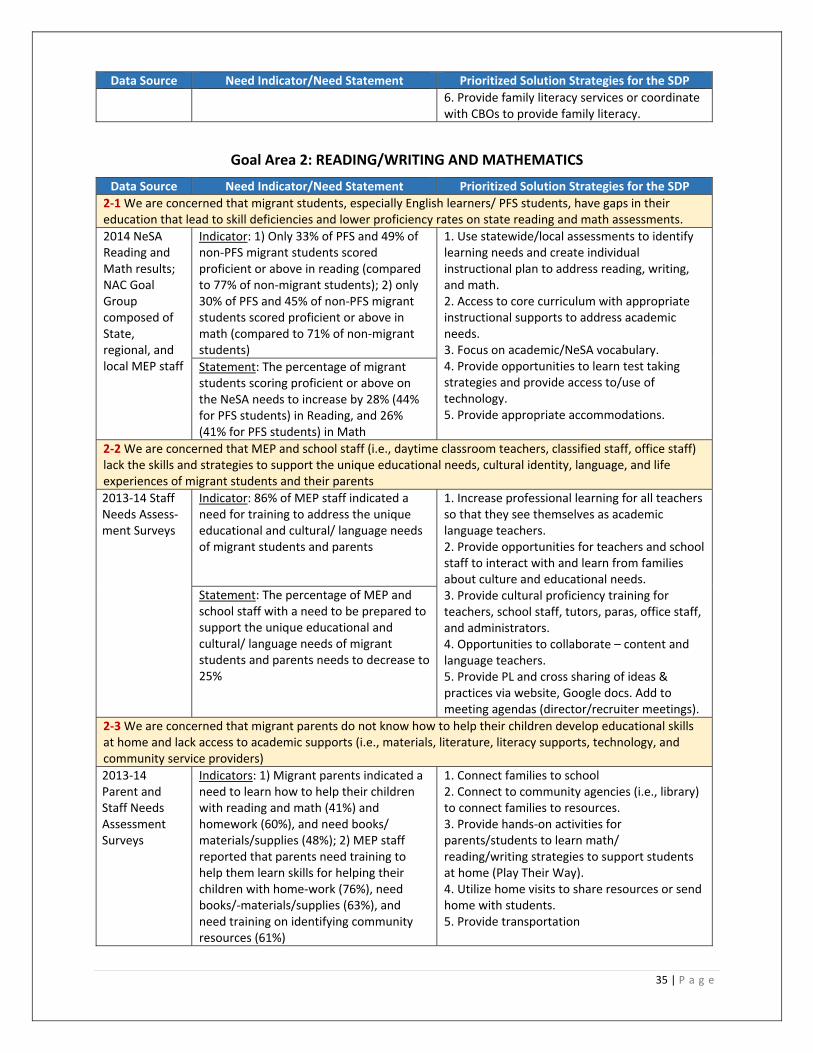
35 | P a g e
Data Source Need Indicator/Need Statement Prioritized Solution Strategies for the SDP
6. Provide family literacy services or coordinate with CBOs to provide family literacy.
Goal Area 2: READING/WRITING AND MATHEMATICS Data Source Need Indicator/Need Statement Prioritized Solution Strategies for the SDP
2‐1 We are concerned that migrant students, especially English learners/ PFS students, have gaps in their education that lead to skill deficiencies and lower proficiency rates on state reading and math assessments.
2014 NeSA Reading and Math results; NAC Goal Group composed of State, regional, and local MEP staff
Indicator: 1) Only 33% of PFS and 49% of non‐PFS migrant students scored proficient or above in reading (compared to 77% of non‐migrant students); 2) only 30% of PFS and 45% of non‐PFS migrant students scored proficient or above in math (compared to 71% of non‐migrant students)
1. Use statewide/local assessments to identify learning needs and create individual instructional plan to address reading, writing, and math. 2. Access to core curriculum with appropriate instructional supports to address academic needs. 3. Focus on academic/NeSA vocabulary. 4. Provide opportunities to learn test taking strategies and provide access to/use of technology. 5. Provide appropriate accommodations.
Statement: The percentage of migrant students scoring proficient or above on the NeSA needs to increase by 28% (44% for PFS students) in Reading, and 26% (41% for PFS students) in Math
2‐2 We are concerned that MEP and school staff (i.e., daytime classroom teachers, classified staff, office staff) lack the skills and strategies to support the unique educational needs, cultural identity, language, and life experiences of migrant students and their parents
2013‐14 Staff Needs Assess‐ment Surveys
Indicator: 86% of MEP staff indicated a need for training to address the unique educational and cultural/ language needs of migrant students and parents
1. Increase professional learning for all teachers so that they see themselves as academic language teachers. 2. Provide opportunities for teachers and school staff to interact with and learn from families about culture and educational needs. 3. Provide cultural proficiency training for teachers, school staff, tutors, paras, office staff, and administrators. 4. Opportunities to collaborate – content and language teachers. 5. Provide PL and cross sharing of ideas & practices via website, Google docs. Add to meeting agendas (director/recruiter meetings).
Statement: The percentage of MEP and school staff with a need to be prepared to support the unique educational and cultural/ language needs of migrant students and parents needs to decrease to 25%
2‐3 We are concerned that migrant parents do not know how to help their children develop educational skills at home and lack access to academic supports (i.e., materials, literature, literacy supports, technology, and community service providers)
2013‐14 Parent and Staff Needs Assessment Surveys
Indicators: 1) Migrant parents indicated a need to learn how to help their children with reading and math (41%) and homework (60%), and need books/ materials/supplies (48%); 2) MEP staff reported that parents need training to help them learn skills for helping their children with home‐work (76%), need books/‐materials/supplies (63%), and need training on identifying community resources (61%)
1. Connect families to school 2. Connect to community agencies (i.e., library) to connect families to resources. 3. Provide hands‐on activities for parents/students to learn math/ reading/writing strategies to support students at home (Play Their Way). 4. Utilize home visits to share resources or send home with students. 5. Provide transportation

36 | P a g e
Data Source Need Indicator/Need Statement Prioritized Solution Strategies for the SDP
Statement: The percentage of migrant parents with a need to learn skills to help their child learn reading and math, help with homework, and access resources needs to decrease to less than 20%
6. Explore hosting events at alternative locations near work or home. 7. Provide opportunities to use school tools (i.e., PowerSchool, Infinite Campus). 8. Provide interpreters/translated materials. 9. Identify needs and best times to meet (individualized learning plan). 10. Include extended family members, not just parents. 11. Send monthly “tip sheets” with practical ideas. 12. Discuss parent academic expectations.
2‐4 We are concerned that migrant students have unmet support services needs such as medical/ dental care, mental health services, and transportation that impact participation in school and MEP services which has a direct impact on attendance and academic achievement
2013‐14 Parent, Staff, and Student/OSY Needs Assess‐ment Surveys
Indicator: 1) 52% of migrant students/youth indicated a need for support services; 2) migrant parents indicated a need for transportation (36%) and health referrals (20%); 3) MEP staff reported that students and parents need health services (59%) and transportation (35%)
1. Educate parents about available community agencies and programs (provide opportunities for agencies to speak to families). 2. Follow‐up on referrals to see why or why not they are being utilized. 3. Coordinate efforts to get migrant families to existing community health fairs, etc. 4. Provide transportation 5. Provide interpreters and translated materials.6. Understand cultural perspectives or labels. 7. Coordination of services to provide transportation, interpreting. 8. Share information with teachers, counselors, social workers, etc. 9. Distribute MEP Community Resource Guide
Statement: The percentage of migrant students/youth with need for support services needs to decrease to less than 10%
2‐5 We are concerned that migrant students are not participating in migrant‐funded extended academic learning opportunities
2012‐13 State of the Nebraska MEP Report
Indicator: Only 12% of all migrant students participated in extended learning opportunities in 2012‐13
1. Provide transportation to migrant students participating in extended learning activities. 2. Match extended learning opportunities to student academic needs to motivate attendance. 3. Clearly communicate opportunities for parents & students (hold informational meetings and provide transportation/childcare) 4. Explore hosting events to alternate location near work or home areas. 5. Connect to community agencies and business to make it real and target interests of students. 6. Mobile education van/lab 7. Develop more cost effective instructional service models (possibly use technology).
Statement: The percentage of migrant students participating in extended learning opportunities needs to increase to 25%

37 | P a g e
Goal Area 3: HIGH SCHOOL GRADUATION AND SERVICES TO OSY Data Source Need Indicator/Need Statement Possible Solution Strategies for the SDP
3‐1 We are concerned that MEP staff lack knowledge of skills and strategies for engaging and supporting secondary students and OSY
NAC Goal Group composed of State, regional, and local MEP staff
Indicator: The NAC goal group indicated a need for staff to improve their skills for engaging and supporting secondary students and OSY
1. Cross sharing of ideas & practices via website, Google doc. Add to meeting agendas (director/recruiter meetings). 2. PL topics: OCR, community resources, SOSOSY materials, higher education, graduation requirements, technology (Zoom, etc.), cultural proficiency online with scheduled follow‐up for accountability. 3. Promote awareness and utilization of SOSOSY instructional materials with all MEP projects/staff. 4. Job shadowing (utilize technology).
Statement: MEP staff training on strategies for engagement and support of secondary students and OSY needs to be infused into all MEP training in Nebraska
3‐2 We are concerned that migrant secondary students, especially ELs/PFS students, have a lack of information about credits, grades, and academic accomplishments resulting in a lower graduation rate than their peers due to mobility, school district priorities, and inappropriate strategies
2012‐13 State Data Records; 2012‐13 Disaggregated LEP Migrant Student Graduation Rate; 2012‐13 NE MEP Evaluation Report (MPO 3b); 2013‐14 Secondary Student/OSY Needs Assessment Surveys
Indicator: 1) Only 62% of migrant students (42% of PFS migrant students) graduated in 2012‐13 compared to 89% of non‐migrant students; 2) only 23% of secondary migrant students are on‐track for graduation; 3) of the 21 migrant student dropouts in 2012‐13, 52% were English learners; 4) fewer than 1% of secondary migrant students received credit accrual services in 2012‐13 even though 19% were credit deficient; 5) 79% of secondary‐aged migrant youth reported needing more help with learning English to do well in school
1. Mobile educational lab/vehicle for credit recovery programs. 2. Individual learning/graduation plans for each migrant secondary student. 3. Credit 101 You Tube video in a variety of languages with checklist/ lesson plan/graduation plan/grad requirements. 4. Clearly communicate graduation requirements to both parents & students. 5. Explore PASS, UT, Odyssey, A+ to meet graduation requirements for districts with large numbers of secondary migrant students. 6. Disseminate information on graduation at alternate locations. 7. Assign a mentor to students.
Statement: The percentage of migrant students graduating from high school needs to increase by 27% (47% for PFS students); and the percentage of secondary migrant students on‐track for graduation needs to increase to 50%
3‐3 We are concerned that OSY are not aware of the MEP instructional services available to obtain their educational goals, or credits and competencies needed for graduation due to mobility, or the constraints of school districts
MSIX Missed Student Report; 2012‐13 State of the NE Report; 2012‐13 MIS2000 Student Summary OSY Report; OSY profile
Indicator: 1) Only 35% of the eligible OSY were served during the regular school year in 2012‐13, and only 36% were served during the summer; 2) only 19% of OSY received instructional services (4% received pre‐GED instruction); 3) on the OSY Profile, high numbers of OSY report dropping out of school due to age and lack of credits
1. Explore mobile educational vehicles (van with wi‐fi and teacher/tutor) technology lab. 2. Migrant‐funded GED paras/tutors (utilize technology). 3. Regional MEPs provide services to OSY to all programs (option for districts to outsource OSY services). 4. Explore providing services at alternate locations (workplace, community). 5. Explore HEP/CAMP options. 6. Online SOSOSY lessons, OSY support groups.
Statement: The percentage of OSY served during the regular year and summer needs to increase to 50%. The percentage of OSY

38 | P a g e
Data Source Need Indicator/Need Statement Possible Solution Strategies for the SDP
receiving instructional services needs to increase to 30% or more.
3‐4 We are concerned that migrant secondary students, OSY, and parents lack knowledge of options after high school including postsecondary education and career opportunities
2013‐14 Parent, Staff, and Secondary Student/OSY Needs Assess‐ment Surveys
Indicators: 1) 86% of secondary students/OSY indicated a need for more information about options after graduation; 2) 17% of migrant parents indicated a need for training on options after graduation; 3) 45% of MEP staff reported that migrant parents need training/information about postsecondary education, careers, and workforce readiness
1. Transition from MEP plan for each student and You Tube video (student project/LOR). 2. Explore interest inventories in multiple languages. 3. PD to guidance counselors on migrant‐specific scholarships and CAMP (newsletter, etc.). 4. Parent and student training on postsecondary options (i.e., ECMC Foundation curriculum training, Exito Escolar Toolkit). 5. Provide interpretation at existing FAFSA events, college visits, Education Quest.
Statement: The percentage of migrant secondary students/ OSY with a need for information about options after graduation needs to decrease to 25%. With so few parents indicating a need for information about options after graduation, there needs to be more information provided so more feel postsecondary education/careers are options for their children.
3‐5 We are concerned that migrant secondary students and OSY have unmet support services needs such as counseling, health care, and mental health services that result in a lack of social and emotional skills needed to be successful in school and in the workplace
2013‐14 Secondary Student/OSY Needs Assess‐ment Surveys; MIS2000 Student Summary 2012‐13
Indicator: 1) 52% of migrant secondary‐aged youth responding to a survey indicated a need for support services; 2) only 35% of OSY received any services
1. MEP career day, students practice interviewing, completing applications, etc (statewide). 2. Leadership academies/activities 3. Counseling via Zoom. 4. Community‐based clinics – collaborate with mobile educational vehicle to provide onsite health services. 5. Interview plan/transition plan 6. Industry visitation (dropout prevention).
Statement: The percentage of migrant secondary students and OSY with need for support services needs to decrease to less than 10%
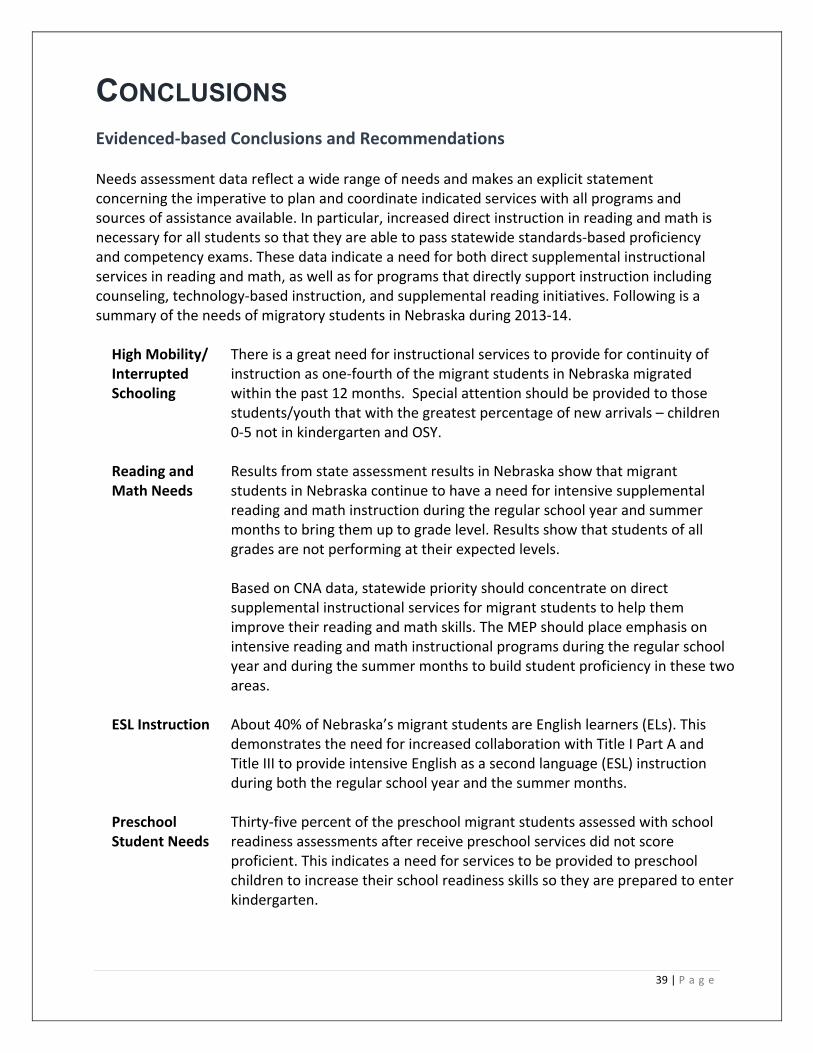
39 | P a g e
CONCLUSIONS Evidenced‐based Conclusions and Recommendations Needs assessment data reflect a wide range of needs and makes an explicit statement concerning the imperative to plan and coordinate indicated services with all programs and sources of assistance available. In particular, increased direct instruction in reading and math is necessary for all students so that they are able to pass statewide standards‐based proficiency and competency exams. These data indicate a need for both direct supplemental instructional services in reading and math, as well as for programs that directly support instruction including counseling, technology‐based instruction, and supplemental reading initiatives. Following is a summary of the needs of migratory students in Nebraska during 2013‐14. High Mobility/ Interrupted Schooling
There is a great need for instructional services to provide for continuity of instruction as one‐fourth of the migrant students in Nebraska migrated within the past 12 months. Special attention should be provided to those students/youth that with the greatest percentage of new arrivals – children 0‐5 not in kindergarten and OSY.
Reading and Math Needs
Results from state assessment results in Nebraska show that migrant students in Nebraska continue to have a need for intensive supplemental reading and math instruction during the regular school year and summer months to bring them up to grade level. Results show that students of all grades are not performing at their expected levels. Based on CNA data, statewide priority should concentrate on direct supplemental instructional services for migrant students to help them improve their reading and math skills. The MEP should place emphasis on intensive reading and math instructional programs during the regular school year and during the summer months to build student proficiency in these two areas.
ESL Instruction About 40% of Nebraska’s migrant students are English learners (ELs). This demonstrates the need for increased collaboration with Title I Part A and Title III to provide intensive English as a second language (ESL) instruction during both the regular school year and the summer months.
Preschool Student Needs
Thirty‐five percent of the preschool migrant students assessed with school readiness assessments after receive preschool services did not score proficient. This indicates a need for services to be provided to preschool children to increase their school readiness skills so they are prepared to enter kindergarten.

40 | P a g e
Support Services Needs
Nearly all of the participating students were in need of social work, health and dental services, outreach or advocacy during the year. In addition, on surveys, MEP staff and parents consistently rated highly the need for support services for students and families. Support services should continue to be provided and even enhanced to ensure that barriers to school success are eliminated for migrant students.
Secondary Credit Accrual
In a statewide assessment of need, it was determined that 16% of the secondary migrant students were credit deficient. Students need the opportunity to accrue credit and skills in order to increase their chances of graduating from high school. Additionally, services (including enrichment and instruction) to enhance secondary student attitudes about school, school attendance, career planning and awareness and education, computer literacy, leadership, goal setting, and self‐advocacy should be provided.
Professional Development
There is a continuing need to build the capacity of MEP staff to serve the academic needs of students in Nebraska. Professional development needs that exist address reading and math strategies, involving migrant parents, and ESL strategies among other topics mentioned in this report.
Parent/ Family Needs
The majority of staff responding to the needs assessment survey felt that parents need training on helping their child with math and reading and increasing family literacy skills. The majority of parents responding also reported a need to learn strategies for helping their child with math and reading and homework. This indicates a strong need expressed by staff and parents to provide training to parents to help them prepare their children for school and support them in learning reading and math.
Next Steps in Applying the Results of the CNA to Planning Services As part of the comprehensive service delivery planning process, NDE collaborates with migrant directors and the PAC to update its MPOs each year after determining progress made. The MPOs are aligned with statewide performance targets, revised MPOs, and research‐based strategies and promising practices to meet the MPOs. The Nebraska MEP has created a Toolkit to help sub‐grantees conduct local needs assessments, and identified local, State, and Federal resources to help with the delivery of appropriate services, and monitor the progress of student outcomes. Using the data as a guide, NDE will continue to work with all sub‐grantees, especially those that have not made substantial progress toward meeting the MPOs, to identify options and institute research‐ and evidence‐based improvements, as appropriate. The next step for the Nebraska MEP is to use the updated data contained in this CNA report to determine if services outlined in the Service Delivery Plan (SDP) need to be updated to reflect changes in needs. The SDP serves as the basis for the use of all MEP funds in the State and articulates a clear vision of:
41 | P a g e
performance goals and targets, especially as they relate to the provision of services for
PFS students;
the MEP’s measurable outcomes and how they help achieve the State’s performance targets;
the services the MEP will provide on a statewide basis;
plans for technical assistance, professional development, parent involvement, and identification and recruitment; and
how to evaluate whether and to what degree the program is effective. In the Nebraska SDP, the program must ensure that all components align with the unique needs of migrant students as outlined in the CNA and include the following components:
1. Performance Targets. The plan must specify the performance targets that the State has adopted for all migrant children for: 1) reading; 2) mathematics; 3) school readiness; and 4) high school graduation.
2. Needs Assessment. The plan must contain a summary of the Comprehensive Needs Assessment, including identification and an assessment of: (1) the unique educational needs of migrant children that result from the children’s migrant lifestyle; and (2) other needs of migrant students that must be met in order for them to participate effectively in school.
3. Measurable Program Outcomes. The plan must include the measurable outcomes that the MEP will produce statewide through specific educational or educationally‐related services. Measurable outcomes allow the MEP to determine whether and to what degree the program has met the special educational needs of migrant children that were identified through the Comprehensive Needs Assessment. The measurable outcomes should also help achieve the State’s performance targets.
4. Service Delivery. The plan must describe the MEP’s strategies for achieving the performance targets and measurable objectives described above. The State’s service delivery strategy must address: (1) the unique educational needs of migrant children that result from the children’s migrant lifestyle, and (2) other needs of migrant students that must be met in order for them to participate effectively in school.
5. Evaluation. The plan must describe how the State will evaluate whether and to what degree the program is effective in relation to the performance targets and measurable outcomes. The Nebraska MEP may also include the policies and procedures it will implement to address other administrative activities and program functions, such as:
Priority for Services. A description of how, on a statewide basis, the MEP will give
priority to migrant children who: 1) are failing, or most at risk of failing, to meet the State’s challenging academic content and student achievement standards, and 2) whose education has been interrupted during the regular school year.

42 | P a g e
Student Records. A description of the State’s plan for requesting and using migrant student records and transferring migrant student records to schools and other migrant sites in which migrant students enroll.
Plan for Communication and Broad Dissemination and Use of the Updated CNA NAC members discussed ways to disseminate the CNA Update to ensure its understanding and use including the following:
Share at data/recruiter/director meetings
Webinars
“Strategy of the Month” newsletter or tip sheet
Websites – local and State
MEP staff meetings (2 responses)
State/local PAC meetings (3 responses)
Local district meetings
Annual migrant directors’ meeting
NDE Federal Programs meeting
MEP service provider training
MEP booklet
Translate key parts to use with parents
Tri‐fold summary
Tweeted
Report for Commissioner and other targeted policy makers With respect to communication, the important question to ask is: Who needs to know what? Another important question is: How are we going to best implement what we discovered is the need in the CNA update? The NAC suggested sharing the CNA Decisions and Planning Chart and asking recipients to focus on the solutions and how they will implement them. In addition to Nebraska educators, administrators, and parents, the CNA update will be shared with OME. Communication strategies for the updated Nebraska MEP CNA include: Submitting the whole report to the SEA and OME; Widely disseminating the CNA Decisions and Planning Chart; Developing a PowerPoint presentation that lays out changes from the last CNA; Translating all documents into Spanish for parents and community members; and Developing a 1‐page handout on the CNA update, but begin at the basics (i.e., “What is
the MEP?”) and add graphics on the continuous improvement process.
43 | P a g e
Appendix A NAC Meeting Agendas and Minutes
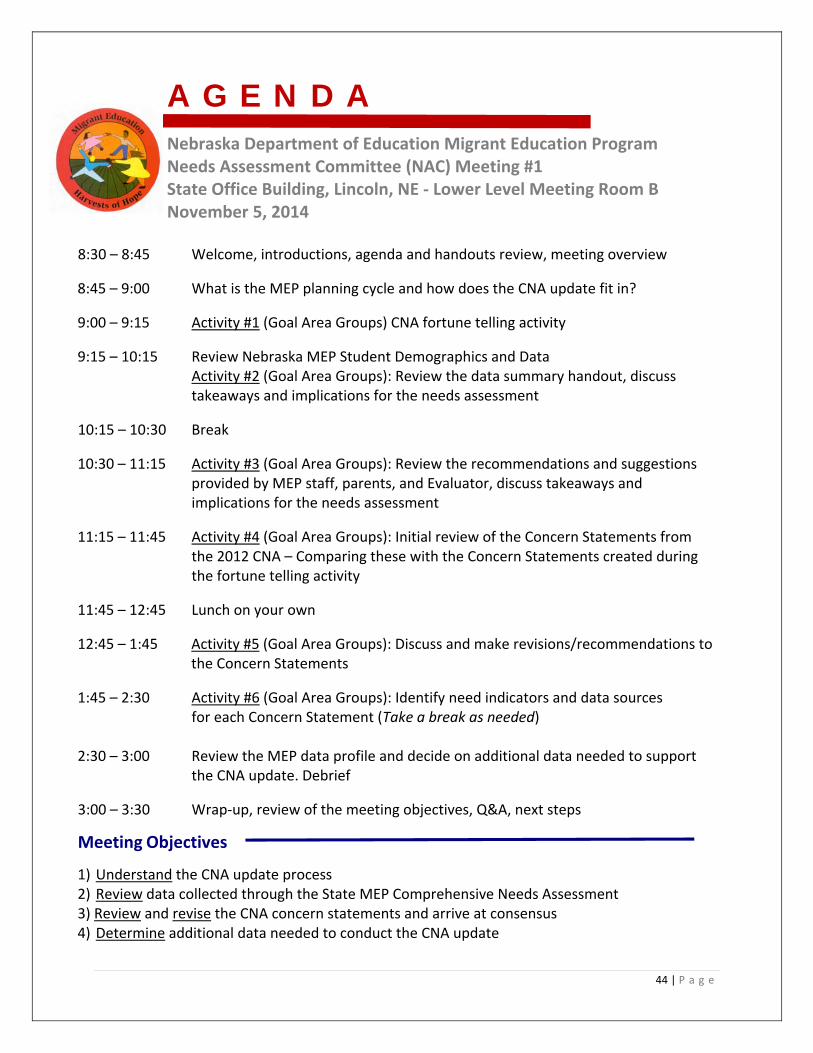
44 | P a g e
A G E N D A
Nebraska Department of Education Migrant Education Program Needs Assessment Committee (NAC) Meeting #1 State Office Building, Lincoln, NE ‐ Lower Level Meeting Room B November 5, 2014
8:30 – 8:45 Welcome, introductions, agenda and handouts review, meeting overview
8:45 – 9:00 What is the MEP planning cycle and how does the CNA update fit in?
9:00 – 9:15 Activity #1 (Goal Area Groups) CNA fortune telling activity
9:15 – 10:15 Review Nebraska MEP Student Demographics and Data Activity #2 (Goal Area Groups): Review the data summary handout, discuss
takeaways and implications for the needs assessment
10:15 – 10:30 Break
10:30 – 11:15 Activity #3 (Goal Area Groups): Review the recommendations and suggestions provided by MEP staff, parents, and Evaluator, discuss takeaways and implications for the needs assessment
11:15 – 11:45 Activity #4 (Goal Area Groups): Initial review of the Concern Statements from the 2012 CNA – Comparing these with the Concern Statements created during the fortune telling activity
11:45 – 12:45 Lunch on your own
12:45 – 1:45 Activity #5 (Goal Area Groups): Discuss and make revisions/recommendations to the Concern Statements
1:45 – 2:30 Activity #6 (Goal Area Groups): Identify need indicators and data sources for each Concern Statement (Take a break as needed)
2:30 – 3:00 Review the MEP data profile and decide on additional data needed to support the CNA update. Debrief
3:00 – 3:30 Wrap‐up, review of the meeting objectives, Q&A, next steps
Meeting Objectives
1) Understand the CNA update process 2) Review data collected through the State MEP Comprehensive Needs Assessment 3) Review and revise the CNA concern statements and arrive at consensus 4) Determine additional data needed to conduct the CNA update

45 | P a g e
MEETING SUMMARY
Nebraska Migrant Education Program Needs Assessment Committee (NAC) Meeting #1 Lincoln, Nebraska – November 5, 2014
Meeting Participants 1. Mary Ann Losh (NDE, Administrator) 2. Sue Henry (NDE, MEP) 3. Lindsay Ickes (NDE, MEP) 4. Terri Schuster (NDE, ELL) 5. Cheryl Feeken, Records Clerk (Crete) 6. Larianne Polk, ESU Administrator (ESU #7 ‐ Columbus) 7. Danielle Waite, Statewide MEP Data Coordinator (ESU #7 – Columbus) 8. Kiowa Rogers, MEP Director (ESU #13/Scottsbluff) 9. Jamie Garner, MEP Director, Staff Development (ESU #15/McCook) 10. Veronica Estevez, MEP State PAC, MEP Quality Control (ESU #15/McCook) 11. Amanda Levos, MEP Director, ELL (Grand Island) 12. Diane Kvasnicka, Early Childhood Office at NDE 13. Alan Ehlers, MEP Director, Superintendent (Madison) 14. Susan Mayberger, MEP Director, ELL and Refugee (Omaha) 15. Suzanne Wetzel, MEP Coordinator, Early Childhood (Omaha) 16. Susan Durón, Meeting Facilitator, Owner/Consultant, META Associates 17. Cari Semivan, Meeting Facilitator, Consultant, META Associates
Meeting Objectives 1) Understand the CNA update process
2) Review data collected through the State MEP Comprehensive Needs Assessment
3) Review and revise the CNA concern statements and arrive at consensus
4) Determine additional data needed to conduct the CNA update
Discussion and Activities About half of the group was part of the previous NAC or SDP committees. Sue and Mary Ann welcomed the group and thanked them for their participation. The members of the Needs Assessment Committee (NAC) introduced themselves. Next, Susan presented the meeting objectives; and Cari gave an overview of the packet materials, and reviewed the agenda.

46 | P a g e
An overview of the planning cycle provided by the Office of Migrant Education (OME) in its CNA Toolkit (2012) was presented that consists of the Comprehensive Needs Assessment (CNA), Service Delivery Plan (SDP), NAC roles and responsibilities, project implementation, program evaluation, monitoring, and sub‐allocation. Cari asked participants to choose a group based on the Nebraska 3 goal areas prior to starting Activity 1. Following is a list of goal group members.
Goal Areas Group Members
1) School Readiness Diane, Jamie, Cheryl, Veronica, Suzanne, Sue
2) Reading/Writing and Math Terri, Amanda, Alan, Susan M.
3) Graduation and Services to OSY Kiowa, Larianne, Danielle, Lindsay
Small Group Activity #1: The CNA Fortune Telling activity was introduced by Cari. The 3 goal area groups worked at their tables to identify concern statements facing migrant students in Nebraska. The groups posted their Fortune Telling sheet on chart paper to be visited later. The concerns predicted follow. We are concerned about . . . School Readiness
Access to quality early childhood services
Transportation in rural areas
Learning in English language
Assessing native language skills
Literacy background of students
Being prepared for kindergarten
Structure/culture/social expectation of school life
More time needed to develop skills
Preventive health Reading/Writing and Math
Achievement gap in reading/writing, and math based on NeSA and ELDA results.
Lack of continuity in instruction when students move from school to school, especially since math is progressive and there may be curriculum gaps.
Unrealistic goals are a concern. Need to develop annual growth goals for students.
The availability of services and opportunities for native language translation. Graduation
Not enough credits to graduate
No post‐graduation plans
Can’t afford college
Not aware of post‐high school resources
Language barriers
No job skill training
Services to OSY
No job skill training
Family responsibilities (work, children)
Lack of confidence to succeed
Access to health care and transportation and housing
Language barriers
Access to a GED program

47 | P a g e
Small Group Activity #2: Cari introduced this activity by asking the participants to work in their groups to review and analyze the data and identify some “take‐aways” related to the 3 goal areas. The following statements reflect group discussion. School Readiness Data “Take‐Aways”
There is no consistency in preschool assessments and what they are measuring.
There is data missing and there is not a clear distinction between 3 and 4 year olds with regards to the data reported.
NE did not meet the school readiness assessment results MPOs for the past 2 years.
Only 73 of the more than 1,150 children ages 3‐5 (not in kindergarten) had pre/post school readiness assessment results in 2013‐14.
There was a large increase in the number of parents who report that they are better prepared for helping their children be ready for school, and a larger number of parents responding to surveys in 2013‐14 than in 2012‐13.
Reading/Writing and Math Data “Take‐Aways”
Migrant students overall in every grade did not meet State content standards.
Achievement gap in math is seen at every level. Greater in math than reading.
As you go higher in the grades, there is more of a gap between migrant and non‐migrant in both reading and math.
PFS students consistently show greater needs than non‐PFS and non‐migrant students.
Graduation and Services to OSY Data “Take‐Aways”
Migrant students graduate at substantially lower rates than non‐migrant students with fewer PFS students graduating than non‐PFS and non‐migrant.
Not meeting MPOs for instructional services and credit accrual.
The majority of instructional services given to OSY was in ESL.
Only 4% of OSY received pre‐GED instructional services.
Low percentage received pre‐employment vocational counseling services. When looking at the MPOs, Susan Mayberger noted that the community is often confused when reporting on graduation rate and drop‐out rate. These are two separate things. This is something to consider by the SDP Committee next year. Small Group Activity #3: Cari introduced this activity by asking the participants to work in their groups to review the recommendations made by the evaluator in the 2012‐13 Nebraska MEP Evaluation Report, as well as the suggestions and recommendations made by MEP staff and parents during 2012‐13 and 2013‐14 to identify some “take‐aways” related to the 3 goal areas. School Readiness – Recommendations “Take‐Aways”
Parents want more information (i.e., parent training, information on the project, how to help their children with reading).
We need to identify an assessment for short‐term summer programs that is tied in with Teaching Strategies GOLD.
Parents want more books and to understand child development.
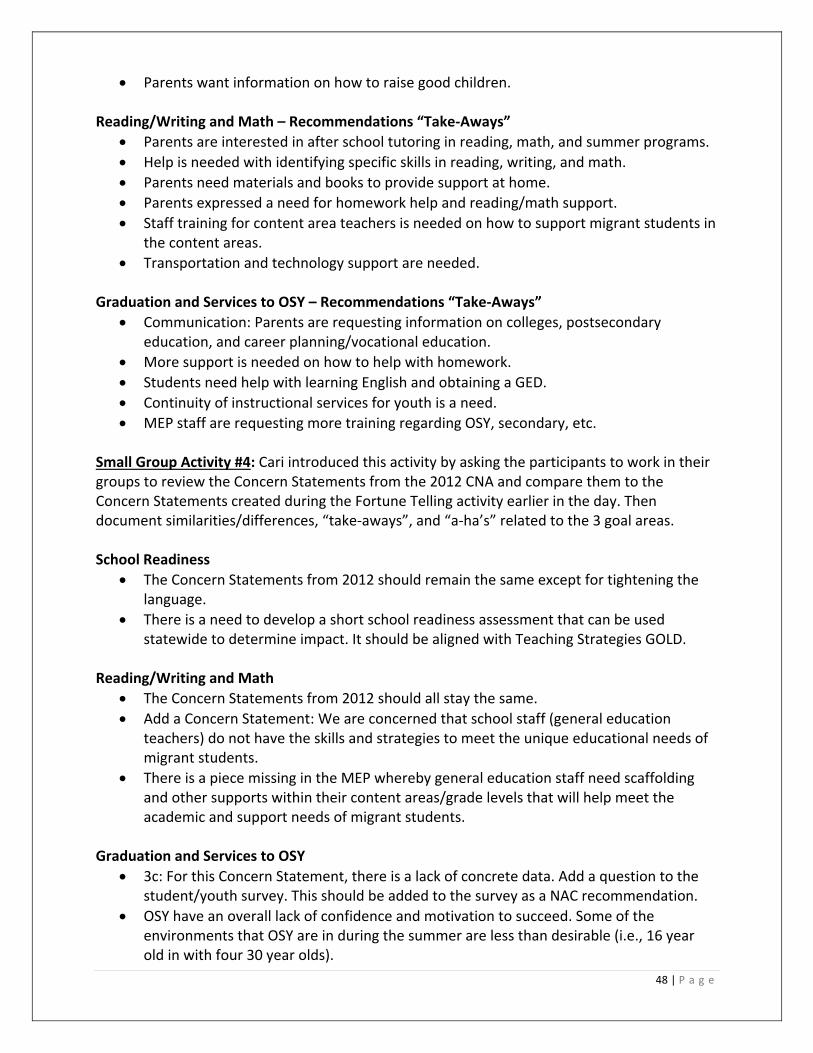
48 | P a g e
Parents want information on how to raise good children. Reading/Writing and Math – Recommendations “Take‐Aways”
Parents are interested in after school tutoring in reading, math, and summer programs.
Help is needed with identifying specific skills in reading, writing, and math.
Parents need materials and books to provide support at home.
Parents expressed a need for homework help and reading/math support.
Staff training for content area teachers is needed on how to support migrant students in the content areas.
Transportation and technology support are needed. Graduation and Services to OSY – Recommendations “Take‐Aways”
Communication: Parents are requesting information on colleges, postsecondary education, and career planning/vocational education.
More support is needed on how to help with homework.
Students need help with learning English and obtaining a GED.
Continuity of instructional services for youth is a need.
MEP staff are requesting more training regarding OSY, secondary, etc. Small Group Activity #4: Cari introduced this activity by asking the participants to work in their groups to review the Concern Statements from the 2012 CNA and compare them to the Concern Statements created during the Fortune Telling activity earlier in the day. Then document similarities/differences, “take‐aways”, and “a‐ha’s” related to the 3 goal areas. School Readiness
The Concern Statements from 2012 should remain the same except for tightening the language.
There is a need to develop a short school readiness assessment that can be used statewide to determine impact. It should be aligned with Teaching Strategies GOLD.
Reading/Writing and Math
The Concern Statements from 2012 should all stay the same.
Add a Concern Statement: We are concerned that school staff (general education teachers) do not have the skills and strategies to meet the unique educational needs of migrant students.
There is a piece missing in the MEP whereby general education staff need scaffolding and other supports within their content areas/grade levels that will help meet the academic and support needs of migrant students.
Graduation and Services to OSY
3c: For this Concern Statement, there is a lack of concrete data. Add a question to the student/youth survey. This should be added to the survey as a NAC recommendation.
OSY have an overall lack of confidence and motivation to succeed. Some of the environments that OSY are in during the summer are less than desirable (i.e., 16 year old in with four 30 year olds).
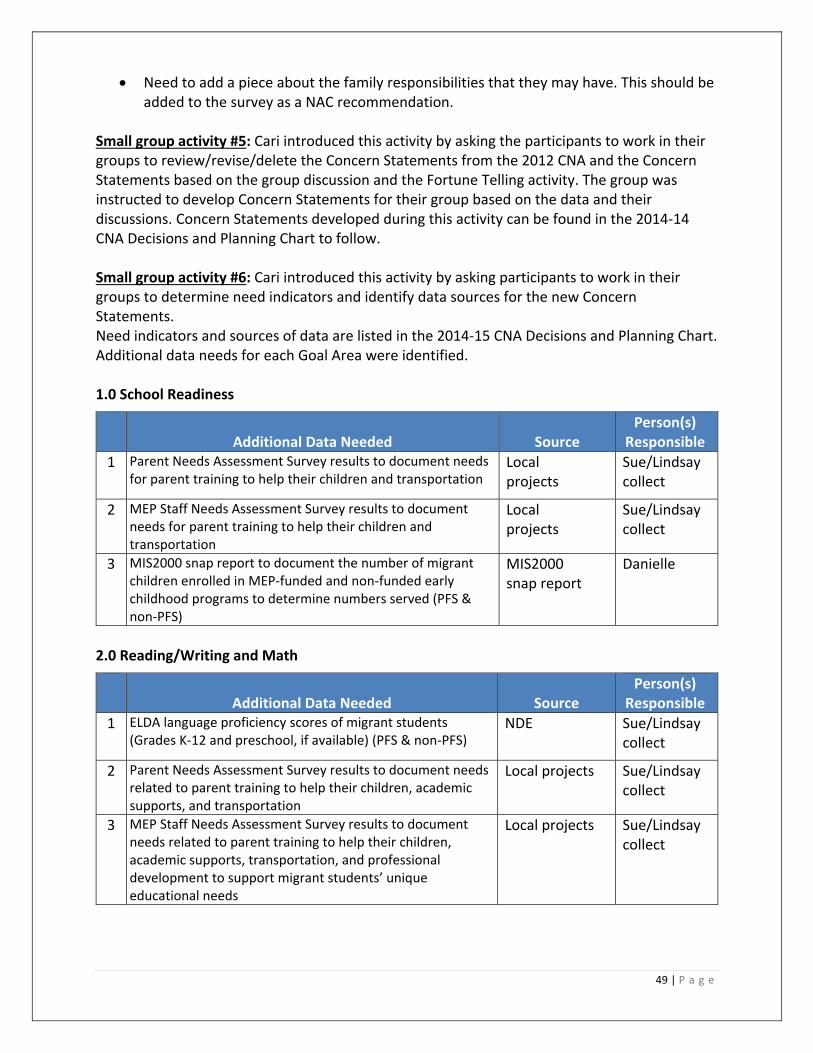
49 | P a g e
Need to add a piece about the family responsibilities that they may have. This should be added to the survey as a NAC recommendation.
Small group activity #5: Cari introduced this activity by asking the participants to work in their groups to review/revise/delete the Concern Statements from the 2012 CNA and the Concern Statements based on the group discussion and the Fortune Telling activity. The group was instructed to develop Concern Statements for their group based on the data and their discussions. Concern Statements developed during this activity can be found in the 2014‐14 CNA Decisions and Planning Chart to follow. Small group activity #6: Cari introduced this activity by asking participants to work in their groups to determine need indicators and identify data sources for the new Concern Statements. Need indicators and sources of data are listed in the 2014‐15 CNA Decisions and Planning Chart. Additional data needs for each Goal Area were identified. 1.0 School Readiness
Additional Data Needed Source Person(s)
Responsible
1 Parent Needs Assessment Survey results to document needs for parent training to help their children and transportation
Local projects
Sue/Lindsay collect
2 MEP Staff Needs Assessment Survey results to document needs for parent training to help their children and transportation
Local projects
Sue/Lindsay collect
3 MIS2000 snap report to document the number of migrant children enrolled in MEP‐funded and non‐funded early childhood programs to determine numbers served (PFS & non‐PFS)
MIS2000 snap report
Danielle
2.0 Reading/Writing and Math
Additional Data Needed Source Person(s)
Responsible
1 ELDA language proficiency scores of migrant students (Grades K‐12 and preschool, if available) (PFS & non‐PFS)
NDE Sue/Lindsay collect
2 Parent Needs Assessment Survey results to document needs related to parent training to help their children, academic supports, and transportation
Local projects Sue/Lindsay collect
3 MEP Staff Needs Assessment Survey results to document needs related to parent training to help their children, academic supports, transportation, and professional development to support migrant students’ unique educational needs
Local projects Sue/Lindsay collect

50 | P a g e
3.0 Graduation and Services to OSY
Additional Data Needed Source Person(s)
Responsible
1 Number of migrant secondary students on‐track for graduation (PFS & non‐PFS)
NE MEP Data Danielle
2 2013‐14 Parent Needs Assessment Survey results on training needs related to options after graduation
Local projects Sue/Lindsay collect
3 2013‐14 Secondary Student/OSY Needs Assessment Survey results on the need for more information about options after graduation
Local projects Sue/Lindsay collect
4 2013‐14 Staff Needs Assessment Survey results on PD needs related to parent training needs on postsecondary, career, and workforce readiness
Local projects Sue/Lindsay collect
5 Number of secondary students/OSY with credit deficiencies (PFS & non‐PFS)
NE MEP Data Danielle
Recommendations for Follow‐up: School Readiness
Create a simple, statewide school readiness assessment for short term programs, such as summer school, using Teaching Strategies GOLD as a framework (since that is the assessment used by preschool programs throughout the State).
Reading/Writing and Math
Add an item to local needs assessment parent/student surveys or evaluation surveys that ask students and parents about the extent to which their cultural identity, language, and life experiences are addressed in the school.
Graduation and Services to OSY
Separate questions about graduation requirements and postsecondary/career on the parent survey
CNA Secondary Student/OSY Survey – add a question about social/emotional skills
Model a survey after the Special Education Post‐School Outcomes Survey (to determine the extent to which students are prepared for postsecondary education and careers)
Diploma Project – PA (to help match student/parent educational expectations) Large group discussion: Susan led the group through a discussion about the 2012‐13 Nebraska MEP Student Profile to determine if additional data was needed to complete the MEP profile. Following are the results of this discussion:
Report Year 4 graduation rate, year 5 graduation rate, and year 6 graduation rate.
Report LEP migrant student graduation rate.
Report ELDA scores for migrant students.

51 | P a g e
Wrap‐up, Follow‐up, Next Steps, and Timelines Susan shared the next steps and timelines for the work of the NAC and NDE as captured below.
NAC Meeting #2 (2/11/15) will include a review of any additional data. The NAC will review concerns, determine possible solutions, and identify resources/experts.
Ensure that any missing data is ready for the next meeting.
Create the 2014‐15 CNA Decisions and Planning Chart

52 | P a g e
A G E N D A
Nebraska Department of Education Migrant Education Program Needs Assessment Committee (NAC) Meeting #2 State Office Building, Lincoln, NE ‐ Lower Level Meeting Room B February 11, 2015
8:30 – 8:45 Welcome, introductions, agenda and handouts review, meeting overview
8:45 – 9:15 Quiz ‐ The Planning Cycle: A Review: Comprehensive Needs Assessment (CNA), Service Delivery Plan (SDP), program implementation, program evaluation. Where are we in the process?
9:15 – 9:45 Activity #1 (Goal Area Groups) Review and revise the Concern Statements, Data Sources, Need Indicators, and Need Statements
9:45 – 10:00 Activity #2 (Goal Area Groups) Prioritize Concern Statements
10:00 – 10:15 Break
10:15 – 11:45 Activity #3 (Goal Area Groups) Review and make recommendations about possible solutions to the Concerns and Need Statements
11:45 – 1:00 Lunch on your own
1:00 – 1:30 Activity #3, Cont. (Gallery Walk) Review and suggest additional solutions to the other Goal Area Groups
1:30 – 2:00 Activity #4 (Goal Area Group) Prioritize solutions
2:00 – 2:30 Activity #5 (Goal Area Groups) Identify resources and experts/staff by listing information, materials, and personnel needed to address the concerns. Gallery walk and debrief. ***Break as needed***
2:30 – 3:00 Activity #6 “Save the Last Word” (Small Groups) Identify loose ends and ways to communicate the CNA to the field.
3:00 – 3:30 Wrap‐up, review of the meeting objectives, Q&A, next steps
Meeting Objectives 1) Finalize concerns, data sources, need indicators, need statements 2) Rank concerns for focus during service delivery planning 3) Develop solutions for the concern statements 4) Rank solutions for focus during service delivery planning 5) Identify possible resources and experts/staff to meet migrant student needs 6) Review next steps for completion of the CNA and service delivery planning
53 | P a g e
MEETING SUMMARY
Nebraska Migrant Education Program Needs Assessment Committee (NAC) Meeting #2 Lincoln, Nebraska – February 11, 2015
Meeting Participants 18. Mary Ann Losh (NDE, Administrator) 19. Sue Henry (NDE, MEP) 20. Deb Romanek (NDE, Math) 21. Terri Schuster (NDE, ELL) 22. Cheryl Feeken, Records Clerk (Crete) 23. Larianne Polk, ESU Administrator (ESU #7 ‐ Columbus) 24. Dee Condon, MEP Director (ESU #7 – Columbus) 25. Danielle Waite, Statewide MEP Data Coordinator (ESU #7 – Columbus) 26. Kiowa Rogers, MEP Director (ESU #13/Scottsbluff) 27. Jamie Garner, MEP Director, Staff Development (ESU #15/McCook) 28. Veronica Estevez, MEP State PAC, MEP Quality Control (ESU #15/McCook) 29. Amanda Levos, MEP Director, ELL (Grand Island) 30. Linda Hix, Director of Federal Programs (Lincoln) 31. Suzanne Wetzel, MEP Coordinator, Early Childhood (Omaha) 32. Cari Semivan, Meeting Facilitator, Consultant, META Associates
Meeting Objectives 1) Finalize concerns, data sources, need indicators, need statements 2) Rank concerns for focus during service delivery planning 3) Develop solutions for the concern statements 4) Rank solutions for focus during service delivery planning 5) Identify possible resources and experts/staff to meet migrant student needs 6) Review next steps for completion of the CNA and service delivery planning
Discussion and Activities Sue and Mary Ann welcomed the group and thanked them for their participation. The members of the Needs Assessment Committee (NAC) introduced themselves. Next, Cari presented the meeting objectives and gave an overview of the packet materials, and reviewed the agenda. Participants took a quiz on the planning cycle provided by the Office of Migrant Education (OME) in its CNA Toolkit (2012) and reviewed the main components of the cycle and the Comprehensive Needs Assessment. Cari reviewed the draft CNA Decisions and Planning Chart

54 | P a g e
(Handout #1) that lists the Concern Statements, Data Sources, Need Indicators, and Need Statement identified during the Needs Assessment Committee (NAC) meeting #1; and reviewed the remaining tasks of the CNA process. The group divided into their 3 Goal Area groups. Following is a list of goal group members.
Goal Areas Group Members
1) School Readiness Jamie, Cheryl, Veronica, Suzanne, Sue, Dee
2) Reading/Writing and Math Terri, Amanda, Linda, Deb
3) Graduation and Services to OSY Kiowa, Larianne, Danielle, Mary Ann
Small Group Activity #1: The 3 goal area groups worked at their tables to review the Concern Statements, Data Sources, Need Indicators, and Need Statements. The groups documented their changes on their group’s activity sheets and their edits/feedback were incorporated into the final version of the 2014‐15 CNA Decisions and Planning Chart. Small Group Activity #2: NAC members worked in their groups to prioritize the concerns by rank ordering each concern (1‐highest priority). Concern statements were ranked according to their order in the 2014‐15 CNA Decisions and Planning Chart as seen below. School Readiness #1 – We are concerned that migrant preschoolers, especially English learners (ELs) do not have access to free, quality early childhood programs and therefore do not have the school readiness skills to be prepared for kindergarten and beyond. #2 – We are concerned that migrant children encounter barriers to school readiness including, but not limited, to, lack of medical/dental care, and lack of transportation. #3 – We are concerned that migrant preschool children in short term (i.e., summer) and non‐school programs are not receiving needs‐based school readiness services due to a lack of a quick, available assessment #4 – We are concerned that while migrant parents value education for their children, they may not know the importance of a preschool education, or have the skills/access to resources to support their children in a manner consistent with school expectations and academic success. Reading/Writing and Mathematics #1 – We are concerned that migrant students, especially English learners/PFS students, have gaps in their education that lead to skill deficiencies and lower proficiency rates on state reading and math assessments. #2 ‐ We are concerned that MEP and school staff (i.e., daytime classroom teachers, classified staff, office staff) lack the skills and strategies to support the unique educational needs, cultural identity, language, and life experiences of migrant students and their parents #3 ‐ We are concerned that migrant parents do not know how to help their children develop educational skills at home and lack access to academic supports (i.e., materials, literature, literacy supports, technology, and community service providers) #4 ‐ We are concerned that migrant students have unmet support services needs such as medical/dental care, mental health services, and transportation that impact participation in school and MEP services which has a direct impact on attendance and academic achievement

55 | P a g e
#5 ‐ We are concerned that migrant students are not participating in migrant‐funded extended academic learning opportunities Graduation and Services to OSY #1 ‐ We are concerned that MEP staff lack knowledge of skills and strategies for engaging and supporting secondary students and OSY #2 ‐ We are concerned that migrant secondary students, especially ELs/PFS students, have a lack of information about credits, grades, and academic accomplishments resulting in a lower graduation rate than their peers due to mobility, school district priorities, and inappropriate strategies #3 ‐ We are concerned that OSY are not aware of the MEP instructional services available to obtain their educational goals, or credits and competencies needed for graduation due to mobility, or the constraints of school districts #4 ‐ We are concerned that migrant secondary students, OSY, and parents lack knowledge of options after high school including postsecondary education and career opportunities #5 ‐ We are concerned that migrant secondary students and OSY have unmet support services needs such as counseling, health care, and mental health services that result in a lack of social and emotional skills needed to be successful in school and in the workplace Small Group Activity #3: NAC members worked in their groups to identify possible solution strategies to address the concerns and need statements. Members of the other two groups participated in a “Gallery Walk” to review and add to the solutions identified by the other groups. The solutions identified are included in the final version of the 2014‐15 CNA Decisions and Planning Chart. Small Group Activity #4: NAC members worked in their goal area groups to prioritize the solutions by each member of the group placing sticky dots next to the most important solutions under each concern and coming to consensus. The solution statements are in order of priority on the 2014‐15 CNA Decisions and Planning Chart. Small group activity #5: NAC members worked in their goal area groups to identify resources and experts/staff to address the concerns and implement the solutions. Members of the other two groups participated in a “Gallery Walk” to review and add to the resources and experts/staff identified by the other groups. The resources and experts identified are included in the 2014‐15 CNA Decisions and Planning Chart. Small group activity #6: The final activity of the day provided NAC members with an opportunity to discuss and document loose ends from the CNA process, suggestions for the CNA report, suggestions for future CNA/SDP meetings, and ways to communicate the CNA to the field. Following are their comments and suggestions. Loose Ends
Early childhood/school readiness needs more data and standardized data
Professional development to MEP staff on CNA and SDP
Short‐term/home‐based assessment for preschool students
56 | P a g e
Coordinate with ECE office at NDE
Training for data reporters
ELP assessment data for migrant students
Graduation rates of urban vs. rural (Grand Island, Omaha, Lincoln & other Class A pulled separate from others) NE has 90% graduation rate, but that may not be realistic/accurate view of our State’s demographics
Continually review data
Accountability to see if solutions work Suggestions for future CNA/SDP meetings
Guidance on how general or specific we should make the solutions or resources
Select a few possible solutions (or prioritize) instead of a long list
Have the other groups star the possible solutions instead of the same group Ways to communicate the CNA to the field
Share at data/recruiter/director meetings
Webinars
“Strategy of the Month” newsletter or tip sheet
Website – local
MEP staff meetings (2 responses)
State/local PAC meetings (3 responses)
Local district meetings
Annual migrant directors’ meeting
NDE Federal Programs meeting
MEP service provider training
MEP booklet
Translate key parts to use with parents
Tri‐fold summary
Websites
Tweeted
Report for Commissioner and other targeted policy makers
Wrap‐up, Follow‐up, Next Steps, and Timelines The group reviewed the next steps and timelines for the CNA as captured below.
Finalize the CNA Decisions and Planning Chart incorporating the work from the 2 NAC meetings
Draft the CNA report (by April 30, 2015)
Incorporate NDE and NAC feedback and finalize the report (by May 20, 2015)
Begin the Service Delivery Planning (SDP) process during 2015‐16
Draft the CNA report and incorporate NDE and NAC feedback and finalize the report.
57 | P a g e
Appendix B CNA Surveys

Nebraska Migrant Education Program – Toolkit: Conducting a Local MEP Needs Assessment 11 | P a g e
TOOL 1‐2A MIGRANT EDUCATION PROGRAM PARENT NEEDS ASSESSMENT SURVEY
Directions: In each area below, please put an “X” by the top three (3) items that you feel will benefit your children MOST to help them be more successful in school.
1. SUPPLEMENTARY INSTRUCTIONAL SERVICES (Mark THREE)
more reading/literacy help English language services General diploma (GED) more mathematics help
H.S. credit programs Information about the Nebraska
education system & requirements
summer programs
drop‐out prevention programs
pre‐school programs
Programs for out‐of‐school youth
instructional technology
graduation/career activities other______________________
2. SUPPORT SERVICES (Mark THREE) interpreting/translating
parenting education
information for out‐of‐school youth
locating resources
counseling for students
career/postsecondary information
books/materials/supplies
health referrals (medical/dental/vision)
information on 0‐4 yr. old services
transportation
referrals to community agencies
other_______________________
mentoring for my child Information on how to help my child in reading and math
3. What TOPICS would you recommend for greater PARENT INVOLVEMENT to help you support your children’s learning? (Mark THREE)
promoting H.S. graduation
school safety (drug/gang awareness)
ways to help with reading & math
Info on options after H.S.
increasing family literacy
young child school readiness
helping with homework
finding community resources
services for binational migrant students
health/nutrition in the home
parent rights/school policies
other_____________________
COMMENTS:

Nebraska Migrant Education Program – Toolkit: Conducting a Local MEP Needs Assessment 12 | P a g e
TOOL 1‐2B PROGRAMA DE EDUCACIÓN MIGRANTE ENCUESTA PARA LOS PADRES
Instrucciones: En cada área a continuación, identifique con “X” los tres (3) elementos que más beneficiarán a sus hijos a tener éxito en la escuela.
1. SERVICIOS EDUCATIVOS SUPLEMENTALES (Marque TRES)
más ayuda con la lectura y escritura
clases de inglés programas de GED
más ayuda con matemáticas
programas para crédito de High School
información sobre el sistema educativo y requisitos en el estado de Nebraska
programas de verano
programas para prevenir la deserción de la escuela
programas preescolares
Programas para jóvenes que no asisten a la escuela
tecnología actividades de graduación/carrera otros______________________
2. SERVICIOS DE APOYO (Marque TRES)
traducción/interpretación
educación sobre la crianza de niños información para jóvenes que no asisten a la escuela
identificar recursos consejería para estudiantes información sobre carreras y universidades
libros y materiales
referencia de salud (médica/dental/vista) información sobre servicios para niños menores de 5 años
transporte referencia a servicios comunitarios otros_______________________
un mentor para mi hijo(a) Información sobre como ayudar a mi hijo(a) en lectura y matemáticas
3. ¿Cuáles TEMAS recomiende usted para incrementar la PARTICIPACIÓN DE PADRES para asistirle en apoyar al aprendizaje de sus niños? (Marque TRES)
promover la graduación de la high school
seguridad en la escuela (conciencia sobre las drogas y pandillas)
como ayudar a sus hijos con la lectura y matemáticas
información sobre opciones después de H.S.
incrementar la alfabetización de la familia
preparación escolar para niños pre‐escolres
ayudando con la tarea
como identificar recursos comunitarios Servicios para estudiantes binacionales
nutrición y salud en casa
derechos de padres/políticas de las escuelas otros_____________________
COMENTARIOS:

Nebraska Migrant Education Program – Toolkit: Conducting a Local MEP Needs Assessment 13 | P a g e
TOOL 1-3 NEBRASKA MIGRANT EDUCATION PROGRAM STAFF NEEDS
ASSESSMENT SURVEY Check all that apply
School____________________ Grade____________________
□ Migrant, ESL, Title I Teacher □ Paraprofessional/tutor
□ Classroom Teacher □ MEP Non‐instructional Staff
□ Principal □ Other_________________
Directions: Please check the areas that you have found through observation or reviewing data that are needed MOST to help migrant children succeed in school.
1. What Supplementary INSTRUCTIONAL SERVICES are needed most? (Check all that apply)
Reading Pre‐kindergarten programs Extended‐day tutoring
Mathematics Out‐of‐school youth services In‐school tutoring
Other content: ___________ PASS or other H.S. programs Summer school services
2. What Supplementary SUPPORT SERVICES are needed most? (Check all that apply)
Books/materials/supplies Health services‐medical/dental Nutrition services
Clothing referrals Counseling for H.S. students Locating community resources
Transportation Post H.S./Career counseling Out‐of‐school youth services
3. What topics would you recommend for PROFESSIONAL DEVELOPMENT to increase educators' capacity to meet the needs of migrant students? (Check all that apply)
Program planning Identification & recruitment Involving migrant parents
Program evaluation Health/medical/dental issues Supplemental ESL strategies
Student assessment Reading/literacy strategies Other_______________________
Curriculum & instruction Mathematics strategies Other_______________________
4. What topics would you recommend for MIGRANT PARENTS to help support their children’s education/achievement? (Check all that apply)
Postsecondary, career, workforce readiness Increasing family literacy Keeping your child safe
Helping with homework Identifying community resources Other_______________________
5. What other ideas do you have to IMPROVE SERVICES to migrant students in Nebraska?
“I know enough about the Migrant Education Program to answer these questions with confidence.”
4= Totally true □ 3= Mostly true □ 2= Hardly true □ 1= Untrue*
*(NOTE: If you check “1”, do not complete the survey)

Nebraska Migrant Education Program – Toolkit: Conducting a Local MEP Needs Assessment 14 | P a g e
TOOL 1‐4A NEBRASKA MIGRANT EDUCATION PROGRAM SECONDARY STUDENT/OUT‐OF‐SCHOOL YOUTH NEEDS ASSESSMENT SURVEY
Check one box: □ I am a high school student □ I am an out‐of‐school youth
Check all that apply: I would like help with…
□ improving my academic skills □ improving my English language skills
□ enrolling in career/technical education programs □ learning about social health issues like STDs, drugs, pregnancy
□ taking a course to make up for credits I am missing □
understanding the importance of staying in school
□ preparing for my end of course assessments □ learning about career options
□ learning about preparing for college □ receiving support services (such as free books, free dental care, free eye exam, etc.)
□ learning about paying for college
Check the best answer to the following:
My Learning Experience Not at all A little Some A lot Not
Applicable
1) I need more help to progress in my studies.
2) I need more help with learning English to do well in school.
3) I need more instruction in basic financial tasks like keeping track of a budget or paying bills.
4) I need more help to earn the high school credits I need to graduate.
5) I need more information about my options after graduation (such as a career or college).
What other ways could the Migrant Education Program help you?
What suggestions do you have for improving the services you receive from the migrant education program?

Nebraska Migrant Education Program – Toolkit: Conducting a Local MEP Needs Assessment 15 | P a g e
TOOL 1‐4BB PROGRAMA DE EDUCACIÓN MIGRANTE DEL ESTADO DE NEBRASKA ENCUESTA PARA ESTUDIANTES
Marque uno: □ Soy un estudiante de “high school” □ Soy un jóven que ha dejado sus estudios
Marca todos los que aplican: Me gustaría ayuda con…
□ mejorar mis habilidades escolares □ mejorar mi inglés
□ inscribirme en programas de carrera o educación técnica □
aprender sobre temas de salud como enfermedades de transmisión sexual, drogas, y embarazo
□ tomar un curso que me falta □ entender la importancia de terminar mis estudios
□ preparación con mis exámenes de fin de curso □ aprender sobre mis opciones de carrera
□ preparación para la universidad □ recibir servicios de apoyo como libros gratuitos y servicios dentales/visión gratuitos
□ preparación en financiar en los estudios universitarios
Marca la mejor respuesta a lo siguiente:
Mi Experiencia Escolar No de Nada Un poco Algo Mucho No me aplica
6) Necesito más ayuda para progresar con mis estudios
7) Necesito más ayuda con el inglés para avanzar en mis estudios
8) Necesito más instrucción en tareas básicas financieras como mantener un presupuesto o pagar las cuentas
9) Necesito ayuda para obtener los créditos de high school que necesito para graduar
10) Necesito más información sobre las opciones que tendré al graduarme (como carrera o universidad)
¿Cómo más te puede ayudar el Programa de Educación Migrante?
¿Qué sugerencias tienes para mejorar los servicios que recibes del Programa de Educación Migrante?

58 | P a g e
Appendix C 2014‐15 CNA Decisions and Planning Chart

Nebraska MEP 2014-15 CNA Decisions and Planning Chart
Areas of Concern: EC=Educational Continuity; IT=Instructional Time; SE=School Engagement; ELD=English language development; ESH=Educational Support in the Home; H=Health; AS=Access to Services 03/11/2015
59
GOAL 1.0: School Readiness
Concern Statement Data Source Need Indicator/Need
Statement Prioritized Solution Strategies
for the SDP Resources/Experts
Areas of
Concern
1‐1 We are concerned that migrant preschoolers, especially English learners (ELs), do not have access to free, quality early childhood programs and therefore do not have the school readiness skills to be prepared for kindergarten and beyond
Teaching Strategies GOLD, PPVT, and PALS assessment results; MIS2000; NAC Goal Group composed of State, regional, and local MEP staff
Indicator: 1) Only 30% of migrant children participated in an ECE program (14% MEP‐funded, 16% non‐MEP‐funded); 2) only 52% of migrant children attending migrant‐funded preschools scored proficient on school readiness assessments which was 38% short of the MPO target (90%)
1. Help parents with preschool enrollment.2. Partner with Head Start and local school districts to provide center‐based preschool services to migrant preschool children. 3. Measure growth by using a standard assessment. 4. Designate migrant students as priority for preschool services based on assessed needs. 5. Assist families in collecting documents needed, forms, etc. 6. Increase growth by using correct assessments. 7. Increased by good academic strategies. 8. Provide supplemental education services to migrant students to enable them to be enrolled in school. 9. Encourage employment in preschools by adults of migrant students.
‐ School districts (programs in place) ‐ Head Start ‐ Partnerships with other grants for support ‐ Bilingual staff ‐ Curriculum ‐ Library programs (1‐2 times per week) ‐ Prime‐time (6 weeks) ‐ Private preschool ‐ Training/certified teachers ‐ PL for preschool teachers ‐ Tablets with age‐appropriate learning apps
EC, IT, AS, ELD
Statement: The percentage of preschool migrant children scoring proficient on school readiness assess‐ments needs to increase by 38%, and at least 50% of migrant children, especially English learners, need to participate in ECE programs
1‐2 We are concerned that migrant children encounter barriers to school readiness including, but not limited to, lack of medical/dental care, and lack of transportation
2013‐14 CSPR; 2012‐13 State of the Nebraska MEP Report; 2013‐14 Parent and Staff Needs Assessment Surveys
Indicator: 1) Only 56% of preschool‐age migrant children received support services in 2013‐14; 2) Only 11% of migrant students received health services in 2012‐13; 3) 36% of migrant parents and 35% of migrant staff indicated a need for transportation to facilitate participation in ECE programs and services
1. Provide avenues for transportation to allow access to health services. 2. Provide transportation for pre‐K students or help students create a transportation plan. 3. Provide or seek resources to pay for health services. 4. Coordinate with CBOs. 5. Seek medical/dental providers, especially in rural areas. 6. Partner with health agencies.
‐ Public transportation‐ Contract with community agencies/district for transportation ‐ Community health centers ‐ Migrant Health (where available) ‐ Lions Club ‐ District emergency funds (NSEA)
H, AS, IT

Nebraska MEP 2014-15 CNA Decisions and Planning Chart
Areas of Concern: EC=Educational Continuity; IT=Instructional Time; SE=School Engagement; ELD=English language development; ESH=Educational Support in the Home; H=Health; AS=Access to Services 03/11/2015
60
Concern Statement Data Source Need Indicator/Need
Statement Prioritized Solution Strategies
for the SDP Resources/Experts
Areas of
Concern
Statement: The percentage of migrant preschool children receiving support services, including health and transportation, needs to increase to 75%
7. Use Mobile Education Van/lab as the hub for the support systems (school readiness, medical/dental personnel for screenings, etc.).
1‐3 We are concerned that migrant preschool children in short term (i.e., summer) and non‐school programs are not receiving needs‐based school readiness services due to a lack of a quick, available assessment
2013‐14 Evaluation Report (MPO 1a)
Indicator: Only 6% of migrant children ages 3‐5 (not in kindergarten) participating in migrant‐funded preschools had school readiness assessment results in 2013‐14.
1. Short common assessment tool.2. Coordination with NDE to access existing data on children ages 3‐5. 3. Curriculum to support short term programs. 4. Staff development to implement new assessment.
‐ NDE Early Childhood data and staff ‐ Teaching Strategies GOLD (selected criteria) ‐ Design assessment for short term PK programs.
EC, IT
Statement: The percentage of migrant children ages 3‐5 assessed for school readiness needs to increase to 35%
1‐4 We are concerned that while migrant parents value education for their children, they may not know the importance of a preschool education, or have the skills/access to resources to support their children in a manner consistent with school expectations and academic success
2013‐14 Parent Needs Assessment Surveys
Indicators: 93% of the 44 parents of preschool migrant children responding to a survey reported a need to learn skills to help their children learn school readiness skills
1. Share school expectations with parents (absences, health issues, etc.) 2. Meet with parents regarding preschool enrollment and to discuss student/family concerns (You Tube video in various languages) 3. Communicate with parents in their home language. 4. Take groups of preschool students on field trips to area preschools. 5. Create demand for preschool attendance with families and support transition to kindergarten. 6. Provide family literacy services or coordinate with CBOs to provide family literacy.
‐MEP staff – home visits to explain expectations ‐ Preschool teachers including Head Start ‐ Parent outreach and communication ‐ Community organizations/ agencies ‐ Hospitals/doctors – information in lobby/office (Ready for Success booklets, calendars) ‐ Dolly Parton Imagination Library (free)
AS, ESH, EC, IT
Statement: The percentage of migrant parents that participate in MEP training/ education needs to increase to 50%

Nebraska MEP 2014-15 CNA Decisions and Planning Chart
Areas of Concern: EC=Educational Continuity; IT=Instructional Time; SE=School Engagement; ELD=English language development; ESH=Educational Support in the Home; H=Health; AS=Access to Services 03/11/2015
61
GOAL 2.0: Reading/Writing and Mathematics
Concern Statement Data Source Need Indicator/Need
Statement Prioritized Solution Strategies
for the SDP Resources/Experts
Areas of
Concern
2‐1 We are concerned that migrant students, especially English learners/ PFS students, have gaps in their education that lead to skill deficiencies and lower proficiency rates on state reading and math assessments.
2014 NeSA Reading and Math results; NAC Goal Group composed of State, regional, and local MEP staff
Indicator: 1) Only 33% of PFS and 49% of non‐PFS migrant students scored proficient or above in reading (compared to 77% of non‐migrant students); 2) only 30% of PFS and 45% of non‐PFS migrant students scored proficient or above in math (compared to 71% of non‐migrant students)
1. Use statewide/local assessments to identify learning needs and create individual instructional plan to address reading, writing, and math. 2. Access to core curriculum with appropriate instructional supports to address academic needs. 3. Focus on academic/NeSA vocabulary. 4. Provide opportunities to learn test taking strategies and provide access to/use of technology. 5. Provide appropriate accommodations.
‐ Instructional coaches‐ Interventionists ‐ Reading specialists ‐ Math specialists ‐ MEP staff & Zoom ‐ ELL teachers, coaches ‐ Teachers (LA/ math) ‐ Tutors (adults, peers, retired teachers; trained/proficient) ‐ Access to timely formative & summative assessments ‐ Standards Instructional Tool ‐Academic language/ vocabulary – PL ‐ Individual instruction plans ‐ Online resources (research‐based/best practices)
EC, IT, SE, ELD
Statement: The percentage of migrant students scoring proficient or above on the NeSA needs to increase by 28% (44% for PFS students) in Reading, and 26% (41% for PFS students) in Math
2‐2 We are concerned that MEP and school staff (i.e., daytime classroom teachers, classified staff, office staff) lack the skills and strategies to support the unique educational needs, cultural identity, language, and life experiences of migrant students and their parents
2013‐14 Staff Needs Assess‐ment Surveys
Indicator: 86% of MEP staff indicated a need for training to address the unique educational and cultural/ language needs of migrant students and parents
1. Increase professional learning for all teachers so that they see themselves as academic language teachers. 2. Provide opportunities for teachers and school staff to interact with and learn from families about culture and educational needs. 3. Provide cultural proficiency training for teachers, school staff, tutors, paras, office staff, and administrators. 4. Opportunities to collaborate – content and language teachers. 5. Provide PL and cross sharing of ideas & practices via website, Google docs. Add to meeting agendas (director/recruiter meetings).
‐ Instructional coaches/ specialists ‐ Curriculum directors/ coordinators ‐ Conferences (statewide reading and math) ‐ Community agencies (multicultural ed) ‐ Parent panel to share stories about culture and experiences‐ Research‐based professional learning: cultural proficiency, migrancy, language acquisition
SE, ELD
Statement: The percentage of MEP and school staff with a need to be prepared to support the unique educational and cultural/ language needs of migrant students and parents needs to decrease to 25%

Nebraska MEP 2014-15 CNA Decisions and Planning Chart
Areas of Concern: EC=Educational Continuity; IT=Instructional Time; SE=School Engagement; ELD=English language development; ESH=Educational Support in the Home; H=Health; AS=Access to Services 03/11/2015
62
Concern Statement Data Source Need Indicator/Need
Statement Prioritized Solution Strategies
for the SDP Resources/Experts
Areas of
Concern
‐ Training & courses for ELL endorsements
2‐3 We are concerned that migrant parents do not know how to help their children develop educational skills at home and lack access to academic supports (i.e., materials, literature, literacy supports, technology, and community service providers)
2013‐14 Parent and Staff Needs Assessment Surveys
Indicators: 1) Migrant parents indicated a need to learn how to help their children with reading and math (41%) and homework (60%), and need books/ materials/supplies (48%); 2) MEP staff reported that parents need training to help them learn skills for helping their children with home‐work (76%), need books/‐materials/supplies (63%), and need training on identifying community resources (61%)
1. Connect families to school 2. Connect to community agencies (i.e., library) to connect families to resources. 3. Provide hands‐on activities for parents/students to learn math/ reading/writing strategies to support students at home (Play Their Way). 4. Utilize home visits to share resources or send home with students. 5. Provide transportation 6. Explore hosting events at alternative locations near work or home. 7. Provide opportunities to use school tools (i.e., PowerSchool, Infinite Campus). 8. Provide interpreters/translated materials. 9. Identify needs and best times to meet (individualized learning plan). 10. Include extended family members, not just parents. 11. Send monthly “tip sheets” with practical ideas. 12. Discuss parent academic expectations.
‐ Parent Advisory Committee‐ Parent liaisons/facilitators ‐ Take‐home resources/ materials (reading/writing/ math) ‐ Community agencies ‐ Library ‐ Access to wi‐fi hot spot especially for districts with one‐to‐one ‐ Mentors for parents ‐ Home visitors ‐ Hotline for parents (Nebraska Help Line)
AS, ESH
Statement: The percentage of migrant parents with a need to learn skills to help their child learn reading and math, help with homework, and access resources needs to decrease to less than 20%
2‐4 We are concerned that migrant students have unmet support services needs such as medical/ dental care, mental health services, and transporta‐tion that impact participation in school and MEP services which has a direct impact on
2013‐14 Parent, Staff, and Student/OSY Needs Assess‐ment Surveys
Indicator: 1) 52% of migrant students/youth indicated a need for support services; 2) migrant parents indicated a need for transportation (36%) and health referrals (20%); 3) MEP staff reported that students and parents need health services (59%) and transportation (35%)
1. Educate parents about available community agencies and programs (provide opportunities for agencies to speak to families). 2. Follow‐up on referrals to see why or why not they are being utilized. 3. Coordinate efforts to get migrant families to existing community health fairs, etc. 4. Provide transportation 5. Provide interpreters and translated materials.6. Understand cultural perspectives or labels.
‐ Local health professionals and health department ‐ Include/share information about school health initiatives ‐ Partnership with local agencies, health fairs, etc. ‐ Social workers ‐ Nurses ‐ Counselors ‐ Mental Health Professionals
H, AS, IT
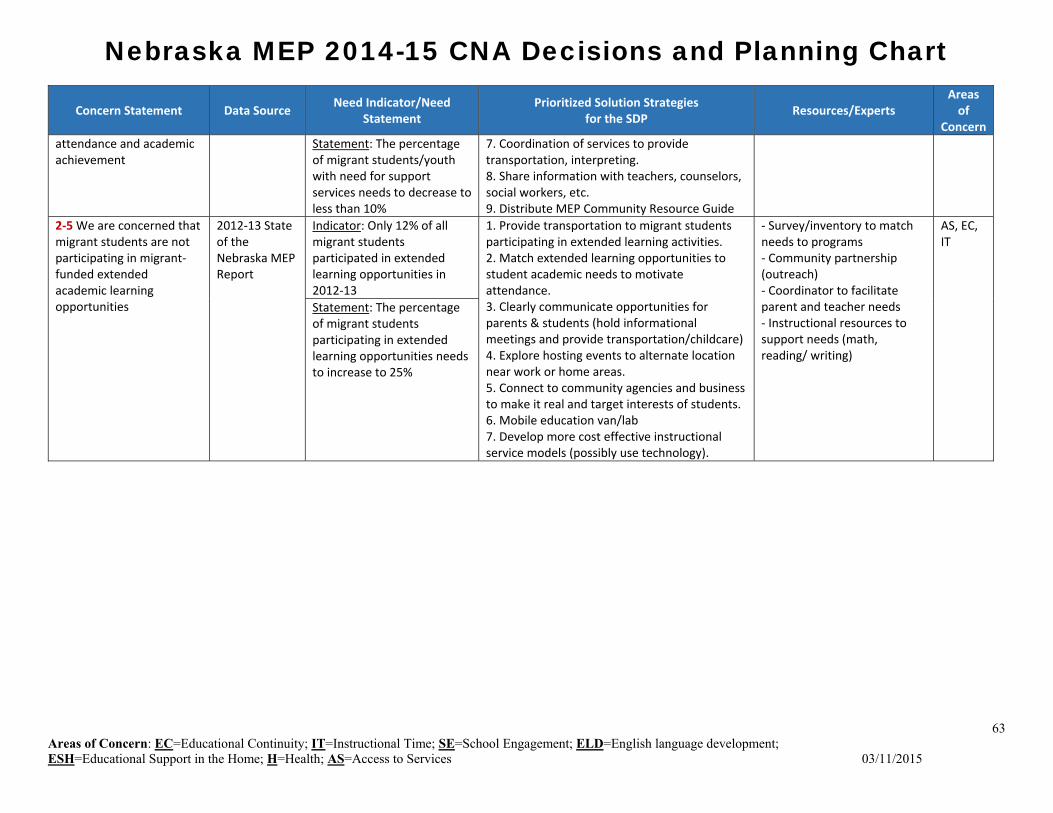
Nebraska MEP 2014-15 CNA Decisions and Planning Chart
Areas of Concern: EC=Educational Continuity; IT=Instructional Time; SE=School Engagement; ELD=English language development; ESH=Educational Support in the Home; H=Health; AS=Access to Services 03/11/2015
63
Concern Statement Data Source Need Indicator/Need
Statement Prioritized Solution Strategies
for the SDP Resources/Experts
Areas of
Concern
attendance and academic achievement
Statement: The percentage of migrant students/youth with need for support services needs to decrease to less than 10%
7. Coordination of services to provide transportation, interpreting. 8. Share information with teachers, counselors, social workers, etc. 9. Distribute MEP Community Resource Guide
2‐5 We are concerned that migrant students are not participating in migrant‐funded extended academic learning opportunities
2012‐13 State of the Nebraska MEP Report
Indicator: Only 12% of all migrant students participated in extended learning opportunities in 2012‐13
1. Provide transportation to migrant students participating in extended learning activities. 2. Match extended learning opportunities to student academic needs to motivate attendance. 3. Clearly communicate opportunities for parents & students (hold informational meetings and provide transportation/childcare) 4. Explore hosting events to alternate location near work or home areas. 5. Connect to community agencies and business to make it real and target interests of students. 6. Mobile education van/lab 7. Develop more cost effective instructional service models (possibly use technology).
‐ Survey/inventory to match needs to programs ‐ Community partnership (outreach) ‐ Coordinator to facilitate parent and teacher needs ‐ Instructional resources to support needs (math, reading/ writing)
AS, EC, IT
Statement: The percentage of migrant students participating in extended learning opportunities needs to increase to 25%

Nebraska MEP 2014-15 CNA Decisions and Planning Chart
Areas of Concern: EC=Educational Continuity; IT=Instructional Time; SE=School Engagement; ELD=English language development; ESH=Educational Support in the Home; H=Health; AS=Access to Services 03/11/2015
64
GOAL 3.0: High School Graduation and Services to OSY
Concern Statement Data Source Need Indicator/Need Statement Possible Solution Strategies for the
SDP Resources/Experts
Areas of
Concern
3‐1 We are concerned that MEP staff lack knowledge of skills and strategies for engaging and supporting secondary students and OSY
NAC Goal Group composed of State, regional, and local MEP staff
Indicator: The NAC goal group indicated a need for staff to improve their skills for engaging and supporting secondary students and OSY
1. Cross sharing of ideas & practices via website, Google doc. Add to meeting agendas (director/recruiter meetings). 2. PL topics: OCR, community resources, SOSOSY materials, higher education, graduation requirements, technology (Zoom, etc.), cultural proficiency online with scheduled follow‐up for accountability. 3. Promote awareness and utilization of SOSOSY instructional materials with all MEP projects/staff. 4. Job shadowing (utilize technology).
‐ SOSOSY training/materials‐ OCR training ‐ Training on postsecondary options ‐ Technology training ‐ Cultural proficiency ‐ Graduation requirements ‐ Time at each state MEP meeting to share OSY/ graduation practices ‐ Online idea sharing space ‐ Time to release employees for job shadowing ‐ SOSOSY trainer ‐ Attorneys ‐ SPED Transition Specialist ‐ ESU technology staff ‐ Carol Rempp @ NDE ‐ NDE & MEP staff
SE
Statement: MEP staff training on strategies for engagement and support of secondary students and OSY needs to be infused into all MEP training in Nebraska
3‐2 We are concerned that migrant secondary students, especially ELs/PFS students, have a lack of information about credits, grades, and academic accomplishments resulting in a lower graduation rate than their peers due to mobility, school district priorities, and inappropriate strategies
2012‐13 State Data Records; 2012‐13 Disaggregated LEP Migrant Student Graduation Rate; 2012‐13 NE MEP Evaluation Report (MPO 3b); 2013‐14 Secondary
Indicator: 1) Only 62% of migrant students (42% of PFS migrant students) graduated in 2012‐13 compared to 89% of non‐migrant students; 2) only 23% of secondary migrant students are on‐track for graduation; 3) of the 21 migrant student dropouts in 2012‐13, 52% were English learners; 4) fewer than 1% of secondary migrant students received credit accrual services in 2012‐13 even though 19% were credit deficient; 5) 79% of secondary‐aged migrant youth
1. Mobile educational lab/vehicle for credit recovery programs. 2. Individual learning/graduation plans for each migrant secondary student. 3. Credit 101 You Tube video in a variety of languages with checklist/ lesson plan/graduation plan/grad requirements. 4. Clearly communicate graduation requirements to both parents & students. 5. Explore PASS, UT, Odyssey, A+ to meet graduation requirements for
‐MEV Committee (Van)‐ OSY Directors, services providers ‐ Technology staff & MEP staff ‐ NDE staff ‐ MEP students and staff ‐ Former OSY serving as student mentors ‐ Attorney draw up sample policy ‐District staff
EC, IT, SE, ELD

Nebraska MEP 2014-15 CNA Decisions and Planning Chart
Areas of Concern: EC=Educational Continuity; IT=Instructional Time; SE=School Engagement; ELD=English language development; ESH=Educational Support in the Home; H=Health; AS=Access to Services 03/11/2015
65
Concern Statement Data Source Need Indicator/Need Statement Possible Solution Strategies for the
SDP Resources/Experts
Areas of
Concern
Student/OSY Needs Assessment Surveys
reported needing more help with learning English to do well in school
districts with large numbers of secondary migrant students. 6. Disseminate information on graduation at alternate locations. 7. Assign a mentor to students.
Statement: The percentage of migrant students graduating from high school needs to increase by 27% (47% for PFS students); and the percentage of secondary migrant students on‐track for graduation needs to increase to 50%
3‐3 We are concerned that OSY are not aware of the MEP instructional services available to obtain their educational goals, or credits and competencies needed for graduation due to mobility, or the constraints of school districts
MSIX Missed Student Report; 2012‐13 State of the NE Report; 2012‐13 MIS2000 Student Summary OSY Report; OSY profile
Indicator: 1) Only 35% of the eligible OSY were served during the regular school year in 2012‐13, and only 36% were served during the summer; 2) only 19% of OSY received instructional services (4% received pre‐GED instruction); 3) on the OSY Profile, high numbers of OSY report dropping out of school due to age and lack of credits
1. Explore mobile educational vehicles (van with wi‐fi and teacher/tutor) technology lab. 2. Migrant‐funded GED paras/tutors (utilize technology). 3. Regional MEPs provide services to OSY to all programs (option for districts to outsource OSY services). 4. Explore providing services at alternate locations (workplace, community). 5. Explore HEP/CAMP options. 6. Online SOSOSY lessons, OSY support groups.
‐ Staff to serve OSY‐ Training in GED ‐ Van(s) and funding ‐ Program outline/startup ‐ Permission from NDE/ project directors for outsourcing OSY services ‐ HEP grant partnership ‐ SOSOSY online lessons (schoology), technology ‐ Space for OSY support group ‐ GED centers/online ‐ Teachers ‐ MEP staff ‐ Van subcommittee ‐ NDE staff ‐ District staff ‐ OSY service providers ‐ Higher education staff
SE, IT, AS, EC
Statement: The percentage of OSY served during the regular year and summer needs to increase to 50%. The percentage of OSY receiving instructional services needs to increase to 30% or more.
3‐4 We are concerned that migrant secondary students, OSY, and parents lack knowledge of options after high school including
2013‐14 Parent, Staff, and Secondary Student/OSY
Indicators: 1) 86% of secondary students/OSY indicated a need for more information about options after graduation; 2) 17% of migrant parents indicated a need for
1. Transition from MEP plan for each student and You Tube video (student project/LOR). 2. Explore interest inventories in multiple languages.
‐Transition template (part of ILP) ‐You Tube transition video ‐Interest inventory
SE, AS, ESH
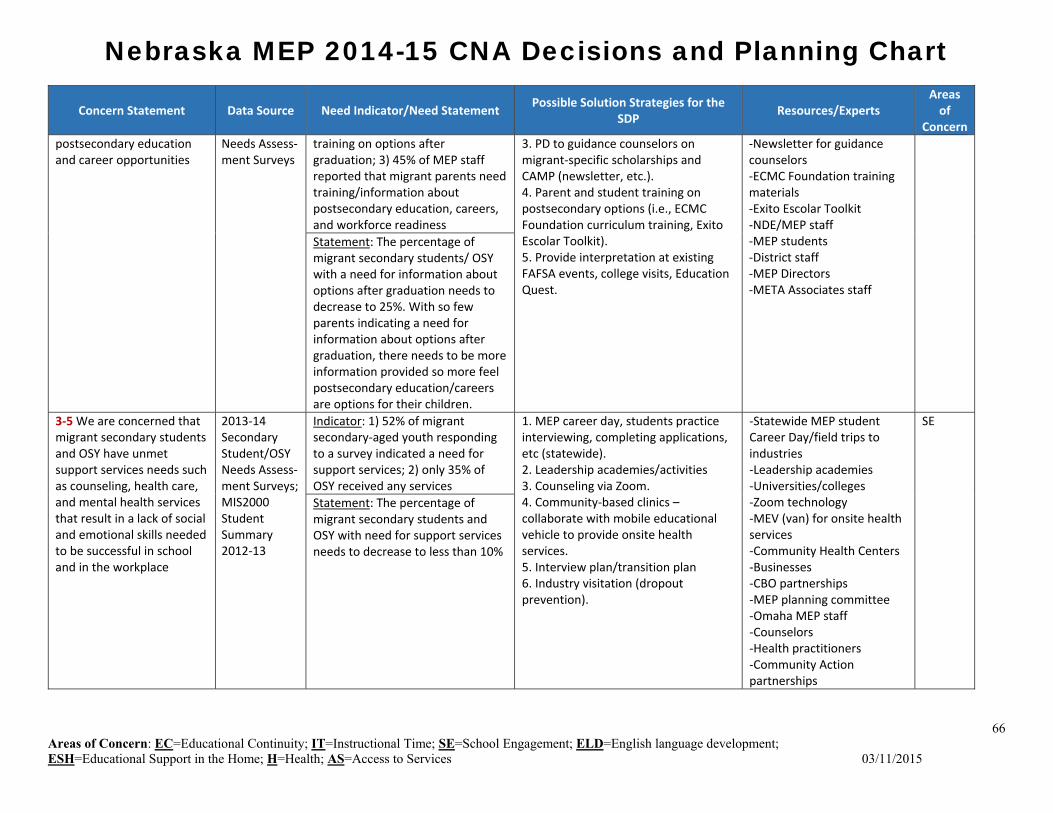
Nebraska MEP 2014-15 CNA Decisions and Planning Chart
Areas of Concern: EC=Educational Continuity; IT=Instructional Time; SE=School Engagement; ELD=English language development; ESH=Educational Support in the Home; H=Health; AS=Access to Services 03/11/2015
66
Concern Statement Data Source Need Indicator/Need Statement Possible Solution Strategies for the
SDP Resources/Experts
Areas of
Concern
postsecondary education and career opportunities
Needs Assess‐ment Surveys
training on options after graduation; 3) 45% of MEP staff reported that migrant parents need training/information about postsecondary education, careers, and workforce readiness
3. PD to guidance counselors on migrant‐specific scholarships and CAMP (newsletter, etc.). 4. Parent and student training on postsecondary options (i.e., ECMC Foundation curriculum training, Exito Escolar Toolkit). 5. Provide interpretation at existing FAFSA events, college visits, Education Quest.
‐Newsletter for guidance counselors ‐ECMC Foundation training materials ‐Exito Escolar Toolkit ‐NDE/MEP staff ‐MEP students ‐District staff ‐MEP Directors ‐META Associates staff
Statement: The percentage of migrant secondary students/ OSY with a need for information about options after graduation needs to decrease to 25%. With so few parents indicating a need for information about options after graduation, there needs to be more information provided so more feel postsecondary education/careers are options for their children.
3‐5 We are concerned that migrant secondary students and OSY have unmet support services needs such as counseling, health care, and mental health services that result in a lack of social and emotional skills needed to be successful in school and in the workplace
2013‐14 Secondary Student/OSY Needs Assess‐ment Surveys; MIS2000 Student Summary 2012‐13
Indicator: 1) 52% of migrant secondary‐aged youth responding to a survey indicated a need for support services; 2) only 35% of OSY received any services
1. MEP career day, students practice interviewing, completing applications, etc (statewide). 2. Leadership academies/activities 3. Counseling via Zoom. 4. Community‐based clinics – collaborate with mobile educational vehicle to provide onsite health services. 5. Interview plan/transition plan 6. Industry visitation (dropout prevention).
‐Statewide MEP student Career Day/field trips to industries ‐Leadership academies ‐Universities/colleges ‐Zoom technology ‐MEV (van) for onsite health services ‐Community Health Centers ‐Businesses ‐CBO partnerships ‐MEP planning committee ‐Omaha MEP staff ‐Counselors ‐Health practitioners ‐Community Action partnerships
SE
Statement: The percentage of migrant secondary students and OSY with need for support services needs to decrease to less than 10%