Embed Size (px)
Citation preview
ORIGINAL ARTICLE
npgCell Research (2015) :1-16.© 2015 IBCB, SIBS, CAS All rights reserved 1001-0602/15 $ 32.00www.nature.com/cr
cMyc-mediated activation of serine biosynthesis pathway
is critical for cancer progression under nutrient
deprivation conditions
Linchong Sun1, *, Libing Song2, *, Qianfen Wan3, Gongwei Wu1, Xinghua Li2, Yinghui Wang1, Jin Wang3, Zhaoji Liu1, Xiuying Zhong1, Xiaoping He1, Shengqi Shen1, Xin Pan4, Ailing Li4, Yulan Wang3, 5, Ping Gao1, Huiru Tang3, 6, Huafeng Zhang1
1CAS Key Laboratory of Innate Immunity and Chronic Disease, Innovation Center for Cell Signaling Network, School of Life Sci-
ence, University of Science and Technology of China, Hefei, Anhui 230027, China; 2State Key Laboratory of Oncology in South-
ern China and Departments of Experimental Research, Sun Yat-sen University Cancer Center, Guangzhou, Guangdong 510060,
China; 3CAS Key Laboratory of Magnetic Resonance in Biological Systems, Wuhan Institute of Physics and Mathematics, Chinese
Academy of Sciences, Wuhan, Hubei 430071, China; 4State Key Laboratory of Proteomics, China National Center of Biomedical
Analysis, Beijing 100850, China; 5Collaborative Innovation Center for Diagnosis and Treatment of Infectious Diseases, Zhejiang
University, Hangzhou, Zhejiang 310058, China; 6State Key Laboratory of Genetic Engineering, Collaborative Innovation Center
for Genetics and Development, Fudan University, Shanghai 200433, China
Cancer cells are known to undergo metabolic reprogramming to sustain survival and rapid proliferation, however,
it remains to be fully elucidated how oncogenic lesions coordinate the metabolic switch under various stressed condi-
tions. Here we show that deprivation of glucose or glutamine, two major nutrition sources for cancer cells, dramat-
ically activated serine biosynthesis pathway (SSP) that was accompanied by elevated cMyc expression. We further
identiied that cMyc stimulated SSP activation by transcriptionally upregulating expression of multiple SSP enzymes. Moreover, we demonstrated that SSP activation facilitated by cMyc led to elevated glutathione (GSH) production,
cell cycle progression and nucleic acid synthesis, which are essential for cell survival and proliferation especially un-
der nutrient-deprived conditions. We further uncovered that phosphoserine phosphatase (PSPH), the inal rate-lim-
iting enzyme of the SSP pathway, is critical for cMyc-driven cancer progression both in vitro and in vivo, and impor-
tantly, aberrant expression of PSPH is highly correlated with mortality in hepatocellular carcinoma (HCC) patients,
suggesting a potential causal relation between this cMyc-regulated enzyme, or SSP activation in general, and cancer development. Taken together, our results reveal that aberrant expression of cMyc leads to the enhanced SSP activa-
tion, an essential part of metabolic switch, to facilitate cancer progression under nutrient-deprived conditions.
Keywords: cMyc; SSP; metabolism; PSPH; cancer
Cell Research advance online publication 20 March 2015; doi:10.1038/cr.2015.33
*These two authors contributed equally to this work.Correspondence: Huafeng Zhanga, Huiru Tangb, Ping Gaoc
aE-mail: [email protected]: [email protected]: [email protected] 29 September 2014; revised 26 December 2014; accepted 14 January 2015
Introduction
Cancer cells are known to adopt metabolic switch for
energy supply and building blocks necessary for rapid proliferation under different stressed conditions. As two vital energy sources in favor of Warburg effect, glucose and glutamine are avidly used by proliferating cancer cells to provide not only ATP but also carbon and nitro-gen sources for the biosynthesis of proteins, nucleotides and lipids, and reducing powers, etc. [1-4]. Glucose can sustain rapid cancer cell proliferation through high lev-els of glycolysis or providing metabolic intermediates for PPP pathway to synthesize biomacromolecules [5], whereas glutamine contributes to multiple biosynthetic
2
cMyc activates serine biosynthesis pathwaysnpg
Cell Research | www.nature.com/cr
pathways and governs redox homeostasis in addition to supporting the TCA cycle and lipogenesis by decompos-ing into α-ketoglutarate (α-KG), especially under hypox-ic conditions [2, 6-8]. As a result, cancer cells are highly dependent on glucose and glutamine for survival and proliferation, and their deprivation leads to severe cell death. However, the metabolism of glucose and gluta-mine is complicated and their regulation mechanisms are not fully understood. Speciically, we are still unaware of what speciic and detailed metabolic responses that can-cer cells would undertake when deprived of glucose or glutamine.
Also critical for cell proliferation are serine and glycine, two non-essential amino acids in mammals [9, 10], which are known for their functions in phospholipid synthesis and cystathionine formation in central nervous system [11, 12]. Interestingly, it has been reported re-cently that these two amino acids play important roles in cancer progression [13-16]. Glycolytic metabolism of glucose provides metabolite of 3-PG which can be cata-lyzed by 3-phosphoglycerate dehydrogenase (PHGDH), phosphoserine aminotransferase (PSAT1) and phos-phoserine phosphatase (PSPH) into serine, during which glycine is produced through the inter-conversion between serine and glycine by serine hydroxymethyltransferase (SHMT1/2) [17-19]. Serine and glycine synthesis is ac-companied by the production of GSH, a tripeptide that is comprised of glycine, glutamate and cysteine, con-tributing to the redox balance in cells as reactive oxygen species (ROS) scavenger [20-23]. Serine and glycine are also involved in nucleotide synthesis, thus entering into one-carbon metabolism and promoting cancer cell pro-liferation [14, 18, 24]. It was reported recently that, upon serine starvation, p53 activates p21 to promote GSH production to combat ROS [25, 26]. Additionally, p73, ATF4, G9A, HIF1 and PKCζ were also reported to regu-late serine biosynthesis and metabolism [27-31]. Howev-er, compared to the profound understanding of glycolysis and glutaminolysis in cancer cells, we are only begin-ning to appreciate the critical impact of serine synthesis pathway (SSP) on cancer progression. It remains largely unexplored as to how this pathway is regulated under normal or stressed conditions.
Among numerous notable transcriptional factors, cMyc is well known to regulate up to 10%-15% human genes involved in cell cycle, development, apoptosis and metabolism [32-34]. Interestingly, it has been suggest-ed recently that cMyc is posed to amplify all the extant expressed genes [35, 36]. More recently, new evidence emerges to reveal that cMyc selectively fine-tunes ex-pression of many important genes essential for cell growth and cancer progression [37-39]. All these results
point to the enigmatic roles and underlying mechanisms for cMyc yet to be further elucidated under developmen-tal or oncogenic circumstances. cMyc has been exten-sively documented to regulate glucose, glutamine and nucleotides metabolism [7, 40-43], nevertheless, it is un-clear whether cMyc also controls the serine/glycine me-tabolism, especially under nutrient-deprived conditions.
As cancer cells normally undergo a comprehensive metabolic reprogramming that involves multiple major metabolic pathways, we surmised that the metabolic networks of glucose, glutamine and serine/glycine are coordinately regulated and intertwined during cancer progression under stressed conditions. Here, we report that the expressions of all the major enzymes involved in SSP are comprehensively activated when cancer cells are deprived of glucose or glutamine. We further demon-strate that oncogenic cMyc plays a vital role in this pro-cess by coordination of glycolysis, glutaminolysis, and importantly, SSP to promote cancer cell survival and pro-gression under the nutrient-deprived conditions. More-over, we uncover that aberrant expression of SSP enzyme PSPH is critical for cMyc-mediated cancer progression. Taken together, our indings illustrate a previously unap-preciated role for cMyc to orchestrate a comprehensive metabolic changes leading to SSP activation and cancer proliferation.
Results
The pathways leading to serine biosynthesis are activat-
ed under nutrient deprivation conditions
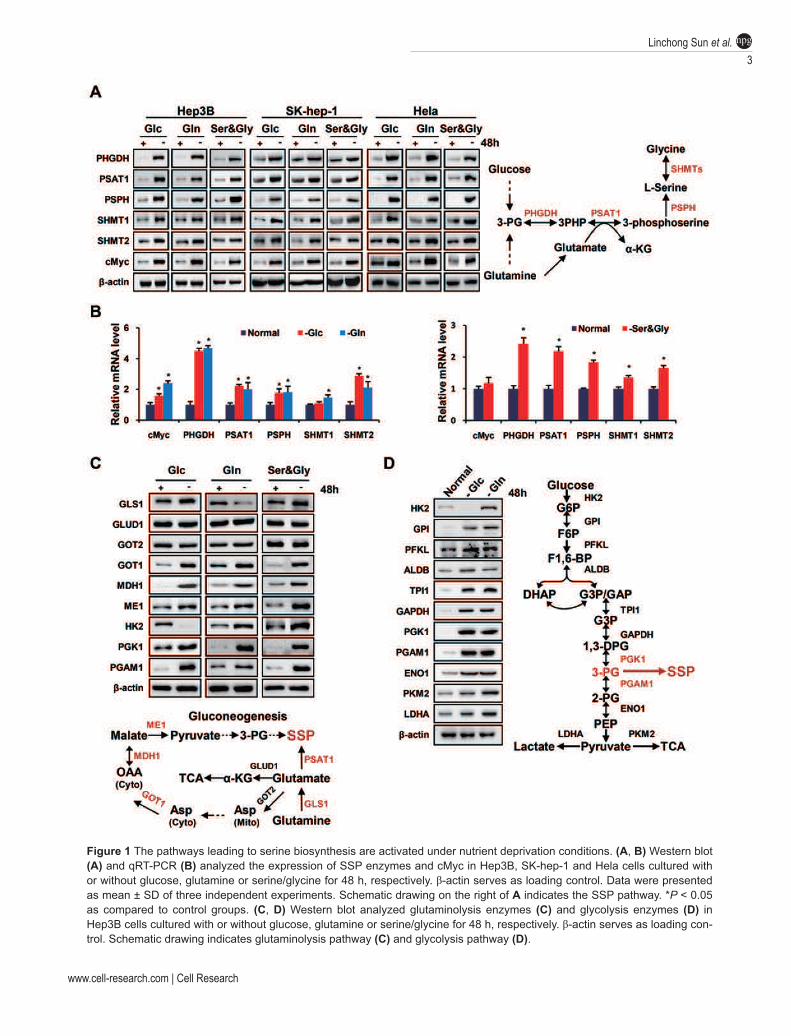
Previous studies have shown that serine is important for cancer proliferation and that serine/glycine depri-vation triggers activation of SSP [25]. However, while glucose and glutamine are the major sources for energy supply and anabolic metabolisms for cancer cell prolif-eration, the effects of glucose/glutamine deprivation on activation of SSP and the underlying mechanisms are still largely unknown. Hence we irst examined SSP en-zyme expressions under glucose/glutamine deprivation conditions compared with serine/glycine deprivation conditions. Western blot assay revealed that the pro-tein levels of 5 major SSP enzymes, PHGDH, PSAT1, PSPH, SHMT1 and SHMT2, were all elevated under glucose- or glutamine- or serine/glycine-deprived con-ditions in Hep3B human hepatoma cells. Similar results were observed in SK-hep-1 and Hela cells (Figure 1A). Additionally, the mRNA levels of these enzymes were also increased in Hep3B cells (Figure 1B), suggesting transcriptional activation of SSP genes under glucose- or glutamine- or serine/glycine-deprived conditions.
The pathways leading to SSP are complicated. In brief,
Linchong Sun et al.
3
npg
www.cell-research.com | Cell Research
Figure 1 The pathways leading to serine biosynthesis are activated under nutrient deprivation conditions. (A, B) Western blot
(A) and qRT-PCR (B) analyzed the expression of SSP enzymes and cMyc in Hep3B, SK-hep-1 and Hela cells cultured with
or without glucose, glutamine or serine/glycine for 48 h, respectively. β-actin serves as loading control. Data were presented
as mean ± SD of three independent experiments. Schematic drawing on the right of A indicates the SSP pathway. *P < 0.05
as compared to control groups. (C, D) Western blot analyzed glutaminolysis enzymes (C) and glycolysis enzymes (D) in
Hep3B cells cultured with or without glucose, glutamine or serine/glycine for 48 h, respectively. β-actin serves as loading con-
trol. Schematic drawing indicates glutaminolysis pathway (C) and glycolysis pathway (D).
4
cMyc activates serine biosynthesis pathwaysnpg
Cell Research | www.nature.com/cr
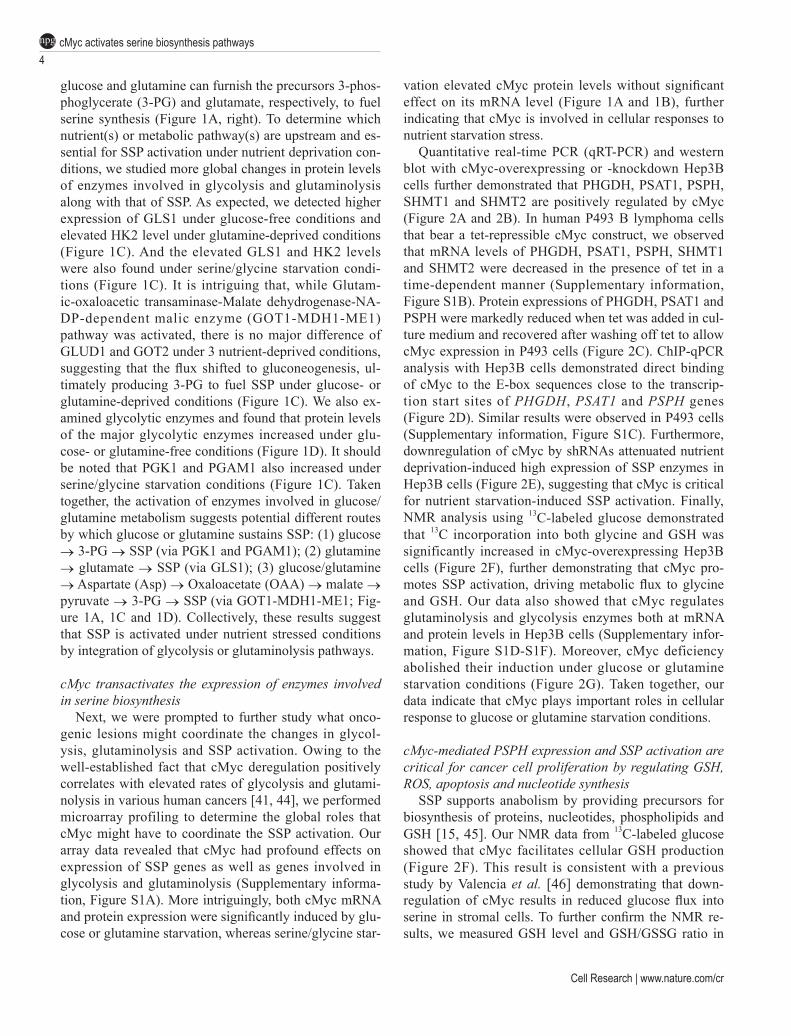
glucose and glutamine can furnish the precursors 3-phos-phoglycerate (3-PG) and glutamate, respectively, to fuel serine synthesis (Figure 1A, right). To determine which nutrient(s) or metabolic pathway(s) are upstream and es-sential for SSP activation under nutrient deprivation con-ditions, we studied more global changes in protein levels of enzymes involved in glycolysis and glutaminolysis along with that of SSP. As expected, we detected higher expression of GLS1 under glucose-free conditions and elevated HK2 level under glutamine-deprived conditions (Figure 1C). And the elevated GLS1 and HK2 levels were also found under serine/glycine starvation condi-tions (Figure 1C). It is intriguing that, while Glutam-ic-oxaloacetic transaminase-Malate dehydrogenase-NA-DP-dependent malic enzyme (GOT1-MDH1-ME1) pathway was activated, there is no major difference of GLUD1 and GOT2 under 3 nutrient-deprived conditions, suggesting that the lux shifted to gluconeogenesis, ul-timately producing 3-PG to fuel SSP under glucose- or glutamine-deprived conditions (Figure 1C). We also ex-amined glycolytic enzymes and found that protein levels of the major glycolytic enzymes increased under glu-cose- or glutamine-free conditions (Figure 1D). It should be noted that PGK1 and PGAM1 also increased under serine/glycine starvation conditions (Figure 1C). Taken together, the activation of enzymes involved in glucose/glutamine metabolism suggests potential different routes by which glucose or glutamine sustains SSP: (1) glucose → 3-PG → SSP (via PGK1 and PGAM1); (2) glutamine → glutamate → SSP (via GLS1); (3) glucose/glutamine → Aspartate (Asp) → Oxaloacetate (OAA) → malate → pyruvate → 3-PG → SSP (via GOT1-MDH1-ME1; Fig-ure 1A, 1C and 1D). Collectively, these results suggest that SSP is activated under nutrient stressed conditions by integration of glycolysis or glutaminolysis pathways.
cMyc transactivates the expression of enzymes involved
in serine biosynthesis
Next, we were prompted to further study what onco-genic lesions might coordinate the changes in glycol-ysis, glutaminolysis and SSP activation. Owing to the well-established fact that cMyc deregulation positively correlates with elevated rates of glycolysis and glutami-nolysis in various human cancers [41, 44], we performed microarray profiling to determine the global roles that cMyc might have to coordinate the SSP activation. Our array data revealed that cMyc had profound effects on expression of SSP genes as well as genes involved in glycolysis and glutaminolysis (Supplementary informa-tion, Figure S1A). More intriguingly, both cMyc mRNA and protein expression were signiicantly induced by glu-cose or glutamine starvation, whereas serine/glycine star-
vation elevated cMyc protein levels without signiicant effect on its mRNA level (Figure 1A and 1B), further indicating that cMyc is involved in cellular responses to nutrient starvation stress.
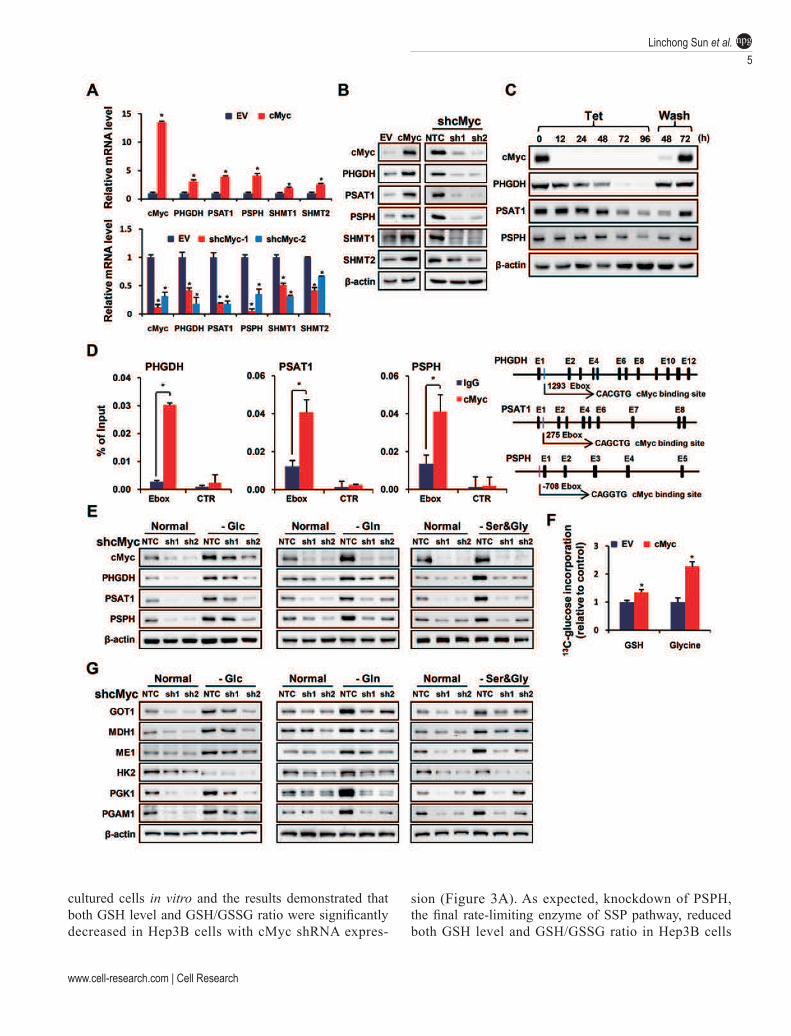
Quantitative real-time PCR (qRT-PCR) and western blot with cMyc-overexpressing or -knockdown Hep3B cells further demonstrated that PHGDH, PSAT1, PSPH, SHMT1 and SHMT2 are positively regulated by cMyc (Figure 2A and 2B). In human P493 B lymphoma cells that bear a tet-repressible cMyc construct, we observed that mRNA levels of PHGDH, PSAT1, PSPH, SHMT1 and SHMT2 were decreased in the presence of tet in a time-dependent manner (Supplementary information, Figure S1B). Protein expressions of PHGDH, PSAT1 and PSPH were markedly reduced when tet was added in cul-ture medium and recovered after washing off tet to allow cMyc expression in P493 cells (Figure 2C). ChIP-qPCR analysis with Hep3B cells demonstrated direct binding of cMyc to the E-box sequences close to the transcrip-tion start sites of PHGDH, PSAT1 and PSPH genes (Figure 2D). Similar results were observed in P493 cells (Supplementary information, Figure S1C). Furthermore, downregulation of cMyc by shRNAs attenuated nutrient deprivation-induced high expression of SSP enzymes in Hep3B cells (Figure 2E), suggesting that cMyc is critical for nutrient starvation-induced SSP activation. Finally, NMR analysis using 13C-labeled glucose demonstrated that 13C incorporation into both glycine and GSH was significantly increased in cMyc-overexpressing Hep3B cells (Figure 2F), further demonstrating that cMyc pro-motes SSP activation, driving metabolic lux to glycine and GSH. Our data also showed that cMyc regulates glutaminolysis and glycolysis enzymes both at mRNA and protein levels in Hep3B cells (Supplementary infor-mation, Figure S1D-S1F). Moreover, cMyc deficiency abolished their induction under glucose or glutamine starvation conditions (Figure 2G). Taken together, our data indicate that cMyc plays important roles in cellular response to glucose or glutamine starvation conditions.
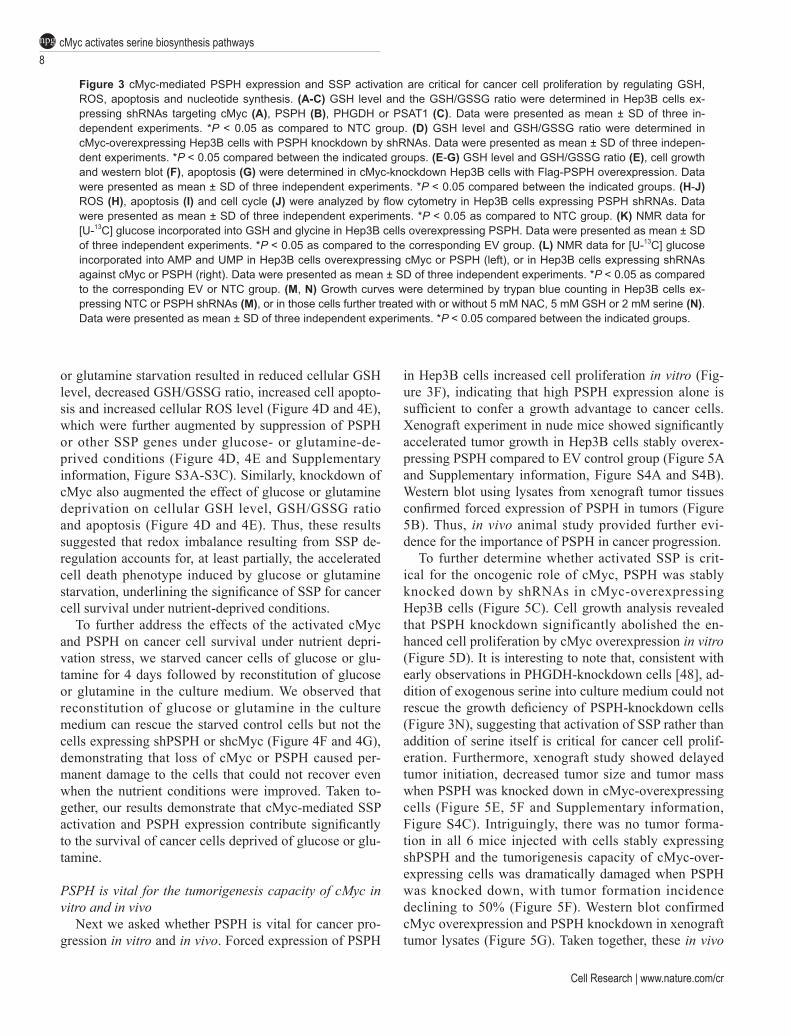
cMyc-mediated PSPH expression and SSP activation are
critical for cancer cell proliferation by regulating GSH,
ROS, apoptosis and nucleotide synthesis
SSP supports anabolism by providing precursors for biosynthesis of proteins, nucleotides, phospholipids and GSH [15, 45]. Our NMR data from 13C-labeled glucose showed that cMyc facilitates cellular GSH production (Figure 2F). This result is consistent with a previous study by Valencia et al. [46] demonstrating that down-regulation of cMyc results in reduced glucose lux into serine in stromal cells. To further conirm the NMR re-sults, we measured GSH level and GSH/GSSG ratio in
Linchong Sun et al.
5
npg
www.cell-research.com | Cell Research
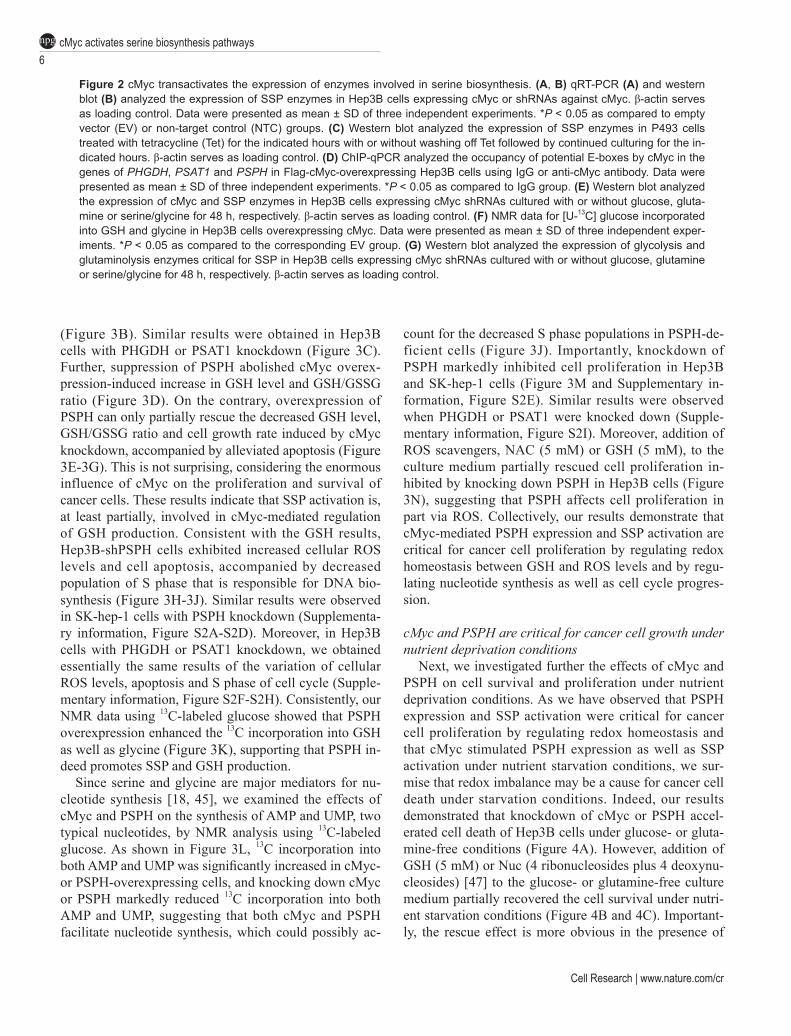
cultured cells in vitro and the results demonstrated that both GSH level and GSH/GSSG ratio were signiicantly decreased in Hep3B cells with cMyc shRNA expres-
sion (Figure 3A). As expected, knockdown of PSPH, the inal rate-limiting enzyme of SSP pathway, reduced both GSH level and GSH/GSSG ratio in Hep3B cells
6
cMyc activates serine biosynthesis pathwaysnpg
Cell Research | www.nature.com/cr
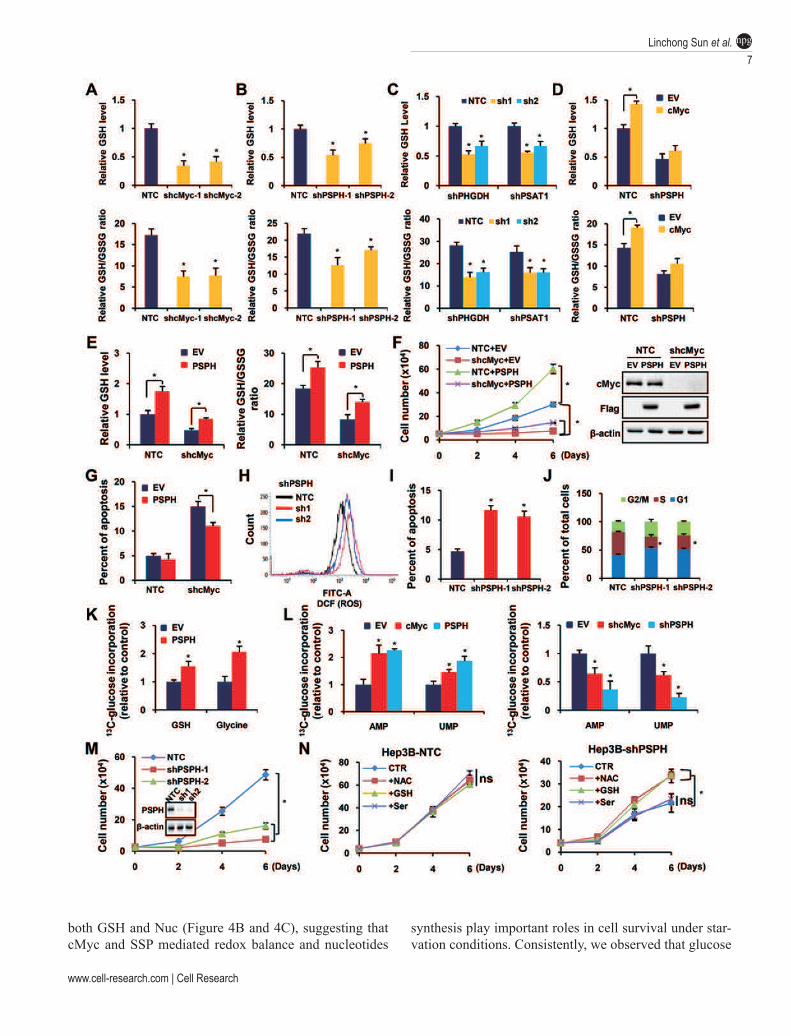
(Figure 3B). Similar results were obtained in Hep3B cells with PHGDH or PSAT1 knockdown (Figure 3C). Further, suppression of PSPH abolished cMyc overex-pression-induced increase in GSH level and GSH/GSSG ratio (Figure 3D). On the contrary, overexpression of PSPH can only partially rescue the decreased GSH level, GSH/GSSG ratio and cell growth rate induced by cMyc knockdown, accompanied by alleviated apoptosis (Figure 3E-3G). This is not surprising, considering the enormous influence of cMyc on the proliferation and survival of cancer cells. These results indicate that SSP activation is, at least partially, involved in cMyc-mediated regulation of GSH production. Consistent with the GSH results, Hep3B-shPSPH cells exhibited increased cellular ROS levels and cell apoptosis, accompanied by decreased population of S phase that is responsible for DNA bio-synthesis (Figure 3H-3J). Similar results were observed in SK-hep-1 cells with PSPH knockdown (Supplementa-ry information, Figure S2A-S2D). Moreover, in Hep3B cells with PHGDH or PSAT1 knockdown, we obtained essentially the same results of the variation of cellular ROS levels, apoptosis and S phase of cell cycle (Supple-mentary information, Figure S2F-S2H). Consistently, our NMR data using 13C-labeled glucose showed that PSPH overexpression enhanced the 13C incorporation into GSH as well as glycine (Figure 3K), supporting that PSPH in-deed promotes SSP and GSH production.
Since serine and glycine are major mediators for nu-cleotide synthesis [18, 45], we examined the effects of cMyc and PSPH on the synthesis of AMP and UMP, two typical nucleotides, by NMR analysis using 13C-labeled glucose. As shown in Figure 3L, 13C incorporation into both AMP and UMP was signiicantly increased in cMyc- or PSPH-overexpressing cells, and knocking down cMyc or PSPH markedly reduced 13C incorporation into both AMP and UMP, suggesting that both cMyc and PSPH facilitate nucleotide synthesis, which could possibly ac-
count for the decreased S phase populations in PSPH-de-ficient cells (Figure 3J). Importantly, knockdown of PSPH markedly inhibited cell proliferation in Hep3B and SK-hep-1 cells (Figure 3M and Supplementary in-formation, Figure S2E). Similar results were observed when PHGDH or PSAT1 were knocked down (Supple-mentary information, Figure S2I). Moreover, addition of ROS scavengers, NAC (5 mM) or GSH (5 mM), to the culture medium partially rescued cell proliferation in-hibited by knocking down PSPH in Hep3B cells (Figure 3N), suggesting that PSPH affects cell proliferation in part via ROS. Collectively, our results demonstrate that cMyc-mediated PSPH expression and SSP activation are critical for cancer cell proliferation by regulating redox homeostasis between GSH and ROS levels and by regu-lating nucleotide synthesis as well as cell cycle progres-sion.
cMyc and PSPH are critical for cancer cell growth under
nutrient deprivation conditions
Next, we investigated further the effects of cMyc and PSPH on cell survival and proliferation under nutrient deprivation conditions. As we have observed that PSPH expression and SSP activation were critical for cancer cell proliferation by regulating redox homeostasis and that cMyc stimulated PSPH expression as well as SSP activation under nutrient starvation conditions, we sur-mise that redox imbalance may be a cause for cancer cell death under starvation conditions. Indeed, our results demonstrated that knockdown of cMyc or PSPH accel-erated cell death of Hep3B cells under glucose- or gluta-mine-free conditions (Figure 4A). However, addition of GSH (5 mM) or Nuc (4 ribonucleosides plus 4 deoxynu-cleosides) [47] to the glucose- or glutamine-free culture medium partially recovered the cell survival under nutri-ent starvation conditions (Figure 4B and 4C). Important-ly, the rescue effect is more obvious in the presence of
Figure 2 cMyc transactivates the expression of enzymes involved in serine biosynthesis. (A, B) qRT-PCR (A) and western
blot (B) analyzed the expression of SSP enzymes in Hep3B cells expressing cMyc or shRNAs against cMyc. β-actin serves
as loading control. Data were presented as mean ± SD of three independent experiments. *P < 0.05 as compared to empty
vector (EV) or non-target control (NTC) groups. (C) Western blot analyzed the expression of SSP enzymes in P493 cells
treated with tetracycline (Tet) for the indicated hours with or without washing off Tet followed by continued culturing for the in-
dicated hours. β-actin serves as loading control. (D) ChIP-qPCR analyzed the occupancy of potential E-boxes by cMyc in the
genes of PHGDH, PSAT1 and PSPH in Flag-cMyc-overexpressing Hep3B cells using IgG or anti-cMyc antibody. Data were
presented as mean ± SD of three independent experiments. *P < 0.05 as compared to IgG group. (E) Western blot analyzed
the expression of cMyc and SSP enzymes in Hep3B cells expressing cMyc shRNAs cultured with or without glucose, gluta-
mine or serine/glycine for 48 h, respectively. β-actin serves as loading control. (F) NMR data for [U-13
C] glucose incorporated
into GSH and glycine in Hep3B cells overexpressing cMyc. Data were presented as mean ± SD of three independent exper-
iments. *P < 0.05 as compared to the corresponding EV group. (G) Western blot analyzed the expression of glycolysis and
glutaminolysis enzymes critical for SSP in Hep3B cells expressing cMyc shRNAs cultured with or without glucose, glutamine
or serine/glycine for 48 h, respectively. β-actin serves as loading control.
Linchong Sun et al.
7
npg
www.cell-research.com | Cell Research
both GSH and Nuc (Figure 4B and 4C), suggesting that cMyc and SSP mediated redox balance and nucleotides
synthesis play important roles in cell survival under star-vation conditions. Consistently, we observed that glucose
8
cMyc activates serine biosynthesis pathwaysnpg
Cell Research | www.nature.com/cr
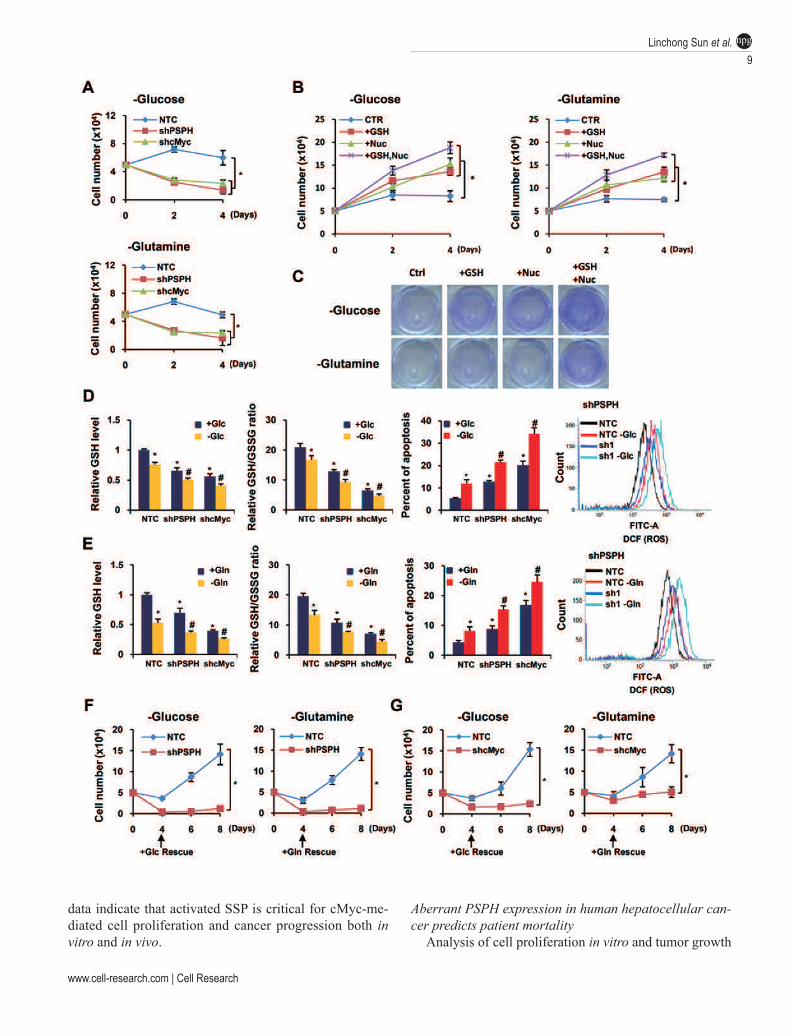
or glutamine starvation resulted in reduced cellular GSH level, decreased GSH/GSSG ratio, increased cell apopto-sis and increased cellular ROS level (Figure 4D and 4E), which were further augmented by suppression of PSPH or other SSP genes under glucose- or glutamine-de-prived conditions (Figure 4D, 4E and Supplementary information, Figure S3A-S3C). Similarly, knockdown of cMyc also augmented the effect of glucose or glutamine deprivation on cellular GSH level, GSH/GSSG ratio and apoptosis (Figure 4D and 4E). Thus, these results suggested that redox imbalance resulting from SSP de-regulation accounts for, at least partially, the accelerated cell death phenotype induced by glucose or glutamine starvation, underlining the signiicance of SSP for cancer cell survival under nutrient-deprived conditions.
To further address the effects of the activated cMyc and PSPH on cancer cell survival under nutrient depri-vation stress, we starved cancer cells of glucose or glu-tamine for 4 days followed by reconstitution of glucose or glutamine in the culture medium. We observed that reconstitution of glucose or glutamine in the culture medium can rescue the starved control cells but not the cells expressing shPSPH or shcMyc (Figure 4F and 4G), demonstrating that loss of cMyc or PSPH caused per-manent damage to the cells that could not recover even when the nutrient conditions were improved. Taken to-gether, our results demonstrate that cMyc-mediated SSP activation and PSPH expression contribute signiicantly to the survival of cancer cells deprived of glucose or glu-tamine.
PSPH is vital for the tumorigenesis capacity of cMyc in
vitro and in vivo
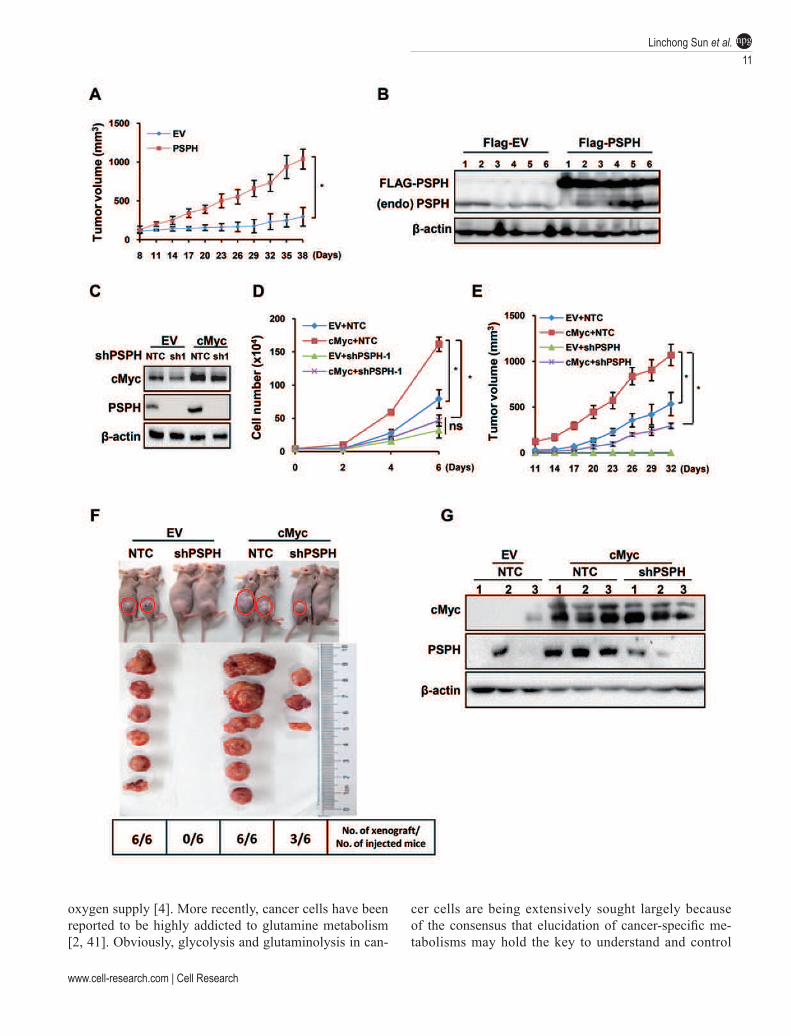
Next we asked whether PSPH is vital for cancer pro-gression in vitro and in vivo. Forced expression of PSPH
in Hep3B cells increased cell proliferation in vitro (Fig-ure 3F), indicating that high PSPH expression alone is suficient to confer a growth advantage to cancer cells. Xenograft experiment in nude mice showed signiicantly accelerated tumor growth in Hep3B cells stably overex-pressing PSPH compared to EV control group (Figure 5A and Supplementary information, Figure S4A and S4B). Western blot using lysates from xenograft tumor tissues conirmed forced expression of PSPH in tumors (Figure 5B). Thus, in vivo animal study provided further evi-dence for the importance of PSPH in cancer progression.
To further determine whether activated SSP is crit-ical for the oncogenic role of cMyc, PSPH was stably knocked down by shRNAs in cMyc-overexpressing Hep3B cells (Figure 5C). Cell growth analysis revealed that PSPH knockdown significantly abolished the en-hanced cell proliferation by cMyc overexpression in vitro
(Figure 5D). It is interesting to note that, consistent with early observations in PHGDH-knockdown cells [48], ad-dition of exogenous serine into culture medium could not rescue the growth deiciency of PSPH-knockdown cells (Figure 3N), suggesting that activation of SSP rather than addition of serine itself is critical for cancer cell prolif-eration. Furthermore, xenograft study showed delayed tumor initiation, decreased tumor size and tumor mass when PSPH was knocked down in cMyc-overexpressing cells (Figure 5E, 5F and Supplementary information, Figure S4C). Intriguingly, there was no tumor forma-tion in all 6 mice injected with cells stably expressing shPSPH and the tumorigenesis capacity of cMyc-over-expressing cells was dramatically damaged when PSPH was knocked down, with tumor formation incidence declining to 50% (Figure 5F). Western blot confirmed cMyc overexpression and PSPH knockdown in xenograft tumor lysates (Figure 5G). Taken together, these in vivo
Figure 3 cMyc-mediated PSPH expression and SSP activation are critical for cancer cell proliferation by regulating GSH,
ROS, apoptosis and nucleotide synthesis. (A-C) GSH level and the GSH/GSSG ratio were determined in Hep3B cells ex-
pressing shRNAs targeting cMyc (A), PSPH (B), PHGDH or PSAT1 (C). Data were presented as mean ± SD of three in-
dependent experiments. *P < 0.05 as compared to NTC group. (D) GSH level and GSH/GSSG ratio were determined in
cMyc-overexpressing Hep3B cells with PSPH knockdown by shRNAs. Data were presented as mean ± SD of three indepen-
dent experiments. *P < 0.05 compared between the indicated groups. (E-G) GSH level and GSH/GSSG ratio (E), cell growth
and western blot (F), apoptosis (G) were determined in cMyc-knockdown Hep3B cells with Flag-PSPH overexpression. Data
were presented as mean ± SD of three independent experiments. *P < 0.05 compared between the indicated groups. (H-J)
ROS (H), apoptosis (I) and cell cycle (J) were analyzed by low cytometry in Hep3B cells expressing PSPH shRNAs. Data were presented as mean ± SD of three independent experiments. *P < 0.05 as compared to NTC group. (K) NMR data for
[U-13
C] glucose incorporated into GSH and glycine in Hep3B cells overexpressing PSPH. Data were presented as mean ± SD
of three independent experiments. *P < 0.05 as compared to the corresponding EV group. (L) NMR data for [U-13
C] glucose
incorporated into AMP and UMP in Hep3B cells overexpressing cMyc or PSPH (left), or in Hep3B cells expressing shRNAs
against cMyc or PSPH (right). Data were presented as mean ± SD of three independent experiments. *P < 0.05 as compared
to the corresponding EV or NTC group. (M, N) Growth curves were determined by trypan blue counting in Hep3B cells ex-
pressing NTC or PSPH shRNAs (M), or in those cells further treated with or without 5 mM NAC, 5 mM GSH or 2 mM serine (N).
Data were presented as mean ± SD of three independent experiments. *P < 0.05 compared between the indicated groups.
Linchong Sun et al.
9
npg
www.cell-research.com | Cell Research
data indicate that activated SSP is critical for cMyc-me-diated cell proliferation and cancer progression both in
vitro and in vivo.
Aberrant PSPH expression in human hepatocellular can-
cer predicts patient mortality
Analysis of cell proliferation in vitro and tumor growth
10
cMyc activates serine biosynthesis pathwaysnpg
Cell Research | www.nature.com/cr
in vivo indicated that PSPH is critical for the oncogenic roles of cMyc. To investigate the physiological signif-icance of aberrant PSPH expression or SSP activation in human malignancies, PSPH expression was further studied in 20 paired hepatocellular carcinoma (HCC) le-sions and adjacent non-cancerous tissue samples and the results showed that both PSPH mRNA and protein levels were signiicantly increased in HCC lesions as compared to adjacent normal tissue (Figure 6A and 6B), whereas the expression of PHGDH and PSAT1 was decreased in HCC lesions as compared to adjacent normal tissue (Supplementary information, Figure S4D), suggesting that it is important to combine clinical data and experi-mental evidence systematically to decipher mechanisms underlying SSP activation during cancer progression.
Next, immunohistochemistry (IHC) was employed to analyze PSPH expression in a retrospective cohort of 158 clinicopathologically characterized HCC cases, including 10 cases of clinical stage I (6.3%), 106 cases of clinical stage II (67.1%), 33 cases of clinical stage III (20.9%) and 9 cases of clinical stage IV (5.7%) liver can-cer samples, based on the TNM staging (Supplementary information, Table S1). The IHC results revealed that PSPH protein expression was generally negative in nor-mal human liver tissues, weak in early stage HCC (TNM stages I and II) and abundant in late stage HCC (TNM stages III and IV) tissues (Figure 6C). Quantitative anal-ysis of the IHC results revealed that PSPH expression in clinical stage I-IV primary liver tumors was signiicantly increased compared to normal liver (Figure 6D and Sup-plementary information, Table S2). Furthermore, PSPH was markedly upregulated in late stage HCC (stages III and IV) as compared to early stage HCC (stages I and II; Figure 6D and Supplementary information, Table S2), suggesting that PSPH expression was gradually increased as HCC progressed to a higher clinical stage. Moreover, Spearman analysis revealed correlations between PSPH expression and patient clinicopathological characteris-
tics, including survival time (P < 0.001), vital status (P
< 0.001) and clinical stage (P < 0.001; Supplementary information, Table S3), further suggesting a strong as-sociation of PSPH expression with HCC clinical staging and patient survival. Univariate and multivariate analysis revealed that, together with TNM stage and tumor size, PSPH level is a signiicant prognostic factor and is pre-dictive of the overall survival of HCC patients (Supple-mentary information, Table S4). Finally, Kaplan-Meier test indicated that PSPH expression in HCC patients was signiicantly associated with survival time, with patients expressing low PSPH in their HCC lesions surviving much longer than those with high PSPH expression (Fig-ure 6E), suggesting that PSPH protein may represent a promising prognostic biomarker for HCC.
Discussion
An important progress recently in the ield of cancer metabolism is the appreciation of serine/glycine metab-olism in cancer cells. Accumulating studies have estab-lished serine/glycine metabolism as one of the central hubs for cancer metabolism, however, it is far from clear how serine/glycine metabolism is regulated under normal or stressed conditions. Hence, in this study, we explored how activation of SSP is regulated under nutrient stressed conditions, especially when glucose or glutamine is deprived. We demonstrated that, under glucose/gluta-mine-deprived conditions, cMyc is activated to enhance the expression of enzymes involved in SSP activation to promote cellular survival and proliferation.
The current study focused on the effects of two ma-jor nutrient substrates, glucose and glutamine, on serine biosynthesis because cancer cells are highly dependent on these two substrates for survival and proliferation [1, 13-15]. It was described almost 90 years ago by Otto Warburg that cancer cells avidly use the less efficient glycolysis pathway for energy sources even with ambient
Figure 4 cMyc and PSPH are critical for cancer cell growth under nutrient deprivation conditions. (A) Growth curves were
determined by trypan blue counting in Hep3B cells expressing shRNAs against cMyc or PSPH starved of glucose (top) or
glutamine (bottom). Data were presented as mean ± SD of three independent experiments. *P < 0.05 compared between the
indicated groups. (B, C) Growth analysis (B) and crystal violet assay (C) were performed in Hep3B cells starved of glucose or
glutamine without or with supplement of GSH, Nuc (4 ribonucleosides and 4 deoxyribonucleosides) or both. Data were pre-
sented as mean ± SD of three independent experiments. *P < 0.05 compared between the indicated groups. (D, E) GSH lev-
el, GSH/GSSG ratio, apoptosis and cellular ROS level were determined in Hep3B cells expressing shRNAs targeting PSPH
or cMyc starved of glucose (D) or glutamine (E). Data were presented as mean ± SD of three independent experiments.
*P < 0.05 as compared with NTC+Glc or NTC+Gln group; #P < 0.05 as compared with NTC–Glc or NTC–Gln group. (F, G)
Hep3B cells expressing shRNAs targeting PSPH (F) or cMyc (G) were cultured in medium without glucose (left) or glutamine
(right) for 4 days, followed by culturing in complete medium for the indicated days. Cell growth was determined by trypan blue
counting. Data were presented as mean ± SD of three independent experiments. *P < 0.05 compared between the indicated
groups.
Linchong Sun et al.
11
npg
www.cell-research.com | Cell Research
oxygen supply [4]. More recently, cancer cells have been reported to be highly addicted to glutamine metabolism [2, 41]. Obviously, glycolysis and glutaminolysis in can-
cer cells are being extensively sought largely because of the consensus that elucidation of cancer-speciic me-tabolisms may hold the key to understand and control
12
cMyc activates serine biosynthesis pathwaysnpg
Cell Research | www.nature.com/cr
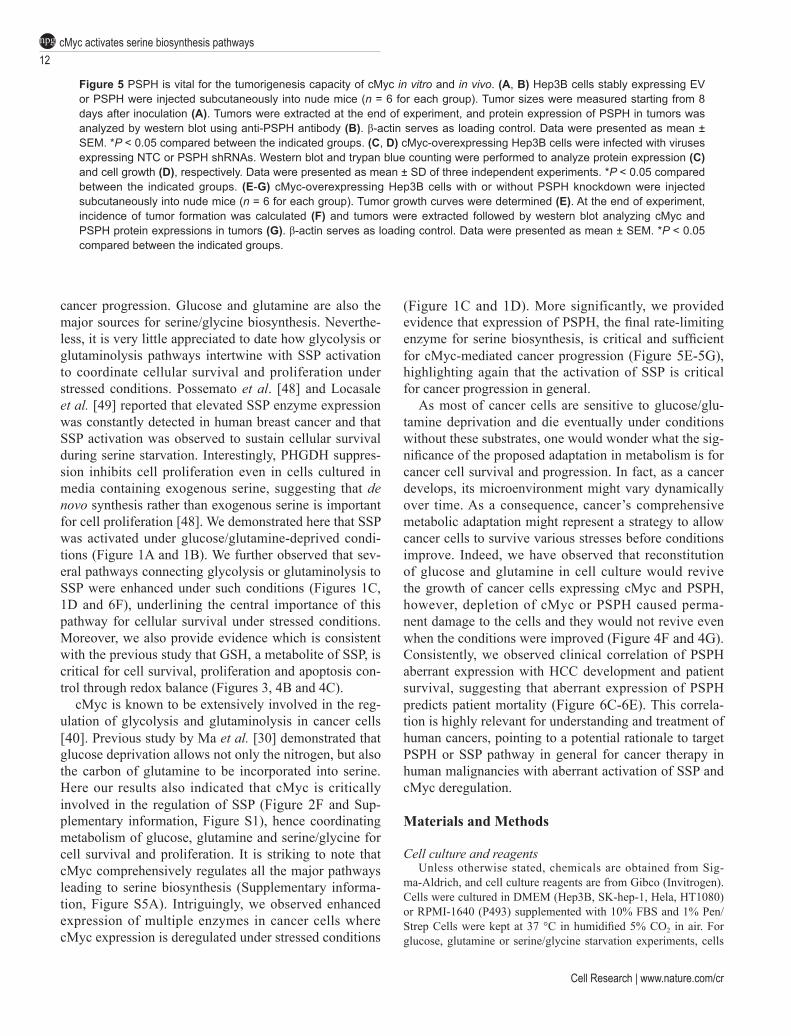
Figure 5 PSPH is vital for the tumorigenesis capacity of cMyc in vitro and in vivo. (A, B) Hep3B cells stably expressing EV
or PSPH were injected subcutaneously into nude mice (n = 6 for each group). Tumor sizes were measured starting from 8
days after inoculation (A). Tumors were extracted at the end of experiment, and protein expression of PSPH in tumors was
analyzed by western blot using anti-PSPH antibody (B). β-actin serves as loading control. Data were presented as mean ±
SEM. *P < 0.05 compared between the indicated groups. (C, D) cMyc-overexpressing Hep3B cells were infected with viruses
expressing NTC or PSPH shRNAs. Western blot and trypan blue counting were performed to analyze protein expression (C)
and cell growth (D), respectively. Data were presented as mean ± SD of three independent experiments. *P < 0.05 compared
between the indicated groups. (E-G) cMyc-overexpressing Hep3B cells with or without PSPH knockdown were injected
subcutaneously into nude mice (n = 6 for each group). Tumor growth curves were determined (E). At the end of experiment,
incidence of tumor formation was calculated (F) and tumors were extracted followed by western blot analyzing cMyc and
PSPH protein expressions in tumors (G). β-actin serves as loading control. Data were presented as mean ± SEM. *P < 0.05
compared between the indicated groups.
cancer progression. Glucose and glutamine are also the major sources for serine/glycine biosynthesis. Neverthe-less, it is very little appreciated to date how glycolysis or glutaminolysis pathways intertwine with SSP activation to coordinate cellular survival and proliferation under stressed conditions. Possemato et al. [48] and Locasale et al. [49] reported that elevated SSP enzyme expression was constantly detected in human breast cancer and that SSP activation was observed to sustain cellular survival during serine starvation. Interestingly, PHGDH suppres-sion inhibits cell proliferation even in cells cultured in media containing exogenous serine, suggesting that de
novo synthesis rather than exogenous serine is important for cell proliferation [48]. We demonstrated here that SSP was activated under glucose/glutamine-deprived condi-tions (Figure 1A and 1B). We further observed that sev-eral pathways connecting glycolysis or glutaminolysis to SSP were enhanced under such conditions (Figures 1C, 1D and 6F), underlining the central importance of this pathway for cellular survival under stressed conditions. Moreover, we also provide evidence which is consistent with the previous study that GSH, a metabolite of SSP, is critical for cell survival, proliferation and apoptosis con-trol through redox balance (Figures 3, 4B and 4C).
cMyc is known to be extensively involved in the reg-ulation of glycolysis and glutaminolysis in cancer cells [40]. Previous study by Ma et al. [30] demonstrated that glucose deprivation allows not only the nitrogen, but also the carbon of glutamine to be incorporated into serine. Here our results also indicated that cMyc is critically involved in the regulation of SSP (Figure 2F and Sup-plementary information, Figure S1), hence coordinating metabolism of glucose, glutamine and serine/glycine for cell survival and proliferation. It is striking to note that cMyc comprehensively regulates all the major pathways leading to serine biosynthesis (Supplementary informa-tion, Figure S5A). Intriguingly, we observed enhanced expression of multiple enzymes in cancer cells where cMyc expression is deregulated under stressed conditions
(Figure 1C and 1D). More significantly, we provided evidence that expression of PSPH, the inal rate-limiting enzyme for serine biosynthesis, is critical and suficient for cMyc-mediated cancer progression (Figure 5E-5G), highlighting again that the activation of SSP is critical for cancer progression in general.
As most of cancer cells are sensitive to glucose/glu-tamine deprivation and die eventually under conditions without these substrates, one would wonder what the sig-niicance of the proposed adaptation in metabolism is for cancer cell survival and progression. In fact, as a cancer develops, its microenvironment might vary dynamically over time. As a consequence, cancer’s comprehensive metabolic adaptation might represent a strategy to allow cancer cells to survive various stresses before conditions improve. Indeed, we have observed that reconstitution of glucose and glutamine in cell culture would revive the growth of cancer cells expressing cMyc and PSPH, however, depletion of cMyc or PSPH caused perma-nent damage to the cells and they would not revive even when the conditions were improved (Figure 4F and 4G). Consistently, we observed clinical correlation of PSPH aberrant expression with HCC development and patient survival, suggesting that aberrant expression of PSPH predicts patient mortality (Figure 6C-6E). This correla-tion is highly relevant for understanding and treatment of human cancers, pointing to a potential rationale to target PSPH or SSP pathway in general for cancer therapy in human malignancies with aberrant activation of SSP and cMyc deregulation.
Materials and Methods
Cell culture and reagentsUnless otherwise stated, chemicals are obtained from Sig-
ma-Aldrich, and cell culture reagents are from Gibco (Invitrogen). Cells were cultured in DMEM (Hep3B, SK-hep-1, Hela, HT1080) or RPMI-1640 (P493) supplemented with 10% FBS and 1% Pen/Strep Cells were kept at 37 °C in humidiied 5% CO2 in air. For glucose, glutamine or serine/glycine starvation experiments, cells
Linchong Sun et al.
13
npg
www.cell-research.com | Cell Research
were fed with DMEM deprived of corresponding nutrients. Trypan blue exclusion assay and colony formation assay were used to as-sess cell growth and survival.
Western blot Cell lysates were prepared in RIPA buffer (50 mM Tris-Cl, pH
8.0, 150 mM NaCl, 5 mM EDTA, 0.1% SDS, 1% NP-40) supple-
14
cMyc activates serine biosynthesis pathwaysnpg
Cell Research | www.nature.com/cr
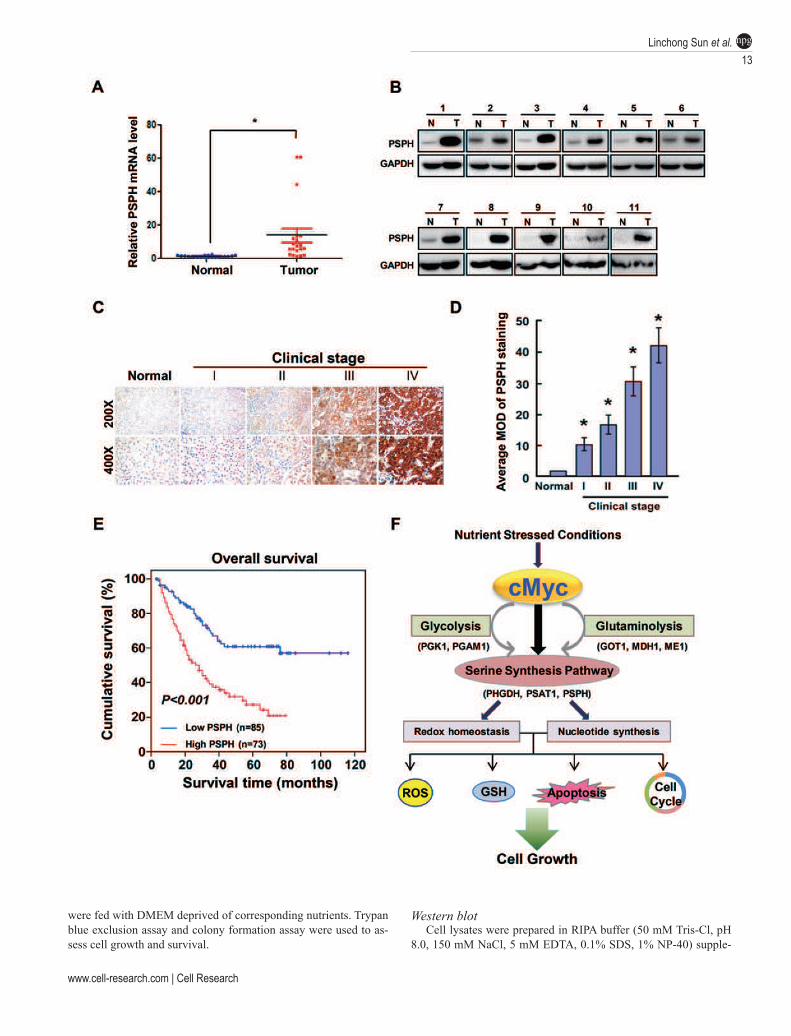
Figure 6 Prognostic signiicance of aberrant PSPH expression in human hepatocellular cancer. (A) qRT-PCR analyzed PSPH
mRNA expression in 20 pairs of clinically matched tumor adjacent non-cancerous liver tissues (normal) and human HCC tis-
sues (tumor). mRNA levels were normalized to 18S rRNA. *P < 0.05 as compared to normal tissue group. (B) Western blot
analyzed PSPH protein expression in the paired tumor adjacent non-cancerous liver tissues (N) and human HCC tissues (T).
GAPDH serves as loading control. (C) Representative IHC analysis of PSPH expression in normal liver tissues (normal) and
HCC specimens of different clinical stages (I-IV) was shown. (D) Statistical quantiication of the mean optical density (MOD) values of PSPH staining in IHC assay between normal liver tissues and HCC specimens of different clinical stages (I-IV). The
MOD of PSPH staining increases as HCC progresses to a higher clinical stage. Data were presented as mean ± SD. *P < 0.05
vs normal control group. (E) Kaplan-Meier curves with univariate analyses for patients with low vs high PSPH expression. (F)
Summary: cMyc activates serine biosynthesis pathway directly by regulating SSP enzymes at transcriptional level or indirect-
ly by coordinating glycolysis (PGK1, PGAM1) and glutaminolysis (GOT1, MDH1, ME1) under nutrient stressed conditions,
leading to cancer cell survival and proliferation via regulation of ROS, GSH, apoptosis and cell cycle.
mented with protease cocktails. Equal amounts of proteins were fractionated by SDS-PAGE. Primary antibodies against the follow-ing proteins were used: PHGDH, PSAT1, PSPH, SHMT2, GLS1, GLUD1, GOT1, GOT2, MDH1, ME1, ME2, HK2, GPI, PFKL, ALDB, TPI1, GAPDH, PGK1, PGAM1, ENO1 and LDHA (Pro-teintech); cMyc (Zymed); PKM2 (Cell Signaling Technology); SHMT1 (Abgent), Flag (Sigma-Aldrich). β-actin (Abmart) served as loading control. HRP-conjugated anti-rabbit and anti-mouse (Bio-Rad) secondary antibodies were used. Signal was detected using Western ECL Substrate (Bio-Rad).
qRT-PCRTotal RNA was isolated using Trizol followed by DNase (Am-
bion) treatment and reverse transcription with iScript cDNA Syn-thesis Kit (Bio-rad). qRT-PCR was performed using SYBR Green master mix (Vazyme) on a Bio-Rad iCycler. Primer sequences used were shown in Supplementary information, Table S5. All samples were normalized to 18S rRNA. The fold change of target mRNA expression was calculated based on threshold cycle (Ct), where ∆Ct = Cttarget – Ct18S and ∆(∆Ct) =∆CtControl – ∆CtIndicated condition.
Plasmids and stable cellsAll shRNAs in PLKO vector against cMyc, PHGDH, PSAT1,
PSPH were commercially purchased (Sigma-Aldrich). cMyc was subcloned into pBabeMNires GFP empty vector [50] or PMX-3×Flag empty vector. PSPH was subcloned into pSin-3×Flag vec-tor. Hep3B cells were infected with retrovirus (cMyc) or lentivirus (PSPH and all shRNAs) followed by antibiotic selection to estab-lish stable cells. Detailed shRNA information is shown in Supple-mentary information, Table S6.
Chromatin immunoprecipitation (ChIP) assayThe ChIP assay was performed with an EZ-ChIP kit (Millipore)
following the manufacturer’s instruction. Briely, cells were ixed with 1% formaldehyde and quenched in 0.125 M glycine. Cells were sonicated by Bioruptor Sonication System UCD-300. DNA was immunoprecipitated by either control IgG or cMyc primary antibody (Cell Signaling Technology). RNA and protein were digested using RNase A and Proteinase K, respectively, followed by qRT-PCR analysis using SYBR Green master mix (Vazyme). Oligos used for this analysis are tabulated in Supplementary infor-mation, Table S7.
ROS detectionCells were stained with 5-(and -6)-carboxy-2′, 7′-dichlorodihy-
droluorescein diacetate (carboxy-H2DCFDA; Molecular Probes) and analyzed by low cytometers (BD Bioscience) following the manufacturer’s instruction. Gain and ampliier settings were held constant during the experiment [50].
GSH and GSH/GSSG ratio determinationThe intracellular GSH levels, and reduced and oxidized gluta-
thione (GSH/GSSG) ratio were measured using assay kit (V6611 and V6911) purchased from Promega following the manufactur-er’s instruction.
Cell cycle analysisCells were harvested by trypsinization, washed twice with
PBS containing 5% FBS, ixed in 70% ethanol followed by stain-ing with 20 µg/ml propidium iodide containing 20 µg/ml RNase (DNase free). Stained cells were analyzed by low cytometry.
Apoptosis assaysApoptosis was measured by low cytometry using the Annexin
V-PI Apoptosis Detection Kit (Bestbio) according to the manufac-turer’s instructions.
NMR analysis of 13
C-labeled metabolites13C-labeled metabolites were measured quantitatively with
one-dimensional heteronuclear multiquantum coherence NMR method and proton detection using a gradient selected pulse se-quence. All these 1H NMR spectra were acquired at 298 K on a Bruker Avance III 600 MHz NMR spectrometer (operating at 600.13 MHz for 1H and 150.90 MHz for 13C) equipped with an in-verse cryogenic probe. The 90° pulse length was adjusted to about 12 and 13.5 µs for 1H and 13C, respectively, and 13C decoupling was achieved with an adiabatic scheme (p5m4sp180.2) during acquisition period. Proton spectral width was 8 400 Hz (14 ppm) whilst 13C decoupling carrier frequency was set on about 70 ppm and JCH set to 140 Hz. 2 048 data points were collected to ensure the 13C decoupling period short enough (i.e., acquisition time of 0.122 s) to avoid stressing probe. Sixty four scans were collected with the recycle delay of 20 s (to ensure complete proton relax-ation) with the water signal pre-saturated 2 s prior to the irst 1H 90° pulse. FIDs were zero-illed to 16 k data points and applied with an exponential window function, line-broadening factor of 5 Hz and forward linear prediction prior to Fourier transformation. So-obtained spectra only contained signals of protons directly at-tached to 13C nuclei.
Concentration of 13C-containing metabolites were quantified
Linchong Sun et al.
15
npg
www.cell-research.com | Cell Research
by tabulating the proton signal integrals against that of sodium 3-trimethylsilyl [2,2,3,3-d4] propionate (TSP) with a known con-centration, which had natural 13C abundance and was also em-ployed as proton chemical shift reference (δ0.00). During such cal-culation, polarization transfer eficiency for each concerned moi-eties was taken into account with a factor of sin2 (πJCHÄ), where Ä was the polarization transfer delay and JCH was one-band coupling constant. Such strategy was validated experimentally with a model mixture of 13C-labeled metabolites with known concentration.
Animal studiesAll animal studies were conducted with approval from the An-
imal Research Ethics Committee of the University of Science and Technology of China. For xenograft experiments, 5 × 10⁶ Hep3B cells stably expressing EV, PSPH, or cMyc-overexpressing Hep3B cells with or without PSPH knockdown were injected subcutane-ously into 5-week-old male nude mice (SJA Laboratory Animal Company, China). The tumor volumes were measured using digi-tal calipers every 3 days and calculated using the equation: length (mm) × width (mm) × depth (mm) × 0.52.
Clinical human HCC specimensHuman tissue specimens, including 20 pairs of freshly
snap-frozen HCC tissues and paired normal adjacent tissues, were histopathologically diagnosed at Sun Yat-sen University Cancer Center (Guangzhou, China). Formalin-fixed, paraffin-embedded primary HCC specimens obtained from 158 patients were random-ly selected from the archives of the Sun Yat-sen University Cancer Center. For using these clinical materials for research purposes, prior patients’ written informed consents and approval from the Institutional Research Ethics Committee of Sun Yat-sen University Cancer Center were obtained. Tumor clinical stages were deined according to the 2002 American Joint Committee on Cancer/Inter-national Union against Cancer tumor/lymph node metastasis/distal metastasis (TNM) classiication system [51]. Total RNA and pro-tein were extracted from paired tissues and detected by qRT-PCR and western blot, respectively.
ImmunohistochemistryThe IHC procedure for PSPH and scoring of PSPH expression
were performed as previously reported [52]. IHC staining was quantitatively analyzed with the AxioVision Rel.4.6 computerized image analysis system assisted with the automatic measurement program (Carl Zeiss, Oberkochen, Germany). Ten representative staining ields of each section were analyzed to verify the Mean Optical Density (MOD). The MOD data were statistically ana-lyzed by t-test to compare the average MOD difference between different groups of tissues.
Statistical analysis The data were presented as mean ± SD or mean ± SEM as
stated. Student’s t-test was used to calculate P values. Statistical signiicance is displayed as P < 0.05.
Acknowledgments
This work is supported by the National Basic Key Re-
search Program of China (2014CB910600, 2012CB910104 and 2011CBA01103), the National Natural Science Foundation of
China (31171358, 31371429, 81372148, 31071257, 91439102 and 21175149), Chinese Academy of Sciences (XDA01010404), Research Fund for the Doctoral Program of Higher Education of China (20133402110020 and 20133402110014).
References
1 Cairns RA, Harris IS, Mak TW. Regulation of cancer cell me-tabolism. Nat Rev Cancer 2011; 11:85-95.
2 DeBerardinis RJ, Cheng T. Q’s next: the diverse functions of glutamine in metabolism, cell biology and cancer. Oncogene 2010; 29:313-324.
3 Shaw RJ. Glucose metabolism and cancer. Curr Opin Cell
Biol 2006; 18:598-608.4 Warburg O. On the origin of cancer cells. Science 1956;
123:309-314.5 Soga T. Cancer metabolism: key players in metabolic repro-
gramming. Cancer Sci 2013; 104:275-281.6 Shanware NP, Mullen AR, DeBerardinis RJ, Abraham RT.
Glutamine: pleiotropic roles in tumor growth and stress resis-tance. J Mol Med 2011; 89:229-236.
7 Le A, Lane AN, Hamaker M, et al. Glucose-independent glutamine metabolism via TCA cycling for proliferation and survival in B cells. Cell Metab 2012; 15:110-121.
8 Metallo CM, Gameiro PA, Bell EL, et al. Reductive gluta-mine metabolism by IDH1 mediates lipogenesis under hypox-ia. Nature 2012; 481:380-384.
9 Jain M, Nilsson R, Sharma S, et al. Metabolite proiling iden-tiies a key role for glycine in rapid cancer cell proliferation. Science 2012; 336:1040-1044.
10 Kalhan SC, Hanson RW. Resurgence of serine: an often neglected but indispensable amino acid. J Biol Chem 2012; 287:19786-19791.
11 de Koning TJ, Snell K, Duran M, Berger R, Poll-The BT, Sur-tees R. L-serine in disease and development. Biochem J 2003; 371:653-661.
12 Tabatabaie L, Klomp LW, Berger R, de Koning TJ. L-serine synthesis in the central nervous system: a review on serine deiciency disorders. Mol Genet Metab 2010; 99:256-262.
13 Amelio I, Cutruzzolá F, Antonov A, Agostini M, Melino G. Serine and glycine metabolism in cancer. Trends Biochem Sci 2014; 39:191-198.
14 Locasale JW. Serine, glycine and one-carbon units: cancer metabolism in full circle. Nat Rev Cancer 2013; 13:572-583.
15 Tedeschi PM, Markert EK, Gounder M, et al. Contribution of serine, folate and glycine metabolism to the ATP, NADPH and purine requirements of cancer cells. Cell Death Dis 2013; 4:e877.
16 Vazquez A, Tedeschi PM, Bertino JR. Overexpression of the mitochondrial folate and glycine-serine pathway: a new de-terminant of methotrexate selectivity in tumors. Cancer Res 2012; 73:478-482.
17 Lund K, Merrill DK, Guynn RW. The reactions of the phos-phorylated pathway of L-serine biosynthesis: thermodynamic relationships in rabbit liver in vivo. Arch Biochem Biophys 1985; 237:186-196.
18 Anderson DD, Stover PJ. SHMT1 and SHMT2 are function-ally redundant in nuclear de novo thymidylate biosynthesis. PLoS One 2009; 4:e5839.
16
cMyc activates serine biosynthesis pathwaysnpg
Cell Research | www.nature.com/cr
19 MacFarlane AJ, Liu X, Perry CA, et al. Cytoplasmic serine hydroxymethyltransferase regulates the metabolic partitioning of methylenetetrahydrofolate but is not essential in mice. J
Biol Chem 2008; 283:25846-25853.20 Amores-Sanchez MI, Medina MA. Glutamine, as a precursor
of glutathione, and oxidative stress. Mol Genet Metab 1999; 67:100-105.
21 Anderson ME. Glutathione: an overview of biosynthesis and modulation. Chem Biol Interact 1998; 111-112:1-14.
22 Townsend DM, Tew KD, Tapiero H. The importance of glutathione in human disease. Biomed Pharmacother 2003; 57:145-155.
23 Circu ML, Aw TY. Reactive oxygen species, cellular redox systems, and apoptosis. Free Radical Bio Med 2010; 48:749-762.
24 Anderson DD, Woeller CF, Chiang EP, Shane B, Stover PJ. Serine hydroxymethyltransferase anchors de novo thymi-dylate synthesis pathway to nuclear lamina for DNA synthe-sis. J Biol Chem 2012; 287:7051-7062.
25 Maddocks OD, Berkers CR, Mason SM, et al. Serine starva-tion induces stress and p53-dependent metabolic remodelling in cancer cells. Nature 2013; 493:542-546.
26 Tavana O, Gu W. The hunger games: p53 regulates metabo-lism upon serine starvation. Cell Metab 2013; 17:159-161.
27 Amelio I, Markert EK, Ruini A, et al. p73 regulates serine biosynthesis in cancer. Oncogene 2014; 33:5039-5046.
28 Ding J, Li T, Wang X, et al. The histone H3 methyltransfer-ase G9A epigenetically activates the serine-glycine synthesis pathway to sustain cancer cell survival and proliferation. Cell
Metab 2013; 18:896-907.29 Ye J, Fan J, Venneti S, et al. Serine catabolism regulates mito-
chondrial redox control during hypoxia. Cancer Discov 2014; 4:1406-1417.
30 Ma L, Tao Y, Duran A, et al. Control of nutrient stress-in-duced metabolic reprogramming by PKCζ in tumorigenesis. Cell 2013; 152:599-611.
31 Ye J, Mancuso A, Tong X, et al. Pyruvate kinase M2 promotes de novo serine synthesis to sustain mTORC1 activity and cell proliferation. Proc Natl Acad Sci USA 2012; 109:6904-6909.
32 Brooks TA, Hurley LH. The role of supercoiling in transcrip-tional control of MYC and its importance in molecular thera-peutics. Nat Rev Cancer 2010; 9:949.
33 Dang CV. MYC on the path to cancer. Cell 2012; 149:22-35.34 van Riggelen J, Yetil A, Felsher DW. MYC as a regulator of
ribosome biogenesis and protein synthesis. Nat Rev Cancer 2010; 10:301-309.
35 Lin CY, Loven J, Rahl PB, et al. Transcriptional ampliication in tumor cells with elevated c-Myc. Cell 2012; 151:56-67.
36 Nie Z, Hu G, Wei G, et al. c-Myc is a universal ampliier of
expressed genes in lymphocytes and embryonic stem cells. Cell 2012; 151:68-79.
37 Dang CV. Gene regulation: ine-tuned ampliication in cells. Nature 2014; 511:417-418.
38 Sabo A, Kress TR, Pelizzola M, et al. Selective transcriptional regulation by Myc in cellular growth control and lymphoma-genesis. Nature 2014; 511:488-492.
39 Walz S, Lorenzin F, Morton J, et al. Activation and repression by oncogenic MYC shape tumour-specific gene expression proiles. Nature 2014; 511:483-487.
40 Dang CV. Glutaminolysis: Supplying carbon or nitrogen, or both for cancer cells? Cell Cycle 2010; 9:3884-3886.
41 Gao P, Tchernyshyov I, Chang TC, et al. c-Myc suppression of miR-23a/b enhances mitochondrial glutaminase expression and glutamine metabolism. Nature 2009; 458:762-765.
42 Kim Jw, Zeller KI, Wang Y, et al. Evaluation of Myc E-Box phylogenetic footprints in glycolytic genes by chromatin im-munoprecipitation assays. Mol Cell Biol 2004; 24:5923-5936.
43 Liu YC, Li F, Handler J, et al. Global regulation of nucleotide biosynthetic genes by c-Myc. PLoS One 2008; 3:e2722.
44 Dang CV. MYC, metabolism, cell growth, and tumorigenesis. Cold Spring Harb Perspect Med 2013; 3:a014217-a014217.
45 Fan J, Ye J, Kamphorst JJ, Shlomi T, Thompson CB, Rab-inowitz JD. Quantitative flux analysis reveals folate-de-pendent NADPH production. Nature 2014; 510:298-302.
46 Valencia T, Kim JY, Abu-Baker S, et al. Metabolic reprogram-ming of stromal ibroblasts through p62-mTORC1 signaling promotes inlammation and tumorigenesis. Cancer Cell 2014; 26:121-135.
47 Du W, Jiang P, Mancuso A, et al. TAp73 enhances the pentose phosphate pathway and supports cell proliferation. Nat Cell
Biol 2013; 15:991-1000.48 Possemato R, Marks KM, Shaul YD, et al. Functional ge-
nomics reveal that the serine synthesis pathway is essential in breast cancer. Nature 2011; 476:346-350.
49 Locasale JW, Grassian AR, Melman T, et al. Phosphoglycer-ate dehydrogenase diverts glycolytic lux and contributes to oncogenesis. Nat Genet 2011; 43:869-874.
50 Zhang H, Gao P, Fukuda R, et al. HIF-1 inhibits mitochondri-al biogenesis and cellular respiration in VHL-deicient renal cell carcinoma by repression of c-MYC activity. Cancer Cell 2007; 11:407-420.
51 Xie C, Wu J, Yun J, et al. MACC1 as a prognostic biomarker for early-stage and AFP-normal hepatocellular carcinoma. PLoS One 2013; 8:e64235.
52 Xie C, Song LB, Wu JH, et al. Upregulator of cell prolifer-ation predicts poor prognosis in hepatocellular carcinoma and contributes to hepatocarcinogenesis by downregulating FOXO3a. PLoS One 2012; 7:e40607.
(Supplementary information is linked to the online version of the paper on the Cell Research website.)