Embed Size (px)
Citation preview
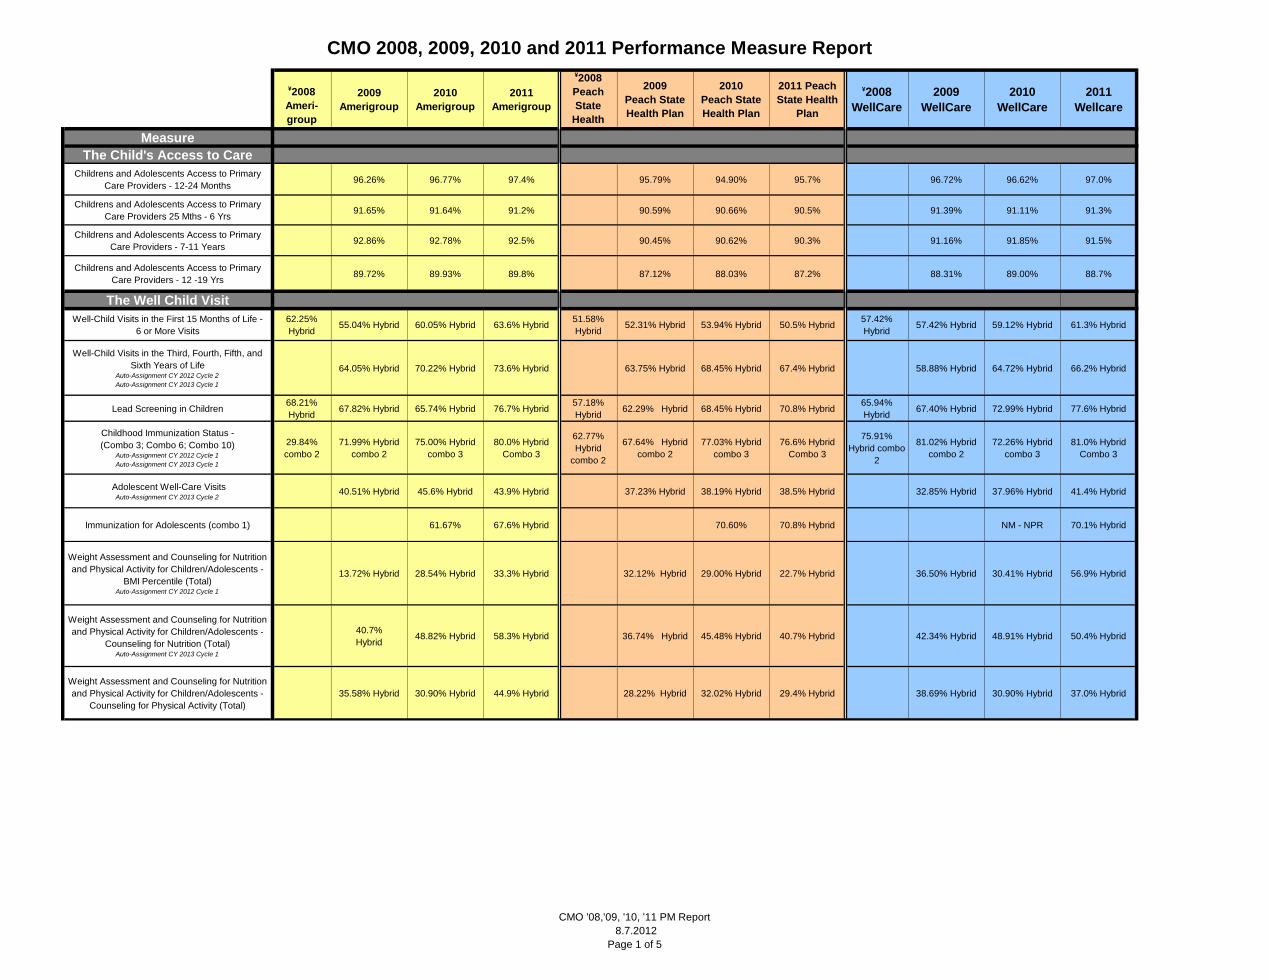
¥2008
Ameri-
group
2009
Amerigroup
2010
Amerigroup
2011
Amerigroup
¥2008
Peach
State
Health
Plan
2009
Peach State
Health Plan
2010
Peach State
Health Plan
2011 Peach
State Health
Plan
¥2008
WellCare
2009
WellCare
2010
WellCare
2011
Wellcare
Measure
The Child's Access to Care
Childrens and Adolescents Access to Primary
Care Providers - 12-24 Months96.26% 96.77% 97.4% 95.79% 94.90% 95.7% 96.72% 96.62% 97.0%
Childrens and Adolescents Access to Primary
Care Providers 25 Mths - 6 Yrs91.65% 91.64% 91.2% 90.59% 90.66% 90.5% 91.39% 91.11% 91.3%
Childrens and Adolescents Access to Primary
Care Providers - 7-11 Years92.86% 92.78% 92.5% 90.45% 90.62% 90.3% 91.16% 91.85% 91.5%
Childrens and Adolescents Access to Primary
Care Providers - 12 -19 Yrs89.72% 89.93% 89.8% 87.12% 88.03% 87.2% 88.31% 89.00% 88.7%
The Well Child Visit
Well-Child Visits in the First 15 Months of Life -
6 or More Visits
62.25%
Hybrid55.04% Hybrid 60.05% Hybrid 63.6% Hybrid
51.58%
Hybrid52.31% Hybrid 53.94% Hybrid 50.5% Hybrid
57.42%
Hybrid57.42% Hybrid 59.12% Hybrid 61.3% Hybrid
Well-Child Visits in the Third, Fourth, Fifth, and
Sixth Years of Life Auto-Assignment CY 2012 Cycle 2
Auto-Assignment CY 2013 Cycle 1
64.05% Hybrid 70.22% Hybrid 73.6% Hybrid 63.75% Hybrid 68.45% Hybrid 67.4% Hybrid 58.88% Hybrid 64.72% Hybrid 66.2% Hybrid
Lead Screening in Children68.21%
Hybrid67.82% Hybrid 65.74% Hybrid 76.7% Hybrid
57.18%
Hybrid62.29% Hybrid 68.45% Hybrid 70.8% Hybrid
65.94%
Hybrid67.40% Hybrid 72.99% Hybrid 77.6% Hybrid
Childhood Immunization Status -
(Combo 3; Combo 6; Combo 10)Auto-Assignment CY 2012 Cycle 1
Auto-Assignment CY 2013 Cycle 1
29.84%
combo 2
71.99% Hybrid
combo 2
75.00% Hybrid
combo 3
80.0% Hybrid
Combo 3
62.77%
Hybrid
combo 2
67.64% Hybrid
combo 2
77.03% Hybrid
combo 3
76.6% Hybrid
Combo 3
75.91%
Hybrid combo
2
81.02% Hybrid
combo 2
72.26% Hybrid
combo 3
81.0% Hybrid
Combo 3
Adolescent Well-Care VisitsAuto-Assignment CY 2013 Cycle 2
40.51% Hybrid 45.6% Hybrid 43.9% Hybrid 37.23% Hybrid 38.19% Hybrid 38.5% Hybrid 32.85% Hybrid 37.96% Hybrid 41.4% Hybrid
Immunization for Adolescents (combo 1) 61.67% 67.6% Hybrid 70.60% 70.8% Hybrid NM - NPR 70.1% Hybrid
Weight Assessment and Counseling for Nutrition
and Physical Activity for Children/Adolescents -
BMI Percentile (Total) Auto-Assignment CY 2012 Cycle 1
13.72% Hybrid 28.54% Hybrid 33.3% Hybrid 32.12% Hybrid 29.00% Hybrid 22.7% Hybrid 36.50% Hybrid 30.41% Hybrid 56.9% Hybrid
Weight Assessment and Counseling for Nutrition
and Physical Activity for Children/Adolescents -
Counseling for Nutrition (Total) Auto-Assignment CY 2013 Cycle 1
40.7%
Hybrid48.82% Hybrid 58.3% Hybrid 36.74% Hybrid 45.48% Hybrid 40.7% Hybrid 42.34% Hybrid 48.91% Hybrid 50.4% Hybrid
Weight Assessment and Counseling for Nutrition
and Physical Activity for Children/Adolescents -
Counseling for Physical Activity (Total)
35.58% Hybrid 30.90% Hybrid 44.9% Hybrid 28.22% Hybrid 32.02% Hybrid 29.4% Hybrid 38.69% Hybrid 30.90% Hybrid 37.0% Hybrid
CMO 2008, 2009, 2010 and 2011 Performance Measure Report
CMO '08,'09, '10, '11 PM Report
8.7.2012
Page 1 of 5
¥2008
Ameri-
group
2009
Amerigroup
2010
Amerigroup
2011
Amerigroup
¥2008
Peach
State
Health
Plan
2009
Peach State
Health Plan
2010
Peach State
Health Plan
2011 Peach
State Health
Plan
¥2008
WellCare
2009
WellCare
2010
WellCare
2011
Wellcare
Measure
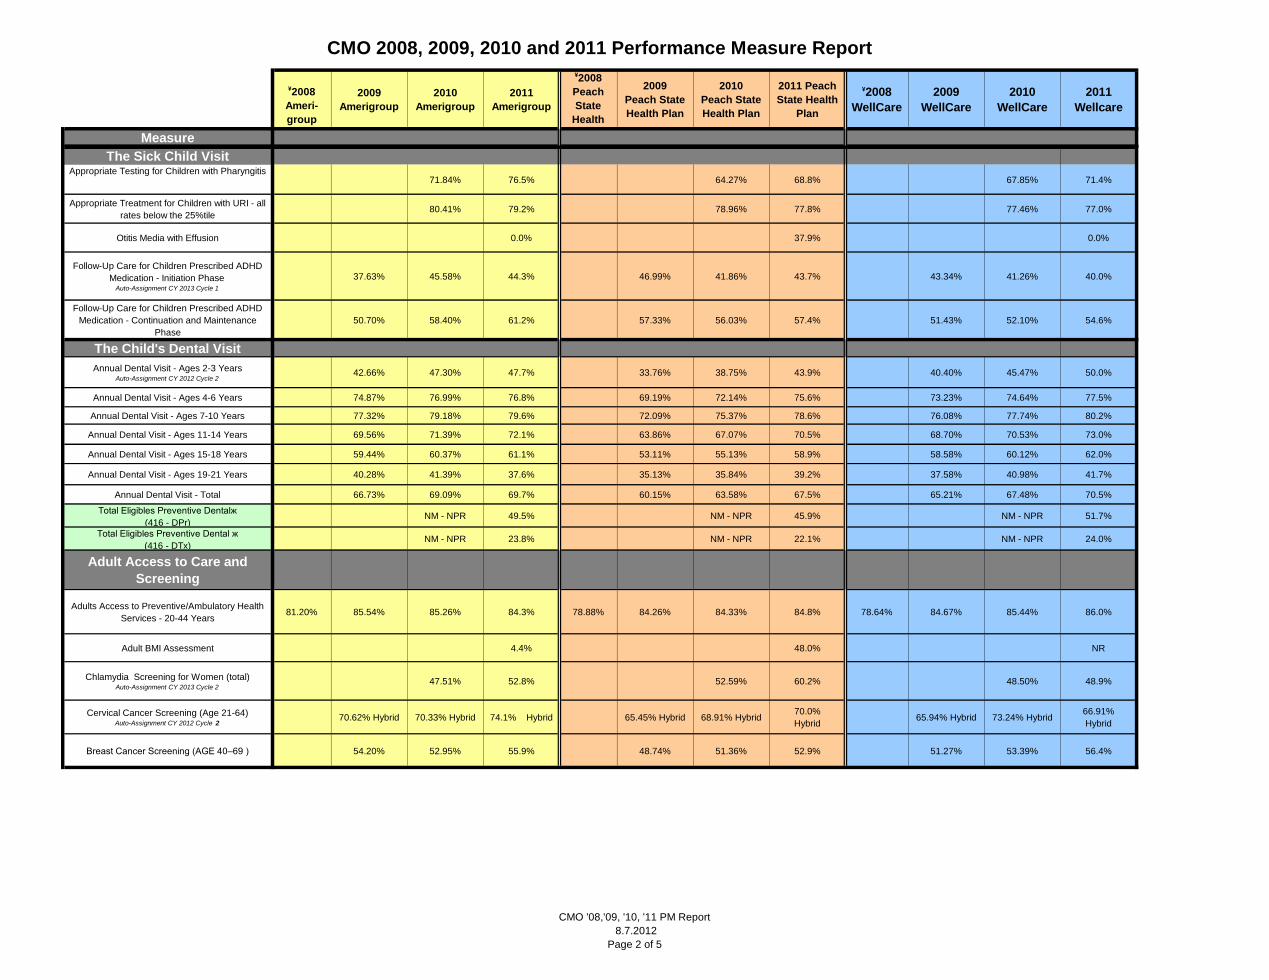
CMO 2008, 2009, 2010 and 2011 Performance Measure Report
The Sick Child VisitAppropriate Testing for Children with Pharyngitis
71.84% 76.5% 64.27% 68.8% 67.85% 71.4%
Appropriate Treatment for Children with URI - all
rates below the 25%tile80.41% 79.2% 78.96% 77.8% 77.46% 77.0%
Otitis Media with Effusion 0.0% 37.9% 0.0%
Follow-Up Care for Children Prescribed ADHD
Medication - Initiation PhaseAuto-Assignment CY 2013 Cycle 1
37.63% 45.58% 44.3% 46.99% 41.86% 43.7% 43.34% 41.26% 40.0%
Follow-Up Care for Children Prescribed ADHD
Medication - Continuation and Maintenance
Phase
50.70% 58.40% 61.2% 57.33% 56.03% 57.4% 51.43% 52.10% 54.6%
The Child's Dental Visit
Annual Dental Visit - Ages 2-3 Years Auto-Assignment CY 2012 Cycle 2
42.66% 47.30% 47.7% 33.76% 38.75% 43.9% 40.40% 45.47% 50.0%
Annual Dental Visit - Ages 4-6 Years 74.87% 76.99% 76.8% 69.19% 72.14% 75.6% 73.23% 74.64% 77.5%
Annual Dental Visit - Ages 7-10 Years 77.32% 79.18% 79.6% 72.09% 75.37% 78.6% 76.08% 77.74% 80.2%
Annual Dental Visit - Ages 11-14 Years 69.56% 71.39% 72.1% 63.86% 67.07% 70.5% 68.70% 70.53% 73.0%
Annual Dental Visit - Ages 15-18 Years 59.44% 60.37% 61.1% 53.11% 55.13% 58.9% 58.58% 60.12% 62.0%
Annual Dental Visit - Ages 19-21 Years 40.28% 41.39% 37.6% 35.13% 35.84% 39.2% 37.58% 40.98% 41.7%
Annual Dental Visit - Total 66.73% 69.09% 69.7% 60.15% 63.58% 67.5% 65.21% 67.48% 70.5%
Total Eligibles Preventive Dentalж
(416 - DPr)NM - NPR 49.5% NM - NPR 45.9% NM - NPR 51.7%
Total Eligibles Preventive Dental ж
(416 - DTx)NM - NPR 23.8% NM - NPR 22.1% NM - NPR 24.0%
Adult Access to Care and
Screening
Adults Access to Preventive/Ambulatory Health
Services - 20-44 Years81.20% 85.54% 85.26% 84.3% 78.88% 84.26% 84.33% 84.8% 78.64% 84.67% 85.44% 86.0%
Adult BMI Assessment 4.4% 48.0% NR
Chlamydia Screening for Women (total) Auto-Assignment CY 2013 Cycle 2
47.51% 52.8% 52.59% 60.2% 48.50% 48.9%
Cervical Cancer Screening (Age 21-64) Auto-Assignment CY 2012 Cycle 2
70.62% Hybrid 70.33% Hybrid 74.1% Hybrid 65.45% Hybrid 68.91% Hybrid70.0%
Hybrid65.94% Hybrid 73.24% Hybrid
66.91%
Hybrid
Breast Cancer Screening (AGE 40–69 ) 54.20% 52.95% 55.9% 48.74% 51.36% 52.9% 51.27% 53.39% 56.4%
CMO '08,'09, '10, '11 PM Report
8.7.2012
Page 2 of 5
¥2008
Ameri-
group
2009
Amerigroup
2010
Amerigroup
2011
Amerigroup
¥2008
Peach
State
Health
Plan
2009
Peach State
Health Plan
2010
Peach State
Health Plan
2011 Peach
State Health
Plan
¥2008
WellCare
2009
WellCare
2010
WellCare
2011
Wellcare
Measure
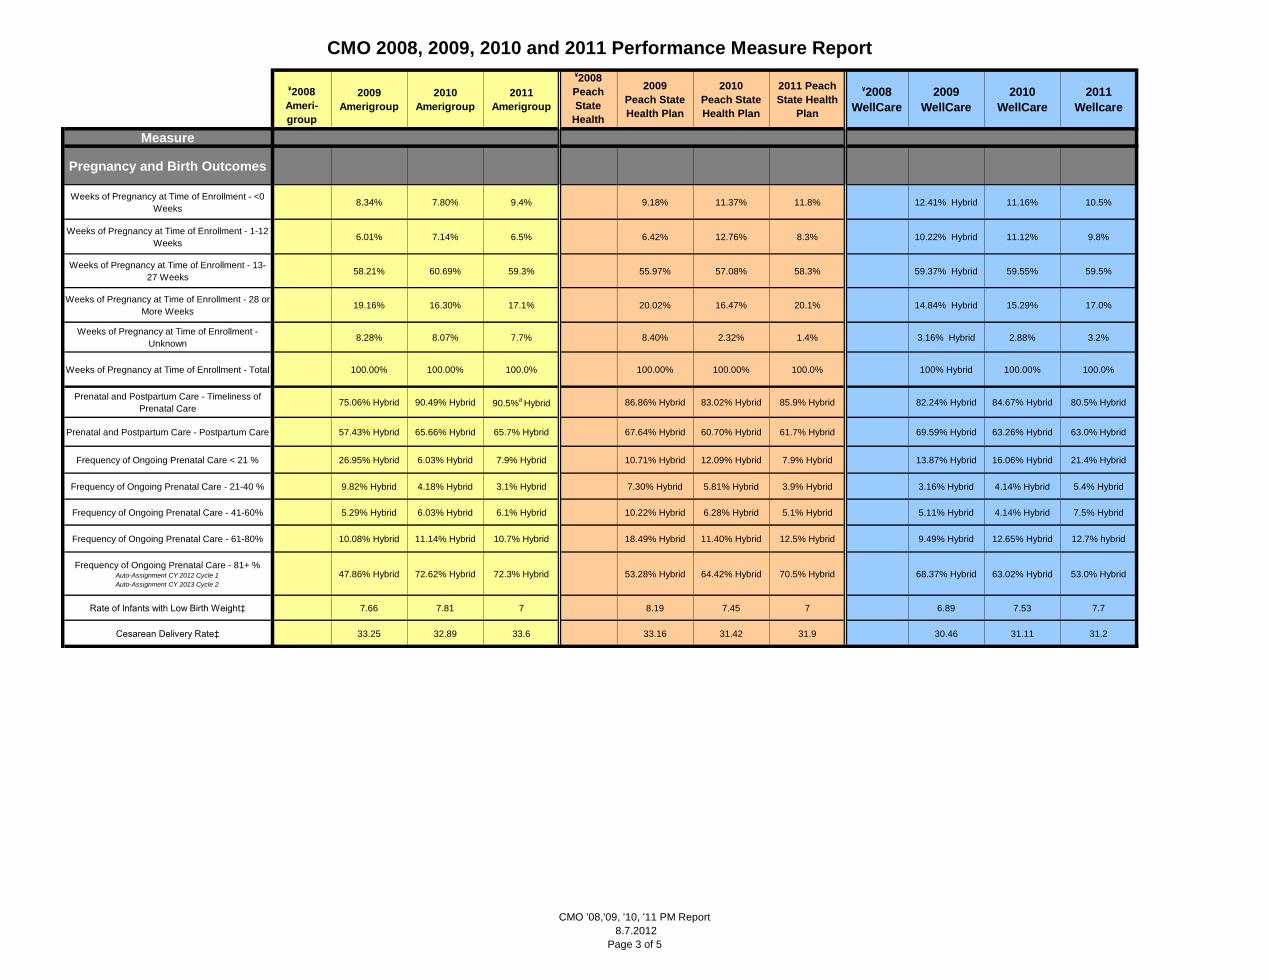
CMO 2008, 2009, 2010 and 2011 Performance Measure Report
Pregnancy and Birth Outcomes
Weeks of Pregnancy at Time of Enrollment - <0
Weeks8.34% 7.80% 9.4% 9.18% 11.37% 11.8% 12.41% Hybrid 11.16% 10.5%
Weeks of Pregnancy at Time of Enrollment - 1-12
Weeks6.01% 7.14% 6.5% 6.42% 12.76% 8.3% 10.22% Hybrid 11.12% 9.8%
Weeks of Pregnancy at Time of Enrollment - 13-
27 Weeks58.21% 60.69% 59.3% 55.97% 57.08% 58.3% 59.37% Hybrid 59.55% 59.5%
Weeks of Pregnancy at Time of Enrollment - 28 or
More Weeks19.16% 16.30% 17.1% 20.02% 16.47% 20.1% 14.84% Hybrid 15.29% 17.0%
Weeks of Pregnancy at Time of Enrollment -
Unknown8.28% 8.07% 7.7% 8.40% 2.32% 1.4% 3.16% Hybrid 2.88% 3.2%
Weeks of Pregnancy at Time of Enrollment - Total 100.00% 100.00% 100.0% 100.00% 100.00% 100.0% 100% Hybrid 100.00% 100.0%
Prenatal and Postpartum Care - Timeliness of
Prenatal Care75.06% Hybrid 90.49% Hybrid 90.5%
a Hybrid 86.86% Hybrid 83.02% Hybrid 85.9% Hybrid 82.24% Hybrid 84.67% Hybrid 80.5% Hybrid
Prenatal and Postpartum Care - Postpartum Care 57.43% Hybrid 65.66% Hybrid 65.7% Hybrid 67.64% Hybrid 60.70% Hybrid 61.7% Hybrid 69.59% Hybrid 63.26% Hybrid 63.0% Hybrid
Frequency of Ongoing Prenatal Care < 21 % 26.95% Hybrid 6.03% Hybrid 7.9% Hybrid 10.71% Hybrid 12.09% Hybrid 7.9% Hybrid 13.87% Hybrid 16.06% Hybrid 21.4% Hybrid
Frequency of Ongoing Prenatal Care - 21-40 % 9.82% Hybrid 4.18% Hybrid 3.1% Hybrid 7.30% Hybrid 5.81% Hybrid 3.9% Hybrid 3.16% Hybrid 4.14% Hybrid 5.4% Hybrid
Frequency of Ongoing Prenatal Care - 41-60% 5.29% Hybrid 6.03% Hybrid 6.1% Hybrid 10.22% Hybrid 6.28% Hybrid 5.1% Hybrid 5.11% Hybrid 4.14% Hybrid 7.5% Hybrid
Frequency of Ongoing Prenatal Care - 61-80% 10.08% Hybrid 11.14% Hybrid 10.7% Hybrid 18.49% Hybrid 11.40% Hybrid 12.5% Hybrid 9.49% Hybrid 12.65% Hybrid 12.7% hybrid
Frequency of Ongoing Prenatal Care - 81+ % Auto-Assignment CY 2012 Cycle 1
Auto-Assignment CY 2013 Cycle 2
47.86% Hybrid 72.62% Hybrid 72.3% Hybrid 53.28% Hybrid 64.42% Hybrid 70.5% Hybrid 68.37% Hybrid 63.02% Hybrid 53.0% Hybrid
Rate of Infants with Low Birth Weight‡ 7.66 7.81 7 8.19 7.45 7 6.89 7.53 7.7
Cesarean Delivery Rate‡ 33.25 32.89 33.6 33.16 31.42 31.9 30.46 31.11 31.2
CMO '08,'09, '10, '11 PM Report
8.7.2012
Page 3 of 5
¥2008
Ameri-
group
2009
Amerigroup
2010
Amerigroup
2011
Amerigroup
¥2008
Peach
State
Health
Plan
2009
Peach State
Health Plan
2010
Peach State
Health Plan
2011 Peach
State Health
Plan
¥2008
WellCare
2009
WellCare
2010
WellCare
2011
Wellcare
Measure
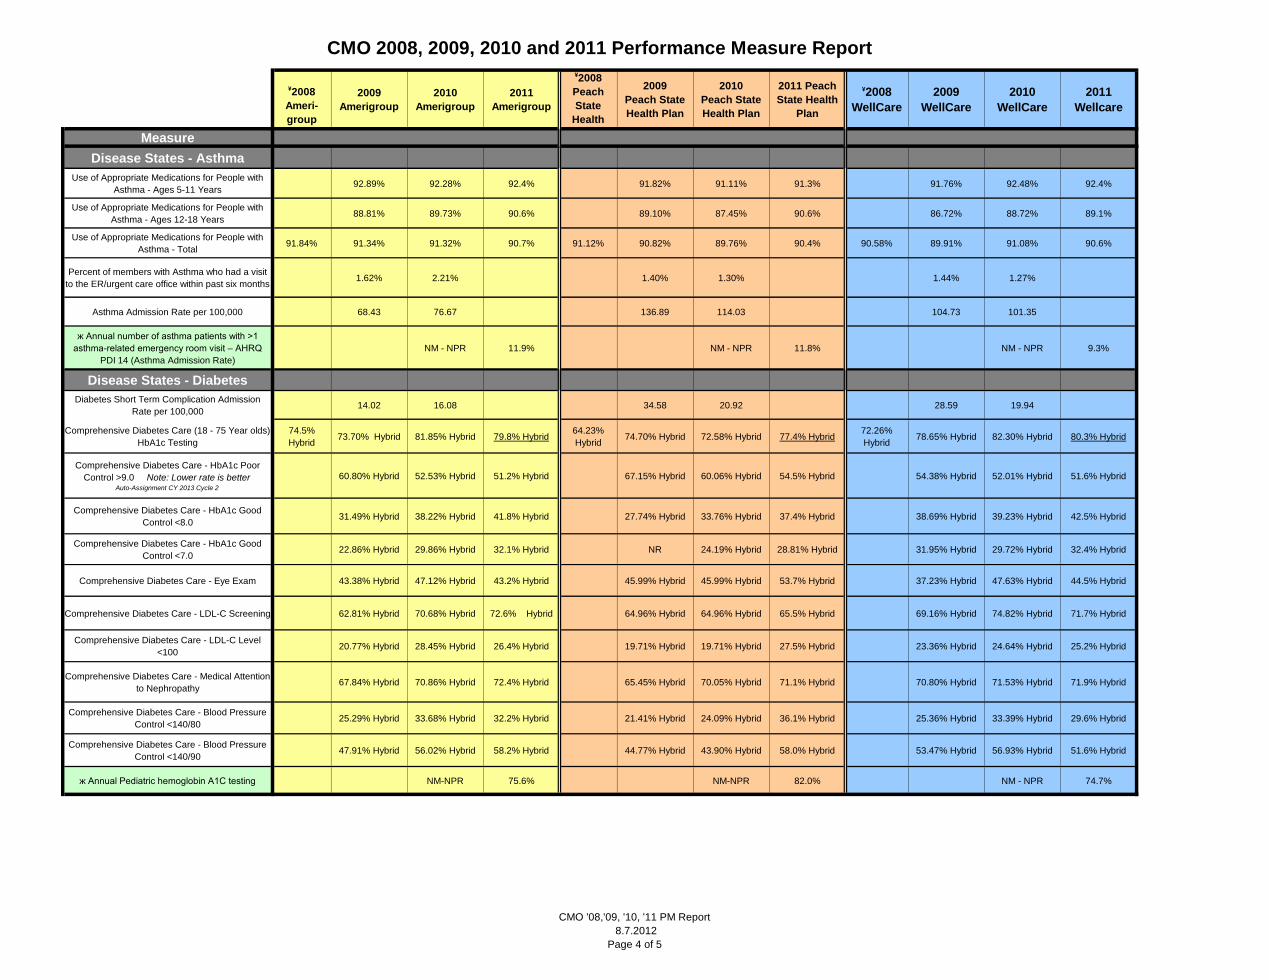
CMO 2008, 2009, 2010 and 2011 Performance Measure Report
Disease States - Asthma
Use of Appropriate Medications for People with
Asthma - Ages 5-11 Years92.89% 92.28% 92.4% 91.82% 91.11% 91.3% 91.76% 92.48% 92.4%
Use of Appropriate Medications for People with
Asthma - Ages 12-18 Years88.81% 89.73% 90.6% 89.10% 87.45% 90.6% 86.72% 88.72% 89.1%
Use of Appropriate Medications for People with
Asthma - Total91.84% 91.34% 91.32% 90.7% 91.12% 90.82% 89.76% 90.4% 90.58% 89.91% 91.08% 90.6%
Percent of members with Asthma who had a visit
to the ER/urgent care office within past six months1.62% 2.21% 1.40% 1.30% 1.44% 1.27%
Asthma Admission Rate per 100,000 68.43 76.67 136.89 114.03 104.73 101.35
ж Annual number of asthma patients with >1
asthma-related emergency room visit – AHRQ
PDI 14 (Asthma Admission Rate)
NM - NPR 11.9% NM - NPR 11.8% NM - NPR 9.3%
Disease States - Diabetes
Diabetes Short Term Complication Admission
Rate per 100,00014.02 16.08 34.58 20.92 28.59 19.94
Comprehensive Diabetes Care (18 - 75 Year olds)
HbA1c Testing
74.5%
Hybrid73.70% Hybrid 81.85% Hybrid 79.8% Hybrid
64.23%
Hybrid74.70% Hybrid 72.58% Hybrid 77.4% Hybrid
72.26%
Hybrid78.65% Hybrid 82.30% Hybrid 80.3% Hybrid
Comprehensive Diabetes Care - HbA1c Poor
Control >9.0 Note: Lower rate is better Auto-Assignment CY 2013 Cycle 2
60.80% Hybrid 52.53% Hybrid 51.2% Hybrid 67.15% Hybrid 60.06% Hybrid 54.5% Hybrid 54.38% Hybrid 52.01% Hybrid 51.6% Hybrid
Comprehensive Diabetes Care - HbA1c Good
Control <8.031.49% Hybrid 38.22% Hybrid 41.8% Hybrid 27.74% Hybrid 33.76% Hybrid 37.4% Hybrid 38.69% Hybrid 39.23% Hybrid 42.5% Hybrid
Comprehensive Diabetes Care - HbA1c Good
Control <7.022.86% Hybrid 29.86% Hybrid 32.1% Hybrid NR 24.19% Hybrid 28.81% Hybrid 31.95% Hybrid 29.72% Hybrid 32.4% Hybrid
Comprehensive Diabetes Care - Eye Exam 43.38% Hybrid 47.12% Hybrid 43.2% Hybrid 45.99% Hybrid 45.99% Hybrid 53.7% Hybrid 37.23% Hybrid 47.63% Hybrid 44.5% Hybrid
Comprehensive Diabetes Care - LDL-C Screening 62.81% Hybrid 70.68% Hybrid 72.6% Hybrid 64.96% Hybrid 64.96% Hybrid 65.5% Hybrid 69.16% Hybrid 74.82% Hybrid 71.7% Hybrid
Comprehensive Diabetes Care - LDL-C Level
<10020.77% Hybrid 28.45% Hybrid 26.4% Hybrid 19.71% Hybrid 19.71% Hybrid 27.5% Hybrid 23.36% Hybrid 24.64% Hybrid 25.2% Hybrid
Comprehensive Diabetes Care - Medical Attention
to Nephropathy67.84% Hybrid 70.86% Hybrid 72.4% Hybrid 65.45% Hybrid 70.05% Hybrid 71.1% Hybrid 70.80% Hybrid 71.53% Hybrid 71.9% Hybrid
Comprehensive Diabetes Care - Blood Pressure
Control <140/8025.29% Hybrid 33.68% Hybrid 32.2% Hybrid 21.41% Hybrid 24.09% Hybrid 36.1% Hybrid 25.36% Hybrid 33.39% Hybrid 29.6% Hybrid
Comprehensive Diabetes Care - Blood Pressure
Control <140/9047.91% Hybrid 56.02% Hybrid 58.2% Hybrid 44.77% Hybrid 43.90% Hybrid 58.0% Hybrid 53.47% Hybrid 56.93% Hybrid 51.6% Hybrid
ж Annual Pediatric hemoglobin A1C testing NM-NPR 75.6% NM-NPR 82.0% NM - NPR 74.7%
CMO '08,'09, '10, '11 PM Report
8.7.2012
Page 4 of 5
¥2008
Ameri-
group
2009
Amerigroup
2010
Amerigroup
2011
Amerigroup
¥2008
Peach
State
Health
Plan
2009
Peach State
Health Plan
2010
Peach State
Health Plan
2011 Peach
State Health
Plan
¥2008
WellCare
2009
WellCare
2010
WellCare
2011
Wellcare
Measure
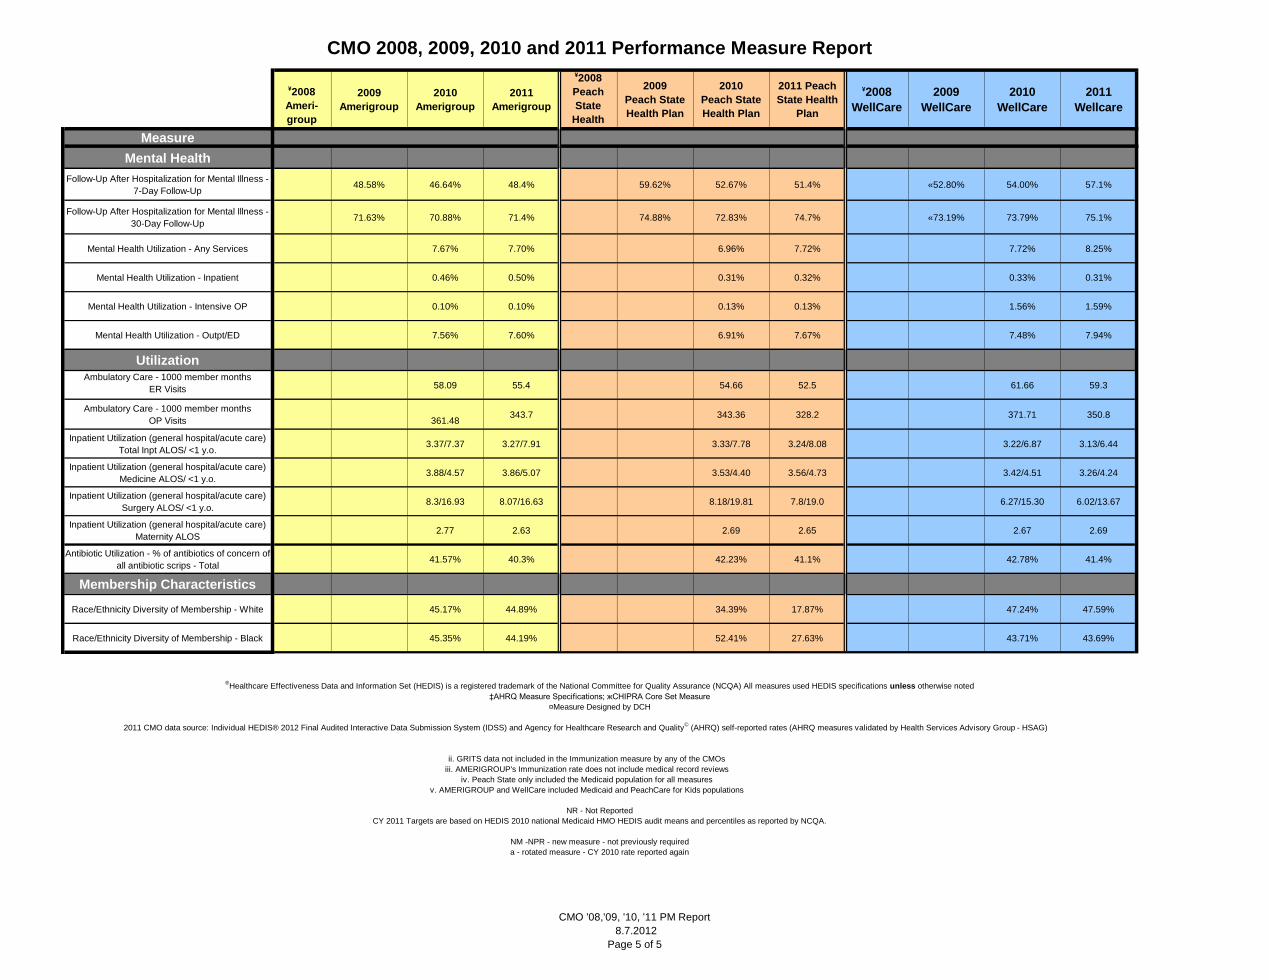
CMO 2008, 2009, 2010 and 2011 Performance Measure Report
Mental Health
Follow-Up After Hospitalization for Mental Illness -
7-Day Follow-Up48.58% 46.64% 48.4% 59.62% 52.67% 51.4% «52.80% 54.00% 57.1%
Follow-Up After Hospitalization for Mental Illness -
30-Day Follow-Up71.63% 70.88% 71.4% 74.88% 72.83% 74.7% «73.19% 73.79% 75.1%
Mental Health Utilization - Any Services 7.67% 7.70% 6.96% 7.72% 7.72% 8.25%
Mental Health Utilization - Inpatient 0.46% 0.50% 0.31% 0.32% 0.33% 0.31%
Mental Health Utilization - Intensive OP 0.10% 0.10% 0.13% 0.13% 1.56% 1.59%
Mental Health Utilization - Outpt/ED 7.56% 7.60% 6.91% 7.67% 7.48% 7.94%
UtilizationAmbulatory Care - 1000 member months
ER Visits 58.09 55.4 54.66 52.5 61.66 59.3
Ambulatory Care - 1000 member months
OP Visits 361.48343.7 343.36 328.2 371.71 350.8
Inpatient Utilization (general hospital/acute care)
Total Inpt ALOS/ <1 y.o.3.37/7.37 3.27/7.91 3.33/7.78 3.24/8.08 3.22/6.87 3.13/6.44
Inpatient Utilization (general hospital/acute care)
Medicine ALOS/ <1 y.o.3.88/4.57 3.86/5.07 3.53/4.40 3.56/4.73 3.42/4.51 3.26/4.24
Inpatient Utilization (general hospital/acute care)
Surgery ALOS/ <1 y.o.8.3/16.93 8.07/16.63 8.18/19.81 7.8/19.0 6.27/15.30 6.02/13.67
Inpatient Utilization (general hospital/acute care)
Maternity ALOS2.77 2.63 2.69 2.65 2.67 2.69
Antibiotic Utilization - % of antibiotics of concern of
all antibiotic scrips - Total41.57% 40.3% 42.23% 41.1% 42.78% 41.4%
Membership Characteristics
Race/Ethnicity Diversity of Membership - White 45.17% 44.89% 34.39% 17.87% 47.24% 47.59%
Race/Ethnicity Diversity of Membership - Black 45.35% 44.19% 52.41% 27.63% 43.71% 43.69%
NR - Not Reported
CY 2011 Targets are based on HEDIS 2010 national Medicaid HMO HEDIS audit means and percentiles as reported by NCQA.
NM -NPR - new measure - not previously required
a - rotated measure - CY 2010 rate reported again
®Healthcare Effectiveness Data and Information Set (HEDIS) is a registered trademark of the National Committee for Quality Assurance (NCQA) All measures used HEDIS specifications unless otherwise noted
‡AHRQ Measure Specifications; жCHIPRA Core Set Measure
¤Measure Designed by DCH
2011 CMO data source: Individual HEDIS® 2012 Final Audited Interactive Data Submission System (IDSS) and Agency for Healthcare Research and Quality© (AHRQ) self-reported rates (AHRQ measures validated by Health Services Advisory Group
- HSAG)
ii. GRITS data not included in the Immunization measure by any of the CMOs
iii. AMERIGROUP's Immunization rate does not include medical record reviews
iv. Peach State only included the Medicaid population for all measures
v. AMERIGROUP and WellCare included Medicaid and PeachCare for Kids populations
CMO '08,'09, '10, '11 PM Report
8.7.2012
Page 5 of 5