Embed Size (px)
Citation preview
CMMI Level 5: Return onInvestment for Raytheon N TXDonna FreedNetwork Centric Systems, McKinney, TX
12/1/2004 Page 2
Achieving CMMI Level 5• We did it!• How Did We Do It?
– Achieve Engineering Goals.
This presentation describes the benefitsof achieving CMM Level 4 in 2001, andthen to achieve CMMI Level 5 in 2003.
This presentation describes the benefitsof achieving CMM Level 4 in 2001, andthen to achieve CMMI Level 5 in 2003.
12/1/2004 Page 3
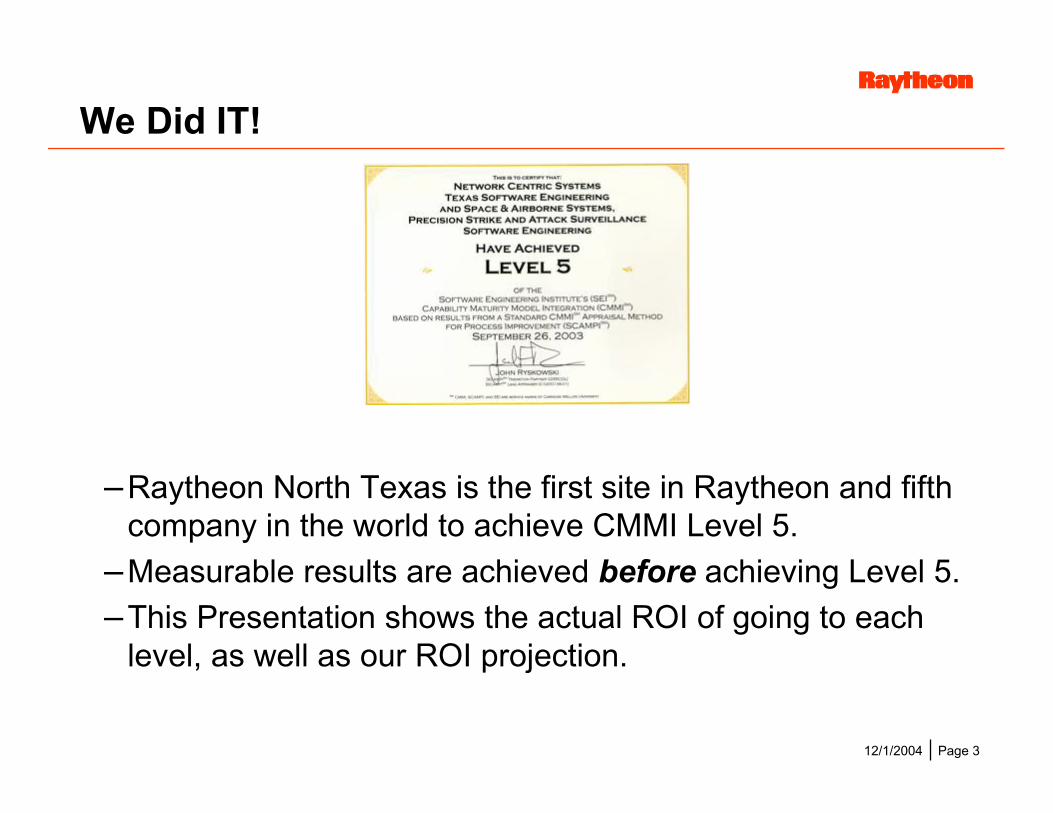
We Did IT!
–Raytheon North Texas is the first site in Raytheon and fifthcompany in the world to achieve CMMI Level 5.
–Measurable results are achieved before achieving Level 5.–This Presentation shows the actual ROI of going to each
level, as well as our ROI projection.
12/1/2004 Page 4
How Did We Use CMMI to Achieve?• Why is Raytheon North Texas pro-active about achieving
CMMI Level 5?–Because we want to achieve the performance excellence
goals required by our business. We are focused onachieving performance excellence and recognition as thepreferred supplier for new business.
12/1/2004 Page 5
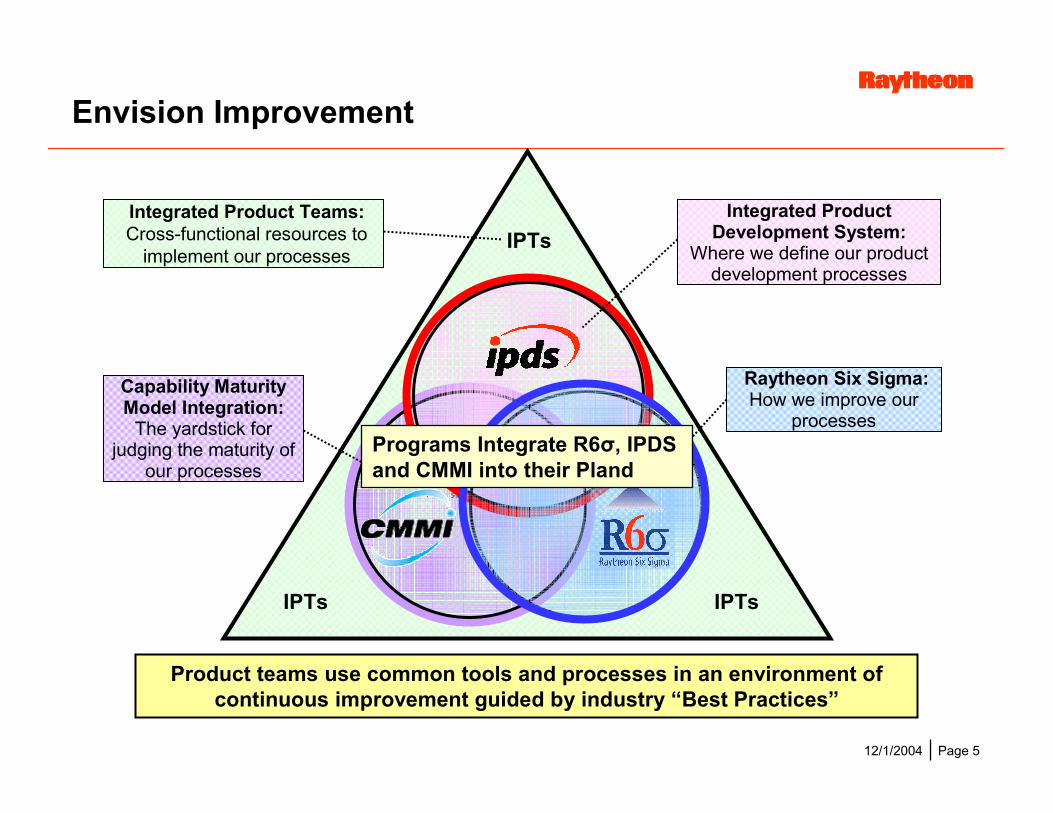
Envision Improvement
Product teams use common tools and processes in an environment ofcontinuous improvement guided by industry “Best Practices”
Integrated Product Teams:Cross-functional resources to
implement our processes
IPTs
IPTs
IPTs
Capability MaturityModel Integration:
The yardstick forjudging the maturity of
our processes
Integrated ProductDevelopment System:
Where we define our productdevelopment processes
Raytheon Six Sigma:How we improve our
processesPrograms Integrate R6σ, IPDSand CMMI into their Pland
12/1/2004 Page 6
How Did We Achieve PerformanceGoals?
How did we use CMMI to achieve our performanceexcellence goals?–We picked performance goals that were important
to us.–The metrics data we collect characterizes the
organizational performance in terms of ourorganizational goals and identifies opportunities ofimprovement.
12/1/2004 Page 7
SWEC SWIP Objectives• Meet Commitments (to Customer)
– Intent: Meet the cost and schedule objectives of the programs wesupport.
– Quantification: CPI and SPI
• SW Price– Intent: Price software engineering products competitively– Quantification: $ / DLOC
• Deliver Quality– Intent: Deliver quality software engineering products– Quantification: In-phase Defects and Defect Density
We have been executing statistical process control onthe overall process using these measures for years.
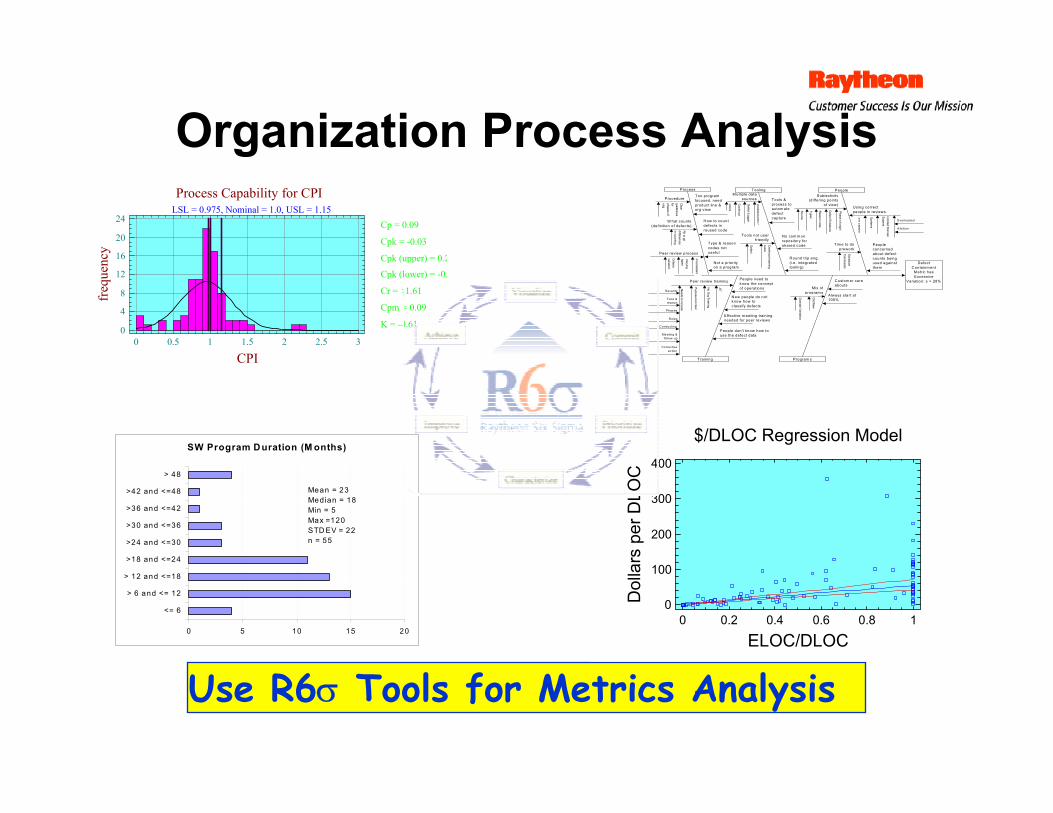
Organization Process Analysis
Use R6σ Tools for Metrics Analysis
Cp = 0.09
Cpk = -0.03
Cpk (upper) = 0.2
Cpk (lower) = -0.
Cr = 11.61
Cpm = 0.09
K = -0.61
Process Capability for CPILSL = 0.975, Nominal = 1.0, USL = 1.15
CPI
freq
uenc
y
0 0.5 1 1.5 2 2.5 30
4
8
12
16
20
24
M ultiple datasources
Process Tooling People
Training Program s
DefectC ontainm ent
M etr ic hasExcessive
Variation: s > 28%
Peer review process
W hat counts(definition of defects)
Procedure
Tools not userfriendly
Not a priorityon a program
Type & reasoncodes notuseful
H ow to coun tdefects inreused code
Too programfocused, needproduct line &org view
R ound trip eng.(i.e. integratedtooling)
No com m onrepository forshared code
Tools &process toautom atedefectcapture
T im e to doprework
Using correctpeople in reviews
Subjectivity(differing points
of view)
Peopleconcernedabout defectcounts beingused againstthem
Clear
guidelines f or phases of o rig
Peer review training
People don't know how touse the defect data
Effective m eeting trainingneeded for peer reviews
N ew people do notknow how toclassify defects
People need toknow the conceptof operations Mix of
program sAlways start at100%
C ustom er careabouts
Pjt to pjt differences in counting
Inconsistent
Varying t ypes
Criteria
v ariation
J IT
No O
rg Training
Purpose not clear
Needs to include:
S everity
Type &rea son
Phas es
Roles
Conducting
Me eting &follow-up
Correctiveac tion
Old/N
ew
Dom
ain Variation
Schedule C
onstraints
SW Experts
Systems
Limited D
omain
Experts
O verloaded
A ttrition
Phase of origin
Defect Existence
Reason code
T ypes
Source
Doublecounts??
Defect Logger
Continuus
Doors
Continuus learning
curve
Defect
SW Program D uration (M onths)
0 5 10 15 20
<= 6
> 6 and <= 12
> 12 and <=18
>18 and <=24
>24 and <=30
>30 and <=36
>36 and <=42
>42 and <=48
> 48
Mean = 23Median = 18Min = 5Max =120STD EV = 22n = 55
$/DLOC Regression Model
ELOC/DLOCD
olla
rs p
er D
LOC
0 0.2 0.4 0.6 0.8 10
100
200
300
400
12/1/2004 Page 9
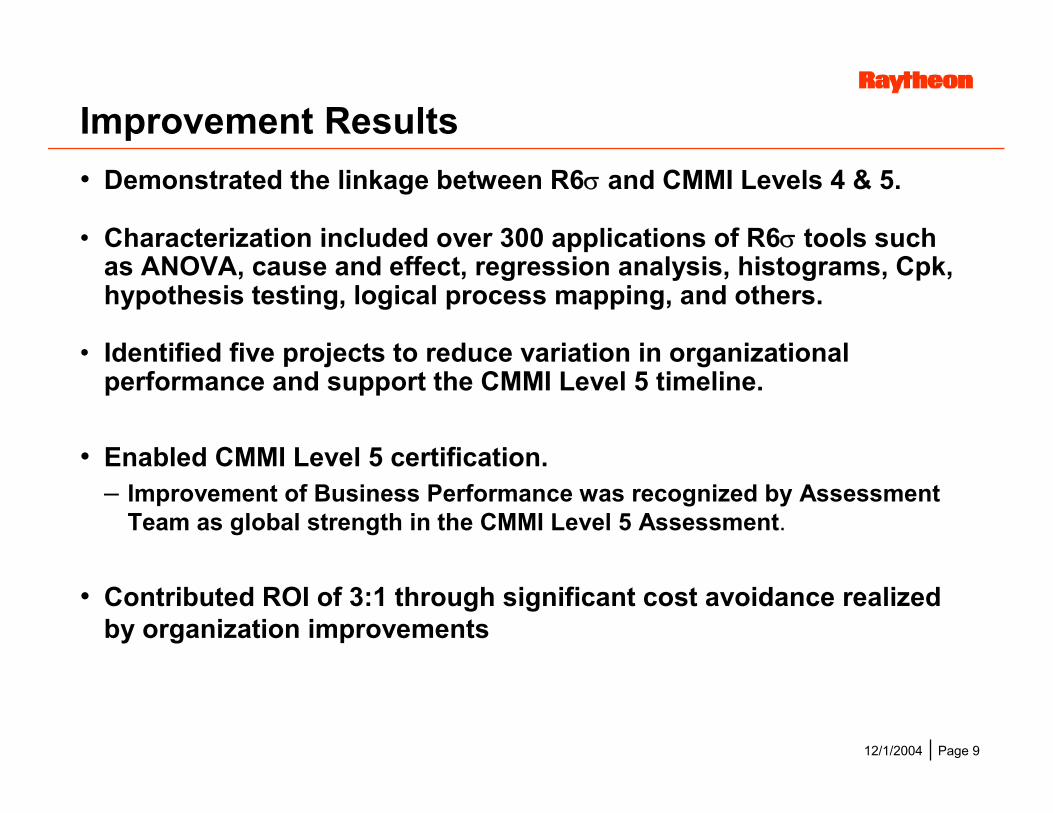
Improvement Results• Demonstrated the linkage between R6σ and CMMI Levels 4 & 5.
• Characterization included over 300 applications of R6σ tools suchas ANOVA, cause and effect, regression analysis, histograms, Cpk,hypothesis testing, logical process mapping, and others.
• Identified five projects to reduce variation in organizationalperformance and support the CMMI Level 5 timeline.
• Enabled CMMI Level 5 certification.– Improvement of Business Performance was recognized by Assessment
Team as global strength in the CMMI Level 5 Assessment.
• Contributed ROI of 3:1 through significant cost avoidance realizedby organization improvements
12/1/2004 Page 10
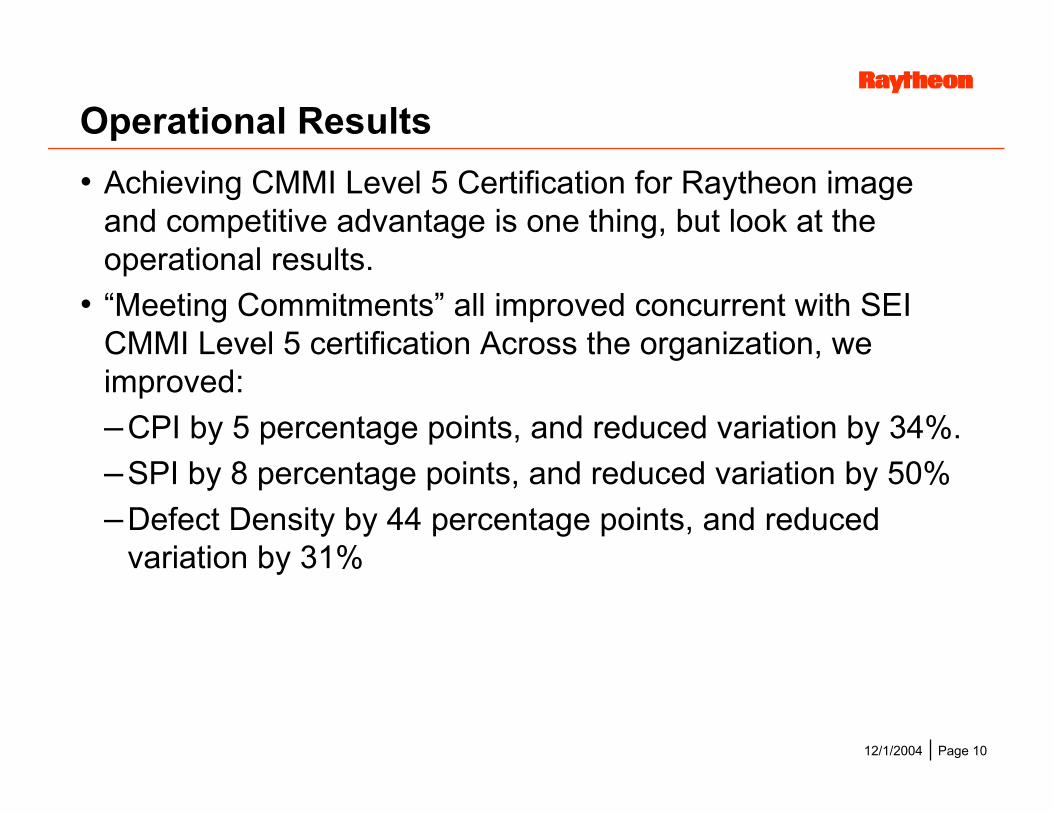
Operational Results• Achieving CMMI Level 5 Certification for Raytheon image
and competitive advantage is one thing, but look at theoperational results.
• “Meeting Commitments” all improved concurrent with SEICMMI Level 5 certification Across the organization, weimproved:–CPI by 5 percentage points, and reduced variation by 34%.–SPI by 8 percentage points, and reduced variation by 50%–Defect Density by 44 percentage points, and reduced
variation by 31%
12/1/2004 Page 11
Process Capability for CPI
CPI
frequ
ency
0
10
20
30
40
Process Capability for CPI
CPI
freq
uenc
y
0
2
4
6
8
10
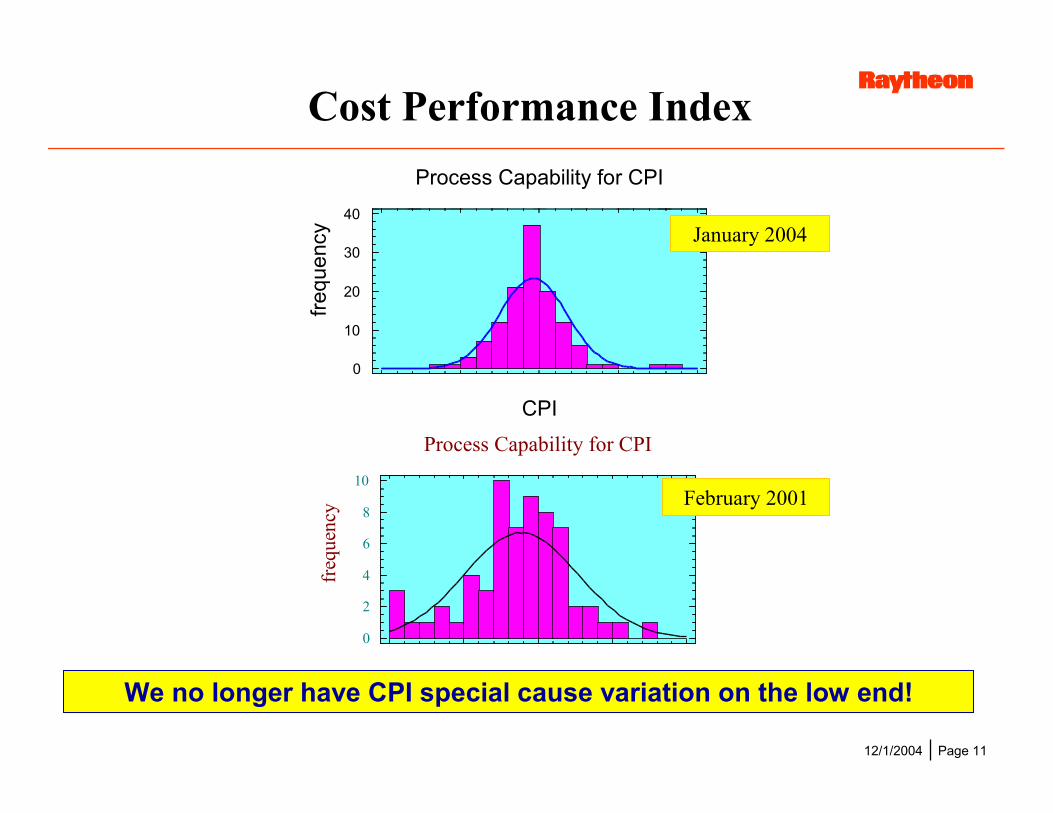
Cost Performance Index
We no longer have CPI special cause variation on the low end!
January 2004
February 2001
12/1/2004 Page 12
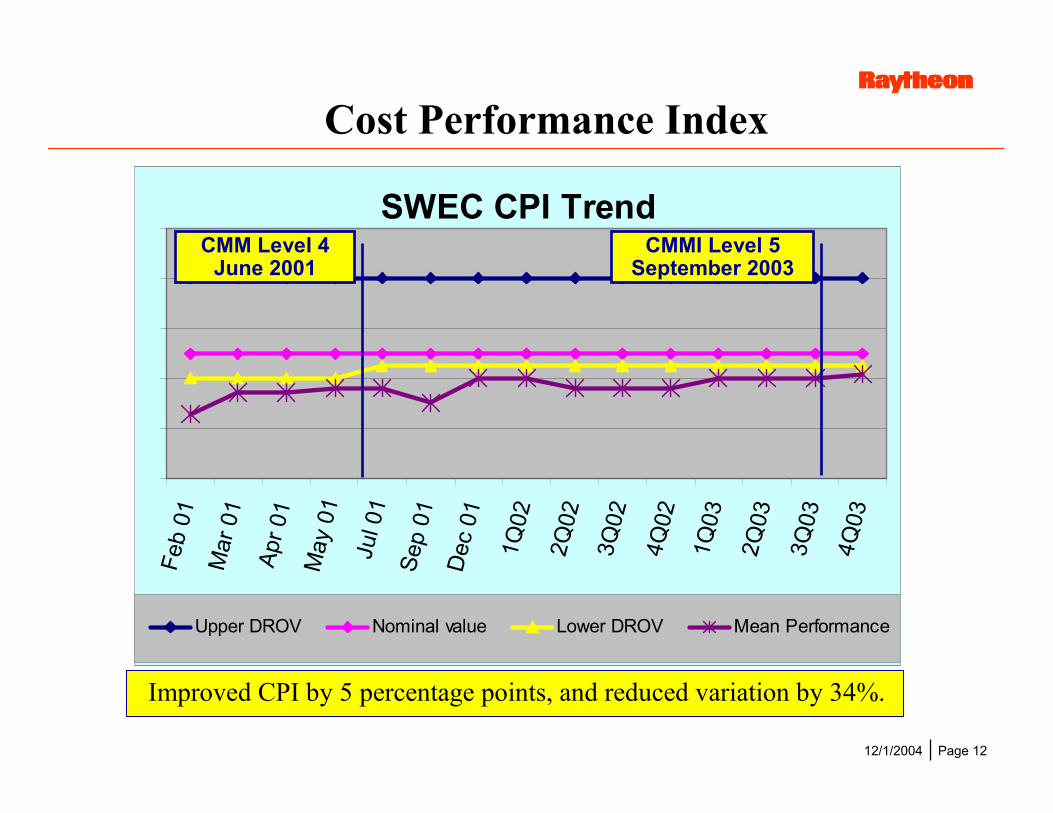
Cost Performance Index
SWEC CPI TrendFe
b01
Mar
01Ap
r 01
May
01Ju
l 01
Sep
01D
ec01
1Q02
2Q02
3Q02
4Q02
1Q03
2Q03
3Q03
4Q03
Upper DROV Nominal value Lower DROV Mean Performance
Improved CPI by 5 percentage points, and reduced variation by 34%.
CMM Level 4June 2001
CMMI Level 5September 2003
12/1/2004 Page 13
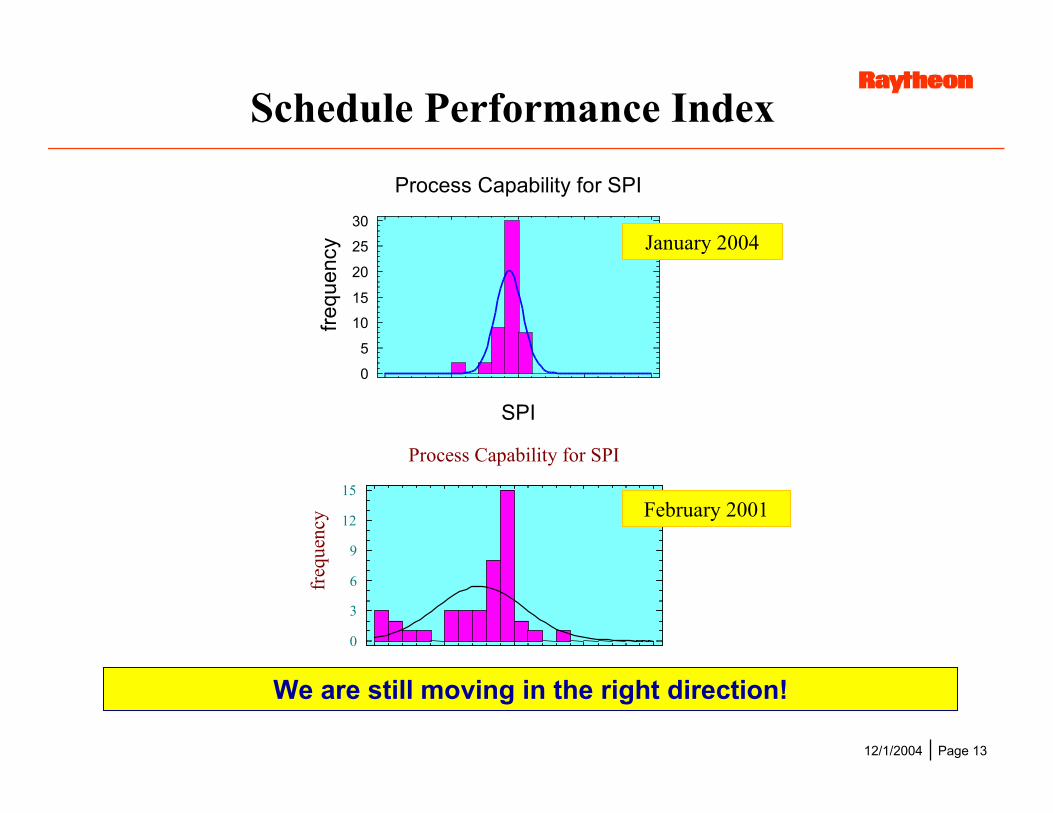
Process Capability for SPI
SPI
frequ
ency
0
5
10
15
20
25
30
Process Capability for SPI
SPI
freq
uenc
y
0
3
6
9
12
15
Schedule Performance Index
February 2001
We are still moving in the right direction!
January 2004
12/1/2004 Page 14
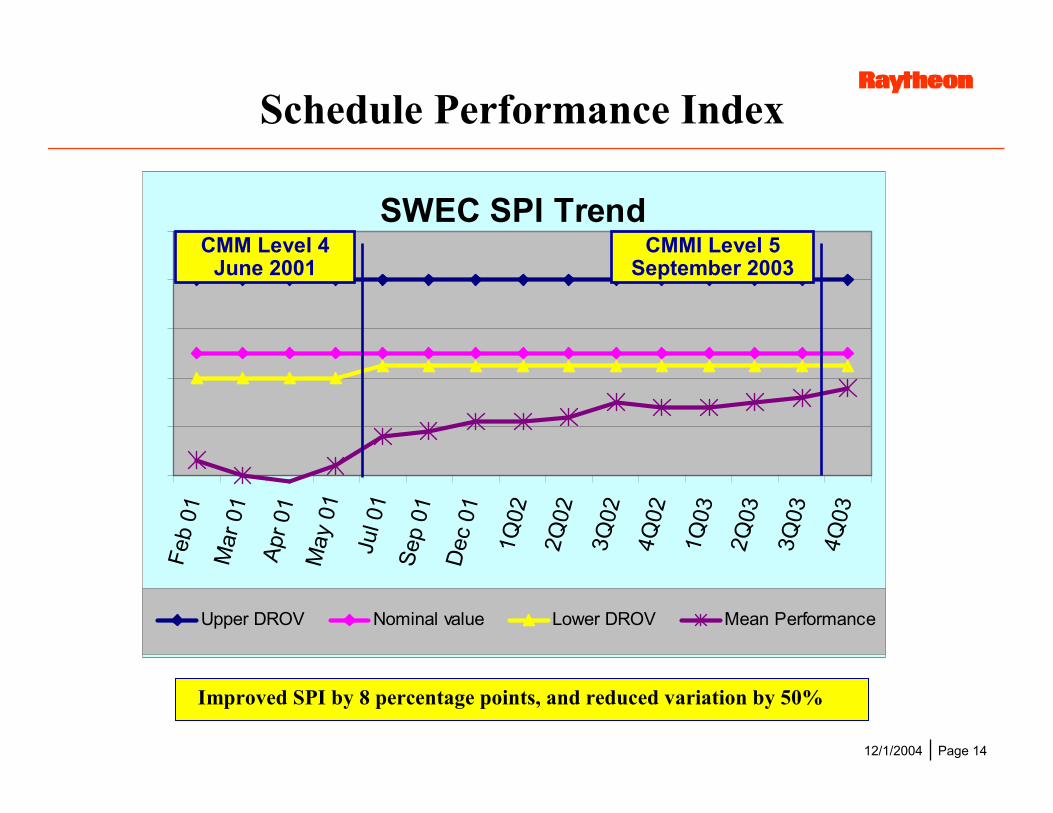
Schedule Performance Index
SWEC SPI TrendFe
b01
Mar
01Ap
r 01
May
01Ju
l 01
Sep
01D
ec01
1Q02
2Q02
3Q02
4Q02
1Q03
2Q03
3Q03
4Q03
Upper DROV Nominal value Lower DROV Mean Performance
Improved SPI by 8 percentage points, and reduced variation by 50%
CMM Level 4June 2001
CMMI Level 5September 2003
12/1/2004 Page 15
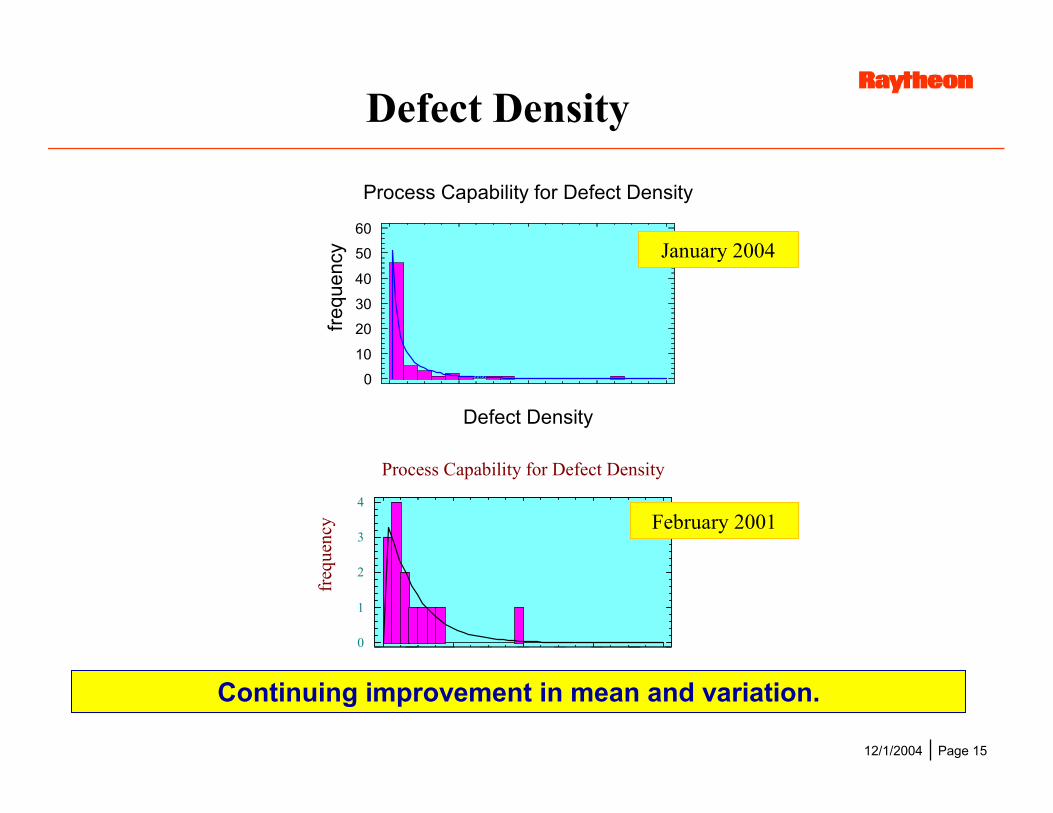
Process Capability for Defect Density
Defect Density
frequ
ency
0
10
20
30
40
50
60
Process Capability for Defect Density
Defect Density
freq
uenc
y
0
1
2
3
4
Defect Density
February 2001
Continuing improvement in mean and variation.
January 2004
12/1/2004 Page 16
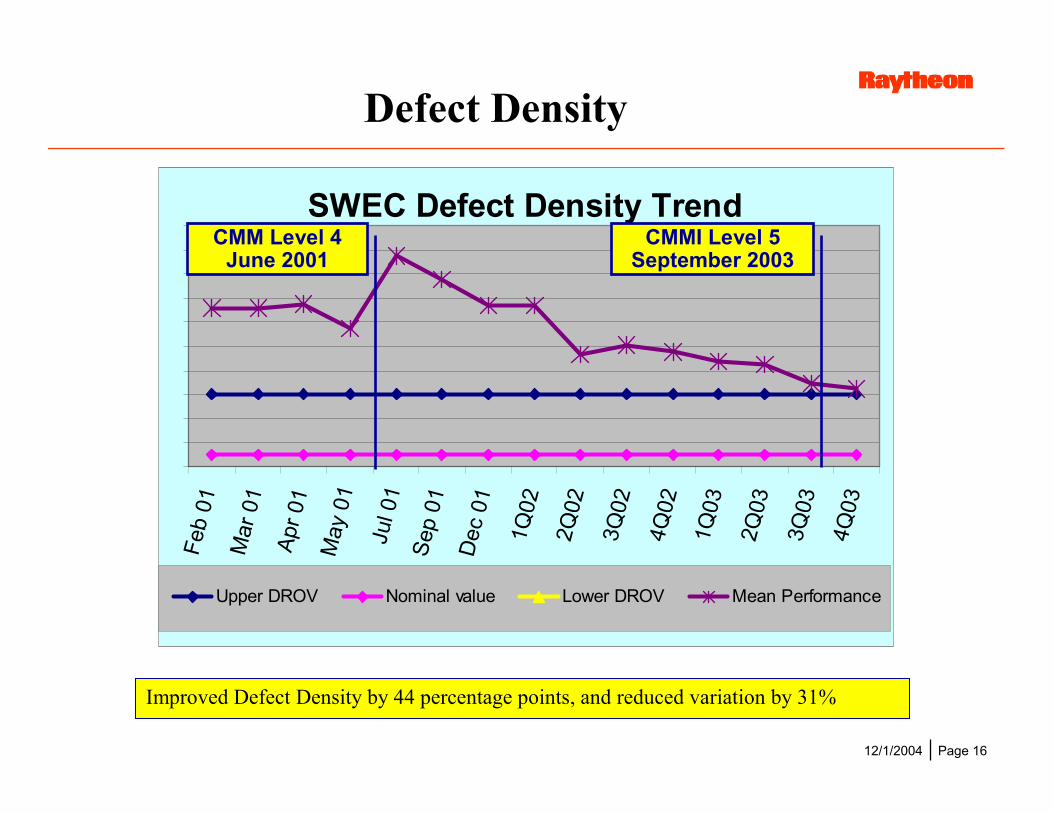
Defect Density
Improved Defect Density by 44 percentage points, and reduced variation by 31%
SWEC Defect Density TrendFe
b01
Mar
01Ap
r 01
May
01Ju
l 01
Sep
01D
ec01
1Q02
2Q02
3Q02
4Q02
1Q03
2Q03
3Q03
4Q03
Upper DROV Nominal value Lower DROV Mean Performance
CMM Level 4June 2001
CMMI Level 5September 2003
12/1/2004 Page 17
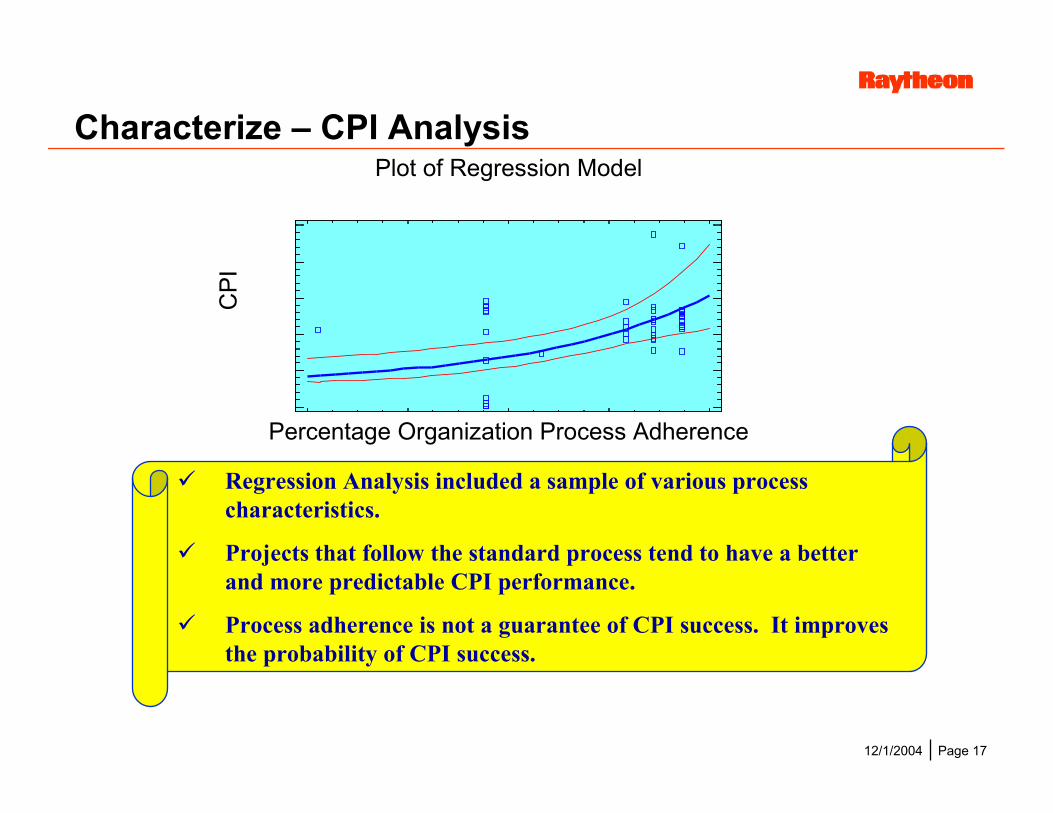
Plot of Regression Model
Percentage Organization Process Adherence
CP
I
Characterize – CPI Analysis
� Regression Analysis included a sample of various processcharacteristics.
� Projects that follow the standard process tend to have a betterand more predictable CPI performance.
� Process adherence is not a guarantee of CPI success. It improvesthe probability of CPI success.
12/1/2004 Page 18
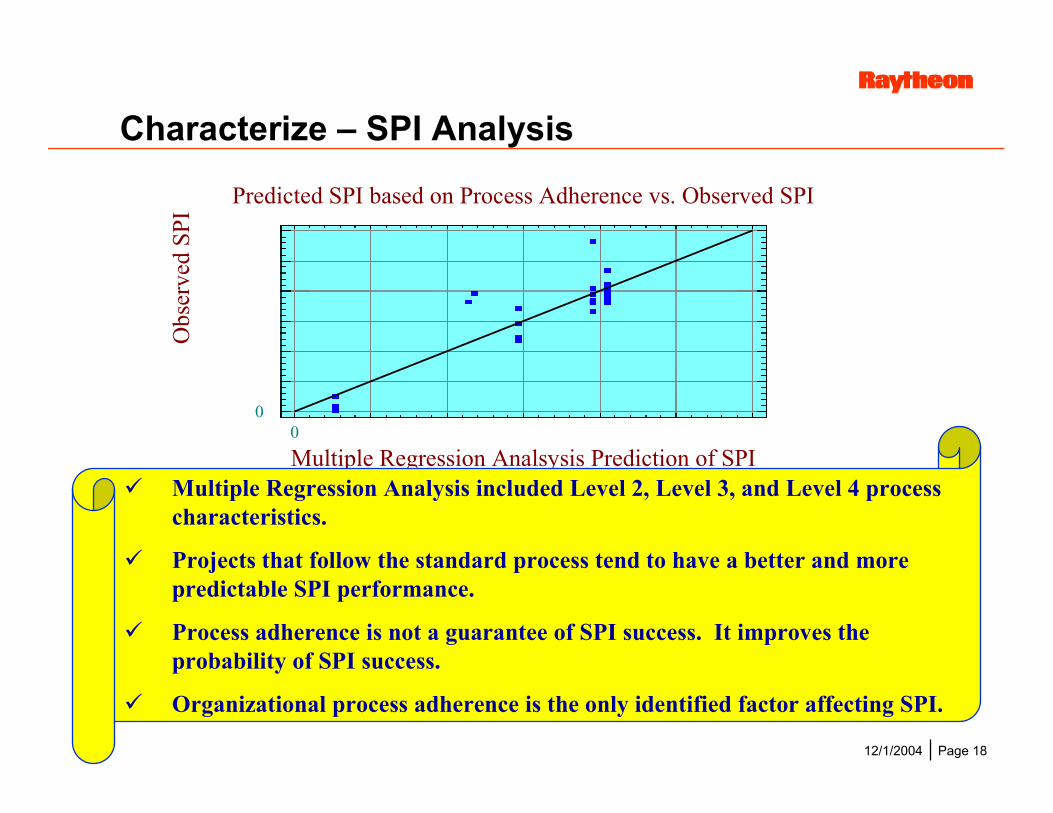
Characterize – SPI Analysis
Predicted SPI based on Process Adherence vs. Observed SPI
Multiple Regression Analsysis Prediction of SPI
Obs
erve
d SP
I
00
� Multiple Regression Analysis included Level 2, Level 3, and Level 4 processcharacteristics.
� Projects that follow the standard process tend to have a better and morepredictable SPI performance.
� Process adherence is not a guarantee of SPI success. It improves theprobability of SPI success.
� Organizational process adherence is the only identified factor affecting SPI.
12/1/2004 Page 19
Results• Our improvements were recognized as organizational
strengths in the appraisal.
“This accomplishment leads the way for Raytheon todistinguish ourselves from the competition and achievecustomer satisfaction through superior program execution.There is no higher illustration of customer focus than thislevel of excellence.”
Colin Schottlaender, Raytheon NCS President
These improvementscontributed to
ROI of 3:1