Embed Size (px)
Citation preview

217
Appendix 1 CMIP3 Models Used in
Climate Projections
Blowholes, Tongatapu

218 Climate Change in the Pacific: Scientific Assessment and New Research | Volume 1: Regional Overview
For many of the climate projections presented in Chapters 6 and 7, CMIP3 data were either analysed directly (e.g. temperature, rainfall) or used to calculate a climate variable (e.g. surface relative humidity, potential evapotranspiration) or diagnostic (e.g. Genesis Potential Index, aragonite saturation state) of interest (Table A1). However, many research institutions participating in CMIP3 did not provide data for all the model variables and SRES emission scenarios requested by the project organisers. As such, data availability is inconsistent for different variables, emission scenarios (i.e. A2, A1B and B1) and output frequencies (i.e. daily or monthly).
Table A1. CMIP3 model variables required to provide information on each PCCSP variable / climate diagnostic.
PCCSP variable / climate diagnostic Required model output (CMIP3 naming convention)
Surface air temperature Surface air temperature (tas)
Daily maximum surface air temperature Daily maximum surface air temperature (tasmax)
Daily minimum surface air temperature Daily minimum surface air temperature (tasmin)
Rainfall Precipitation (pr)
Surface wind Calculated from zonal surface wind speed (uas) and meridional surface wind speed (vas)
Solar radiation Surface downwelling shortwave radiation (rsds)
Surface relative humidity Calculated from surface specific humidity (huss), sea level pressure (psl), surface altitude (orog) and surface air temperature (tas) data
Potential evapotranspiration Calculated from surface downwelling shortwave radiation (rsds), surface air temperature (tas), surface altitude (orog), (calculated) surface relative humidity and precipitation (pr) data (Morton, 1983)
Sea surface temperature Sea surface temperature (tos)
Sea surface salinity Salinity (so)
Ocean temperature Sea water potential temperature (thetao)
Ocean salinity Salinity (so)
Ocean density Calculated from potential temperature (thetao) and salinity (so) data
Ocean circulation Calculated from eastward seawater velocity (uo) and northward seawater velocity (vo)
Buoyancy frequency squared Calculated from potential temperature (thetao) and salinity (so) data
Steric sea level Calculated from potential temperature (thetao) and salinity (so) data
Dynamic component of sea level Sea surface elevation (zos)
Genesis potential index Calculated from sea surface temperature (tos), sea level pressure (psl), air temperature (ta), specific humidity (hus), zonal wind speed (ua) and meridional wind speed (va) data
Curvature vorticity parameter Calculated from air temperature (ta), specific humidity (hus), zonal wind speed (ua) and meridional wind speed (va) data
CSIRO direct detection method Requires sea level pressure (psl), air temperature (ta), zonal wind speed (ua), meridional wind speed (va) data
Aragonite saturation state (Ωar) Requires sea surface temperature (tos) and sea surface salinity (so) data
Information on the CMIP3 model data used in providing information on each PCCSP climate variable / diagnostic is therefore provided here (Table A2, Table A3, Table A4). It should be noted that:
• For any given variable and timescale, where data are available for one or more of the A2, A1B or B1 scenarios, data are also available for the corresponding ‘Climate of the Twentieth Century’ (20c3m) simulation.
• Due to high data archiving costs, daily GCM data are typically only available for the periods 1980–1999, 2046–2065 and 2080–2099. No such limitations apply for monthly data.
• For certain variables and emission scenarios, modelling groups provided data for multiple simulations of the same model, using slightly different initial conditions. The information outlined here indicates the models for which at least one simulation is available.
• The CMIP3 data are freely available, along with detailed documentation, from the Program for Climate Model Diagnosis and Intercomparison at Lawrence Livermore National Laboratory (www-pcmdi.llnl.gov).

219Appendix 1: CMIP3 Models Used in Climate Projections
Table A2. CMIP3 models used in calculating atmospheric projections requiring daily timescale data.
Temperaturea Rainfall Tropical cyclonesb
A2 A1B B1 A2 A1B B1 CVP CDD GPI
1 BCCR-BCM2.0
2 CCSM3
3 CGCM3.1 (T47)
4 CGCM3.1 (T63)
5 CNRM-CM3
6 CSIRO-Mk3.0
7 CSIRO-Mk3.5
8 ECHAM5/MPI-OM
9 ECHO-G
10 FGOALS-g1.0
11 GFDL-CM2.0
12 GFDL-CM2.1
13 GISS-AOM
14 GISS-EH
15 GISS-ER
16 INGV-SXG
17 INM-CM3.0
18 IPSL-CM4
19 MIROC3.2 (hires)
20 MIROC3.2 (medres)
21 MRI-CGCM2.3.2
22 PCM
23 UKMO-HadCM3
24 UKMO-HadGEM1
Total models used 11 15 15 14 16 16 4 10 14
Pale blue cells denote those models and scenarios used in calculating projections. Italicised model names indicate those models excluded due to unacceptable performance in simulating the current climate (Section 5.5.1)aRefers to both the daily maximum and minimum surface air temperaturebThe Curvature Vorticity Parameter (CVP), CSIRO Direct Detection (CCD) scheme and Genesis Potential Index (GPI) were only calculated for the A2 emission scenario.

220 Climate Change in the Pacific: Scientific Assessment and New Research | Volume 1: Regional Overview
Table A3. CMIP3 models used in calculating atmospheric projections requiring monthly timescale data.
Model nameSurface air
temperature, rainfallSurface wind Solar radiation
Surface relative humidity, potential evapotranspiration
A2 A1B B1 A2 A1B B1 A2 A1B B1 A2 A1B B1
1 BCCR-BCM2.0
2 CCSM3
3 CGCM3.1 (T47)
4 CGCM3.1 (T63)
5 CNRM-CM3
6 CSIRO-Mk3.0
7 CSIRO-Mk3.5
8 ECHAM5/MPI-OM
9 ECHO-G
10 FGOALS-g1.0
11 GFDL-CM2.0
12 GFDL-CM2.1
13 GISS-AOM
14 GISS-EH
15 GISS-ER
16 INGV-SXG
17 INM-CM3.0
18 IPSL-CM4
19 MIROC3.2 (hires)
20 MIROC3.2 (medres)
21 MRI-CGCM2.3.2
22 PCM
23 UKMO-HadCM3
24 UKMO-HadGEM1
Total models used 15 18 17 13 16 15 15 18 16 9 11 10
Pale blue cells denote those models and scenarios used in calculating projections. Italicised model names indicate those models excluded due to unacceptable performance in simulating the current climate (Section 5.5.1).
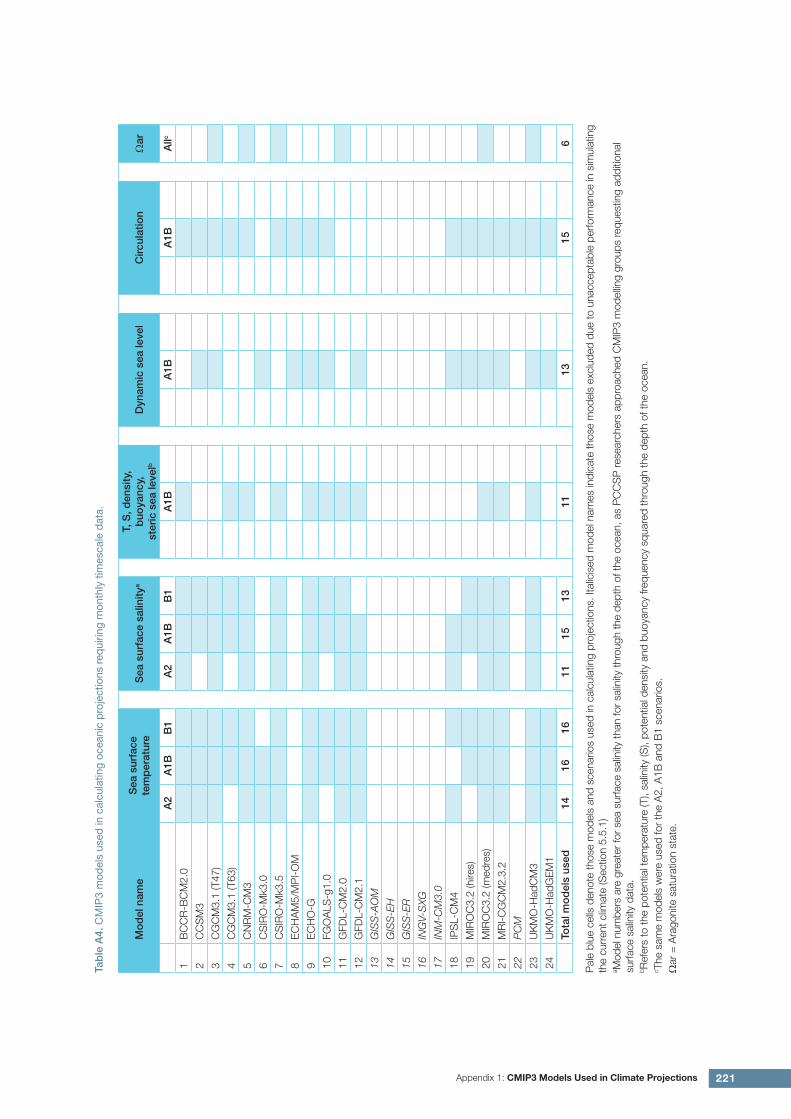
221Appendix 1: CMIP3 Models Used in Climate Projections
Tab
le A
4. C
MIP
3 m
odel
s us
ed in
cal
cula
ting
ocea
nic
pro
ject
ions
req
uirin
g m
onth
ly t
imes
cale
dat
a.
Mo
del
nam
eS
ea s
urfa
ce
tem
per
atur
eS
ea s
urfa
ce s
alin
itya
T, S
, den
sity
, b
uoya
ncy,
st
eric
sea
leve
lb
Dyn
amic
sea
leve
lC
ircul
atio
nΩ
ar
A2
A1B
B1
A2
A1B
B1
A1B
A1B
A1B
Allc
1B
CC
R-B
CM
2.0
2C
CS
M3
3C
GC
M3.
1 (T
47)
4C
GC
M3.
1 (T
63)
5C
NR
M-C
M3
6C
SIR
O-M
k3.0
7C
SIR
O-M
k3.5
8E
CH
AM
5/M
PI-
OM
9E
CH
O-G
10FG
OA
LS-g
1.0
11G
FDL-
CM
2.0
12G
FDL-
CM
2.1
13G
ISS
-AO
M
14G
ISS
-EH
15G
ISS
-ER
16IN
GV-
SXG
17IN
M-C
M3.
0
18IP
SL-
CM
4
19M
IRO
C3.
2 (h
ires)
20M
IRO
C3.
2 (m
edre
s)
21M
RI-
CG
CM
2.3.
2
22P
CM
23U
KM
O-H
adC
M3
24U
KM
O-H
adG
EM
1
Tota
l mo
del
s us
ed14
1616
1115
1311
1315
6
Pal
e bl
ue c
ells
den
ote
thos
e m
odel
s an
d sc
enar
ios
used
in c
alcu
latin
g pr
ojec
tions
. Ita
licis
ed m
odel
nam
es in
dica
te th
ose
mod
els
excl
uded
due
to u
nacc
epta
ble
perfo
rman
ce in
sim
ulat
ing
the
curr
ent c
limat
e (S
ectio
n 5.
5.1)
a Mod
el n
umbe
rs a
re g
reat
er fo
r se
a su
rface
sal
inity
than
for
salin
ity th
roug
h th
e de
pth
of th
e oc
ean,
as
PC
CS
P re
sear
cher
s ap
proa
ched
CM
IP3
mod
ellin
g gr
oups
requ
estin
g ad
ditio
nal
surfa
ce s
alin
ity d
ata.
b Ref
ers
to th
e po
tent
ial t
empe
ratu
re (T
), sa
linity
(S),
pote
ntia
l den
sity
and
buo
yanc
y fre
quen
cy s
quar
ed th
roug
h th
e de
pth
of th
e oc
ean.
c The
sam
e m
odel
s w
ere
used
for
the
A2,
A1B
and
B1
scen
ario
s.Ω
ar =
Ara
goni
te s
atur
atio
n st
ate.


![Clinics in Surgery Research Article · and suctionbased techniues hae either been largely abandoned ngioet oston cientic ... (SMPE) [6,8]. Given significantly increased 30-day mortality](https://img.pdfslide.us/doc/110x75/5c1eab3809d3f26b738b6cba/clinics-in-surgery-research-and-suctionbased-techniues-hae-either-been-largely.jpg)