Embed Size (px)
Citation preview
AN APPRAISAL OF THE MARINE FISHERIES IN ORISSA
K. S. SCARIAH, VARUGHESE PHIUPOSE, S. S. DAN,
P. KARUNAKARAN NAIR AND G. SUBBARAMAN
CMFRI Special Publication
Number 32
2
Issued in connection with the 40th Anniversary Celebrations of
Central Marine Fisheries Research Institute P. B. No. 2704, E. R. G. Road, Cochin-682 031, India
{Indian Council of Agricultural Research)
September 16-18. 1987.
Limited Circulation
©
Published by
Dr. P. S. B. R. JAMES Director
Central Marine Fisherici Research Institute
P. B. 2704 E. R. G. Road Cochin-682 031
India
Cover drawing by Shri K. K. Sankaran Artist CMFRI, Cochin
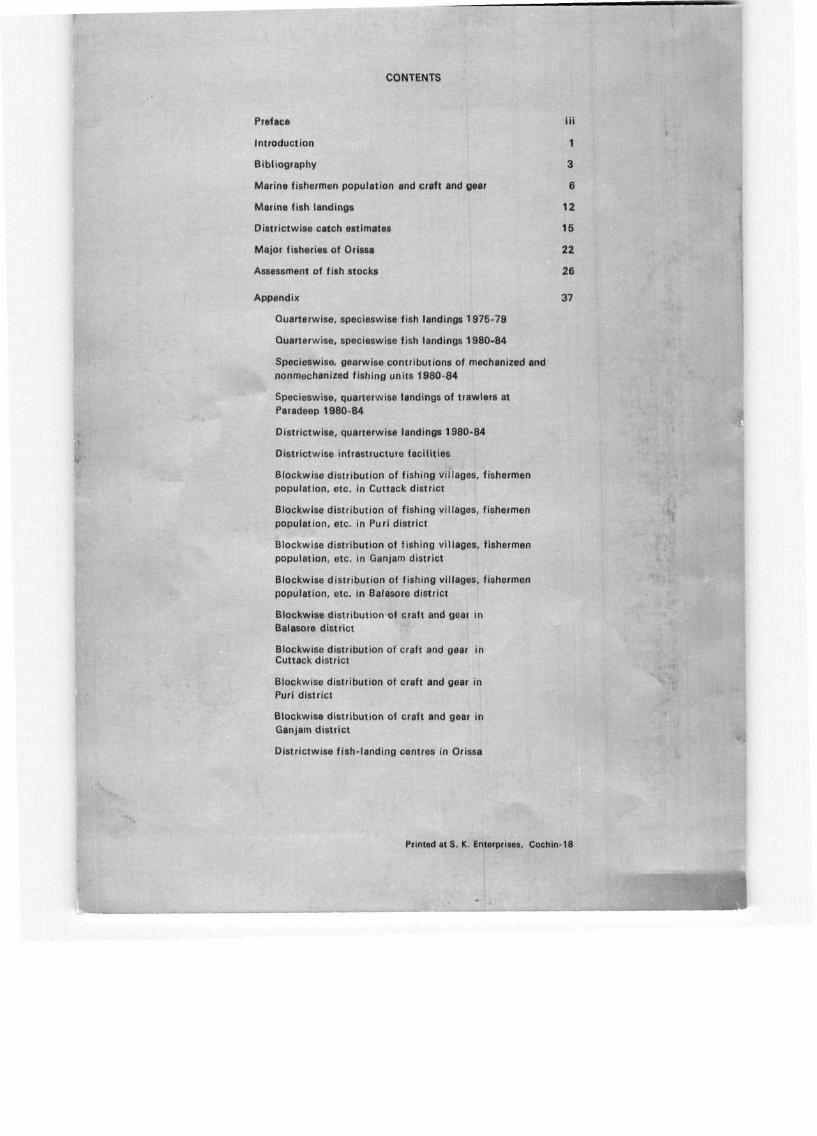
CONTENTS
Preface
Introduction
Bibliography
Marine fishermen population and craft and gear
Marine fish landings
Districtwise catch estimates
Major fisheries of Orissa
Assessment of fish stocks
i i i
1
3
6
12
15
22
26
Appendix 37
Quarterwise, specieswise fish landings 1975-79
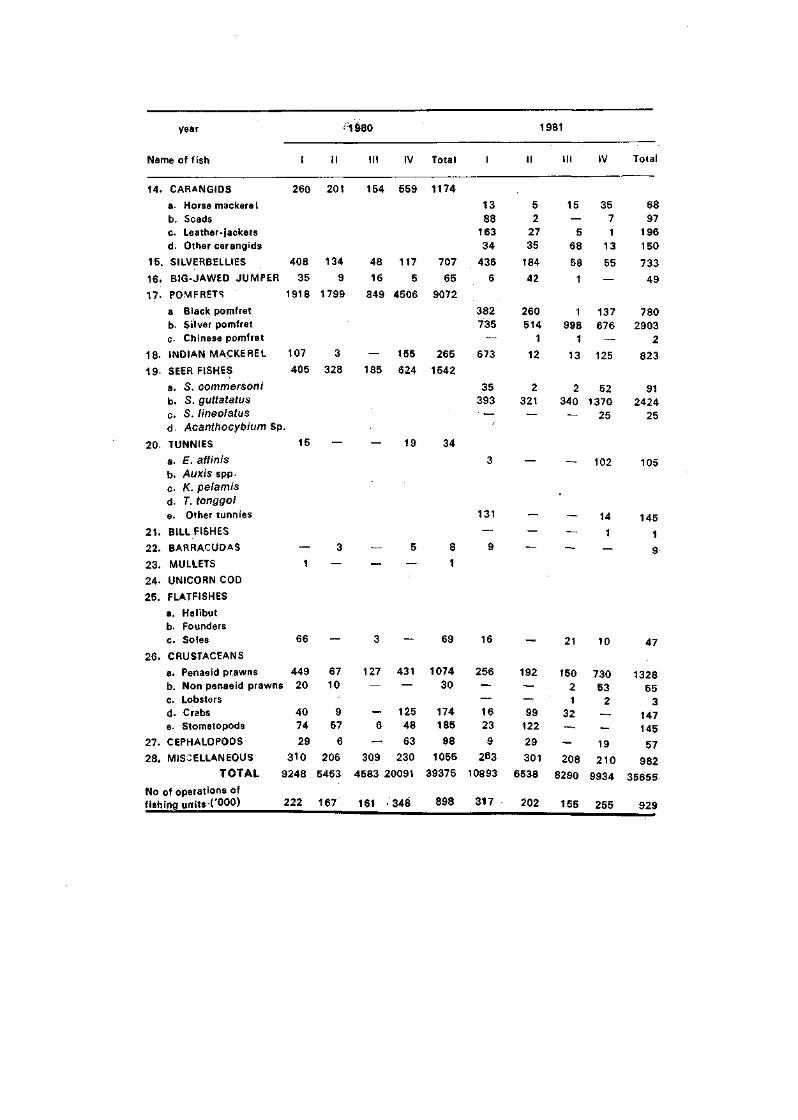
Quarterwise, specieswise fish landings 1980-84
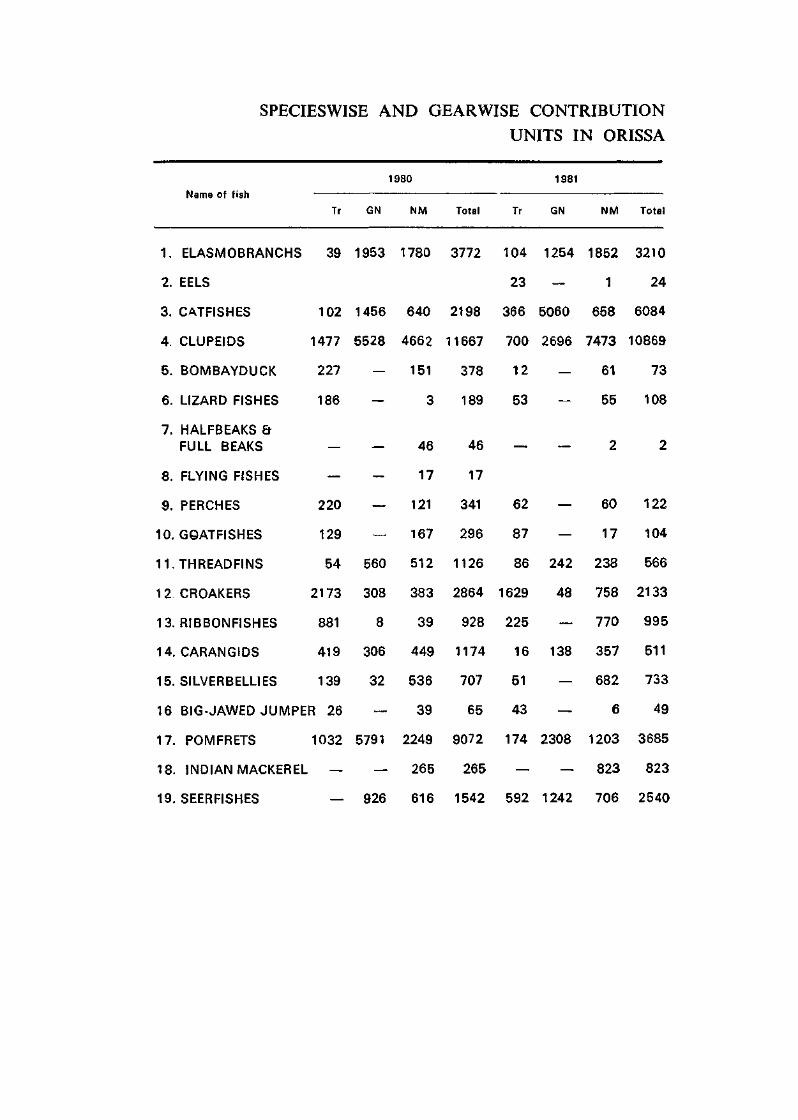
Specieswise, gearwise contributions of mechanized and nonmechanized fishing units 1980-84
Specieswise, quarterwise landings of trawlers at Paradeep 1980-84
Districtwise, quarterwise landings 1980-84
Districtwise infrastructure facilities
Blockwise distribution of fishing villages, fishermen population, etc. in Cuttack district
Blockwise distribution of fishing villages, fishermen population, etc. in Puri district
Blockwise distribution of fishing villages, fishermen population, etc. in Ganjam district
Blockwise distribution of fishing villages, fishermen population, etc. in Bafasore district
Blockwise distribution of craft and gear in Balasore district
Blockwise distribution of craft and gear in Cuttack district
Blockwise distribution of craft and gear in Puri district
Blockwise distribution of craft and gear in Ganjam district
Districtwise fish-landing centres in Orissa
Printed at S. K. Enterprises, Cochin-18
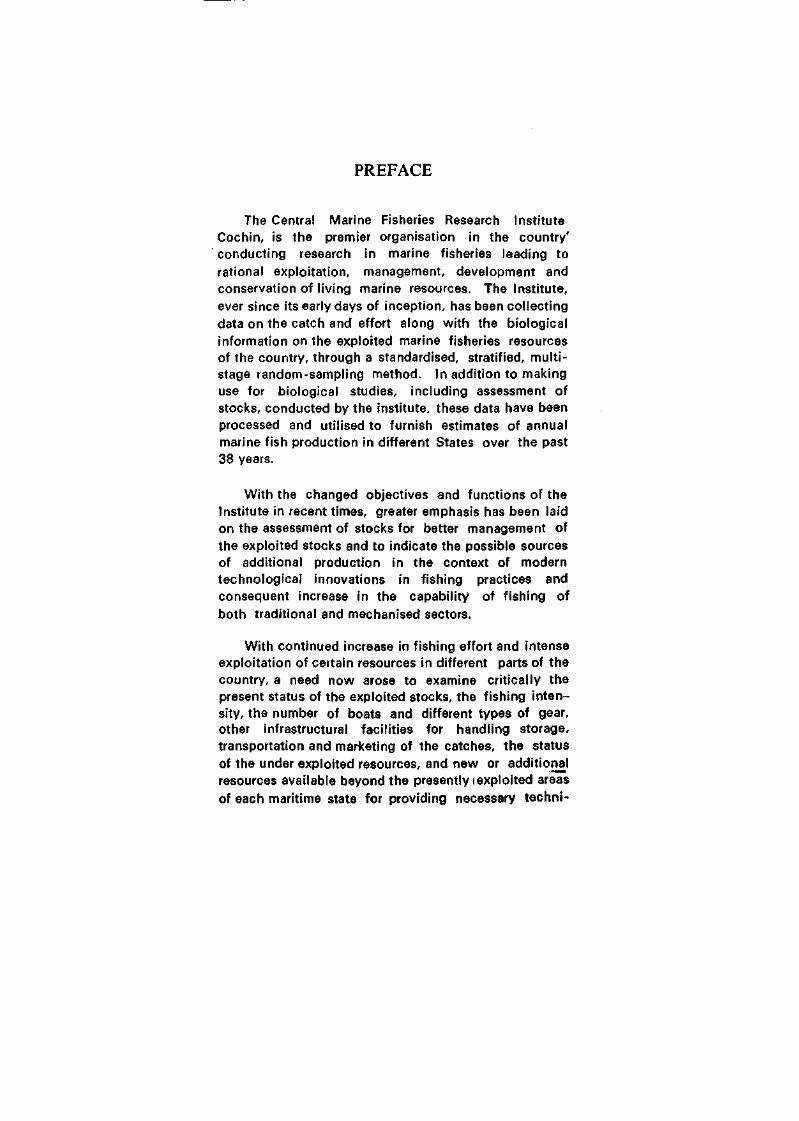
PREFACE
The Central Marine Fisheries Research Institute Cochin, is the premier organisation in the country' conducting research in marine fisheries leading to rational exploitation, management, development and conservation of living marine resources. The Institute, ever since its early days of inception, has been collecting data on the catch and effort along with the biological information on the exploited marine fisheries resources of the country, through a standardised, stratified, multistage random-sampling method. In addition to making use for biological studies, including assessment of stocks, conducted by the institute, these data have been processed and utilised to furnish estimates of annual marine fish production in different States over the past 38 years.
With the changed objectives and functions of the Institute in recent times, greater emphasis has been laid on the assessment of stocks for better management of the exploited stocks and to indicate the possible sources of additional production in the context of modern technological innovations in fishing practices and consequent increase in the capability of fishing of both traditional and mechanised sectors.
With continued increase in fishing effort and intense exploitation of certain resources in different parts of the country, a need now arose to examine critically the present status of the exploited stocks, the fishing intensity, the number of boats and different types of gear, other infrastructural facilities for handling storage, transportation and marketing of the catches, the status of the under exploited resources, and new or additional resources available beyond the presently iexploited areas of each maritime state for providing necessary techni-
cal advice to the respective Governments to manage and conserve the resources.
It is with this in view that the data relating to each maritime state for the period 1975-84 are consolidated and processed and presented as a separate Special Publication. This Number gives the appraisal of the marine fisheries of Orissa, highlighting the status of the exploited resources and the level of exploitation. It also gives guidelines for increasing the catches by proper development, management and conservation of resources.
I thank Dr. K. S. Scaria and S/Shri Varughese Phili-pose, P. Karunakaran Nair, G. Subbaraman and S. S. Dan for the pains taken in the preparation of this report. S/Shri Sukdev Bar, K, Ramasomayajulu, K. Dhanaraju and Sapan Kumar Ghosh collected the catch and other details which form the base of this report. I deeply appreciate the earnest efforts put by them in this regard.
P. S. B. R. James Director C. M. F. R. Institute Cochin-31
AN APPRAISAL OF THE MARINE FISHERIES IN ORISSA
K. S. SCARIAH, VARUGHESE PHILIPOSE, S.S.DAN,
P. KARUNAKARAN NAIR AND G. SUBBARAMAN
INTRODUCTION
The State Orissa is situated between latitudes 17.75°N and 22.5°N and longitudes 81.5°E and 87.6°E, bordered by the Bay of Bengal in the east, West Bengal in the north-east, Bihar in the north, Madhyapradesh in the west and north-west, and Andhra Pradesh in the south.
Orissa, with an area of 1 55,842 sq. km. accounts for 4.7% of the geographical area of India. The state has 13 districts, of which four are coastal. The coastal districts are Balasore, Cuttack, Puri and Ganjam. These together have a coastline of 480 km. forming 8% of the coastline of India.
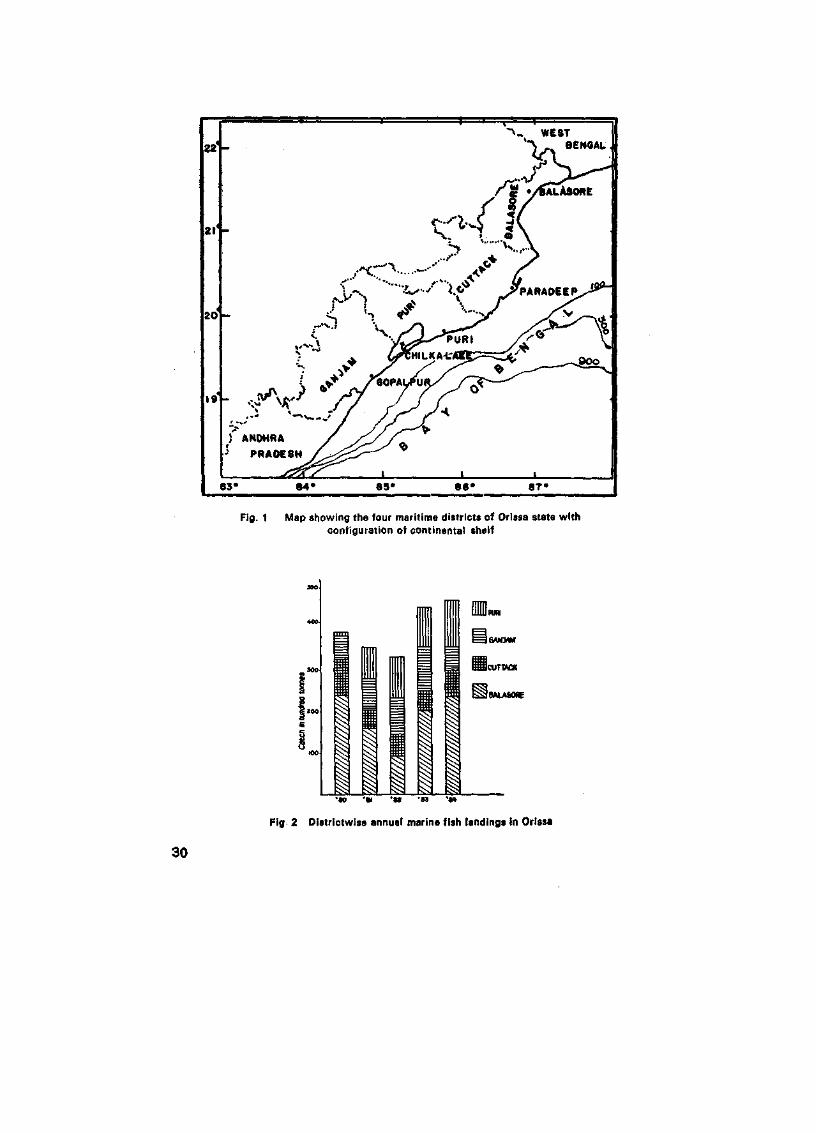
The continental shelf up to 200m depth covers an area of 25,000 sq. km, which is 4.5% of the total area of the country's continental shelf. In the northern part of Orissa, the continental shelf extends up to 120 km and in the southern part up to 40 km. (Fig. 1).
Orissa has a moderate climate, consisting of three seasons, summer from March to May, rainy season from June to September-November, and winter from December to February. Of the two monsoons, the active is the S. W., during June-September, and the weak is the N. E. in November. The S. W. monsoon contributes 90% of the annual rainfall, averaging about 148 cm. Orissa's coastal area is cyclone-prone and is likely to be worst
affected during the S. W. monsoon. Cyclones may also occur in May, during the inter-monsoonal period.
Two major currents along the coast prevail throughout the year a north-easterly one f lows during the period January to July and a southwesterly during the period August to December.
The distribution of marine craft and gear in Orissa is in relation to the diversity of the marine ecology from south to north Orissa. South Orissa, comprising Ganjam, Puri and the southern part of Cuttack district, has a narrow continental shelf and open sandy beaches, where as north Orissa, comprising central and northern Cuttack district and Balasore is characterised by an extended continental shelf, intertidal flats and extensive river deltas.
In recent years, Orissa is fast developing in the fisheries sector introducing a large number of mechanised boats improving techniques of f ishing in indigenous sector and establishing a well-developed fishery harbour at Paradeep. The status of marine fisheries in the state of Orissa during the past ten years (1975-1984) is detailed in this book, mainly based on the works of this Institute listed in the next-chapter (Bibliography).
2
BIBLIOGRAPHY
ALAGARAJA, K, K. NARAYANA KURUP, M. SRINATH AND G. BALAKRI-SHNAN 1982. Analysis of marine fish landings in India-
A new approach. CMFRI Spl. Publn, 10 :1 -40 .
APPA RAO, T. 1978. Relative abundance of sciaenids along Andhra-Orissa coasts. Indian. J. Fish., 13 (1 8-2) : 201-212.
APPA RAO, T. AND B. KRISHNAMOORTHI 1983. Diurnal variation in the catches of demersal fishes in the northwest region of Bay of Bengal during 1959 60. Ibid., 29 (1 & 2) : 134-143.
BAY OF BENGAL PROGRAMME. Marine Small Scale Fisheries of Orissa. A general Description. BOBP / INF / 7.
BHATTATHIRI, P. M. A., V. P. DEVASSAY AND K. RADHAKRISHNA 1980. Primary production in the Bay of Bengal during southwest monsoon of 1978. Mahasagar., 13 (4) : 315-321.
CMFRI, 1981. All India Census of Marine Fishermen, Craft and Gear 1980. Mar. Fish. Infor. Serv T& ESer., 30 : 1-32.
DfVASSY, V. P., K. RADHAKRISHNA AND P. M. A. BHATTATHIRI 1981. Primary productivity studies in the Bay of Bengal. Mahasagar., 14 (1977).
DHARMA RAJA, S. K. AND VARGHESE PHILIPOSE 1977. Trends in the yields of major exploited fisheries of east coast of India. Indian. J. Fish., 22 (1 & 2) (1975) : 187-197.
GEORGE, P.C, B.T.ANTONY RAJA AND K. C. GEORGE 1977. Fishery Resources of Indian. Economic Zone. Souvenir, Silver Jubilee. I. F. P., Cochin, India: 79-116.
JAMES, P. S. B. R., K. ALAGARSWAMY, K. V. NARAYANA RAO, M. S. MUTHU, M. S. RAJAGOPALAN, K. ALAGARAJA AND C. MUKUNDAN 1986. Potential Marine Fishery Resources. Seminar on Potential Marine Fishery Resources. April 23, 1986. CMFRI, Cochin-31.
JONES, S. 1957. On, the late winter and early spring migration of the Indian Shad Hilsa illisha (Hamilton) in the Gangetic Delta. Indian. J. Fish.. 4 (2) : 304 - 314.
3
JONES, S. AND V. R PANTULA 1958. On some larval and juvenil fishes from the Bengal and Orissa coasts. Ibid., 5 (1) : 118-143.
JONES, S. 1959. Fishing methods for the Indian Shad, Hilsa illisha (Hamilton) in the Indian region. Part-1. J.Bombay Nat. Hist. Soc, 56 (2) : 250-275.
JONES, S. 1959. Fishing methods for the Indian Shad Hilsa illisha (Hamilton) in Indian region. Part-11. Ibid. 56 (3) : 423-448.
JOSEPH, K. M. AND M. E. JOHN 1986. Potential Marine Fishery Resources. Seminar on Potential Marine Fishery Resources. April 23' 1986. CMFRI, Cochin-31.
KRISHNAMOORTHI, B. 1976. An assessment of the demersal fishery resources off the Andhra-Orissa Coast based on exploratory trawling. Indian J. Fish., 21 (2) : 557-565.
KUTHALINGAM, M. D. K. 1967. Observations on the fishery and biology of silver pomfret Pampus argenteus (Euphrases) from the Bay of Bengal. Indian. J. Fish., 10 A (1) : 59-74.
KUTHALINGAM, M. D. K. 1967. Some observations on the fishery and biology of Kurtus indicus (Block) of the Bay of Bengal Sand Heads to Gopalpur. Ibid. 10A (2): 159-166
KUTHALINGAM, M. D. K., P. MOJUMDAR AND (LATE) A. K. CHATERJEE 1974. Offshore fishery resource of the Bay of Bengal from Sand Heads to Gopalpur. Proc. Symp. Living [Resources of the Seas around India. Sol. Pubn. CMFRI: 495-516.
MUTHU, M. S. 1967. On the occurrence of Metapenaeus ensis (de-Haan) in the Bay of Bengal. J. mar. biol. Assn. India, 7 (2) : 465-468.
NAGABHUSHANAM, A. K. 1971. A>ludy of the offshore demersal fisheries of Andhra and Orissa coasts, with special reference to the biological data collected during 1960. Indian J. Fish., 13 (1 & 2 ) (1966) : 359-379.
PANIKKAR, N. K. 1954. Progress of Hilsa investigation in India from 1938 to 1950 - A review. J. As/at. Soc, Calcutta, 20 (1) : 61 -63.. .
RADHAKRISHNA, K. 1978. Primary productivity of the Bay of Bengal during March-April 1975. Indian. J. Mar Sci., 7 (1) : 58-60.
4
RADHAKRISHNA, K.. P. M. A. BHATTATHIRI AND V. P. DEVASSY 1978. Primary productivity of the Bay of Bengal during August-September 1976. Ibid., 7 (1) : 94-98.
RAMASOMAYAJULU, K. AND. K. DHANA RAJU 1985. A confirmation of the occurrence of oil sardine Sardinella longiceps valaenciennes along the Orissa coast. Ibid., 32 (4) : 495-496.
RAO, K, VENKATASUBBA 1984. Age and growth of Lizard fishes (Saurida spp) from the northwestern Bay of Bengal. Indian J. Fish., 31 (1) : 19-30.
REUBEN, S. 1968. On the occurrence of Euphausia distinguenda Hansen irt the northwestern Bay of Bengal, Curr.Sci., 37 (24):703 704.
REUBEN, S. 1969. A note on the food of malabar trevally Carangoides malabaricus (Block & Schneder) from the northwestern Bay of Bengal. J. mar. biol. Assn. India, 10 (1) (1968): 135-151.
SEKHARAN, K. V. 1973. The depth distribution of catfishes Tachysurus thalassinus (Rupp) and T. tenuispinus (Day) in the northwestern Bay of Bengal. Indian. J. Fish, 20 (1): 193-202.
SEKHARAN, K. V. 1973. On the catfish resources of the coasts Andhra Pradesh, Orissa and West Bengal. Proc. Symp. living Resources of the seas around India, Special Publication CMFRI, pp 51 7-536
SEKHARAN, K. V., M. S. MUTHU, K. VENKATASUBBA RAO, V. RAMA-MOHANA RAO, P. MOJUMDAR AND S.REUBEN 1973. Exploratory trawling on the continental shelf along the northwestern part of Bay of Bengal. Ibid, pp. 280-337.
SILAS, E. G, T. JACOB, K. C. GEORGE AND M. J. GEORGE 1980. Status paper on coastal fishery resources along the east coast. Report on the consultation on stock assessment for small scale fisheries in the Bay of Bengal. BOBP\REP. 10.2: 23-27.
5
MARINE FISHERMEN POPULATION AND CRAFT AND GEAR IN ORISSA
For planning developmental programmes in marine fisheries sector, the information such as the number of fishing villages, landing centres, fishermen population, active fishermen and fishing craft and gear in a maritime state is a prerequisite. Such information also provides the frame needed for conducting sample survey for estimation of marine fish production and fishing effort. Further, periodic frame surveys are necessary to understand the status of the traditional small scale fisheries sector in the changing pattern of f ishing industry. The National Commission on Agriculture has emphasised in its recommendation that CMFRI should conduct quinquennial census in order to update the inventory of fishing resources available in the coastal villages wi th the help of state governments. Keeping this in view, Central Marine Fisheries Research Institute (CMFRI) has been conducting frame surveys periodically since 1948-'49.
An account of all India census of marine fishermen and craft and gear carried out by CMFRI in 1980 w i th the co-operation of the maritime states was published (CMFRI) 1981. This report gives statewise and districtwise details of marine f ishing villages, landing centres, fishermen populat ion, educational status, number of fishermen engaged in actual fishing and fishing craft and gear.
Fishing Villages and Landing Centres
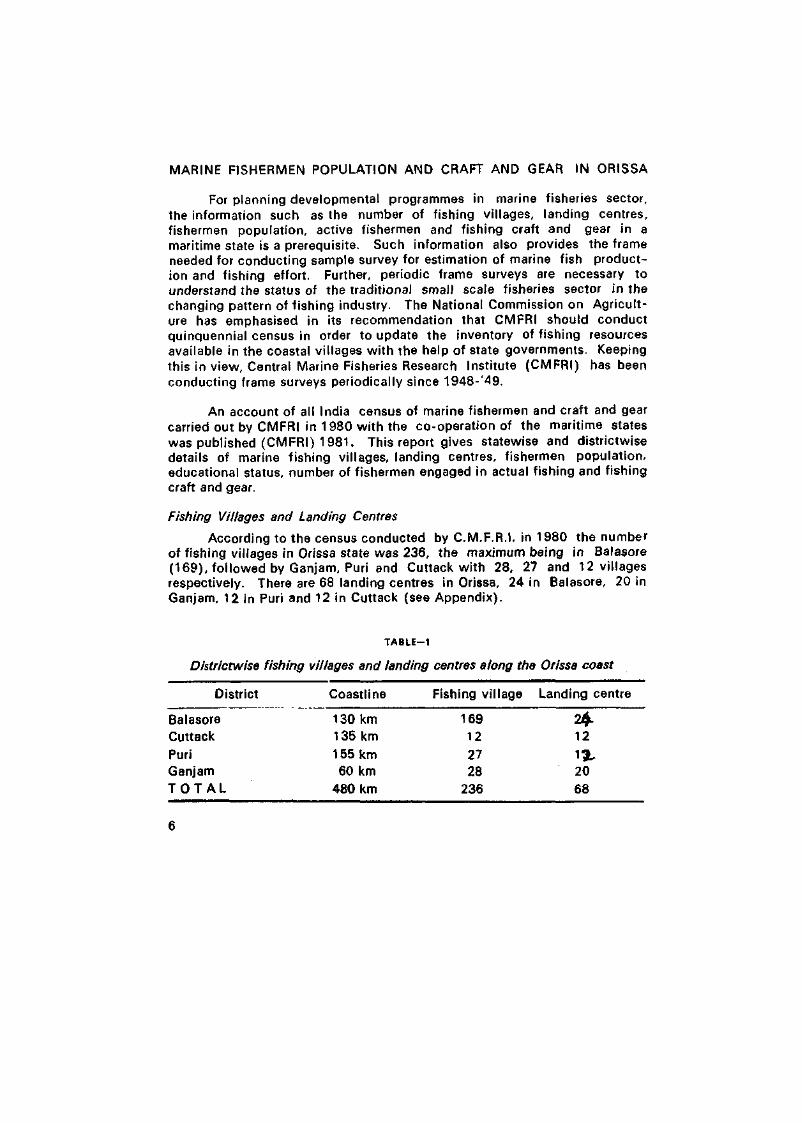
According to the census conducted by CM.F.R. I , in 1980 the number of f ishing villages in Orissa state was 236, the maximum being in Balasore (169) , fo l lowed by Ganjam, Puri and Cuttack wi th 28, 27 and 12 villages respectively. There are 68 landing centres in Orissa, 24 in Balasore, 20 in Ganjam, 12 in Puri and 12 in Cuttack (see Appendix).
TABLE-1
Districtwise fishing villages and landing centres along the Orissa coast
District Coastline Fishing vil lage Landing centre
Balasore Cuttack
Puri Ganjam T O T A L
130 km 169 2$. 135 km 12 12
155 km 27 13 , 60 km 28 20
480 km 236 68
6
Balasore District: In the Balasore district marine fishing villages are covered by 7 'blocks' namely Balasore (Sadar), Baliapal, Bhogarai, Basudebpur, Remuna, Bahanage and Chandabali. The maximum number of marine fishing village was observed in Baliapal (49) the next highest was in Balasore (Sadar) (33), followed by Bhogarai (32), Basudebpur (19), Remuna and Bahanage (16 each) and Chandabali (4).
Cuttack District: There are only 3 'blocks' in this district where marine fishing villages are situated with 4 fishing villages in each.
Puri District: The marine fishing villages in Puri are covered by 4 'blocks' viz. Astarang, Krishnaprasad, Puri Sadar and Gop. The maximum number of fishing villages was observed in Astarang ( ' 6 ) , followed by Krishnaprasad (6), Puri Sadar (3) and Gop (2).
Ganfam District: Ganjam has 28 marine fishing villages situated in Chatrapur, Rangailunda, Chikiti and Ganjam 'blocks'.
Households:
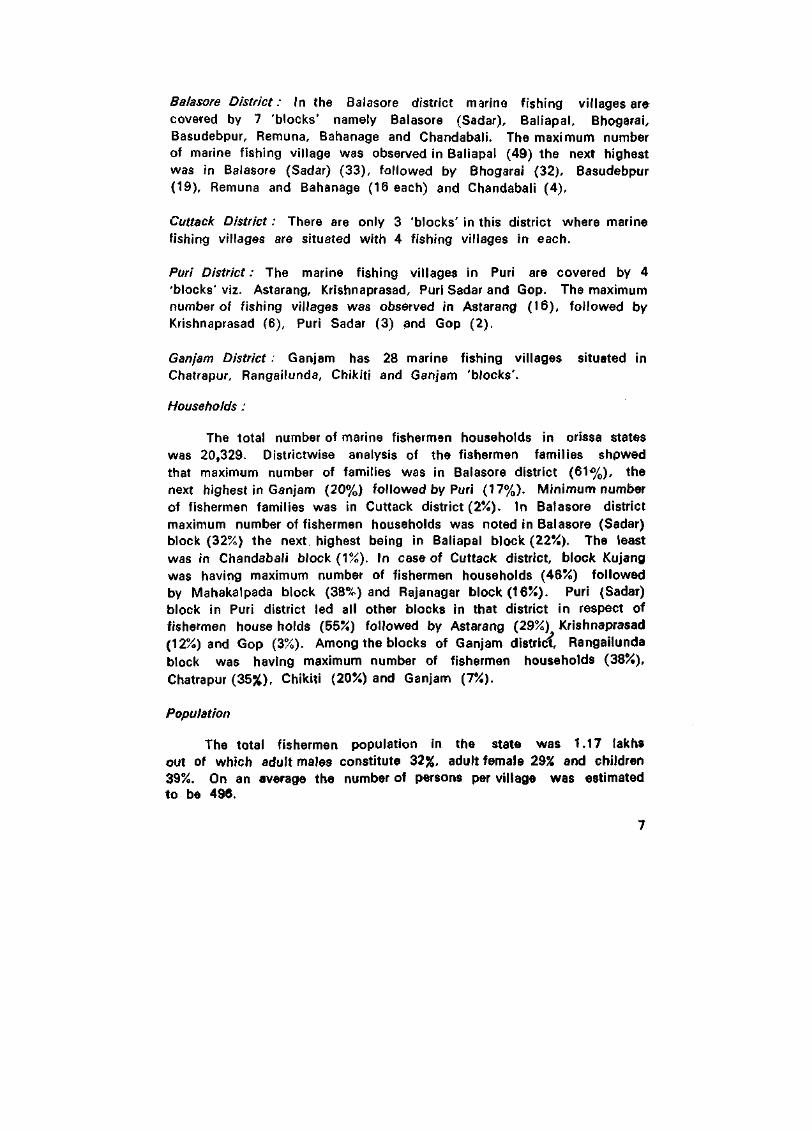
The total number of marine fishermen households in orissa states was 20,329. Districtwise analysis of the fishermen families shpwed that maximum number of families was in Balasore district (61%), the next highest in Ganjam (20%) followed by Puri (17%). Minimum number of fishermen families was in Cuttack district (2%). In Balasore district maximum number of fishermen households was noted in Balasore (Sadar) block (32%) the next highest being in Baliapal block (22%). The least was in Chandabali block (1%). In case of Cuttack district, block Kujang was having maximum number of fishermen households (46%) followed by Mahakalpada block (38%) and Rajanagar block (16%). Puri (Sadar) block in Puri district led all other blocks in that district in respect of fishermen house holds (55%) followed by Astarang (29%) Krishnaprasad (12%) and Gop (3%). Among the blocks of Ganjam district, Rangailunda block was having maximum number of fishermen households (38%), Chatrapur (35%), Chikiti (20%) and Ganjam (7%).
Population
The total fishermen population in the state was 1.17 lakhs out of which adult males constitute 32%, adult female 29% and children 39%. On an average the number of persons per village was estimated to be 496.
7
Districtwise analysis of the fishermen population showed that maximum number was in Balasore district (64%) followed by Puri (18%), Ganjam (16%) and Cuttack (2%), with 496 persons per village on an average.
Balasore District: Among the blocks of Balasore district, the maximum number of fishermen population was found in Balasore (Sadar) (35%) followed by Baliapal (19%), Basudebpur (16%), Bhogarai (13%) Bahanage and Remuna (9% each) and Chandabali (1%). The average family size was the highest in Basudebpur block (7) and least in Baliapal and Remuna (5 each). The highest number of persons per fishing village was in Balasore (Sadar) block (743) and least in Chandabali block (240).
Puri District: In respect of fishermen population, Puri (Sadar) block in Puri district led all other blocks in that district. 56% of the fishermen population was in Puri (Sadar) block. Those were 30% in Astarang, 1 1 % in Krishnaprasad and 3% in Gop. The average family size in all the blocks was found to be 6. The number of persons per fishing village was highest in Puri (Sadar) block (3,844) and least in Gop block (351).
Ganjam District: The highest fishermen population was in Rangailunda block (38%) followed by Chatrapur (34%), Chikiti (22%) and Ganjam (6%). The average family size was 5 in Chatrapur, Rangailunda and Chikiti block and 4 in Ganjam blocks. The number of persons per fishing village was highest in Rangailunda block (903) and least in Ganjam block (311).
Cuttack District: The maximum number of fishermen population in this district was found to be in Kujang block (53%) followed by Mahakalpada (32%) and Rajanagar (15%). The average family size was highest in Kujang block (8) and in other two blocks it was 6 each. The number of persons per fishing village was highest in Kujang block (353) and lowest in Rajanagar block (98).
Education
Among the fishermen population in Orissa, those who have completed primary standard forms 7% secondary 2% and beyond secondary standard less than 1%.
Balasore District: 13% of the fishermen population of the block of Balasore (Sadar), Baliapal and Chandabali of the Balasore district passed any one of the following, viz. primary, secondary and above standards. Out of the remaining 4 blocks their percentage were as follows, Bhogarai (11%), Bahanage (8%), Basudebpur (6%) and Ramuna (2%).
8
Cuttack District: Among fishermen population, none was recorded to have passed any of the three categories coming under educational status in Mahakalpada and Kujang block of Cuttack district. In Rajanagar block-those who have passed primary and secondary standards put together worked out to only 7% of which those who have passed primary standard constituted 6%.
Puri District: More fishermen came under educated category in Astarang block (25%) as compared with other blocks of this district, where as in Gop it was 4% and 2% each in Krishnaprasad and Puri )Sadar). The percentages of those who have passed primary, secondary and above secondary standards came to 60%, 33% and 7% respectively in Astarang block.
Ganjam District: The percentage of fishermen who had education under the three categories was found to be poor in all the four blocks of Ganjam district. It ranged from 2% observed in Rangailunda block to 4% observed in Ganjam block.
Fishermen Engaged in Actual Fishing
The number of fishermen engaged in actual fishing in this state was found to be 30,724 forming 26% of the total fishermen population, of this;
the number of fishermen who were engaged in full time fishing constitutes 67%, part time 2G% and occasional 13%. Among actual fishermen in Puri district as much as 82% belonged to full time category, 11% to part time and 7% to the occasional. In Ganjam district 68% belong to full time category and 20% and 12% to the remaining two categories respectively. In Balasore district, the percentage of fishermen engaged in full time fishing was 6?, part time and occasional being 23 and 15 respectively. The percentage of fishermen belonging to full time category in Cuttack district was 55, part time being 44 and occasional 1.
Balasore District: From the fishermen population of the blocks of Balasore district, 32% of Chandabali block, 26% each of Remuna and Balasore (Sadar) blocks, 25% each of Bahange and Basudebpur block and 22% of Bhogarai block were engaged in actual fishing. However among the three categories of fishermen doing actual fishing viz. full time, part time and occasional, those coming under full time category were highest in Bhogarai (84%), closely followed by Basudebpur (83%) and Bahange (70%) the least being observed in Chandabali block (32%). In the rest of the blocks the percentage varied between 57 noted in Balasore (Sadar) and 44 observed in
9
Remuna. In Chandabali and Baliapal blocks part time fishermen constituted sizeable numbers of the fishermen engaged in actual fishing, their percentage being 51 and 43 respectively.
Cuttack District: In Kujang block, 32% of the fishermen population were found to be engaged in actual fishing, while in Rajanagar and Mahakalpada blocks the corresponding figures were 28% and 27% respectively. While 97% of those engaged in actual fishing came under full time category in Kujang block, all engaged in actual fishing in Mahakalpada and Rajanagar blocks came under part time category.
Puri District: As much as 48% of fishermen population were found to be engaged in actual fishing in Gop block, the next highest being recorded in Krishnaprasad block, (31%), followed by Astarang (29%) and Puri (Sadar) blocks (27%). In all the blocks, except in Astarang, more than 80% of the fishermen population were engaged in full time fishing, whereas in Astrang this figure was only 67%.
Ganjam District: The number of fishermen engaged in actual fishing among the total fishermen population was found to be the highest in Chatrapur block (30%) followed by Chikiti and Ganjam (29% each) and Rangailunda blocks (26%). More than 75% of fishermen engaged in actual fishing came under full time category in Chatrapur, Rangailunda and Ganjam blocks, while in Chikiti block 6 1 % of those engaged in actual fishing came under part time category.
Fishing Craft
Total number of mechanised boats operating in Orissa coast was 745 of which 470 were trawlers the rest being gillnetters. Maximum number of mechanised boats, they being mostly gillnetters, were in Balasore district. There were only two mechanised gillnetters in Ganjam district and all other craft in this district were non-mechanised boats. Total number of non-mechanised craft in Orissa was 10,550. Maximum number of non-mechanised boats were found in Cuttack district (3,034), followed by Ganjam (2,963), Balasore (2,555) and Puri (1968).
Fishing Gear
There were 33,936 fishing gear in Orissa, maximum being in Puri district (12,220). In Balasore district, there were 11,383 fishing gear followed by Ganjam (6,566) and Cuttack (3,767). The types of gear found in this states were trawlnets, drift/gillnets, hooks and lines, shore seines, small purse-seines, fixed bag nets and boat seines.
10
Of the different types of gear observed in Balasore (Sadar) block of Balasore district, fixed bag nets were the dominant one (55%) followed by drift/gill nets (38%) and hooks and lines (5%>. Janjal, a small purse-seine, was the dominant gear in Baliapal block (59%) followed by shore-seines (25%) and fixed bag nets (9%). In Bhogarai shore-seine (40%) constituted the dominant one followed by fixed bag net (32%), while in Basadebpur traps (39%) constituted the dominant one followed by drift/gill nets (26%). Fixed bag nets and drift/gill nets were the common gear in the rest of the blocks.
In Cuttack district, fixed bag net was found only in Mahakalpada block, being numerically the most abundant gear (71%) followed by hooks and lines and drift/gill nets. Drift/gill nets was the dominant one in Rajanagar and Kujang blocks.
In Puri district, boat-seines (57%) formed the dominant gear in Astarang block while in Krishnaprasad block drift/gill net (79%) was the dominant gear. Hooks and lines were most abundant in Puri Sadar.
Drift/gill net was the abundant gear in Chatrapur and Rangailunda blocks of Ganjam district followed by hooks and lines and boat seines. In Chikiti and Ganjam blocks drift/ gill net and hooks and lines were found to be the two most common gear.
Infrastructure Facilities
Tables (see Appendix) show the districtwise infrastructure facilities available in the four coastal districts of Orissa. Among the blocks of Balasore district, Balasore (Sadar) blocks is generally better endowed with infrastructure facilities such as electricity, tap water, schools and hospitals, Chandabai was found to be least developed in respect of many such facilities. In Cuttack district were the Paradeep fishery harbour is situated Kunjung block in general was better developed in respect of infrastructure facilities when compared with the other blocks. Among the four blocks of Puri district a special feature noted was that in Astarang block 33% fishermen houses were "Pucca". In Ganjam district, Rangailunda block had better infrastructure facilities when compared to other 'blocks'.
11
MARINE FISH LANDINGS
An account of the marine fish landings in Orissa state, both district-wise and gearwise, is given below.
Catch Estimate for the State
The average annual marine fish production in Orissa state during
1975--84 period has been estimated at 34,027 tonnes. The maximum catch
of 46,773 tonnes was in 1984 and minimum 15,072 tonnes in 1977.
Quarterwise analysis of fish landings for the above period (January-
March being considered as first quarter) showed that, on an average,
the landings were highest in the fourth quarter (17,167 tonnes) followed
by the first quarter (7,723 tonnes) and the third quarter (5,603 tonnes).
The lowest catch was observed in the 2nd quarter (3,514 tonnes) comprising the rainy season. Peak landings during the fourth quarter may be associated to the south westerly sea current flowing during this-period.
The landings by mechanised units over the ten year period (1975-'84) constituted on an avergage 21,126 tonnes/year forming 53% of the total catch. In 1980 and '84 the contribution from mechanised sector was higher, respectively at 65% and 62%. However, in 1982, the catch from the non-mechanised sector was found to be higher (54%). The catch per unit effort (CPUE) of mechanised sector was found showing a rising trend from 73 kg. per boat in 1980 to 232 kg. per boat in 1984, while CPUE of non-mechanised sector showed a narrow fluctuation between 23 and 29 kg.
Two types of gear, viz. trawl and gill nets, were in operation in the mechanised sector during the period 1980-84, the contribution from trawl net to the total mechanised catch on an average being 60% (Figs. 4
12
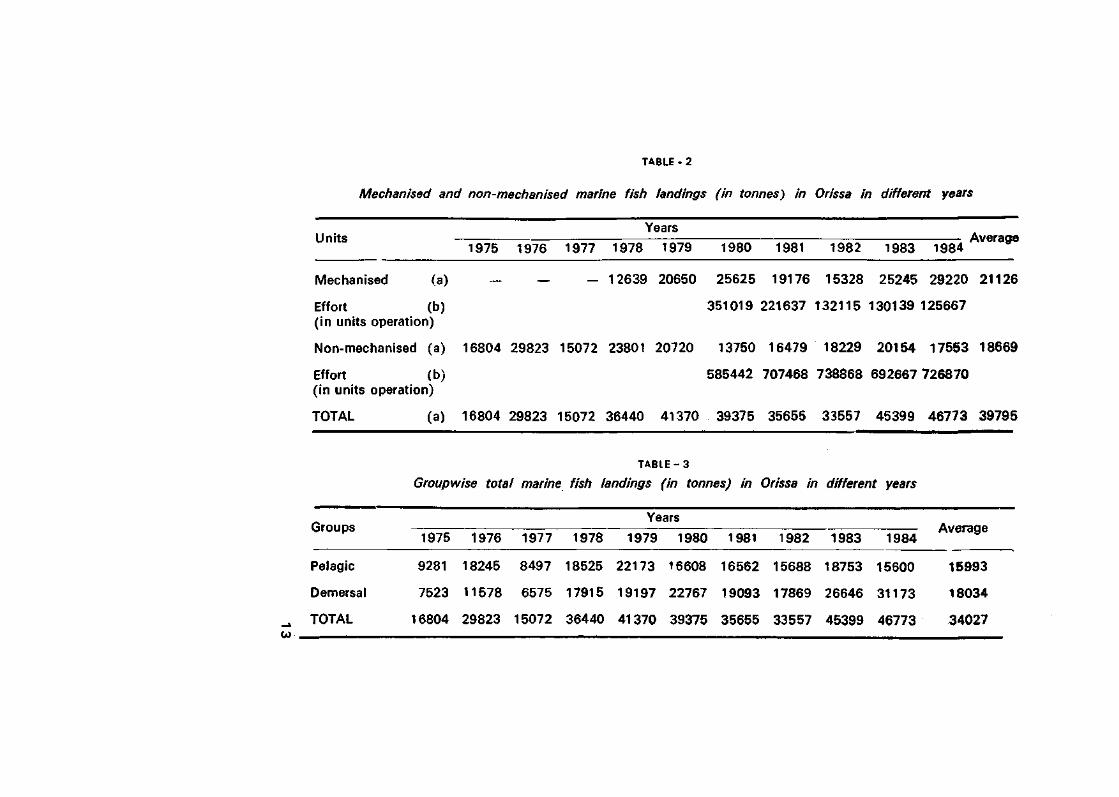
TABLE - 2
Mechanised and non-mechanised marine fish landings (in tonnes) in Orissa in different years
Years Units Average
1975 1976 1977 1978 1979 1980 1981 1982 1983 1984
Mechanised (a) - — - 12639 20650 25625 19176 15328 25245 29220 21126
Effort (b) 351019 221637 132115 130139 125667
(in units operation)
Non-mechanised (a) 16804 29823 15072 23801 20720 13750 16479 18229 20154 17553 18669
Effort (b) 585442 707468 738868 692667 726870 (in units operation) TOTAL (a) 16804 29823 15072 36440 41370 39375 35655 33557 45399 46773 39795
TABLE-3
Groupwise total marine fish landings (in tonnes) in Orissa in different years
YOSTS Groups Average
1975 1976 1977 1978 1979 1980 1981 1982 1983 1984
Pelagic 9281 18245 8497 18525 22173 16608 16562 15688 18753 15600 15993
Demersal 7523 11578 6575 17915 19197 22767 19093 17869 26646 31173 18034
TOTAL 16804 29823 15072 36440 41370 39375 35655 33557 45399 46773 34027
and 5) during the years 1980„and 1981, contribution by gil l net alone
was 67% and 69% respectively, however, from 1982 onwards a change in
this pattern was noticed. Contribution to the mechanised catch by trawl
net showed steady increase, reaching the peak of 8 7 % during 1983 and
1984. The CPUE of this net shqwed a significant increase from 63 kg
in 1980 to 308 kg in 1983 and1 358 kg in 1984. The CPUE of gil l net
remained steady at 79 kg during the years 1980 and 1981 and declined
^o 56 kg in 1983.
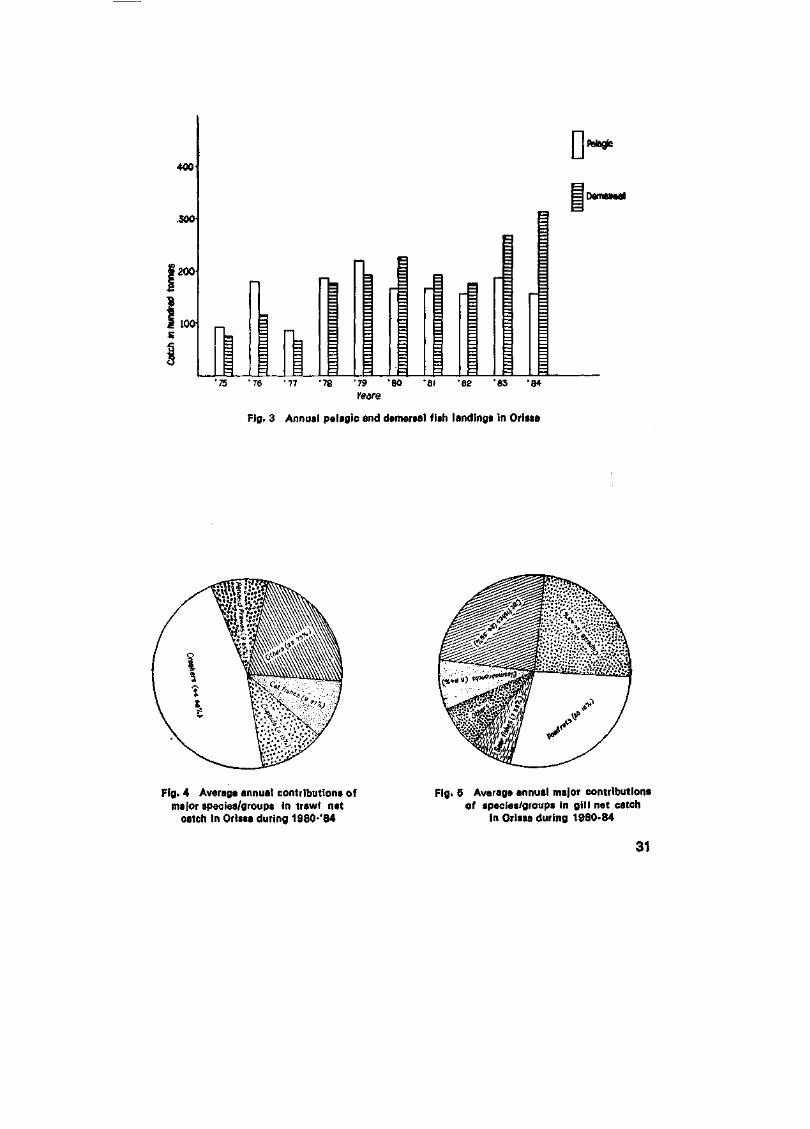
Contribution of pelagic fisheries to the total fish landings in Orissa
during 1975-84 showed a declining trend. The highest contr ibution
was during the year 1976 (61%) and lowest (33%) during the year 1984.
Except in 1976, the trend in the contribution of demersal group to the
total catch was increasing, going up to 67% during 1984.
Specieswise analysis of average annual catch for 10 years under
consideration showed that pomfrets formed the highest constituent (15%),
fo l lowed by croakers (13%) Hilsa ilisha (12%), catfish (9%) and other
sardines (8%). The Maximum contribution of pomfrets was during the
year 1976 (36%) and that of Hilsa ilisha was during 1975 (29%), contr ibution
from prawns was only meagre 4%.
A new development noticed in the fisheries of Orissa, was the landings
of oil sardines. For the first time in Orissa, 539 tonnes of oil sardine
was landed during 1984.
14
DISTRICTWISE CATCH ESTIMATE
Baiasore District
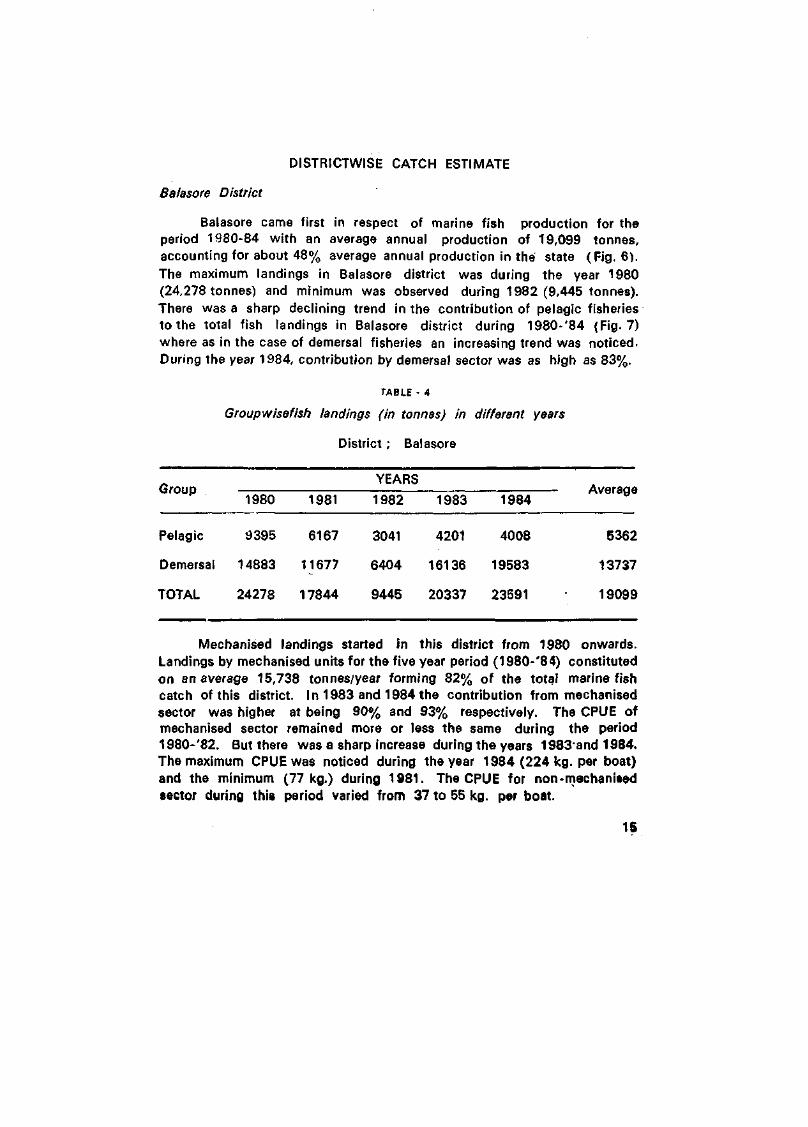
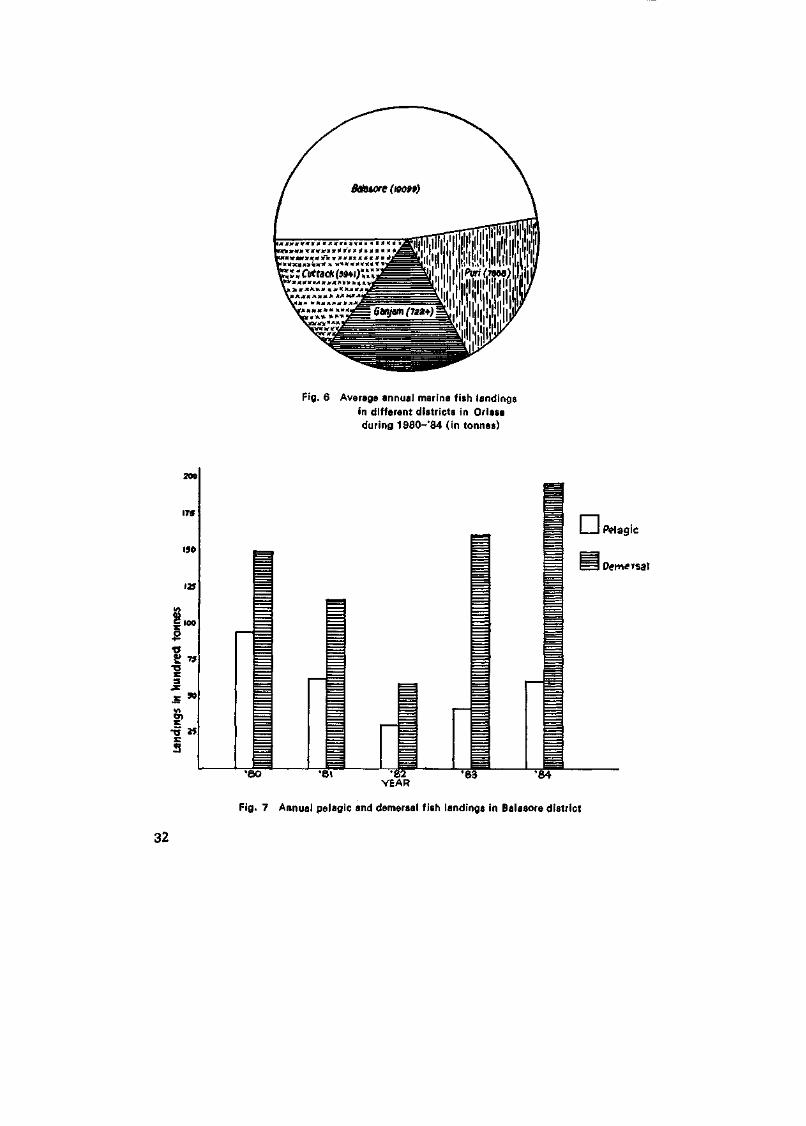
Baiasore came first in respect of marine fish production for the period 1980-84 with an average annual production of 19,099 tonnes, accounting for about 48% average annual production in the state (Fig. 6). The maximum landings in Baiasore district was during the year 1980 (24,278 tonnes) and minimum was observed during 1982 (9,445 tonnes). There was a sharp declining trend in the contribution of pelagic fisheries to the total fish landings in Baiasore district during 1980-'84 (Fig. 7) where as in the case of demersal fisheries an increasing trend was noticed. During the year 1984, contribution by demersal sector was as high as 83%.
TABLE - 4
Groupwisefish landings (in tonnes) in different years
District; Baiasore
Group 1980 1981
YEARS
1982 1983 1984 Average
Pelagic 9395 6167
Demersal 14883 11677
TOTAL 24278 17844
3041
6404
9445
4201
16136
20337
4008
19583
23591
5362
13737
19099
Mechanised landings started in this district from 1980 onwards. Landings by mechanised units for the five year period (1980-'84) constituted on an average 15,738 tonnes/year forming 82% of the total marine fish catch of this district. In 1983 and 1984 the contribution from mechanised sector was higher at being 90% and 93% respectively. The CPUE of mechanised sector remained more or less the same during the period 1980-'82. But there was a sharp increase during the years 1983*and 1984. The maximum CPUE was noticed during the year 1984 (224 kg. per boat) and the minimum (77 kg.) during 1981. The CPUE for non-mechanised sector during this period varied from 37 to 55 kg. per boat.
15
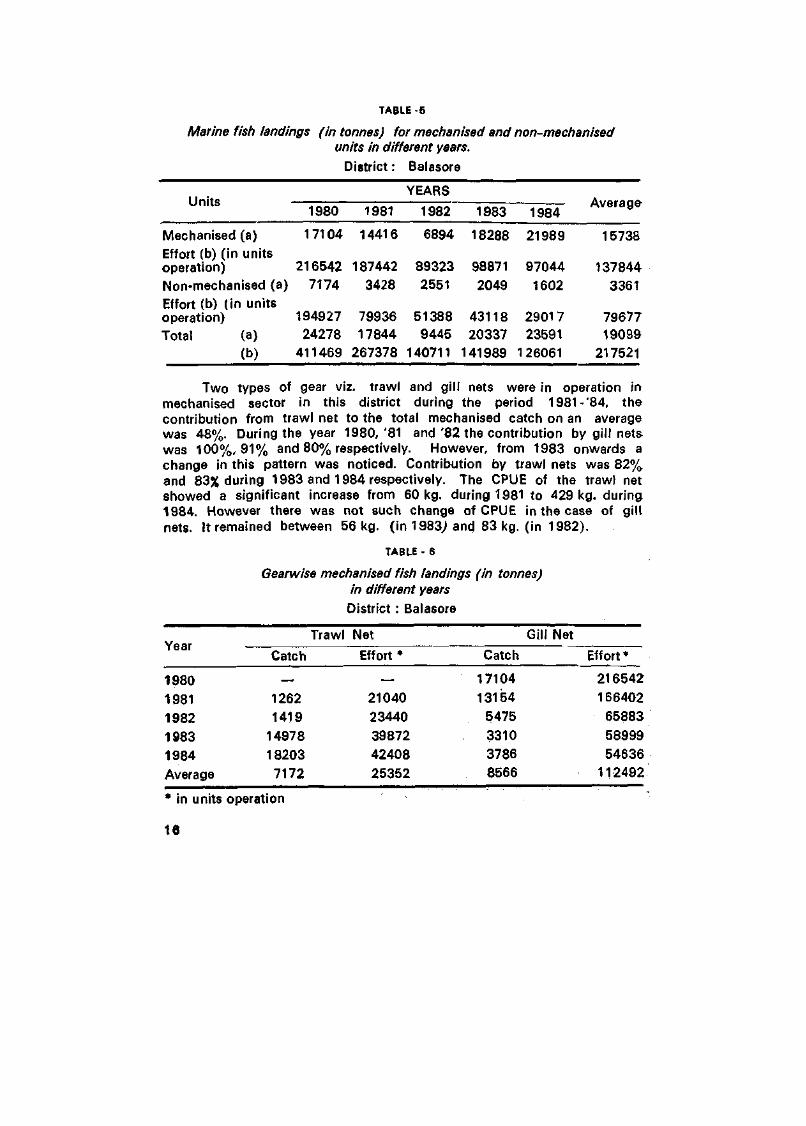
TABLE -6
Marine fish landings (in tonnes) for mechanised and non-mechanised units in different years.
District: Balasore
Units
Mechanised (a) Effort (b) (in units operation) Non-mechanised (a) Effort (b) (in units operation) Total (a)
(b)
1980
17104
216542 7174
194927 24278
411469
1981
14416
187442 3428
79936 17844
267378
YEARS
1982
6894
89323 2551
51388 9445
140711
1983
18288
98871 2049
43118 20337
141989
1984
21989
97044 1602
29017 23591
126061
Average
15738
137844 3361
79677 19099
217521
Two types of gear viz. trawl and gill nets were in operation in mechanised sector in this district during the period 1981-'84, the contribution from trawl net to the total mechanised catch on an average was 48%. During the year 1980,'81 and'82 the contribution by gill nets was 100%, 9 1 % and 80% respectively. However, from 1983 onwards a change in this pattern was noticed. Contribution by trawl nets was 82% and 83% during 1983 and 1984 respectively. The CPUE of the trawl net showed a significant increase from 60 kg. during 1981 to 429 kg. during 1984. However there was not such change of CPUE in the case of gill nets. It remained between 56 kg. (in 1983; and 83 kg. (in 1982).
TABLE - 6
Gearwise mechanised fish landings (in tonnes) in different years District : Balasore
Year
1980 1981 1982 1983 1984 Average
Trawl
Catch
—
1262 1419
14978 18203 7172
Net
Effort *
—
21040
23440 39872 42408 25352
Catch
17104 13154
5475 3310 3786 8566
Gill Net
Effort •
216542
166402 65883 58999 54636
112492
* in units operation
16
Quarterwise analysis of fish landings for the period 1980-'84, showed that maximum landings were observed during the fourth quarter of every year followed by first quarter and third quarter. On an average 10,038 tonnes were landed in the fourth quarter and 1923 tonnes in the second quarter. Specieswise analysis of average catch for the five years during 1980-'84 showed that c@flakers formed highest constituent (26%) followed by pomfrets (18%), cat fish (18%) and Hilsa 7//s/?a(9%) (Fig. 8). The maximum contribution of q&fakers was during the year 1984 (57%) and 1983 (51%) and that of pomfrets was during 1980 (32%). Contribution by prawns was less than 1%.
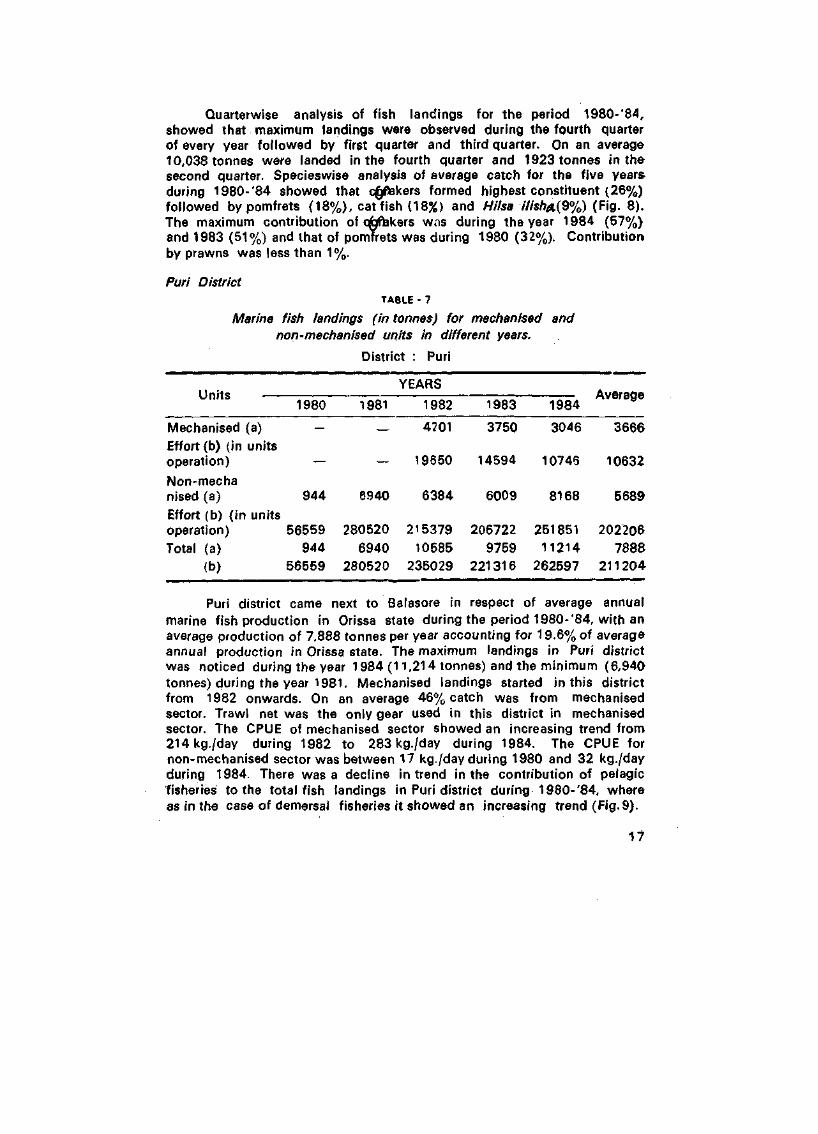
Puri District TABLE - 7
Marine fish landings (in tonnes) for mechanised and non-mechanised units in different years.
District : Puri
1 Initi-
Mechanised (a) Effort (b) (in units operation)
Non-mecha nised (a) Effort (b) (in units operation) Total (a)
(b)
1980
—
—
944
56559 944
56559
1981
—
6940
280520 6940
280520
YEARS
1982
4201
19650
6384
215379 10585
235029
1983
3750
14594
6009
206722 9759
221316
1984
3046
10746
8168
251851 11214
262597
Average
3666
10632
5689
202206 7888
211204
Puri district came next to Balasore in respect of average annual marine fish production in Orissa state during the period 1980-'84, with an average production of 7,888 tonnes per year accounting for 19.6% of average annual production in Orissa state. The maximum landings in Puri district was noticed during the year 1984 (11,214 tonnes) and the minimum (6,940 tonnes) during the year 1981. Mechanised landings started in this district from 1982 onwards. On an average 46% catch was from mechanised sector. Trawl net was the only gear used in this district in mechanised sector. The CPUE of mechanised sector showed an increasing trend from 214 kg./day during 1982 to 283 kg./day during 1984. The CPUE for non-mechanised sector was between 17 kg./day during 1980 and 32 kg./day during 1984. There was a decline in trend in the contribution of pelagic fisheries to the total fish landings in Puri district during 1980-'84, where as in the case of demersal fisheries it showed an increasing trend (Fig. 9).
17
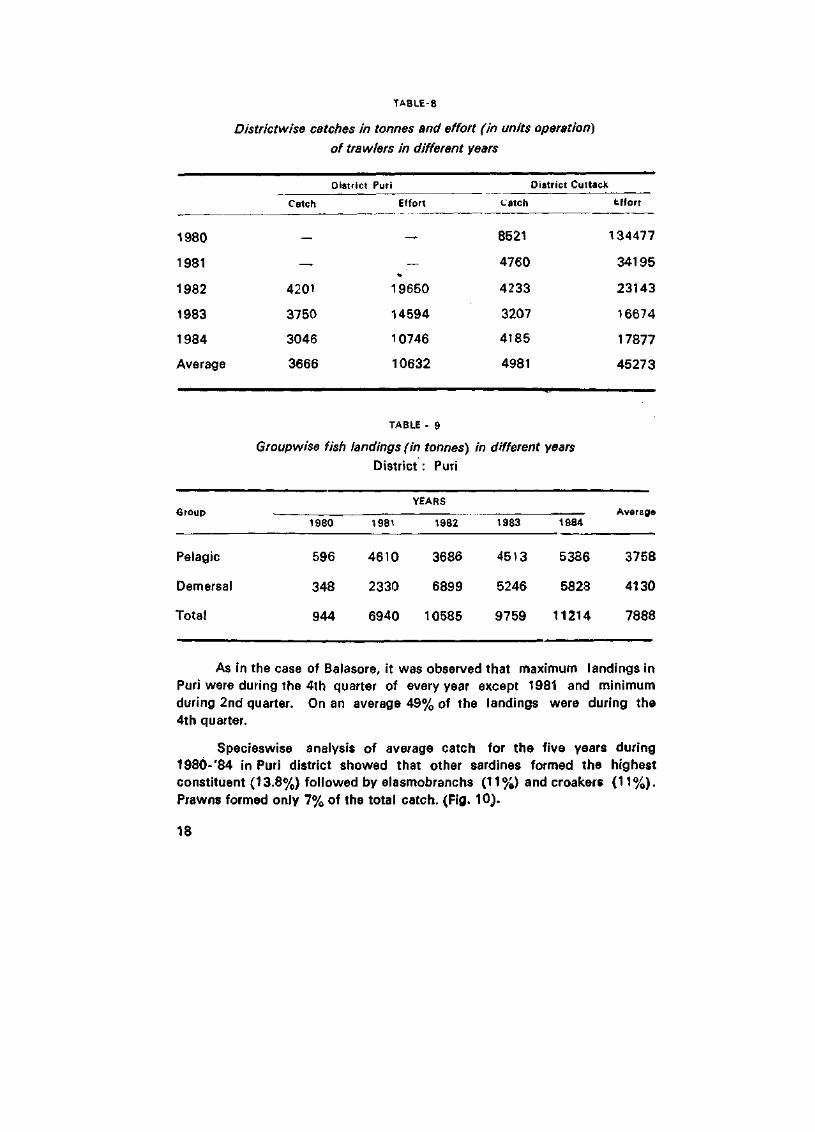
TABLE-8
Districtwise catches in tonnes and effort (in units operation)
of trawlers in different years
1980
1981
1982
1983
1984
Average
Catch
—
—
4201
3750
3046
3666
District Puri
Effort
—
—
19650
14594
10746
10632
TABLE - 9
District Ci
catch
8521
4760
4233
3207
4185
4981
utack
tffort
134477
34195
23143
16674
17877
45273
Groupwise fish landings (in tonnes) in different years District : Puri
Group
Pelagic
Demersal
Total
1980
596
348
944
1981
4610
2330
6940
YEARS
1982
3686
6899
10585
1983
4513
5246
9759
1984
5386
5823
11214
Average
3758
4130
7888
As in the case of Balasore, it was observed that maximum landings in Puri were during the 4th quarter of every year except 1981 and minimum during 2nd quarter. On an average 49% of the landings were during the 4th quarter.
Specieswise analysis of average catch for the five years during 1980-'84 in Puri district showed that other sardines formed the highest constituent (13.8%) followed by elasmobranchs (11%) and croakers (11%). Prawns formed only 7% of the total catch. (Fig. 10).
18
Cuttack District.
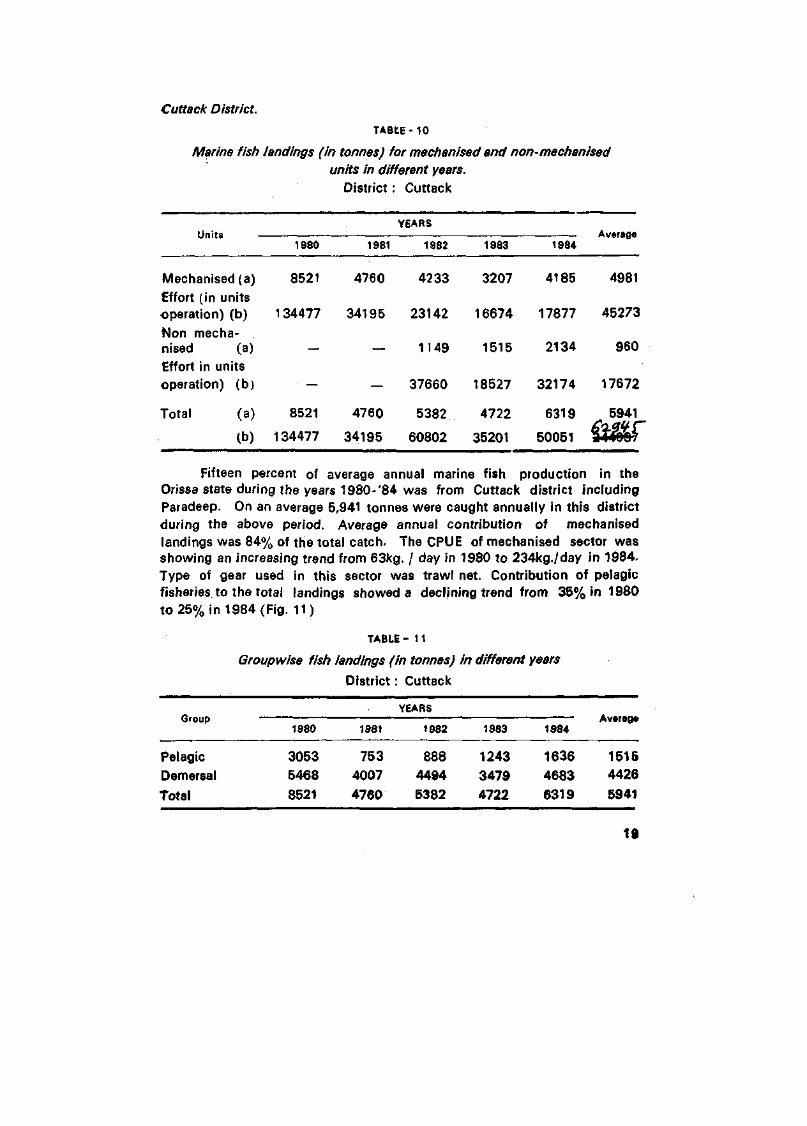
TABLE-10
Marine fish landings (in tonnes) for mechanised and non-mechanised units in different years.
District: Cuttack
YEARS Units Average
1980 1981 1982 1983 1984
Mechanised (a) 8521 Effort (in units operation) (b) 1 34477 Non mechanised (a) — Effort in units operation) (b) —
Total (a) 8521
(b) 134477
Fifteen percent of average annual marine fish production in the Orissa state during the years 1980-'84 was from Cuttack district including Paradeep. On an average 5,941 tonnes were caught annually in this district during the above period. Average annual contribution of mechanised landings was 84% of the total catch. The CPUE of mechanised sector was showing an increasing trend from 63kg. / day in 1980 to 234kg./day in 1984. Type of gear used in this sector was trawl net. Contribution of pelagic fisheries.to the total landings showed a declining trend from 35% in 1980 to 25% in 1984 (Fig. 11)
TABLE- 11
Groupwise fish landings (in tonnes) in different years
District : Cuttack
Group
Pelagic Demersal
Total
1980
3053 5468
8521
1981
753 4007
4760
YEARS
1982
888 4494
5382
1983
1243 3479
4722
1984
1636
4683 6319
1515 4426
5941
4760 4233 3207 4185 4981
34195 23142 16674 17877 45273
— 1149 1515 2134 960
— 37660 18527 32174 17672
4760 5382 4722 6319 5941
34195 60802 35201 50051
19
Quarterwise analysis of fish landings for the period 1980-'84 showed that the maximum landings were observed during fourth quarter of every year, followed by first quarter as observed in other districts. On an average 3,058 tonnes were landed in the fourth quarter and 1,503 tonnes in the first quarter.
Croakers formed the highest constituent (26%) of average yearly marine fish catch during the years 1980-'84. Contribution of prawns was 14% and other clupeids formed 9% (Fig. 12). The bulk of marine fish catch in Cuttack district was landed at Paradeep Fisheries Harbour.
Paradeep Fisheries Harbour
Paradeep is the most important mechanised fish landing centre ir» Orissa and 13% of average yearly fish landing in Orissa was at Paradeep. The major gear used in this centre was trawl net. Quarterly gearwise marine fish landings at this centre during the years 1980-'84 is given in Appendix. It was observed that on an average 53% annual marine fish landings in this centre was during the fourth quarter, and 29% in the second. Croakers constituted 30% of average annual landings during the years 1980-'84, followed by prawns (17%) and other clupeids.
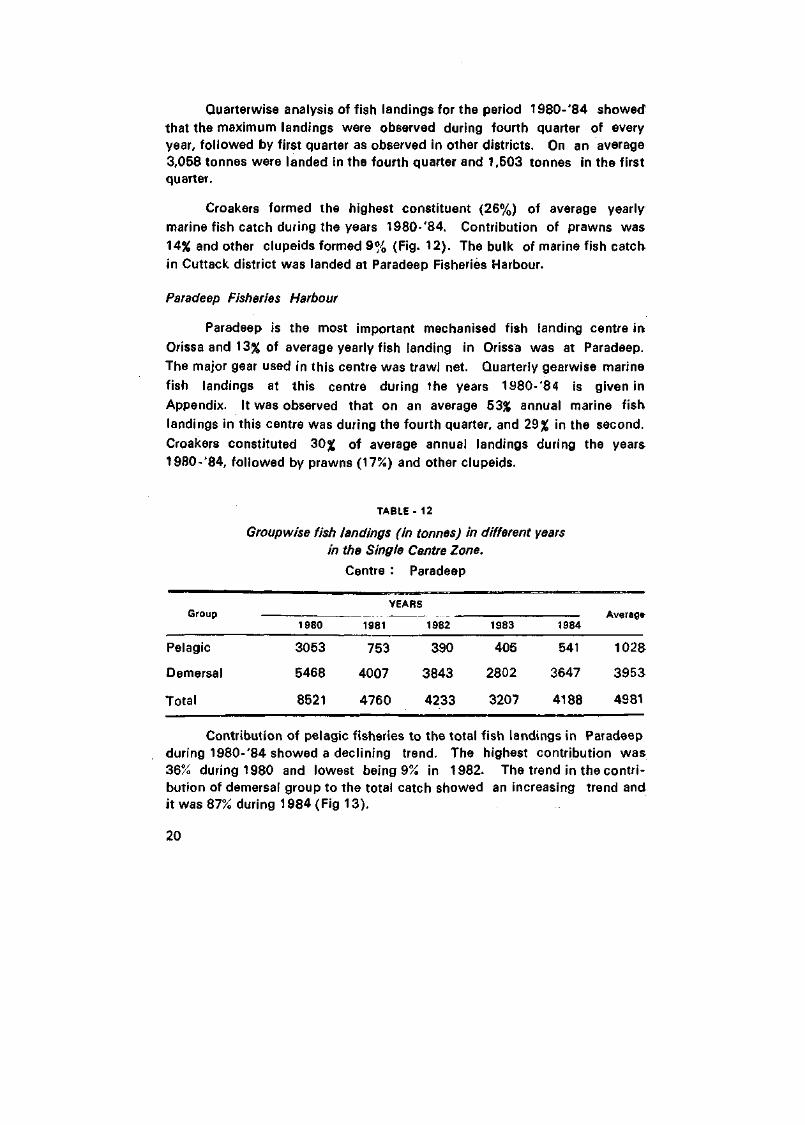
TABLE -12
Groupwise fish landings (in tonnes) in different years in the Single Centre Zone.
Centre : Paradeep
YEARS Group Average
1980 1981 1982 1983 1984
Pelagic 3053 753 390 405 541 1028
Demersal 5468 4007 3843 2802 3647 3953
Total 8521 4760 4233 3207 4188 4981
Contribution of pelagic fisheries to the total fish landings in Paradeep during 1980-'84 showed a declining trend. The highest contribution was 36% during 1980 and lowest being 9% in 1982. The trend in the contribution of demersal group to the total catch showed an increasing trend and it was 87% during 1984 (Fig 13).
20
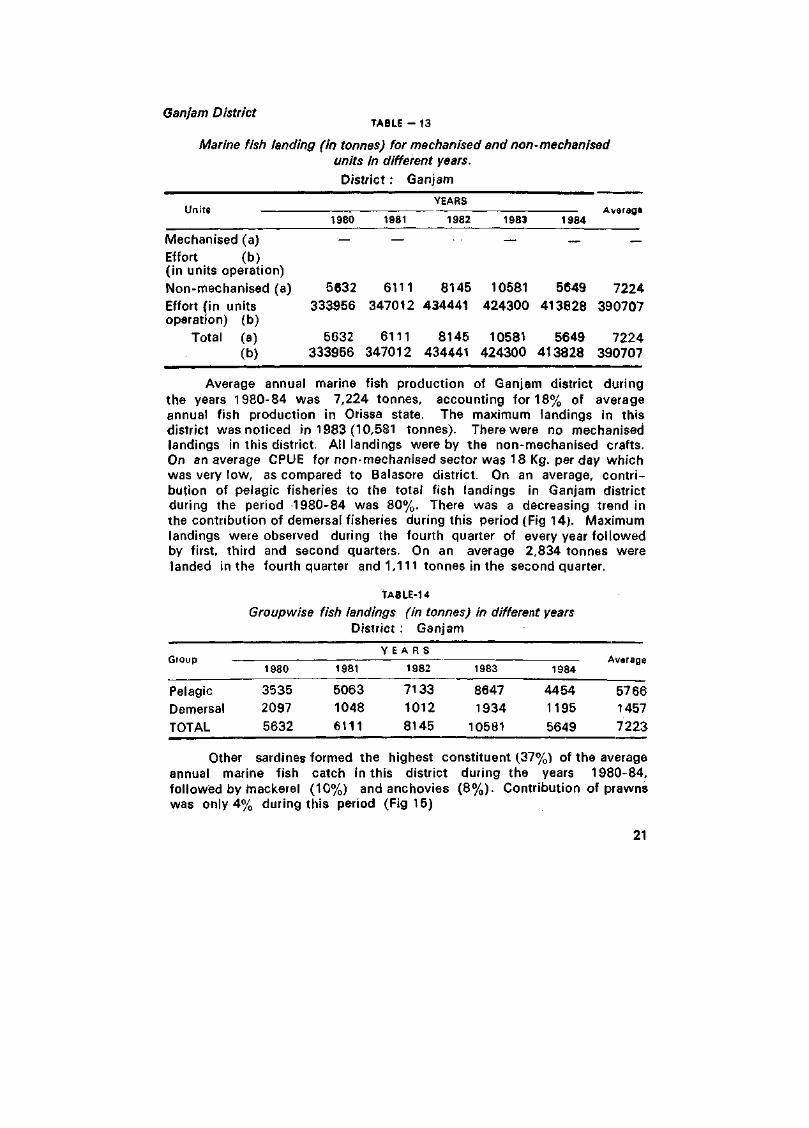
Gan/am District TABLE - 13
Marine fish landing (in tonnes) for mechanised and non-mechanised units in different years.
District: Ganjam
Mechanised (a) Effort (b) (in units operation) Non-mechanised (a) Effort (in units operation) (b)
Total (a) (b)
1980
—
5632 333956
5632 333956
1981
—
6111 347012
6111 347012
YEARS
1982
8145 434441
8145 434441
1983
—
10581 424300
10581 424300
1984
—
5649 413828
5649 413828
Average
—
7224 390707
7224 390707
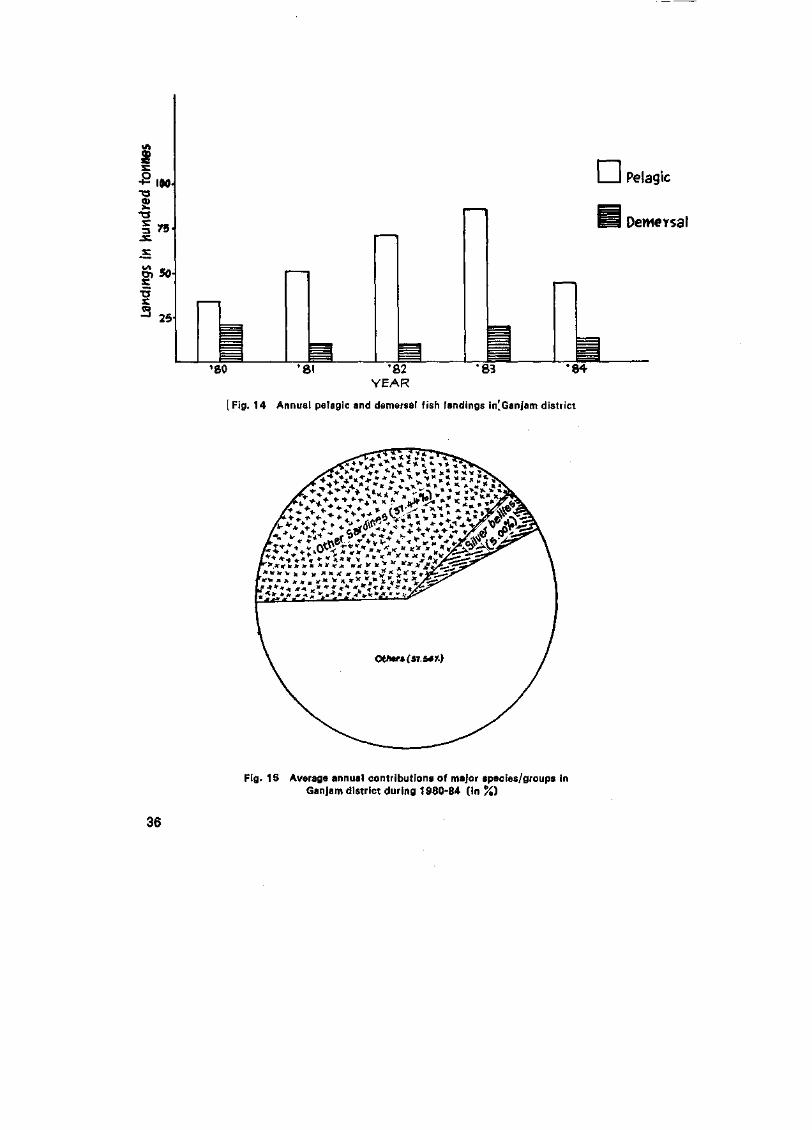
Average annual marine fish production of Ganjam district during the years 1980-84 was 7,224 tonnes, accounting for 18% of average annual fish production in Orissa state. The maximum landings in this district was noticed in 1983 (10,581 tonnes). There were no mechanised landings in this district. All landings were by the non-mechanised crafts. On an average CPUE for non-mechanised sector was 18 Kg. per day which was very low, as compared to Balasore district. On an average, contribution of pelagic fisheries to the total fish landings in Ganjam district during the period -1980-84 was 80%. There was a decreasing trend in the contribution of demersal fisheries during this period (Fig 14). Maximum landings were observed during the fourth quarter of every year followed by first, third and second quarters. On an average 2,834 tonnes were landed in the fourth quarter and 1,111 tonnes in the second quarter.
TABLE-U
Groupwise fish landings (in tonnes) in different years District : Ganjam
roup
Pelagic Demersal TOTAL
1980
3535 2097 5632
1981
5063 1048 6111
Y E A R S
1982
7133 1012 8145
1983
8647 1934
10581
1984
4454 1195 5649
Average
5766 1457 7223
Other sardines formed the highest constituent (37%) of the average annual marine fish catch in this district during the years 1980-84, followed by mackerel (10%) and anchovies (8%). Contribution of prawns was only 4% during this period (Fig 15)
21
MAJOR FISHERIES OF ORISSA STATE
Croakers, catfish, pomfrets, other sardines, elasmobranchs, hilsa shad, in this order of abundance from the major fisheries of the Orissa state.
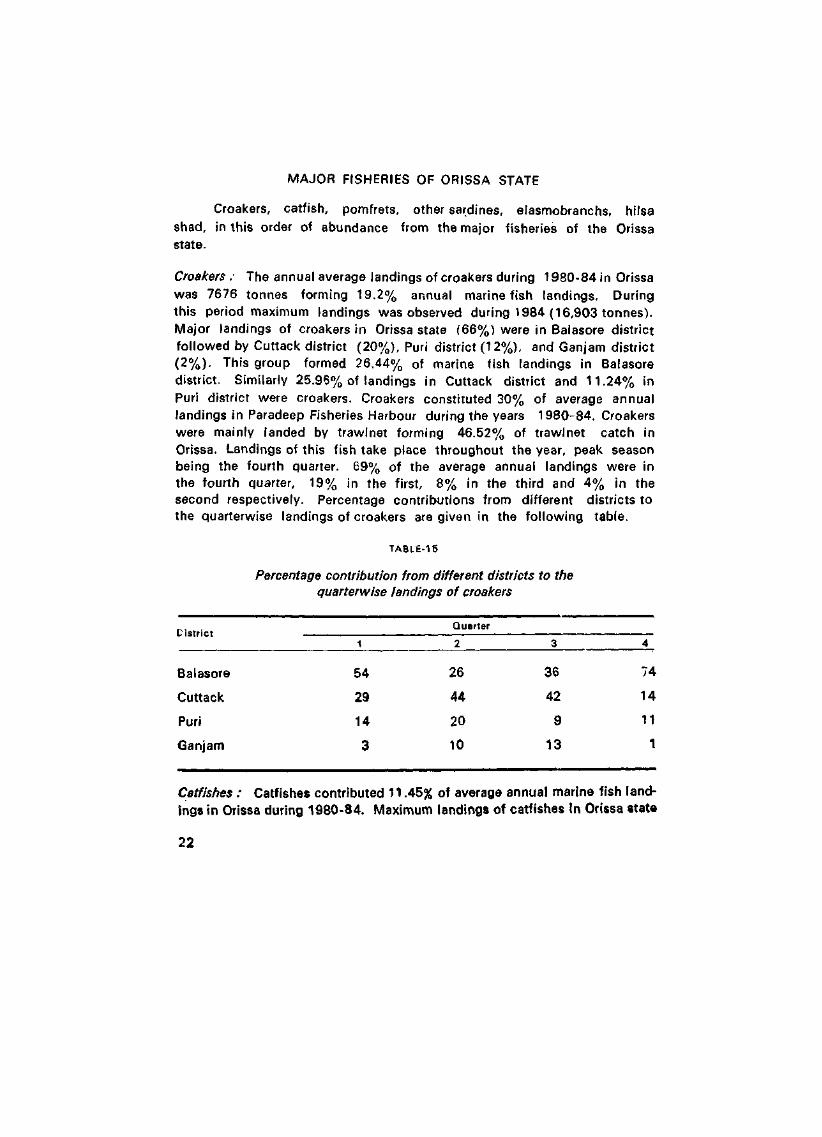
Croakers : The annual average landings of croakers during 1980-84 in Orissa was 7676 tonnes forming 19.2% annual marine fish landings. During this period maximum landings was observed during 1984 (16,903 tonnes). Major landings of croakers in Orissa state (66%) were in Balasore district followed by Cuttack district (20%), Pun' district (12%), and Ganjam district (2%). This group formed 26.44% of marine fish landings in Balasore district. Similarly 25.95% of landings in Cuttack district and 11.24% in Puri district were croakers. Croakers constituted 30% of average annual landings in Paradeep Fisheries Harbour during the years 1980-84. Croakers were mainly landed by trawlnet forming 46.52% of trawlnet catch in Orissa. Landings of this fish take place throughout the year, peak season being the fourth quarter. 69% of the average annual landings were in the fourth quarter, 19% in the first, 8% in the third and 4% in the second respectively. Percentage contributions from different districts to the quarterwise landings of croakers are given in the following table.
TABLE-15
Percentage contribution from different districts to the quarterwise landings of croakers
1 2 3 4_
Balasore 54 26 36 74
Cuttack 29 44 42 14
Puri 14 20 9 11
Ganjam 3 10 13 1
Catfishes ; Catfishes contributed 11.45% of average annual marine fish landings in Orissa during 1980-84. Maximum landings of catfishes in Orissa stats
22
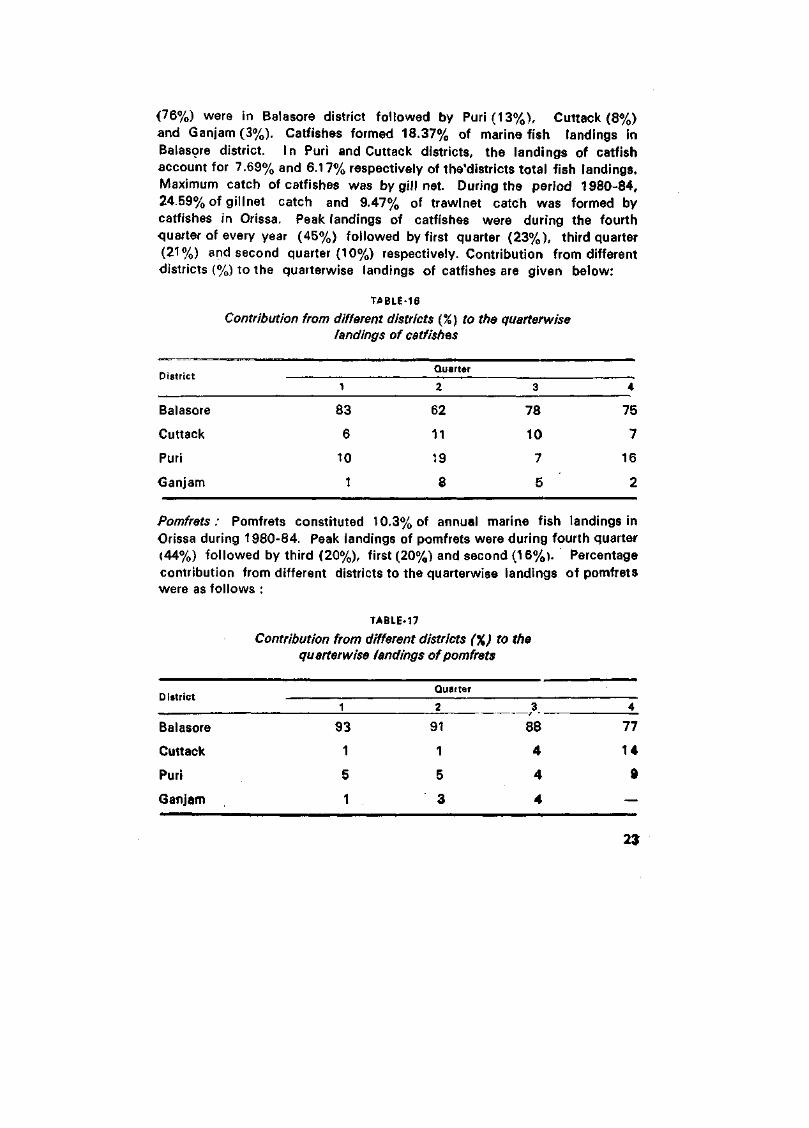
(76%) were in Baiasore district followed by Puri (13%), Cuttack (8%) and Ganjam(3%). Catfishes formed 18.37% of marine fish landings in Baiasore district. In Puri and Cuttack districts, the landings of catfish account for 7.69% and 6.17% respectively of the'districts total fish landings. Maximum catch of catfishes was by gill net. During the period 1980-84, 24.59% of gillnet catch and 9.47% of trawlnet catch was formed by catfishes in Orissa. Peak landings of catfishes were during the fourth quarter of every year (45%) followed by first quarter (23%), third quarter (21%) and second quarter (10%) respectively. Contribution from different districts (%) to the quarterwise landings of catfishes are given below:
TABLE-16
Contribution from different districts (%) to the quarterwise landings of catfishes
1 2 3 4
Baiasore 83 62 78 75
Cuttack 6 11 10 7
Puri 10 19 7 16
Ganjam 1 8 5 2
Pomfrets: Pomfrets constituted 10.3% of annual marine fish landings in Orissa during 1980-84. Peak landings of pomfrets were during fourth quarter (44%) followed by third (20%), first (20%) and second (16%). Percentage contribution from different districts to the quarterwise landings of pomfrets were as follows :
TABLE-17
Contribution from different districts (%) to the quarterwise landings of pomfrets
Quarter
J 2 3 4_
93 91 88 77
1 1 4 14
5 5 4 9
1 3 4 —
District
Baiasore
Cuttack
Puri
Ganjam
23
Maximum landings of pomfrets in Orissa state (85%) were in Balasore district followed by Cuttack (7%), Puri (7%) and Ganjam (1%). 18.38% of marine fish landings in Balasore district was pomfrets. There were significant landings of pomfrets in Cuttack district. Pomfrets were mostly landed by gillnet forming 28.1% of the landings by gillnet.
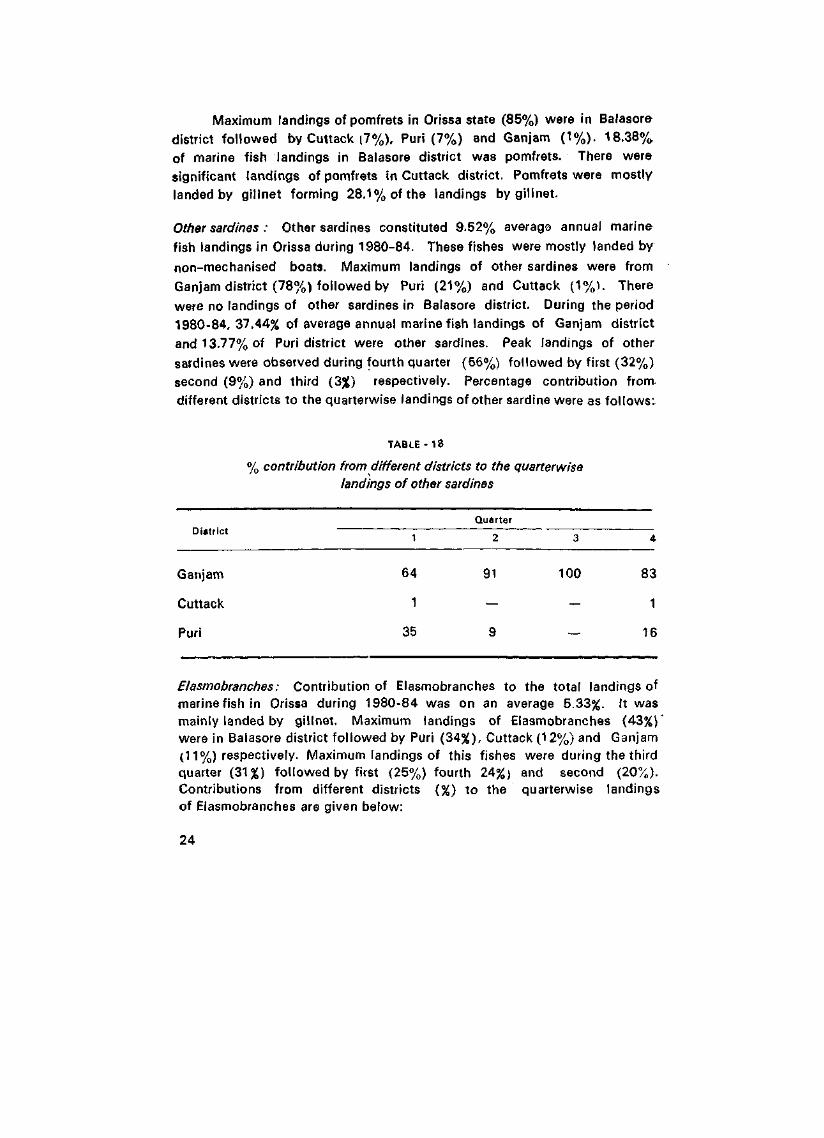
Other sardines : Other sardines constituted 9.52% averaga annual marine fish landings in Orissa during 1980-84. These fishes were mostly landed by non-mechanised boats. Maximum landings of other sardines were from Ganjam district (78%) followed by Puri (21%) and Cuttack (1%). There were no landings of other sardines in Balasore district. During the period 1980-84, 37.44% of average annual marine fish landings of Ganjam district and 13.77% of Puri district were other sardines. Peak landings of other sardines were observed during fourth quarter (56%) followed by first (32%) second (9%) and third (3%) respectively. Percentage contribution from different districts to the quarterwise landings of other sardine were as follows^
TABLE - 18
% contribution from different districts to the quarterwise landings of other sardines
Quarter
Ganjam 64 91 100 83
Cuttack 1 — — 1
Puri 35 9 — 16
Elasmobranches: Contribution of Elasmobranches to the total landings of marine fish in Orissa during 1980-84 was on an average 5.33%. It was mainly landed by gillnet. Maximum landings of Elasmobranches (43%) were in Balasore district followed by Puri (34%), Cuttack (1 2%) and Ganjam (11%) respectively. Maximum landings of this fishes were during the third quarter (31%) followed by first (25%) fourth 24%) and second (20%). Contributions from different districts (%) to the quarterwise landings of Elasmobranches are given below:
24
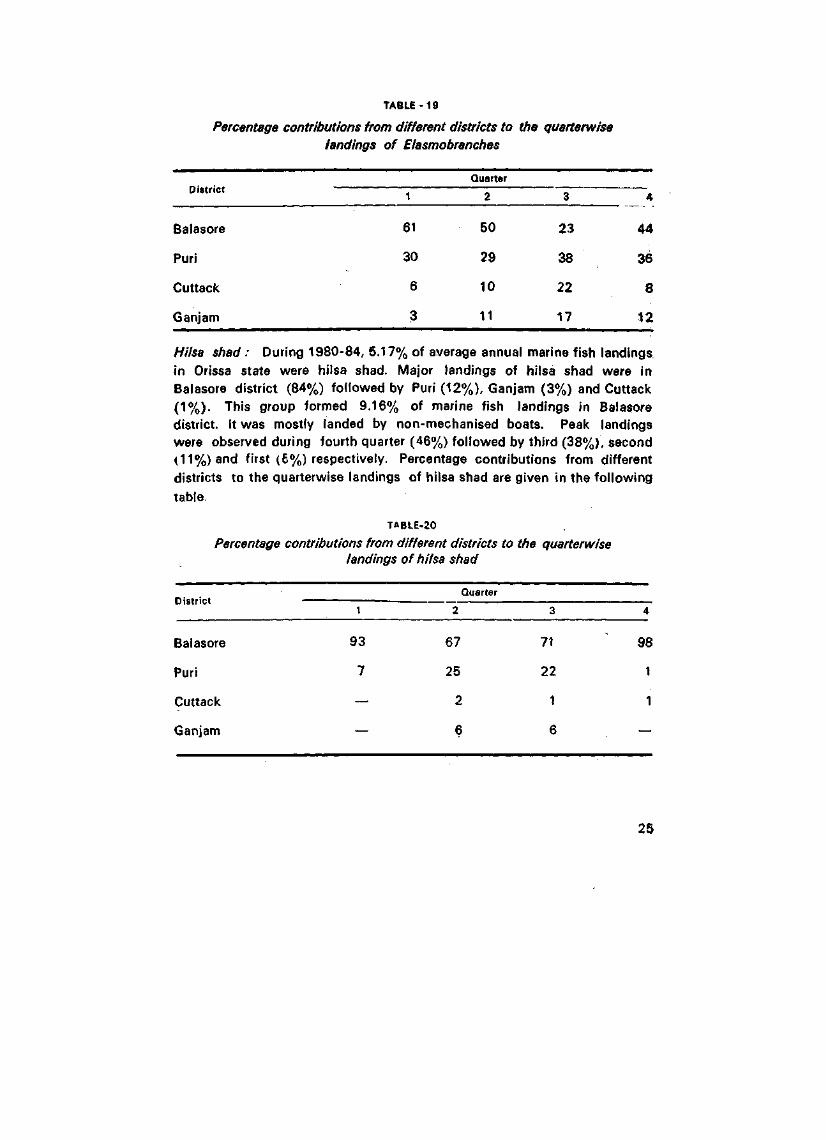
TABLE-19
Percentage contributions from different districts to the quarterwise landings of Elasmobranches
District Quarter
1
61
30
6
3
2
50
29
10
11
3
23
38
22
17
4
44
36
8
12
Balasore
Puri
Cuttack
Ganjam
Hilsa shad : During 1980-84, 5.17% of average annual marine fish landings, in Orissa state were hilsa shad. Major landings of hilsa shad were in Balasore district (84%) followed by Puri (12%), Ganjam (3%) and Cuttack (1%). This group formed 9.16% of marine fish landings in Balasore district. It was mostly landed by non-mechanised boats. Peak landings were observed during fourth quarter (46%) followed by third (38%), second 01%) and first (E%) respectively. Percentage contributions from different districts to the quarterwise landings of hilsa shad are given in the following table.
TABLE-20
Percentage contributions from different districts to the quarterwise landings of hilsa shad
District
Balasore
Puri
Cuttack
Ganjam
1
93
7
—
—
Quarter
2
67
25
2
6
3
71
22
1
6
4
98
1
1
—
25
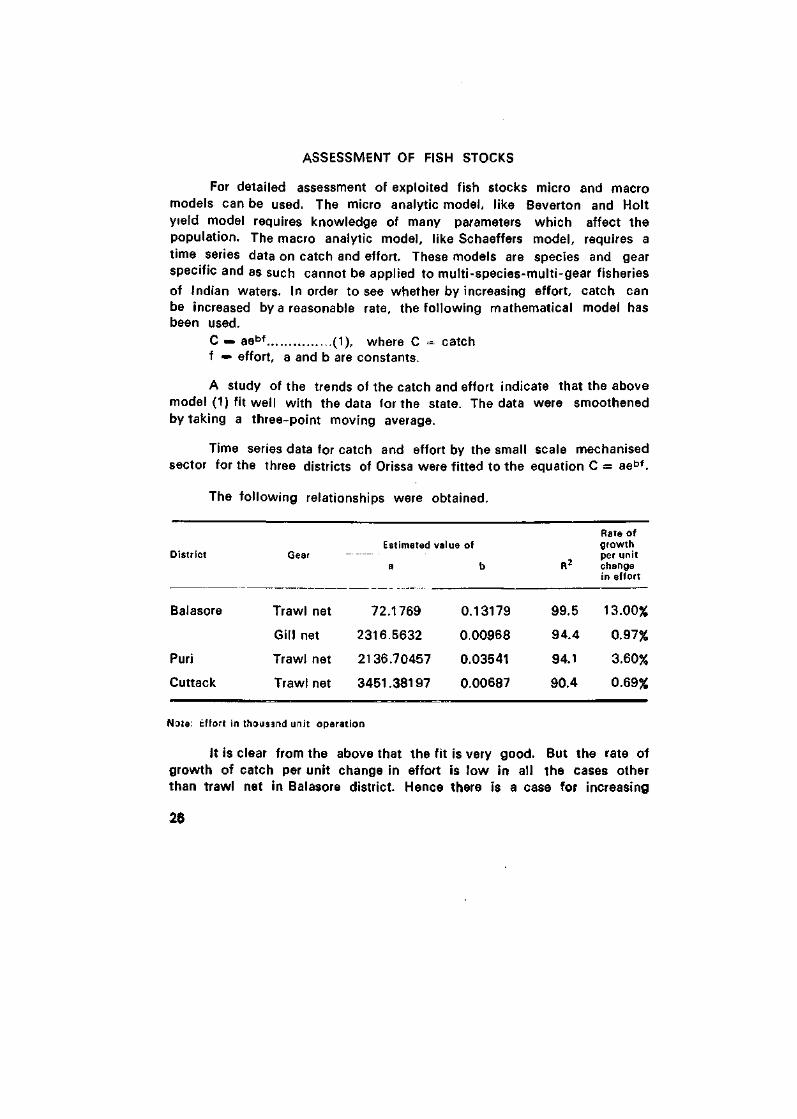
ASSESSMENT OF FISH STOCKS
For detailed assessment of exploited fish stocks micro and macro models can be used. The micro analytic model, like Beverton and Holt yield model requires knowledge of many parameters which affect the population. The macro analytic model, like Schaeffers model, requires a time series data on catch and effort. These models are species and gear specific and as such cannot be applied to multi-species-multi-gear fisheries of Indian waters. In order to see whether by increasing effort, catch can be increased by a reasonable rate, the following mathematical model has been used.
C — aebf (1), where C = catch f •=» effort, a and b are constants.
A study of the trends of the catch and effort indicate that the above model (1) fit well with the data for the state. The data were smoothened by taking a three-point moving average.
Time series data for catch and effort by the small scale mechanised sector for the three districts of Orissa were fitted to the equation C = aebf.
The following relationships were obtained.
District
Balasore
Puri
Cuttack
Gear
Trawl net
Gill net
Trawl net
Trawl net
Estimated val
a
72.1769
2316.5632
2136.70457
3451.38197
ue of
b
0.13179
0.00968
0.03541
0.00687
R2
99.5
94.4
94.1
90.4
Rate of growth per unit change in effort
13.00%
0.97%
3.60%
0.69%
Nata: tffort in thousand unit operation
it is clear from the above that the fit is very good. But the rate of growth of catch per unit change in effort is low in all the cases other than trawl net in Balasore district. Hence there is a case for increasing
26
trawl net effort in Balasore district. It may be .'mentioned here that there is no mechanised fishing in Ganjam district. The catch per hour record provided by the Fishery Survey of India (FSI) using vessels of 17.5 m length with the same horse power and gear from different basis gives an indication of the abundance of demersal fish in the coastal areas of various zones up to a depth of 58 m. Compared to 76.6 kg./h and 97.5 kg./h for Andhra Pradesh and Tamil Nadu respectively, the figure for the fishing grounds off the Orissa coast was 153 kg./h. The figures are based on average values for five years between 1976-77 and 1980-81.
From the demersal fishery surveys conducted by F. S. I, Joseph and John (1986) have reported that the distribution of mackerel extends along the entire east coast inside the 100 m contour with increasing catch rates in northern latitudes. According to them mackerel formed 12.4% of catch in upper east coast with an average catch rate of 28.3 kg/h. During 1985 Matsya Darshini recorded for mackerel, which formed 61.5% of trawl catch, an average catch rate of 105 kg/hr in lat. 20°-21° N within 60-120 m depth. This indicated the presence of rich mackerel fishery resources in deep waters along the Orissa coast also. The FSI vessels have also recorded very high catch rate of 53.21 kg/h for catfish in 50-100 m depth belt of upper east coast. Highly productive carangids ground yielding on an average of 46.11 kg/h below 50 m depth, 31.77 kg/h between 50-100 m and 22.82 kg/h between 100-200 m depth were located along the upper east coast of India.
Productive areas of other sardines were identified during trawl surveys in 1983 and 1984 from the deeper waters along upper east coast. The abundance was predominantly in 50-110 m depth range with peak concentration (123 kg/h) in 71-100 m belt. Though possibilities of higher production of this group from other sections of Indian coast is marginal, other sardines have promising potential in the deeper waters of upper east coast.
There are good grounds of Priacanthus, popularly known as'Big eye' or ''Bull eye", in the upper east coast, in the depth range 100-200 m depth, with a catch rate of 44.23 kg/h.
According to George eta/. 1977, the areas which need immediate attention are the upper east coast particularly, for prawns and cephalopods-
27
Potential Yield
The demersal fisheries potential (exploitable fish stock) in the continental shelf of Orissa has been estimated at 1,00,000/- to 1,20,000/-!
tonnes by the Indian Institute of foreign Trade (BOBP /INF/7). Based on the values of organic productivity and shelf area, Jones and Banerji (1973) have estimated the potential marine fishery resources including demersal, off Orissa coast at about 2,08,000 tonnes. Out of this 1,80,000 tonnes was from the shelf area up to 50 m depth and the rest from beyond 50 m depth and up to 200 m depth. Contribution of demersal group of fishes was 95,000 tonnes in the area up to 50 m depth, which was comparable with the figure arrived at by Indian Institute of Foreign Trade. From the ten year trend in landings, we observed that the estimates corresponding to 0.50 m depth zone (or 0-70 m depth) are in the lower side as exploitation is mostly confined to this zone alone.
Since there is no commercial exploitation beyond 50 m depth, the potential yield from these waters is also to be taken into account.
Alagaraja (1986) has proposed an approach called "maximum contribution approach" which would provide some indication on the potential harvestable yield that could be obtained. This involves considering the maximum catch over a period of time as an indicator of potential yield.
The maximum catch that could be obtained under the conditions of exploitation during the period was obtained by considering the maximum catch of important components for the last 10 years period. Estimated total landings was 75,462 tonnes which may be taken as an indicator of potential harvestable yield of the state, and it is on the lower side, when compared with the estimates arrived at by Jones and Banerji (1973). We can safely assume that the potential harvestable yield of the Orissa state will be of the order of 1,00,000 tonnes. Maximum exploited so far was 46,773 tonnes during 1984. There is an additional quantity of 54,000 tonnes which* can be exploited in a phased manner. 50% of the additional resources can be exploited in the next five years. After watching the condition of the stock, we can expand our effort to take the remaining resources.
At the present rate of exploitation, some more additional effort is needed in the next five years to get additional 27,000 tonnes. With this aim, in view, the following table has been prepared from the average annual marine fish landings in Orissa during 1983-84.
28
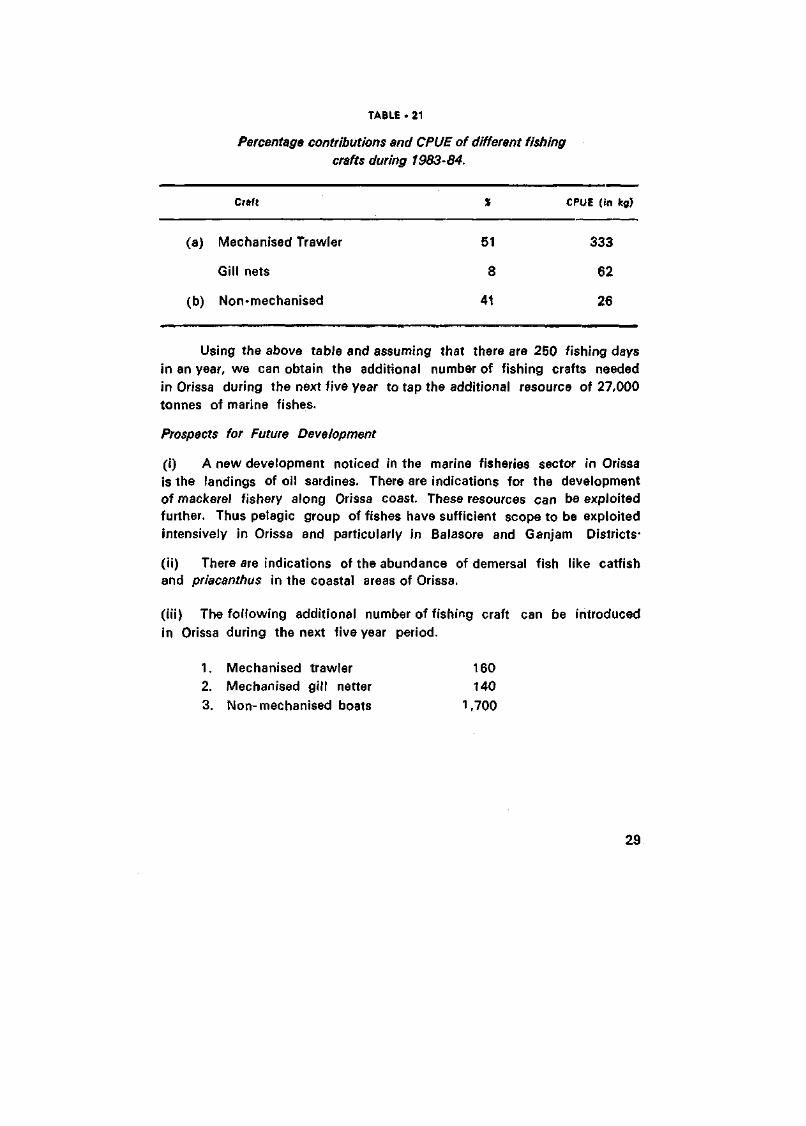
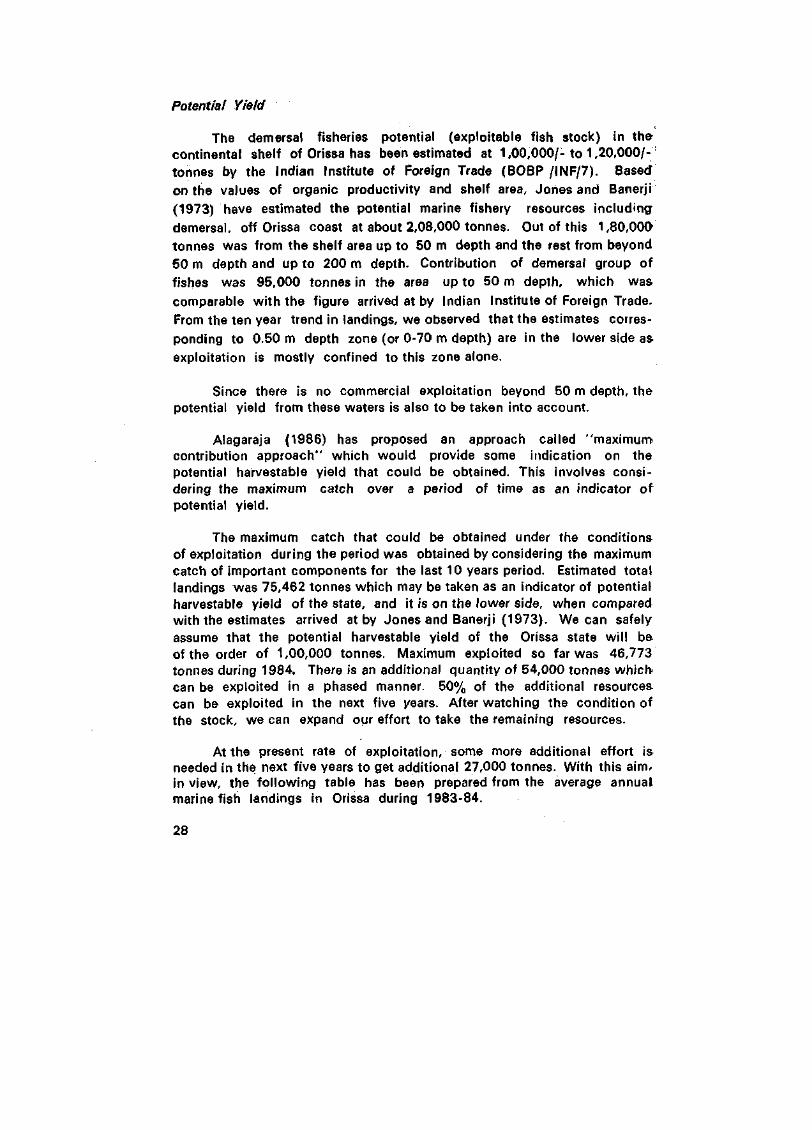
TABLE - 21
Percentage contributions and CPUE of different fishing crafts during 1983-84.
Craft X CPUE (in kg)
(a) Mechanised Trawler 51 333
Gill nets 8 62
(b) Non-mechanised 41 26
Using the above table and assuming that there are 250 fishing days in an year, we can obtain the additional number of fishing crafts needed in Orissa during the next five year to tap the additional resource of 27,000 tonnes of marine fishes.
Prospects for Future Development
(i) A new development noticed in the marine fisheries sector in Orissa is the landings of oil sardines. There are indications for the development of mackerel fishery along Orissa coast. These resources can be exploited further. Thus pelagic group of fishes have sufficient scope to be exploited intensively in Orissa and particularly in Balasore and Ganjam Districts-
(ii) There are indications of the abundance of demersal fish like catfish and priacanthus in the coastal areas of Orissa.
(iii) The following additional number of fishing craft can be introduced in Orissa during the next five year period.
1. Mechanised trawler 160 2. Mechanised gill netter 140
3. Non-mechanised boats 1,700
29
22'
21'
20
19
ANDHRA
PRADE8H
83*
Fig. 1 Map showing the four maritime districts of Orissa state with configuration of continental shelf
5 8
1 M 'SO 'Bl ' X i i
1 |
IcUTOCK
§8AUS0flE
Fig 2 DIstrictwise annual marine fish landings in Orissa
D Pelagic
400
.300
'200
JDemesMl
? 100
'75 '76 '77 '78 '79 '80 '81 '82 '83 '84
Years
Fig. 3 Annual pelagic and demersal fish landings in Orlssa
Fig. 4 Average annual contributions of major species/groups In trawl net
catch In Orissa during 1980-'84
Fig. 5 Average annual major contributions of species/groups in gill net catch
In Orissa during 1980-84
31
8&6tore (i90»»)
Fig. 6 Average annual marine fish landings in different districts in Orissa during 1980-'84 (in tonnes)
200
175
150
123
•o f> 73
•a x
J «r »0 en s -a 2* 3
a Pelagic
Demersat
'BO '81 '82 *83 *84 YEAR
Fig. 7 Annual pelagic and demersal fish landings in Balasore district
32
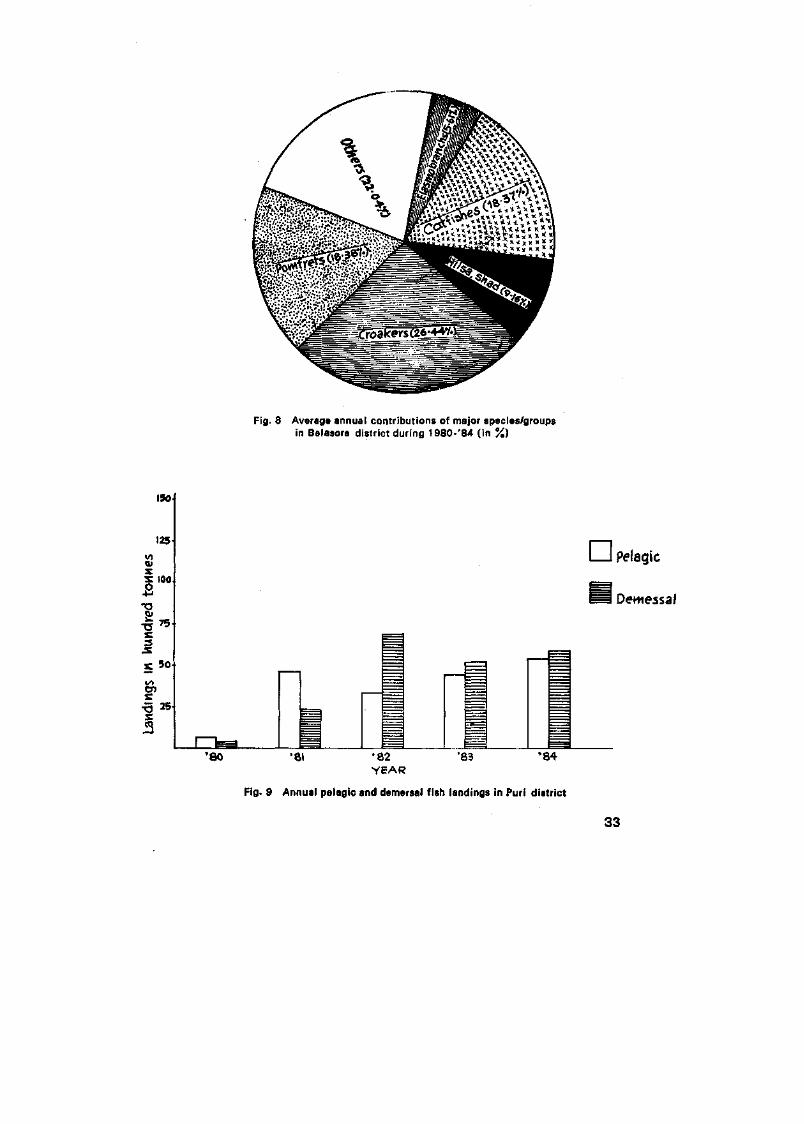
Fig. 8 Average annual contributions of major species/groups in Balasore district during 1980-'84 (in %)
ISo4
125-w <a s: loo
B
X. 3
JE
s 50
en £ •5 »+
n Pelagic
Dewessa/
[ " " M i ' 80 •81 ' 8 2
YEAR '83 ' 8 4
Fig. 9 Annual pelagic and demersal fish landings in Puri district
33
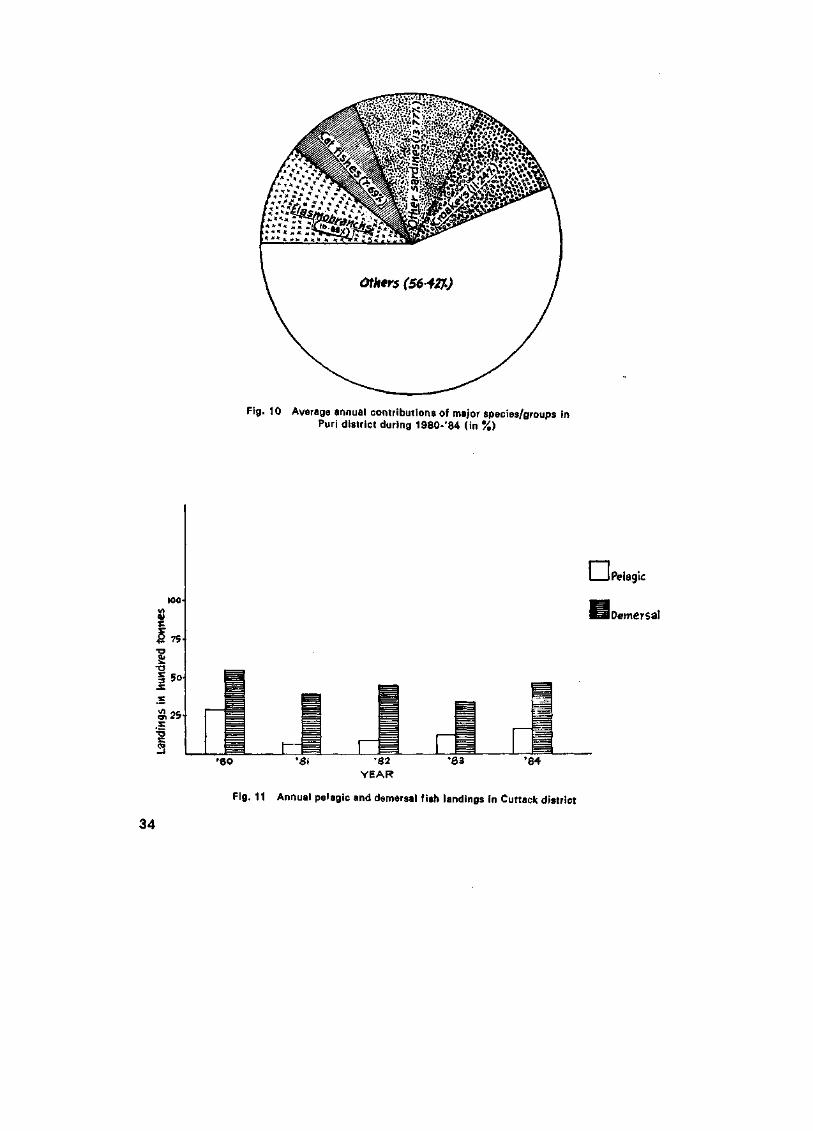
Fig. 10 Average annual contributions of major species/groups in Puri district during 1980-'84 (in %)
I I Pelagic
100-
« s
Pelagii
Demersal
# 7 5 -
3
f '80 '81 •82
Y E A R '83 '84
Fig. 11 Annual pelagic and demersal fish landings in Cuttack district
34
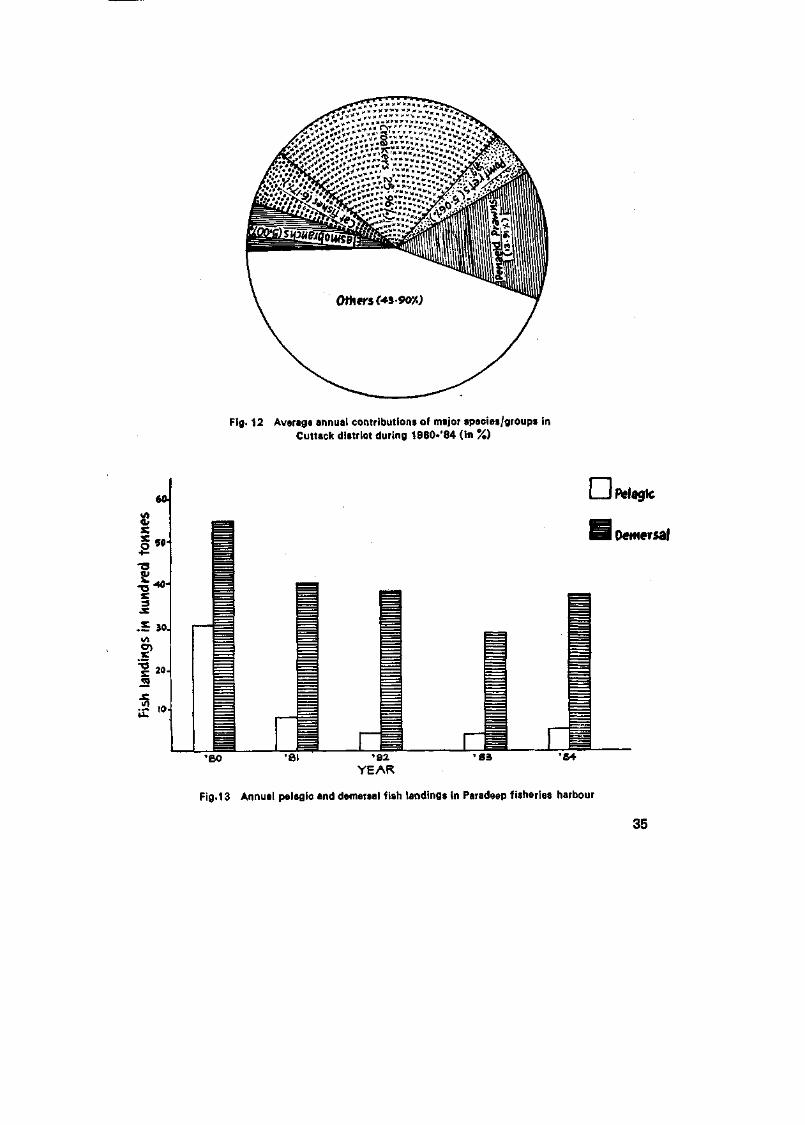
Fig. 12 Average annual contributions of major species/groups in Cuttack district during 1980-'84 (in %)
60.
S § 5 0 -
-o 5! s; 3
JC
- 5 30.
"g 20. i1
==
i=i —̂
=
=
==
[ J Pelagic
Demersal
'80 •81 '82 Y E A R
' 8 3 'B4
Fig.13 Annual pelagic and demersal fish landings in Paradsep fisheries harbour
35
I 100
5 75-1
Ol 50"
"O
I I Pelagic
Demersal
25
'80 *8I '82 '83 ' 8 4 YEAR
[Fig. 14 Annual pelagic and demersal fish landings in[Ganjam district
Fig. 15 Average annual contributions of major species/groups in Ganjam district during 1980-84 (in %)
36
ORISSA
APPENDIX
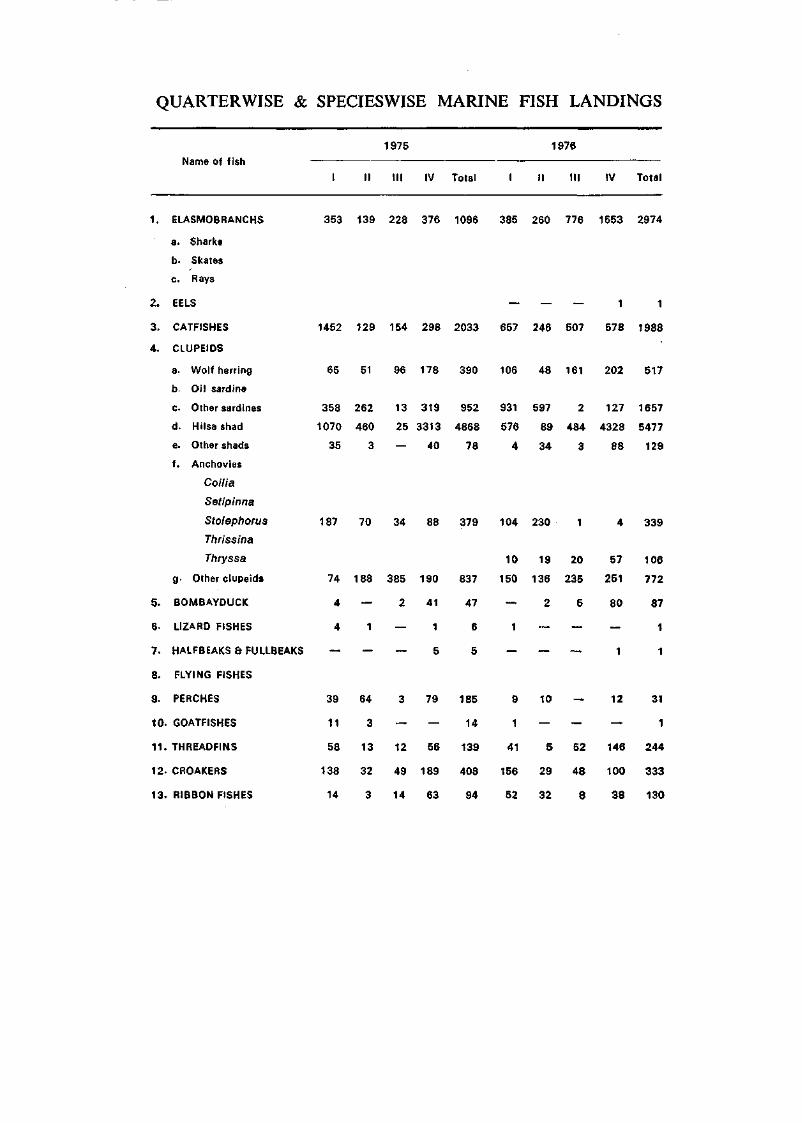
QUARTERWISE & SPECIESWISE MARINE FISH LANDINGS
Name of fish 1975 1976
IV Total III IV Total
1. ELASMOBRANCHS
a. Sharks
b. Skates
c. Rays
2. EELS
3. CATFISHES
4. CLUPEIDS
a. Wolf herring
b Oil sardine
c. Other sardines
d. Hilsa shad
e. Other shads
f. Anchovies
Coilia
Setipinna
Stolephorus
Thrissina
Thryssa
g Other clupeids
5. BOMBAYDUCK
6. LIZARD FISHES
7. HALFBEAKS&FULLBEAKS
8. FLYING FISHES
3. PERCHES
10. GOATFISHES
11. THREADFINS
12- CROAKERS
13. RIBBON FISHES
353 139 228 376 1096 385 260 776 1553 2974
1452 129 154 298 2033
— — — 1 1
657 246 507 578 1988
65 51 96 178 390 106 48 161 202 517
358 262 13 319 952
1070 460 25 3313 4868
35 3 — 40 78
187 70 34 88 379
74 188 385 190 837
4 — 2 41 47
4 1 — 1 6
— — — 5 5
39 64 3 79 185
11 3 — — 14
58 13 12 56 139
138 32 49 189 408
14 3 14 63 94
931 597 2 127 1657
576 89 484 4328 5477
4 34 3 88 129
104 230 4 339
10 19 20 57 106
150 136 235 251 772
— 2 5 80 87
1 — — — 1
_ _ — 1 -!
9 10 — 12 31
1 — — — 1
41 5 52 146 244
156 29 48 100 333
52 32 8 38 130
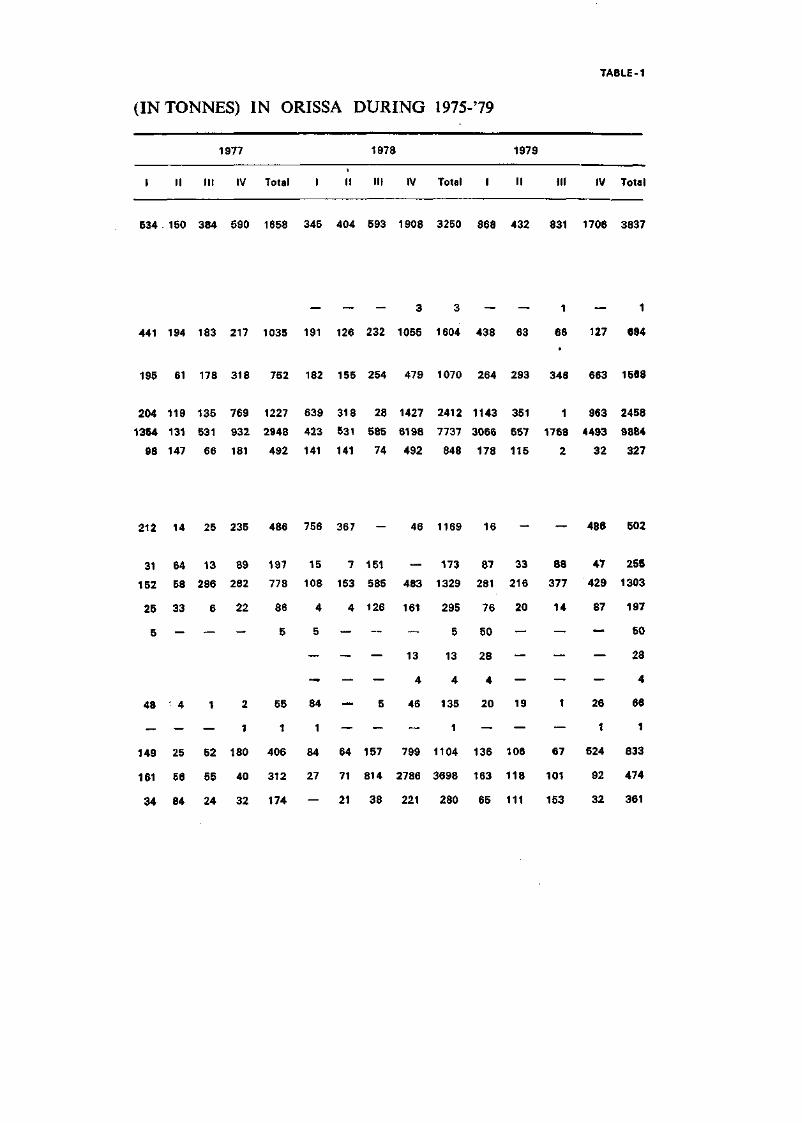
(IN TONNES) IN ORISSA DURING 1975-79
TABLE-1
1977
I II III IV Total
534 150 384 590 1658
441 194 183 217 1035
195 61 178 318 752
204 119 135 769 1227
1364 131 531 932 2948
98 147 66 181 492
212 14 25 235 486
31 64 13 89 197
152 58 286 282 778
25 33 6 22 86
5 - — - 5
48 4 1 2 55
— — — 1 1
149 25 52 180 406
161 E6 55 40 312
34 84 24 32 174
1978
I II III IV Total
345 404 593 1908 3250
— — — 3 3
191 126 232 1055 1604
182 155 254 479 1070
639 318 28 1427 2412
423 531 585 6198 7737
141 141 74 492 848
756 367 — 46 1169
15 7 151 — 173
108 153 585 483 1329
4 4 126 161 295
5 — — — 5
— — — 13 13
— — — 4 4
84 — 5 46 135
1 — — — 1
84 64 157 799 1104
27 71 814 2786 3698
— 21 38 221 280
1979
II III IV Total
868 432 831 1706 3837
— — 1 — 1
438 63 66 127 094
264 293 348 663 1568
1143 351 1 963 2458
3066 557 1768 4493 9884
178 115 2 32 327
16 — — 486 502
87 33 88 47 256
281 216 377 429 1303
76 20 14 87 197
50 — — — 50
28 — — — 28
4 — — - 4
20 19 1 26 66
— — — 1 1
136 106 67 524 833
163 118 101 92 474
65 111 153 32 361
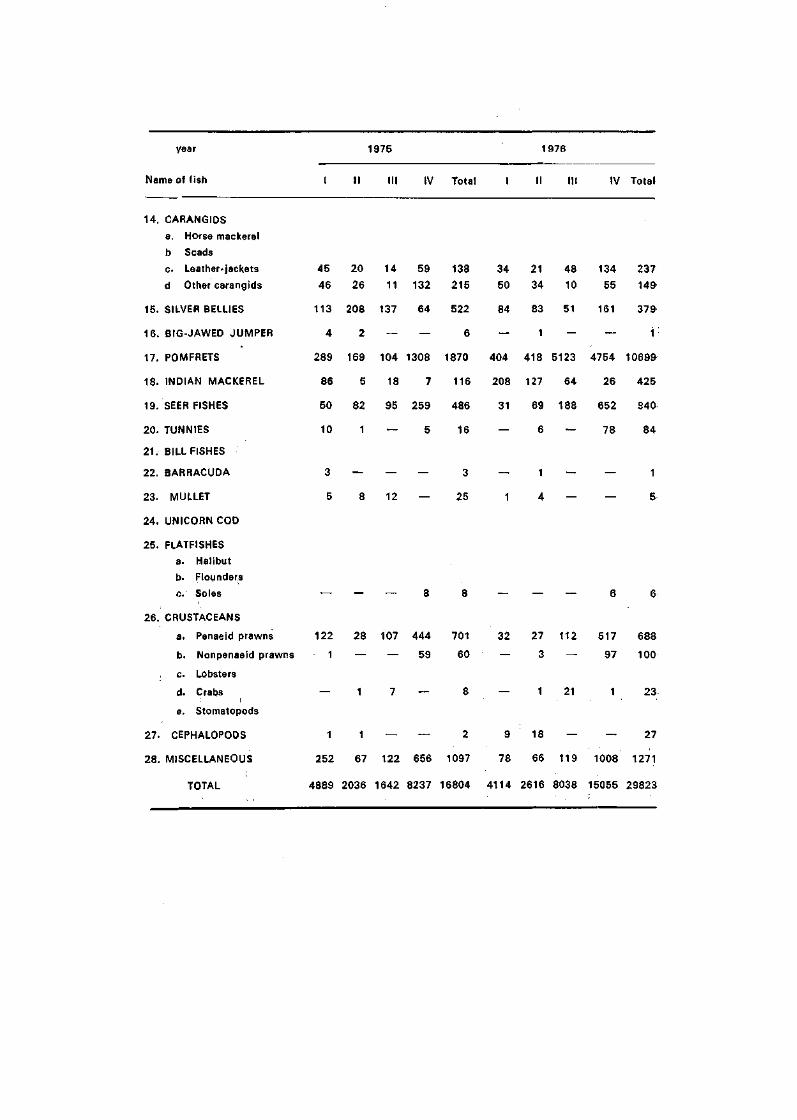
year 1975 1976
Name of fish IV Total III IV Total
14. CARANGIDS
a. Horse mackerel
b Scads
c. Leather-jackets
d Other carangids
15. SILVER BELLIES
16. BIG-JAWED JUMPER
17. POMFRETS
18. INDIAN MACKEREL
19. SEER FISHES
20. TUNNIES
21. BILL FISHES
22. BARRACUDA
23. MULLET
24. UNICORN COD
25. FLATFISHES
a. Halibut
b. Flounders
c. Soles
26. CRUSTACEANS
a. Penaeid prawns
b. Nonpenaeid prawns
c. Lobsters
d. Crabs •
e. Stomatopods
27. CEPHALOPODS
28. MISCELLANEOUS
TOTAL
45 20 14 59 138
46 26 11 132 215
113 208 137 64 522
4 2 — — 6
289 169 104 1308 1870
86 5 18 7 116
50 82 95 259 486
10 1 — 5 16
34 21 48 134 237
50 34 10 55 149
84 83 51 161 379
— 1 - — 1
404 418 5123 4754 10699
208 127 64 26 425
31 69 188 652 840
— 6 — 78 84
3
5
—
8
—
12
—
—
3
25
—
1
1
4
— —
.—.
1
5
— — — 8 8
122 28 107 444 701
1 — — 59 60
— 1 7 — 8
1 1 — — 2
252 67 122 656 1097
4889 2036 1642 8237 16804
32 27 112 517 688
— 3 — 97 100
— 1 21 23
9 18 — — 27
78 66 119 1008 1271
4114 2616 8038 15055 29823
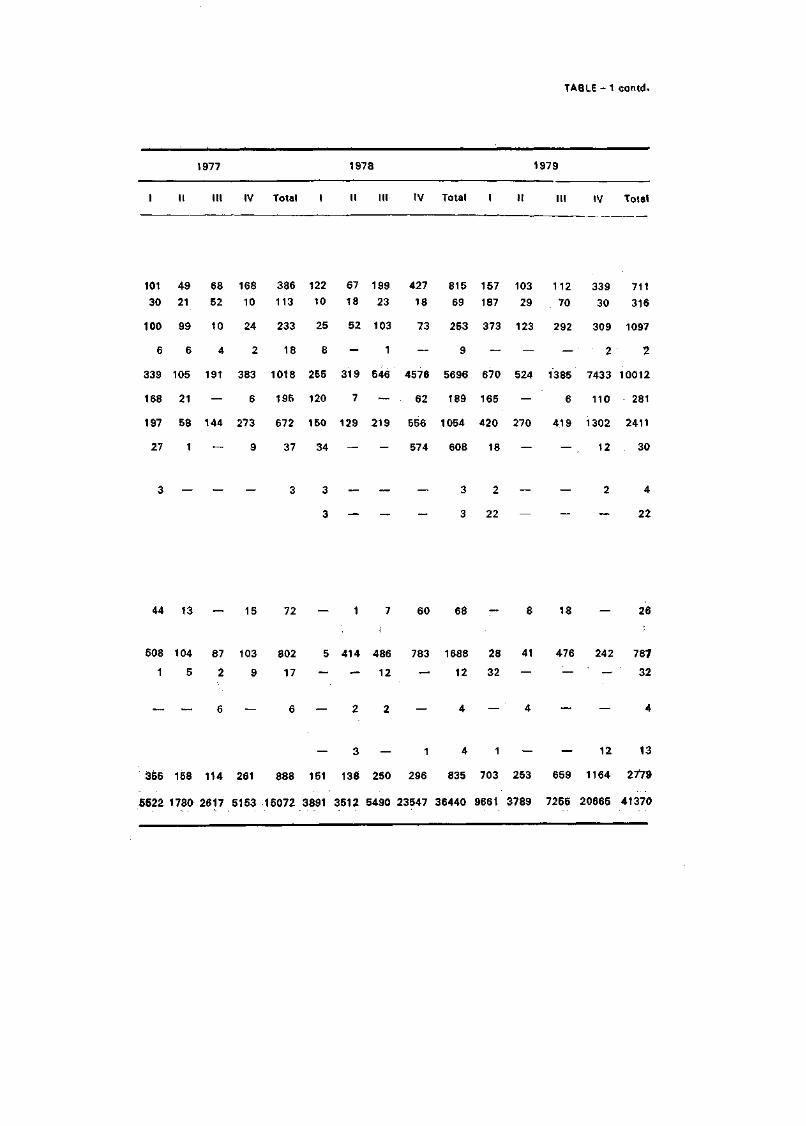
TABLE - 1 contd.
1977 1978 1979
I II III IV Total I II III IV Total I II m iv Total
101 49 68 168 386 122 67 199 427 815 157 103 112 339 711
30 21 52 10 113 10 18 23 18 69 187 29 70 30 316
100 99 10 24 233 25 52 103 73 253 373 123 292 309 1097
6 6 4 2 18 8 — 1 — 9 — — — 2 2
339 105 191 383 1018 255 319 546 4576 5696 670 524 1385 7433 10012
168 2 1 — 6 195 120 7 — . 62 189 165 — 6 110 281
197 58 144 273 672 150 129 219 556 1054 420 270 419 1302 2411
27 1 — 9 37 34 — — 574 608 18 — — . 12 30
3 — — — 3 3 — — — 3 2 — — 2 4
3 — — — 3 22 — — — 22
44 13 — 15 7 2 — 1 7 60 68 — 8 18 — 26
508 104 87 103 802 5 414 486 783 1688 28 41 476 242 787
1 5 2 9 17 — — 12 — 12 32 — — — 32
— — 6 — 6 — 2 2 — 4 — 4 — — 4
— 3 — 1 4 1 — — 12 13
355 158 114 261 888 151 13S 250 296 835 703 253 659 1164 2779
5522 1780 2617 5153 15072 3891 3512 5490 23547 36440 9661 3789 7255 20665 41370
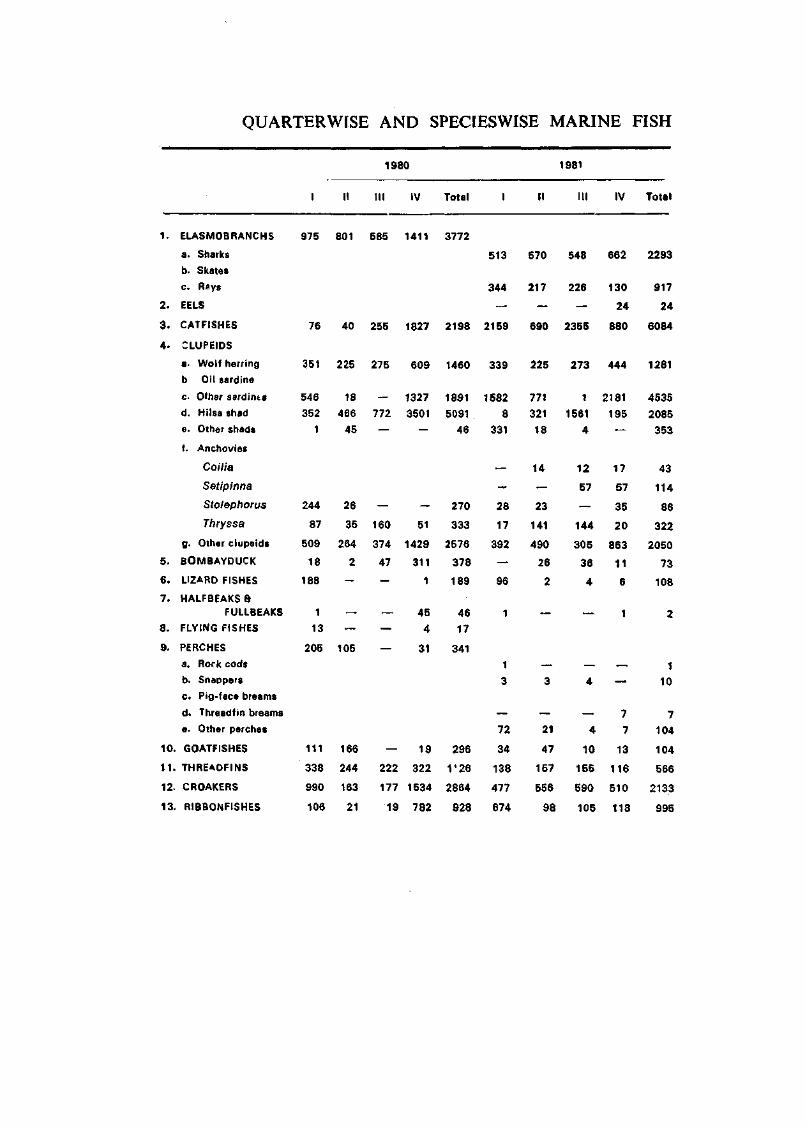
QUARTERWISE AND SPECIESWISE MARINE FISH
1.
2 .
3 .
4 .
5.
6 .
7.
8.
9.
10.
1 1 .
12.
13.
ELASMOBRANCHS
a. Sharks
b. Skates
c. Rsys
EELS
CATFISHES
CLUPEIDS
a- Wolf herring
b Oil sardine
c. Other sardines
d. Hilsa shad
e. Other shads
f. Anchovies
Coilia
Setipinna
Stolephorus
Thryssa
g. Other clupeids
BOMBAYDUCK
UZARD FISHES
HALFBEAKS & FULLBEAKS
FLYING FISHES
PERCHES
a. Rock cods
b. Snappers
c. Pig-face breams
d. Threadfin breams
e. Other perches
GOATFISHES
THREADFINS
CROAKERS
RIBBONFISHES
I
975
76
351
546
352
1
244
87
509
18
188
1
13
205
111
338
990
106
II
801
40
225
18
466
45
26
35
264
2
-
— —
105
166
244
163
21
1980
III
585
255
275
— 772
'
— 160
374
47
—
— — —
— 222
177
19
IV
1411
1827
609
1327
3501
"
— 51
1429
311
1
45
4
31
19
322
1534
782
Total
3772
2198
1460
1891
5091
46
270
333
2576
378
189
46
17
341
296
V 2 6
2864
928
1
513
344
—
2159
339
1582
8
331
:
28
17
392
— 96
1
1
3
— 72
34
138
477
674
II
570
217
—
690
225
771
321
18
14
23
141
490
26
2
—
— 3
— 21
47
157
556
98
1981
III
548
226
—
2355
273
1
1561
4
12
57
— 144
305
36
4
—
— 4
— 4
10
155
590
105
IV
662
130
24
880
444
2181
195
17
57
35
20
863
11
6
1
— —
7
7
13
116
510
118
Total
2293
917
24
6084
1281
4535
2085
353
43
114
86
322
2050
73
108
2
1
10
7
104
104
566
2133
995
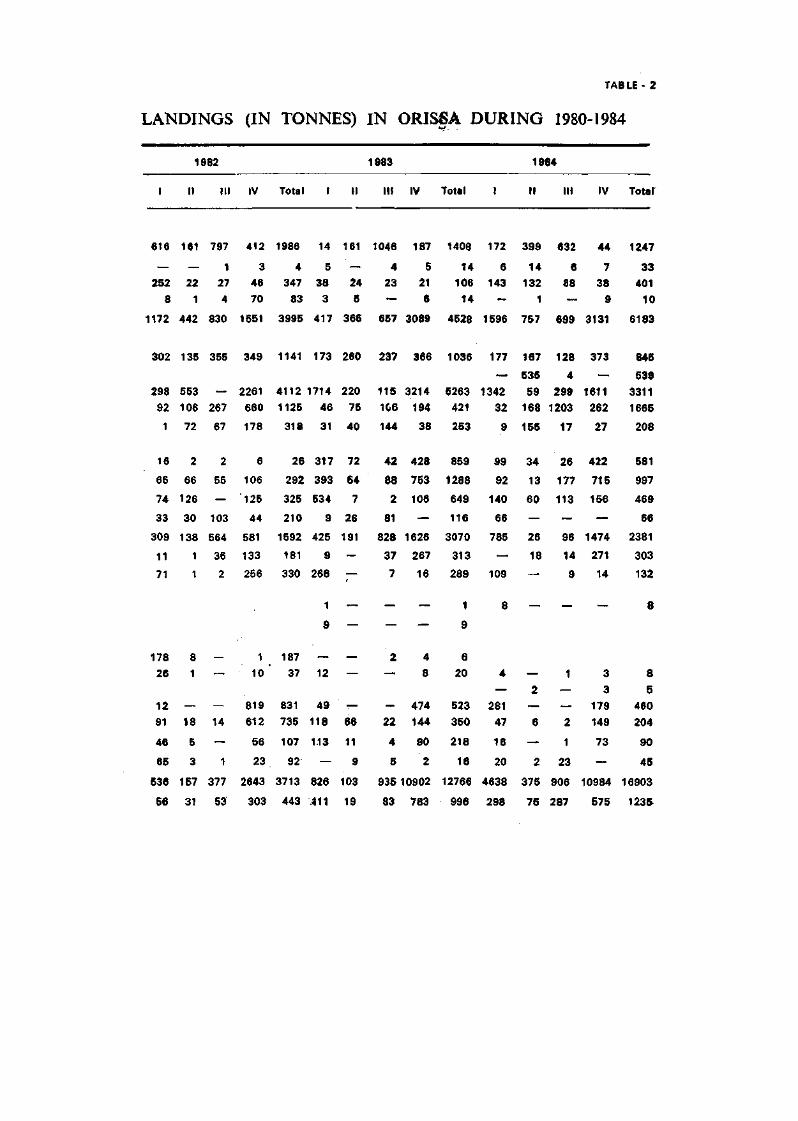
TAB LE - 2
LANDINGS (IN TONNES) IN ORISSA DURING 1980-1984
1
616
— 252
8
1982
11
161
— 22
1
III
797
1 27
4
IV
412
3 46
70
Total
1986
4
347
83
I
14
5 38
3
II
161
— 24
5
1983
III
1046
4
23
—
IV
187
5
21
6
Total
1408
14 106
14
I
172
6
143
—
1984
II
399
14
132
1
III
632
6
88
—
IV
44
7
38
9
Total
1247
33
401
10
1172 442 830 1551 3995 417 366 657 3089 4528 1596 757 699 3131 6183
302 135 355 349 1141 173 260 237 366 1036 177 167 128 373 84S
— 535 4 — 539
298 553 — 2261 4112 1714 220 115 3214 6263 1342 59 299 1611 3311
92 106 267 660 1125 46 76 106 194 421 32 168 1203 262 1665
1 72 67 178 318 31 40 144 38 253 9 155 17 27 208
16
65
74
33
309
11
71
178
26
12
91
46
65
536
66
2
66
126
30
138
1
1
8
1
— 18
5
3
157
31
2
55
— 103
564
36
2
— —•
— 14
—
1
377
53
6
106
'125
44
581
133
256
1
10 '
819
612
56
23
2643
303
26
292
325
210
1592
181
330
187
37
831
735
107
92
3713
443
317
393
534
9
425
9
266
1
9
— 12
49
118
113
—
826
•Jill
72
64
7
26
191
— —
—
— —
— 66
11
9
103
19
42
88
2
81
828
37
7
—
2
~•
— 22
4
5
428
753
106
— 1626
267
16
—
4
8
474
144
90
2
935 10902
83 783
859
1288
649
116
3070
313
289
1
9
6
20
523
350
218
16
12766
996
99
92
140
66
785
— 109
8
4
281
47
16
20
4638
298
34
13
60
— 26
18
—
—
2 — 6
— 2
375
75
26
177
113
— 96
14
9
—
1
— 2
1
23
906
287
422
715
156
— 1474
271
14
—
3
3
179
149
73
—
10984
575
581
997
469
66
2381
303
132
8
00 10
460
204
90
45
16903
1235
year ^1980 1981
Name of f ish
14. CARANGIDS
a. Horse mackerel
b. Scads c. Leather-jackets d. Other carangids
15. SILVERBELLIES
16. BIG-JAWED JUMPER
17. POMFRETS
a Black pomfret b. Silver pomfret c- Chinese pomfret
18. INDIAN MACKEREL
19. SEER FISHES
a. S. commersoni b. S. guttatatus c. S. lineolatus d. Acanthocybium Sp
20. TUNNIES
a. E. affinis
b. Auxis spp-c. K. pelamis d. T. tonggol
e. Other tunnies
2 1 . BILLFISHE3
22. BARRACUDAS
23. MULLETS
24- UNICORN COD
25. FLATFISHES
a. Halibut b. Founders c. Soles
26. CRUSTACEANS
a. Penaeid prawns b. Non penaeid prawns
c. Lobsters
d. Crabs e. Stomatopods
27. CEPHALOPODS
28 . MISCELLANEOUS
T O T A L
No of operations of f ish ing units-('OOO)
I
260
408
35
1918
107
405
I ,
15
— 1
66
449
; 20
40 74
29
310
9248
222
II
201
134
9
1799
3
328
—
3
—
—
67 10
9 57
6
206
5453
167
III
154
48
16
849
— 185
—
— —
3
127
6
—. 309
IV
559
117
5
4506
155
624
19
5
—
—
431
125 48
63
230
4583 20091
16V • 348
Total
1174
707
65
9072
265
1542
34
8
1
69
1074
30
174 185
98
1055
39375
898
I
13
88 163 34
436
6
382 735
673
35 393
/
3
131
— 9
16
256
16 23
9
263
10893
317
II
5
2 27 35
184
42
260 514
1
12
2 321
— — —
__
192
99 122
29
301
6538
202
III
15
— 5
68
58
1
1
998 1
13
2 340
— — —
21
150 2 1
32
— 208
8290
155
IV
35
7
1
13
55
—
137 676
125
52 1370
25
102
14
1
—
10
730 63
2
19
210
9934
255
Total
68
97 196
150
733
49
780
2903
2
823
91
2424 25
105
145
1
9
47
1328 55
3 147 145
57
982
35655
929
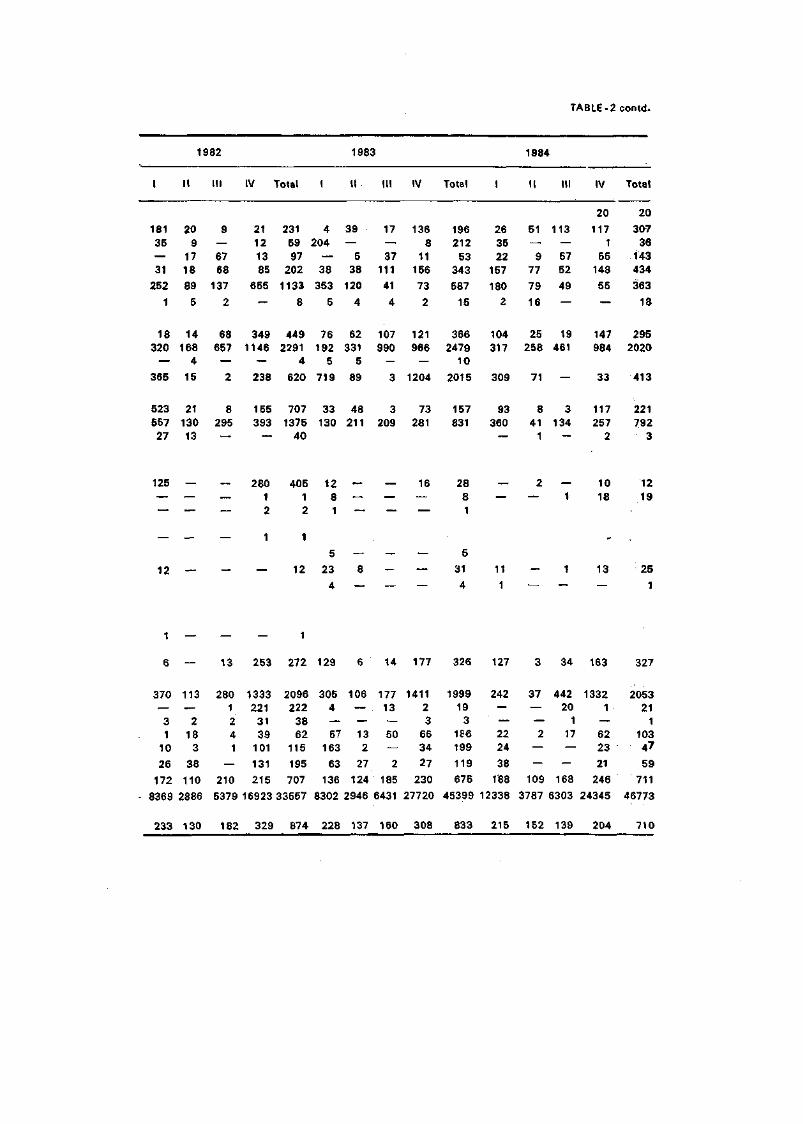
TABLE-2 contd.
1
181 35 — 31
252
1
18 320 —
365
523 557 27
125 —
12
1982
II
20 9 17 18
89
5
14 168 4
15
21 130 13
_
—
Ill
9 — 67 68
137
2
68 657 — 2
8 295 , _
—
IV
21 12 13 85
655
—
349 1146
— 238
155 393
• " "
280 1 2
1
Total
231 59 97 202
1133
8
449 2291
4
620
707 1375 40
405 1 2
1
12
I
4 204 — 38
353
5
76 192 5
719
33 130
12 8 1
5
23
4
1983
II
39 — 5 38
120
4
62 331 5
89
48 211
_
—
8 —
Ill
17 — 37
111 41
4
107 990 — 3
3 209
—
—
—
IV
136 8 11 156
73
2
121 966 —
1204
73 281
16 —
—
—
Total
196 212 53
343 587
15
366 2479 10
2015
157 831
28 8 1
5
31
4
1
26 35 22
157
180 2
104 317
309
93 360 —
_
—
11
1
1984
II
51 — 9
77
79
16
25 258
71
8 41 1
2 —
—
Ill
113 — 57 52
49
—
19 461
—
3 134
__
1
1 —
IV
20
117 1
55 148 55
—
147 984
33
117 257 2
10 18
13 —
Total
20
307 36 143 434
363
18
295 2020
413
221 792 3
12 19
25
1
1 — — — 1
6 — 13 253 272 129 6 14 177 326 127 3 34 163 327
370 113 280 1333 2096 305 106 177 1411 1999 242 37 442 1332 2053 — — 1 221 222 4 — 13 2 19 — — 20 1 21
3 1 10
26
172
2 18 3
38
110
2 4 1
— 210
31 39 101
131
215
38 62
115
195 707
— 57
163
63 136
— 13 2
27
124
— 50 — 2
185
3 66 34
27
230
3 186 199
119 675
— 22 24
38
1'88
— 2 — — 109
1 17 — — 168
— 62 23
21 246
1 103 47
59 711
8369 2886 5379 16923 33557 8302 2946 6431 27720 45399 12338 3787 6303 24345 46773
233 130 182 329 874 228 137 160 308 833 215 152 139 204 710
SPECIESWISE AND GEARWISE CONTRIBUTION UNITS IN ORISSA
1980 1981 Name of fish
GN NM Total GN NM Total
1. ELASMOBRANCHS 39
2. EELS
1953
3.
4.
5.
6.
7.
8.
9.
10.
11.
12.
13.
14.
15.
16
17.
18.
19.
CATFISHES
CLUPEIDS
BOMBAYDUCK
LIZARD FISHES
HALFBEAKS & FULL BEAKS
FLYING FISHES
PERCHES
GOATFISHES
THREADFINS
CROAKERS
RIBBONFISHES
CARANGIDS
SILVERBELLIES
102
1477
227
186
—
—
220
129
54
2173
881
419
139
BIG-JAWED JUMPER 26
POMFRETS
INDIAN MACKEREL
SEERFISHES
1032
1456
5528
—
—
—
—
—
—
560
308
8
306
32
—
5791
—
926
1780 3772 104 1254 1852 3210
23 — 1 24
640 2198 366 5060 658 6084
4662 11667 700 2696 7473 10869
151 378 12 — 61 73
3 189 53 — 55 108
46 46 — — 2 2
17 17
121 341 62 — 60 122
167 296 87 — 17 104
512 1126 86 242 238 566
383 2864 1629 48 758 2133
39 928 225 — 770 995
449 1174 16 138 357 511
536 707 51 — 682 733
39 65 43 — 6 49
2249 9072 174 2308 1203 3685
265 265 — — 823 823
616 1542 592 1242 706 2540
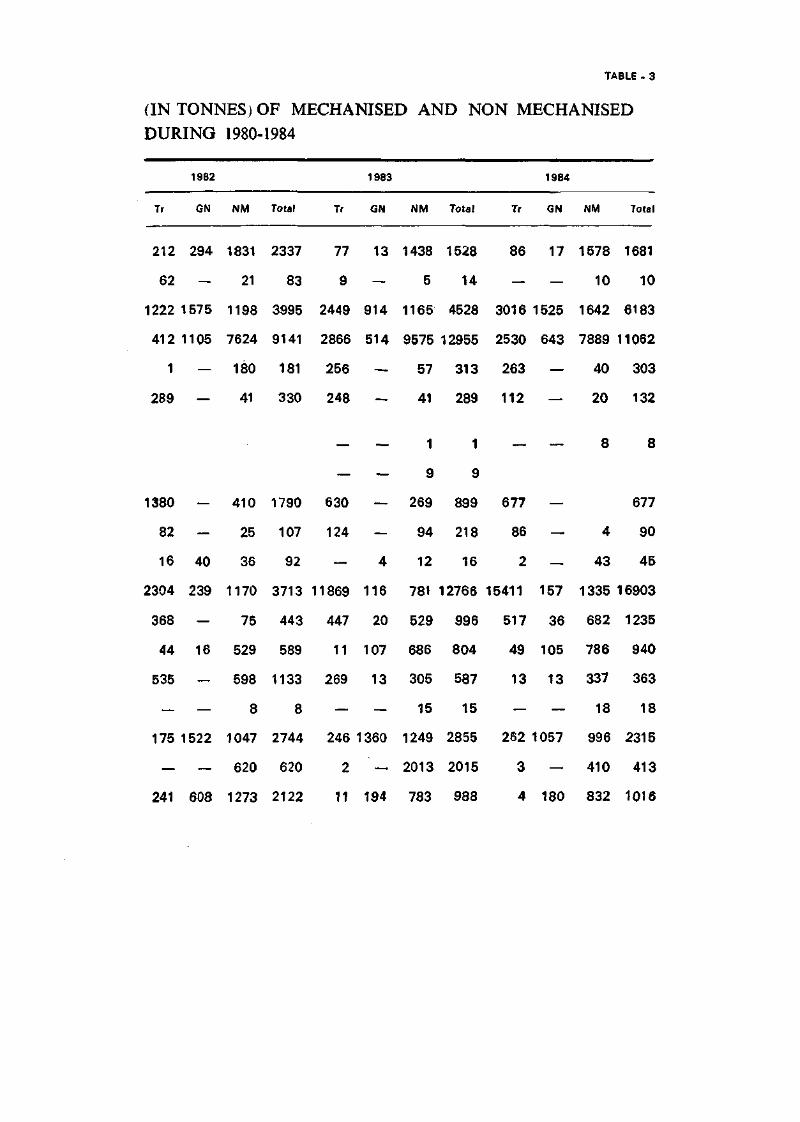
TABLE - 3
(IN TONNES) OF MECHANISED AND NON MECHANISED
DURING 1980-1984
1982 1983 1984
Tr GN NM Total Tr GN NM Total Tr GN NM Total
212 294 1831
62 — 21
1222 1575 1198
412 1105 7624
1 — 180
289 — 41
1380 — 410
82 - 25
16 40 36
2304 239 1170
368 — 75
44 16 529
535 — 598
— — 8
175 1522 1047
— — 620
241 608 1273
2337 77 13
83 9 —
3995 2449 914
9141 2866 514
181 256 —
330 248 —
1790 630 —
107 124 —
92 — 4
3713 11869 116
443 447 20
589 1 1 1 0 7
1133 269 13
8 — —
2744 246 1360
620 2 —
2122 11 194
1438 1528 86
5 14 —
1165 4528 3016
9575 12955 2530
57 313 263
41 289 112
1 1
9
269
94
12
781
529
686
305
15
1249
2013
783
9
899
218
16
12766
996
804
587
15
2855
2015
988
677
86
2
15411
517
49
13
—
282
3
4
17 1578 1681
— 10 10
1525 1642 6183
643 7889 11062
— 40 303
— 20 132
— 8 8
—
—
—
157
36
105
13
—
057
—
180
4
43
1335
682
786
337
18
996
410
832
677
90
45
16903
1235
940
363
18
2315
413
1016
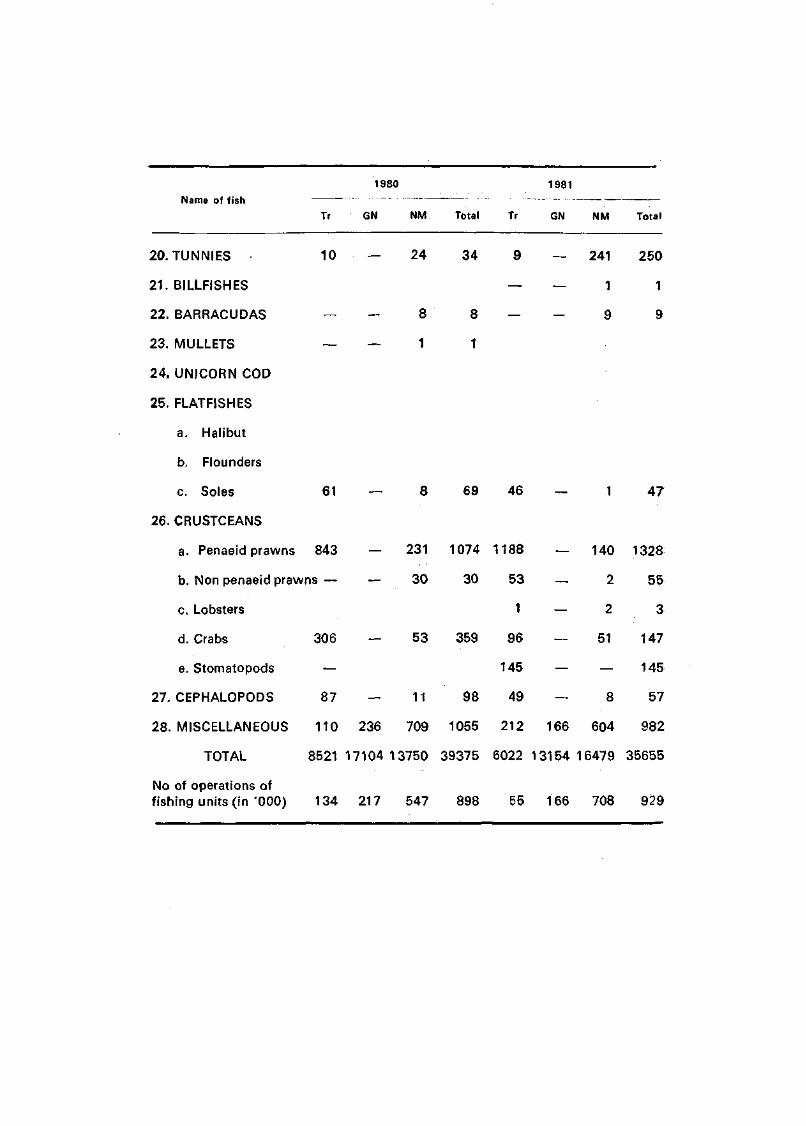
Name of fish
20. TUNNIES
21. BILLFISHES
22. BARRACUDAS
23. MULLETS
24. UNICORN COD
25. FLATFISHES
a. Halibut
b. Flounders
c. Soles
26. CRUSTCEANS
a. Penaeid prawns
Tr
10
—
—
61
843
b. Non penaeid prawns —
c. Lobsters
d. Crabs
e. Stomatopods
27. CEPHALOPODS
28. MISCELLANEOUS
TOTAL
No of operations of fishing units (in '000)
306
—
87
110
8521
134
1980
GN
—
—
—
—
—
—
—
—
236
NM
24
8
1
8
231
30
53
11
709
17104 13750
217 547
Total
34
8
1
69
1074
30
359
98
1055
39375
898
Tr
9
—
—
46
1188
53
1
96
145
49
212
6022
55
1981
GN
—
—
—
—
—
—
—
—
—
—
166
NM
241
1
9
1
140
2
2
51
—
8
604
13154 16479
166 708
Total
250
1
9
47
1328
55
3
147
145
57
982
35655
929
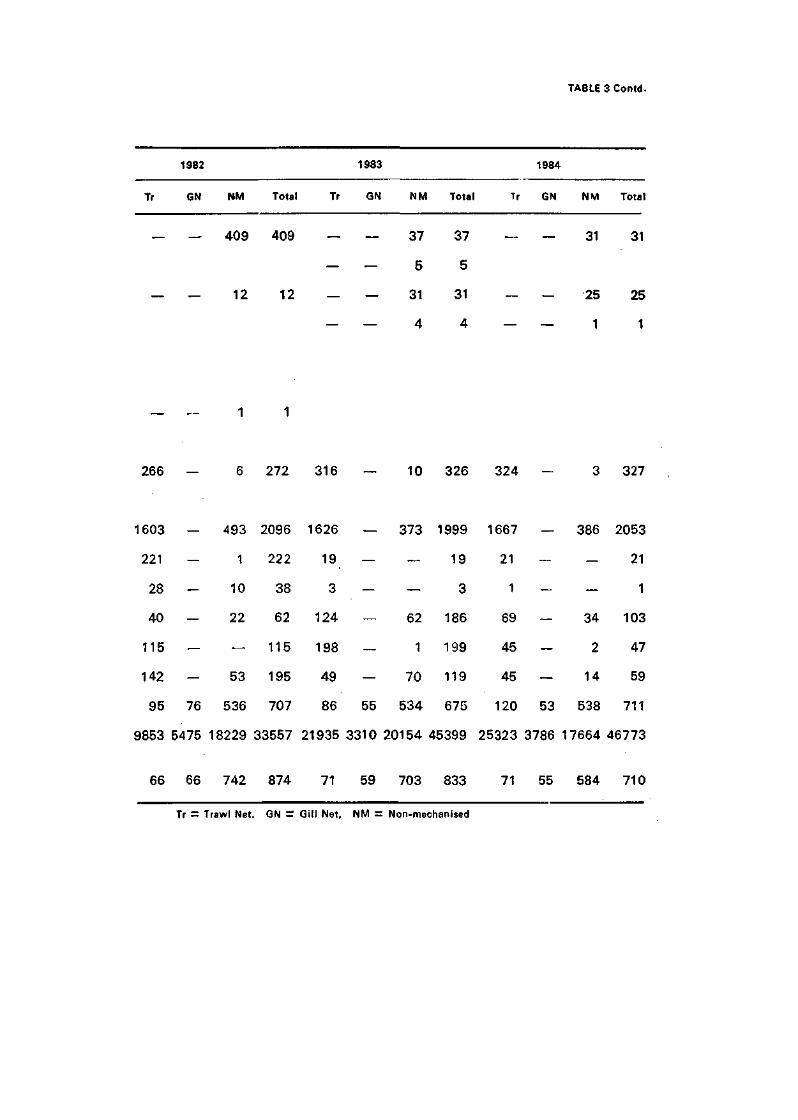
1982 1983 1984
Tr GN NM Total
_ _ 409 409
— — 12 12
— — 1 1
266 — 6 272
1603 — 493 2096
221 — 1 222
28 — 10 38
40 — 22 62
115 — — 115
142 — 53 195
95 76 536 707
9853 5475 18229 33557
66 66 742 874
Tr = Trawl Net. GN =
Tr GN NM Total
— — 37 37
- — 5 5
- — 31 31
- — 4 4
316 — 10 326
1626 — 373 1999
19 — — 19
3 - — 3
124 — 62 186
198 — 1 199
49 — 70 119
86 55 534 675
21935 3310 20154 45399
71 59 703 833
Gill Net, NM = Non-mechanised
Tr GN NM Total
— — 31 31
— — 25 25
— — 1 1
324 - 3 327
1667 — 386 2053
21 — — 21
1 - — 1
69 — 34 103
45 — 2 47
45 — 14 59
120 53 538 711
25323 3786 17664 46773
71 55 584 710
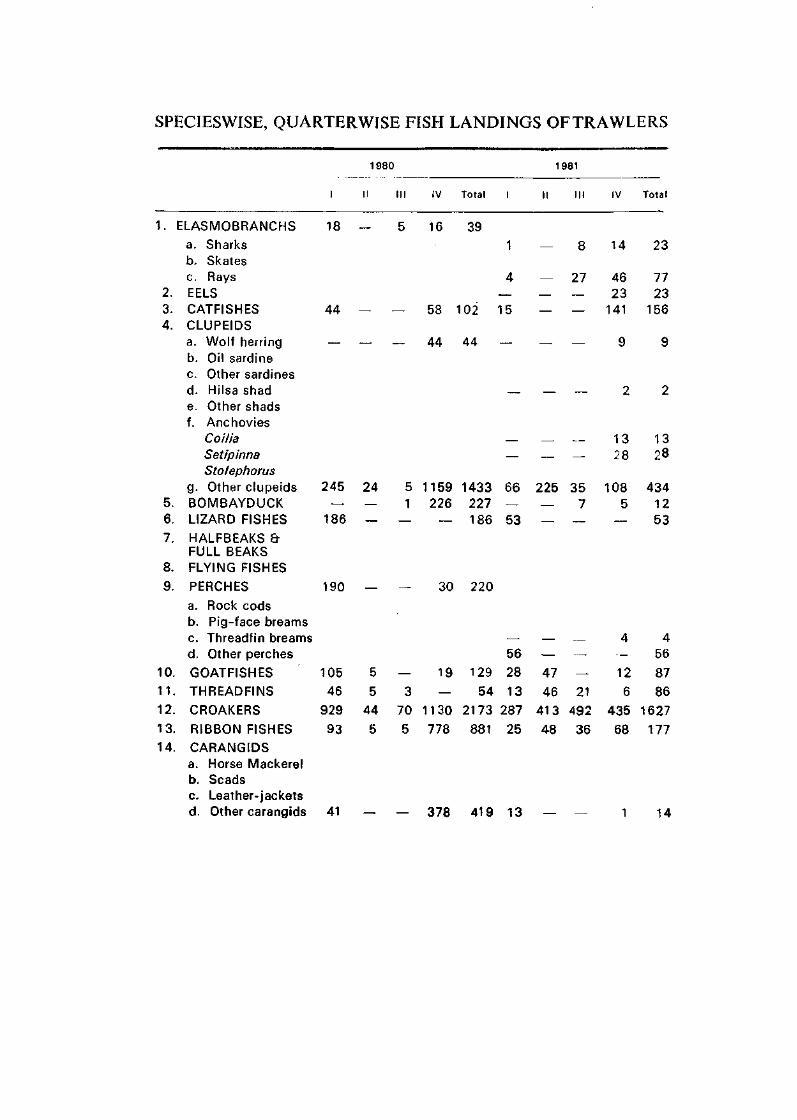
SPECIES WISE, QUARTERWrSE FISH LANDINGS OF TRAWLERS
1.
2. 3. 4.
5. 6.
7.
8.
9.
10.
1 1 .
12.
13.
14.
ELASMOBRANCHS
a. Sharks b. Skates c. Rays EELS CATFISHES CLUPEIDS a. Wolf herring b. Oil sardine c. Other sardines d. Hilsa shad e. Other shads f. Anchovies
Coilia Set/pinna Stolephorus
g. Other clupeids BOMBAYDUCK LIZARD FISHES
HALFBEAKS & FULL BEAKS FLYING FISHES
PERCHES
a. Rock cods b. Pig-face breams c. Threadfin breams d. Other perches
GOATFISHES
THREADFINS
CROAKERS
RIBBON FISHES
CARANGIDS a. Horse Mackerel b. Scads c. Leather-jackets d. Other carangids
i
18
44
245 —
186
190
105
46
929
93
41
1980
I! Ill
— 5
— —
24 5 — 1 — —
5 —
5 3
44 70
5 5
— _
IV
16
58
44
1159 226
—
30
19
—
1130
778
378
Total
39
102
44
1433 227 186
220
129
54
2173
881
419
i
1
4 — 15
—
—
66 —
53
— 56
28
13
287
25
13
1981
II
—
—• — —
—
—
225 — —
— —
47
46
413
48
—•
in
8
27 — —
—
—
35 7
—
—. .._
—
21
492
36
—
IV
14
46 23
141
9
2
13 28
108 5
—
4 —
12
6
435
68
1
Total
23
77 23
156
9
2
13 28
434 12 53
4 56
87
86
1627
177
14
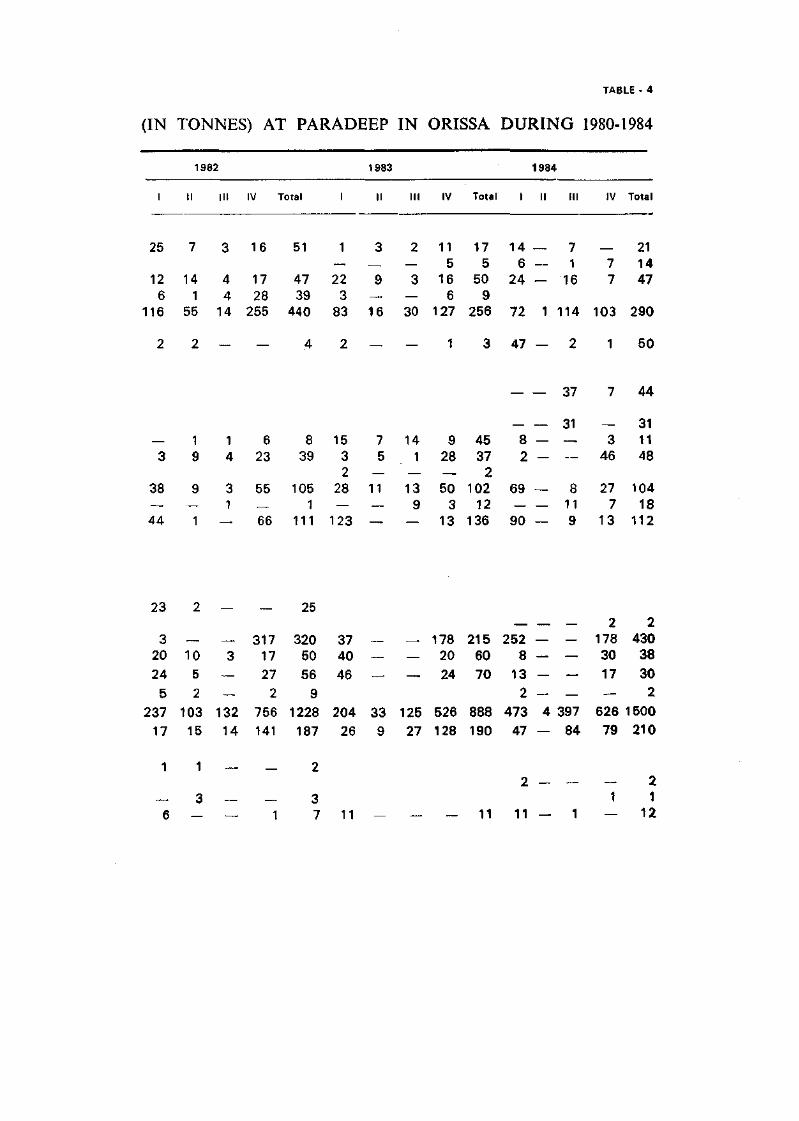
TABLE - 4
(IN TONNES) AT PARADEEP IN ORISSA DURING 1980-1984
1982 1983 1984
1 II III IV Total I II III IV Total I II III IV Total
25 7 3 16 51 1 3 2 11 17 14 — 7 — 21 — — — 5 5 6 — 1 7 14
12 14 4 17 47 22 9 3 16 50 24 — 16 7 47 6 1 4 28 39 3 — — 6 9
116 55 14 255 440 83 16 30 127 256 72 1 114 103 290
2 2 — — 4 2 — — 1 3 4 7 — 2 1 5 0
37 7 44
38
44
1 9
9
1
1 4
3 1 —.
6 23
55 — 66
8 39
105 1
111
15 3 2 28 — 123
7 5
11 — —
14 1
13 9 —
9 28
50 3
13
45 37 2
102 12
136
— — 8 — 2 -
69 — — — 90 —
31 — —
8 11 9
— 3 46
27 7
13
31 11 48
104 18 112
3 20 24 5
— 10 5 2
— 3 — —
317 17 27 2
320 50 56 9
37 40 46
23 2 — — 25 2 2
- — 178 215 252 — — 178 430 - — 20 60 8 — — 30 38 _ _ 24 70 13 — — 17 30
2 - - - 2 237 103 132 756 1228 204 33 125 526 888 473 4 397 626 1500
17 15 14 141 187 26 9 27 128 190 47 — 84 79 210
1 1 — - 2 2 - - - 2
_ 3 - - 3 1 1 6 — — 1 7 11 — — — 11 11 — 1 — 12
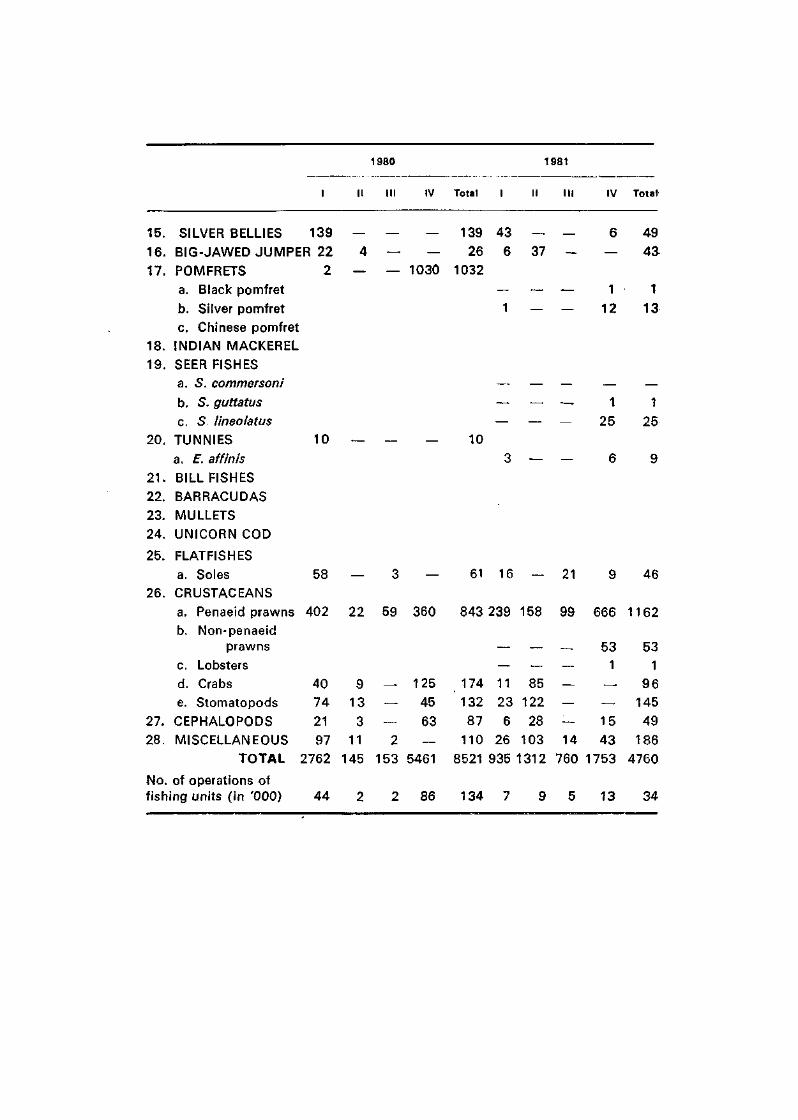
1980 1981
15. SILVER BELLIES 139
16. BIG-JAWED JUMPER 22
17.
18.
19.
20.
2 1 .
22.
23.
24.
25.
26.
27.
28.
POM FRETS
a. Black pomfret
b. Silver pomfret
c. Chinese pomfret
INDIAN MACKEREL
SEER FISHES
a. 5. commersoni
b. S. guttatus
c. S lineolatus
TUNNIES
a. E. affinis
BILL FISHES
BARRACUDAS
MULLETS
UNICORN COD
FLATFISHES
a. Soles
CRUSTACEANS
a. Penaeid prawns
b. Non-penaeid
prawns
c. Lobsters
d. Crabs
e. Stomatopods
CEPHALOPODS
MISCELLANEOUS
TOTAL
10
58
Mo. of operations of f ishing units ( in '000)
40 74 21 97
2762
44
II
4
—
Ill
—
—
IV
— 1030
Total
139 26
1032
I
43 6
1
n
37
Mi
—
IV
6 —
1
12
Total
49 4a
1
13
10 3 — —
61 16 — 21
1 25
9 13 3 11 145
125 45 63
174 132 87 110
11 23 6 26
85 122 28 103 14
53 1
15 43
153 5461 8521 935 1312 760 1753
1
25
46
402 22 59 360 843 239 158 99 666 1162
86 134 13
53 1
96 145
49 186
4760
34
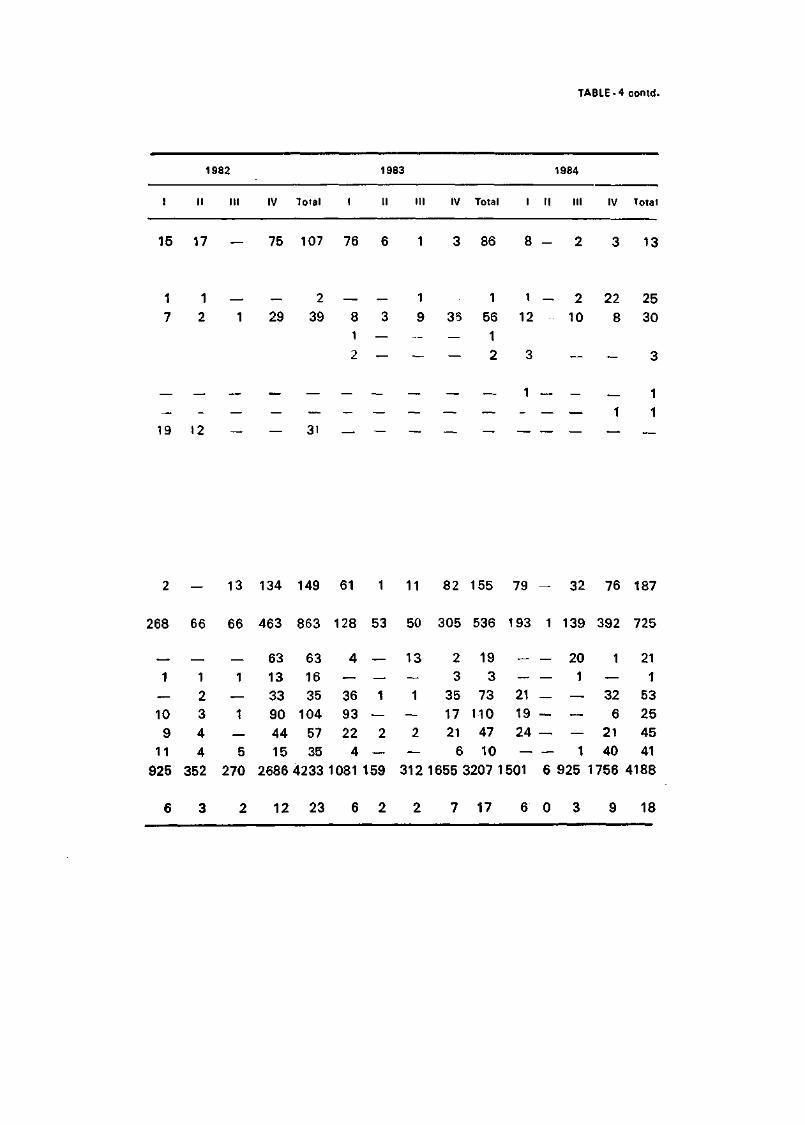
TABLE-4contd.
1982 1983 1984
I II III IV total I III IV Total I II III IV Total
15 17 — 75 107 76 6 1 3 86 8 - 2 3 13
1 1 _ _ 2 — - 1 1 1 - 2 22 25 7 2 1 29 39 8 3 9 36 56 12 - 10 8 30
1 — _ _ 1 2 — - — 2 3 __ _ . 3
_ _ _ _ _ _ _ _ _ _ 1 _ _ _. 1 _ _ _ _ _ _ _ _ _ _ _ _ _ _ _ 1 !
19 12 — — 31 — — — _ — — — __
13 134 149 61 1 11 82 155 79 32 76 187
268 66 66 463 863 128 53 50 305 536 193 1 139 392 725
— 1
—
10 9
11
— 1 2 3 4 4
— 1
—
1 —
5
63 13 33 90 44 15
63 16 35
104 57 35
4 — 36 93 22
4
— — 1
—
2 —
13 __
1 — 2
—
2 3
35 17 21
6
19 3
73 110 47 10
— — — — 21 — 19 — 24 — — —
20 1
— •
— —
1
1 — 32
6 21 40
21 1
53 25 45 41
925 352 270 2686 4233 1081159 312 1655 3207 1501 6 925 1756 4188
6 3 2 12 23 6 2 2 7 17 6 0 3 9 18
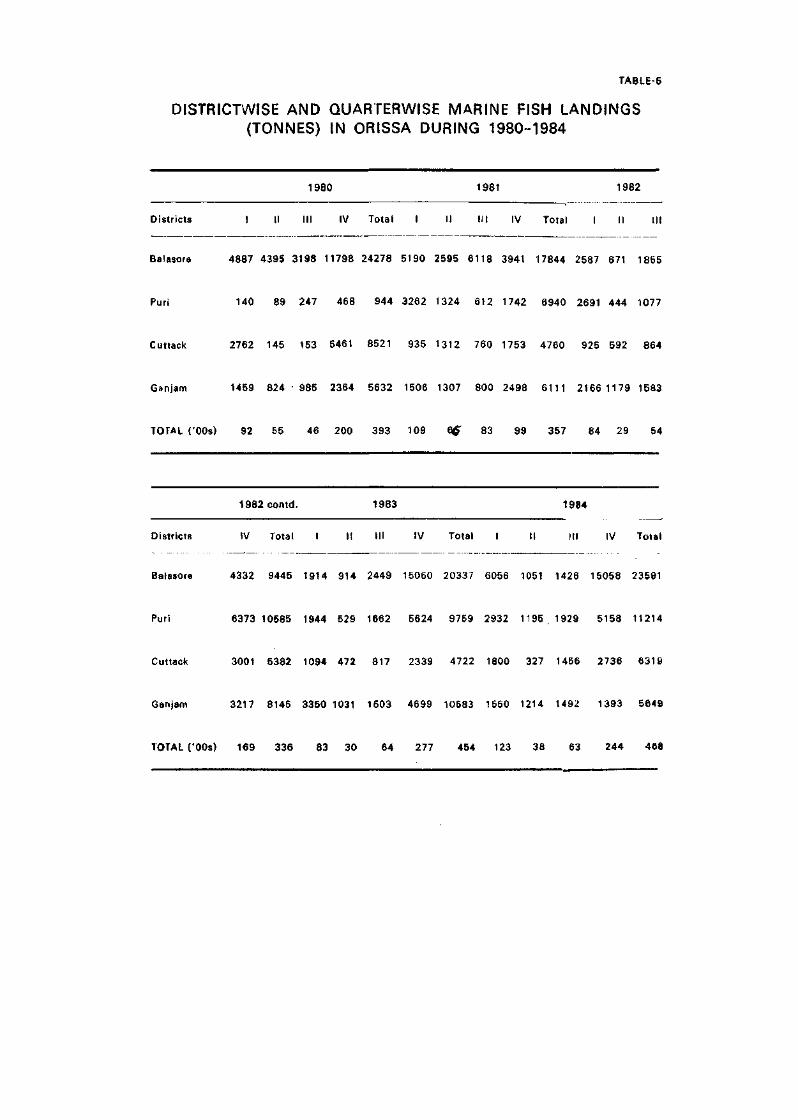
TABLE-5
DISTRICTWISE AND QUARTERWISE MARINE FISH LANDINGS (TONNES) IN ORISSA DURING 1980-1984
Districts
1980 1981 1982
III IV Total I II III IV Total I II III
Balasore 4887 4395 3198 11798 24278 5190 2595 6118 3941 17844 2587 671 1855
Puri 140 89 247 468 944 3262 1324 612 1742 6940 2691 444 1077
Cuttack 2762 145 153 5461 8521 935 1312 760 1753 4760 925 592 864
Gsnjam 1459 824 • 985 2364 5632 1506 1307 800 2498 6111 2166 1179 1583
TOTAL C00s) 92 55 46 200 393 109 S& 83 99 357 84 29 54
1982 contd. 1983 1984
Districts IV Total I II III IV Total I II III IV Total
Balasore 4332 9445 1914 914 2449 15060 20337 6056 1051 1426 15058 23591
Puri 6373 10585 1944 529 1662 5624 9769 2932 1195 1929 5158 11214
Cuttack 3001 5382 1094 472 817 2339 4722 1800 327 1456 2736 6319
Ganjam 3217 8145 3350 1031 1503 4699 10583 1550 1214 1492 1393 5649
TOTAL C00s) 169 336 83 30 64 277 454 123 38 63 244 468
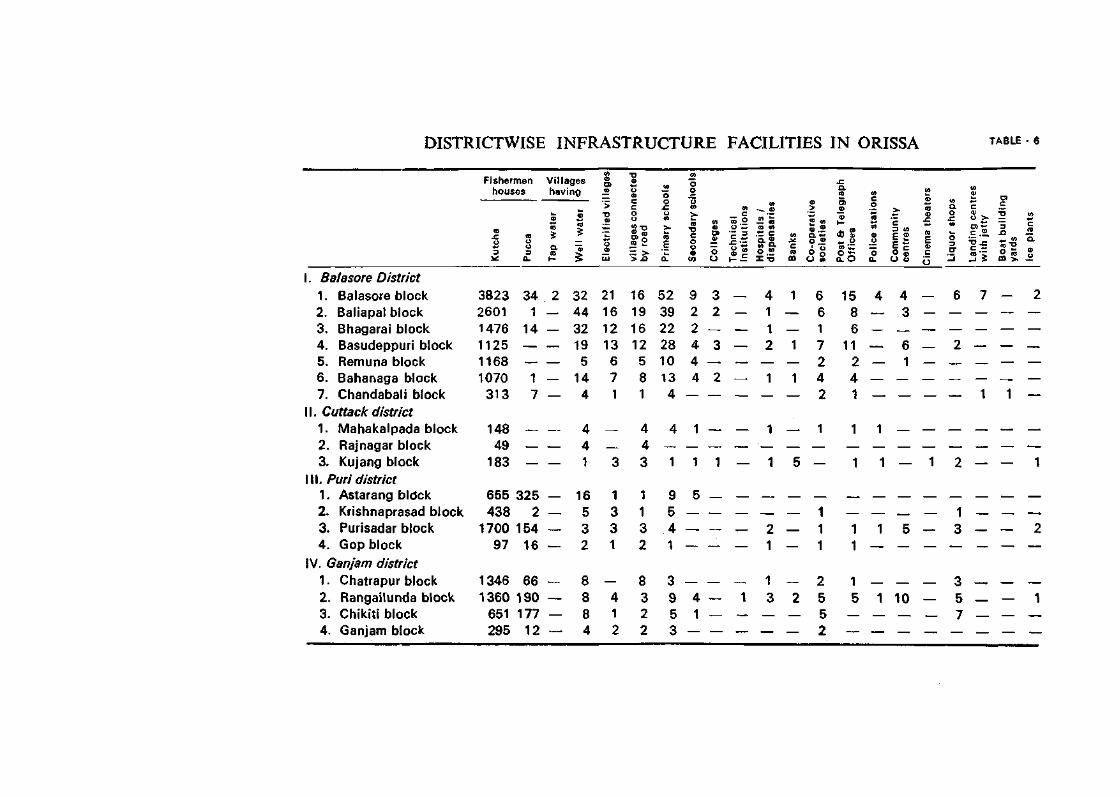
DISTRICTWISE INFRASTRUCTURE FACILITIES IN ORISSA TABLE e
1. Balasore District
1. Balasore block 2. Baliapal block 3. Bhagarai block 4. Basudeppuri block 5. Remuna block 6. Bahanaga block 7. Chandabali block
I I . Cuttack district 1. Mahakalpada block 2. Rajnagar block 3. Kujang block
I I I . Puridistrict 1. Astarang bldck 2. Krishnaprasad block 3. Purisadar block 4. Gop block
IV. Ganjam district 1. Chatrapur block 2. Rangailunda block 3. Chikit i block 4. Ganjam block
Fishermen houses
Ku
tch
a
3823 2601 1476 1125 1168 1070
313
148 49
183
CO O O Z>
34 1
14 —
— •
1 7
— — —
655 325 438 2
1700 154 97
1346
16
66 1360 190
651 295
177 12
Villages having
£ £
2 — — — — —• —
— — —
— — — —
— — — —
32 44 32 19
5 14
4
4 4 1
16 5 3 2
8 8 8 4
Ele
ctr
ifie
d v
illa
ge
s
21 16 12 13
6 7 1
— —
3
1 3 3 1
— 4 1 2
vill
ag
es
con
ne
cte
d
by
roa
d
16 19 16 12
5 8 1
4 4
3
1 1 3 2
8 3 2 2
Pri
ma
ry s
cho
ols
52 39 22 28 10 13 4
4 — 1
9 5 4 1
3
9 5 3
Se
con
da
ry s
ch
oo
ls
9 2 2 4 4 4
—
1 —
1
5
— —
— 4 1
Co
lleg
es
3 2
—
3 — 2
— •
— —
1
— —
— — —•
Te
ch
nic
al
Institu
tio
ns
— — — — —
— •
—
— — —
— —
— 1
—
Ho
sp
ita
ls /
d
isp
en
sa
rie
s
4 1
1 2
— 1
—
1 • —
1
2 1
1
3 —
Ba
nks
1 — — 1
— 1
—
— —
5
— —
—
2 —
Co
-op
era
tive
so
cie
tie
s
6 6 1 7 2 4 2
1 — —
1 1 1
2 5 5 2
I P
ost
&
Te
leg
rap
h
Off
ice
s
15 8 6
11 2 4 1
1 —
1
1 1
1 5
—
Po
lice
sta
tio
ns
4 — — — —
—
1 —
1
1 —
—
1 —
Co
mm
un
ity
ce
ntr
es
4 3
— 6 1
—
— — —
5 —
—
10 —
Cin
em
a t
he
ate
rs
— — — — —
—
— —
1
—
—
— — —
Liq
uo
r sh
op
s
6 — — 2
—
—
— —
2
1 3
—
3 5 7
La
nd
ing
ce
ntr
es
wiih
je
tty
7 — — — —
1
— — —
— —
—
—
Bo
at
bu
ild
ing
ya
rds
— — — — —
1
— — —
—
—
— — —
Ice
pla
nts
2 — — — —
—
— —
1
2 —
—
1 —
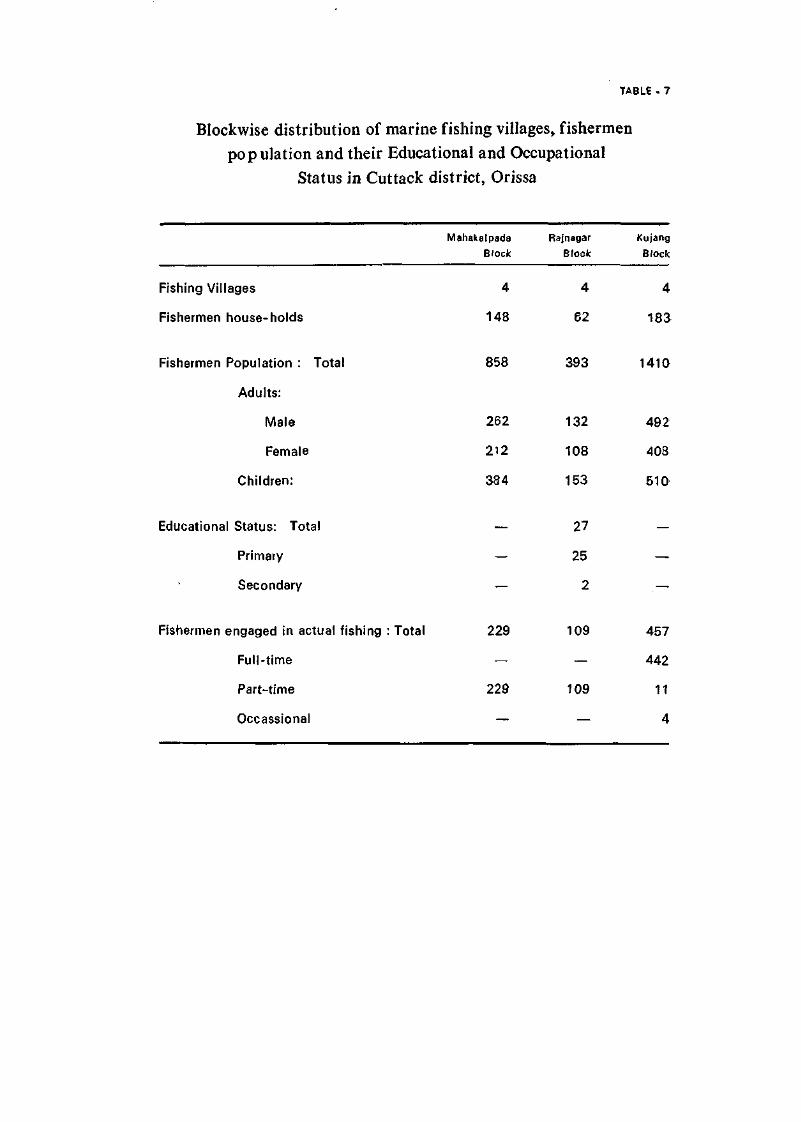
TABLE - 7
Blockwise distribution of marine fishing villages, fishermen
population and their Educational and Occupational
Status in Cuttack district, Orissa
Mahakalpada
Block
Rajnagar
Block
Kujang
Block
Fishing Villages
Fishermen house-holds
4
148
4
62
4
183
Fishermen Population : Total
Adults:
Male
Female
Children:
Educational Status: Total
Primary
Secondary
Fishermen engaged in actual fishing : Total
Full-time
Part-time
Occassional
858 393 1410
262
212
384
—
229
—
229
132
108
153
27
25
2
109
—
109
492
408
510
—
457
442
11
4
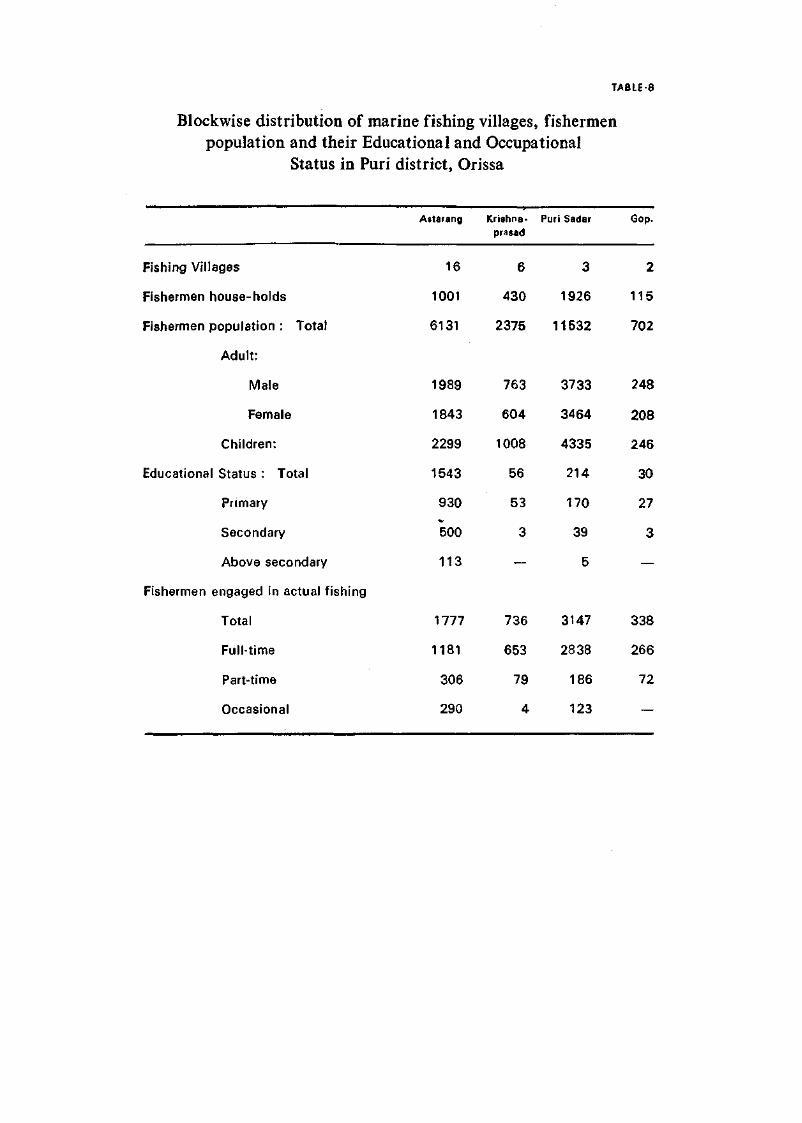
TABLES
Blockwise distribution of marine fishing villages, fishermen population and their Educational and Occupational
Status in Puri district, Orissa
Fishing Villages
Fishermen house-holds
Fishermen population : Total
Adult:
Male
Female
Children:
Educational Status : Total
Primary
Secondary
Above secondary
Fishermen engaged in actual fishing
Total
Full-time
Part-time
Occasional
Astarang
16
1001
6131
1989
1843
2299
1543
930
500
113
1777
1181
306
290
Krishna-Prasad
6
430
2375
763
604
1008
56
53
3
—
736
653
79
4
Puri Sadar
3
1926
11532
3733
3464
4335
214
170
39
5
3147
2838
186
123
Gop.
2
115
702
248
208
246
30
27
3
—
338
266
72
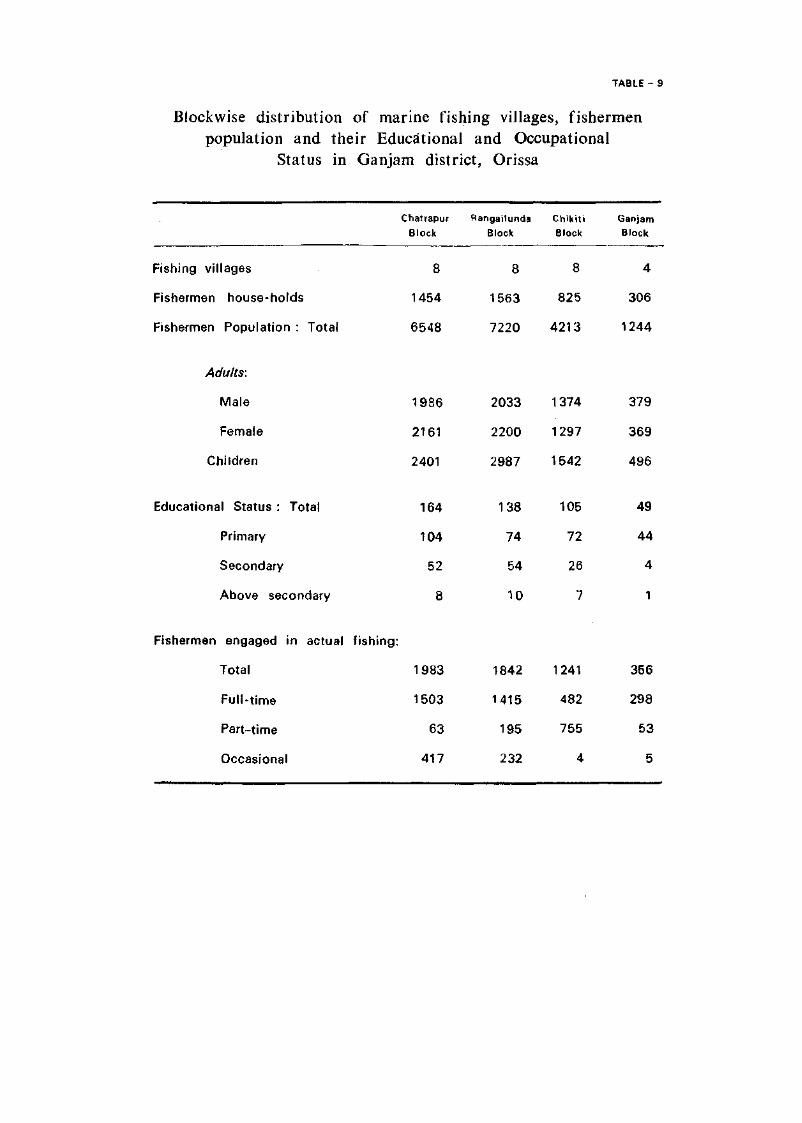
TABLE - 9
Blockwise distribution of marine fishing villages, fishermen population and their Educational and Occupational
Status in Ganjam district, Orissa
Fishing villages
Fishermen house-holds
Fishermen Population : Total
Adults:
Male
Female
Children
Educational Status : Total
Primary
Secondary
Above secondary
Chatrapur
Block
8
1454
6548
19S6
2161
2401
164
104
52
8
Rangailunda
Block
8
1563
7220
2033
2200
2987
138
74
54
10
Chik i t i
Block
8
825
4213
1374
1297
1542
105
72
26
7
Ganjam
Block
4
306
1244
379
369
496
49
44
4
1
Fishermen engaged in actual f ishing:
Total 1983
Full-t ime 1503
Part-time 63
Occasional 417
1842
1415
195
232
1241
482
755
4
356
298
53
5
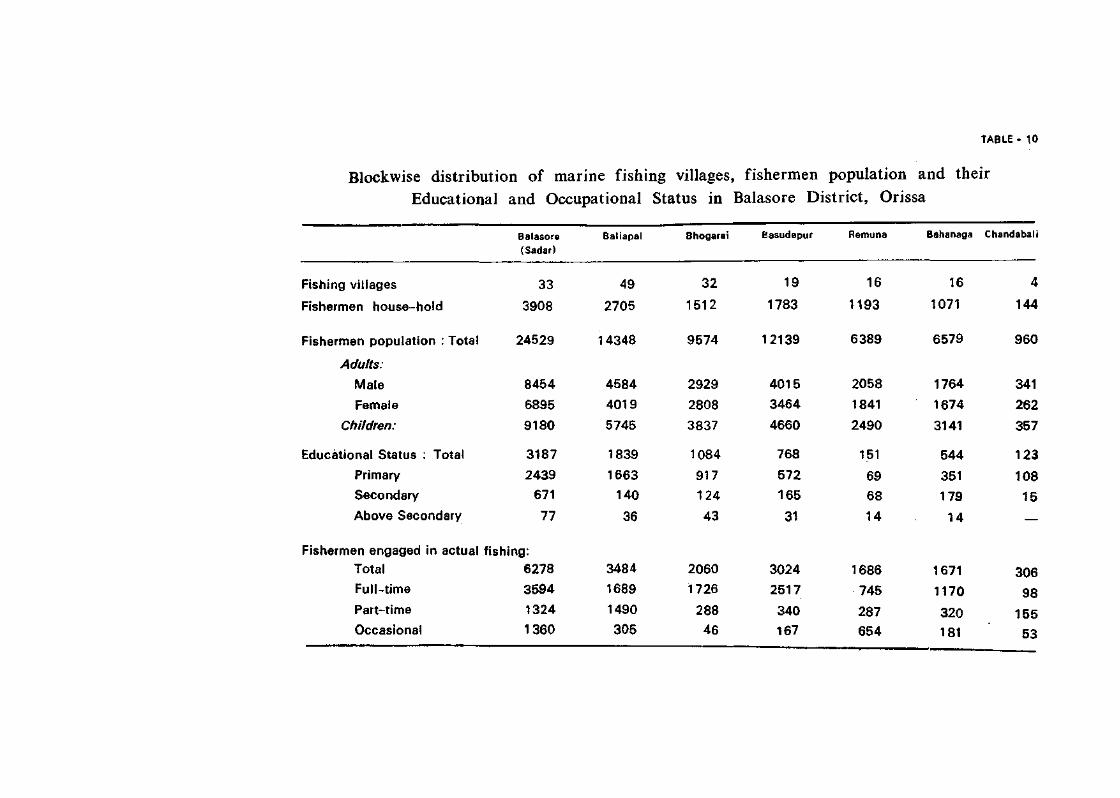
TABLE - 10
Blockwise distribution of marine fishing villages, fishermen population and their Educational and Occupational Status in Balasore District, Orissa
Fishing villages
Fishermen house-hold
Fishermen population : Total
Adults:
Male
Female
Children:
Educational Status : Total
Primary
Secondary
Above Secondary
Fishermen engaged in actual fi<
Total
Full-t ime
Part-time
Occasional
Balasore (Sadar)
33
3908
24529
8454
6895
9180
3187
2439
671
77
shing:
6278
3594
1324
1360
Baliapal
49
2705
14348
4584
4019
5745
1839
1663
140
36
3484
1689
1490
305
Bhogarai
32
1512
9574
2929
2808
3837
1084
917
124
43
2060
1726
288
46
Basudepur
19
1783
12139
4015
3464
4660
768
572
165
31
3024
2517
340
167
Remuna
16
1193
6389
2058
1841
2490
151
69
68
14
1686
745
287
654
Bahanaga
16
1071
6579
1764
1674
3141
544
351
179
14
1671
1170
320
181
Chandabali
4
144
960
341
262
357
123
108
15
—
306
98
155
53
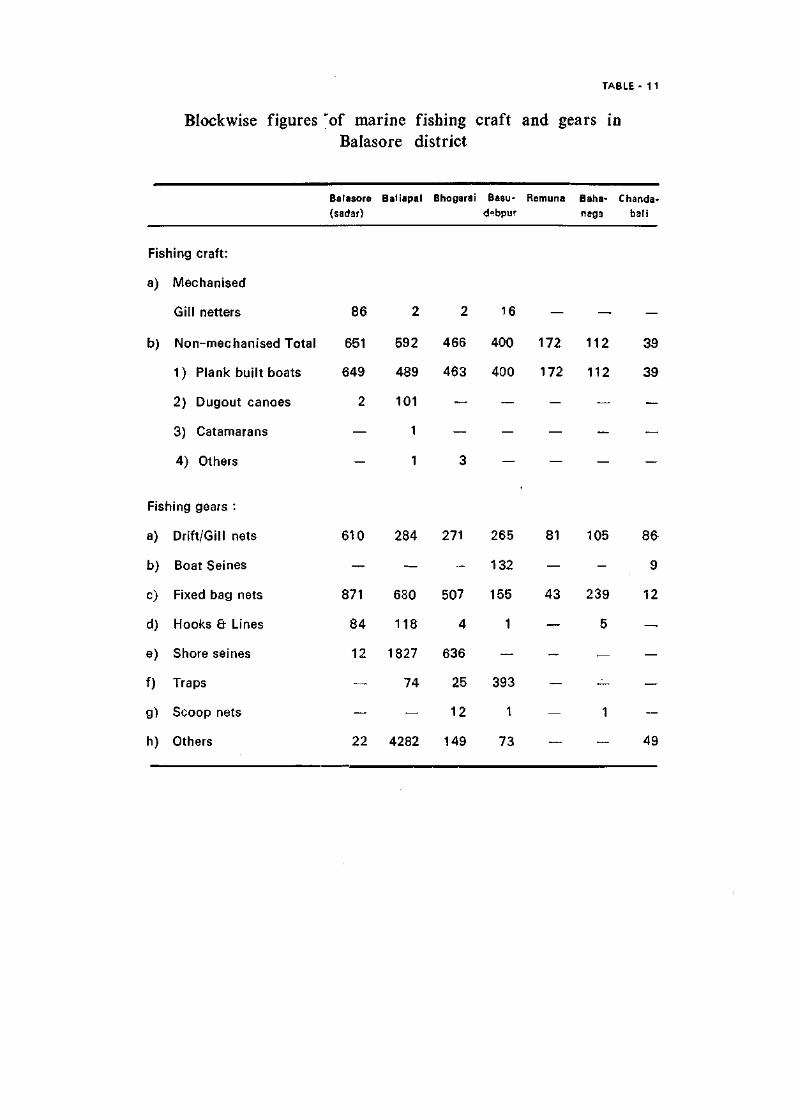
TABLE - 11
Blockwise figures 'of marine fishing craft and gears in Balasore district
Fishing craft:
a) Mechanised
Gill netters
b) Non-mechanised Total
1) Plank built boats
2) Dugout canoes
3) Catamarans
4) Others
Fishing gears :
a) Drift/Gill nets
b) Boat Seines
c) Fixed bag nets
d) Hooks & Lines
e) Shore seines
f) Traps
g) Scoop nets
h) Others
Balasore (sadar)
86
651
649
2
—
—
610
—
871
84
12
—
—
22
Baliapal
2
592
489
101
1
1
284
—
680
118
1827
74
—
4282
Bhogarai
2
466
463
3
271
._
507
4
636
25
12
149
Basu-debpur
16
400
400
—
265
132
155
1
—
393
1
73
Remuna
—
172
172
—
81
—
43
—
—
—
—
—
Baha-nag3
—
112
112
—
105
—
239
5
—
—
1
.—
Chanda-bali
—
39
39
—
86
9
12
—
—
—
—
49
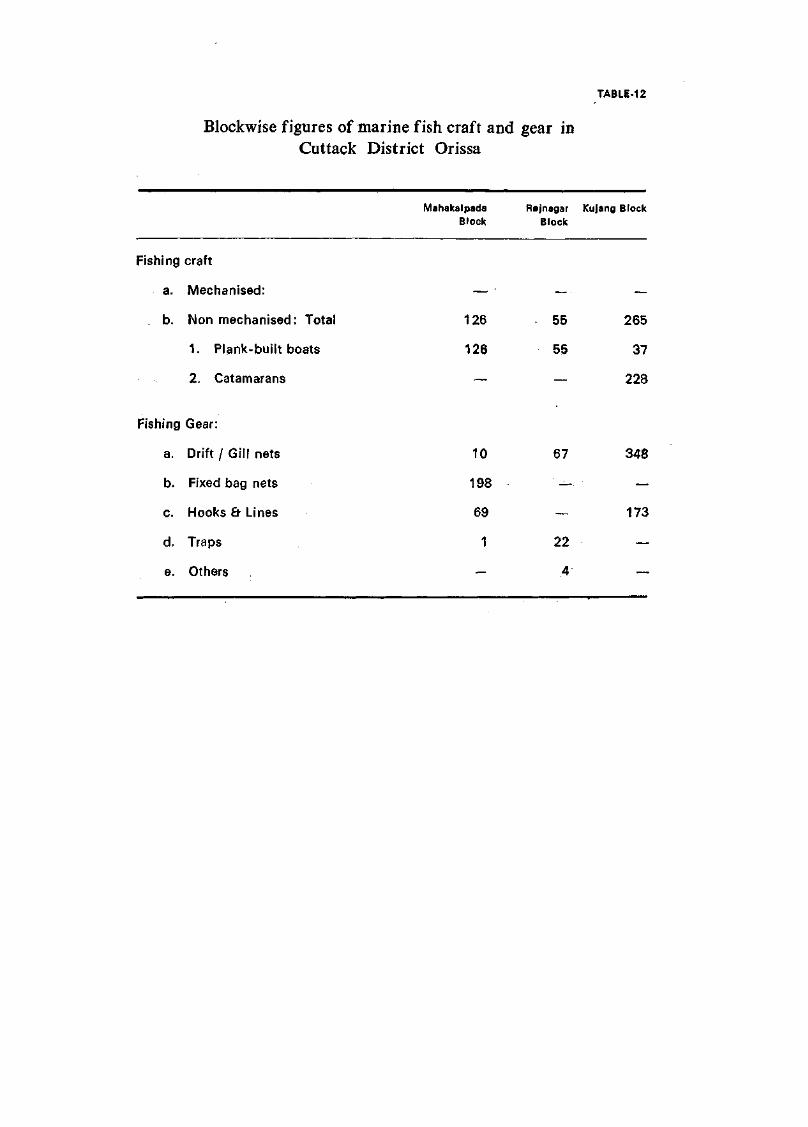
TABLE-12
Blockwise figures of marine fish craft and gear in Cuttack District Orissa
Mahakalpada Block
Rajnagar Kujang Block Block
Fishing craft
a. Mechanised:
. b. Non mechanised: Total
1. Plank-built boats
2. Catamarans
126
126
55
55
265
37
228
Fishing Gear:
a. Drift / Gill nets
b. Fixed bag nets
c. Hooks & Lines
d. Traps
e. Others
10
198
69
1
67
—
22
4
348
173
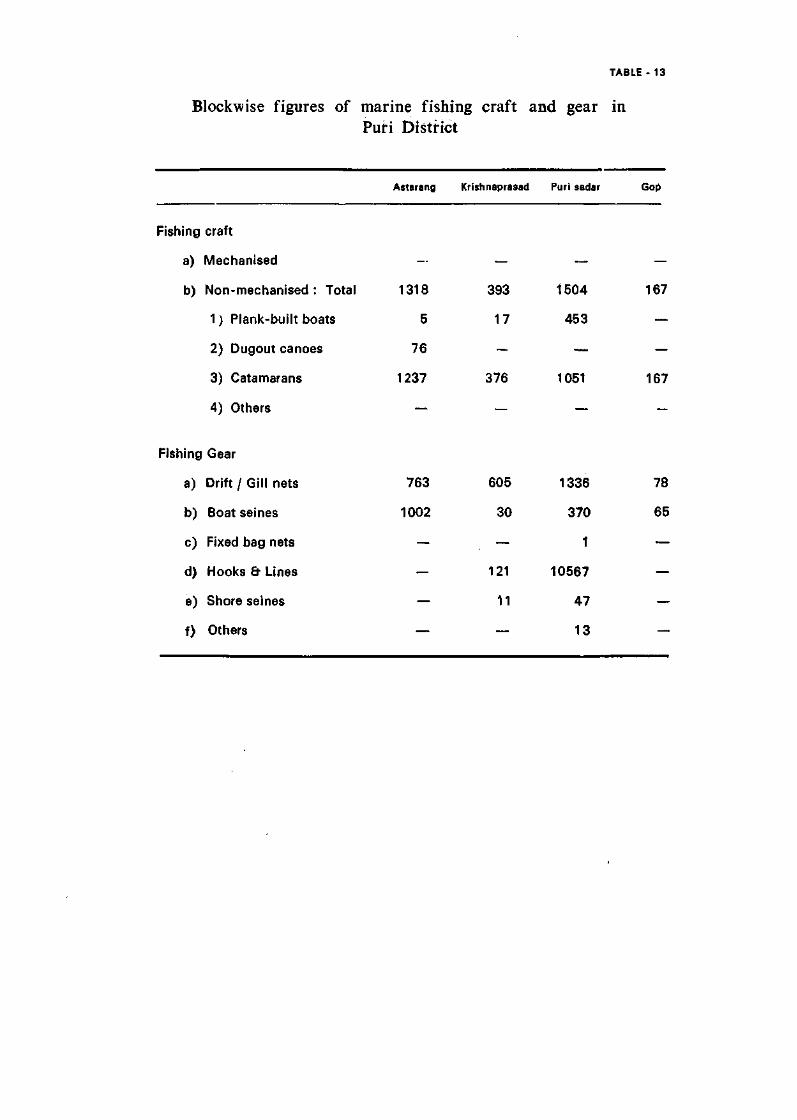
TABLE-13
Blockwise figures of marine fishing craft and gear in Puri District
Fishing craft
a) Mechanised
b) Non-mechanised : Total
1) Plank-built boats
2) Dugout canoes
3) Catamarans
4) Others
Fishing Gear
a) Drift / Gill nets
b) Boat seines
c) Fixed bag nets
d) Hooks & Lines
e) Shore seines
f) Others
Astarang
—
1318
5
76
1237
—
763
1002
—
—
—
—
Krishnaprasad
—
393
17
—
376
—
605
30
—
121
11
—
Puri sadar
—
1504
453
—
1051
—
1336
370
1
10567
47
13
Gop
—
167
—
—
167
—
78
65
—
—
—
—
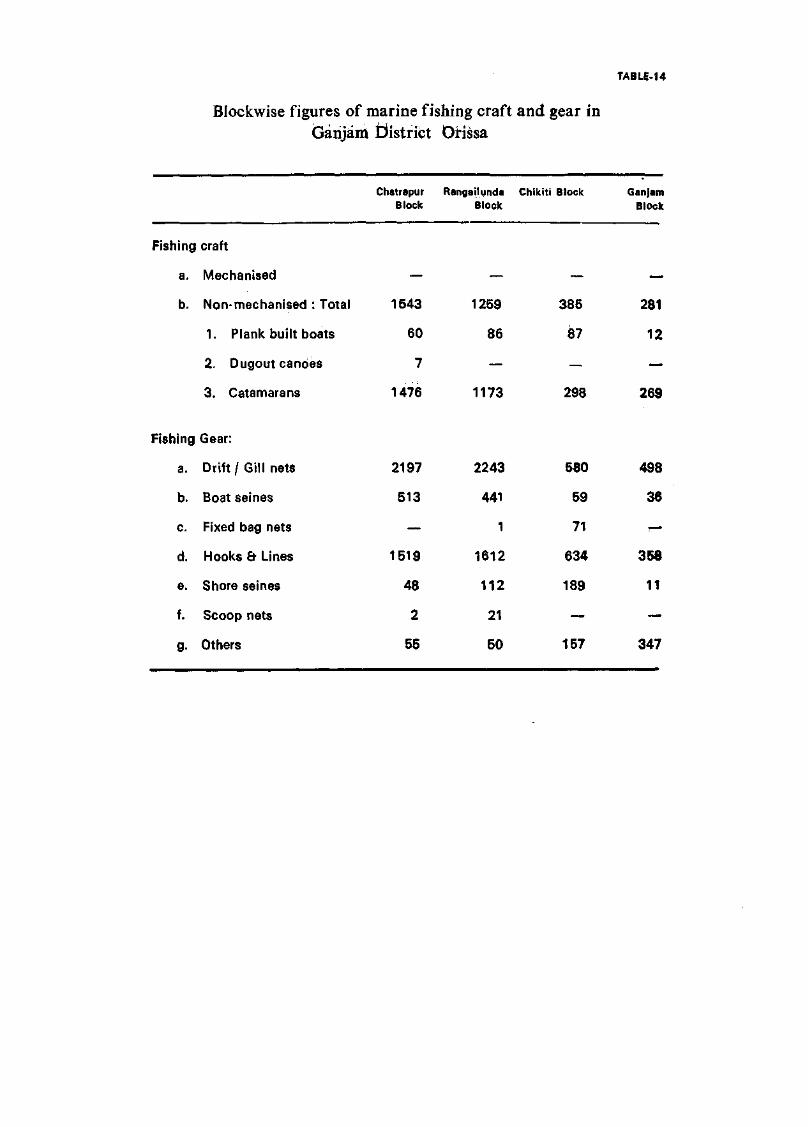
TABLE-14
Blockwise figures of marine fishing craft and gear in Garijam District Orissa
Fishing
a.
b.
Fishing
a.
b.
c.
d.
e.
f.
g-
craft
Mechanised
Non-mechanised : Total
1. Plank built boats
2. Dugout canoes
3. Catamarans
Gear:
Dri f t / Gill nets
Boat seines
Fixed bag nets
Hooks 8- Lines
Shore seines
Scoop nets
Others
Chatrapur Block
—
1543
60
7
1476
2197
513
—
1519
48
2
55
Rangailunda Block
—
1259
86
—
1173
2243
441
1
1612
112
21
50
Chikiti Block
—
385
87
—
298
580
59
71
634
189
—
157
G an jam Block
—
281
12
—
269
498
36
—
358
11
—
347
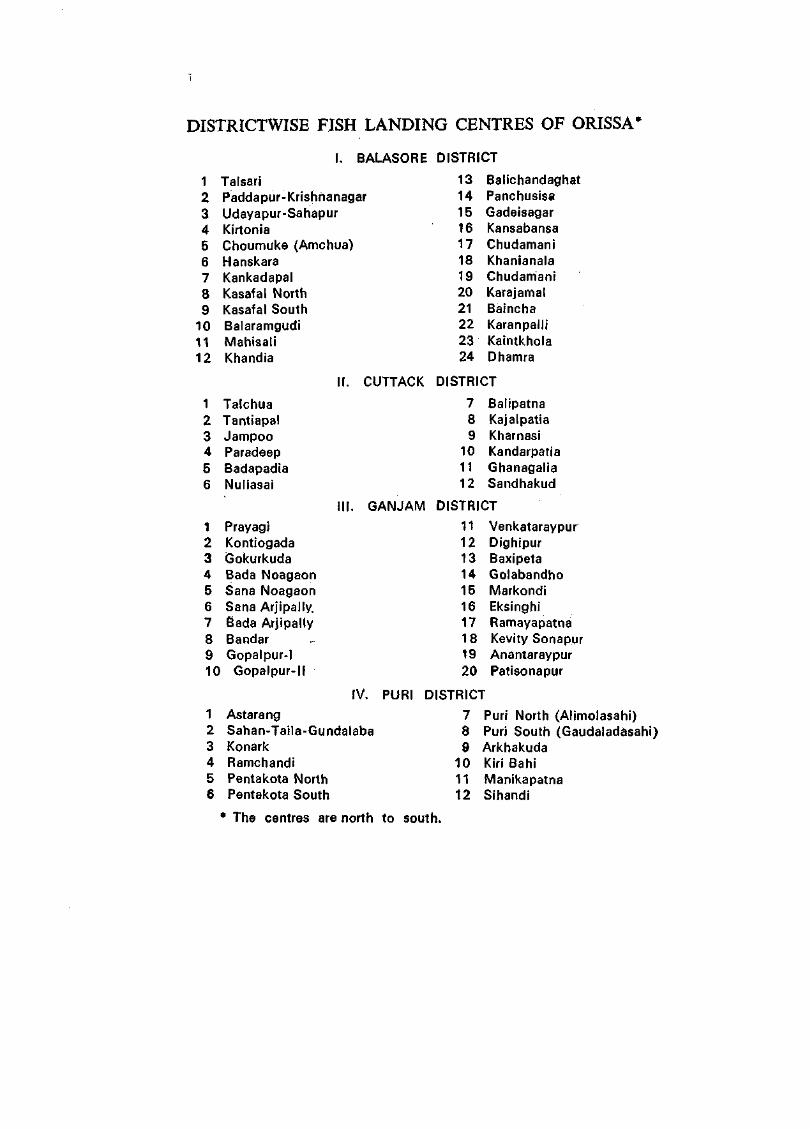
DISTRICTWISE FISH LANDING CENTRES OF ORISSA*
I. BALASORE DISTRICT
1 Talsari 2 Paddapur-Krishhanagar 3 Udayapur-Sahapur 4 Kirtonia 5 Choumuke (Amchua) 6 Hanskara 7 Kankadapal 8 Kasafal North 9 Kasafal South
10 Balaramgudi 11 Mahisali 12 Khandia
II. CUTTACK
1 Talchua 2 Tantiapal 3 Jampoo 4 Paradeep 5 Badapadia 6 Nuliasai
III. GANJAM
1 Prayagi 2 Kontiogada 3 Gokurkuda 4 Bada Noagaon 5 Sana Noagaon 6 Sana Arjipally. 7 Bada Arjipally 8 Bandar 9 Gopalpur-I 10 Gopalpur-ll
13 14 15 16 17 18 19 20 21 22 23 24
Balichandaghat Panchusisa Gadeisagar Kansabansa Chudamani Khanianala Chudamani Karajamal Baincha Karanpalli Kaintkhola Dhamra
DISTRICT
7 8 9
10 11 12
Balipatna Kajalpatia Kharnasi Kandarpatia Ghanagalia Sandhakud
DISTRICT
11 12 13 14 15 16 17 18 19 20
Venkataraypur Dighipur Baxipeta Golabandho Markondi Eksinghi Ramayapatna Kevity Sonapur Anantaraypur Patisonapur
IV. PURI DISTRICT
1 Astarang 2 Sahan-Taila-Gundalaba 3 Konark 4 Ramchandi 5 Pentakota North 6 Pentakota South
7 8 9
10 11 12
Puri North (Alimolasahi) Puri South (Gaudaladasahi) Arkhakuda Kiri Bahi Manikapatna Sihandi
* The centres are north to south.