Embed Size (px)
Citation preview

DAIRY MARKET NEWS
WEEK OF MARCH 9 - 13, 2020 VOLUME 87, REPORT 11
DAIRY MARKET NEWS AT A GLANCE
TABLE OF CONTENTS
Product Highlights/CME/DMN at a Glance 1 Weekly CME Cash Trading/Butter Markets 2 Cheese Markets 3 Fluid Milk and Cream 4 Nonfat Dry Milk/Dry Buttermilk/Dry Whole Milk 5
Dry Whey/WPC 34%/Lactose/Casein 6 U.S. Dairy Cow Slaughter/Class Milk Prices/NDPSR/Futures 7 International Dairy Market News 8 Market News Information AVT Schedule 9 March Supply and Demand Estimates 10
February CPI and PPI 12 Dairy Graphs G1 National Retail Report – Dairy Dairy Market News Contacts
CME GROUP CASH MARKETS (3/13) BUTTER: Grade AA closed at $1.8125. The weekly average for Grade AA is $1.8155 (-.0425). CHEESE: Barrels closed at $1.5000 and 40# blocks at $1.8725. The weekly average for barrels is $1.4530 (-.0660) and blocks, $1.7925 (+.0345). NONFAT DRY MILK: Grade A closed at $1.0525. The weekly average for Grade A is $1.0665 (-.0585). DRY WHEY: Extra grade dry whey closed at $.3475. The weekly average for dry whey is $.3425 (+.0040). CHEESE HIGHLIGHTS: There are obvious concerns about cheese orders regarding the coronavirus outbreak. Expectations are, and some evidence has already shown, that food service orders could take a bearish hit. Retail orders, however, could pick up as more people stock up on food supplies at their local groceries. Cheese production is busy with plentiful milk supplies. Spot milk prices are more discounted than in previous years, from $2 to $5 under Class. Inventories are steady to growing, as producers are keeping busy with the current milk availability. Cheese market tones are positive, but with caution. The CME block to barrel spread remains relatively large ($.30+ this week). BUTTER HIGHLIGHTS: Requests for cream are ramping up among Class II processors, however butterfat supply seems to be more than sufficient to meet their needs, along with churners' claims. Butter production is reported as moderate to busy across the country, while bulk stocks continue building into cold storage for later usage. Butter sales into restaurants had slowed down due to the Coronavirus outbreak, but sales into the retail sector are described as adequate to good. Nationwide, this week, bulk prices are ranging from 1 cent below the market to 7.5 cents above the market. FLUID MILK/CREAM: Farmers are saying milk output is at early spring flush in the West and moving into the Midwest. Mostly mild winter weather has been friendly to milk output, although some farmers are reporting slightly lower component levels.
Bottling demand is steady to lower, as spring break approaches. Coronavirus issues could create even more downticks for bottlers, as spring breaks are being extended across the country. Cheesemakers are finding milk at $2 to $5 under Class, which is discounted noticeably lower than it has been during week 11 in previous years. Cream is still easy to locate for butter churners and other cream end users, including ice cream manufacturers. That said, multiples have moved up in some cases. F.O.B. cream multiples are 1.05-1.20 in the East, 1.08-1.25 in the Midwest, and 1.00-1.19 in the West. DRY PRODUCTS: World events and market situations have some markets on hold, others in a bearish decline, while others have fought the trend and pushed higher this week. Low/medium heat nonfat dry milk prices shifted lower in all regions. Traders say Chinese buying remains active, but Mexican buyers are taking advantage of a hamstrung market and holding off. The buttermilk price range narrowed in the Central/East regions, while the opposite trend happened in the West. Drying time is primed for readily available condensed skim supplies. Although demand for dry whole milk is described as fair, prices took a bearish hit. Dry whey price shifts were mixed in the country this week, but mostly steady to slightly higher. There is a lot of milk available for cheese producers. Therefore, there is a lot of cheese/whey being produced and inventories are reportedly growing. Whey protein concentrate 34% markets are mixed, but prices held steady. Lactose prices are steady to slightly higher, as inventories are primarily contractually bound. Rennet and acid casein prices are steady to lower, and like with lactose, most inventories are tied up in contracts. INTERNATIONAL DAIRY MARKET NEWS: EUROPEAN OVERVIEW: WESTERN OVERVIEW: There are widespread good feelings within the Western European dairy industry that 2020 has begun on a good basis.
CONTINUED ON PAGE 1A
Commodity Commodity CommodityNDM BUTTERMILK LACTOSE
Central Low/Med. Heat 1.0700 1.2500 1.1300 1.1600 Central/East 1.1200 1.1800 Central/West 0.2400 0.4200 0.2800 0.3400
Change -0.0100 -0.0050 -0.0300 -0.0400 Change 0.0200 -0.0125 Change N.C. 0.0050 N.C. N.C.
Central High Heat 1.2500 1.3500 West 1.1200 1.1825 1.1400 1.1600 WPC 34%
Change N.C. 0.0300 Change -0.0100 0.0125 N.C. N.C. Central/West 0.9400 1.1725 0.9550 1.0750
West Low/Med. Heat 1.0500 1.2200 1.1000 1.1600 WHEY Change N.C. N.C. N.C. N.C.
Change -0.0200 N.C. -0.0300 N.C. Central 0.3200 0.4000 0.3475 0.3700 CASEIN
West High Heat 1.2200 1.3500 Change 0.0200 0.0100 N.C. N.C. Rennet 4.4500 4.5450
Change -0.0200 0.0400 West 0.2825 0.4100 0.3500 0.3900 Change N.C. -0.0025
DRY WHOLE MILK Change -0.0125 N.C. N.C. N.C. Acid 3.6275 3.8450
National 1.7000 1.8500 Northeast 0.3350 0.4100 Change N.C. N.C.
Change -0.0500 -0.0500 Change N.C. 0.0050 ANIMAL FEED WHEY
Central 0.2900 0.3100
Change N.C. N.C.
Commodity Commodity CommoditySMP WHOLE MILK POWDER BUTTER
W. Europe 2675 2850 W. Europe 3275 3400 W. Europe 3775 4100
Change -25 N.C. Change 25 25 Change N.C. 125
Oceania 2725 2850 Oceania 2925 2975 Oceania 4075 4350
Change -75 -400 Change -25 -25 Change 25 225
S. America 2650 2850 S. America 2900 3000 BUTTEROIL
Change -100 -100 Change N.C. -100 W. Europe 4725 5225
WHEY Change -125 250
W. Europe 800 1050 CHEDDAR CHEESEChange N.C. 75 Oceania 4250 4300
Change -225 -325
DAIRY MARKET NEWS PRICE SUMMARY FOR MARCH 9 - 13, 2020PRICES ($/LB) & CHANGES FROM PREVIOUS PUBLISHED PRICES
Range Mostly Range Mostly Range Mostly
DAIRY MARKET NEWS PRICE SUMMARY FOR MARCH 2 - 13, 2020PRICES ($/MT) & CHANGES FROM PREVIOUS PUBLISHED PRICES
Range Range Range

CONTINUED FROM PAGE 1
Spring is present in many Western European dairy countries. Temperatures are seasonally moderate. Production is moving upward toward the seasonal peak in April – May. The impact of coronavirus in Western Europe is still more anecdotal than quantified. Many comments are heard that dairy powders and whey are moving into export markets more slowly. This week, Italy increased quarantined areas from the region near Milan, to include the whole country. Until this increase, few disruptions had been reported about German milk moving to Italian cheese factories, or in cheese leaving factories. EASTERN OVERVIEW: Poland, the leading Eastern European milk producer, recorded a 1.9 percent increase in milk production during 2019, according to Eurostat. Other Eastern European countries reporting 2019 increases in milk production are Cyprus, Hungary, Estonia, Greece, Bulgaria, Romania, and Latvia. OCEANIA OVERVIEW: AUSTRALIA: July 2019 – January 2020 milk production in Australia decreased 3.7 percent from the corresponding previous period, according to Dairy Australia. January 2020 milk production, 731.2 million litres, was 0.5 percent higher than January 2019. NEW ZEALAND: Drought continues to be a problem for dairy producers. There was some rain last week, but not enough. Experts believe multiple rain events over many days will be required to end the drought. The Agriculture Minister of New Zealand has now expanded drought classifications to more regions. This will lead to government assistance in affected areas. Meanwhile, milk production is being adversely affected. SOUTH AMERICA OVERVIEW: The last two weeks have been mostly dry and warm in most states of Brazil, Argentina and Uruguay. Sunny skies promoted the growth of second-crop corn in southern Brazil and improved the development of summer grains in Argentina. Pasture quality is reported as fair/good in the main continental dairy basins and concentrate supplies remain readily available at inexpensive values. With enough feed and mild weather, farm milk yields continue improving across Brazil and the Southern Cone region. In this way, apart from Brazil, raw milk intakes are abundant to meet manufacturing needs within the regional dairy industry. Fluid/UHT milk demands from schools, grocery stores, and restaurants are steady to improving. NATIONAL RETAIL REPORT (DMN): The total number of dairy product advertisements decreased 3 percent for conventional, while for organic decreased 26 percent. The number of total ads for conventional cottage cheese in 16 ounces containers notably increased by 156 percent. Conventional ice cream in 48 to 64 ounce containers was the most advertised dairy product this week, with a 13 percent increase in ad numbers. The number of ads for conventional 1 pound butter decreased by 32 percent, while for organic declined 87 percent. The weighted average price for conventional 1 pound butter packages is $3.57, compared to $5.29 for organic 1 pound butter packages. MARCH SUPPLY AND DEMAND ESTIMATES (USDA, WOAB): The milk production forecast for 2020 is raised from last month on a higher expected cow inventory. The 2020 fat basis import forecast is raised from the previous month on recent trade data and stronger anticipated imports of cheese and butterfat products. The fat basis export forecast is reduced on slower expected demand in the first half of the year. On a skim-solids basis, the import forecast is raised on stronger imports of cheese, milk proteins, and several other dairy products. The skim-solids basis export forecast is raised on expectations of continued strength in international demand. Annual product price forecasts for cheese, butter, and nonfat dry milk (NDM) are lowered from the previous month. However, the whey price forecast is raised. The Class III price is reduced on the lower cheese price forecast, while the Class IV price is reduced on lower butter and NDM price forecasts. The all milk price forecast is lowered from the previous month to $18.25 per cwt.
FEBRUARY CONSUMER PRICE INDEX AND PRODUCER PRICE INDEX (BLS): The February CPI for all food is 261.9, +1.8 percent from 2019. The dairy products index is 224.4, +3.6 percent from a year ago. The following are the February to February changes for selected products: fresh whole milk is +5.8 percent; cheese, +5.3 percent; and butter, -1.3 percent. The February PPI for All Food Manufacturing is 201.0, +1.1 percent from 2019. The dairy products index is 205.3, +4.2 percent. The February to February changes for selected products: fresh whole milk is +7.8 percent; cheese, +9.5 percent; butter, -20.0 percent; and dry milk products/mixtures, .01 percent.
WEEK OF FEBRUARY 24– 28, 2020 DAIRY MARKET NEWS VOLUME 87, REPORT 9
DAIRY MARKET NEWS AT A GLANCE
-1A-

DAIRY MARKET NEWS, MARCH 9 - 13, 2020 -2- VOLUME 87, REPORT 11
NORTHEAST
For some manufacturers, butter churning declined a tad this week, as Class II cream needs strengthened in response to increasing holiday demand. Also, spot cream prices advanced, with the cream multiplier inching higher to the beat of Class II cream interest. Some butter manufacturers view the current environment through lenses that suggest an improved equilibrium between butter output and butter demand. As such, lighter cream availability slows the pace of unintentional stock buildup for some. With that said, demand varies from adequate to good. Additional retail stores plan to feature holiday butter ads soon, as orders continue to develop. Bulk sales are slowing, but holding last week's range of 4 to 7 cents over the market, based on the CME with various time frames and averages used. Retail promotional activity for conventional print butter shows a 28 percent increase in the Northeast and 196 percent rise in the Southeast. Ads grew 7 percent countrywide. Prices for: Eastern U.S., All First Sales, F.O.B., Grade AA, Conventional, and Edible Butter Bulk Basis Pricing - 80% Butterfat $/LB: +0.0400 - +0.0700 Secondary Sourced Information: CME TRADING The CME Group's Tuesday cash butter price closed at $1.8175, down from $1.8600 a week ago.
CENTRAL
Butter producers are reporting more promising demand tones. Spring holiday demand expectations are beginning to come to fruition. Butter is available in bulk, but prices did see a shift higher this week after months of slow to slight price movements. Butter production is moderate to busy, depending on the producer and area of the region. Cream is still readily available for butter churning. Most late-week cream multiples are unchanged. However, ice cream production increases have begun to push more cream into Class II facilities. Butter market tones saw some improvement last week with the new crop butter rule on the CME. Butter markets have definitely seen improvements from the high $1.60s prices of late February. Nevertheless, coronavirus has most DMN contacts questioning expectations of all markets, including butter. One presumption is a potential uptick in retail demand, while food service (restaurant) demand takes a bearish hit.
Prices for: Central U.S., All First Sales, F.O.B., Grade AA, Conventional, and Edible Butter Bulk Basis Pricing - 80% Butterfat $/LB: -0.0100 - +0.0700
WEST
In the West, retail orders are slowly coming off of the last two weeks' peak demand period caused by the coronavirus outbreak. Food service sales are down as some people avoid going to crowded public places. Cream availability has tightened up a bit because some ice cream producers have started to take a few loads of cream. However, cream churning is active, and butter manufacturers don't have any issue with getting their cream needs filled. As the next holiday is around the corner, the expectation is that more cream will go to holiday dairy product manufacturing. Butter stocks are unchanged from the previous week. Bulk butter prices are unchanged from a week ago. Prices for: Western U.S., All First Sales, F.O.B., Grade AA, Conventional, and Edible Butter Bulk Basis Pricing - 80% Butterfat $/LB: 0.0000 - +0.0750
Secondary Sourced Information:
2020 U.S. Butter and Milkfat Exports (USDA-FAS) 2020 Exports % Change From (Million Lb.) 1 Year Ago January 4.0 - 22 Exports – Destination Country 1 Canada 2.1 +3 2 Mexico 0.7 +112 3 South Korea 0.3 +16 4 Saudi Arabia 0.3 - 76 5 Taiwan 0.2 +49
CONTINUED ON PAGE 2A
BUTTER MARKETS
NOTICE: Five days of trading information can be found at www.cmegroup.com/trading/agricultural/spot-call-data.html
Prices shown are in U.S. dollars per lb. in carlot quantities. Carlot unit weights: CHEESE, 40,000-44,000 lbs.; NONFAT DRY MILK, 41,000-45,000 lbs.; BUTTER, 40,000-43,000 lbs.;DRY WHEY, 41,000-45,000 lbs. Weekly Change is the sum of Daily Price Changes. Weekly Average is the simple average of the Daily Cash Close prices for the calendar week. Weekly Average Change is the difference between current and previous Weekly Average. Computed by Dairy Market News for informational purposes. This data is available on the Internet at WWW.AMS.USDA.GOV/MARKET-NEWS/DAIRY
CME GROUP
COMMODITY MONDAY MAR 9
TUESDAY MAR 10
WEDNESDAY MAR 11
THURSDAY MAR 12
FRIDAY MAR 13
:: WEEKLY CHANGE
:: WEEKLY AVERAGE
CHEESE
BARRELS $1.4100 (-0.0675)
$1.4100 (N.C.)
$1.4550 (+0.0450)
$1.4900 (+0.0350)
$1.5000 (+0.0100)
:: ::
(+0.0225)
:: ::
$1.4530 (-0.0660)
40 POUND BLOCKS $1.7600 (+0.0100)
$1.7600 (N.C.)
$1.7600 (N.C.)
$1.8100 (+0.0500)
$1.8725 (+0.0625)
:: ::
(+0.1225)
:: ::
$1.7925 (+0.0345)
NONFAT DRY MILK
GRADE A $1.0825 (-0.0325)
$1.0800 (-0.0025)
$1.0675 (-0.0125)
$1.0500 (-0.0175)
$1.0525 (+0.0025)
:: ::
(-0.0625)
:: ::
$1.0665 (-0.0585)
BUTTER
GRADE AA $1.8175 (-0.0375)
$1.8175 (N.C.)
$1.8175 (N.C.)
$1.8125 (-0.0050)
$1.8125 (N.C.)
:: ::
(-0.0425)
:: ::
$1.8155 (-0.0425)
DRY WHEY
EXTRA GRADE $0.3325 (-0.0150)
$0.3375 (+0.0050)
$0.3475 (+0.0100)
$0.3475 (N.C.)
$0.3475 (N.C.)
:: ::
(N.C.)
:: ::
$0.3425 (+0.0040)

DAIRY MARKET NEWS, MARCH 9 - 13, 2020 -2- VOLUME 87, REPORT 11
-2A-
CONTINUED FROM PAGE 2
Secondary Sourced Information: 2020 U.S. Butter and Milkfat Imports (USDA-FAS) (Imports for Consumption) 2020 Imports % Change From (Million Lb.) 1 Year Ago January Imports Total Butter, Fats, Milk (H.S. Code 0405) 9.3 + 30 Butter Quota (H.S. Code 405101000) 1.3 + 270 Over Quota (H.S. Code 405102000) 2.2 - 51 AMF Quota (H.S. Code 405901020) 0.4 + 86 Over Quota (H.S. Code 405902020) 2.5 + 29 Other Milk Fat 3.0 + 870 2020 Imports % Change From (Million Lb.) 1 Year Ago TOTAL, JAN – JAN 9.3 + 30 Imports – Country of Origin 1 India 2.9 + 1183 2 Ireland 2.0 - 47 3 Mexico 1.6 + 23 4 Chile 0.9 + 31 5 France 0.8 + 258

DAIRY MARKET NEWS, MARCH 9 - 13, 2020 VOLUME 87, REPORT 11
CHEESE MARKETS
NORTHEAST
Northeast cheese production is strong in the region. Mozzarella and provolone production schedules are stable. Manufacturers’ cheese inventories are steady to growing. The Coronavirus continues to heavily impact the industry. There are reports cheese orders from the retail sector have increased as customers are stocking up on products. Food service sales are, however, prone to be lower as fewer consum-ers are going to restaurants. Cheese prices are lower on various mar-ket exchanges. There are reports some international markets that have been affected by the virus are preparing to make tariff exemp-tions for cheese. In the Northeast, the wholesale cheese prices for both cheddar and Muenster increased $0.0125. However, the process cheese prices dipped $0.0700. The Grade A Swiss price dropped $0.1200 following the release of the February 2020 Announcement of Class and Component Prices, although the Class III skim milk price for February 2020 saw a 42 cents incline.
WHOLESALE SELLING PRICES: DELIVERED
DOLLARS PER POUND(MIXED LOTS (1000-5000 POUNDS)) Cheddar 40 pound Block 2.2150-2.5025 Muenster 2.2025-2.5525 Process American 5 pound Sliced 1.6750-2.1550 Swiss 10-14 pound Cuts 3.6100-3.9325
Secondary Sourced Information: This week, a cooperative export assistance program accepted re-quests for export assistance to sell 738,549 pounds (335 metric tons) of cheese.
MIDWEST
Midwestern cheese producers are reporting generally steady, if not tepid, cheese demand. Notably, coronavirus issues are not directly affecting Midwestern cheesemakers, according to some. There are concerns and/or expectations of food service requests lessening, but retail demand could improve, as more people are staying in. Cheese inventory reports range from growing to long. Milk is available, and the volume of offers has increased. That said, the mid-week price range is similar to last week's at this point. Cheese market tones are far from steady. Not only have prices slouched, but the block to bar-rel price gap on the CME is riding the, until recently, record breaking $.35 line this week. Midwestern wholesale prices are down $.1200 for Swiss cuts, down $.0700 for process, but up $.0125 for all other types. WISCONSIN WHOLESALE SELLING PRICES: DELIVERED DOLLARS PER POUND(MIXED LOTS (1000-5000 POUNDS)) Blue 5 pounds 2.3975-3.4675 Brick 5 pounds 2.1300-2.5550 Cheddar 40 pound Block 1.8525-2.2525 Monterey Jack 10 pounds 2.1050-2.3100 Mozzarella 5-6 pounds 1.9300-2.8750 Muenster 5 pounds 2.1300-2.5550 Process American 5 pound Loaf 1.6050-1.9650 Swiss 6-9 pound Cuts 3.1250-3.2425
WEST
Western cheesemakers say demand has been steady. Retail orders are strong, but food service has been a bit slower. With an abundance of milk, cheese plants are running near full capacity. Some processors relay that they would take in more milk if they could, however, they do not have the space for any extra loads. Industry contacts suggest block cheese inventories are in balance. There are more barrels avail-
-3-
able. End users say they are getting steady offers from manufacturers, but these offers are not large lot sizes.
WHOLESALE SELLING PRICES: DELIVERED DOLLARS PER POUND(MIXED LOTS (1000-5000 POUNDS))
Cheddar 10 pound Cuts 2.0900-2.2900 Cheddar 40 pound Block 1.8425-2.3325 Monterey Jack 10 pounds 2.0775-2.3525 Process American 5 pound Loaf 1.6225-1.8775 Swiss 6-9 pound Cuts 3.2075-3.6375
***UPDATE*** WEEK 10 WEST CHEESE REPORT
In the West, cheese production remains active as low-cost milk con-tinues to flow to the vats. Domestic cheese sales are mostly stable to increasing, especially for blocks. Some U.S. processors are sending export shipments without any inconvenience; whereas, others are hav-ing logistic issues while trying to move cheese to the final destination. Current affordable cheese prices are attracting some international buy-ers to want to take more loads. Generally, cheese stocks are readily available to meet all buying needs. The coronavirus outbreak contin-ues to bring more uncertainty into the cheese market. In the West, wholesale prices were up $.0025 for process, but down $.0500 for cheddar block, cuts and Monterey Jack. Swiss cut wholesale prices are unchanged from the previous week.
WHOLESALE SELLING PRICES: DELIVERED DOLLARS PER POUND(MIXED LOTS (1000-5000 POUNDS))
Cheddar 10 pound Cuts 2.0775-2.2775 Cheddar 40 pound Block 1.8300-2.3200 Monterey Jack 10 pounds 2.0650-2.3400 Process American 5 pound Loaf 1.6925-1.9475 Swiss 6-9 pound Cuts 3.3275-3.7575
FOREIGN TYPE
Since the first occurrence of the coronavirus in Germany and other European countries, retail demands for sliced cheese have been higher than usual. As large events are cancelled in hotels, their usage of cheese is declining. The outflows of sliced cheese to international markets are unchanged from a week ago. However, logistic costs have become more expensive due to the limited availability of containers. In Southern Europe, there is uncertainty about how the number of holiday guests will develop in the upcoming months and how this will affect the cheese market. Sliced cheese stocks remain low. In the spot market, prices are inconsistent, and prices negotiations have in-creased. U.S. domestic prices for blue, gorgonzola, parmesan, and Romano are up $.0125 when compared to last week prices, whereas Swiss cheese prices are down $.1200. All other cheese prices in the table below are steady.
WHOLESALE SELLING PRICES: FOB DISTRIBUTORS DOCK DOLLARS PER POUND (1000 - 5000 POUNDS, MIXED LOTS)
: NEW YORK VARIETY : IMPORTED : DOMESTIC : : Blue : 2.6400-5.2300 : 2.2750-3.7625* Gorgonzola : 3.6900-5.7400 : 2.7825-3.5000* Parmesan : -0- : 3.6625-5.7525* Romano : -0- : 3.4650-5.6200* Sardo Romano (Argentina) : 2.8500-4.7800 : -0- Reggianito (Argentina) : 3.2900-4.7800 : -0- Jarlsberg : 2.9500-6.4500 : -0- Swiss : -0- : 3.6475-3.9700* Swiss (Finland) : 2.6700-2.9300 : -0- * = Price change.
CONTINUED ON PAGE 3A

DAIRY MARKET NEWS, MARCH 9 - 13, 2020 VOLUME 87, REPORT 11
CHEESE MARKETS
-3A-
CONTINUED FROM PAGE 3
***UPDATE*** WEEK 10 FOREIGN TYPE REPORT
In Germany and other European countries, sliced cheese sales are being impacted by the coronavirus outbreak. End-users are increasingly step-ping up and stocking on food, including sliced cheese. As the result, the food retail sector demands for sliced cheese are higher than usual. Requests from other domestic sectors, as well as from the international market, are at normal levels. The logistic costs for exported cheese have augmented due to restricted numbers of available containers. In southern Europe there is uncertainty about how many holiday guests will be visiting in the coming months and how that will impact the cheese market. Cheese holdings in warehouses are still low. According to industry contacts, spot prices are inconsistent. U.S. domestic prices for blue, gorgonzola, parmesan, and Romano have declined by $.0500 compared to a week ago. All other cheese prices in the table below are unchanged.
WHOLESALE SELLING PRICES: FOB DISTRIBUTORS DOCK DOLLARS PER POUND (1000 - 5000 POUNDS, MIXED LOTS)
: NEW YORK VARIETY : IMPORTED : DOMESTIC : : Blue : 2.6400-5.2300 : 2.2625-3.7500* Gorgonzola : 3.6900-5.7400 : 2.7700-3.4875* Parmesan : -0- :. 3.6500-5.7400* Romano : -0- : 3.4525-5.6075* Sardo Romano (Argentina) : 2.8500-4.7800 : -0- Reggianito (Argentina) : 3.2900-4.7800 : -0- Jarlsberg : 2.9500-6.4500 : -0- Swiss : -0- : 3.7675-4.0900 Swiss (Finland) : 2.6700-2.9300 : -0- * = Price change.
COLD STORAGE
WEEKLY COLD STORAGE HOLDINGS - SELECTED STORAGE CENTERS IN THOUSAND POUNDS - INCLUDING GOVERNMENT STOCKS
: BUTTER CHEESE 03/09/2020 : 74390 : 76851 03/01/2020 : 73288 : 76387 CHANGE : 1102 : 464 % CHANGE : 2 : 1
2020 U.S. Cheese and Curd Imports (USDA-FAS)
(Imports for Consumption) 2020 Imports % Change From January Imports (Million Lb.) 1 Year Ago TOTAL Cheese and Curd (H.S. Code 0406) 28.3 + 2 Cheese, Except Fresh (H.S. Code 040690) 25.5 + 5 Fresh Cheese (H.S. Code 040610) 1.2 + 17 Cheese, Processed (H.S. Code 040630) 0.9 - 41 Cheese, Blue-Veined (H.S. Code 040640) 0.6 - 18 2020 Imports % Change From (Million Lb.) 1 Year Ago TOTAL, JANUARY 28.3 + 2 Imports - Country of Origin 1 Italy 6.6 + 27 2 France 2.8 - 20 3 Canada 2.2 + 77 4 Nicaragua 2.1 + 35 5 Switzerland 2.0 + 28
2020 U.S. Cheese and Curd Exports (USDA-FAS)
2020 Exports % Change From (Million Lb.) 1 Year Ago January 61.7 ... TOTAL, JANUARY 61.7 ... Exports – Destination Country 1 Mexico 18.8 + 21 2 South Korea 9.0 - 16 3 Australia 4.9 ... 4 Japan 4.8 - 16 5 Chile 2.3 + 6

DAIRY MARKET NEWS, MARCH 9 - 13, 2020 VOLUME 87, REPORT 11
Milk is available in the Northeast. Farm milk output continues to increase. There are some balancing operations receiving comfortable milk volumes, as other plants are receiving stronger milk volumes. Class I sales are fairly level this week. Class III manufacturers continue to clear steady milk volumes at this time. Mid-Atlantic milk production is slightly up. Manufacturing plants are receiving stable milk volumes. Southeast milk production is picking up in the area. Class I sales have also increased as some bottlers have added onto their regular orders. There are a few milk loads clearing to manufacturers. Florida milk production is climbing at a moderate pace, but milk output is not at its peak yet. Class I sales have remained slightly up. Cream market conditions are fairly unchanged. Spot loads are readily available in some areas. Spot demand is somewhat outweighed by supplies. Butter churns are running fairly strong in a few operations. Cream multiples are ranging 1.05-1.20 this week. Condensed skim is showing weakness in the market. Manufacturers’ inventories are growing and surpassing customers’ current interests. Northeastern U.S., F.O.B. Condensed Skim Price Range - Class II; $/LB Solids: 0.70 - 0.90 Price Range - Class III; $/LB Solids: 0.55 - 0.85 Northeastern U.S., F.O.B. Cream Multiples Range - All Classes: 1.0500 - 1.2000 Price Range - Class II; $/LB Butterfat: 1.9509 - 2.2296
MIDWEST Milk production continues to remain or steadily increase farm to farm. With spring nearing, spring flush level milk is already upon the Western region and moving toward the Central United States. Bottlers are already slower, and spring break extensions in the Southern portion of the region (due to coronavirus) are not expected to help demand. Cheese producers have reported plentiful, if not more than plentiful, milk supplies. Offers are voluminous and prices continued to decline on the bottom end of the spot milk range. During this same week in 2017, prices did reach the current $5 discounts, but the last two years did not near that mark. Last year, spot milk prices ranged from $.50 to $2 under, while in 2018 prices were $1 over to $3 under during week 11. With bottling demand lighter, milk availability is not expected to diminish shortly. Cream reports were mostly similar to last week, with some slight upticks on the bottom of the multiples range. Ice cream producers have begun to enter the fray, but they are not making a huge dent, yet. That said, they are taking on cream early in the week, as multiples remain higher on the top of the range. Condensed skim is widely available from Western or Eastern suppliers. Last year at this time, farmers in the upper Midwest were recovering from a tough late winter. The end of winter this year could not be more different. Many contacts have continually suggested winter situations were mostly mild in 2019/20. Feed quality is in question, but right now dairy farmers say their feed situation is adequate. Price Range - Class III Milk; $/CWT; Spot Basis: -5.00 - -2.00 Trade Activity: Slow Midwestern U.S., F.O.B. Cream Multiples Range - All Classes: 1.0800 - 1.2500 Price Range - Class II; $/LB Butterfat: 2.1739 - 2.3225 Multiples Range - Class II: 1.1700 - 1.2500
WEST California milk component levels are a bit down. Milk availability continues to be up. Milk production is steady to up. Bottled milk sales are steady. Class II demand is increasing. Manufacturing plants continue to run at full capacities. In Arizona, milk output is high. Schools are currently closed for spring break. Therefore, Class I intakes are lower. Repair projects at one plant are causing an increase in cream loads in the region and forcing a few processors to look for help with cream clearing in Texas. Arizona processors are being offered out-of-state milk, condensed skim, and cream. However, they are only helping whenever possible. The production of some Class II dairy products has started to increase in light of the upcoming holiday. In New Mexico, milk supplies are up, whereas sales are down. Class I and II sales have declined, but Class II requests are steady to slightly up. With the spring break in some areas, several schools have not ordered milk this week. More milk was moved to balancing plants for clearing. The weather continues to favor the production of milk in New Mexico. Milk production in the Pacific Northwest is strong. Manufacturers report milk intakes are already keeping the plants full without taking in additional loads of milk. Bottling demand has decreased due to school closings. Some educational institutions are on spring break. Some have closed in efforts to control the spread of the coronavirus. In either case, the reduced bottling demand is creating new challenges to place and process milk. In the mountain states of Idaho, Utah, and Colorado, milk intakes are still above processing capacity. Some processors have implemented base programs to try to control the milk supply. A few industry contacts think these efforts have helped flatten the volume of milk intakes. However, discounted milk at $7 below Class IV is common in Idaho. In addition, there are rumors of more milk being discarded within the state. Condensed skim processing is very active in the western dairy market. Some loads are being moved from California to Arizona for processing. The cream market is generally steady to a bit balanced in the West. Supplies have tightened up in some areas. Unlike last week, several processors are not receiving unsolicited cream offers this week. Most of the cream loads are finding homes. Cream multiples have moved up by .0200 this week. Western U.S., F.O.B. Cream Multiples Range - All Classes: 1.0000 - 1.1900
-4-
EAST
FLUID MILK AND CREAM

DAIRY MARKET NEWS, MARCH 9 - 13, 2020 VOLUME 87, REPORT 11
NONFAT DRY MILK, BUTTERMILK & WHOLE MILK
Prices represent carlot/trucklot quantities for domestic and export sales packaged in 25 kg. or 50 lb. bags, or totes, spray process, dollars per pound.
NONFAT DRY MILK - CENTRAL AND EAST
CENTRAL: Nonfat dry milk (NDM) trading was slower, as prices are facing bearish pressure. Nonfat drying is ongoing, with the exception of some maintenance glitches being the only setbacks. Condensed skim is entering the region from both the East and the West, and prices are noticeably discounted. Inventories are available, as offers are reportedly buyer-friendly. High heat trading was quiet, as it has been within the region. High heat NDM prices saw some shifts higher on the top of the range, with bakeries entering the fray. Contacts say early in the year, price points around $1.10/lb were unexpected in 2020. At that time, the coronavirus epidemic was unforeseen. Obviously, things have changed and analysts/contacts say the current situation is murky. EAST: Nonfat dry milk (NDM) prices shifted lower in the range and mostly series. As additional milk channels to Class II manufacturing, NDM dipped from the previous week's production volumes. Nonetheless, the current output still advances inventory levels in the region, due to sluggish demand triggered by factors relating to the coronavirus. As the bearish NDM market trend continues, buyers in the market are choosing to wait and see how low the price will go. Sources noted, market disruptions are occurring as speculative traders are uncertain whether to be in or out of the market. Meanwhile, there are some manufacturers who are still sitting on upper limit prices, expecting actions that cut the impact of the virus to prompt needed price support. That may be unlikely, with recent news of the virus's official elevation to pandemic status. Hence, the low/medium heat NDM market transmits a volatile undertone. High heat NDM prices are higher at the top of the range. Demand is perking as spring baking interest develops. A few manufacturers are drying high heat NDM as customer orders pick up. Inventories are light to sufficient. Prices for: Eastern and Central U.S., All First Sales, F.O.B., Extra Grade & Grade A, Conventional, and Edible Nonfat Dry Milk Price Range - Low & Medium Heat; $/LB: 1.0700 - 1.2500 Mostly Range - Low & Medium Heat; $/LB: 1.1300 - 1.1600 Prices for: Eastern and Central U.S., All First Sales, F.O.B., Extra Grade & Grade A, Conventional, and Edible Nonfat Dry Milk Price Range - High Heat; $/LB: 1.2500 - 1.3500
NONFAT DRY MILK - WEST The western low/medium heat nonfat dry milk market has weakened as reflected by decreasing price trends at both the bottom of the range and the bottom of the mostly series. A few sellers report that spot trading has declined within the U.S. Export sales to China are active, but Mexican buyers are gauging the market and postponing any unnecessary purchase in the hope that future prices will be lower. According to market participants, there were no shipment disruptions this week. However, on top of the coronavirus induced uncertainty, the high value of the dollar is making low/medium heat a little less appealing to international buyers. Production is ongoing. Stocks are balanced to building up. High heat nonfat dry milk demands for spring baking have augmented. Supplies are low, whereas sales are trending up. Prices are mixed. Production is irregular. Prices for: Western U.S., All First Sales, F.O.B., Extra Grade & Grade A, Conventional, and Edible Nonfat Dry Milk Price Range - Low & Medium Heat; $/LB: 1.0500 - 1.2200 Mostly Range - Low & Medium Heat; $/LB: 1.1000 - 1.1600 Prices for: Western U.S., All First Sales, F.O.B., Extra Grade & Grade A, Conventional, and Edible Nonfat Dry Milk Price Range - High Heat; $/LB: 1.2200 - 1.3500
DRY BUTTERMILK - CENTRAL AND EAST
CENTRAL: For the second week in a row, the dry buttermilk price range narrowed. Trading activity was moderate, slower than last week. Producers describe buttermilk demand as adequate. They say condensed buttermilk sales are somewhat quieter. Ice cream producers, who are reportedly starting to pick up, may start to change that narrative shortly. Buttermilk powder inventories are in fine shape, according to producers/sellers. Coronavirus concerns have pervaded agricultural markets, in general. Buttermilk powder market tones are hushed in light of the current situation, but notes of bearishness have yet to provide tangible results, such as pushing prices lower. EAST: Dry buttermilk prices are mixed. Output is somewhat lower in response to reduced milk intakes at some locations. As a result, there is unfilled demand due to the lack of producer offerings in the East spot market. In general, buying interest is adequate to good for current offerings, which are trading near the top end of the range. Prices for: Eastern and Central U.S., All First Sales, F.O.B., Conventional, and Edible Buttermilk Price Range ; $/LB: 1.1200 - 1.1800
DRY BUTTERMILK - WEST
Western f.o.b. prices for dry buttermilk are lower at the bottom of the range, but up at the top. Prices remain stable on the mostly series. Dry buttermilk offers in the spot market are light. Some market participants are concerned about getting enough supplies to meet their needs. Production is seasonally low because drying time is mostly used for condensed skim processing. Sales of dry buttermilk are unchanged from a week ago. Prices for: Western U.S., All First Sales, F.O.B., Conventional, and Edible Buttermilk Price Range ; $/LB: 1.1200 - 1.1825 Mostly Range - ; $/LB: 1.1400 - 1.1600
DRY WHOLE MILK - U.S. After a few weeks of price stagnation, spot prices for national dry whole milk had a bearish behavior this week. The market is unsettled at the moment, but unlike other dairy commodities, coronavirus is not playing the main driver of uncertainty in this market. National dry whole milk prices dropped principally because more manufacturing milk is available, and stocks are more available in the cash market. Demands from bakers are described as fair/good. Prices for: U.S., All First Sales, F.O.B., Conventional, and Edible Dry Whole Milk Price Range - 26% Butterfat; $/LB: 1.7000 - 1.8500
-5-
DAIRY MARKET NEWS, MARCH 9 - 13, 2020 -6- VOLUME 87, REPORT 11
WHEY, WPC 34%, LACTOSE & CASEIN Prices represent carlot/trucklot quantities for domestic and export sales packaged in 25 kg. or 50 lb. bags, or totes, spray process, dollars per pound.
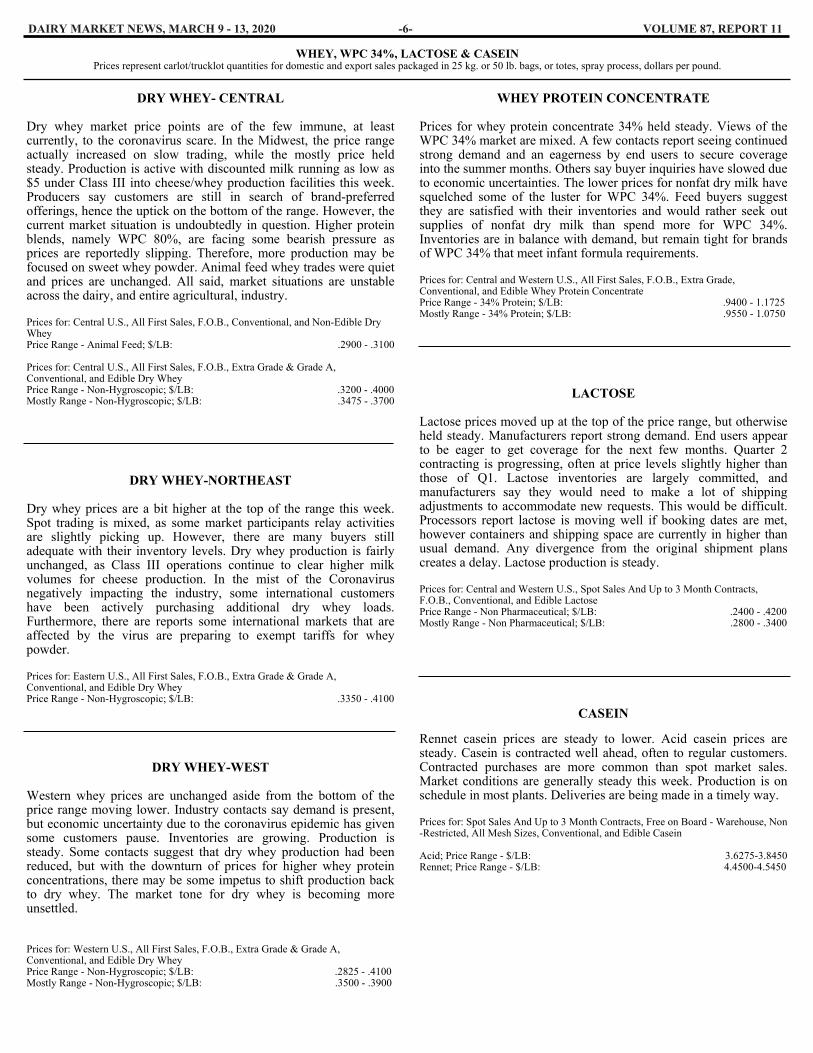
DRY WHEY- CENTRAL Dry whey market price points are of the few immune, at least currently, to the coronavirus scare. In the Midwest, the price range actually increased on slow trading, while the mostly price held steady. Production is active with discounted milk running as low as $5 under Class III into cheese/whey production facilities this week. Producers say customers are still in search of brand-preferred offerings, hence the uptick on the bottom of the range. However, the current market situation is undoubtedly in question. Higher protein blends, namely WPC 80%, are facing some bearish pressure as prices are reportedly slipping. Therefore, more production may be focused on sweet whey powder. Animal feed whey trades were quiet and prices are unchanged. All said, market situations are unstable across the dairy, and entire agricultural, industry. Prices for: Central U.S., All First Sales, F.O.B., Conventional, and Non-Edible Dry Whey Price Range - Animal Feed; $/LB: .2900 - .3100 Prices for: Central U.S., All First Sales, F.O.B., Extra Grade & Grade A, Conventional, and Edible Dry Whey Price Range - Non-Hygroscopic; $/LB: .3200 - .4000 Mostly Range - Non-Hygroscopic; $/LB: .3475 - .3700
DRY WHEY-NORTHEAST Dry whey prices are a bit higher at the top of the range this week. Spot trading is mixed, as some market participants relay activities are slightly picking up. However, there are many buyers still adequate with their inventory levels. Dry whey production is fairly unchanged, as Class III operations continue to clear higher milk volumes for cheese production. In the mist of the Coronavirus negatively impacting the industry, some international customers have been actively purchasing additional dry whey loads. Furthermore, there are reports some international markets that are affected by the virus are preparing to exempt tariffs for whey powder. Prices for: Eastern U.S., All First Sales, F.O.B., Extra Grade & Grade A, Conventional, and Edible Dry Whey Price Range - Non-Hygroscopic; $/LB: .3350 - .4100
DRY WHEY-WEST Western whey prices are unchanged aside from the bottom of the price range moving lower. Industry contacts say demand is present, but economic uncertainty due to the coronavirus epidemic has given some customers pause. Inventories are growing. Production is steady. Some contacts suggest that dry whey production had been reduced, but with the downturn of prices for higher whey protein concentrations, there may be some impetus to shift production back to dry whey. The market tone for dry whey is becoming more unsettled. Prices for: Western U.S., All First Sales, F.O.B., Extra Grade & Grade A, Conventional, and Edible Dry Whey Price Range - Non-Hygroscopic; $/LB: .2825 - .4100 Mostly Range - Non-Hygroscopic; $/LB: .3500 - .3900
WHEY PROTEIN CONCENTRATE Prices for whey protein concentrate 34% held steady. Views of the WPC 34% market are mixed. A few contacts report seeing continued strong demand and an eagerness by end users to secure coverage into the summer months. Others say buyer inquiries have slowed due to economic uncertainties. The lower prices for nonfat dry milk have squelched some of the luster for WPC 34%. Feed buyers suggest they are satisfied with their inventories and would rather seek out supplies of nonfat dry milk than spend more for WPC 34%. Inventories are in balance with demand, but remain tight for brands of WPC 34% that meet infant formula requirements. Prices for: Central and Western U.S., All First Sales, F.O.B., Extra Grade, Conventional, and Edible Whey Protein Concentrate Price Range - 34% Protein; $/LB: .9400 - 1.1725 Mostly Range - 34% Protein; $/LB: .9550 - 1.0750
LACTOSE Lactose prices moved up at the top of the price range, but otherwise held steady. Manufacturers report strong demand. End users appear to be eager to get coverage for the next few months. Quarter 2 contracting is progressing, often at price levels slightly higher than those of Q1. Lactose inventories are largely committed, and manufacturers say they would need to make a lot of shipping adjustments to accommodate new requests. This would be difficult. Processors report lactose is moving well if booking dates are met, however containers and shipping space are currently in higher than usual demand. Any divergence from the original shipment plans creates a delay. Lactose production is steady. Prices for: Central and Western U.S., Spot Sales And Up to 3 Month Contracts, F.O.B., Conventional, and Edible Lactose Price Range - Non Pharmaceutical; $/LB: .2400 - .4200 Mostly Range - Non Pharmaceutical; $/LB: .2800 - .3400
CASEIN Rennet casein prices are steady to lower. Acid casein prices are steady. Casein is contracted well ahead, often to regular customers. Contracted purchases are more common than spot market sales. Market conditions are generally steady this week. Production is on schedule in most plants. Deliveries are being made in a timely way. Prices for: Spot Sales And Up to 3 Month Contracts, Free on Board - Warehouse, Non-Restricted, All Mesh Sizes, Conventional, and Edible Casein Acid; Price Range - $/LB: 3.6275-3.8450 Rennet; Price Range - $/LB: 4.4500-4.5450

DAIRY MARKET NEWS, MARCH 9 - 13, 2020 -7- VOLUME 87, REPORT 11
U.S. Dairy Cow Slaughter (1000 head) under Federal Inspection
2020 WEEKLY 2020 2019 WEEKLY 2019 WEEK ENDING DAIRY COWS CUMULATIVE DAIRY COWS DAIRY COWS CUMULATIVE DAIRY COWS 02/22/2020 65.7 522.9 71.6 532.7 WEBSITE: http://www.ams.usda.gov/mnreports/sj_ls714.txt SOURCE: The slaughter data are gathered and tabulated in a cooperative effort by the Agricultural Marketing Service, the Food Safety and Inspection Service, and the National Agricultural Statistics Service, all of USDA
FEDERAL MILK ORDER CLASS III MILK PRICES (3.5% Butterfat)
YEAR JAN FEB MAR APR MAY JUN JUL AUG SEP OCT NOV DEC 2015 16.18 15.46 15.56 15.81 16.19 16.72 16.33 16.27 15.82 15.46 15.30 14.44 2016 13.72 13.80 13.74 13.63 12.76 13.22 15.24 16.91 16.39 14.82 16.76 17.40 2017 16.77 16.88 15.81 15.22 15.57 16.44 15.45 16.57 16.36 16.69 16.88 15.44 2018 14.00 13.40 14.22 14.47 15.18 15.21 14.10 14.95 16.09 15.53 14.44 13.78 2019 13.96 13.89 15.04 15.96 16.38 16.27 17.55 17.60 18.31 18.72 20.45 19.37
FEDERAL MILK ORDER CLASS IV MILK PRCES (3.5% Butterfat)
YEAR JAN FEB MAR APR MAY JUN JUL AUG SEP OCT NOV DEC 2015 13.23 13.82 13.80 13.51 13.91 13.90 13.15 12.90 15.08 16.43 16.89 15.52 2016 13.31 13.49 12.74 12.68 13.09 13.77 14.84 14.65 14.25 13.66 13.76 14.97 2017 16.19 15.59 14.32 14.01 14.49 15.89 16.60 16.61 15.86 14.85 13.99 13.51 2018 13.13 12.87 13.04 13.48 14.57 14.91 14.14 14.63 14.81 15.01 15.06 15.09 2019 15.48 15.86 15.71 15.72 16.29 16.83 16.90 16.74 16.35 16.39 16.60 16.70
FEDERAL MILK ORDER CLASS PRICES FOR 2020 (3.5% Butterfat)
CLASS JAN FEB MAR APR MAY JUN JUL AUG SEP OCT NOV DEC I (BASE) 19.01 17.55 17.46 II 17.05 16.84 III 17.05 17.00 IV 16.65 16.20
Further information may be found at: https://www.ams.usda.gov/rules-regulations/mmr/dmr
NATIONAL DAIRY PRODUCTS SALES REPORT
U.S. AVERAGES AND TOTAL POUNDS
WEEK ENDING 03/07/2020
BUTTER
1.7352 5,341,939
CHEESE 40# BLOCKS
1.8464 12,563,420
CHEESE BARRELS 38% MOISTURE
1.6232 12,514,778
DRY WHEY
.3750 4,815,363
NDM
1.1549 19,095,537
Further data and revisions may be found on the internet at: http://www.ams.usda.gov/rules-regulations/mmr/dmr
CME GROUP, INC FUTURES
Selected settling prices CLASS III MILK FUTURES (Pit-Traded) ($/cwt)
DATE 03/06 03/09 03/10 03/11 03/12 MAR 20 16.37 16.30 16.33 16.32 16.30 APR 20 16.03 15.81 15.85 15.83 15.90 MAY 20 16.28 15.96 15.99 15.93 15.84
CLASS IV MILK FUTURES (Pit-Traded) ($/cwt)
DATE 03/06 03/09 03/10 03/11 03/12 MAR 20 15.55 15.52 15.52 15.52 15.11 APR 20 15.40 15.10 15.20 15.20 14.72 MAY 20 15.50 15.10 15.29 15.29 14.79
CASH SETTLED BUTTER FUTURES (Electronic-Traded) (¢/lb)
DATE 03/06 03/09 03/10 03/11 03/12 MAR 20 183.50 182.50 182.00 182.00 179.78 APR 20 188.50 185.25 186.50 185.80 183.63 MAY 20 190.83 188.03 188.98 188.85 185.93
NONFAT DRY MILK FUTURES (Pit-Traded) (¢/lb) DATE 03/06 03/09 03/10 03/11 03/12 MAR 20 115.55 115.25 115.25 115.25 111.75 APR 20 111.60 109.28 109.85 110.00 106.10 MAY 20 111.48 107.48 109.00 108.33 104.35
WHEY (Electronic-Traded) (¢/lb)
DATE 03/06 03/09 03/10 03/11 03/12 MAR 20 36.28 35.95 36.03 36.83 37.00 APR 20 36.00 35.40 35.53 35.68 35.68 MAY 20 36.50 35.15 35.25 35.25 35.68
CHEESE CSC (Electronic-Traded) ($/lb)
DATE 03/06 03/09 03/10 03/11 03/12 MAR 20 1.72 1.71 1.72 1.72 1.72 APR 20 1.69 1.67 1.67 1.67 1.68 MAY 20 1.71 1.70 1.69 1.69 1.68
Further information may be found at: http://www.cmegroup.com/market-data/daily-bulletin.html

DAIRY MARKET NEWS, MARCH 9 - 13, 2020 VOLUME 87, REPORT 11
INTERNATIONAL DAIRY MARKET NEWS - EUROPE Information gathered March 2 - 13, 2020
Prices are U.S. $/MT, F.O.B. port. Information gathered for this report is from trades, offers to sell, and secondary data. This bi-weekly report may not always contain the same products and/or regions. Future reports may be included or withdrawn depending on availability of information. MT = metric ton = 2,204.6 pounds.
-8-
WESTERN OVERVIEW
There are widespread good feelings within the Western European dairy industry that 2020 has begun on a good basis. Spring is pre-sent in many Western European dairy countries. Temperatures are seasonally moderate. Production is moving upward toward the sea-sonal peak in April – May. 2019 milk production increases were not as strong as had been pro-jected early in 2019. Nevertheless, there was a 0.4 percent increase, according to Eurostat. The increase occurred even with 2019 de-creases in some of the primary milk producing countries. German milk production was -0.1 percent, France recorded -0.2 percent, Netherlands recorded -0.7 percent, and Italy finished 2019 with -0.2 percent. Ireland was a strong Western European producer with +5.3 percent for 2019. The agglomeration of smaller Western European milk producing countries and some Eastern European milk produc-ing countries overcame the negative results in the biggest producers to yield the overall positive outcome for the EU. The impact of coronavirus in Western Europe is still more anecdotal than quantified. Many comments are heard that dairy powders and whey are moving into export markets more slowly. This week, Italy increased quarantined areas from the region near Milan, to include the whole country. Until this increase, few disruptions had been reported about German milk moving to Italian cheese factories, or in cheese leaving factories. The new restrictions in Italy limit people’s movement, close most schools, prevent many public events, and close restaurants at 6:00PM. With the new countrywide quarantine, it remains to be seen how that may affect dairy processing and sales. It is difficult to assess the magnitude of diminished economic activi-ty. Some bankers have cautioned that lenders will likely be more cautious in extending new credit due to the uncertainty of how things will resolve. The process which results in prevailing retail fluid milk prices throughout Germany is being adjusted. Dairy producers are nervous that a move to lower retail fluid milk process may move back to farms with lower milk pay prices. This may occur in part due to increasing milk production in Germany. EU cheese production during 2019 increased 0.1 percent according to Eurostat. Cheese exports from the EU for 2019, 879,704 MT, increased 6 percent. Changes for the top export destinations include the United States, 139,101 MT, +4 percent; Japan, 114,133 MT, +7 percent; and Switzerland, 62,542 MT, +1 percent. German retailers report increases in sales of sliced cheese, believed to be a result of consumers buying ahead as a result of coronavirus concerns. Ex-ports have been flowing normally, even to Italy so far. However, tightness of shipping containers has made exporting more expen-sive.
EASTERN OVERVIEW
Poland, the leading Eastern European milk producer, recorded a 1.9 percent increase in milk production during 2019, according to Euro-stat. Other Eastern European countries reporting 2019 increases in milk production are Cyprus, Hungary, Estonia, Greece, Bulgaria, Romania, and Latvia.
BUTTER/BUTTEROIL
Butter prices in Western Europe are steady to higher, partly due to the exchange rate between the dollar and euro. Butteroil prices are mixed, lower at the bottom of the price range but higher at the top. Germany continues to report the highest butter prices. Belgium, France and Netherlands follow at lower levels. Sources report that demand for packaged butter in Germany and other large Western European countries has increased sharply since the end of February. Partly this is attributed to consumer stocking following news about coronavirus. Some German supermarkets have empty butter spaces in coolers. Butter producers are working to keep up. The season when customers typically increase buying for spring religious holidays is approaching. It is unclear whether consumers will be able to carry current buying forward, or whether the normal spring purchase demand is still ahead. Typically, the production sea-son peaks in May. Western Europe, 82% Butterfat, Free on Board - Port Butter Price Range - $/MT: 3,775 - 4,100 Western Europe, 99% Butterfat, Free on Board - Port Butteroil Price Range - $/MT: 4,725 - 5,225 Secondary Sourced Information: Butter production in the EU increased 1.0 percent during 2019, ac-cording to Eurostat. Butter exports from the EU for 2019, 180,197 MT, increased 41 percent. Changes for the top export destinations include the United States, 33,860 MT, +21 percent; United Arab Emirates, 10,948 MT, +154 percent; and China, 10,841 MT, +38 percent.
SKIM MILK POWDER
Western European skim milk powder prices are mixed. Lower range prices are weaker while top range prices are steady. German and French prices have vied as the highest price between the two weeks of this reporting period. Prices in Netherlands are lower. SMP markets in Western Europe have become quieter in recent weeks. Shipments have slowed to China and some other countries dealing with coronavirus. New contracting from some countries has also slowed. There is uncertainty whether the slower pacing of ex-ports will be recouped in the future, or whether there will be a hit on total 2020 exports. However, many regular export customers in other countries continue to make new deals and accept deliveries. During March, Western European SMP production is seasonally increasing. Typically, the production season peaks in May. Prices for: Europe, All First Sales, Free on Board - Port, Convention-al, and Edible Skim Milk Powder Price Range - 1.25% Butterfat; $/MT: 2,675 - 2,850 Secondary Sourced Information: SMP production in the EU decreased 0.3 percent during 2019, ac-cording to Eurostat.
CONTINUED ON PAGE 8A

DAIRY MARKET NEWS, MARCH 9 - 13, 2020 VOLUME 87, REPORT 11
INTERNATIONAL DAIRY MARKET NEWS - EUROPE Information gathered March 2 - 13, 2020
Prices are U.S. $/MT, F.O.B. port. Information gathered for this report is from trades, offers to sell, and secondary data. This bi-weekly report may not always contain the same products and/or regions. Future reports may be included or withdrawn depending on availability of information. MT = metric ton = 2,204.6 pounds.
CONTINUED FROM PAGE 8 SMP exports from the EU for 2019, 962,359 MT, increased 18 per-cent. Changes for the top export destinations include China, 126,298 MT, +38 percent; Algeria, 100,718 MT, -30 percent; and Indonesia, 71,136 MT, +27 percent.
DRY WHEY
Dry whey prices in Western Europe are steady to slightly higher. Overall demand for dry whey is calmer. Many buyers accumulated stocks or finalized contracts in recent weeks. That has resulted in less present buying activity. However, available stocks are being moved to buyers. Prices for: Western Europe, All First Sales, Free on Board - Port, Conventional, and Edible Dry Whey Price Range - Non-Hygroscopic; $/MT: 800 - 1,050 Secondary Sourced Information: Combined whey production during 2019 decreased 0.8 percent in the primary producing countries Germany, France and Austria, ac-cording to ZMB. Individual results include France, -3.3 percent; Germany, -1.8 percent; and Austria, +66.5 percent. EU whey exports January – December 2019, 701,000 MT, increased 1.1 percent from January – December 2018, according to CLAL data made available to USDA.
WHOLE MILK POWDER Whole milk powder prices in Western Europe are slightly higher. The exchange rate between the dollar and euro is a factor in the dol-lar-based price increase. During March, Western European WMP production is seasonally increasing. Typically, the production season peaks in May. The de-velopment of slightly increased production, but lower exports during 2019, has left Western Europe with a bit more WMP than during 2019. Domestic consumption has been continuous and is up some-what, helping with the overall balance. Nevertheless, this trend is causing some manufacturers to consider shifting some milk from WMP to other products during 2020. Prices for: Europe, All First Sales, Free on Board - Port, Conven-tional, and Edible Whole Milk Powder Price Range - 26% Butterfat; $/MT: 3,275 - 3,400 Secondary Sourced Information: WMP production in the EU increased 1.0 percent during 2019, ac-cording to Eurostat. WMP exports from the EU for 2019, 297,429 MT, decreased 11 percent. Changes for the top export destinations include Oman, 40,531 MT, -16 percent; Algeria, 21,730 MT, -18 percent; and Ni-geria, 18,776 MT, +18 percent.
- 8A-

DAIRY MARKET NEWS, MARCH 9 - 13, 2020 VOLUME 87, REPORT 11
INTERNATIONAL DAIRY MARKET NEWS - OCEANIA Information gathered March 2 - 13 , 2020
Prices are U.S. $/MT, F.O.B. port. Information gathered for this report is from trades, offers to sell, and secondary data. This bi-weekly report may not always contain the same products and/or regions. Future reports may be included or withdrawn depending on availability of information. MT = metric ton = 2,204.6 pounds.
OCEANIA DAIRY MARKET OVERVIEW
AUSTRALIA: July 2019 – January 2020 milk production in Aus-tralia decreased 3.7 percent from the corresponding previous period, according to Dairy Australia. January 2020 milk production, 731.2 million litres, was 0.5 percent higher than January 2019. More de-tailed production data are in the table which follows. AUSTRALIA MILK PRODUCTION, MILKFAT and PROTEIN July 2019 - January 2020 January 2020 Million Percent Change Percentage State Liters From 1 Year Ago Milkfat Protein New South Wales 637.4 - 6.7 3.98 3.22 Victoria 3,688.5 - 2.8 4.28 3.40 Queensland 194.1 -14.2 3.93 3.25 South Australia 278.7 - 9.9 3.91 3.25 Western Australia 219.4 - 4.1 3.93 3.19 Tasmania 592.4 + 1.7 4.28 3.50 Australia (Total) 5,610.6 - 3.7 4.20* 3.37** +1.4 percent from prior year period ** +3.9 percent from prior year period Data from Dairy Australia NEW ZEALAND: January 2020 New Zealand milk production re-ported by DCANZ was 2,454 million MT, down 0.7 percent from January 2019 milk production, 2,471 million MT. January 2020 milk solids, 211,377 million kg, are up 1.1 percent from January 2019, 209,036 million kg. This season to date, June 2019 – January 2020, milk production decreased 0.5 percent from the corresponding year earlier period according to Eucolait. Milk solids increased 0.5 per-cent. Drought continues to be a problem for dairy producers. There was some rain last week, but not enough. Experts believe multiple rain events over many days will be required to end the drought. The Agri-culture Minister of New Zealand has now expanded drought classifi-cations to more regions. This will lead to government assistance in affected areas. Meanwhile, milk production is being adversely affect-ed.
BUTTER/BUTTEROIL
Butter prices in Oceania are higher. Export buyers are continuing to contract for additional deliveries. Most butter exports go to countries other than China. Thus, the impact of coronavirus, which has slowed exports of some dairy powders has not similarly slowed butter. But-ter production in Oceania has seasonally slowed. This also is a factor putting upward pressure on prices. Finally, manufacturers are juggl-ing filling orders against building inventories for the slowest time of the season in a few months. Oceania, 82% Butterfat, Free on Board - Port Butter Price Range - $/MT: 4,075 - 4,350
Australian exports of butter July 2019 – January 2020, 4,589 MT, compared with July 2018 – January 2019, decreased 34.3 percent according to Dairy Australia. Butter exports from New Zealand during January 2020, 27,159 MT, decreased 3.3 percent from January 2019, according to Eucolait. Dur-ing 2019, China, the largest export customer, accounted for 22.5 per-cent of butter exports from New Zealand. At GDT event 255 on March 3, the butter all contracts price, $4,131, increased 1.0 percent. The April contract, $4,350, increased 6.7 per-cent.
SKIM MILK POWDER
Skim milk powder prices in Oceania are lower. Demand has dropped quite a bit for deliveries currently and into April. This is a significant factor pulling overall pricing lower. Weaker demand from north Asia, including China, are regularly cited factors. Coronavirus con-tinues to slow SMP demand for all the so often mentioned reasons. Because New Zealand has developed export patterns with China as a large and significant export customer, when China slows buying or accepting deliveries, it leads to a backup in stocks. Prices for: Oceania, All First Sales, Free on Board - Port, Conven-tional, and Edible Skim Milk Powder Price Range - 1.25% Butterfat; $/MT: 2,725 - 2,850 Secondary Sourced Information: Australian exports of SMP July 2019 – January 2020, 56,582 MT, compared with July 2018 – January 2019, decreased 40.9 percent according to Dairy Australia. SMP exports from New Zealand during January 2020, 42,279 MT, decreased 8.8 percent from January 2019, according to Eucolait. Dur-ing 2019, China, the largest export customer, accounted for 35.3 per-cent of SMP exports from New Zealand. At GDT event 255 on March 3, the SMP all contracts price, $2,747, decreased 3.2 percent. The April contract, $2,764, decreased 14.3 percent.
CHEESE
Cheddar prices in Oceania are lower. Most regular buyers are cur-rently well stocked and contracted for coming months. Slowed north Asian buying related to coronavirus is not believed to be much of a factor in this market. Cheddar production is simply a bit ahead of current demand. Prices for: Oceania Cheese, Cheddar, 39% Maximum Moisture, Free on Board - Port, Price Range - $/MT: 4,250 - 4,300
CONTINUED ON PAGE 8C
- 8B-
DAIRY MARKET NEWS, MARCH 9 - 13, 2020 VOLUME 87, REPORT 11
INTERNATIONAL DAIRY MARKET NEWS - OCEANIA Information gathered March 2 - 13 , 2020
Prices are U.S. $/MT, F.O.B. port. Information gathered for this report is from trades, offers to sell, and secondary data. This bi-weekly report may not always contain the same products and/or regions. Future reports may be included or withdrawn depending on availability of information. MT = metric ton = 2,204.6 pounds.
Exchange rates for selected foreign currencies: March 10, 2020 .0160 Argentina Peso .0135 India Rupee .6504 Australian Dollar .0095 Japan yen .2155 Brazil Real .0480 Mexican Peso .7285 Canadian Dollar .6271 New Zealand Dollar .0012 Chile Peso .2617 Poland Zloty 1.1283 Euro .0240 Uruguay Peso Conversion example: To compare the value of 1 US Dollar to Mexi-can Pesos: (1/.0480) = 20.8333 Mexican Pesos. Source: "Wall Street Journal"
CONTINUED FROM PAGE 8B
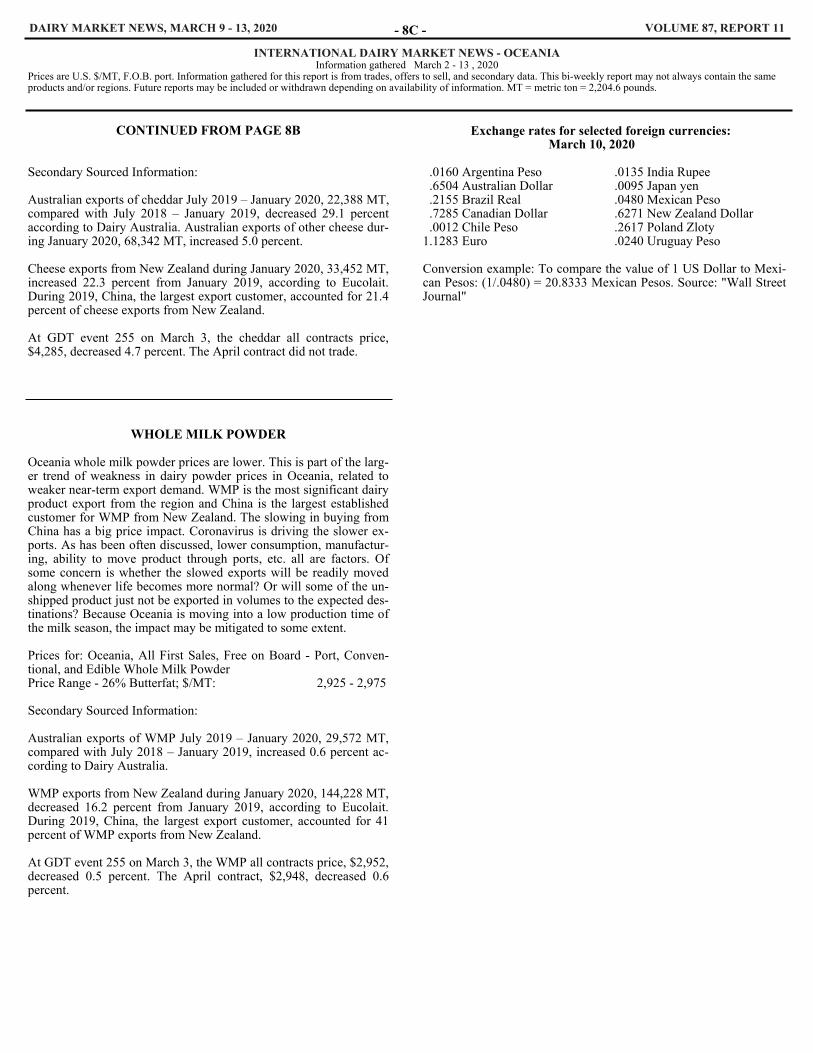
Secondary Sourced Information: Australian exports of cheddar July 2019 – January 2020, 22,388 MT, compared with July 2018 – January 2019, decreased 29.1 percent according to Dairy Australia. Australian exports of other cheese dur-ing January 2020, 68,342 MT, increased 5.0 percent. Cheese exports from New Zealand during January 2020, 33,452 MT, increased 22.3 percent from January 2019, according to Eucolait. During 2019, China, the largest export customer, accounted for 21.4 percent of cheese exports from New Zealand. At GDT event 255 on March 3, the cheddar all contracts price, $4,285, decreased 4.7 percent. The April contract did not trade.
WHOLE MILK POWDER
Oceania whole milk powder prices are lower. This is part of the larg-er trend of weakness in dairy powder prices in Oceania, related to weaker near-term export demand. WMP is the most significant dairy product export from the region and China is the largest established customer for WMP from New Zealand. The slowing in buying from China has a big price impact. Coronavirus is driving the slower ex-ports. As has been often discussed, lower consumption, manufactur-ing, ability to move product through ports, etc. all are factors. Of some concern is whether the slowed exports will be readily moved along whenever life becomes more normal? Or will some of the un-shipped product just not be exported in volumes to the expected des-tinations? Because Oceania is moving into a low production time of the milk season, the impact may be mitigated to some extent. Prices for: Oceania, All First Sales, Free on Board - Port, Conven-tional, and Edible Whole Milk Powder Price Range - 26% Butterfat; $/MT: 2,925 - 2,975 Secondary Sourced Information: Australian exports of WMP July 2019 – January 2020, 29,572 MT, compared with July 2018 – January 2019, increased 0.6 percent ac-cording to Dairy Australia. WMP exports from New Zealand during January 2020, 144,228 MT, decreased 16.2 percent from January 2019, according to Eucolait. During 2019, China, the largest export customer, accounted for 41 percent of WMP exports from New Zealand. At GDT event 255 on March 3, the WMP all contracts price, $2,952, decreased 0.5 percent. The April contract, $2,948, decreased 0.6 percent.
- 8C -

DAIRY MARKET NEWS, MARCH 9 - 13, 2020 -8D- VOLUME 87, REPORT 11
INTERNATIONAL DAIRY MARKET NEWS - SOUTH AMERICA Information gathered March 2 - 13, 2020
Prices are U.S. $/MT, F.O.B. port. Information gathered for this report is from trades, offers to sell, and secondary data. This bi-weekly report may not always contain the same products and/or regions. Future reports may be included or withdrawn depending on availability of information. MT = metric ton = 2,204.6 pounds.
SOUTH AMERICA OVERVIEW
The last two weeks have been mostly dry and warm in most states of Brazil, Argentina and Uruguay. Sunny skies promoted the growth of second-crop corn in southern Brazil and improved the development of summer grains in Argentina. Pasture quality is reported as fair/good in the main continental dairy basins and concentrate supplies remain readily available at inexpensive values. With enough feed and mild weather, farm milk yields continue improving across Brazil and the Southern Cone region. In this way, apart from Brazil, raw milk intakes are abundant to meet manufacturing needs within the regional dairy industry. Fluid/UHT milk demands from schools, grocery stores, and restaurants are steady to improving. The cream market is still in a firm position as supplies remain below adequate to meet all the needs of buyers/end users. However, cream volumes are anticipated to increase again throughout the fall season. Due to the coronavirus outbreak, overseas exports of dairy products outside the Mercosur bloc have been limited.
SKIM MILK POWDER
In the main ports of the South American Southern Cone region, free on board (f.o.b.) export prices adjusted lower, in line with recent downtick SMP price trends at some offshore auctions. The making of skim milk powder (SMP) has been more proactive as regional farm milk production increases. With fewer SMP requests, mainly from Brazil, due to the coronavirus, most Argentinian and Uruguay-an manufacturers have had to lower their prices to be more attractive to buyers. In some cases, SMP stocks continue building, while in other cases SMP inventories are reported as stable. Prices for: South America, All First Sales, Free on Board - Port, Conventional, and Edible Skim Milk Powder Price Range - 1.25% Butterfat; $/MT: 2,650 - 2,850 Secondary Sourced Information: At the GDT Event 255 on March 3, skim milk powder (SMP) prices across all contract periods averaged $2,747 per metric ton, down 3.2 percent from the last event.
WHOLE MILK POWDER
The uncertainty fashioned by the coronavirus continues pushing down international and regional prices for whole milk powder (WMP). During the past two weeks, free on board (f.o.b.) export behaved steady to lower in the Southern Cone region of South America. Several WMP orders from Brazilian buyers were either held or cut. Meanwhile, large volumes of condensed whole milk are still clearing into dryers, while inventories continue slowly growing. Prices for: South America, All First Sales, Free on Board - Port, Conventional, and Edible Whole Milk Powder Price Range - 26% Butterfat; $/MT: 2,900 - 3,000
Secondary Sourced Information: At the GDT Event 255 on March 3, whole milk powder (WMP) prices across all contract periods averaged $2,952 per metric ton, down 0.5 percent from the last event.

DAIRY MARKET NEWS, MARCH 9 - 13, 2020 - 9 - VOLUME 87, REPORT 11
DIAL 608-422-8602
MARKET NEWS INFORMATION BY PHONE
The system is accessible via a touch-tone telephone. By listening to the menu and pressing the appropriate numbers, you will have access to the latest CME Group daily pricing for cheese, NDM, and butter, weekly domestic DMN dry product prices, and biweekly DMN international dairy product prices. Release day(s) and times (Central) are in parenthesis. 1/
CME Group Cash Prices Cheese NDM Butter
(Daily-12:15 p.m.) PRESS 4
DMN Domestic Dry Product Prices
(TH-Weekly 11:30 a.m.) PRESS 5
DMN International Market Prices
(TH-Biweekly 10:00 a.m.) PRESS 6
1/ Holidays may affect release days and times.
UNITED STATES DEPARTMENT OF AGRICULTURE DAIRY MARKET NEWS 4600 American Parkway, Suite 106 Madison, WI 53718 608-422-8587
03/14/2018

DAIRY MARKET NEWS, MARCH 9 – 13, 2020 -10- VOLUME 87, REPORT 11
March Supply and Demand Estimates The milk production forecast for 2020 is raised from last month on a higher expected cow inventory. The 2020 fat basis import forecast is raised from the previous month on recent trade data and stronger anticipated imports of cheese and butterfat products. The fat basis export forecast is reduced on slower expected demand in the first half of the year. On a skim-solids basis, the import forecast is raised on stronger imports of cheese, milk proteins, and several other dairy products. The skim-solids basis export forecast is raised on expectations of continued strength in international demand. Annual product price forecasts for cheese, butter, and nonfat dry milk (NDM) are lowered from the previous month. However, the whey price forecast is raised. The Class III price is reduced on the lower cheese price forecast, while the Class IV price is reduced on lower butter and NDM price forecasts. The all milk price forecast is lowered from the previous month to $18.25 per cwt.
U.S. Milk Supply and Use
Commodity 2018 2019 Estimated 2020 Projected
Feb Mar Feb Mar (billion pounds) Milk Production 217.6 218.3 218.4 222 222.3 Farm Use 1.0 1.0 1.0 1.0 1.0 Fat Basis Supply Beginning Commercial Stocks 13.4 13.8 13.8 13.6 13.7 Marketings 216.5 217.3 217.4 221.0 221.2 Imports 6.3 7.0 7.0 6.3 6.8 Total Commercial Supply 236.2 238.0 238.1 241.0 241.7 Fat Basis Use Commercial Exports 10.4 9.1 9.1 9.4 9.2 Ending Commercial Stocks 13.8 13.6 13.7 13.4 14.1 CCC Donations 0.0 0.2 0.2 0.3 0.3 Domestic Commercial Use 212.1 215.1 215.1 217.9 218.2 Skim-Solid Basis Supply Beginning Commercial Stocks 11.8 10.7 10.7 10.2 10.2 Marketings 216.5 217.3 217.4 221.0 221.2 Imports 5.5 5.8 5.8 5.5 5.6 Total Commercial Supply 233.8 233.8 233.9 236.7 237.1 Skim-Solids Basis Use Commercial Exports 44.7 41.6 41.6 43.6 43.9 Ending Commercial Stocks 10.7 10.2 10.2 10.3 10.4 CCC Donations 0.0 0.2 0.2 0.1 0.1 Domestic Commercial Use 178.5 181.8 181.9 182.7 182.7
NOTE: Totals may not add due to rounding. Continued on page 11

DAIRY MARKET NEWS, MARCH 9 – 13, 2020 -11- VOLUME 87, REPORT 11
March Milk Supply and Demand Estimates-cont’d
1 Simple average of monthly prices calculated from AMS weekly average dairy product prices for class price computations. Details may be found by going to http://www.ams.usda.gov/rules-regulations/mmr/dmr; scroll down to Publications, National Dairy Products Sales Reports, and select Current Release & Archives.” 2 Annual and quarterly Class III and Class IV prices are the simple average of monthly minimum Federal order milk prices paid by regulated plants for milk used in the respective classes. All milk price is the simple average of monthly prices received by farmers for milk at average test. 3 Does not reflect any deductions from producers as authorized by legislation. 4 Projection. Source: U.S. Department of Agriculture. World Agricultural Outlook Board. World Agricultural Supply and Demand Estimates, WASDE-598, March 10, 2020. Approved by the Interagency Commodity Estimates Committee [members for Dairy are: Shayle Shagam, ICEC Chair, WAOB; Carolyn Liebrand, AMS; Paul Kiendl, FAS; Jerry Cessna, ERS; and Georgi Gabrielyan, FPAC].
U.S. Dairy Prices
Commodity 2018 2019 Estimated 2020 Projected
Feb Mar Feb Mar (dollars per pound) Product Prices 1 Cheese 1.5377 1.7586 1.7586 1.7900 1.7550 Butter 2.2572 2.2431 2.2431 1.9100 1.8450 Nonfat Dry Milk 0.7945 1.0419 1.0419 1.2550 1.1750 Dry Whey 0.3422 0.3799 0.3799 0.3450 0.3550 (dollars per cwt) Milk Prices 2 Class III 14.61 16.96 16.96 16.95 16.65 Class IV 14.23 16.30 16.30 16.70 15.75 All Milk 3 16.27 18.60 18.60 18.85 18.25 Quarterly 2019 IV 2020 I 4 2020 II 4 2020 III 4 2020 IV 4 (billion pounds) Milk Production 54.0 55.7 56.9 55.0 54.7 (dollars per cwt) All Milk Price 2, 3 20.53 18.80 17.90 18.05 18.20 Class III Price 2 19.51 16.75 16.50 16.69 16.59 Class IV Price 2 16.56 16.18 15.59 15.65 15.60

DAIRY MARKET NEWS, MARCH 9 - 13, 2020 -12- VOLUME 87, REPORT 11
Consumer Price Index and Average Retail Prices for Selected Products, U.S. City Average 1
Consumer Price Index
Month
All Food Dairy Products Fresh Whole Milk Cheese Butter Meat, Poultry, Fish, and Eggs
CPI 2 Pct.
Chg 3 CPI 2
Pct. Chg 3
CPI 2 Pct.
Chg 3 CPI 2
Pct. Chg 3
CPI 2 Pct.
Chg 3 CPI 2
Pct. Chg 3
Dec 2019 259.8 1.8 221.9 2.4 206.3 5.2 234.5 3.1 239.3 0.7 252.9 2.3
Jan 2020 261.1 1.8 223.0 2.7 209.3 6.2 233.9 3.5 252.8 1.8 252.9 1.9
Feb 2020 261.9 1.8 224.4 3.6 208.4 5.8 236.6 5.3 248.6 -1.3 253.4 1.9
U.S. City Average Retail Prices
Month Whole Milk 4 Butter 5 Process Cheese 6 Natural Cheese 7 Ice Cream 8
2019 2018 2019 2018 2019 2018 2019 2018 2019 2018
(dollars) Dec 3.188 2.853 N/A N/A 3.909 3.944 5.302 5.360 4.740 4.812
2020 2019 2020 2019 2020 2019 2020 2019 2020 2019
(dollars)
Jan 3.253 2.913 N/A N/A 3.847 3.922 5.204 5.372 4.824 4.912
Feb 3.196 2.900 N/A N/A 3.912 3.863 5.381 5.247 4.884 4.981
N/A = Not available. 1 "CPI Detailed Report," "Consumer Prices: Energy and Food," BLS, U.S. Department of Labor. According to BLS, average prices are best used to measure the price level in a particular month. To measure price change over time, the CPI is more appropriate. 2 The standard reference base period for these indexes is 1982-1984 = 100. 3 Percent change over previous year. 4 Per gallon. 5 Per pound. Grade AA, salted, stick butter. 6 Per pound, any size and type of package. 7 Per pound, cheddar cheese in any size and type of package and variety (sharp, mild, smoked, etc.). 8 Per 1/2 gallon prepackaged regular.
Producer Price Index (PPI)1
Producer Price Index
Month
All Food Manufacturing
Dairy Products Fresh Whole Milk Cheese Butter Dry Milk Products
and Mixtures
PPI Pct. Chg
2 PPI Pct. Chg PPI Pct. Chg PPI Pct. Chg PPI Pct. Chg PPI Pct. Chg
Dec-19 202.6 2.3 208.4 7.0 238.8 12.2 194.5 13.7 136 -12.4 163.8 -0.2
Jan-20 202.2 2.0 206.3 5.5 238 11.5 189.9 10.9 135.7 -13.5 166.8 -3.1
Feb-20 201.0 1.1 205.3 4.2 230.7 7.8 189.7 9.5 126.9 -20.0 175.1 0.1 1 The standard reference base period for these indexes is 1981-1984 = 100. 2 Percent change from previous year.

DAIRY MARKET NEWS, MARCH 9 - 13, 2020 -G1- VOLUME 87, REPORT 11
40
45
50
55
60
65
70
75
80
85
Jan Feb Mar Apr May Jun Jul Aug Sep Oct Nov Dec
Cheese Exports (various H.S. Codes)
2016 2017 2018 2019 2020
Million Pounds
GRAPH USDA, DMN; SOURCE USDA, FAS
0
2
4
6
8
10
12
14
Jan Feb Mar Apr May Jun Jul Aug Sep Oct Nov Dec
2016 2017 2018 2019 2020
Million Pounds
GRAPH, USDA, DMN; SOURCE, USDA, FAS
DAIRY MARKET NEWS, MARCH 9 - 13, 2020 -G2- VOLUME 87, REPORT 11
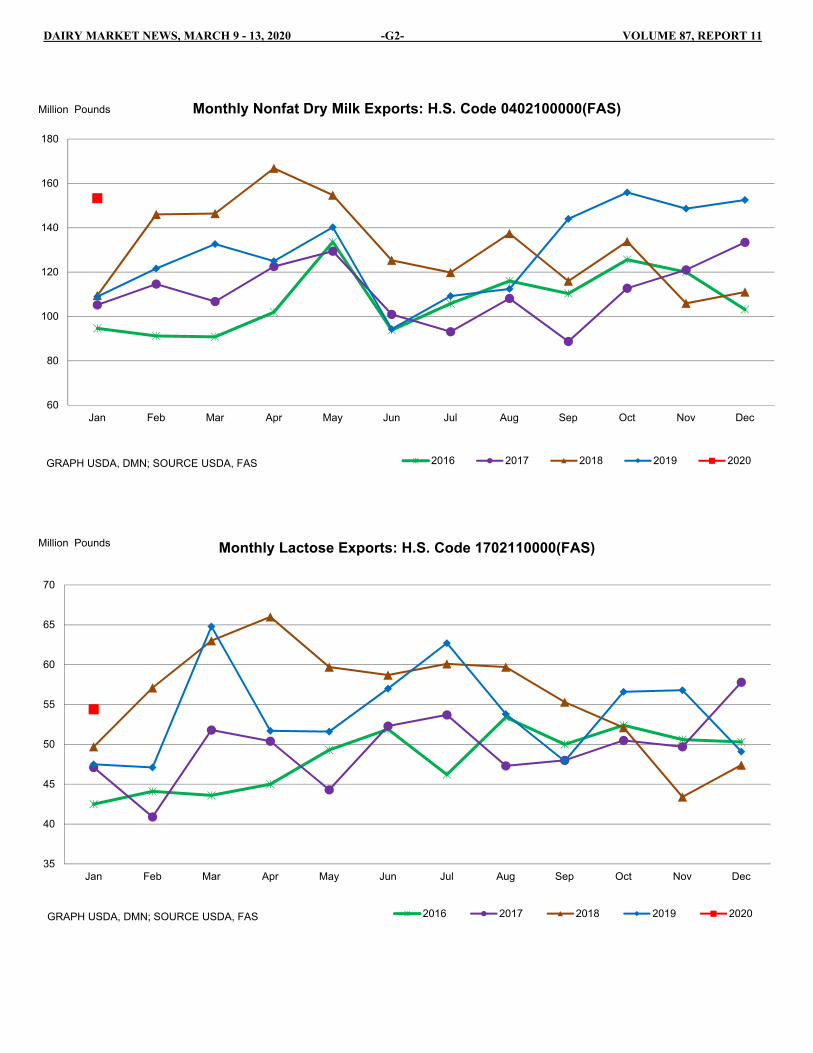
60
80
100
120
140
160
180
Jan Feb Mar Apr May Jun Jul Aug Sep Oct Nov Dec
Monthly Nonfat Dry Milk Exports: H.S. Code 0402100000(FAS)
2016 2017 2018 2019 2020
Million Pounds
GRAPH USDA, DMN; SOURCE USDA, FAS
35
40
45
50
55
60
65
70
Jan Feb Mar Apr May Jun Jul Aug Sep Oct Nov Dec
Monthly Lactose Exports: H.S. Code 1702110000(FAS)
2016 2017 2018 2019 2020
Million Pounds
GRAPH USDA, DMN; SOURCE USDA, FAS

DAIRY MARKET NEWS, MARCH 9 - 13, 2020 -G3- VOLUME 87, REPORT 11
20
25
30
35
40
45
50
Jan Feb Mar Apr May Jun Jul Aug Sep Oct Nov Dec
Monthly Dry Whey Exports: H.S. Code 0404104000(FAS)
2016 2017 2018 2019 2020
Million Pounds
GRAPH USDA, DMN; SOURCE USDA,FAS
10
15
20
25
30
35
40
45
Jan Feb Mar Apr May Jun Jul Aug Sep Oct Nov Dec
Monthly WPC <80% Exports: H.S. Code 0404100500(FAS)
2016 2017 2018 2019 2020
Million Pounds
GRAPH USDA, DMN; SOURCE USDA,FAS

1 -- Dairy Market News surveys nearly 150 retailers, comprising over 23,000 individual stores, with online weekly advertised features.
Dairy Market News Branch
AgriculturalMarketingService
National Retail Report-DairyWebsites: http://www.marketnews.usda.gov/mnp/da-home and http://www.ams.usda.gov/mnreports/dybretail.pdf
Volume 87- Number 11 Issued Weekly Friday, March 13, 2020
Advertised Prices for Dairy Products at Major Retail Supermarket Outlets ending during the period of 03/13/2020 to 03/19/2020
The total number of dairy product advertisements decreased 3 percent for conventional, while for organic decreased 26 percent. The number of total ads for conventional cottage cheese in 16 ounces containers notably increased by 156 percent. Conventional ice cream in 48 to 64 ounce containers was the most advertised dairy product this week, with a 13 percent increase in ad numbers. The number of ads for conventional 1 pound butter decreased by 32 percent, while for organic declined 87 percent. The weighted average price for conventional 1 pound butter packages is $3.57, compared to $5.29 for organic 1 pound butter packages.
The national weighted average advertised price for conventional milk in half gallons is $2.39, compared to $3.99 for organic milk half gallons, resulting in an organic premium of $1.60. Conventional milk ads decreased by 27 percent, while organic milk ads decreased by 8 percent. Milk in half gallons are the most advertised organic item this week.
The total number of ads for conventional and organic yogurt decrease by 14 percent and 53 percent, respectively. The weighted average advertised price for yogurt in 4-6 ounce containers is $0.55 for conventional, compared to $1.79 for organic, resulting in an organic premium of $1.24.
The total number of ads for conventional cheese dropped 8 percent, while for organic declined 20 percent. The weighted average price for conventional 8 ounce shred cheese is $2.43 and $3.00 for organic, representing an organic premium of $0.57.
Yogurt Cheese Ice cream Sour cream Cottage cheese
Stor
es w
ith A
ds
0K
5K
10K
15K
20K
25K
30K03/13/2020 03/06/2020 02/28/2020
Top 5 Commodities Featured This Week

National Retail Report - Dairy Vol 87 - No. 11Friday, March 13, 2020 - Page 2
Wtd Avg - Simple weighted average
Butter, 5%
Cheese, 24%
Cottage cheese, 7%
Cream cheese, 4%
Flavored milk, 1%Ice cream, 16%
Milk, 1%
Sour cream, 8%
Yogurt, 28%
Percentage of Total Conventional Ads by Commodity
Butter, 3%
Cheese, 2%
Cottage cheese, 8%
Cream cheese, 3%
Milk, 72%
Sour cream, 3%
Yogurt, 9%
Percentage of Total Organic Ads by Commodity

National Retail Report - Dairy Vol 87 - No. 11Friday, March 13, 2020 - Page 3
Wtd Avg - Simple weighted average
NATIONAL -- CONVENTIONAL DAIRY PRODUCTS
Commodity Type Pack Size
THIS PERIOD LAST WEEK LAST YEAR
StoresWith Ads
Wtd AvgPrice
StoresWith Ads
Wtd AvgPrice
StoresWith Ads
Wtd AvgPrice
Butter 1 # 4144 3.57 6078 3.47 3045 3.12Cheese Natural Varieties 8 oz block 5514 2.33 4038 2.54 3284 2.06Cheese Natural Varieties 1 # block 1299 4.32 2576 3.36 1720 3.73Cheese Natural Varieties 2 # block 379 6.98 808 6.88 1246 4.71Cheese Natural Varieties 8 oz shred 8689 2.43 7582 2.42 7905 2.05Cheese Natural Varieties 1 # shred 2193 4.69 4567 4.10 603 3.17Cottage cheese 16 oz 5102 2.16 1990 2.11 1691 2.35Cream cheese 8 oz 3149 2.00 4949 1.94 3670 1.68Flavored milk All fat tests half gallon 583 3.03 624 3.48 1098 2.79Flavored milk All fat tests gallon 496 3.83 392 3.85 604 2.82Ice cream 48-64oz 12536 3.07 11057 3.26 9278 2.87Milk All fat tests half gallon 561 2.39 239 2.64 1158 2.29Milk All fat tests gallon 464 2.84 1159 3.63 574 2.81Sour cream 16 oz 6059 1.94 3606 1.81 2380 1.80Yogurt Greek 4-6 oz 9913 .95 10227 .96 6949 .96Yogurt Greek 32 oz 4293 3.98 5230 4.02 1442 3.93Yogurt Yogurt 4-6 oz 6144 .55 6850 .52 4742 .52Yogurt Yogurt 32 oz 1181 2.48 2716 2.36 714 2.83
REGIONAL -- CONVENTIONAL DAIRY PRODUCTS
Commodity Type Pack Size
NORTHEAST U.S. SOUTHEAST U.S. MIDWEST U.S.
Price Range
Stores with Ads
Wtd AvgPrice
Price Range
Stores with Ads
Wtd AvgPrice
Price Range
Stores with Ads
Wtd AvgPrice
Butter 1 # 2.50-3.99 1074 3.48 2.49-3.99 2141 3.57 2.50-3.50 188 3.13
Cheese Natural Varieties 8 oz block 1.67-3.49 1724 2.45 1.29-2.99 2248 2.54 1.29-2.50 1068 1.67
Cheese Natural Varieties 1 # block 3.99-5.99 737 4.57 3.99 214 3.99
Cheese Natural Varieties 2 # block 6.99 63 6.99 6.98 195 6.98
Cheese Natural Varieties 8 oz shred 1.99-3.00 2002 2.37 2.00-2.99 2463 2.58 1.29-3.00 1493 1.99
Cheese Natural Varieties 1 # shred 4.79-4.99 598 4.88
Cottage cheese 16 oz 1.50-2.50 1722 2.03 2.00-3.39 2566 2.28 1.49-2.49 278 2.14
Cream cheese 8 oz 1.50-2.99 484 2.68 1.50-3.00 799 2.88 1.00-1.50 886 1.37
Flavored milk All fat tests gallon 3.99-4.99 286 4.62
Ice cream 48-64oz 2.50-4.29 4139 2.97 2.50-5.99 2959 2.96 1.99-3.99 2094 3.02
Milk All fat tests half gallon 2.19 135 2.19 4.49 69 4.49
Sour cream 16 oz 1.68-2.39 1868 1.93 1.50-2.00 3305 1.95 1.29-2.49 491 1.86
Yogurt Greek 4-6 oz 0.69-1.00 2182 .93 0.70-1.00 4045 .97 0.80-1.00 1316 .87
Yogurt Greek 32 oz 3.47-5.99 1592 4.11 3.50-5.00 301 4.57 3.79-4.99 394 4.64
Yogurt Yogurt 4-6 oz 0.50-0.83 1660 .61 0.25-0.60 1912 .53 0.40-0.60 1070 .52
Yogurt Yogurt 32 oz 2.79-3.50 439 3.28 1.99 286 1.99

National Retail Report - Dairy Vol 87 - No. 11Friday, March 13, 2020 - Page 4
Wtd Avg - Simple weighted average
Commodity Type Pack Size
SOUTH CENTRAL U.S. SOUTHWEST U.S. NORTHWEST U.S.
Price Range
Stores with Ads
Wtd AvgPrice
Price Range
Stores with Ads
Wtd AvgPrice
Price Range
Stores with Ads
Wtd AvgPrice
Butter 1 # 2.50-4.99 408 3.89 2.99-3.99 125 3.49 2.88-3.99 174 3.55
Cheese Natural Varieties 8 oz block 1.99-3.00 200 2.68 1.50-2.99 240 2.05
Cheese Natural Varieties 1 # block 3.99 337 3.99
Cheese Natural Varieties 2 # block 6.99 121 6.99
Cheese Natural Varieties 8 oz shred 1.29-3.00 779 2.37 1.99-3.50 1350 2.78 1.50-2.69 568 2.35
Cheese Natural Varieties 1 # shred 4.58 973 4.58 3.99-4.88 481 4.63 4.88 130 4.88
Cottage cheese 16 oz 1.49-2.00 232 1.78 2.49-2.50 199 2.50 1.67 105 1.67
Cream cheese 8 oz 1.29-2.00 333 1.58 1.49 244 1.49 0.98-1.67 392 1.46
Flavored milk All fat tests half gallon 1.99 246 1.99 3.99 289 3.99
Flavored milk All fat tests gallon 2.50-2.99 210 2.75
Ice cream 48-64oz 2.50-5.99 1254 3.57 2.50-3.99 1545 3.21 2.49-2.50 355 2.50
Milk All fat tests half gallon 1.99 309 1.99
Milk All fat tests gallon 2.39-3.39 254 2.91 2.50-2.99 210 2.75
Sour cream 16 oz 1.49-2.00 306 1.83 2.50 62 2.50
Yogurt Greek 4-6 oz 0.80-1.00 702 .90 0.79-1.00 756 .88 0.80-1.00 804 .91
Yogurt Greek 32 oz 3.47-4.99 1106 3.65 3.47-4.98 481 3.90 3.39-3.47 419 3.41
Yogurt Yogurt 4-6 oz 0.40-0.50 490 .48 0.49-0.60 557 .52 0.39-0.60 455 .55
Yogurt Yogurt 32 oz 1.99 422 1.99
Commodity Type Pack Size
ALASKA U.S. HAWAII U.S.
Price Range
Stores with Ads
Wtd AvgPrice
Price Range
Stores with Ads
Wtd AvgPrice
Butter 1 # 4.99 34 4.99
Cheese Natural Varieties 8 oz block 3.75 34 3.75
Cheese Natural Varieties 1 # block 3.99 11 3.99
Cheese Natural Varieties 8 oz shred 3.75 34 3.75
Cheese Natural Varieties 1 # shred 3.99 11 3.99
Cream cheese 8 oz 1.49 11 1.49
Flavored milk All fat tests half gallon 1.99 21 1.99 2.99 27 2.99
Ice cream 48-64oz 2.50-3.14 54 2.95 3.14-5.49 136 4.57
Milk All fat tests half gallon 1.99 21 1.99 2.99 27 2.99
Sour cream 16 oz 2.50 27 2.50
Yogurt Greek 4-6 oz 0.80-6.00 81 2.67 0.99 27 .99
Yogurt Yogurt 32 oz 2.50 34 2.50
NATIONAL -- ORGANIC DAIRY PRODUCTS
Commodity Type Pack Size THIS PERIOD LAST WEEK LAST YEAR

National Retail Report - Dairy Vol 87 - No. 11Friday, March 13, 2020 - Page 5
Wtd Avg - Simple weighted average
StoresWith Ads
Wtd AvgPrice
StoresWith Ads
Wtd AvgPrice
StoresWith Ads
Wtd AvgPrice
Butter 1 # 121 5.29 918 5.45 108 5.29
Cheese Natural Varieties 8 oz shred 78 3.00 98 3.00 410 3.49
Cottage cheese 16 oz 289 3.99 410 3.99
Cream cheese 8 oz 121 2.50 137 2.50
Milk All fat tests half gallon 2192 3.99 2566 4.24 1341 4.09
Milk All fat tests gallon 428 6.87 361 5.40
Milk All fat tests 8 oz UHT 147 1.25 69 .99 137 1.17
Sour cream 16 oz 121 2.19 245 2.16
Yogurt Greek 4-6 oz 147 1.25
Yogurt Greek 32 oz 62 3.99 147 3.50 214 3.50
Yogurt Yogurt 4-6 oz 137 1.79 411 .89
Yogurt Yogurt 32 oz 597 3.78 298 3.49
REGIONAL -- ORGANIC DAIRY PRODUCTS
Commodity Type Pack Size
NORTHEAST U.S. SOUTHEAST U.S. MIDWEST U.S.
Price Range
Stores with Ads
Wtd AvgPrice
Price Range
Stores with Ads
Wtd AvgPrice
Price Range
Stores with Ads
Wtd AvgPrice
Milk All fat tests half gallon 3.99-4.99 796 4.17 3.50-3.99 502 3.78
Milk All fat tests gallon 6.99 147 6.99
Milk All fat tests 8 oz UHT 1.25 147 1.25
Yogurt Greek 4-6 oz 1.25 147 1.25
Yogurt Greek 32 oz 3.99 62 3.99
Yogurt Yogurt 4-6 oz 1.79 137 1.79
Commodity Type Pack Size
SOUTH CENTRAL U.S. SOUTHWEST U.S. NORTHWEST U.S.
Price Range
Stores with Ads
Wtd AvgPrice
Price Range
Stores with Ads
Wtd AvgPrice
Price Range
Stores with Ads
Wtd AvgPrice
Butter 1 # 5.29 121 5.29
Cheese Natural Varieties 8 oz shred 3.00 78 3.00
Cottage cheese 16 oz 3.99 289 3.99
Cream cheese 8 oz 2.50 121 2.50
Milk All fat tests half gallon 3.99-4.99 438 4.12 3.99 291 3.99 2.99-3.99 165 3.35
Milk All fat tests gallon 7.99 114 7.99 5.99 167 5.99
Sour cream 16 oz 2.19 121 2.19

National Retail Report - Dairy Vol 87 - No. 11Friday, March 13, 2020 - Page 6
Wtd Avg - Simple weighted average
Commodity Type Pack Size
ALASKA U.S. HAWAII U.S.
Price Range
Stores with Ads
Wtd AvgPrice
Price Range
Stores with Ads
Wtd AvgPrice
REGIONAL DEFINITIONS
As used in this report, regions include the following states:
NORTHEAST U.S. Connecticut, Delaware, Massachusetts, Maryland, Maine, New Hampshire, New jersey, New York, Pennsylvania, Rhode Island and Vermont
SOUTHEAST U.S. Alabama, Florida, Georgia, Mississippi, North Carolina, South Carolina, Tennessee, Virginia and West VirginiaMIDWEST U.S. Iowa, Illinois, Indiana, Kentucky, Michigan, Minnesota, North Dakota, Nebraska, Ohio, South Dakota and WisconsinSOUTH CENTRAL U.S. Arkansas, Colorado, Kansas, Louisiana, Missouri, New Mexico, Oklahoma, and TexasSOUTHWEST U.S. Arizona, California, Nevada and UtahNORTHWEST U.S. Idaho, Montana, Oregon, Washington, and WyomingALASKA AlaskaHAWAII HawaiiNATIONAL Continental United States

USDA is an equal opportunity provider and employer
Dairy Market News United States Department of Agriculture
Agricultural Marketing Service Dairy Programs Market Information Branch
Volume 87, Report 11 March 13, 2020
GENERAL NUMBER (608) 422-8587 Elizabeth Frederick (608) 422-8587 [email protected]
ORGANIC/ EAST Daniel Johnson (608) 422-8605 [email protected]
EAST Jessica Mueller (608) 422-8589 [email protected]
CENTRAL Israel Weber (608) 422-8601 [email protected]
SOUTHWEST/SOUTH AMERICA AJ (Angel José) Terán (608) 422-8593 Angel.Terá[email protected]
SOUTHWEST Florence Kone-Gonzalez (608) 422-8594 [email protected]
NORTHWEST/MOUNTAIN Mike Bandli (608) 422-8592 [email protected]
EUROPE/OCEANIA Eric Graf (608) 422-8590 [email protected]
DEPUTY DIRECTOR, DAIRY MARKET NEWS
Janet Linder (608) 422-8588 [email protected] DIRECTOR, DAIRY MARKET NEWS
Butch Speth (608) 422-8586 [email protected]
RECORDED INFORMATION SYSTEM (608) 422-8602
FAX (608) 240-6689 ________________________ USDA, Dairy Market News 4600 American Parkway, STE 106 Madison, WI 53718-8334
Additional Dairy Market News Information: DMN Website: https://www.ams.usda.gov/market-news/dairy
DMN MARS (My Market News): https://mymarketnews.ams.usda.gov/