Embed Size (px)
Citation preview

1
3DS
.CO
M©
Das
saul
tSys
tèm
es| C
MD
201
8
Pascal DALOZEVP, CFO & Corporate Strategy Officer

Multi-Year Growth Plan

3
3DS
.CO
M©
Das
saul
tSys
tèm
es| C
MD
201
8
3DDesign
3D DMUDigital Mock-up
3D PLM Product Lifecycle
ManagementBusiness Experience
Doubling Addressable Market with 3DEXPERIENCE
$4 bn
$8 bn
$16 bn
$32 bn
At current currencies

4
3DS
.CO
M©
Das
saul
tSys
tèm
es| C
MD
201
8
Market Expansion & Market Share Gains
+3pts
PLM MARKET SHARES
Software PLM market including CAD, Simulation,
Product Data Management, Digital Manufacturing
$10bn
PLM
Software
$6bn
Services
$16bn
2012 2017
MARKET EXPANSION
30%
18%
10% 9%
32%
20%
9%
6%
33%
21%
9%
6%
3DS Siemens PLM PTC Autodesk
2015 2016 2017
12 B$ TAM
~$12bnCAD, Product Data
Management, Simulation,
Digital Manufacturing
PLM Software
Scientific Innovation Lifecycle Mgt.
Supply Chain
Digital Marketing;
Program & Portfolio Mgt.
& Analytics;
Manufacturing Operation Mgt
~$4bn
~$9bn
$28bn
Services
~$1bn Fluid & Electromagnetic Simulation
~$2bn
3DEXPERIENCE Software
x3

5
3DS
.CO
M©
Das
saul
tSys
tèm
es| C
MD
201
8
Market Trends & 3DS Perspectives
~$12bn
+8%
+6%
x1.4
+1pt
Market 3DS
$28bn
Faster growth
Market share gainper year
+11%
+9%
15%
85%
2017 Software TAM
~$16bn
CAGR 2017-23 Performance vs market CAGR 2017-232017 share in revenue
PLM
Market
Extended
Market
+7% +9%

6
3DS
.CO
M©
Das
saul
tSys
tèm
es| C
MD
201
8
Growth Drivers
VS
BT
PC
BRANDS
“User Experience” & Communities
INDUSTRIES
“Solution Experience”
GEO AND CHANNELS
“Customer Experience”
Software & Applications Content Services+ +
7
3DS
.CO
M©
Das
saul
tSys
tèm
es| C
MD
201
8
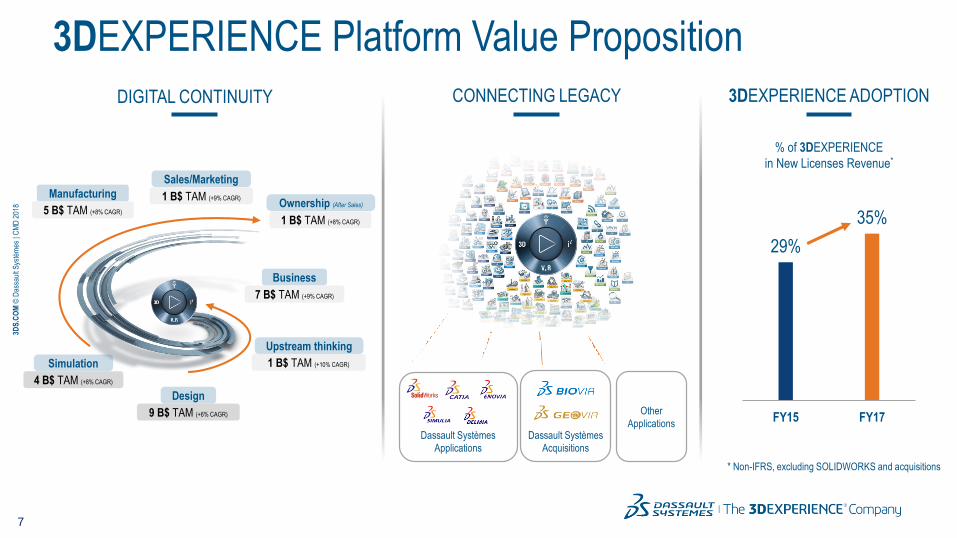
3DEXPERIENCE Platform Value Proposition
29%
35%
FY15 FY17
% of 3DEXPERIENCE
in New Licenses Revenue*
* Non-IFRS, excluding SOLIDWORKS and acquisitions
3DEXPERIENCE ADOPTIONCONNECTING LEGACYDIGITAL CONTINUITY
Upstream thinking
Sales/Marketing
Ownership (After Sales)
Design
Manufacturing
9 B$ TAM (+6% CAGR)
Simulation 1 B$ TAM (+10% CAGR)
1 B$ TAM (+8% CAGR)
1 B$ TAM (+9% CAGR)
5 B$ TAM (+8% CAGR)
4 B$ TAM (+8% CAGR)
Business
7 B$ TAM (+9% CAGR)
Dassault Systèmes
Applications
Dassault Systèmes
Acquisitions
Other
Applications

8
3DS
.CO
M©
Das
saul
tSys
tèm
es| C
MD
201
8
Delivering More Value to Customers
Roles & Apps
Industry Solution Experiences
Industry Process Experiences
Offer
86 Solutions
366 Processes
334 Roles
Value
Enterprise: Business model
Organization: Collaboration
User: Empowerment
Users
Organization
Enterprise
VALUE
DELIVERY
VALUE
COMMITMENT
VALUE
DEFINITION
VALUE
ASSESSMENT
End-to-end transformation engagement
Average new licenses
deal value
Product
Solution
x2
DEALS VALUEVALUE ENGAGEMENT PORTFOLIO VALUE

9
3DS
.CO
M©
Das
saul
tSys
tèm
es| C
MD
201
8
Reaching More Customers
VS
BT
PC
52%
24%
24%
System Integrators contributing to 2017 BT
3DEXPERIENCE new licenses, 6% sourced
and 28% joint
2017 software
revenue share
LOCALGLOBAL
AMERICAS
30%EUROPE
43%ASIA
27%
12 GEOs, 140 countries
Non-IFRS, FY17 % of software revenue
new customers per year
220,000
2017total customers
+26,000
20172016
+23,000
+22,000
2015
CLIENTS BASE

10
3DS
.CO
M©
Das
saul
tSys
tèm
es| C
MD
201
8
Expanding our Footprint with Cloud
15 Million
Providing cloud computing infrastructure services (IaaS)
through 10 data centers
Enabling 3DEXPERIENCE Platform rapid deployment
whatever the size of the company
9 M
CONNECTED USERSCLOUD COVERAGECLOUD OFFER
New YorkSan Jose
Paris
Singapore
Hong Kong
TokyoSeoul
Mumbai
Dublin
2015 2016 2017
12 M
3DS Outscale and other providers
85%of the portfolio
283Roles
R2018xon the Cloud

11
3DS
.CO
M©
Das
saul
tSys
tèm
es| C
MD
201
8
Adapted & Agile Business Model
Our Customers have the choice
On-premise
Cloud
Data safety
Integration in an enterprise architecture
Customization
Cost of ownership
Ready-to-use solution
Reduction of infrastructure costs
Native collaboration
No customization
Upfront + Recurring
Subscription
CAPEX budget
Long-term total cost of ownership
OPEX budget
Short-term return
220
280
167
368
2 Perpetual license of 100€ + support
3 Cloud licenses: 2 in subscription and 1 in upfront + recurring
Cloud revenue
On-premise revenue
comparison basis
No dilution of revenue & growth
CLOUD OPTIONS CLOUD BUSINESS MODEL
1/3from market extension
1/3in Upfront
+ Recurring model
Cloud assumptions
M6 M12 M18 M24
12
3DS
.CO
M©
Das
saul
tSys
tèm
es| C
MD
201
8
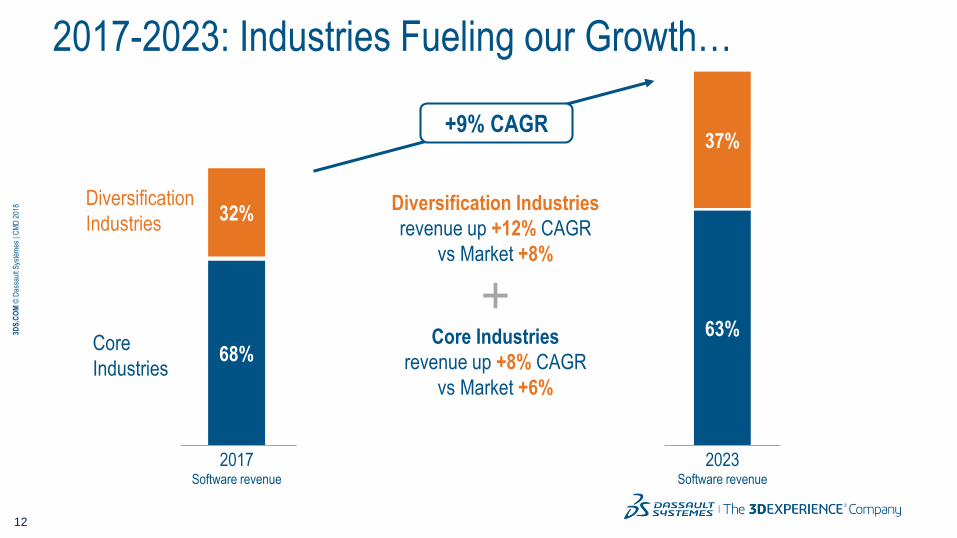
2017-2023: Industries Fueling our Growth…
68%
32%
63%
37%
Diversification Industries
revenue up +12% CAGR
vs Market +8%
2017Software revenue
Core Industries
revenue up +8% CAGR
vs Market +6%
Core
Industries
Diversification
Industries
2023Software revenue
+9% CAGR

13
3DS
.CO
M©
Das
saul
tSys
tèm
es| C
MD
201
8
1/3
2/3
78%
22%
and 3DEXPERIENCE Product Cycle Accelerating Growth
3DEXPERIENCE 3DEXPERIENCE
adoption
Upsell with
3DEXPERIENCE
+9% CAGR
2017Software revenue
2023Software revenue
…
% software
revenue
excluding
acquisitions &
SOLIDWORKS
Acquisitions &
SOLIDWORKS
14
3DS
.CO
M©
Das
saul
tSys
tèm
es| C
MD
201
8
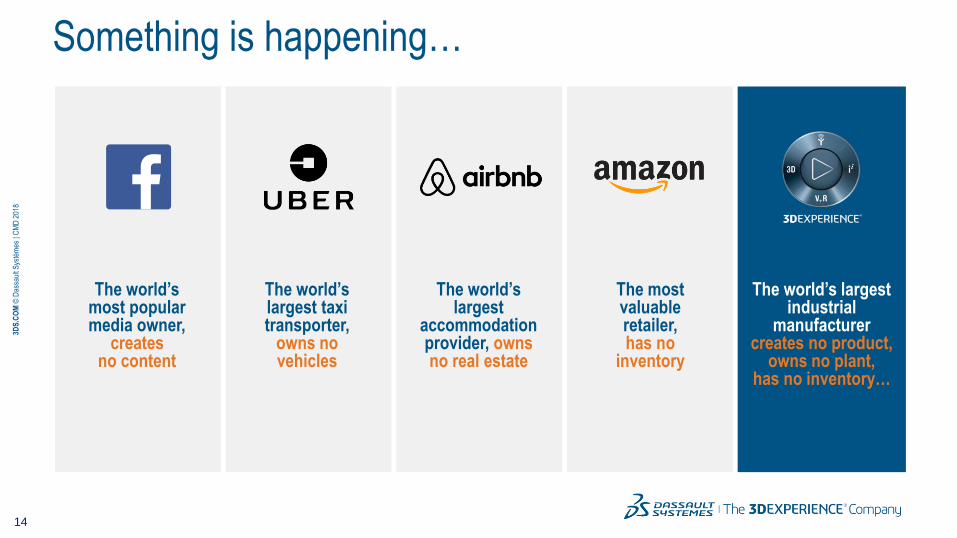
Something is happening…
The world’s most popular media owner,
createsno content
The world’s largest taxi transporter,
owns no vehicles
The world’s largest
accommodation provider, owns no real estate
The most valuable retailer,has no
inventory
The world’s largestindustrial
manufacturercreates no product,
owns no plant,has no inventory…

15
3DS
.CO
M©
Das
saul
tSys
tèm
es| C
MD
201
8
𝐥𝐢𝐦 𝑽 − 𝝋 = 𝟎
lim𝜕𝑡 = 0
lim𝜕𝑑 = 0
lim𝑛 = ∞
A new worldwith new principles
16
3DS
.CO
M©
Das
saul
tSys
tèm
es| C
MD
201
8
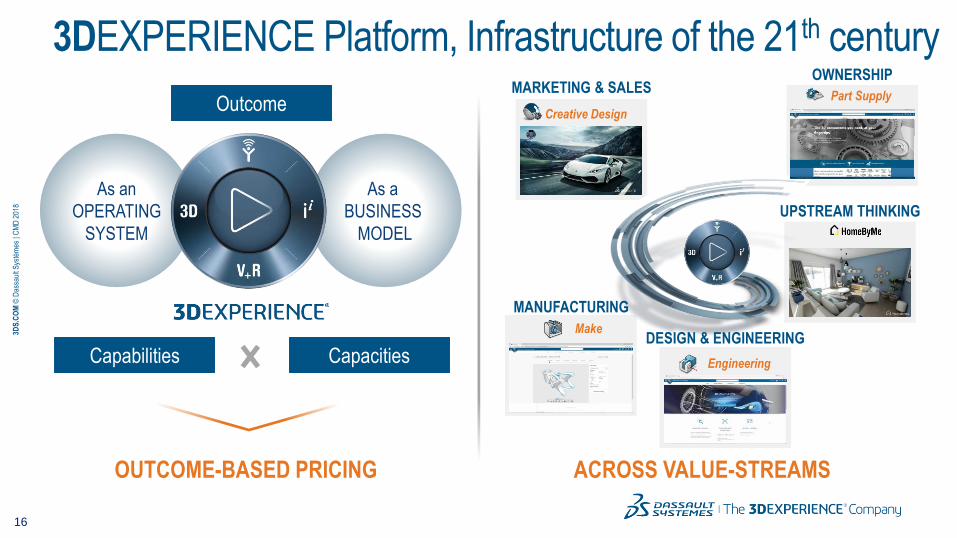
Creative Design
MARKETING & SALES
3DEXPERIENCE Platform, Infrastructure of the 21th century
As a
BUSINESS
MODEL
As an
OPERATING
SYSTEM
Outcome
Capabilities Capacities
UPSTREAM THINKING
Part Supply
OWNERSHIP
Engineering
DESIGN & ENGINEERINGMake
MANUFACTURING
ACROSS VALUE-STREAMSOUTCOME-BASED PRICING

17
3DS
.CO
M©
Das
saul
tSys
tèm
es| C
MD
201
8
Investment Capacity to Fulfill our Purpose
PRODUCT
Life-Science
Health Care
Patient Care
Territories / Cities
Natural Resources
Domain div
Segment div
New usages
1,845 M€ Net financial position
Q1 2018
745 M€ Operating Cash Flow
2017
- Dividends
- Share buybacks
- Acquisitions
1
2
3
NATURE
LIFE

18
3DS
.CO
M©
Das
saul
tSys
tèm
es| C
MD
201
8
Organic ~3.3
~0.2Acquisitions
2019e EPS
Organic revenue growth acceleration
up 2pts
Continued organic margin
improvement
Tax rate improvement by 1pt
Currency appreciation:
USD (1.18/EUR) and JPY (130/EUR)
3.50 €
Pipe of acquisitions
1,50
2,00
2,50
3,00
3,50
2014 2015 2016 2017 2018 2019
2014-2019 Plan Actuals & guidance
2014-2019 EPS Objectives non-IFRS*
in €
** 2018 guidance rates of 1.22 USD/EUR and 134.5 JPY/EUR, and tax rate of 29.7%, as of April 2018
Assumptions compared to 2018 guidance**:
3.50
3.00
2.50
2.001.82
1.501.75
3.50
* non-IFRS (IAS 18)

19
3DS
.CO
M©
Das
saul
tSys
tèm
es| C
MD
201
8
€ 2.83-2.88
€ 6.00EPS:
Keeping currency rates unchanged
with 2018 guidance as of April 2018
2018-2023: 3DS to more than Double EPS non-IFRS*
€ 0.9
€ 1.2
€ 1.0
Industry
Diversification
3DEXPERIENCE
Product Cycle
Acquisitions &
MarketplaceOrganic operating margin
up 50 basis points /year
Tax rate decrease to 27%
€6.00
2018 Guidance 2023 € 2.83-2.88
ASSUMPTIONS
* non-IFRS (IAS 18)

20
3DS
.CO
M©
Das
saul
tSys
tèm
es| C
MD
201
8