Embed Size (px)
Citation preview

Weekly / Vol. 60 / No. 38 September 30, 2011
U.S. Department of Health and Human ServicesCenters for Disease Control and Prevention
Morbidity and Mortality Weekly Report
In the past 2 years, CDC has learned of several clusters of respiratory illness associated with human enterovirus 68 (HEV68), including severe disease. HEV68 is a unique enterovirus that shares epidemiologic and biologic features with human rhinoviruses (HRV) (1). First isolated in California in 1962 from four children with bronchiolitis and pneumonia (2), HEV68 has been reported rarely since that time and the full spectrum of illness that it can cause is unknown. The six clusters of respiratory illness associated with HEV68 described in this report occurred in Asia, Europe, and the United States during 2008–2010. HEV68 infection was associated with respiratory illness ranging from relatively mild illness that did not require hospitalization to severe illness requiring intensive care and mechanical ventilation. Three cases, two in the Philippines and one in Japan, were fatal. In these six clusters, HEV68 disproportionately occurred among children. CDC learned of clusters of HEV68 from public health agencies requesting consultation or diagnostic assistance and from reports presented at scientific conferences. In each cluster, HEV68 was diagnosed by reverse transcription–polymerase chain reaction (RT-PCR) testing targeting the 5’-nontranslated region, followed by partial sequencing of the structural protein genes, VP4-VP2, VP1, or both, to give definitive, enterovirus type-specific information. This report highlights HEV68 as an increasingly recognized cause of respiratory illness. Clinicians should be aware of HEV68 as one of many causes of viral respiratory disease and should report clusters of unexplained respiratory illness to the appropriate public health agency.
Philippines During October 2008–March 2009, an outbreak of HEV68
was detected in the Eastern Visayas region of the Philippines among pediatric patients hospitalized with pneumonia (3). As part of a study of the etiology of pediatric viral respiratory illness, clinical samples from 816 patients hospitalized with pneumonia during May 2008–May 2009 were screened
retrospectively for HEV68 by molecular methods (RT-PCR and partial sequencing); 21 (2.6%) were found to be positive. The virus was first detected in late October 2008, and cases peaked in early December. No cases of HEV68-related illness were found after March 2009. Among the 21 patients with HEV68 infection, 17 (81%) were aged 0–4 years (Table). Common signs and symptoms included cough, difficulty breathing, wheezing, and retractions. Two cases were fatal.
Japan Japan’s Infectious Agent Surveillance Report (IASR) system,
which receives reports from local public health laboratories,* first received sporadic reports of HEV68 in 2005, with ≤10 cases identified each year until 2010. During 2010, an increase in HEV68 cases was observed, with more than 120 cases. Most HEV68 infections occurred during July–October 2010, with detections throughout Japan during this time. Clinical and demographic information was only available on a subset of 11 pediatric patients who were positive for HEV68. Of these 11 HEV68 cases, 10 were in patients diagnosed with acute respiratory illnesses, such as asthmatic bronchitis or pneumonia, and one in a patient with febrile convulsions
INSIDE1305 Current Cigarette Smoking Prevalence Among
Working Adults — United States, 2004–2010 1310 Severe Illness from 2009 Pandemic Influenza A
(H1N1) — Utah, 2009–10 Influenza Season 1315 Progress in Implementing Measles Mortality
Reduction Strategies — India, 2010–20111320 Announcements 1321 Notice to Readers
Clusters of Acute Respiratory Illness Associated with Human Enterovirus 68 — Asia, Europe, and United States, 2008–2010
* Reports, published in Japanese and some in English, are available at http://idsc.nih.go.jp/iasr/virus/virus-e.html.

Morbidity and Mortality Weekly Report
1302 MMWR / September 30, 2011 / Vol. 60 / No. 38
The MMWR series of publications is published by the Office of Surveillance, Epidemiology, and Laboratory Services, Centers for Disease Control and Prevention (CDC), U.S. Department of Health and Human Services, Atlanta, GA 30333.Suggested citation: Centers for Disease Control and Prevention. [Article title]. MMWR 2011;60:[inclusive page numbers].
Centers for Disease Control and PreventionThomas R. Frieden, MD, MPH, Director
Harold W. Jaffe, MD, MA, Associate Director for ScienceJames W. Stephens, PhD, Director, Office of Science Quality
Stephen B. Thacker, MD, MSc, Deputy Director for Surveillance, Epidemiology, and Laboratory ServicesStephanie Zaza, MD, MPH, Director, Epidemiology and Analysis Program Office
MMWR Editorial and Production StaffRonald L. Moolenaar, MD, MPH, Editor, MMWR Series
John S. Moran, MD, MPH, Deputy Editor, MMWR SeriesRobert A. Gunn, MD, MPH, Associate Editor, MMWR Series
Teresa F. Rutledge, Managing Editor, MMWR SeriesDouglas W. Weatherwax, Lead Technical Writer-Editor
Donald G. Meadows, MA, Jude C. Rutledge, Writer-Editors
Martha F. Boyd, Lead Visual Information SpecialistMaureen A. Leahy, Julia C. Martinroe, Stephen R. Spriggs, Terraye M. Starr
Visual Information SpecialistsQuang M. Doan, MBA, Phyllis H. King
Information Technology Specialists
MMWR Editorial BoardWilliam L. Roper, MD, MPH, Chapel Hill, NC, Chairman
Virginia A. Caine, MD, Indianapolis, INJonathan E. Fielding, MD, MPH, MBA, Los Angeles, CA
David W. Fleming, MD, Seattle, WAWilliam E. Halperin, MD, DrPH, MPH, Newark, NJ
King K. Holmes, MD, PhD, Seattle, WADeborah Holtzman, PhD, Atlanta, GA
John K. Iglehart, Bethesda, MDDennis G. Maki, MD, Madison, WI
Patricia Quinlisk, MD, MPH, Des Moines, IAPatrick L. Remington, MD, MPH, Madison, WI
Barbara K. Rimer, DrPH, Chapel Hill, NCJohn V. Rullan, MD, MPH, San Juan, PR
William Schaffner, MD, Nashville, TNAnne Schuchat, MD, Atlanta, GA
Dixie E. Snider, MD, MPH, Atlanta, GAJohn W. Ward, MD, Atlanta, GA
(4). Of the 11 patients, 10 were aged 0–4 years (Table). One fatal case occurred, involving a boy aged 4 years in whom HEV68 was detected by nucleic acid amplification from a pharyngeal swab. The boy, who had been healthy with no underlying disease, arrived at the emergency department in cardiopulmonary arrest and could not be resuscitated (5).
Netherlands During August–November 2010, HEV68 was detected
within a prospective, hospital-based study of respiratory infections in the northern part of the Netherlands. All rhinovirus-positive samples obtained during September 2009–January 2011 were sequenced as part of a validation study. Specimens from 24 patients with acute respiratory illness, including pneumonia, asthma exacerbation, and wheezing,
were positive for HEV68. Among the 24 patients, 23 were hospitalized during their illness, and five required intensive care. Three of the infections were acquired while in the hospital. Half of the 24 patients with HEV68 infection were aged ≥20 years (Table). Chronic underlying illness was present in approximately 80% of patients; no deaths were reported.
The National Institute for Public Health and the Environment also observed an increase in HEV68 infections among patients sampled in 2010 by the Netherlands sentinel general practice network for surveillance of acute respiratory infections among 42 practices. Samples have been collected in this network since 1994 and analyzed by RT-PCR for enteroviruses, allowing for a retrospective characterization of trends. As of the fall of 2010, a substantially greater number of HEV68 infections had occurred throughout the Netherlands that year than in previous years.
United States Georgia. In September 2009, a hospital in Atlanta started
using a new, multipathogen testing system (Luminex xTAG Respiratory Viral Panel [RVP], Luminex Corporation, Austin, Texas) for respiratory viral testing in its laboratory. The system can detect several respiratory viruses, including HRVs and enteroviruses, which are identified by the system only as “entero-rhinovirus.” During the next respiratory illness season, September 2009–April 2010, adult patients at the Atlanta hospital facility who were diagnosed with “entero-rhinovirus” appeared to be more ill than those diagnosed with HRV in
TABLE. Human enterovirus 68 cases, by cluster location and age group — Asia, Europe, and United States, 2008–2010
LocationNo.
overall
Age group (yrs)
0–4 5–9 10–19 ≥20
Total 95 54 11 12 18Japan 11 10 1 0 —*Netherlands 24 11 1 0 12Philippines 21 17 2 2 —*United States 39 16 7 10 6
Georgia 6 0 0 0 6Pennsylvania 28 15 5 8 —*Arizona 5 1 2 2 —*
* Surveillance studies in this area did not include patients aged ≥20 years.

Morbidity and Mortality Weekly Report
MMWR / September 30, 2011 / Vol. 60 / No. 38 1303
previous seasons. Nucleic acid sequencing of 68 specimens from the 2009–2010 season revealed that 62 (91.2%) contained HRV and six (8.8%) contained HEV68. Among the six patients with HEV68 (Table), three were aged >50 years and two were immunocompromised. Five patients had fever and four had cough. One patient had abnormal findings on chest radiography that were attributed to cryptococcosis. No other cases were associated with coinfections. Three patients were hospitalized for a median of 4 days. None of the patients required admission to an intensive-care unit (ICU), and none died.
Pennsylvania. In mid-September 2009, a pediatric hospital in Philadelphia noted more than twice the proportion of respiratory specimens testing positive for HRV by RT-PCR compared with those seen during previous fall HRV seasons. An investigation identified 390 children treated at the hospital during August–October 2009 from whom at least one respiratory specimen was positive for HRV. Respiratory specimens from 66 of these children were sent to CDC for further molecular characterization. HEV68 was identified in 28 (42%) of the specimens. Among the 28 patients with HEV68 infection, 15 (54%) were aged 0–4 years (Table), and 15 were admitted to the ICU. The median duration of hospitalization was 5 days, and none of the patients died.
Arizona. During August–September 2010, hospital officials at an isolated community hospital in rural Arizona noted an increase in pediatric admissions for lower respiratory tract illness. During this time, 43% of pediatric admissions were for respiratory illness, compared with a mean of 17% during the same period in the 3 previous years, a statistically significant difference. Similar illness, characterized by cough and tachypnea or hypoxemia, occurred in 18 patients. Abnormal lung examination result and wheezing, particularly new-onset wheezing, were noted. At least half of children with available chest radiographs had infiltrates. Hospitalization lasted a median of 1.5 days, and no deaths were reported. Despite viral testing and blood cultures performed at the Arizona Department of Health Services on patients with specimens available, no pathogen was detected. Nasopharyngeal specimens of seven patients were sent to CDC for further testing, and HEV68 was identified in five of the patients, one of whom also was positive by RT-PCR testing for Streptococcus pneumonia.
Reported by
Tadatsugu Imamura, Akira Suzuki, MD, PhD, Dept of Virology, Tohoku Univ Graduate School of Medicine, Japan. Adam Meijer, PhD, National Institute for Public Health and the Environment; Hubert G.M. Niesters, PhD, Janette C. Rahamat-Langendoen, MD, Univ Medical Center Groningen, Netherlands. Jose Lojo, MPH, Philadelphia Dept of Health; Richard L. Hodinka, PhD, Susan Coffin, MD, Children’s Hospital of Philadelphia;
Stephen M. Ostroff, MD, Pennsylvania Dept of Health. Colleen S. Kraft, MD, Emory Univ Hospital, Atlanta, Georgia. John T. Redd, MD, Indian Health Svc. Dean D. Erdman, DrPH, Xiaoyan Lu, Mark S. Oberste, PhD, Lauren J. Stockman, MPH, Gregory L. Armstrong, MD, Div of Viral Diseases, National Center for Immunization and Respiratory Diseases; Lara M. Jacobson, MD, Catherine Y. Yen, MD, EIS officers, CDC. Corresponding contributor: Lauren J. Stockman, [email protected], 404-639-2553.
Editorial Note
Enteroviruses and HRV are common, closely related human pathogens in the Picornaviridae family. Most enterovirus infections are asymptomatic. When an enterovirus does cause disease, clinical manifestations vary widely and can include mild upper respiratory illness, febrile rash illness, and neurologic illness, such as aseptic meningitis and encephalitis. In contrast, HEV68 has been associated almost exclusively with respiratory disease (1,6). Since the early 1960s, only sporadic cases of infection with HEV68 have been reported (6,7). Identification of a large number of patients with HEV68 respiratory disease detected during a single season, such as described in this report, is a recent phenomenon.
Whether this increase in recognized cases is attributable to improved diagnostics or whether the clusters themselves represent an emergence of the pathogen is unknown. The technology for isolation of enteroviruses is not new. Viral culture has been available since the 1950s, although antisera for identifying an isolate as HEV68 were not widely available initially. The National Enterovirus Surveillance System, which has collected information on enterovirus isolates in the United States since 1961, recorded 26 isolates during 1987–2005; the highest number in a single year was 11 in 2003 (7).
During the past decade, improvements in nucleic acid amplification methods have increased the sensitivity of
What is already known on this topic?
Human enterovirus 68 (HEV68) is a unique enterovirus that shares epidemiologic and biologic features with human rhinoviruses.
What is added by this report?
Although isolated cases of HEV68 have been reported since the virus was described in 1962, clusters of cases have been recognized only recently. The clusters described in this report occurred late in the typical enterovirus season and included severe cases, three of which were fatal.
What are the implications for public health practice?
Clinicians should be aware of HEV68 as one of many possible causes of viral respiratory disease. Some diagnostic tests might not detect HEV68 or might misidentify it as a human rhinovirus.
Morbidity and Mortality Weekly Report
1304 MMWR / September 30, 2011 / Vol. 60 / No. 38
enterovirus detection and typing. In the clusters reported during 2008–2010, HEV68 was detected by real-time RT-PCR. Some sites used commercial, multipathogen detection systems that can detect enteroviruses. Two such systems, Luminex xTAG RVP and Idaho Technologies (Salt Lake City, Utah) FilmArray Respiratory Panel, are approved by the Food and Drug Administration for use in clinical settings in the United States. Both systems use broadly reactive primers that amplify RNA from either HRVs or enteroviruses (results are reported as “entero-rhinovirus” or “human rhinovirus/enterovirus”).
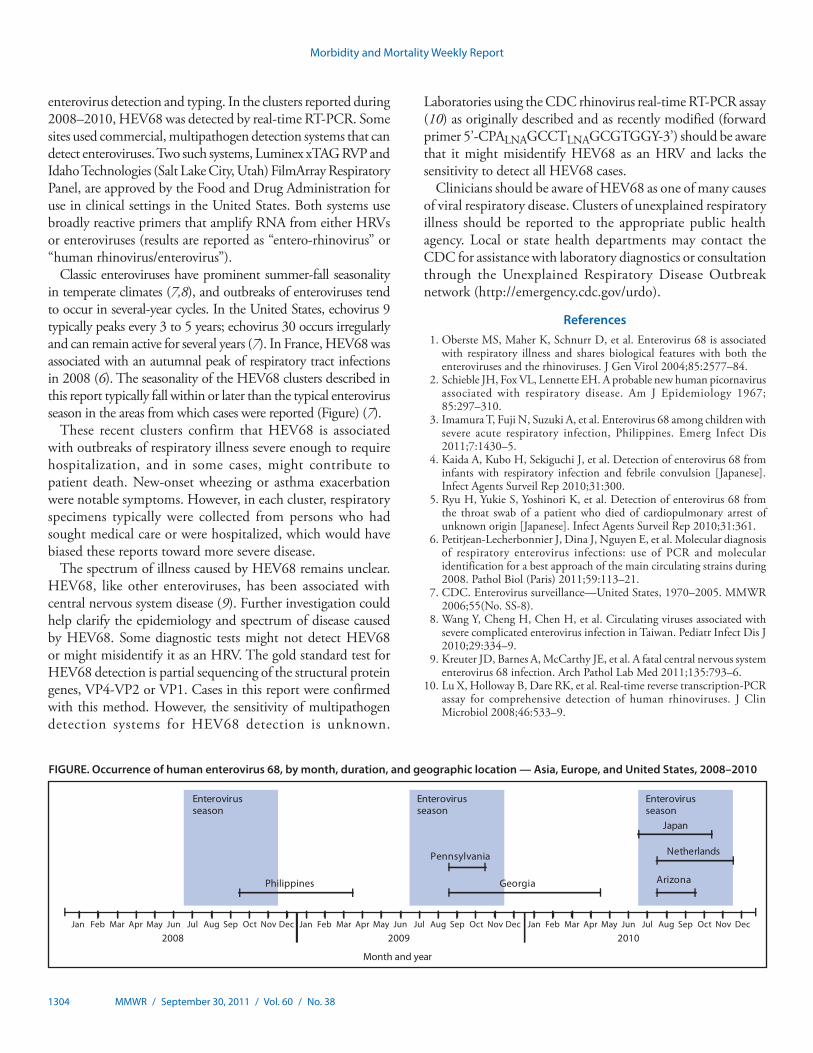
Classic enteroviruses have prominent summer-fall seasonality in temperate climates (7,8), and outbreaks of enteroviruses tend to occur in several-year cycles. In the United States, echovirus 9 typically peaks every 3 to 5 years; echovirus 30 occurs irregularly and can remain active for several years (7). In France, HEV68 was associated with an autumnal peak of respiratory tract infections in 2008 (6). The seasonality of the HEV68 clusters described in this report typically fall within or later than the typical enterovirus season in the areas from which cases were reported (Figure) (7).
These recent clusters confirm that HEV68 is associated with outbreaks of respiratory illness severe enough to require hospitalization, and in some cases, might contribute to patient death. New-onset wheezing or asthma exacerbation were notable symptoms. However, in each cluster, respiratory specimens typically were collected from persons who had sought medical care or were hospitalized, which would have biased these reports toward more severe disease.
The spectrum of illness caused by HEV68 remains unclear. HEV68, like other enteroviruses, has been associated with central nervous system disease (9). Further investigation could help clarify the epidemiology and spectrum of disease caused by HEV68. Some diagnostic tests might not detect HEV68 or might misidentify it as an HRV. The gold standard test for HEV68 detection is partial sequencing of the structural protein genes, VP4-VP2 or VP1. Cases in this report were confirmed with this method. However, the sensitivity of multipathogen detection systems for HEV68 detection is unknown.
Laboratories using the CDC rhinovirus real-time RT-PCR assay (10) as originally described and as recently modified (forward primer 5’-CPALNAGCCTLNAGCGTGGY-3’) should be aware that it might misidentify HEV68 as an HRV and lacks the sensitivity to detect all HEV68 cases.
Clinicians should be aware of HEV68 as one of many causes of viral respiratory disease. Clusters of unexplained respiratory illness should be reported to the appropriate public health agency. Local or state health departments may contact the CDC for assistance with laboratory diagnostics or consultation through the Unexplained Respiratory Disease Outbreak network (http://emergency.cdc.gov/urdo).
References 1. Oberste MS, Maher K, Schnurr D, et al. Enterovirus 68 is associated
with respiratory illness and shares biological features with both the enteroviruses and the rhinoviruses. J Gen Virol 2004;85:2577–84.
2. Schieble JH, Fox VL, Lennette EH. A probable new human picornavirus associated with respiratory disease. Am J Epidemiology 1967; 85:297–310.
3. Imamura T, Fuji N, Suzuki A, et al. Enterovirus 68 among children with severe acute respiratory infection, Philippines. Emerg Infect Dis 2011;7:1430–5.
4. Kaida A, Kubo H, Sekiguchi J, et al. Detection of enterovirus 68 from infants with respiratory infection and febrile convulsion [Japanese]. Infect Agents Surveil Rep 2010;31:300.
5. Ryu H, Yukie S, Yoshinori K, et al. Detection of enterovirus 68 from the throat swab of a patient who died of cardiopulmonary arrest of unknown origin [Japanese]. Infect Agents Surveil Rep 2010;31:361.
6. Petitjean-Lecherbonnier J, Dina J, Nguyen E, et al. Molecular diagnosis of respiratory enterovirus infections: use of PCR and molecular identification for a best approach of the main circulating strains during 2008. Pathol Biol (Paris) 2011;59:113–21.
7. CDC. Enterovirus surveillance—United States, 1970–2005. MMWR 2006;55(No. SS-8).
8. Wang Y, Cheng H, Chen H, et al. Circulating viruses associated with severe complicated enterovirus infection in Taiwan. Pediatr Infect Dis J 2010;29:334–9.
9. Kreuter JD, Barnes A, McCarthy JE, et al. A fatal central nervous system enterovirus 68 infection. Arch Pathol Lab Med 2011;135:793–6.
10. Lu X, Holloway B, Dare RK, et al. Real-time reverse transcription-PCR assay for comprehensive detection of human rhinoviruses. J Clin Microbiol 2008;46:533–9.
Enterovirus season
Enterovirus season
2008 2009 2010NovOctSepAugJulJunMayAprMarFebJan Dec
Philippines Georgia
Japan
Netherlands
Enterovirus season
Pennsylvania
Arizona
Month and year
NovOctSepAugJulJunMayAprMarFebJan Dec NovOctSepAugJulJunMayAprMarFebJan Dec
FIGURE. Occurrence of human enterovirus 68, by month, duration, and geographic location — Asia, Europe, and United States, 2008–2010

Morbidity and Mortality Weekly Report
MMWR / September 30, 2011 / Vol. 60 / No. 38 1305
Cigarette smoking is among the most important modifiable risk factors for adverse health outcomes and a major cause of morbidity and mortality (1). Current cigarette smoking prevalence among all adults aged ≥18 years has decreased 42.4% since 1965, but declines in current smoking prevalence have slowed during the past 5 years (declining from 20.9% in 2005 to 19.3% in 2010) and did not meet the Healthy People 2010 (HP2010) objective to reduce cigarette smoking among adults to ≤12% (1–3). Targeted workplace tobacco control interventions have been effective in reducing smoking prevalence and exposure to secondhand smoke (4,5); therefore, CDC analyzed National Health Interview Survey (NHIS) data for 2004–2010 to describe current cigarette smoking prevalence among currently working U.S. adults by industry and occupation. This report describes the results of that analysis, which found that, overall, age-adjusted cigarette smoking prevalence among working adults was 19.6% and was highest among those with less than a high school education (28.4%), those with no health insurance (28.6%), those living below the federal poverty level (27.7%), and those aged 18–24 years (23.8%). Substantial differences in smoking prevalence were observed across industry and occupation groups. By industry, age-adjusted cigarette smoking prevalence among working adults ranged from 9.7% in education services to 30.0% in mining; by occupation group, prevalence ranged from 8.7% in education, training, and library to 31.4% in construction and extraction. Although some progress has been made in reducing smoking prevalence among working adults, additional effective employer interventions need to be implemented, including health insurance coverage for cessation treatments, easily accessible help for those who want to quit, and smoke-free workplace policies.
NHIS data are collected annually from a nationally representative sample of the noninstitutionalized U.S. population aged ≥18 years through a personal interview. One adult per family is selected randomly and asked to participate in the survey. The survey response rates ranged from 60.8% in 2010 to 72.5% in 2004. For this analysis, current cigarette smokers were defined as adults (aged ≥18 years) who reported having smoked ≥100 cigarettes during their lifetime and who currently smoke every day or some days. Survey participants were considered currently working if, when asked about their employment status during the week before their interview, they responded, “working at a job or business,” “with a job or
business but not at work,” or “working, but not for pay, at a family-owned job or business.”* Information on participants’ current industry and occupation was coded by trained coders and grouped into 21 industry groups and 23 occupation groups.†
To improve the precision and reliability of the estimates, CDC combined 7 years of NHIS data collected during 2004–2010. Sample weights were used to account for the complex sample design. Estimates were age-adjusted to the 2000 U.S. standard population consistent with HP2010 methodology.
During 2004–2010, of the estimated 223 million adults aged ≥18 years, 141 million (63.3%) were employed during the week before the interview. Current cigarette smoking prevalence among currently working adults decreased with increasing age (p<0.05), with 23.8% among those aged 18–24 years and 10.2% among those aged ≥65 years. Age-adjusted prevalence was 19.6% for all currently working adults and was highest among males (21.5%), non-Hispanic whites (21.5%), those whose level of education was less than a high school diploma (28.4%), those living below the federal poverty level§ (27.7%), and those with no health insurance coverage (28.6%) (Table 1).
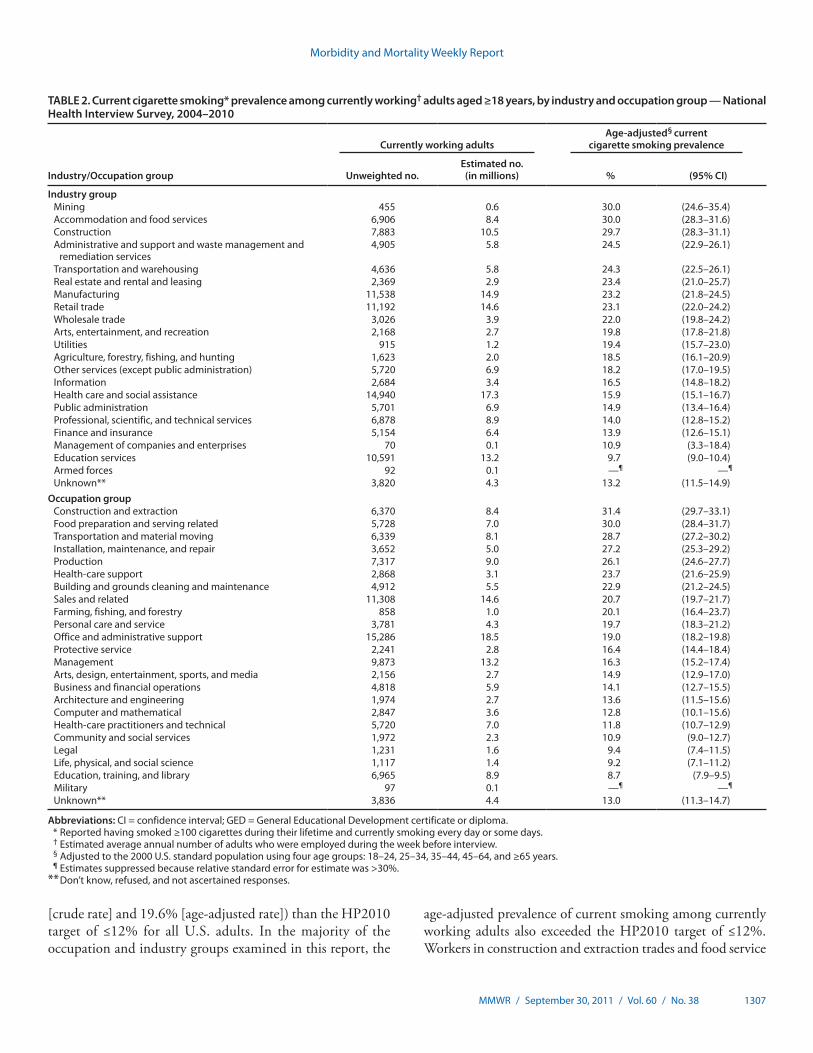
Age-adjusted prevalence of current smoking in 18 of 21 industry groups and 17 of 23 occupation groups was higher than the HP2010 target of ≤12% for smoking prevalence among all adults. Age-adjusted prevalence of current cigarette smoking was >29% among workers in mining (30.0%), accommodation and food services (30.0%), and construction (29.7%) industry groups and among workers in construction and extraction (31.4%) and food preparation and serving-related (30.0%) occupation groups. The age-adjusted prevalence of current smoking was lowest among workers in the education services industry (9.7%) and among workers in the education, training, and library occupation (8.7%) (Table 2).
Current Cigarette Smoking Prevalence Among Working Adults — United States, 2004–2010
* Additional information about the NHIS questionnaire is available at http://www.cdc.gov/nchs/nhis/quest_data_related_1997_forward.htm.
† Additional information about industry and occupation groups and codes are available at ftp://ftp.cdc.gov/pub/health_statistics/nchs/dataset_documentation/nhis/2009/samadult_layout.pdf and ftp://ftp.cdc.gov/pub/health_statistics/nchs/dataset_documentation/nhis/2008/naics_sectors_and_subsectors08.pdf.
§ Poverty status is based on family income and family size using the U.S. Census Bureau’s poverty thresholds for the previous calendar year. In NHIS, ‘‘poor’’ persons are defined as having incomes below the poverty threshold, ‘‘near poor’’ are defined as having incomes of 100% to less than 200% of the poverty threshold, and ‘‘not poor’’ are defined as having incomes that are 200% of the poverty threshold or greater. Additional information available at ftp://ftp.cdc.gov/pub/health_statistics/nchs/dataset_documentation/nhis/2008/srvydesc.pdf.

Morbidity and Mortality Weekly Report
1306 MMWR / September 30, 2011 / Vol. 60 / No. 38
Reported by
Girija Syamlal, MPH, Jacek M. Mazurek, MD, Div of Respiratory Disease Studies, National Institute for Occupational Safety and Health; Ann M. Malarcher, PhD, Office on Smoking and Health, National Center for Chronic Disease Prevention and Health Promotion, CDC. Corresponding contributor: Girija Syamlal, [email protected], 304-285-5827.
Editorial Note
Current smoking prevalence (unadjusted) among currently working adults aged ≥18 years declined from 27.8% during 1987–1994 to 24.5% during 1997–2004 (6). This report indicates that although slight declines in smoking prevalence have occurred since 1997–2004 among currently working adults, the prevalence of smoking remains higher (21.0%
TABLE 1. Current cigarette smoking* prevalence among currently working† adults aged ≥18 years, by selected characteristics — National Health Interview Survey, 2004–2010
Characteristic
Currently working adults Cigarette smoking prevalence§
Unweighted no. Estimated no. (in millions) % (95% CI)
Age group (yrs)
18–24 12,045 18.1 23.8 (22.8–24.9)
25–34 26,015 31.1 23.5 (22.8–24.2) 35–44 27,757 33.4 21.0 (20.3–21.6) 45–64 42,367 53.0 19.8 (19.2–20.3)
≥65 5,082 5.3 10.2 (9.2–11.1)
SexMale 56,070 75.5 21.5 (21.0–22.0)Female 57,196 65.4 17.4 (17.0–17.8)
Race/EthnicityWhite, non-Hispanic 69,035 98.3 21.5 (21.1–22.0)Black, non-Hispanic 16,645 15.8 17.9 (17.0–18.8)Hispanic 21,017 19.3 14.2 (13.4–15.0)Other 6,569 7.5 14.2 (13.0–15.4)
EducationLess than high school diploma 13,868 15.1 28.4 (27.3–29.5)High school/GED 29,164 37.3 27.1 (26.4–27.8)Some college 34,807 43.5 21.0 (20.3–21.6)Bachelor, masters, or higher degree 34,586 44.1 9.1 (8.7–9.6)Unknown 841 1.0 20.4 (16.1–24.8)
Poverty status¶
Poor 8,628 8.1 27.7 (26.2–29.1)Near poor 15,411 16.5 26.3 (25.3–27.3)Not poor 73,404 97.4 18.1 (17.7–18.5)Unknown 15,823 19.0 19.1 (18.3–19.9)
Health insurance statusInsured 91,240 115.7 17.5 (17.2–17.9)Uninsured 21,673 24.7 28.6 (27.4–29.9)Unknown 353 0.5 17.6 (12.2–22.9)
U.S. census region**Northeast 18,719 25.1 18.7 (17.7–19.6)Midwest 26,151 34.8 21.7 (21.0–22.4)South 41,422 50.3 20.8 (20.2–21.4)West 26,974 30.7 15.9 (15.2–16.6)
Total 113,266 19.6 (19.2–20.0)
Abbreviations: CI = confidence interval; GED = General Educational Development certificate or diploma. * Reported having smoked ≥100 cigarettes during their lifetime and currently smoking every day or some days. Current smoking prevalence in all adults (working
and nonworking) was 19.3%. † Estimated average annual number of adults who were employed during the week before interview. § Estimates were age-adjusted using the 2000 U.S. population as the standard population and five age groups: 18–24, 25–34, 35–44, 45–64, and ≥65 years. Estimates
by education status were adjusted using four age groups: 18–24, 25–44, 45–64, and ≥65 years. ¶ Poverty status is based on family income and family size using the U.S. Census Bureau’s poverty thresholds for the previous calendar year. ‘‘Poor’’ persons are defined
as below the poverty threshold. ‘‘Near poor’’ persons have family incomes of 100% to less than 200% of the poverty threshold. ‘‘Not poor’’ persons have family incomes that is 200% of the poverty threshold or greater. Additional information available at ftp://ftp.cdc.gov/pub/health_statistics/nchs/dataset_documentation/nhis/2008/srvydesc.pdf.
** Northeast: Connecticut, Maine, Massachusetts, New Jersey, New Hampshire, New York, Pennsylvania, Rhode Island, and Vermont; Midwest: Illinois, Indiana, Iowa, Kansas, Michigan, Minnesota, Missouri, Nebraska, North Dakota, Ohio, South Dakota, and Wisconsin; South: Alabama, Arkansas, Delaware, District of Columbia, Florida, Georgia, Kentucky, Louisiana, Maryland, Mississippi, North Carolina, Oklahoma, South Carolina, Tennessee, Texas, Virginia, and West Virginia; West: Alaska, Arizona, California, Colorado, Hawaii, Idaho, Montana, New Mexico, Nevada, Oregon, Utah, Washington, and Wyoming.
Morbidity and Mortality Weekly Report
MMWR / September 30, 2011 / Vol. 60 / No. 38 1307
[crude rate] and 19.6% [age-adjusted rate]) than the HP2010 target of ≤12% for all U.S. adults. In the majority of the occupation and industry groups examined in this report, the
age-adjusted prevalence of current smoking among currently working adults also exceeded the HP2010 target of ≤12%. Workers in construction and extraction trades and food service
TABLE 2. Current cigarette smoking* prevalence among currently working† adults aged ≥18 years, by industry and occupation group — National Health Interview Survey, 2004–2010
Industry/Occupation group
Currently working adultsAge-adjusted§ current
cigarette smoking prevalence
Unweighted no.Estimated no. (in millions) % (95% CI)
Industry groupMining 455 0.6 30.0 (24.6–35.4)Accommodation and food services 6,906 8.4 30.0 (28.3–31.6)Construction 7,883 10.5 29.7 (28.3–31.1)Administrative and support and waste management and
remediation services4,905 5.8 24.5 (22.9–26.1)
Transportation and warehousing 4,636 5.8 24.3 (22.5–26.1)Real estate and rental and leasing 2,369 2.9 23.4 (21.0–25.7)Manufacturing 11,538 14.9 23.2 (21.8–24.5)Retail trade 11,192 14.6 23.1 (22.0–24.2)Wholesale trade 3,026 3.9 22.0 (19.8–24.2)Arts, entertainment, and recreation 2,168 2.7 19.8 (17.8–21.8)Utilities 915 1.2 19.4 (15.7–23.0)Agriculture, forestry, fishing, and hunting 1,623 2.0 18.5 (16.1–20.9)Other services (except public administration) 5,720 6.9 18.2 (17.0–19.5)Information 2,684 3.4 16.5 (14.8–18.2)Health care and social assistance 14,940 17.3 15.9 (15.1–16.7)Public administration 5,701 6.9 14.9 (13.4–16.4)Professional, scientific, and technical services 6,878 8.9 14.0 (12.8–15.2)Finance and insurance 5,154 6.4 13.9 (12.6–15.1)Management of companies and enterprises 70 0.1 10.9 (3.3–18.4)Education services 10,591 13.2 9.7 (9.0–10.4)Armed forces 92 0.1 —¶ —¶
Unknown** 3,820 4.3 13.2 (11.5–14.9)Occupation group
Construction and extraction 6,370 8.4 31.4 (29.7–33.1)Food preparation and serving related 5,728 7.0 30.0 (28.4–31.7)Transportation and material moving 6,339 8.1 28.7 (27.2–30.2)Installation, maintenance, and repair 3,652 5.0 27.2 (25.3–29.2)Production 7,317 9.0 26.1 (24.6–27.7)Health-care support 2,868 3.1 23.7 (21.6–25.9)Building and grounds cleaning and maintenance 4,912 5.5 22.9 (21.2–24.5)Sales and related 11,308 14.6 20.7 (19.7–21.7)Farming, fishing, and forestry 858 1.0 20.1 (16.4–23.7)Personal care and service 3,781 4.3 19.7 (18.3–21.2)Office and administrative support 15,286 18.5 19.0 (18.2–19.8)Protective service 2,241 2.8 16.4 (14.4–18.4)Management 9,873 13.2 16.3 (15.2–17.4)Arts, design, entertainment, sports, and media 2,156 2.7 14.9 (12.9–17.0)Business and financial operations 4,818 5.9 14.1 (12.7–15.5)Architecture and engineering 1,974 2.7 13.6 (11.5–15.6)Computer and mathematical 2,847 3.6 12.8 (10.1–15.6)Health-care practitioners and technical 5,720 7.0 11.8 (10.7–12.9)Community and social services 1,972 2.3 10.9 (9.0–12.7)Legal 1,231 1.6 9.4 (7.4–11.5)Life, physical, and social science 1,117 1.4 9.2 (7.1–11.2)Education, training, and library 6,965 8.9 8.7 (7.9–9.5)Military 97 0.1 —¶ —¶
Unknown** 3,836 4.4 13.0 (11.3–14.7)
Abbreviations: CI = confidence interval; GED = General Educational Development certificate or diploma. * Reported having smoked ≥100 cigarettes during their lifetime and currently smoking every day or some days. † Estimated average annual number of adults who were employed during the week before interview. § Adjusted to the 2000 U.S. standard population using four age groups: 18–24, 25–34, 35–44, 45–64, and ≥65 years. ¶ Estimates suppressed because relative standard error for estimate was >30%. ** Don’t know, refused, and not ascertained responses.

Morbidity and Mortality Weekly Report
1308 MMWR / September 30, 2011 / Vol. 60 / No. 38
occupations continue to have the highest smoking prevalence (6). Higher levels of smoking were observed among workers aged 18–24 years, male workers, those with high school or less education, those with no health insurance coverage, and those living below the federal poverty level. Similar findings of higher cigarette smoking prevalences in these specific groups have been reported among the overall U.S. adult population (2).
During 2000–2004, cigarette smoking and exposure to tobacco smoke resulted in approximately 443,000 premature deaths, $97 billion in productivity losses, and $96 billion in health-care costs annually (7). Smoking increases the adverse health risks of occupational exposure; for example, a 50-fold increase in lung cancer incidence was reported among smokers who were exposed to asbestos (6). Smoking in the workplace not only affects the individual’s health but also exposes coworkers to secondhand smoke. Homes and workplaces are the predominant locations for exposure to secondhand smoke (7). Exposure to secondhand smoke causes lung cancer, heart disease, and respiratory illnesses (7,8). Although workplace policies or exposures to secondhand smoke were not assessed in this study, national surveys have shown that the proportion of smoke-free worksites was lower in agriculture, forestry, fishing, mining, and construction and higher in professional and related services (7).
Several intervention and prevention measures have been shown to be effective in reducing smoking prevalence and exposure to secondhand smoke (1,4,8). Such measures
What is already known on this topic?
Smoking prevalence varies by occupation among U.S. working adults. Targeted workplace tobacco control interventions have been effective in reducing smoking prevalence and exposure to secondhand smoke.
What is added by this report?
This report provides information on age-adjusted cigarette smoking prevalence among currently working adults aged ≥18 years for 2004–2010. Age-adjusted current smoking prevalence varied by industry and occupation group. The highest prevalence of smoking was observed among workers in mining, accommodation and food services, and construction industries, and among workers in construction and extraction occupation groups. The age-adjusted prevalences among specific occupations and industries were nearly two and a half times higher than the target of the Healthy People 2010 objective to reduce cigarette smoking among adults to ≤12%.
What are the implications for public health practice?
Employers, businesses, trade associations, and worker representatives need to work in partnership with their state and local health departments in implementing evidence-based policies and programs to reduce the prevalence of smoking among the working population.
include smoke-free workplace policies; individual, group, and telephone-based smoking cessation counseling; cessation medications; tailored print or web-based cessation materials; and comprehensive insurance coverage for effective cessation treatments (1,4,8,9). These proven effective interventions should be strengthened, specifically in workplaces with higher smoking prevalences. To reduce smoking among their workers, employers should ensure that effective tobacco dependence treatments (counseling and medication) are a part of the basic benefits package for all health insurance plans that cover their employees (9). The benefits should include all seven of the cessation medications approved by the Food and Drug Administration (FDA) as well as group, individual, and telephone counseling, with no copayments or other utilization restrictions (9). The Patient Protection and Affordable Care Act of 2010 requires new private health insurance plans to offer their members evidence-based smoking cessation services without cost-sharing and should result in increased cessation among working adults.¶ Employers should educate all employees about the availability of these treatments and encourage their use. In addition, employers, businesses, trade associations, and worker representatives should work together with their state and local health departments in implementing policies and programs to reduce smoking prevalence among the working population.
Providing coverage for tobacco dependence treatment will increase access to services, which will improve the health of employees and result in lower rates of absenteeism and lower utilization of health care resources (9). Workplace interventions also can be tailored to the interests, challenges, and needs of particular industry or occupation groups, and these can be combined with incentives to reduce tobacco use among workers (e.g., by offering rewards to individual workers and to teams as a motivation to participate in a cessation program) (1,4,8). Results from this report help identify industry and occupation groups with high smoking prevalence that are in need of targeted smoking cessation programs, especially among those industry and occupation groups with a relatively large population of workers that otherwise might not be reached (e.g., younger men, who generally are less likely to visit a physician or participate in health promotion activities available at primary-care centers) (4).
The findings in this report are subject to at least three limitations. First, the collected employment information applied only to the week before the interview. Some workers might have changed jobs and thus might have been in a different occupation or industry before the time of the survey. However, CDC conducted additional analyses examining longest held
¶ Additional information available at http://www.dol.gov/ebsa/healthreform.

Morbidity and Mortality Weekly Report
MMWR / September 30, 2011 / Vol. 60 / No. 38 1309
job and found similar results (i.e., higher smoking prevalences in mining and construction industries and in construction and extraction occupations). Second, the data in this report represent major industry/occupation groups, which limits identification of specific industries and occupations associated with cigarette smoking. Finally, the extent of underreporting or overreporting of cigarette smoking could not be determined because smoking information was self-reported and was not validated by biochemical tests. However, comparison of self-reported smoking status with results of measured serum cotinine levels suggests generally high levels of validity and results in similar population estimates (10).
To maximize the health of employees, employers need to integrate comprehensive and effective smoking cessation programs with other worksite programs including health promotion programs in their workplace (8). Smoke-free workplace policies also increase cessation among employees who smoke (8). Comprehensive smoking cessation program benefits should be offered and promoted to increase awareness and program utilization by employees and other enrollees, and the benefits of use of such programs should be monitored and evaluated. CDC’s A Practical Guide to Working with Health-Care Systems on Tobacco-Use Treatment** provides key information and practical advice to help public health professionals and employers improve their understanding of health-care systems, improve availability and use of evidence-based tobacco dependence treatments by employees, and increase smoking cessation. In January 2011, the Federal Employees Health Benefits (FEHB) Program began offering expanded tobacco cessation interventions to nearly 8 million federal employees, retirees, dependents, and spouses.†† The program includes all seven FDA-approved cessation medications as well as individual, group, and telephone counseling, with no copayments, coinsurance, or deductibles. It will cover at least two quit attempts per year, with a minimum of four counseling sessions of at least 30 minutes for each attempt. The FEHB coverage requirements can be used as a model for other public and private insurance plans for implementation of comprehensive cessation coverage.
Acknowledgments
Robert M. Castellan, Div of Respiratory Disease Studies, National Institute for Occupational Safety and Health; Martha Engstrom, Lauren K. Shaw, Office on Smoking and Health, National Center for Chronic Disease Prevention and Health Promotion, CDC.
References 1. CDC. How tobacco smoke causes disease: the biology and behavioral
basis smoking-attributable disease: a report of the Surgeon General. Atlanta, GA: US Department of Health and Human Services, CDC; 2010:647–54. Available at http://www.surgeongeneral.gov/library/tobaccosmoke/report/full_report.pdf. Accessed August 16, 2011.
2. CDC. Vital Signs: current cigarette smoking among adults aged ≥18 years—United States, 2009. MMWR 2010;60:1207–12.
3. US Department of Health and Human Services. Objective 27-1a: reduce smoking rates among adults. Healthy People 2010. Washington DC: US Department of Health and Human Services; 2000. Available at ftp://ftp.cdc.gov/pub/health_statistics/nchs/datasets/data2010/focusarea27/o2701a.pdf. Accessed August 16, 2011.
4. Cahill K, Moher M, Lancaster T. Workplace interventions for smoking cessation. Cochrane Database Syst Rev 2008;(4):CD003440.
5. Task Force on Community Preventive Services. The guide to community preventive services: what works to promote health: part 1: changing risk behaviors and addressing environmental challenges. Tobacco [Chapter 1]. New York, NY: Oxford University Press; 2005. Available at http://www.thecommunityguide.org/tobacco/tobacco.pdf. Accessed August 16, 2011.
6. Lee DJ, Fleming LE, Arheart KL, et al. Smoking rate trends in U.S. occupational groups: the 1987 to 2004 National Health Interview Survey. J Occup Environ Med 2007;49:75–81.
7. CDC. Smoking-attributable mortality, years of potential life lost, and productivity losses—United States, 2000–2004. MMWR 2008; 57:1226–8.
8. CDC. The health consequences of involuntary exposure to tobacco smoke: a report of the Surgeon General. Atlanta, Georgia: US Department of Health and Human Services, CDC; 2006:141–58. Available at http://www.surgeongeneral.gov/library/secondhandsmoke/index.html. Accessed August 16, 2011.
9. Fiore MC, Jaen CR, Baker TB, et al. Treating tobacco use and dependence: 2008 update. Clinical practice guideline. Rockville, MD: US Department of Health and Human Services, Public Health Service; 2008. Available at http://www.surgeongeneral.gov/tobacco/treating_tobacco_use08.pdf. Accessed November 1, 2010.
10. Caraballo RS, Giovino GA, Pechacek TF, Mowery PD. Factors associated with discrepancies between self-reports on cigarette smoking and measured serum cotinine levels among person aged 17 years or older: third National Health and Nutrition Survey, 1988–1994. Am J Epidemiol 2001;153:807–14.
** Available at http://www.cdc.gov/tobacco/quit_smoking/cessation/practical_guide/index.htm.
†† Additional information available at http://www.opm.gov/carrier/carrier_letters/2010/2010-06.pdf.

Morbidity and Mortality Weekly Report
1310 MMWR / September 30, 2011 / Vol. 60 / No. 38
Influenza-associated hospitalizations have been a reportable condition in Utah since 2005, and surveillance for influenza hospitalizations has been a valuable tool for identifying and tracking the population impact of serious influenza illness. During the 2009 influenza A (H1N1) pandemic, Utah public health officials used comparisons with hospitalization data from three previous influenza seasons to rapidly assess the impact of 2009 H1N1 and enable public health authorities to target persons at greatest risk for severe illness. This report summarizes the results of that assessment, which determined that 1,327 2009 H1N1 hospitalizations were reported, compared with an average of 435 seasonal influenza hospitalizations during three previous influenza seasons, and 25.5% of 2009 H1N1 hospitalizations resulted in severe illness (intensive-care unit [ICU] admission or death), compared with 14.0% of seasonal influenza hospitalizations. In addition, 2009 H1N1 disproportionately affected racial/ethnic minorities, pregnant women, and residents of Salt Lake County (the state’s most densely populated county). During the 4-month “spring wave” of the H1N1 pandemic, a greater percentage of hospitalizations (30.9%) resulted in severe illness than during the 9-month “fall wave” (23.0%). Surveillance for influenza hospitalizations can provide essential data to public health authorities that will help them identify those populations at greatest risk for severe illness.
All confirmed and probable influenza-associated hospitalizations* reported by infection-prevention programs and laboratories in the state from April 27, 2009, to May 21, 2010, were analyzed by the Utah Department of Health. Because subtyping data from the Unified State Laboratory: Public Health indicated that 99% of all circulating influenza viruses were 2009 H1N1, all influenza hospitalizations during this period were considered to have resulted from pandemic influenza. Pandemic hospitalizations were compared with confirmed and probable seasonal influenza-associated hospitalizations reported during three previous influenza seasons (2005–06, 2006–07, and 2007–08). Data from the 2008–09 influenza season were not used because of overlap with the 2009 H1N1 spring wave. Additionally, cases occurring during the 4-month 2009 H1N1 spring wave (April 27, 2009–August 29, 2009) were compared with cases during the 9-month “fall wave”
(August 30, 2009–May 21, 2010). Data collected by medical chart reviews and investigations by local health department personnel included demographic information, illness onset dates, laboratory results, comorbid conditions, and number of severe illnesses (defined as ICU admission or death) among persons hospitalized. In this analysis, racial/ethnic minorities were defined as all persons who were not non-Hispanic whites.
Rates were calculated using the total state population as a denominator. Chi-square tests were used to assess the significance of differences between 2009 H1N1 and seasonal hospitalizations by illness severity, race/ethnicity, county of residence, age group, and comorbid conditions and to assess the differences between spring and fall waves of 2009 H1N1 hospitalizations by illness severity, race/ethnicity, county of residence, and age group.
During the 2009 H1N1 pandemic, 1,327 influenza hospitalizations were reported; 423 (15.6 cases per 100,000 persons) were reported during the 4-month spring wave, and 904 (32.8 cases per 100,000) during the 9-month fall wave (Table 1). By comparison, an average of 435 influenza hospitalizations (range: 281–511) (15.8 cases per 100,000) were reported during three previous influenza seasons (Figure). During the 2009 H1N1 pandemic period (April 27, 2009 to May 21, 2010), hospitalization rates, by age group, were as follows: 105.4 cases per 100,000 among persons aged 0–4 years, 40.5 among those aged 5–24 years, 38.0 among those aged 25–49 years, 55.3 among those aged 50–64 years, and 45.3 among those aged ≥65 years. By comparison, average hospitalization rates for the three previous seasons for these age groups were, 57.2, 5.7, 5.6, 12.1, and 55.5 cases per 100,000 population, respectively.
Pandemic H1N1 influenza resulted in more severe illness than seasonal influenza, with 25.5% of pandemic hospitalizations resulting in death or ICU admission, compared with 14.0% of seasonal hospitalizations during the 2007–08 influenza season (p<0.01) (Table 2). Severity increased with age. The percentage of 2009 H1N1 hospitalizations resulting in severe illness ranged from 12.2% among children aged 0–4 years to 42.2% among adults aged ≥65 years. The percentage of 2009 H1N1 hospitalizations resulting in death was zero among persons aged 0–4 years, 2.4% among those aged 5–24 years, 5.2% among those aged 25–49 years, 5.7% among those aged 50–64 years, and 8.1% among those aged ≥65 years. Additionally, hospitalized adults aged ≥65 years were more likely to experience severe disease from 2009 H1N1 (42.2%)
Severe Illness from 2009 Pandemic Influenza A (H1N1) — Utah, 2009–10 Influenza Season
* A confirmed influenza-associated hospitalization was defined as hospitalization for ≥24 hours with a positive result for influenza infection by viral culture, viral nucleic acid test, or direct fluorescent antibody microscopy. A probable influenza-associated hospitalization was defined as hospitalization for ≥24 hours with a positive result for influenza infection from a rapid influenza test.

Morbidity and Mortality Weekly Report
MMWR / September 30, 2011 / Vol. 60 / No. 38 1311
than from seasonal influenza in 2007–08 (21.0%) (p<0.01). Overall, the percentage of 2009 H1N1 hospitalizations resulting in severe illness was significantly greater during the spring wave (30.9%) than the fall wave (23.0%) (p<0.01) (Table 2).
Of 2009 H1N1 hospitalizations with race/ethnicity reported, 29.5% of cases occurred among minorities, who make up 18.6% of the state population, compared with an average of 22.0% of cases during the three previous influenza seasons (p<0.01) (Table 1). Of spring wave H1N1 hospitalizations with known race/ethnicity, 40.7% occurred in minorities, compared with 24.6% of fall wave hospitalizations (p<0.01). Race/ethnicity data were missing for 12.3% of 2009 H1N1 hospitalizations and for an average of 12.6% of influenza hospitalizations during the three previous seasons.
A significantly greater percentage of all Utah 2009 H1N1 hospitalizations were among residents of Salt Lake County (43.7%), compared with hospitalizations for seasonal influenza during 2005–2008 (35.4%) (p<0.01) (Table 1). The largest county in the state, Salt Lake County includes 37% of the state population (1). However, the excess of 2009 H1N1 hospitalizations in Salt Lake County occurred only during the spring wave (64.3% versus 35.7% in other counties); the opposite was observed during the fall wave (34.1% versus 65.9% in other counties). By race/ethnicity, 36.5% of 2009 H1N1 hospitalizations in Salt Lake County occurred among minorities, who represent 24.8% of the county population (1), compared with 29.0% of seasonal hospitalizations (Table 1). This disparity also was limited to the H1N1 spring wave. When
TABLE 1. Number and percentage of seasonal influenza hospitalizations and 2009 pandemic influenza A (H1N1) hospitalizations, by selected patient characteristics and 2009 H1N1 wave — Utah, 2005–2008 and 2009–2010
Characteristic
Seasonal influenza hospitalizations
2009 H1N1 hospitalizations
p value
2009 H1N1 spring wave†
hospitalizations
2009 H1N1 fall wave§
hospitalizations
p valueNo.* (%) No. (%) No. (%) No. (%)
Age group (yrs)0–4 151 (34.7) 280 (21.0) <0.01 94 (22.2) 186 (20.5) 0.49
5–24 52 (12.0) 364 (27.4) <0.01 118 (27.9) 246 (27.2) 0.7925–49 52 (12.0) 362 (27.3) <0.01 120 (28.4) 242 (26.8) 0.5450–64 46 (10.6) 210 (15.8) <0.01 58 (13.7) 152 (16.8) 0.15
≥65 134 (30.8) 111 (8.4) <0.01 33 (7.8) 78 (8.6) 0.61County of residence
Salt Lake County 154 (35.4) 580 (43.7) <0.01 272 (64.3) 308 (34.1) <0.01Other Utah counties 281 (64.6) 747 (56.3) 151 (35.7) 596 (65.9)
Race/EthnicitySalt Lake County
White, non-Hispanic 98 (71.0) 346 (63.5) 0.01 130 (53.5) 216 (71.5) <0.01Minorities¶ 40 (29.0) 199 (36.5) 113 (46.5) 86 (28.5)Total 138 (100.0) 545 (100.0) 243 (100.0) 302 (100.0)
Other Utah countiesWhite, non-Hispanic 241 (81.1) 475 (76.7) <0.01 80 (72.1) 395 (77.8) 0.20Minorities 56 (18.9) 144 (23.3) 31 (27.9) 113 (22.2)Total 297 (100.0) 619 (100.0) 111 (100.0) 508 (100.0)
All Utah countiesWhite, non-Hispanic 339 (78.0) 821 (70.5) <0.01 210 (59.3) 611 (75.4) <0.01Minorities 96 (22.0) 343 (29.5) 144 (40.7) 199 (24.6)Total 435 (100.0) 1,327 (100.0) 423 (100.0) 904 (100.0)
High-risk categories**Aged <5 or ≥65 yrs 276 (63.4) 391 (29.5) <0.01 — — — — —Pregnant 12 (2.5) 81 (6.3) <0.01 — — — — —Respiratory disorder 94 (21.6) 477 (36.9) <0.01 — — — — —Heart/Kidney/
Metabolic disorder139 (32.0) 367 (28.3) 0.08 — — — — —
Immunosuppressed 56 (12.9) 216 (16.8) 0.02 — — — — —Any comorbidity 218 (50.1) 791 (61.6) <0.01 — — — — —Aged <5 or ≥65 yrs
and/or comorbidity371 (85.3) 1002 (77.1) <0.01 — — — — —
* Annual average for 2005–06, 2006–07, and 2007–08 influenza seasons, with the exception of high-risk categories. † April 27–August 29, 2009. § August 30, 2009–May 21, 2010. ¶ All persons not non-Hispanic white. ** Seasonal data are from 2006–07 and 2007–08 influenza seasons combined. Categories are not mutually exclusive.

Morbidity and Mortality Weekly Report
1312 MMWR / September 30, 2011 / Vol. 60 / No. 38
analyzed by census tract, 70% of spring wave 2009 H1N1 hospitalizations were among residents of census tracts with at least a 25% minority population, including one census tract with an 83% minority population. In contrast, only 36% of fall wave H1N1 hospitalizations were among residents of census tracts with at least a 25% minority population.
Among patients hospitalized with seasonal influenza during the combined 2006–07 and 2007–08 influenza seasons, 63.4% were at high risk for complications because of age (i.e., <5 years or ≥65 years), compared with 29.5% of patients hospitalized with 2009 H1N1 (Table 1). Among all hospitalized 2009 H1N1 patients, 6.3% were pregnant women, compared with
FIGURE. Number of influenza hospitalizations, by surveillance week and pandemic influenza A (H1N1) wave — Utah, 2005–2010 influenza seasons
Surveillance week
0
20
40
60
80
100
120
140
160
180
No.
of h
ospi
taliz
atio
ns
2005–06 season2007–08 season2009 H1N1 spring wave2006–07 season2008–09 season2009 H1N1 fall wave
35 38 41 44 47 50 1 4 7 10 13 16 19 22 25 28 31 34
TABLE 2. Number and percentage of seasonal influenza hospitalizations* and 2009 pandemic influenza A (H1N1) hospitalizations resulting in severe illness (intensive-care unit [ICU] admission or death),† by patient age group and 2009 H1N1 wave — Utah, 2007–08 and 2009–10 influenza seasons
Seasonal influenza hospitalizations
2009 H1N1hospitalizations
p value
2009 H1N1spring wave§ hospitalizations
2009 H1N1fall wave¶ hospitalizations
p valueTotal
Severe illness
Total
Severe illness
Total
Severe illness
Total
Severe illness
No. (%) No. (%) No. (%) No. (%)
Age group (yrs)0–4 151 12 (7.9) 278 34 (12.2) 0.16 93 13 (14.0) 185 21 (11.4) 0.53
5–24 52 3 (5.8) 361 68 (18.8) 0.02 115 31 (27.0) 246 37 (15.0) 0.0125–49 53 7 (13.5) 355 112 (31.5) 0.01 113 43 (38.1) 242 69 (28.5) 0.0750–64 46 11 (23.9) 208 74 (35.6) 0.15 56 26 (46.4) 152 48 (31.6) 0.05
≥65 136 28 (21.0) 109 46 (42.2) <0.01 31 13 (41.9) 78 33 (42.3) 0.97Total 439 61 (14.0) 1,311 334 (25.5) <0.01 408 126 (30.9) 903 208 (23.0) <0.01
* Seasonal data from 2007–08 influenza season.† Excludes hospitalizations for which information about ICU admission was not available.§ April 27–August 29, 2009.¶ August 30, 2009–May 21, 2010.
Morbidity and Mortality Weekly Report
MMWR / September 30, 2011 / Vol. 60 / No. 38 1313
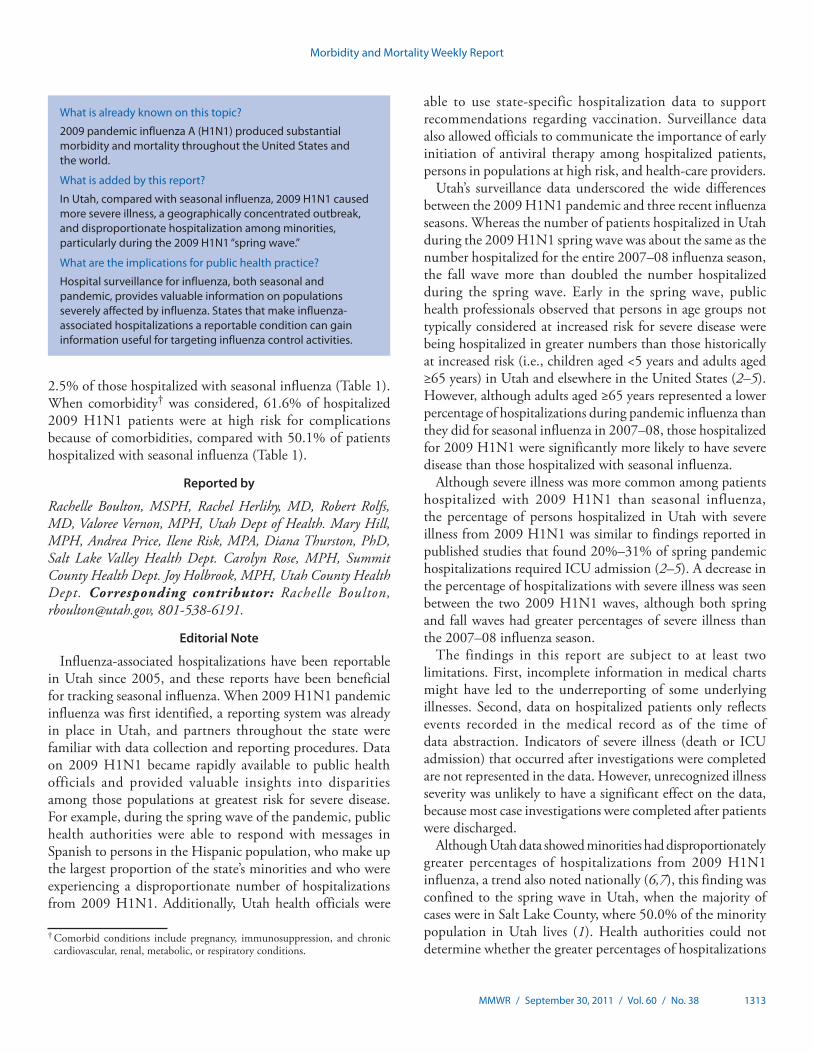
2.5% of those hospitalized with seasonal influenza (Table 1). When comorbidity† was considered, 61.6% of hospitalized 2009 H1N1 patients were at high risk for complications because of comorbidities, compared with 50.1% of patients hospitalized with seasonal influenza (Table 1).
Reported by
Rachelle Boulton, MSPH, Rachel Herlihy, MD, Robert Rolfs, MD, Valoree Vernon, MPH, Utah Dept of Health. Mary Hill, MPH, Andrea Price, Ilene Risk, MPA, Diana Thurston, PhD, Salt Lake Valley Health Dept. Carolyn Rose, MPH, Summit County Health Dept. Joy Holbrook, MPH, Utah County Health Dept. Corresponding contributor: Rachelle Boulton, [email protected], 801-538-6191.
Editorial Note
Influenza-associated hospitalizations have been reportable in Utah since 2005, and these reports have been beneficial for tracking seasonal influenza. When 2009 H1N1 pandemic influenza was first identified, a reporting system was already in place in Utah, and partners throughout the state were familiar with data collection and reporting procedures. Data on 2009 H1N1 became rapidly available to public health officials and provided valuable insights into disparities among those populations at greatest risk for severe disease. For example, during the spring wave of the pandemic, public health authorities were able to respond with messages in Spanish to persons in the Hispanic population, who make up the largest proportion of the state’s minorities and who were experiencing a disproportionate number of hospitalizations from 2009 H1N1. Additionally, Utah health officials were
What is already known on this topic?
2009 pandemic influenza A (H1N1) produced substantial morbidity and mortality throughout the United States and the world.
What is added by this report?
In Utah, compared with seasonal influenza, 2009 H1N1 caused more severe illness, a geographically concentrated outbreak, and disproportionate hospitalization among minorities, particularly during the 2009 H1N1 “spring wave.”
What are the implications for public health practice?
Hospital surveillance for influenza, both seasonal and pandemic, provides valuable information on populations severely affected by influenza. States that make influenza-associated hospitalizations a reportable condition can gain information useful for targeting influenza control activities.
able to use state-specific hospitalization data to support recommendations regarding vaccination. Surveillance data also allowed officials to communicate the importance of early initiation of antiviral therapy among hospitalized patients, persons in populations at high risk, and health-care providers.
Utah’s surveillance data underscored the wide differences between the 2009 H1N1 pandemic and three recent influenza seasons. Whereas the number of patients hospitalized in Utah during the 2009 H1N1 spring wave was about the same as the number hospitalized for the entire 2007–08 influenza season, the fall wave more than doubled the number hospitalized during the spring wave. Early in the spring wave, public health professionals observed that persons in age groups not typically considered at increased risk for severe disease were being hospitalized in greater numbers than those historically at increased risk (i.e., children aged <5 years and adults aged ≥65 years) in Utah and elsewhere in the United States (2–5). However, although adults aged ≥65 years represented a lower percentage of hospitalizations during pandemic influenza than they did for seasonal influenza in 2007–08, those hospitalized for 2009 H1N1 were significantly more likely to have severe disease than those hospitalized with seasonal influenza.
Although severe illness was more common among patients hospitalized with 2009 H1N1 than seasonal influenza, the percentage of persons hospitalized in Utah with severe illness from 2009 H1N1 was similar to findings reported in published studies that found 20%–31% of spring pandemic hospitalizations required ICU admission (2–5). A decrease in the percentage of hospitalizations with severe illness was seen between the two 2009 H1N1 waves, although both spring and fall waves had greater percentages of severe illness than the 2007–08 influenza season.
The findings in this report are subject to at least two limitations. First, incomplete information in medical charts might have led to the underreporting of some underlying illnesses. Second, data on hospitalized patients only reflects events recorded in the medical record as of the time of data abstraction. Indicators of severe illness (death or ICU admission) that occurred after investigations were completed are not represented in the data. However, unrecognized illness severity was unlikely to have a significant effect on the data, because most case investigations were completed after patients were discharged.
Although Utah data showed minorities had disproportionately greater percentages of hospitalizations from 2009 H1N1 influenza, a trend also noted nationally (6,7), this finding was confined to the spring wave in Utah, when the majority of cases were in Salt Lake County, where 50.0% of the minority population in Utah lives (1). Health authorities could not determine whether the greater percentages of hospitalizations
† Comorbid conditions include pregnancy, immunosuppression, and chronic cardiovascular, renal, metabolic, or respiratory conditions.

Morbidity and Mortality Weekly Report
1314 MMWR / September 30, 2011 / Vol. 60 / No. 38
resulted from greater influenza transmission in areas with high minority population or from more severe disease in members of minority populations.
Acknowledgments
Utah’s local health departments and Unified State Laboratory: Public Health.
References 1. Perlich P. Population by race and Hispanic origin: Utah counties (2008).
Salt Lake City, UT: University of Utah, Bureau of Economic and Business Research; 2009. Available at http://bebr.utah.edu/Documents/studies/2008_County_Race_Ethnicity_Estimates.pdf.
2. Jain S, Kamimoto L, Bramley AM, et al. Hospitalized patients with 2009 H1N1 influenza in the United States, April–June 2009. N Engl J Med 2009;361:1935–44.
3. CDC. Patients hospitalized with 2009 pandemic influenza A (H1N1)—New York City, May 2009. MMWR 2010;58:1436–40.
4. Louie JK, Acosta M, Winter K, et al. Factors associated with death or hospitalization due to pandemic 2009 influenza A(H1N1) infection in California. JAMA 2009;302:1896–902.
5. CDC. 2009 pandemic influenza A (H1N1) virus infections—Chicago, Illinois, April–July 2009. MMWR 2009;58:913–8.
6. Zarychanski R, Stuart TL, Kumar A, et al. Correlates of severe disease in patients with 2009 pandemic influenza (H1N1) virus infection. CMAJ 2010;182:257–64.
7. CDC. Deaths related to 2009 pandemic influenza A (H1N1) among American Indian/Alaska Natives—12 states, 2009. MMWR 2009; 58:1341–4.

Morbidity and Mortality Weekly Report
MMWR / September 30, 2011 / Vol. 60 / No. 38 1315
In 2005, an estimated 92,000 deaths occurred in India from measles among children aged <5 years (1). Estimates from 2008 indicate that 77% of global measles mortality was attributable to measles deaths in the World Health Organization (WHO) South-East Asia Region, the majority of which occurred in India (2,3). These figures highlight the importance of India in attaining regional and global measles mortality reduction targets. In 2008, the Indian National Technical Advisory Group on Immunization (NTAGI) recommended introduction of a second dose of measles-containing vaccine (MCV2), delivered through routine vaccination in states with ≥80% coverage with the first dose of measles-containing vaccine (MCV1), or through mass vaccination campaigns in states with <80% MCV1 coverage. Based on these recommendations, the government of India initiated MCV2 introduction in late 2010. This report provides an update on MCV1 coverage, progress in implementing MCV2, and measles outbreak surveillance activities conducted in eight states during 2006–2010. India has initiated implementation of a measles mortality reduction strategy, but the pace of implementation is variable across states. Strong national and state leadership and commitment to rapid reduction of measles mortality are essential to achieve the full benefits of this strategy.
Routine MCV1 coverageIn 1985, MCV1 was introduced in the India Expanded
Program on Immunization, with a recommended age for vaccination of 9–12 months. Estimated national routine MCV1 coverage was 74% among children aged 12–23 months based on the UNICEF-sponsored national Coverage Evaluation Survey (CES) of 2009 (4); state-level MCV1 coverage ranged from 48% to 96%.* District level data from the District Level Household and Facility Survey conducted during 2007–2008 (DLHS-3) indicated that MCV1 coverage was ≥90% in 26% of the evaluated districts (Figure 1).
MCV2 introductionBased on NTAGI recommendations, 17 states† with MCV1
coverage ≥80% (according to DLHS-3 data) had introduced single antigen measles vaccine as MCV2 through routine vaccination services during May 2010–August 2011. Four
states§ with MCV1 coverage ≥80% had introduced measles, mumps, and rubella vaccine as MCV2 before 2008.
Fourteen states¶ with <80% MCV1 coverage have started introducing MCV2 through mass vaccination campaigns using single antigen measles vaccine and targeting children aged 9 months–10 years (Figure 2). The target age group for campaigns was based on age distribution of cases reported through the measles outbreak surveillance system and investigation of several outbreaks in other states. An estimated 134 million children are targeted to receive MCV2 in these states in phases during 2010–2012. The first phase was conducted during September 2010–July 2011. By selecting a limited number of districts, the first phase was intended to establish best practices and document lessons learned for conducting subsequent larger phases of measles vaccination campaigns in India. The second phase will target 144 districts during September–December 2011. In 2012, a total of 172 districts are expected to be covered. In addition, campaign districts will introduce MCV2 through routine vaccination 6 months after completion of campaign activities.
Results of Phase 1 MCV2 campaignsDuring the first phase of MCV2 campaigns, 12,076,836
children were vaccinated in 45 districts of 13 states (all targeted states except Uttar Pradesh). Overall reported administrative coverage** was 86% and exceeded 90% in 18 (40%) of 45 districts. Rapid convenience assessments were conducted by independent monitors during and after the campaign to validate vaccination coverage and assess campaign quality.†† In total, 10,926 areas were assessed, and the campaign vaccination status of 217,512 target-aged children was verified in 43 of 45 districts. Of the assessed areas, 3,946 (36%) had ≥90% children vaccinated, and 3,358 (31%) areas had <80% campaign targeted children vaccinated. In total, 183,965 (85%) of all the assessed children were vaccinated. The most common reasons for nonvaccination,
Progress in Implementing Measles Mortality Reduction Strategies — India, 2010–2011
* India is comprised of 29 states and six Union Territories.† Andaman and Nicobar Islands, Andhra Pradesh, Chandigarh, Dadra and Nagar
Haveli, Daman and Diu, Himachal Pradesh, Jammu and Kashmir, Karnataka, Kerala, Lakshadweep, Maharashtra, Mizoram, Orissa, Punjab, Tamil Nadu, Uttarakhand, and West Bengal.
§ Delhi, Goa, Sikkim, and the Union Territory of Pondicherry. ¶ Arunachal Pradesh, Assam, Bihar, Chhattisgarh, Gujarat, Haryana, Jharkhand,
Madhya Pradesh, Manipur, Meghalaya, Nagaland, Rajasthan, Tripura, and Uttar Pradesh.
** Administrative coverage is calculated by dividing the number of doses administered by the number of persons in the target population.
†† Rapid convenience assessments target identified high-risk populations and areas. In selected areas, 20 households with target-aged children are visited, the campaign vaccination status of children is verified, and reasons for nonvaccination are elicited for unvaccinated children. Unvaccinated children are referred to the nearest vaccination sites. If two or more unvaccinated children are reported from a given area, supervisors are informed, and remedial action is taken.

Morbidity and Mortality Weekly Report
1316 MMWR / September 30, 2011 / Vol. 60 / No. 38
cited by nearly half (48%) of caretakers, were lack of knowledge about 1) the campaign, 2) the location of vaccination sites, or 3) the perceived importance of the activity. No deaths related to adverse events after vaccination were reported.
Measles outbreak surveillanceLaboratory-supported measles outbreak surveillance was
initiated in 2006 and, by 2010, was operational in eight states (Andhra Pradesh, Gujarat, Karnataka, Kerala, Madhya Pradesh,
FIGURE 1. Coverage with 1 dose of measles-containing vaccine among children aged 12–23 months, by district — India, 2007–2008*
* Data are from the District Level Household and Facility Survey 2007–2008.
≥90%80%–89%60%–79%40%–59%20%–39%<20%No data

Morbidity and Mortality Weekly Report
MMWR / September 30, 2011 / Vol. 60 / No. 38 1317
Rajasthan, Tamil Nadu, and West Bengal). An outbreak is considered confirmed if measles immunoglobulin M (IgM) is detected in serum from at least two suspected cases. Sera are tested by a network of eight laboratories accredited by the
FIGURE 2. Coverage with 1 dose of measles-containing vaccine among children aged 12–23 months, by state — India, 2007–2008*
World Health Organization. All samples testing negative for measles IgM are tested for rubella IgM.
During 2010, a total of 242 suspected outbreaks were investigated, and 198 (82%) were laboratory-confirmed
Uttar Pradesh
Gujarat
Daman and Diu
Dadra and Nagar Haveli
Maharashtra
Goa
Karnataka
Tamil Nadu
Pondicherry
Andhra Pradesh
Andaman and Nicobar Islands
Orissa Chhattisgarh
West
Bengal
Bihar
Jharkhand
Sikkim
Arunachal Pradesh
Assam
Nagaland
Manipur
MizoramTripura
Meghalaya
Uttarakhand
Kerala
Lakshadweep
Madhya Pradesh
Punjab
Rajasthan
Haryana
Delhi
Jammu and Kashmir
Himachal Pradesh
<80%≥80%
* Data are from the District Level Household and Facility Survey 2007–2008 for all states except Nagaland, for which data are from the UNICEF 2006 Coverage Evaluation Survey.

Morbidity and Mortality Weekly Report
1318 MMWR / September 30, 2011 / Vol. 60 / No. 38
as measles (Figure 3). Among 8,984 measles patients from laboratory-confirmed outbreaks, 7% were aged <1 year, 41% were aged 1–4 years, 37% were aged 5–9 years, and 15% were aged ≥10 years.
FIGURE 3. Laboratory-confirmed measles and rubella outbreaks in states conducting measles outbreak surveillance — India, 2010*
* Data are from the National Polio Surveillance Project measles surveillance database, 2010.
Rajasthan
Andhra Pradesh
Tamil Nadu
Kerala
West Bengal
Karnataka
Madhya PradeshGujarat
Measles outbreaks
Rubella outbreaks
Mixed outbreaks
Reported by
India Ministry of Health and Family Welfare; Stephen Sosler, PhD, Anindya Sekhar Bose, MD, Hamid Jafari, MD, National Polio Surveillance Project, World Health Organization,

Morbidity and Mortality Weekly Report
MMWR / September 30, 2011 / Vol. 60 / No. 38 1319
New Delhi, India. Abhijeet Anand, MBBS, MPH, Eric Wiesen, MA, Global Immunization Div, National Center for Immunization and Respiratory Diseases, CDC. Corresponding contributor: Abhijeet Anand, [email protected], 404-639-1970.
Editorial Note
Overall, 77% of global measles mortality in 2008 was attributable to measles deaths in the WHO South-East Asia Region, the majority of which occurred in India. Therefore, MCV2 introduction in India as part of a comprehensive measles mortality reduction strategy is an important step towards achieving the global target of a 95% reduction in global measles deaths in 2015 from the 733,000 measles deaths estimated in 2000. The government of India is demonstrating strong commitment to this effort and is providing full financial support for the purchase of all vaccines and all logistic and operational costs of MCV2 introduction activities.
Routine vaccination is a critical strategy for achieving high coverage with MCV1 and MCV2. The government of India is implementing measures to strengthen routine vaccination, especially in districts with low coverage. Nevertheless, substantial challenges exist, including the need for 1) increasing the number of trained staff at all levels, 2) increasing public demand for and confidence in vaccines, 3) improving vaccine stock and cold chain management, and 4) developing a strong reporting and management system for adverse events after vaccination. In addition, administration of MCV2 through routine vaccination services targets children aged 16–24 months, the same age that a diphtheria, tetanus, and pertussis (DTP) booster is recommended by the national immunization program. National DTP booster coverage (according to CES 2009) was 41%, indicating the need to rapidly increase coverage of vaccines scheduled beyond the first year of life (4). The first phase of the measles vaccination campaigns highlighted important challenges in planning and implementation, including obtaining strong state-level leadership and coordination, timely determination of campaign dates, reaching populations with the campaign messages, and reaching children in urban areas. Success in overcoming these challenges in the subsequent phases will be critical to reducing measles mortality in India.
Past experience with MCV2 introduction through mass campaigns in other countries has demonstrated that a substantial proportion of the susceptible population needs to be vaccinated during a short period to achieve maximum reduction of measles virus transmission (5). Phased subnational campaigns over a longer period might leave pockets of susceptible children, especially among highly mobile populations. In a country as large and mobile as India, the benefits of conducting large-scale campaigns during a short period need to be balanced with the need to ensure safety and high coverage with injectable vaccines.
Therefore, a well-considered approach is needed that covers large areas as quickly as possible without jeopardizing quality or safety. The age distribution and vaccination status of measles patients in the eight states currently implementing measles outbreak surveillance demonstrates gaps in immunity, especially among children aged <10 years. Expanding surveillance to obtain information on measles epidemiology in all Indian states will be important. Such information will allow India to quickly identify and respond to outbreaks and will help guide measles control in India. In particular, it will reveal any possible need for campaigns in states with reported routine MCV1 coverage ≥80%.
References1. Kumar R, Awasthi S, Bassani DG, et al. Causes of neonatal and child
mortality in India: a nationally representative mortality survey. Lancet 2010;376:1853–60.
2. World Health Organization. Global reductions in measles mortality 2000–2008 and the risk of measles resurgence. Wkly Epidemiol Rec 2009;84:509–16.
3. CDC. Global measles mortality, 2000–2008. MMWR 2009; 58:1321–6.4. United Nations Children’s Fund. 2009 Coverage Evaluation Survey. New
Delhi, India: United Nations Children’s Fund; 2009.5. Ma C, An Z, Hao L, et al. Progress toward measles elimination
in the People’s Republic of China, 2000–2009. J Infect Dis 2011; 204(Suppl 1):S447–54.
What is already known on this topic?
An estimated 77% of global measles mortality in 2008 was attributable to measles deaths in the World Health Organization South-East Asia Region, the majority of which occurred in India. Progress in reducing measles mortality in India is critical in achieving the global goal of 95% reduction in measles mortality by 2015 from the estimated 733,000 measles deaths in 2000. Providing 2 doses of measles-containing vaccine to all children is an important step in reducing measles deaths; until recently, India was the only country not to have implemented this measles mortality reduction strategy.
What is added by this report?
In 2010, the government of India initiated introduction of a second dose of measles-containing vaccine (MCV2) delivered through routine vaccination or mass vaccination campaigns. The first phase of the campaign, initiated in September 2010, vaccinated approximately 12 million children of the 134 million in 14 states targeted to receive measles vaccine from campaigns by 2012. MCV2 is now being provided through routine vaccination to all remaining 21 states. The government of India is demonstrating strong commitment to accelerated measles mortality reduction activities.
What are the implications for public health practice?
Introduction of MCV2 in India is an important step in reducing global measles mortality. The first phase of measles campaigns in India have demonstrated substantial challenges in planning and implementing campaigns, such as obtaining strong state-level leadership, having trained staff at all levels, and increasing public demand and confidence in vaccines.

Morbidity and Mortality Weekly Report
1320 MMWR / September 30, 2011 / Vol. 60 / No. 38
CDC Symposium on Hepatitis C Laboratory Testing and Surveillance — December 1–2, 2011
The Food and Drug Administration recently approved several highly efficacious drugs for treating persons infected with hepatitis C, serving as an additional impetus for improving efforts to screen for hepatitis C virus (HCV) infection. On December 1–2, 2011, CDC’s Division of Viral Hepatitis will host a symposium titled, Identification, Screening, and Surveillance of HCV Infections in the Era of Improved Therapy for Hepatitis C, where international experts will present their latest perspectives and findings regarding HCV screening and surveillance, and roundtable discussions will be held to promote an exchange of ideas. The symposium will take place at CDC’s Tom Harkin Global Communication Center, 1600 Clifton Road, Atlanta, GA 30333.
Registration is free. Those interested in attending should register online at http://www.cdc.gov/hepatitis/hcvsymposium2011/registration.htm. Program information, including a schedule of events and list of presenters, is available at http://www.cdc.gov/hepatitis/hcvsymposium2011/program.htm.
The Community Preventive Services Task Force: Celebrating 15 Years of Scientific Excellence
The Community Preventive Services Task Force will celebrate 15 years of scientific excellence during its October 3–4, 2011, meeting in Atlanta, Georgia. The Task Force was first convened in 1996 by the U.S. Department of Health and Human Services to assess the effectiveness of community, environmental, population, and health-care system interventions in public health and health promotion. The Task Force is a nonfederal independent body of nationally recognized leaders in public health practice, policy, and research, whose members are appointed by the CDC Director.
The Task Force assembles three times per year. To date, the Task Force has issued 218 findings and recommendations in 20 different public health topic areas. The Community Guide Branch provides the ongoing administrative, research, and technical support for the operations of the Task Force, under CDC’s Epidemiology and Analysis Program Office in the Office of Surveillance, Epidemiology, and Laboratory Services. Task Force findings and recommendations, along with the systematic reviews of the scientific evidence on which they are based, have been used to inform laws and policies, and to support the development of effective public health programs. Additional information about the Guide to Community Preventive Services is available at http://www.thecommunityguide.org/index.html.
Guests are welcome to attend all or any part of the 15th anniversary meeting with Task Force members, liaisons, partners, and CDC staff members. This meeting is open to the public, limited only by space availability. Persons who would like to attend should e-mail [email protected].
Announcements

Morbidity and Mortality Weekly Report
MMWR / September 30, 2011 / Vol. 60 / No. 38 1321
Revised Estimates of the Public Health Impact of 2009 Pandemic Influenza A (H1N1) Vaccination
In the May 20, 2011, report, “Ten Great Public Health Achievements — United States, 2001–2010,” on page 621, preliminary estimates of the impact of public health interventions during the 2009 H1N1 pandemic were presented as follows: “These public health interventions prevented an estimated 5–10 million cases, 30,000 hospitalizations, and 1,500 deaths (1).” These estimates were derived using combined data from two sources: 1) an unpublished CDC model for estimating the impact of the 2009 H1N1 pandemic influenza vaccine on averting cases, hospitalizations, and deaths during the 2009–10 influenza season and 2) a model for estimating the impact of antiviral treatment in averting hospitalizations and deaths during the 2009–10 season (2). As a result of a programming error, the model used to estimate the impact of vaccination did not adequately adjust for the decreasing risk for disease as the pandemic progressed, and thus the impact of vaccination was overestimated.
The corrected estimates for the combined impact from vaccine and antiviral treatment are as follows: 713,000 to 1.5 million cases, 12,300 to 23,000 hospitalizations, and 620 to 1,160 deaths averted. Of these, 713,000 to 1.5 million cases, 3,900 to 10,400 hospitalizations, and 200 to 520 deaths were averted as a result of the vaccination campaign (CDC, unpublished data, 2011), whereas the use of influenza antiviral medications is estimated to have prevented another 8,400 to 12,600 hospitalizations and another 420 to 640 deaths (2).
It is important to note that the error does not involve nor pertain to the effectiveness of the 2009 H1N1 vaccine, nor to estimates of the burden of the 2009 H1N1 pandemic, which resulted in approximately 43 million to 89 million cases, 195,000 to 403,000 hospitalizations, and 8,900 to 18,300 deaths, including 910 to 1,880 deaths among children aged <18 years, during April 2009–April 2010 (3). CDC-supported evaluations have shown that the vaccine was effective in preventing influenza medical visits during the pandemic (4). However, because there was early widespread circulation of the 2009 H1N1 virus, many persons in the United States became ill before vaccine was available.
CDC continues to work on developing and evaluating statistical models for estimating the impact of influenza vaccination in order to develop better programs and ways to monitor the impact of those programs. CDC expects this work might lead to future publications that provide additional impact estimates.
References 1. CDC. Ten great public health achievements—United States, 2001–2010,
MMWR 2011;60:619–23. 2. Atkins CY, Patel A, Taylor TH Jr, et al. Estimating effect of antiviral drug
use during pandemic (H1N1) 2009 outbreak, United States. Emerg Infect Dis 2011;17:1591–8.
3. Shrestha SS, Swerdlow DL, Borse RH, et al. Estimating the burden of 2009 pandemic influenza A (H1N1) in the United States (April 2009—April, 2010). Clin Infect Dis 2011;52:S75–82.
4. Griffin MR, Monto AS, Belongia EA, et al. Effectiveness of non-adjuvanted pandemic influenza A vaccines for preventing pandemic influenza acute respiratory illness visits in 4 U.S. communities. PLoS One 2011;6:e23085.
Notice to Readers

Morbidity and Mortality Weekly Report
1322 MMWR / September 30, 2011 / Vol. 60 / No. 38
TABLE I. Provisional cases of infrequently reported notifiable diseases (<1,000 cases reported during the preceding year) — United States, week ending September 24, 2011 (38th week)*
DiseaseCurrent
weekCum 2011
5-year weekly
average†
Total cases reported for previous yearsStates reporting cases
during current week (No.)2010 2009 2008 2007 2006
Anthrax — — — — 1 — 1 1Arboviral diseases§, ¶:
California serogroup virus disease — 62 3 75 55 62 55 67Eastern equine encephalitis virus disease — 3 0 10 4 4 4 8Powassan virus disease — 12 — 8 6 2 7 1St. Louis encephalitis virus disease — 1 0 10 12 13 9 10Western equine encephalitis virus disease — — — — — — — —
Babesiosis 8 412 1 NN NN NN NN NN NY (7), PA (1)Botulism, total — 66 2 112 118 145 144 165
foodborne — 8 0 7 10 17 32 20infant — 50 2 80 83 109 85 97other (wound and unspecified) — 8 0 25 25 19 27 48
Brucellosis 1 60 2 115 115 80 131 121 PA (1)Chancroid — 11 0 24 28 25 23 33Cholera — 27 0 13 10 5 7 9Cyclosporiasis§ — 128 2 179 141 139 93 137Diphtheria — — — — — — — —Haemophilus influenzae,** invasive disease (age <5 yrs):
serotype b — 5 1 23 35 30 22 29nonserotype b — 82 2 200 236 244 199 175unknown serotype 2 176 2 223 178 163 180 179 SC (1), FL (1)
Hansen disease§ — 33 2 98 103 80 101 66Hantavirus pulmonary syndrome§ — 18 1 20 20 18 32 40Hemolytic uremic syndrome, postdiarrheal§ 1 109 8 266 242 330 292 288 OK (1)Influenza-associated pediatric mortality§,†† — 112 2 61 358 90 77 43Listeriosis 18 460 21 821 851 759 808 884 NY (1), OH (1), NE (1), MD (1), NC (2), OK (6),
CO (6)Measles§§ 5 196 1 63 71 140 43 55 CA (5)Meningococcal disease, invasive¶¶:
A, C, Y, and W-135 2 134 4 280 301 330 325 318 NY (1), GA (1)serogroup B — 68 2 135 174 188 167 193other serogroup — 11 0 12 23 38 35 32unknown serogroup 3 301 7 406 482 616 550 651 MO (1), NE (1), FL (1)
Novel influenza A virus infections*** — 6 0 4 43,774 2 4 NNPlague — 2 0 2 8 3 7 17Poliomyelitis, paralytic — — — — 1 — — —Polio virus Infection, nonparalytic§ — — — — — — — NNPsittacosis§ — 2 0 4 9 8 12 21Q fever, total§ 1 78 3 131 113 120 171 169
acute 1 59 2 106 93 106 — — MO (1)chronic — 19 0 25 20 14 — —
Rabies, human — — 0 2 4 2 1 3Rubella††† — 3 0 5 3 16 12 11Rubella, congenital syndrome — — — — 2 — — 1SARS-CoV§ — — — — — — — —Smallpox§ — — — — — — — —Streptococcal toxic-shock syndrome§ — 84 1 142 161 157 132 125Syphilis, congenital (age <1 yr)§§§ — 139 8 377 423 431 430 349Tetanus — 6 1 26 18 19 28 41Toxic-shock syndrome (staphylococcal)§ — 60 1 82 74 71 92 101Trichinellosis — 8 0 7 13 39 5 15Tularemia 1 97 2 124 93 123 137 95 MO (1)Typhoid fever 1 264 12 467 397 449 434 353 VA (1)Vancomycin-intermediate Staphylococcus aureus§ 3 49 1 91 78 63 37 6 SC (2), FL (1)Vancomycin-resistant Staphylococcus aureus§ — — — 2 1 — 2 1Vibriosis (noncholera Vibrio species infections)§ 11 496 18 846 789 588 549 NN OH (1), MD (2), VA (1), NC (1), FL (5), OK (1)Viral hemorrhagic fever¶¶¶ — — — 1 NN NN NN NNYellow fever — — — — — — — —
See Table 1 footnotes on next page.
Notifiable Diseases and Mortality Tables

Morbidity and Mortality Weekly Report
MMWR / September 30, 2011 / Vol. 60 / No. 38 1323
Notifiable Disease Data Team and 122 Cities Mortality Data Team
Jennifer WardDeborah A. Adams Rosaline DharaWillie J. Anderson Pearl C. SharpLenee Blanton Michael S. Wodajo
* Ratio of current 4-week total to mean of 15 4-week totals (from previous, comparable, and subsequent 4-week periods for the past 5 years). The point where the hatched area begins is based on the mean and two standard deviations of these 4-week totals.
FIGURE I. Selected notifiable disease reports, United States, comparison of provisional 4-week totals September 24, 2011, with historical data
820.50.25 1
Beyond historical limits
DISEASE
Ratio (Log scale)*
DECREASE INCREASECASES CURRENT
4 WEEKS
Hepatitis A, acute
Hepatitis B, acute
Hepatitis C, acute
Legionellosis
Measles
Mumps
Pertussis
Giardiasis
Meningococcal disease
850
51
141
42
270
8
11
13
486
4
TABLE I. (Continued) Provisional cases of infrequently reported notifiable diseases (<1,000 cases reported during the preceding year) — United States, week ending September 24, 2011 (38th week)*
—: No reported cases. N: Not reportable. NN: Not Nationally Notifiable. Cum: Cumulative year-to-date counts. * Case counts for reporting years 2010 and 2011 are provisional and subject to change. For further information on interpretation of these data, see http://www.cdc.gov/osels/ph_surveillance/
nndss/phs/files/ProvisionalNationa%20NotifiableDiseasesSurveillanceData20100927.pdf. † Calculated by summing the incidence counts for the current week, the 2 weeks preceding the current week, and the 2 weeks following the current week, for a total of 5 preceding years.
Additional information is available at http://www.cdc.gov/osels/ph_surveillance/nndss/phs/files/5yearweeklyaverage.pdf. § Not reportable in all states. Data from states where the condition is not reportable are excluded from this table except starting in 2007 for the arboviral diseases, STD data, TB data, and
influenza-associated pediatric mortality, and in 2003 for SARS-CoV. Reporting exceptions are available at http://www.cdc.gov/osels/ph_surveillance/nndss/phs/infdis.htm. ¶ Includes both neuroinvasive and nonneuroinvasive. Updated weekly from reports to the Division of Vector-Borne Infectious Diseases, National Center for Zoonotic, Vector-Borne, and
Enteric Diseases (ArboNET Surveillance). Data for West Nile virus are available in Table II. ** Data for H. influenzae (all ages, all serotypes) are available in Table II. †† Updated weekly from reports to the Influenza Division, National Center for Immunization and Respiratory Diseases. Since October 3, 2010, 116 influenza-associated pediatric deaths
occurring during the 2010-11 influenza season have been reported. §§ The five measles cases reported for the current week were imported. ¶¶ Data for meningococcal disease (all serogroups) are available in Table II. *** CDC discontinued reporting of individual confirmed and probable cases of 2009 pandemic influenza A (H1N1) virus infections on July 24, 2009. During 2009, four cases of human infection
with novel influenza A viruses, different from the 2009 pandemic influenza A (H1N1) strain, were reported to CDC. The four cases of novel influenza A virus infection reported to CDC during 2010, and the six cases reported during 2011, were identified as swine influenza A (H3N2) virus and are unrelated to the 2009 pandemic influenza A (H1N1) virus. Total case counts for 2009 were provided by the Influenza Division, National Center for Immunization and Respiratory Diseases (NCIRD).
††† No rubella cases were reported for the current week. §§§ Updated weekly from reports to the Division of STD Prevention, National Center for HIV/AIDS, Viral Hepatitis, STD, and TB Prevention. ¶¶¶ There was one case of viral hemorrhagic fever reported during week 12 of 2010. The one case report was confirmed as lassa fever. See Table II for dengue hemorrhagic fever.

Morbidity and Mortality Weekly Report
1324 MMWR / September 30, 2011 / Vol. 60 / No. 38
TABLE II. Provisional cases of selected notifiable diseases, United States, weeks ending September 24, 2011, and September 25, 2010 (38th week)*
Reporting area
Chlamydia trachomatis infection Coccidioidomycosis Cryptosporidiosis
Current week
Previous 52 weeks Cum 2011
Cum 2010
Current week
Previous 52 weeks Cum 2011
Cum 2010
Current week
Previous 52 weeks Cum 2011
Cum 2010Med Max Med Max Med Max
United States 13,595 26,074 31,142 951,330 942,353 68 345 568 13,050 NN 176 134 327 6,105 6,972New England 337 865 2,043 31,611 30,042 — 0 1 1 NN — 5 55 257 413
Connecticut — 219 1,557 7,106 7,804 — 0 0 — NN — 0 49 49 77Maine† — 59 100 2,213 1,872 — 0 0 — NN — 1 4 37 83Massachusetts 321 424 860 16,318 15,174 — 0 0 — NN — 2 7 89 133New Hampshire 1 54 82 2,000 1,730 — 0 1 1 NN — 1 5 47 49Rhode Island† — 76 154 2,929 2,549 — 0 0 — NN — 0 1 1 15Vermont† 15 26 84 1,045 913 — 0 0 — NN — 1 4 34 56
Mid. Atlantic 1,884 3,409 5,069 123,824 123,314 — 0 1 3 NN 11 17 37 680 656New Jersey 150 536 935 20,494 19,184 — 0 0 — NN — 0 4 21 36New York (Upstate) 730 715 2,099 26,019 24,503 — 0 0 — NN 7 4 15 165 166New York City 253 1,144 2,612 39,987 45,240 — 0 0 — NN — 1 6 54 70Pennsylvania 751 966 1,240 37,324 34,387 — 0 1 3 NN 4 9 26 440 384
E.N. Central 1,159 3,972 7,039 142,658 149,394 — 0 5 37 NN 81 32 130 1,837 1,970Illinois 29 1,079 1,320 35,989 44,065 — 0 0 — NN — 3 23 129 278Indiana 236 476 3,376 19,345 14,631 — 0 0 — NN — 5 14 180 226Michigan 587 926 1,412 34,726 36,145 — 0 3 22 NN 2 6 13 229 262Ohio 172 1,002 1,134 36,253 37,547 — 0 3 15 NN 75 9 95 842 363Wisconsin 135 458 559 16,345 17,006 — 0 0 — NN 4 8 54 457 841
W.N. Central 440 1,449 1,667 52,294 52,842 — 0 2 6 NN 35 19 80 1,036 1,545Iowa 19 211 254 7,683 7,719 — 0 0 — NN — 6 18 283 323Kansas 24 195 288 7,433 7,153 — 0 0 — NN — 0 7 24 89Minnesota — 275 368 8,610 11,350 — 0 0 — NN — 0 12 — 343Missouri 325 544 759 20,377 18,941 — 0 0 — NN 17 4 63 424 462Nebraska† 72 109 218 4,441 3,633 — 0 2 6 NN 6 4 16 161 215North Dakota — 43 77 1,407 1,734 — 0 0 — NN 12 0 9 28 19South Dakota — 63 93 2,343 2,312 — 0 0 — NN — 1 13 116 94
S. Atlantic 3,984 5,237 6,685 200,138 189,658 — 0 2 3 NN 18 21 37 868 803Delaware 64 85 128 3,105 3,209 — 0 0 — NN — 0 1 7 7District of Columbia — 108 180 3,911 3,961 — 0 0 — NN — 0 1 5 4Florida 901 1,492 1,698 55,695 55,512 — 0 0 — NN 12 8 17 339 299Georgia 531 981 2,384 37,196 32,462 — 0 0 — NN 5 5 11 213 207Maryland† 473 463 1,125 16,946 17,437 — 0 2 3 NN — 1 6 50 31North Carolina 1,108 837 1,688 35,909 32,300 — 0 0 — NN — 0 13 36 66South Carolina† 520 515 946 20,521 19,203 — 0 0 — NN — 3 8 105 90Virginia† 294 655 965 23,805 22,816 — 0 0 — NN 1 2 8 97 83West Virginia 93 78 121 3,050 2,758 — 0 0 — NN — 0 5 16 16
E.S. Central 925 1,804 3,314 68,369 67,490 — 0 0 — NN 1 7 17 233 248Alabama† — 523 1,566 19,732 19,512 — 0 0 — NN — 3 13 102 125Kentucky 247 268 2,352 11,332 11,288 — 0 0 — NN — 1 4 28 61Mississippi 390 398 696 15,258 16,011 — 0 0 — NN — 0 3 31 15Tennessee† 288 595 795 22,047 20,679 — 0 0 — NN 1 1 6 72 47
W.S. Central 2,615 3,394 4,338 128,726 129,596 — 0 1 1 NN 15 7 62 350 366Arkansas† 308 315 440 11,969 11,423 — 0 0 — NN — 0 3 16 26Louisiana 246 482 1,052 16,372 19,514 — 0 1 1 NN — 0 9 35 60Oklahoma — 224 850 7,557 10,593 — 0 0 — NN 2 2 34 65 67Texas† 2,061 2,403 3,107 92,828 88,066 — 0 0 — NN 13 4 34 234 213
Mountain 569 1,652 2,155 61,256 60,972 57 272 456 10,372 NN 7 11 30 455 471Arizona 181 510 698 17,840 19,992 57 269 454 10,252 NN — 1 4 30 30Colorado — 404 848 16,370 14,186 — 0 0 — NN 4 3 12 128 106Idaho† — 80 235 2,895 2,921 — 0 0 — NN — 2 9 86 78Montana† 60 61 89 2,425 2,228 — 0 2 3 NN 3 1 6 58 39Nevada† 199 199 380 7,902 7,421 — 1 5 68 NN — 0 2 5 35New Mexico† 103 199 1,183 7,730 7,898 — 0 4 36 NN — 2 7 95 105Utah — 126 175 4,662 4,830 — 0 2 10 NN — 1 5 33 58Wyoming† 26 38 90 1,432 1,496 — 0 2 3 NN — 0 5 20 20
Pacific 1,682 3,919 6,559 142,454 139,045 11 59 143 2,627 NN 8 11 29 389 500Alaska — 109 157 4,048 4,520 — 0 0 — NN — 0 3 10 3California 1,030 2,959 5,763 110,575 106,344 11 59 143 2,622 NN 5 7 19 234 264Hawaii — 108 135 3,577 4,500 — 0 0 — NN — 0 0 — 1Oregon 305 269 524 10,048 8,197 — 0 1 5 NN 3 2 11 91 166Washington 347 417 522 14,206 15,484 — 0 0 — NN — 1 9 54 66
TerritoriesAmerican Samoa — 0 0 — — — 0 0 — NN N 0 0 N NC.N.M.I. — — — — — — — — — NN — — — — —Guam — 6 81 189 691 — 0 0 — NN — 0 0 — —Puerto Rico 66 104 349 3,883 4,545 — 0 0 — NN N 0 0 N NU.S. Virgin Islands — 16 27 539 430 — 0 0 — NN — 0 0 — —
C.N.M.I.: Commonwealth of Northern Mariana Islands.U: Unavailable. —: No reported cases. N: Not reportable. NN: Not Nationally Notifiable. Cum: Cumulative year-to-date counts. Med: Median. Max: Maximum.* Case counts for reporting year 2010 and 2011 are provisional and subject to change. For further information on interpretation of these data, see http://www.cdc.gov/osels/ph_surveillance/
nndss/phs/files/ProvisionalNationa%20NotifiableDiseasesSurveillanceData20100927.pdf. Data for TB are displayed in Table IV, which appears quarterly.† Contains data reported through the National Electronic Disease Surveillance System (NEDSS).
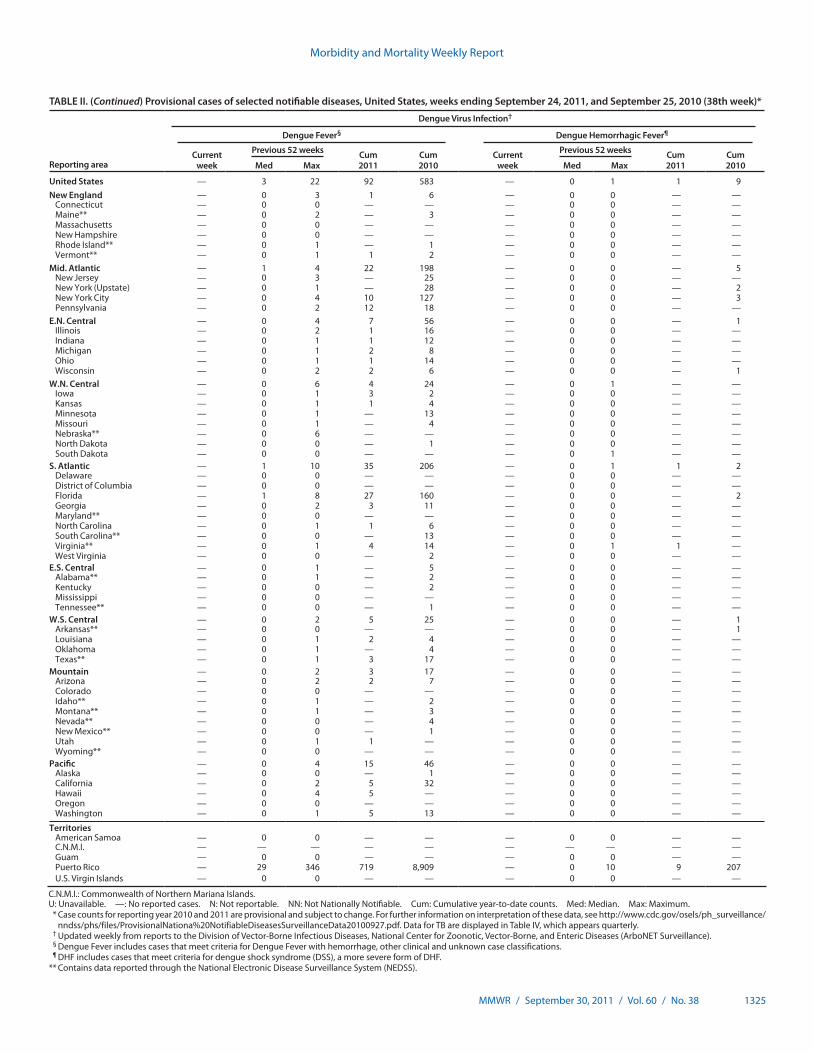
Morbidity and Mortality Weekly Report
MMWR / September 30, 2011 / Vol. 60 / No. 38 1325
TABLE II. (Continued) Provisional cases of selected notifiable diseases, United States, weeks ending September 24, 2011, and September 25, 2010 (38th week)*
Reporting area
Dengue Virus Infection†
Dengue Fever§ Dengue Hemorrhagic Fever¶
Current week
Previous 52 weeks Cum 2011
Cum 2010
Current week
Previous 52 weeks Cum 2011
Cum 2010Med Max Med Max
United States — 3 22 92 583 — 0 1 1 9New England — 0 3 1 6 — 0 0 — —
Connecticut — 0 0 — — — 0 0 — —Maine** — 0 2 — 3 — 0 0 — —Massachusetts — 0 0 — — — 0 0 — —New Hampshire — 0 0 — — — 0 0 — —Rhode Island** — 0 1 — 1 — 0 0 — —Vermont** — 0 1 1 2 — 0 0 — —
Mid. Atlantic — 1 4 22 198 — 0 0 — 5New Jersey — 0 3 — 25 — 0 0 — —New York (Upstate) — 0 1 — 28 — 0 0 — 2New York City — 0 4 10 127 — 0 0 — 3Pennsylvania — 0 2 12 18 — 0 0 — —
E.N. Central — 0 4 7 56 — 0 0 — 1Illinois — 0 2 1 16 — 0 0 — —Indiana — 0 1 1 12 — 0 0 — —Michigan — 0 1 2 8 — 0 0 — —Ohio — 0 1 1 14 — 0 0 — —Wisconsin — 0 2 2 6 — 0 0 — 1
W.N. Central — 0 6 4 24 — 0 1 — —Iowa — 0 1 3 2 — 0 0 — —Kansas — 0 1 1 4 — 0 0 — —Minnesota — 0 1 — 13 — 0 0 — —Missouri — 0 1 — 4 — 0 0 — —Nebraska** — 0 6 — — — 0 0 — —North Dakota — 0 0 — 1 — 0 0 — —South Dakota — 0 0 — — — 0 1 — —
S. Atlantic — 1 10 35 206 — 0 1 1 2Delaware — 0 0 — — — 0 0 — —District of Columbia — 0 0 — — — 0 0 — —Florida — 1 8 27 160 — 0 0 — 2Georgia — 0 2 3 11 — 0 0 — —Maryland** — 0 0 — — — 0 0 — —North Carolina — 0 1 1 6 — 0 0 — —South Carolina** — 0 0 — 13 — 0 0 — —Virginia** — 0 1 4 14 — 0 1 1 —West Virginia — 0 0 — 2 — 0 0 — —
E.S. Central — 0 1 — 5 — 0 0 — —Alabama** — 0 1 — 2 — 0 0 — —Kentucky — 0 0 — 2 — 0 0 — —Mississippi — 0 0 — — — 0 0 — —Tennessee** — 0 0 — 1 — 0 0 — —
W.S. Central — 0 2 5 25 — 0 0 — 1Arkansas** — 0 0 — — — 0 0 — 1Louisiana — 0 1 2 4 — 0 0 — —Oklahoma — 0 1 — 4 — 0 0 — —Texas** — 0 1 3 17 — 0 0 — —
Mountain — 0 2 3 17 — 0 0 — —Arizona — 0 2 2 7 — 0 0 — —Colorado — 0 0 — — — 0 0 — —Idaho** — 0 1 — 2 — 0 0 — —Montana** — 0 1 — 3 — 0 0 — —Nevada** — 0 0 — 4 — 0 0 — —New Mexico** — 0 0 — 1 — 0 0 — —Utah — 0 1 1 — — 0 0 — —Wyoming** — 0 0 — — — 0 0 — —
Pacific — 0 4 15 46 — 0 0 — —Alaska — 0 0 — 1 — 0 0 — —California — 0 2 5 32 — 0 0 — —Hawaii — 0 4 5 — — 0 0 — —Oregon — 0 0 — — — 0 0 — —Washington — 0 1 5 13 — 0 0 — —
TerritoriesAmerican Samoa — 0 0 — — — 0 0 — —C.N.M.I. — — — — — — — — — —Guam — 0 0 — — — 0 0 — —Puerto Rico — 29 346 719 8,909 — 0 10 9 207U.S. Virgin Islands — 0 0 — — — 0 0 — —
C.N.M.I.: Commonwealth of Northern Mariana Islands.U: Unavailable. —: No reported cases. N: Not reportable. NN: Not Nationally Notifiable. Cum: Cumulative year-to-date counts. Med: Median. Max: Maximum. * Case counts for reporting year 2010 and 2011 are provisional and subject to change. For further information on interpretation of these data, see http://www.cdc.gov/osels/ph_surveillance/
nndss/phs/files/ProvisionalNationa%20NotifiableDiseasesSurveillanceData20100927.pdf. Data for TB are displayed in Table IV, which appears quarterly. † Updated weekly from reports to the Division of Vector-Borne Infectious Diseases, National Center for Zoonotic, Vector-Borne, and Enteric Diseases (ArboNET Surveillance). § Dengue Fever includes cases that meet criteria for Dengue Fever with hemorrhage, other clinical and unknown case classifications. ¶ DHF includes cases that meet criteria for dengue shock syndrome (DSS), a more severe form of DHF. ** Contains data reported through the National Electronic Disease Surveillance System (NEDSS).

Morbidity and Mortality Weekly Report
1326 MMWR / September 30, 2011 / Vol. 60 / No. 38
TABLE II. (Continued) Provisional cases of selected notifiable diseases, United States, weeks ending September 24, 2011, and September 25, 2010 (38th week)*
Reporting area
Ehrlichiosis/Anaplasmosis†
Ehrlichia chaffeensis Anaplasma phagocytophilum Undetermined
Current week
Previous 52 weeks Cum 2011
Cum 2010
Current week
Previous 52 weeks Cum 2011
Cum 2010
Current week
Previous 52 weeks Cum 2011
Cum 2010Med Max Med Max Med Max
United States 13 7 109 577 554 23 16 42 442 1,436 2 1 13 85 75New England — 0 2 4 4 — 2 15 108 77 — 0 1 1 2
Connecticut — 0 0 — — — 0 5 — 31 — 0 0 — —Maine§ — 0 1 1 2 — 0 2 12 14 — 0 0 — —Massachusetts — 0 0 — — — 0 10 49 — — 0 0 — —New Hampshire — 0 1 2 2 — 0 4 14 13 — 0 1 1 2Rhode Island§ — 0 1 1 — — 0 10 30 18 — 0 0 — —Vermont§ — 0 0 — — — 0 1 3 1 — 0 0 — —
Mid. Atlantic 1 1 7 52 77 17 4 27 229 212 1 0 2 11 9New Jersey — 0 1 — 47 — 0 3 — 58 — 0 0 — 1New York (Upstate) 1 0 7 45 24 17 3 25 199 143 1 0 2 11 6New York City — 0 1 7 5 — 0 5 28 10 — 0 0 — —Pennsylvania — 0 1 — 1 — 0 1 2 1 — 0 1 — 2
E.N. Central — 0 3 21 40 1 0 9 12 441 — 1 4 36 40Illinois — 0 2 11 14 — 0 2 4 6 — 0 1 2 3Indiana — 0 0 — — — 0 0 — — — 0 3 28 14Michigan — 0 2 4 2 — 0 1 — 3 — 0 2 4 —Ohio — 0 1 6 6 1 0 1 5 2 — 0 1 1 —Wisconsin — 0 1 — 18 — 0 9 3 430 — 0 1 1 23
W.N. Central 1 1 18 142 114 — 1 20 31 633 — 0 11 15 9Iowa N 0 0 N N N 0 0 N N N 0 0 N NKansas — 0 1 2 6 — 0 1 2 1 — 0 0 — —Minnesota — 0 12 — — — 0 20 1 622 — 0 11 — —Missouri 1 1 18 138 107 — 0 7 26 10 — 0 7 14 9Nebraska§ — 0 1 1 1 — 0 0 — — — 0 1 1 —North Dakota N 0 0 N N N 0 0 N N N 0 0 N NSouth Dakota — 0 1 1 — — 0 1 2 — — 0 0 — —
S. Atlantic 1 3 33 201 214 3 1 8 47 53 1 0 1 9 4Delaware — 0 2 15 16 — 0 1 1 4 — 0 0 — —District of Columbia N 0 0 N N N 0 0 N N N 0 0 N NFlorida — 0 3 13 8 — 0 3 8 3 — 0 0 — —Georgia — 0 3 16 19 — 0 2 7 1 — 0 1 1 1Maryland§ 1 0 3 23 19 — 0 2 4 12 — 0 0 — 2North Carolina — 0 17 55 78 — 0 6 17 21 — 0 0 — —South Carolina§ — 0 1 1 4 — 0 0 — 1 — 0 0 — —Virginia§ — 1 14 78 68 3 0 2 10 11 1 0 1 7 1West Virginia — 0 1 — 2 — 0 0 — — — 0 1 1 —
E.S. Central — 0 8 63 82 — 0 2 10 18 — 0 3 9 8Alabama§ — 0 2 3 10 — 0 1 3 7 N 0 0 N NKentucky — 0 3 10 14 — 0 0 — — — 0 0 — 1Mississippi — 0 1 3 3 — 0 0 — 2 — 0 0 — 1Tennessee§ — 0 6 47 55 — 0 1 7 9 — 0 3 9 6
W.S. Central 10 0 87 94 22 1 0 9 3 2 — 0 0 — 1Arkansas§ — 0 12 38 4 — 0 2 2 — — 0 0 — —Louisiana — 0 0 — 1 — 0 0 — — — 0 0 — —Oklahoma 10 0 82 55 14 1 0 7 1 2 — 0 0 — —Texas§ — 0 1 1 3 — 0 1 — — — 0 0 — 1
Mountain — 0 0 — — — 0 0 — — — 0 1 3 —Arizona — 0 0 — — — 0 0 — — — 0 1 3 —Colorado N 0 0 N N N 0 0 N N N 0 0 N NIdaho§ N 0 0 N N N 0 0 N N N 0 0 N NMontana§ N 0 0 N N N 0 0 N N N 0 0 N NNevada§ N 0 0 N N N 0 0 N N N 0 0 N NNew Mexico§ N 0 0 N N N 0 0 N N N 0 0 N NUtah — 0 0 — — — 0 0 — — — 0 0 — —Wyoming§ — 0 0 — — — 0 0 — — — 0 0 — —
Pacific — 0 1 — 1 1 0 1 2 — — 0 1 1 2Alaska N 0 0 N N N 0 0 N N N 0 0 N NCalifornia — 0 1 — 1 — 0 0 — — — 0 1 1 2Hawaii N 0 0 N N N 0 0 N N N 0 0 N NOregon — 0 0 — — 1 0 1 2 — — 0 0 — —Washington — 0 0 — — — 0 0 — — — 0 0 — —
TerritoriesAmerican Samoa N 0 0 N N N 0 0 N N N 0 0 N NC.N.M.I. — — — — — — — — — — — — — — —Guam N 0 0 N N N 0 0 N N N 0 0 N NPuerto Rico N 0 0 N N N 0 0 N N N 0 0 N NU.S. Virgin Islands — 0 0 — — — 0 0 — — — 0 0 — —
C.N.M.I.: Commonwealth of Northern Mariana Islands.U: Unavailable. —: No reported cases. N: Not reportable. NN: Not Nationally Notifiable. Cum: Cumulative year-to-date counts. Med: Median. Max: Maximum.* Case counts for reporting year 2010 and 2011 are provisional and subject to change. For further information on interpretation of these data, see http://www.cdc.gov/osels/ph_surveillance/
nndss/phs/files/ProvisionalNationa%20NotifiableDiseasesSurveillanceData20100927.pdf. Data for TB are displayed in Table IV, which appears quarterly.† Cumulative total E. ewingii cases reported for year 2010 = 10, and 11 cases reported for 2011.§ Contains data reported through the National Electronic Disease Surveillance System (NEDSS).

Morbidity and Mortality Weekly Report
MMWR / September 30, 2011 / Vol. 60 / No. 38 1327
TABLE II. (Continued) Provisional cases of selected notifiable diseases, United States, weeks ending September 24, 2011, and September 25, 2010 (38th week)*
Reporting area
Giardiasis GonorrheaHaemophilus influenzae, invasive†
All ages, all serotypes
Current week
Previous 52 weeks Cum 2011
Cum 2010
Current week
Previous 52 weeks Cum 2011
Cum 2010
Current week
Previous 52 weeks Cum 2011
Cum 2010Med Max Med Max Med Max
United States 245 293 497 10,423 14,500 3,476 5,896 7,484 215,798 222,315 12 64 141 2,316 2,236New England 5 22 42 851 1,244 32 101 206 3,801 4,080 — 4 12 140 131
Connecticut — 4 11 131 229 — 43 150 1,592 1,855 — 1 6 37 25Maine§ 3 3 10 123 155 — 3 17 166 128 — 0 2 16 10Massachusetts — 11 21 343 534 31 48 80 1,668 1,739 — 2 6 62 70New Hampshire — 2 6 81 130 1 2 7 99 109 — 0 2 11 9Rhode Island§ — 1 10 50 50 — 7 16 239 202 — 0 2 9 11Vermont§ 2 2 11 123 146 — 0 8 37 47 — 0 3 5 6
Mid. Atlantic 73 58 103 2,100 2,427 418 764 1,121 28,191 25,688 4 13 32 527 415New Jersey — 5 20 134 359 31 136 224 5,410 4,085 — 2 7 79 78New York (Upstate) 47 22 72 788 817 114 114 271 4,160 4,021 3 3 18 141 108New York City 3 17 29 618 682 58 246 497 8,883 8,683 1 3 6 120 68Pennsylvania 23 16 27 560 569 215 262 364 9,738 8,899 — 4 11 187 161
E.N. Central 28 47 78 1,644 2,481 315 1,023 2,091 37,255 40,968 1 11 22 404 363Illinois — 9 14 261 560 10 264 369 9,045 11,285 — 3 10 119 123Indiana — 6 14 188 303 57 115 1,018 4,679 4,141 — 2 7 73 75Michigan 2 10 25 335 523 177 235 491 8,863 9,956 — 1 4 47 25Ohio 23 17 29 594 608 37 315 392 11,397 12,017 1 2 7 113 90Wisconsin 3 8 17 266 487 34 94 127 3,271 3,569 — 1 5 52 50
W.N. Central 31 24 61 823 1,599 128 300 363 10,943 10,660 1 4 10 114 165Iowa 1 5 15 206 218 2 36 53 1,379 1,280 — 0 0 — 1Kansas — 2 7 70 174 7 39 57 1,475 1,516 — 0 2 16 16Minnesota — 0 30 — 634 — 36 53 1,184 1,596 — 0 5 — 59Missouri 15 8 23 313 309 109 150 182 5,527 4,987 1 1 5 61 63Nebraska§ 3 4 11 143 169 10 24 49 876 830 — 1 3 25 16North Dakota 12 0 12 34 18 — 4 8 128 149 — 0 6 11 10South Dakota — 1 6 57 77 — 11 20 374 302 — 0 1 1 —
S. Atlantic 41 55 104 1,981 2,899 1,193 1,459 1,862 53,826 56,466 6 15 31 556 582Delaware — 0 2 23 25 11 17 31 597 733 — 0 2 3 5District of Columbia — 1 3 28 44 — 40 69 1,422 1,540 — 0 1 — 3Florida 25 24 56 884 1,561 232 379 465 14,338 15,018 3 5 12 181 134Georgia 8 13 51 555 576 169 313 874 11,251 11,254 — 3 7 104 127Maryland§ 4 4 13 197 206 125 117 246 4,078 5,084 2 2 5 66 52North Carolina N 0 0 N N 374 278 535 11,608 10,875 — 1 8 55 107South Carolina§ 1 2 7 82 110 181 145 257 5,844 5,928 1 1 5 59 69Virginia§ 3 7 32 190 347 91 111 185 4,095 5,657 — 1 8 74 66West Virginia — 0 8 22 30 10 16 29 593 377 — 0 9 14 19
E.S. Central 2 4 11 129 156 265 495 1,007 18,605 18,282 — 3 11 145 133Alabama§ 2 4 11 129 156 — 159 410 5,979 5,660 — 1 4 43 22Kentucky N 0 0 N N 65 69 712 3,102 2,943 — 0 4 20 26Mississippi N 0 0 N N 122 117 197 4,174 4,490 — 0 3 12 10Tennessee§ N 0 0 N N 78 143 219 5,350 5,189 — 2 5 70 75
W.S. Central 3 5 17 178 300 670 919 1,319 33,187 35,739 — 2 26 101 103Arkansas§ 3 2 9 88 88 84 94 138 3,569 3,471 — 0 3 26 15Louisiana — 3 12 90 150 108 136 372 4,677 5,995 — 1 4 36 20Oklahoma — 0 0 — 62 — 60 254 2,169 3,167 — 1 19 38 61Texas§ N 0 0 N N 478 595 867 22,772 23,106 — 0 4 1 7
Mountain 30 26 51 928 1,314 135 191 253 7,321 6,996 — 5 12 197 239Arizona — 3 8 91 118 92 68 110 2,733 2,349 — 2 6 74 88Colorado 25 12 24 455 520 — 43 87 1,533 2,001 — 1 5 47 67Idaho§ 1 3 9 107 159 — 2 14 90 81 — 0 2 15 13Montana§ 3 2 5 56 81 2 1 4 59 85 — 0 1 2 2Nevada§ — 1 6 36 79 36 36 103 1,511 1,341 — 0 2 13 6New Mexico§ 1 2 6 64 78 3 28 98 1,191 860 — 1 4 31 31Utah — 3 9 101 238 — 4 10 174 254 — 0 3 14 26Wyoming§ — 0 5 18 41 2 0 3 30 25 — 0 1 1 6
Pacific 32 49 128 1,789 2,080 320 615 791 22,669 23,436 — 4 10 132 105Alaska — 2 7 66 76 — 20 34 705 979 — 0 3 19 19California 25 33 67 1,214 1,262 251 503 695 18,773 19,141 — 0 6 33 16Hawaii — 0 4 24 47 — 13 26 464 536 — 0 3 19 18Oregon 7 7 20 238 379 22 25 40 978 747 — 2 6 58 47Washington — 8 57 247 316 47 50 86 1,749 2,033 — 0 2 3 5
TerritoriesAmerican Samoa — 0 0 — — — 0 0 — — — 0 0 — —C.N.M.I. — — — — — — — — — — — — — — —Guam — 0 0 — 3 — 0 10 6 72 — 0 0 — —Puerto Rico — 1 7 29 67 5 6 14 237 218 — 0 0 — 1U.S. Virgin Islands — 0 0 — — — 2 7 83 106 — 0 0 — —
C.N.M.I.: Commonwealth of Northern Mariana Islands.U: Unavailable. —: No reported cases. N: Not reportable. NN: Not Nationally Notifiable. Cum: Cumulative year-to-date counts. Med: Median. Max: Maximum.* Case counts for reporting year 2010 and 2011 are provisional and subject to change. For further information on interpretation of these data, see http://www.cdc.gov/osels/ph_surveillance/
nndss/phs/files/ProvisionalNationa%20NotifiableDiseasesSurveillanceData20100927.pdf. Data for TB are displayed in Table IV, which appears quarterly.† Data for H. influenzae (age <5 yrs for serotype b, nonserotype b, and unknown serotype) are available in Table I.§ Contains data reported through the National Electronic Disease Surveillance System (NEDSS).

Morbidity and Mortality Weekly Report
1328 MMWR / September 30, 2011 / Vol. 60 / No. 38
TABLE II. (Continued) Provisional cases of selected notifiable diseases, United States, weeks ending September 24, 2011, and September 25, 2010 (38th week)*
Hepatitis (viral, acute), by type
Reporting area
A B C
Current week
Previous 52 weeks Cum 2011
Cum 2010
Current week
Previous 52 weeks Cum 2011
Cum 2010
Current week
Previous 52 weeks Cum 2011
Cum 2010Med Max Med Max Med Max
United States 14 22 74 802 1,179 73 48 167 1,728 2,401 10 18 39 701 608New England — 1 4 38 81 — 1 8 46 44 — 1 4 40 42
Connecticut — 0 3 9 22 — 0 4 10 18 — 0 3 25 28Maine† — 0 2 5 7 — 0 2 6 11 — 0 2 6 2Massachusetts — 0 2 16 43 — 0 6 29 8 — 0 2 5 12New Hampshire — 0 1 — — — 0 1 1 5 N 0 0 N NRhode Island† — 0 1 3 9 U 0 0 U U U 0 0 U UVermont† — 0 2 5 — — 0 0 — 2 — 0 1 4 —
Mid. Atlantic 3 4 12 147 192 4 5 12 193 222 1 1 6 60 79New Jersey — 1 4 20 57 — 1 4 32 60 — 0 4 1 17New York (Upstate) 2 1 4 37 41 2 1 9 36 36 1 0 4 35 39New York City — 1 6 49 53 — 1 5 58 69 — 0 0 — 3Pennsylvania 1 1 3 41 41 2 2 4 67 57 — 0 4 24 20
E.N. Central 2 4 9 137 153 1 5 38 244 375 1 3 12 132 69Illinois — 1 3 33 42 — 1 6 51 96 — 0 1 5 —Indiana — 0 3 12 11 — 1 3 35 58 — 0 5 47 24Michigan — 1 6 56 51 — 1 6 63 99 1 2 7 75 30Ohio 2 1 5 31 35 1 1 30 75 83 — 0 1 4 8Wisconsin — 0 2 5 14 — 0 3 20 39 — 0 1 1 7
W.N. Central — 1 25 32 63 — 2 16 97 86 — 0 6 6 13Iowa — 0 1 4 9 — 0 1 7 12 — 0 0 — —Kansas — 0 2 3 10 — 0 2 9 6 — 0 1 2 1Minnesota — 0 22 9 13 — 0 15 9 6 — 0 6 2 6Missouri — 0 1 10 16 — 2 5 60 51 — 0 1 — 4Nebraska† — 0 3 4 14 — 0 3 11 10 — 0 1 2 2North Dakota — 0 3 — — — 0 0 — — — 0 0 — —South Dakota — 0 2 2 1 — 0 1 1 1 — 0 0 — —
S. Atlantic 5 5 13 169 260 53 12 33 479 661 5 4 11 172 137Delaware — 0 1 2 6 — 0 1 — 21 U 0 0 U UDistrict of Columbia — 0 0 — 1 — 0 0 — 3 — 0 0 — 2Florida 3 1 6 58 104 6 4 11 151 218 3 1 4 45 43Georgia 1 1 4 33 29 3 2 8 68 132 — 1 3 26 18Maryland† — 0 4 21 17 — 1 4 41 47 — 0 2 27 18North Carolina 1 0 3 20 41 1 2 12 83 80 — 1 7 40 32South Carolina† — 0 2 9 22 — 1 4 25 46 — 0 1 1 1Virginia† — 1 4 18 38 — 1 7 48 67 2 0 2 14 9West Virginia — 0 5 8 2 43 0 18 63 47 — 0 6 19 14
E.S. Central — 0 6 35 32 4 9 14 306 264 2 3 7 124 117Alabama† — 0 2 4 5 1 2 4 77 50 — 0 2 10 5Kentucky — 0 6 7 13 — 2 6 76 93 1 1 6 51 81Mississippi — 0 1 6 2 — 1 3 31 25 U 0 0 U UTennessee† — 0 5 18 12 3 3 7 122 96 1 1 5 63 31
W.S. Central 4 2 15 87 97 9 7 67 216 424 1 2 11 67 53Arkansas† — 0 1 — 1 — 1 4 37 48 — 0 0 — 1Louisiana — 0 1 2 8 — 1 4 23 43 — 0 2 5 2Oklahoma — 0 4 3 1 4 1 16 52 74 — 1 10 34 19Texas† 4 2 11 82 87 5 3 45 104 259 1 0 3 28 31
Mountain — 1 5 51 121 1 2 5 56 106 — 1 4 42 49Arizona — 0 2 14 52 1 0 3 13 18 U 0 0 U UColorado — 0 2 17 32 — 0 3 15 36 — 0 3 14 11Idaho† — 0 1 6 6 — 0 1 2 6 — 0 2 8 9Montana† — 0 1 2 4 — 0 0 — — — 0 1 3 2Nevada† — 0 3 5 12 — 0 3 16 34 — 0 1 5 4New Mexico† — 0 1 4 3 — 0 2 5 4 — 0 1 9 13Utah — 0 2 1 9 — 0 1 5 7 — 0 1 1 10Wyoming† — 0 1 2 3 — 0 1 — 1 — 0 1 2 —
Pacific — 3 15 106 180 1 3 25 91 219 — 1 12 58 49Alaska — 0 1 2 1 — 0 1 4 2 U 0 0 U UCalifornia — 2 15 77 143 — 2 22 38 147 — 1 4 23 20Hawaii — 0 2 7 6 — 0 1 5 5 U 0 0 U UOregon — 0 2 5 15 1 0 4 27 33 — 0 3 11 11Washington — 0 4 15 15 — 0 4 17 32 — 0 5 24 18
TerritoriesAmerican Samoa — 0 0 — — — 0 0 — — — 0 0 — —C.N.M.I. — — — — — — — — — — — — — — —Guam — 0 5 8 4 — 0 8 28 64 — 0 4 10 52Puerto Rico — 0 2 6 11 — 0 3 7 17 N 0 0 N NU.S. Virgin Islands — 0 0 — — — 0 0 — — — 0 0 — —
C.N.M.I.: Commonwealth of Northern Mariana Islands.U: Unavailable. —: No reported cases. N: Not reportable. NN: Not Nationally Notifiable. Cum: Cumulative year-to-date counts. Med: Median. Max: Maximum.* Case counts for reporting year 2010 and 2011 are provisional and subject to change. For further information on interpretation of these data, see http://www.cdc.gov/osels/ph_surveillance/
nndss/phs/files/ProvisionalNationa%20NotifiableDiseasesSurveillanceData20100927.pdf. Data for TB are displayed in Table IV, which appears quarterly.† Contains data reported through the National Electronic Disease Surveillance System (NEDSS).

Morbidity and Mortality Weekly Report
MMWR / September 30, 2011 / Vol. 60 / No. 38 1329
TABLE II. (Continued) Provisional cases of selected notifiable diseases, United States, weeks ending September 24, 2011, and September 25, 2010 (38th week)*
Reporting area
Legionellosis Lyme disease Malaria
Current week
Previous 52 weeks Cum 2011
Cum 2010
Current week
Previous 52 weeks Cum 2011
Cum 2010
Current week
Previous 52 weeks Cum 2011
Cum 2010Med Max Med Max Med Max
United States 86 53 128 2,190 2,358 372 352 1,630 21,084 24,938 19 27 114 950 1,257New England 1 4 15 122 190 1 72 293 3,481 7,575 — 1 20 52 83
Connecticut — 0 6 25 31 — 29 173 1,438 2,565 — 0 20 6 2Maine† 1 0 2 9 10 — 9 49 380 544 — 0 1 3 5Massachusetts — 1 9 58 96 — 16 50 494 2,924 — 1 5 33 64New Hampshire — 0 3 12 16 — 11 60 594 1,102 — 0 2 2 2Rhode Island† — 0 4 9 28 — 1 35 110 152 — 0 4 2 7Vermont† — 0 2 9 9 1 5 62 465 288 — 0 1 6 3
Mid. Atlantic 42 15 53 708 621 323 151 1,157 13,745 8,845 3 7 18 204 386New Jersey — 2 18 88 97 84 51 540 5,536 3,080 — 0 6 8 83New York (Upstate) 21 5 24 245 184 138 35 214 2,720 2,005 3 1 4 34 61New York City — 3 17 107 117 — 1 18 58 581 — 3 12 116 199Pennsylvania 21 5 28 268 223 101 62 491 5,431 3,179 — 1 4 46 43
E.N. Central 12 10 50 492 522 2 20 93 1,006 3,393 1 3 7 109 130Illinois — 1 6 61 130 — 1 19 124 122 — 1 4 42 51Indiana — 1 5 65 46 — 0 15 78 75 — 0 2 8 11Michigan — 2 14 108 132 2 1 10 84 83 1 0 4 23 26Ohio 12 4 34 257 163 — 1 9 39 22 — 1 4 30 33Wisconsin — 0 4 1 51 — 16 63 681 3,091 — 0 2 6 9
W.N. Central — 2 9 61 86 — 2 32 91 1,911 1 1 45 25 56Iowa — 0 2 8 14 — 0 11 66 81 — 0 3 15 10Kansas — 0 2 5 8 — 0 2 10 10 — 0 2 6 9Minnesota — 0 8 — 23 — 0 31 — 1,794 — 0 45 — 3Missouri — 1 5 41 25 — 0 0 — 4 — 0 1 — 16Nebraska† — 0 1 4 8 — 0 2 8 8 1 0 1 3 15North Dakota — 0 1 1 3 — 0 10 4 13 — 0 1 — —South Dakota — 0 2 2 5 — 0 1 3 1 — 0 1 1 3
S. Atlantic 22 8 22 338 392 42 52 164 2,512 2,925 10 8 23 331 329Delaware — 0 2 9 13 8 11 46 640 540 — 0 3 6 2District of Columbia — 0 3 9 14 — 0 2 11 32 — 0 1 5 11Florida 6 3 9 115 124 6 1 8 91 65 — 2 7 78 98Georgia — 1 4 27 43 — 0 3 15 9 3 1 5 63 57Maryland† 12 1 6 64 88 12 18 104 896 1,211 4 2 13 85 72North Carolina — 1 7 49 43 — 0 8 51 64 — 0 6 34 34South Carolina† — 0 4 13 10 1 0 6 24 27 1 0 1 4 3Virginia† 4 1 9 46 46 9 17 76 729 889 2 1 8 56 50West Virginia — 0 2 6 11 6 0 14 55 88 — 0 1 — 2
E.S. Central 1 2 10 116 104 — 1 5 45 39 — 1 3 25 24Alabama† — 0 2 18 15 — 0 2 13 2 — 0 2 5 6Kentucky — 0 3 23 22 — 0 1 1 5 — 0 1 6 6Mississippi — 0 3 10 12 — 0 1 3 — — 0 1 1 2Tennessee† 1 1 8 65 55 — 0 3 28 32 — 0 3 13 10
W.S. Central 4 3 13 92 122 — 1 29 32 85 — 1 18 26 75Arkansas† — 0 2 9 14 — 0 0 — — — 0 1 4 4Louisiana — 0 3 13 9 — 0 1 1 3 — 0 1 1 2Oklahoma 2 0 3 9 11 — 0 0 — — — 0 1 4 5Texas† 2 2 11 61 88 — 1 29 31 82 — 0 17 17 64
Mountain 1 2 5 64 134 — 0 4 30 24 — 1 4 50 48Arizona — 1 3 21 47 — 0 2 7 2 — 0 4 20 22Colorado — 0 2 4 24 — 0 1 1 2 — 0 3 18 15Idaho† 1 0 1 5 5 — 0 2 3 8 — 0 1 2 1Montana† — 0 1 1 4 — 0 2 8 4 — 0 1 1 2Nevada† — 0 2 11 18 — 0 1 3 — — 0 2 6 4New Mexico† — 0 2 7 7 — 0 2 6 5 — 0 1 2 1Utah — 0 2 13 22 — 0 1 1 3 — 0 1 1 3Wyoming† — 0 1 2 7 — 0 1 1 — — 0 0 — —
Pacific 3 5 21 197 187 4 3 11 142 141 4 4 10 128 126Alaska — 0 0 — 2 — 0 2 6 6 — 0 2 4 3California 3 4 15 168 159 4 2 9 117 90 4 2 8 91 84Hawaii — 0 1 1 1 N 0 0 N N — 0 1 5 2Oregon — 0 3 12 10 — 0 2 13 38 — 0 4 12 9Washington — 0 6 16 15 — 0 4 6 7 — 0 3 16 28
TerritoriesAmerican Samoa N 0 0 N N N 0 0 N N — 0 1 1 —C.N.M.I. — — — — — — — — — — — — — — —Guam — 0 1 — — — 0 0 — — — 0 0 — —Puerto Rico — 0 1 — 1 N 0 0 N N — 0 0 — 5U.S. Virgin Islands — 0 0 — — — 0 0 — — — 0 0 — —
C.N.M.I.: Commonwealth of Northern Mariana Islands.U: Unavailable. —: No reported cases. N: Not reportable. NN: Not Nationally Notifiable. Cum: Cumulative year-to-date counts. Med: Median. Max: Maximum.* Case counts for reporting year 2010 and 2011 are provisional and subject to change. For further information on interpretation of these data, see http://www.cdc.gov/osels/ph_surveillance/
nndss/phs/files/ProvisionalNationa%20NotifiableDiseasesSurveillanceData20100927.pdf. Data for TB are displayed in Table IV, which appears quarterly.† Contains data reported through the National Electronic Disease Surveillance System (NEDSS).

Morbidity and Mortality Weekly Report
1330 MMWR / September 30, 2011 / Vol. 60 / No. 38
TABLE II. (Continued) Provisional cases of selected notifiable diseases, United States, weeks ending September 24, 2011, and September 25, 2010 (38th week)*
Reporting area
Meningococcal disease, invasive† All serogroups Mumps Pertussis
Current week
Previous 52 weeks Cum 2011
Cum 2010
Current week
Previous 52 weeks Cum 2011
Cum 2010
Current week
Previous 52 weeks Cum 2011
Cum 2010Med Max Med Max Med Max
United States 5 15 53 514 583 6 7 47 209 2,389 77 291 2,925 9,840 15,747New England — 0 3 24 14 — 0 1 5 24 1 8 18 312 391
Connecticut — 0 1 3 2 — 0 0 — 11 — 1 6 30 89Maine§ — 0 1 4 3 — 0 1 — 1 1 2 8 103 38Massachusetts — 0 2 11 4 — 0 1 3 9 — 3 10 99 207New Hampshire — 0 1 1 — — 0 0 — 3 — 1 7 51 13Rhode Island§ — 0 1 — — — 0 1 1 — — 0 3 17 33Vermont§ — 0 3 5 5 — 0 1 1 — — 0 3 12 11
Mid. Atlantic 1 1 6 59 60 2 1 23 27 2,053 26 34 125 1,127 1,023New Jersey — 0 1 5 19 — 0 2 9 340 — 3 7 102 126New York (Upstate) 1 0 4 19 9 2 0 2 8 658 21 13 81 497 350New York City — 0 3 22 15 — 0 22 9 1,032 — 0 19 38 62Pennsylvania — 0 2 13 17 — 0 16 1 23 5 14 70 490 485
E.N. Central — 2 7 69 99 1 1 7 54 47 12 58 198 2,024 3,562Illinois — 0 3 21 19 — 1 3 31 17 — 15 50 515 621Indiana — 0 2 11 22 — 0 1 — 3 — 4 26 140 501Michigan — 0 4 8 16 1 0 1 9 17 4 17 57 509 1,019Ohio — 1 2 20 24 — 0 5 11 9 8 17 80 553 1,093Wisconsin — 0 2 9 18 — 0 1 3 1 — 10 25 307 328
W.N. Central 2 1 4 37 41 1 0 4 31 79 8 24 501 866 1,476Iowa — 0 1 9 9 — 0 1 5 37 — 5 36 139 402Kansas — 0 1 2 6 — 0 1 4 4 — 2 10 71 137Minnesota — 0 2 — 3 — 0 4 1 4 — 0 469 326 444Missouri 1 0 2 13 16 — 0 3 12 9 8 7 43 226 288Nebraska§ 1 0 2 10 5 1 0 1 5 23 — 1 11 43 140North Dakota — 0 1 1 2 — 0 3 4 — — 0 10 37 38South Dakota — 0 1 2 — — 0 0 — 2 — 0 6 24 27
S. Atlantic 2 2 8 106 107 2 0 3 21 47 10 31 106 991 1,271Delaware — 0 1 1 — — 0 0 — — — 0 5 21 9District of Columbia — 0 1 1 1 — 0 0 — 3 — 0 2 3 7Florida 1 1 5 41 49 2 0 2 7 8 5 6 17 247 237Georgia 1 0 1 12 8 — 0 2 4 2 1 3 13 125 184Maryland§ — 0 1 11 7 — 0 1 1 10 1 2 6 60 97North Carolina — 0 3 13 12 — 0 2 7 8 — 3 35 133 234South Carolina§ — 0 1 9 11 — 0 0 — 4 — 3 25 104 289Virginia§ — 0 2 11 17 — 0 2 2 10 3 7 41 246 165West Virginia — 0 3 7 2 — 0 0 — 2 — 0 41 52 49
E.S. Central — 0 3 20 29 — 0 1 4 9 4 9 28 269 577Alabama§ — 0 2 9 5 — 0 1 1 6 — 3 11 107 156Kentucky — 0 2 2 13 — 0 0 — 1 1 1 16 55 197Mississippi — 0 1 2 3 — 0 1 3 — — 1 10 24 58Tennessee§ — 0 2 7 8 — 0 1 — 2 3 2 10 83 166
W.S. Central — 1 12 41 64 — 1 15 49 77 7 23 297 668 2,229Arkansas§ — 0 1 8 5 — 0 1 1 5 — 1 16 43 167Louisiana — 0 2 8 12 — 0 2 — 5 — 0 3 15 33Oklahoma — 0 2 7 14 — 0 1 1 — — 0 92 29 49Texas§ — 0 10 18 33 — 1 14 47 67 7 19 187 581 1,980
Mountain — 1 4 35 45 — 0 2 6 18 7 43 100 1,324 1,098Arizona — 0 1 10 11 — 0 0 — 5 — 15 29 552 329Colorado — 0 1 8 16 — 0 1 3 7 5 9 63 297 163Idaho§ — 0 1 5 5 — 0 1 1 1 2 2 13 103 155Montana§ — 0 2 3 1 — 0 0 — — — 2 16 70 60Nevada§ — 0 1 1 8 — 0 0 — 1 — 0 5 19 27New Mexico§ — 0 1 1 3 — 0 2 2 — — 2 10 93 97Utah — 0 2 7 1 — 0 0 — 3 — 5 16 182 255Wyoming§ — 0 1 — — — 0 0 — 1 — 0 1 8 12
Pacific — 4 26 123 124 — 0 3 12 35 2 72 1,710 2,259 4,120Alaska — 0 1 2 1 — 0 1 1 1 — 0 6 21 34California — 2 17 89 81 — 0 3 5 23 1 59 1,569 1,613 3,526Hawaii — 0 1 4 1 — 0 1 2 3 — 1 9 71 58Oregon — 0 3 16 24 — 0 1 4 2 1 5 11 204 230Washington — 0 8 12 17 — 0 1 — 6 — 9 131 350 272
TerritoriesAmerican Samoa — 0 0 — — — 0 0 — — — 0 0 — —C.N.M.I. — — — — — — — — — — — — — — —Guam — 0 0 — — — 2 9 12 448 — 0 14 31 2Puerto Rico — 0 1 — 1 — 0 1 1 1 — 0 1 2 2U.S. Virgin Islands — 0 0 — — — 0 0 — — — 0 0 — —
C.N.M.I.: Commonwealth of Northern Mariana Islands.U: Unavailable. —: No reported cases. N: Not reportable. NN: Not Nationally Notifiable. Cum: Cumulative year-to-date counts. Med: Median. Max: Maximum.* Case counts for reporting year 2010 and 2011 are provisional and subject to change. For further information on interpretation of these data, see http://www.cdc.gov/osels/ph_surveillance/
nndss/phs/files/ProvisionalNationa%20NotifiableDiseasesSurveillanceData20100927.pdf. Data for TB are displayed in Table IV, which appears quarterly.† Data for meningococcal disease, invasive caused by serogroups A, C, Y, and W-135; serogroup B; other serogroup; and unknown serogroup are available in Table I.§ Contains data reported through the National Electronic Disease Surveillance System (NEDSS).

Morbidity and Mortality Weekly Report
MMWR / September 30, 2011 / Vol. 60 / No. 38 1331
TABLE II. (Continued) Provisional cases of selected notifiable diseases, United States, weeks ending September 24, 2011, and September 25, 2010 (38th week)*
Reporting area
Rabies, animal Salmonellosis Shiga toxin-producing E. coli (STEC)†
Current week
Previous 52 weeks Cum 2011
Cum 2010
Current week
Previous 52 weeks Cum 2011
Cum 2010
Current week
Previous 52 weeks Cum 2011
Cum 2010Med Max Med Max Med Max
United States 27 53 119 1,905 3,401 961 952 1,740 32,854 38,268 57 92 264 3,435 3,797New England — 3 13 130 242 3 25 351 1,297 1,933 1 2 36 141 174
Connecticut — 0 9 28 109 — 0 330 330 491 — 0 36 36 60Maine§ — 1 6 52 48 — 3 8 98 95 — 0 3 23 15Massachusetts — 0 0 — — — 17 38 554 1,010 — 0 10 44 66New Hampshire — 0 3 17 15 — 3 8 130 142 1 0 3 22 18Rhode Island§ — 0 4 15 27 — 1 62 135 141 — 0 2 4 2Vermont§ — 0 2 18 43 3 1 5 50 54 — 0 3 12 13
Mid. Atlantic 12 13 25 461 840 70 100 205 4,105 4,505 4 10 31 428 429New Jersey — 0 0 — — — 21 48 786 918 — 2 6 67 97New York (Upstate) 12 7 20 283 396 50 25 66 1,050 1,078 2 4 12 154 142New York City — 0 3 9 138 2 21 41 846 1,023 — 1 6 62 55Pennsylvania — 6 17 169 306 18 32 111 1,423 1,486 2 3 18 145 135
E.N. Central 1 2 16 145 212 50 87 148 3,251 4,638 10 11 39 579 658Illinois — 1 6 46 109 — 28 56 1,066 1,567 — 2 10 118 125Indiana — 0 6 20 — — 10 23 349 604 — 2 8 85 106Michigan — 1 6 45 59 7 14 30 583 750 1 2 16 116 131Ohio 1 0 5 34 44 43 21 47 938 1,019 9 2 10 139 113Wisconsin N 0 0 N N — 9 44 315 698 — 2 13 121 183
W.N. Central 1 2 40 65 213 53 47 95 1,767 2,284 5 12 39 532 696Iowa — 0 1 — 24 3 9 20 345 411 — 2 15 137 137Kansas 1 0 4 25 52 8 7 20 315 336 2 1 8 76 53Minnesota — 0 34 — 25 — 0 16 — 586 — 0 8 — 232Missouri — 0 2 — 59 27 16 45 754 622 1 4 14 191 185Nebraska§ — 0 3 29 43 13 4 13 192 182 1 1 7 79 59North Dakota — 0 6 11 10 2 0 15 32 30 1 0 10 11 5South Dakota — 0 0 — — — 3 17 129 117 — 1 4 38 25
S. Atlantic 7 18 90 805 888 511 279 716 9,884 10,367 21 14 29 487 499Delaware — 0 0 — — — 3 9 118 135 — 0 2 12 4District of Columbia — 0 0 — — — 1 5 43 78 — 0 1 3 8Florida — 0 81 81 121 200 107 226 3,891 4,214 9 3 15 109 158Georgia — 0 0 — — 60 42 123 1,754 2,082 — 2 8 89 78Maryland§ — 6 14 204 289 17 18 38 684 815 4 1 8 35 69North Carolina — 0 0 — — 170 34 251 1,491 1,001 5 2 11 89 45South Carolina§ N 0 0 N N 34 30 99 1,044 1,095 — 0 4 15 18Virginia§ 7 11 27 451 421 30 21 68 817 802 3 3 9 132 103West Virginia — 0 30 69 57 — 0 14 42 145 — 0 4 3 16
E.S. Central 1 2 7 93 144 61 60 187 2,778 2,821 4 4 22 202 192Alabama§ 1 1 7 67 60 31 18 70 833 729 — 1 15 68 38Kentucky — 0 2 12 16 13 9 32 329 433 1 1 5 32 49Mississippi — 0 1 1 — 1 20 66 900 881 — 0 12 17 14Tennessee§ — 0 4 13 68 16 17 50 716 778 3 2 11 85 91
W.S. Central — 1 31 53 651 152 134 515 4,255 4,787 6 6 151 225 228Arkansas§ — 0 10 41 23 51 14 47 614 545 5 0 3 35 43Louisiana — 0 0 — — — 14 52 537 987 — 0 2 6 15Oklahoma — 0 20 12 40 28 11 95 486 470 1 1 55 42 19Texas§ — 0 30 — 588 73 86 381 2,618 2,785 — 5 95 142 151
Mountain 1 0 4 25 59 8 47 91 1,766 2,189 5 11 30 404 473Arizona N 0 0 N N — 14 34 532 739 1 2 14 66 47Colorado — 0 0 — — 3 10 24 417 437 1 2 11 87 175Idaho§ 1 0 1 4 11 2 3 8 114 124 3 3 6 83 65Montana§ N 0 0 N N 3 2 10 101 76 — 1 5 34 34Nevada§ — 0 2 4 5 — 3 8 101 245 — 0 7 26 28New Mexico§ — 0 2 10 10 — 6 22 231 244 — 1 6 32 34Utah — 0 2 7 9 — 6 15 224 277 — 1 7 62 71Wyoming§ — 0 1 — 24 — 1 9 46 47 — 0 3 14 19
Pacific 4 3 15 128 152 53 110 288 3,751 4,744 1 13 46 437 448Alaska — 0 2 9 12 — 1 6 44 65 — 0 1 2 2California 4 3 10 109 127 42 75 232 2,893 3,473 1 8 36 281 199Hawaii — 0 0 — — 9 7 14 258 257 — 0 1 6 27Oregon — 0 2 10 13 2 5 14 175 418 — 1 11 56 72Washington — 0 14 — — — 12 42 381 531 — 2 16 92 148
TerritoriesAmerican Samoa N 0 0 N N — 0 0 — 2 — 0 0 — —C.N.M.I. — — — — — — — — — — — — — — —Guam — 0 0 — — — 0 3 6 8 — 0 0 — —Puerto Rico 1 0 6 25 35 — 5 25 135 436 — 0 0 — —U.S. Virgin Islands — 0 0 — — — 0 0 — — — 0 0 — —
C.N.M.I.: Commonwealth of Northern Mariana Islands.U: Unavailable. —: No reported cases. N: Not reportable. NN: Not Nationally Notifiable. Cum: Cumulative year-to-date counts. Med: Median. Max: Maximum.* Case counts for reporting year 2010 and 2011 are provisional and subject to change. For further information on interpretation of these data, see http://www.cdc.gov/osels/ph_surveillance/
nndss/phs/files/ProvisionalNationa%20NotifiableDiseasesSurveillanceData20100927.pdf. Data for TB are displayed in Table IV, which appears quarterly.† Includes E. coli O157:H7; Shiga toxin-positive, serogroup non-O157; and Shiga toxin-positive, not serogrouped.§ Contains data reported through the National Electronic Disease Surveillance System (NEDSS).

Morbidity and Mortality Weekly Report
1332 MMWR / September 30, 2011 / Vol. 60 / No. 38
TABLE II. (Continued) Provisional cases of selected notifiable diseases, United States, weeks ending September 24, 2011, and September 25, 2010 (38th week)*
Spotted Fever Rickettsiosis (including RMSF)†
Reporting area
Shigellosis Confirmed Probable
Current week
Previous 52 weeks Cum 2011
Cum 2010
Current week
Previous 52 weeks Cum 2011
Cum 2010
Current week
Previous 52 weeks Cum 2011
Cum 2010Med Max Med Max Med Max
United States 179 229 742 7,689 10,268 1 2 16 138 116 36 23 245 1,348 1,238New England — 2 29 134 288 — 0 0 — — — 0 1 3 3
Connecticut — 0 28 28 69 — 0 0 — — — 0 0 — —Maine§ — 0 4 19 5 — 0 0 — — — 0 0 — 2Massachusetts — 2 6 76 191 — 0 0 — — — 0 1 1 —New Hampshire — 0 2 2 11 — 0 0 — — — 0 1 1 1Rhode Island§ — 0 4 6 11 — 0 0 — — — 0 1 1 —Vermont§ — 0 1 3 1 — 0 0 — — — 0 0 — —
Mid. Atlantic 19 15 74 551 1,343 — 0 2 11 2 1 1 5 33 81New Jersey — 3 8 89 311 — 0 0 — 1 — 0 3 — 47New York (Upstate) 12 3 18 183 173 — 0 1 3 1 — 0 2 6 11New York City 3 4 12 190 241 — 0 0 — — — 0 2 14 11Pennsylvania 4 3 56 89 618 — 0 2 8 — 1 0 3 13 12
E.N. Central 5 15 40 521 1,291 — 0 2 4 3 1 1 6 75 74Illinois — 4 10 115 738 — 0 1 — 2 — 0 3 26 33Indiana§ — 1 4 43 49 — 0 0 — 1 — 0 4 36 20Michigan — 3 10 122 199 — 0 1 1 — — 0 1 1 1Ohio 5 5 27 241 244 — 0 2 3 — 1 0 2 12 14Wisconsin — 0 4 — 61 — 0 0 — — — 0 1 — 6
W.N. Central 3 8 38 229 1,762 — 0 7 24 12 1 4 30 282 235Iowa — 0 4 13 42 — 0 0 — — — 0 2 5 5Kansas§ — 2 12 41 209 — 0 0 — — — 0 0 — —Minnesota — 0 4 — 45 — 0 0 — — — 0 2 — —Missouri 3 5 18 160 1,430 — 0 4 17 9 1 4 30 273 227Nebraska§ — 0 10 11 29 — 0 3 5 3 — 0 1 3 2North Dakota — 0 0 — — — 0 1 2 — — 0 0 — 1South Dakota — 0 2 4 7 — 0 0 — — — 0 1 1 —
S. Atlantic 67 68 133 2,705 1,778 — 1 8 73 72 6 6 55 376 381Delaware§ — 0 1 3 36 — 0 1 1 1 — 0 4 16 17District of Columbia — 0 2 12 27 — 0 1 1 — — 0 1 1 —Florida§ 38 42 98 1,928 748 — 0 1 3 3 — 0 2 8 8Georgia 15 11 26 407 571 — 0 5 41 52 — 0 0 — —Maryland§ 1 2 7 72 100 — 0 1 2 — — 0 3 21 38North Carolina 9 4 36 164 124 — 0 4 12 12 — 1 49 201 194South Carolina§ — 1 4 37 55 — 0 2 10 1 1 0 2 17 12Virginia§ 4 2 8 78 102 — 0 1 3 3 5 2 9 109 112West Virginia — 0 66 4 15 — 0 0 — — — 0 1 3 —
E.S. Central 9 14 29 432 533 — 0 3 7 17 9 5 27 303 345Alabama§ 9 4 15 154 124 — 0 1 3 4 1 1 8 55 68Kentucky — 1 6 36 193 — 0 1 1 6 — 0 0 — —Mississippi — 2 9 117 40 — 0 0 — 1 — 0 4 12 17Tennessee§ — 4 14 125 176 — 0 2 3 6 8 4 21 236 260
W.S. Central 44 59 503 1,811 1,872 1 0 8 5 4 18 1 235 248 106Arkansas§ 5 2 7 56 47 — 0 2 3 — — 0 39 202 65Louisiana — 5 20 166 203 — 0 0 — — — 0 2 4 2Oklahoma 12 2 161 82 216 1 0 5 2 3 17 0 202 38 21Texas§ 27 48 338 1,507 1,406 — 0 1 — 1 1 0 5 4 18
Mountain 7 16 35 561 584 — 0 5 13 2 — 0 6 28 12Arizona 2 6 19 208 312 — 0 4 12 — — 0 6 15 1Colorado§ 4 1 8 75 73 — 0 1 — — — 0 1 2 1Idaho§ — 0 3 15 20 — 0 1 1 — — 0 1 1 5Montana§ 1 1 15 117 7 — 0 0 — 2 — 0 1 1 1Nevada§ — 0 6 23 34 — 0 0 — — — 0 0 — —New Mexico§ — 3 9 84 101 — 0 0 — — — 0 1 1 1Utah — 1 4 37 37 — 0 0 — — — 0 1 1 3Wyoming§ — 0 1 2 — — 0 0 — — — 0 2 7 —
Pacific 25 22 63 745 817 — 0 2 1 4 — 0 0 — 1Alaska — 0 2 5 1 N 0 0 N N N 0 0 N NCalifornia 25 19 59 609 650 — 0 2 1 4 — 0 0 — —Hawaii — 1 3 41 38 N 0 0 N N N 0 0 N NOregon — 1 4 31 45 — 0 0 — — — 0 0 — 1Washington — 1 7 59 83 — 0 1 — — — 0 0 — —
TerritoriesAmerican Samoa — 1 1 1 2 N 0 0 N N N 0 0 N NC.N.M.I. — — — — — — — — — — — — — — —Guam — 0 1 1 5 N 0 0 N N N 0 0 N NPuerto Rico — 0 1 — 4 N 0 0 N N N 0 0 N NU.S. Virgin Islands — 0 0 — — — 0 0 — — — 0 0 — —
C.N.M.I.: Commonwealth of Northern Mariana Islands.U: Unavailable. —: No reported cases. N: Not reportable. NN: Not Nationally Notifiable. Cum: Cumulative year-to-date counts. Med: Median. Max: Maximum.* Case counts for reporting year 2010 and 2011 are provisional and subject to change. For further information on interpretation of these data, see http://www.cdc.gov/osels/ph_surveillance/
nndss/phs/files/ProvisionalNationa%20NotifiableDiseasesSurveillanceData20100927.pdf. Data for TB are displayed in Table IV, which appears quarterly.† Illnesses with similar clinical presentation that result from Spotted fever group rickettsia infections are reported as Spotted fever rickettsioses. Rocky Mountain spotted fever (RMSF) caused
by Rickettsia rickettsii, is the most common and well-known spotted fever.§ Contains data reported through the National Electronic Disease Surveillance System (NEDSS).

Morbidity and Mortality Weekly Report
MMWR / September 30, 2011 / Vol. 60 / No. 38 1333
TABLE II. (Continued) Provisional cases of selected notifiable diseases, United States, weeks ending September 24, 2011, and September 25, 2010 (38th week)*
Streptococcus pneumoniae,† invasive disease
Reporting area
All ages Age <5 Syphilis, primary and secondary
Current week
Previous 52 weeks Cum 2011
Cum 2010
Current week
Previous 52 weeks Cum 2011
Cum 2010
Current week
Previous 52 weeks Cum 2011
Cum 2010Med Max Med Max Med Max
United States 115 298 937 10,106 11,146 6 23 101 731 1,366 112 256 363 9,040 9,999New England 2 17 79 552 611 — 1 5 29 79 5 7 16 263 355
Connecticut — 6 49 235 246 — 0 3 6 22 — 1 8 39 71Maine§ 1 2 13 98 88 — 0 1 3 7 — 0 3 11 21Massachusetts — 0 3 21 53 — 0 3 8 37 3 4 10 160 222New Hampshire — 2 8 73 83 — 0 1 5 4 — 0 3 14 14Rhode Island§ — 2 8 73 80 — 0 1 2 5 — 0 7 32 25Vermont§ 1 1 6 52 61 — 0 2 5 4 2 0 2 7 2
Mid. Atlantic 4 33 81 1,007 1,142 — 3 27 84 168 15 30 50 1,077 1,252New Jersey — 13 35 472 509 — 1 4 28 41 — 4 13 144 180New York (Upstate) — 1 10 60 112 — 1 9 34 83 8 3 20 136 99New York City 4 13 42 475 521 — 0 14 22 44 1 15 30 543 704Pennsylvania N 0 0 N N N 0 0 N N 6 6 13 254 269
E.N. Central 11 67 113 2,184 2,258 — 4 10 119 205 10 30 48 1,099 1,456Illinois N 0 0 N N N 0 0 N N 10 13 22 449 693Indiana — 16 32 490 524 — 0 4 21 42 — 3 8 113 138Michigan 1 15 29 484 516 — 1 4 25 65 — 5 12 180 187Ohio 8 26 45 893 862 — 2 7 61 70 — 9 21 317 403Wisconsin 2 9 24 317 356 — 0 3 12 28 — 1 5 40 35
W.N. Central 1 4 35 128 598 — 0 5 9 86 — 6 17 211 256Iowa N 0 0 N N N 0 0 N N — 0 2 12 16Kansas N 0 0 N N N 0 0 N N — 0 3 19 17Minnesota — 0 24 — 450 — 0 5 — 70 — 3 10 87 98Missouri N 0 0 N N N 0 0 N N — 2 6 87 115Nebraska§ 1 2 9 85 98 — 0 2 8 14 — 0 2 5 6North Dakota — 0 25 43 50 — 0 1 1 2 — 0 1 1 —South Dakota N 0 0 N N N 0 0 N N — 0 0 — 4
S. Atlantic 48 72 170 2,828 3,030 3 7 22 210 378 39 64 178 2,350 2,289Delaware — 1 6 37 28 — 0 1 — — 1 0 4 16 4District of Columbia — 1 3 28 55 — 0 1 4 7 — 3 8 119 105Florida 25 23 68 1,020 1,115 1 3 13 91 151 2 23 36 813 828Georgia 11 22 54 756 974 1 2 7 54 118 4 13 130 472 492Maryland§ 7 10 32 407 385 1 1 4 28 43 2 9 19 329 226North Carolina N 0 0 N N N 0 0 N N 21 8 19 290 317South Carolina§ 5 8 25 339 383 — 0 3 20 43 3 4 10 154 101Virginia§ N 0 0 N N N 0 0 N N 6 4 16 155 210West Virginia — 1 48 241 90 — 0 6 13 16 — 0 2 2 6
E.S. Central 9 19 36 665 758 1 1 4 43 71 1 15 34 519 650Alabama§ N 0 0 N N N 0 0 N N — 4 11 138 185Kentucky N 0 0 N N N 0 0 N N — 2 16 79 97Mississippi N 0 0 N N N 0 0 N N 1 3 16 129 160Tennessee§ 9 19 36 665 758 1 1 4 43 71 — 5 11 173 208
W.S. Central 25 31 368 1,343 1,367 1 4 30 127 185 29 35 59 1,285 1,543Arkansas§ 3 3 26 165 128 — 0 3 13 14 5 4 10 149 158Louisiana — 3 11 119 82 — 0 2 10 20 2 7 24 274 413Oklahoma N 0 0 N N N 0 0 N N — 1 6 42 69Texas§ 22 25 333 1,059 1,157 1 3 27 104 151 22 23 33 820 903
Mountain 15 32 72 1,280 1,300 1 3 8 100 178 1 12 23 390 436Arizona 6 12 45 611 622 1 1 5 49 80 1 4 8 151 167Colorado 8 11 23 399 394 — 0 4 28 54 — 2 8 77 95Idaho§ N 0 0 N N N 0 0 N N — 0 4 11 2Montana§ N 0 0 N N N 0 0 N N — 0 1 4 3Nevada§ N 0 0 N N N 0 0 N N — 2 9 92 78New Mexico§ 1 3 13 177 119 — 0 2 11 15 — 1 4 47 37Utah — 2 8 74 154 — 0 3 12 26 — 0 4 8 54Wyoming§ — 0 15 19 11 — 0 1 — 3 — 0 0 — —
Pacific — 3 11 119 82 — 0 1 10 16 12 51 66 1,846 1,762Alaska — 3 11 115 82 — 0 1 8 16 — 0 1 1 3California N 0 0 N N N 0 0 N N 9 42 57 1,521 1,494Hawaii — 0 3 4 — — 0 1 2 — — 0 5 10 28Oregon N 0 0 N N N 0 0 N N 2 3 10 119 52Washington N 0 0 N N N 0 0 N N 1 5 13 195 185
TerritoriesAmerican Samoa N 0 0 N N N 0 0 N N — 0 0 — —C.N.M.I. — — — — — — — — — — — — — — —Guam — 0 0 — — — 0 0 — — — 0 0 — —Puerto Rico — 0 0 — — — 0 0 — — 7 4 13 166 171U.S. Virgin Islands — 0 0 — — — 0 0 — — — 0 0 — —
C.N.M.I.: Commonwealth of Northern Mariana Islands.U: Unavailable. —: No reported cases. N: Not reportable. NN: Not Nationally Notifiable. Cum: Cumulative year-to-date counts. Med: Median. Max: Maximum.* Case counts for reporting year 2010 and 2011 are provisional and subject to change. For further information on interpretation of these data, see http://www.cdc.gov/osels/ph_surveillance/
nndss/phs/files/ProvisionalNationa%20NotifiableDiseasesSurveillanceData20100927.pdf. Data for TB are displayed in Table IV, which appears quarterly.† Includes drug resistant and susceptible cases of invasive Streptococcus pneumoniae disease among children <5 years and among all ages. Case definition: Isolation of S. pneumoniae from
a normally sterile body site (e.g., blood or cerebrospinal fluid).§ Contains data reported through the National Electronic Disease Surveillance System (NEDSS).

Morbidity and Mortality Weekly Report
1334 MMWR / September 30, 2011 / Vol. 60 / No. 38
TABLE II. (Continued) Provisional cases of selected notifiable diseases, United States, weeks ending September 24, 2011, and September 25, 2010 (38th week)*
West Nile virus disease†
Reporting area
Varicella (chickenpox) Neuroinvasive Nonneuroinvasive§
Current week
Previous 52 weeks Cum 2011
Cum 2010
Current week
Previous 52 weeks Cum 2011
Cum 2010
Current week
Previous 52 weeks Cum 2011
Cum 2010Med Max Med Max Med Max
United States 130 274 367 8,808 11,247 1 1 48 244 557 — 0 18 118 371New England — 21 46 682 825 — 0 3 10 12 — 0 1 2 5
Connecticut — 4 16 169 257 — 0 2 7 7 — 0 1 1 4Maine¶ — 5 16 147 155 — 0 0 — — — 0 0 — —Massachusetts — 6 18 260 208 — 0 1 1 4 — 0 1 1 1New Hampshire — 0 9 9 102 — 0 0 — 1 — 0 0 — —Rhode Island¶ — 0 6 29 29 — 0 1 1 — — 0 0 — —Vermont¶ — 2 10 68 74 — 0 1 1 — — 0 0 — —
Mid. Atlantic 26 37 71 1,632 1,250 — 0 10 22 120 — 0 6 12 60New Jersey 12 14 62 968 436 — 0 1 1 14 — 0 1 3 13New York (Upstate) N 0 0 N N — 0 4 11 55 — 0 4 7 30New York City — 0 0 — — — 0 4 7 33 — 0 1 1 9Pennsylvania 14 19 41 664 814 — 0 2 3 18 — 0 1 1 8
E.N. Central 36 67 118 2,018 3,601 1 0 11 37 70 — 0 4 15 28Illinois 8 16 31 523 941 — 0 6 8 40 — 0 2 4 14Indiana¶ 5 4 18 176 281 — 0 2 4 4 — 0 1 3 7Michigan 3 20 38 639 1,050 1 0 5 18 23 — 0 1 — 4Ohio 20 21 58 679 941 — 0 2 7 3 — 0 3 8 1Wisconsin — 0 22 1 388 — 0 0 — — — 0 0 — 2
W.N. Central 3 8 42 249 666 — 0 6 20 29 — 0 3 17 73Iowa N 0 0 N N — 0 2 4 3 — 0 1 1 4Kansas¶ 3 2 15 81 273 — 0 1 — 3 — 0 2 — 13Minnesota — 0 0 — — — 0 1 — 4 — 0 0 — 4Missouri — 3 24 111 322 — 0 1 2 3 — 0 1 3 —Nebraska¶ — 0 5 3 11 — 0 4 12 10 — 0 3 10 29North Dakota — 0 10 31 33 — 0 1 1 2 — 0 1 3 7South Dakota — 1 7 23 27 — 0 1 1 4 — 0 0 — 16
S. Atlantic 17 36 64 1,275 1,657 — 0 7 32 30 — 0 3 11 21Delaware¶ — 0 3 6 26 — 0 1 1 — — 0 0 — —District of Columbia — 0 2 12 17 — 0 1 — 2 — 0 1 — 3Florida¶ 17 15 38 644 798 — 0 5 15 7 — 0 2 2 2Georgia N 0 0 N N — 0 1 2 4 — 0 1 2 9Maryland¶ N 0 0 N N — 0 2 6 14 — 0 2 7 6North Carolina N 0 0 N N — 0 1 2 — — 0 0 — —South Carolina¶ — 0 9 12 75 — 0 1 — — — 0 0 — —Virginia¶ — 8 25 305 401 — 0 2 5 3 — 0 0 — 1West Virginia — 7 32 296 340 — 0 1 1 — — 0 0 — —
E.S. Central — 5 15 192 232 — 0 6 31 7 — 0 3 18 8Alabama¶ — 4 14 180 225 — 0 1 1 1 — 0 0 — 2Kentucky N 0 0 N N — 0 0 — 2 — 0 0 — 1Mississippi — 0 3 12 7 — 0 4 23 2 — 0 3 17 3Tennessee¶ N 0 0 N N — 0 2 7 2 — 0 1 1 2
W.S. Central 33 43 258 1,836 2,126 — 0 7 10 92 — 0 1 6 18Arkansas¶ 4 4 17 173 153 — 0 0 — 6 — 0 0 — 1Louisiana 1 1 6 59 59 — 0 2 4 17 — 0 1 3 6Oklahoma N 0 0 N N — 0 1 — — — 0 0 — —Texas¶ 28 39 247 1,604 1,914 — 0 5 6 69 — 0 1 3 11
Mountain 15 19 65 842 802 — 0 11 36 137 — 0 3 16 120Arizona 1 3 50 382 — — 0 7 21 88 — 0 2 9 55Colorado¶ 14 4 31 174 301 — 0 1 — 26 — 0 1 2 53Idaho¶ N 0 0 N N — 0 1 1 — — 0 0 — 1Montana¶ — 2 28 111 160 — 0 1 1 — — 0 0 — —Nevada¶ N 0 0 N N — 0 3 10 — — 0 1 3 2New Mexico¶ — 1 2 30 86 — 0 2 2 20 — 0 0 — 4Utah — 4 26 137 241 — 0 0 — 1 — 0 1 — 1Wyoming¶ — 0 3 8 14 — 0 1 1 2 — 0 1 2 4
Pacific — 2 6 82 88 — 0 12 46 60 — 0 6 21 38Alaska — 1 4 40 32 — 0 0 — — — 0 0 — —California — 0 3 8 29 — 0 12 46 60 — 0 6 21 37Hawaii — 1 4 34 27 — 0 0 — — — 0 0 — —Oregon N 0 0 N N — 0 0 — — — 0 0 — —Washington N 0 0 N N — 0 1 — — — 0 0 — 1
TerritoriesAmerican Samoa N 0 0 N N — 0 0 — — — 0 0 — —C.N.M.I. — — — — — — — — — — — — — — —Guam — 0 4 16 23 — 0 0 — — — 0 0 — —Puerto Rico 1 4 21 113 472 — 0 0 — — — 0 0 — —U.S. Virgin Islands — 0 0 — — — 0 0 — — — 0 0 — —
C.N.M.I.: Commonwealth of Northern Mariana Islands.U: Unavailable. —: No reported cases. N: Not reportable. NN: Not Nationally Notifiable. Cum: Cumulative year-to-date counts. Med: Median. Max: Maximum.* Case counts for reporting year 2010 and 2011 are provisional and subject to change. For further information on interpretation of these data, see http://www.cdc.gov/osels/ph_surveillance/
nndss/phs/files/ProvisionalNationa%20NotifiableDiseasesSurveillanceData20100927.pdf. Data for TB are displayed in Table IV, which appears quarterly.† Updated weekly from reports to the Division of Vector-Borne Infectious Diseases, National Center for Zoonotic, Vector-Borne, and Enteric Diseases (ArboNET Surveillance). Data for California
serogroup, eastern equine, Powassan, St. Louis, and western equine diseases are available in Table I.§ Not reportable in all states. Data from states where the condition is not reportable are excluded from this table, except starting in 2007 for the domestic arboviral diseases and influenza-
associated pediatric mortality, and in 2003 for SARS-CoV. Reporting exceptions are available at http://www.cdc.gov/osels/ph_surveillance/nndss/phs/infdis.htm. ¶ Contains data reported through the National Electronic Disease Surveillance System (NEDSS).

Morbidity and Mortality Weekly Report
MMWR / September 30, 2011 / Vol. 60 / No. 38 1335
TABLE III. Deaths in 122 U.S. cities,* week ending September 24, 2011 (38th week)
Reporting area
All causes, by age (years)
P&I† Total
Reporting area (Continued)
All causes, by age (years)
P&I† Total
All Ages ≥65 45–64 25–44 1–24 <1
All Ages ≥65 45–64 25–44 1–24 <1
New England 496 346 105 28 10 7 49 S. Atlantic 1,125 675 299 90 25 36 75Boston, MA 124 75 36 6 4 3 11 Atlanta, GA 163 99 47 7 4 6 9Bridgeport, CT 18 17 1 — — — 3 Baltimore, MD 141 70 52 13 6 — 15Cambridge, MA 17 15 — 1 1 — 2 Charlotte, NC 115 81 21 9 1 3 11Fall River, MA 24 18 4 2 — — 1 Jacksonville, FL 112 65 33 12 1 1 8Hartford, CT 41 26 12 3 — — 6 Miami, FL 94 58 22 9 5 — 4Lowell, MA 16 16 — — — — 2 Norfolk, VA 45 28 9 1 1 6 1Lynn, MA 6 5 1 — — — 1 Richmond, VA 41 23 12 6 — — 1New Bedford, MA 18 14 — 3 1 — — Savannah, GA 39 26 5 3 1 4 2New Haven, CT 34 21 7 5 — 1 2 St. Petersburg, FL 57 34 14 6 1 2 3Providence, RI 77 57 17 2 1 — 5 Tampa, FL 202 131 48 11 3 9 13Somerville, MA 3 2 1 — — — — Washington, D.C. 97 44 33 13 2 5 7Springfield, MA 31 21 5 1 1 3 2 Wilmington, DE 19 16 3 — — — 1Waterbury, CT 36 26 8 2 — — 5 E.S. Central 931 572 247 75 19 18 72Worcester, MA 51 33 13 3 2 — 9 Birmingham, AL 172 96 52 14 4 6 13
Mid. Atlantic 1,663 1,146 367 99 22 28 86 Chattanooga, TN 101 62 31 4 3 1 8Albany, NY 47 35 7 2 — 3 4 Knoxville, TN 91 63 22 3 1 2 6Allentown, PA 25 19 4 2 — — 1 Lexington, KY 48 34 6 5 1 2 2Buffalo, NY 89 67 18 — 2 2 7 Memphis, TN 146 95 39 7 4 1 18Camden, NJ 24 12 8 2 — 2 2 Mobile, AL 190 104 51 26 6 3 10Elizabeth, NJ 17 9 5 3 — — 5 Montgomery, AL 33 22 8 2 — 1 5Erie, PA 35 26 9 — — — 2 Nashville, TN 150 96 38 14 — 2 10Jersey City, NJ 13 7 4 2 — — — W.S. Central 1,078 684 283 58 36 17 45New York City, NY 934 670 192 50 10 11 42 Austin, TX 74 41 25 3 3 2 1Newark, NJ 21 8 10 1 1 1 1 Baton Rouge, LA 57 35 13 9 — — —Paterson, NJ 18 13 1 3 — 1 — Corpus Christi, TX 52 33 15 3 — 1 4Philadelphia, PA 135 68 43 17 5 2 4 Dallas, TX 187 109 53 9 10 6 11Pittsburgh, PA§ 33 21 6 5 1 — 2 El Paso, TX 105 80 22 — 1 2 5Reading, PA 29 21 4 3 — 1 3 Fort Worth, TX U U U U U U URochester, NY 69 38 24 5 — 2 2 Houston, TX 111 70 30 2 5 4 2Schenectady, NY 18 15 3 — — — 2 Little Rock, AR 75 46 20 5 4 — —Scranton, PA 33 29 4 — — — 3 New Orleans, LA U U U U U U USyracuse, NY 68 51 11 2 2 2 4 San Antonio, TX 253 156 70 18 7 2 10Trenton, NJ 22 12 7 1 1 1 — Shreveport, LA 27 16 7 3 1 — 1Utica, NY 9 6 3 — — — — Tulsa, OK 137 98 28 6 5 — 11Yonkers, NY 24 19 4 1 — — 2 Mountain 1,041 692 259 52 17 19 67
E.N. Central 1,950 1,319 450 108 35 38 117 Albuquerque, NM 106 65 29 8 — 4 13Akron, OH 40 27 10 1 1 1 3 Boise, ID 59 46 8 2 1 2 4Canton, OH 33 23 10 — — — 4 Colorado Springs, CO 67 43 20 2 1 1 5Chicago, IL 248 165 62 13 5 3 14 Denver, CO 88 56 26 5 — 1 6Cincinnati, OH 89 53 19 9 1 7 5 Las Vegas, NV 260 175 59 16 7 3 15Cleveland, OH 216 144 56 10 1 5 15 Ogden, UT 42 32 9 — — 1 2Columbus, OH 218 143 53 14 4 4 14 Phoenix, AZ 149 89 44 8 5 3 9Dayton, OH 129 91 23 12 3 — 10 Pueblo, CO 25 18 6 1 — — —Detroit, MI 161 98 40 16 4 3 4 Salt Lake City, UT 113 76 29 5 — 3 6Evansville, IN 50 41 8 1 — — 5 Tucson, AZ 132 92 29 5 3 1 7Fort Wayne, IN 85 68 12 5 — — 3 Pacific 1,664 1,141 377 97 25 23 135Gary, IN 5 3 2 — — — — Berkeley, CA 8 6 2 — — — 1Grand Rapids, MI 58 42 11 1 2 2 3 Fresno, CA 127 85 31 7 2 2 12Indianapolis, IN 176 102 55 7 6 6 14 Glendale, CA 29 22 6 1 — — 6Lansing, MI 48 32 10 2 1 3 1 Honolulu, HI 66 47 13 4 1 1 7Milwaukee, WI 99 64 28 6 — 1 3 Long Beach, CA 56 34 17 3 1 1 5Peoria, IL 43 30 10 1 — 2 7 Los Angeles, CA 256 162 71 13 3 7 31Rockford, IL 53 41 9 2 1 — 2 Pasadena, CA 21 14 6 — 1 — 1South Bend, IN 57 45 9 1 1 1 1 Portland, OR 132 81 42 6 1 2 5Toledo, OH 79 53 16 7 3 — 7 Sacramento, CA 186 134 39 11 1 1 13Youngstown, OH 63 54 7 — 2 — 2 San Diego, CA 141 101 28 9 2 1 11
W.N. Central 507 326 118 36 19 8 35 San Francisco, CA 110 77 19 8 2 3 9Des Moines, IA — — — — — — — San Jose, CA 169 124 31 9 2 3 13Duluth, MN 30 25 4 — 1 — 2 Santa Cruz, CA 35 24 8 2 1 — 2Kansas City, KS 15 7 6 2 — — — Seattle, WA 137 92 32 9 3 1 7Kansas City, MO 95 55 23 12 4 1 6 Spokane, WA 55 40 8 5 1 1 4Lincoln, NE 47 38 5 2 2 — 3 Tacoma, WA 136 98 24 10 4 — 8Minneapolis, MN 74 41 18 7 6 2 3 Total¶ 10,455 6,901 2,505 643 208 194 681Omaha, NE 91 67 16 5 2 1 8St. Louis, MO 23 12 9 2 — — 2St. Paul, MN 58 37 16 3 — 2 7Wichita, KS 74 44 21 3 4 2 4
U: Unavailable. —: No reported cases.* Mortality data in this table are voluntarily reported from 122 cities in the United States, most of which have populations of >100,000. A death is reported by the place of its occurrence and
by the week that the death certificate was filed. Fetal deaths are not included.† Pneumonia and influenza.§ Because of changes in reporting methods in this Pennsylvania city, these numbers are partial counts for the current week. Complete counts will be available in 4 to 6 weeks.¶ Total includes unknown ages.

U.S. Government Printing Office: 2011-723-011/21074 Region IV ISSN: 0149-2195
The Morbidity and Mortality Weekly Report (MMWR) Series is prepared by the Centers for Disease Control and Prevention (CDC) and is available free of charge in electronic format. To receive an electronic copy each week, visit MMWR’s free subscription page at http://www.cdc.gov/mmwr/mmwrsubscribe.html. Paper copy subscriptions are available through the Superintendent of Documents, U.S. Government Printing Office, Washington, DC 20402; telephone 202-512-1800.
Data presented by the Notifiable Disease Data Team and 122 Cities Mortality Data Team in the weekly MMWR are provisional, based on weekly reports to CDC by state health departments. Address all inquiries about the MMWR Series, including material to be considered for publication, to Editor, MMWR Series, Mailstop E-90, CDC, 1600 Clifton Rd., N.E., Atlanta, GA 30333 or to [email protected].
All material in the MMWR Series is in the public domain and may be used and reprinted without permission; citation as to source, however, is appreciated.
Use of trade names and commercial sources is for identification only and does not imply endorsement by the U.S. Department of Health and Human Services.
References to non-CDC sites on the Internet are provided as a service to MMWR readers and do not constitute or imply endorsement of these organizations or their programs by CDC or the U.S. Department of Health and Human Services. CDC is not responsible for the content of these sites. URL addresses listed in MMWR were current as of the date of publication.
Morbidity and Mortality Weekly Report