Embed Size (px)
Citation preview

1
Clustering
Virginia de Sadesa at cogsci
2Visualizing High-Dimensional Data
In general we might want to reduce the dimensionality of our data for bettervisualization. (Note this is very useful for machine learning algorithms too andalso for efficient storage and transmission of information (gzip, jpg).)
We want to do this while preserving as much as the useful information as possible.(Of course how useful is determined is critical).
Clustering and PCA are different methods of dimensionality reduction that canaid visualization.
Here is a nice example to show you the benefit to clustering data. clustering codeand output

3PCA and Clustering
PCA represents a point using a fewer number of dimensions. The directions arethe directions of greatest variance in the data
Clustering represents a point using prototype points.

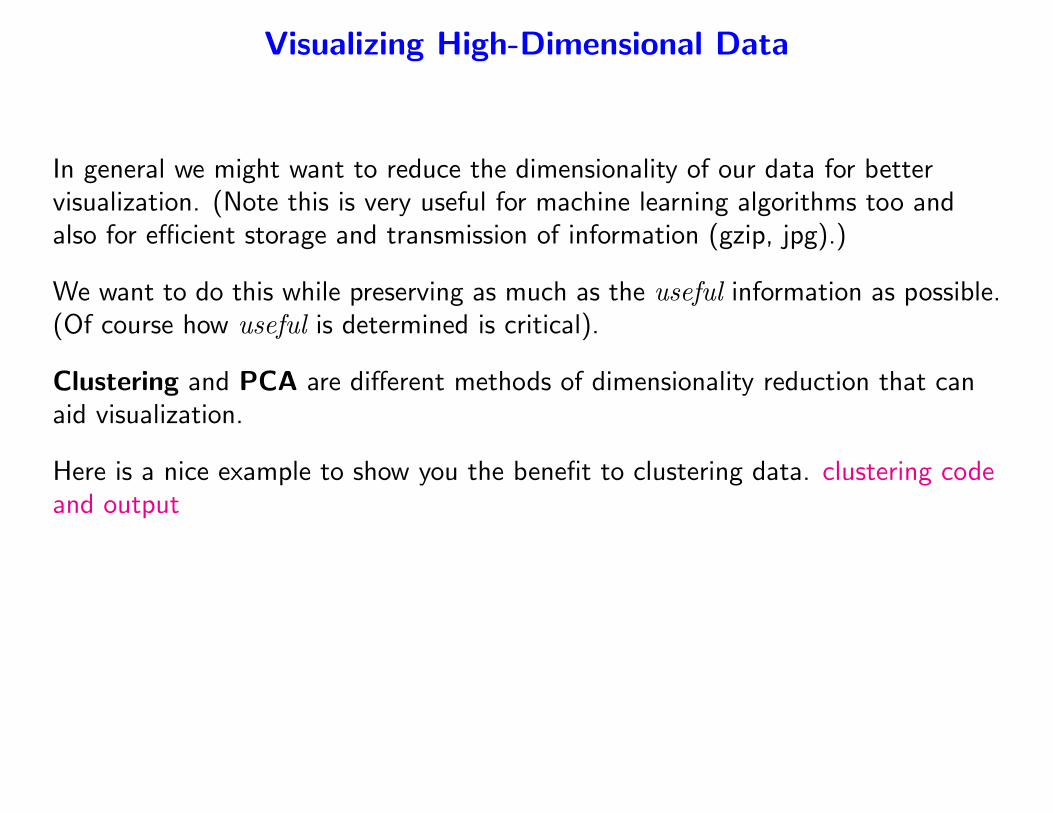
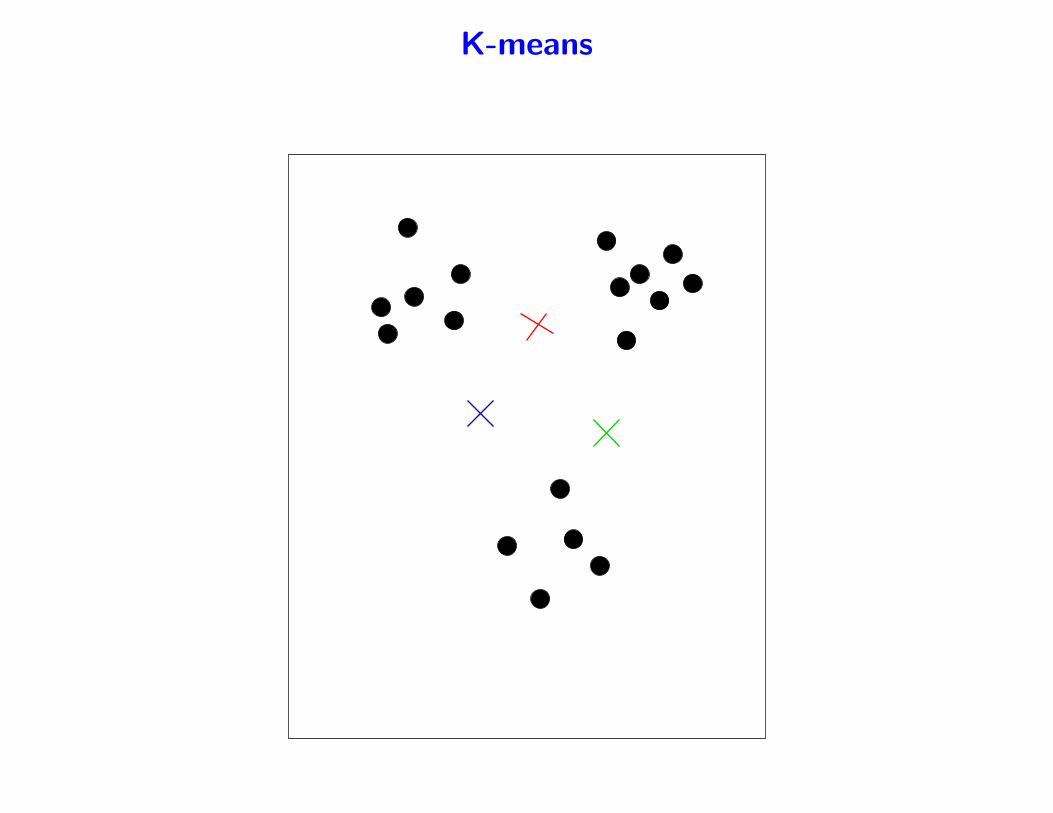
4K-means
a simple but effective clustering algorithm
partitions the data in to K disjoint sets (clusters)
iterative batch algorithm
• Start with initial guess of k centers
• S(j) is all points closest to µ(j)
• Update
µ(j) = 1/Nj
∑n∈S(j)
x(n)
• until no change in the means

5K-means
6K-means

7K-means

8K-means

9K-means

10K-means
11K-means

12K-means

13K-means

14K-means
a simple but effective clustering algorithm
partitions the data in to K disjoint sets (clusters)
iterative batch algorithm
• Start with initial guess of k centers
• S(j) is all points closest to µ(j)
• Update
µ(j) = 1/Nj
∑n∈S(j)
x(n)
• until no change in the means
15There are many more complex clustering schemes
• hierarchical clustering allows hierarchy of clusters
• mixture of Gaussians allows elongated clusters
• spectral clustering allows non-compact clusters
16Spectral clustering
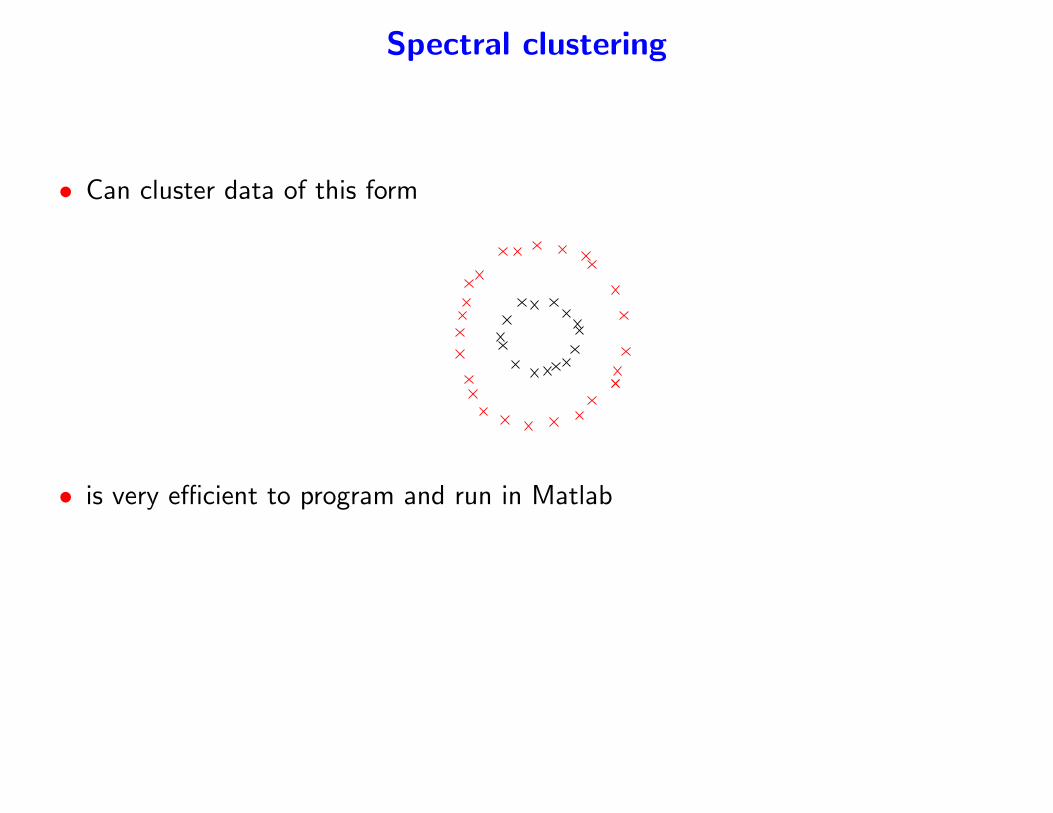
• Can cluster data of this form
• is very efficient to program and run in Matlab

17Image segmentation results (Fowlkes,Martin,Malik) usingspectral clustering
http://www.cs.berkeley.edu/ fowlkes/BSE/cvpr-segs/
(work by Fowlkes, Martin, Malik (UC Berkeley) – uses sophisticated learning ofpairwise similarities)

18PCA overview
PCA finds the linear subspace with the greatest projected variance.
It is commonly used for dimensionality reduction – project to a reduced subspacethat contains most of the variance.
Once the desired dimensionality subspace is found, the data are represented as theprojected point in that subspace.

19

20

21

22
Large V
ariance

23

24
Low V
ariance