Embed Size (px)
Citation preview
CLUSTERING OF X-RAY SELECTED AGN and possible dependence on obscuration
LAZAROS KOUTOULIDIS 1,2
IOANNIS GEORGANTOPOULOS1 ANTONIS GEORGAKAKIS4 ,MANOLIS PLIONIS 1,3 , E.ROVILOS1
1 National Observatory of Athens, Greece 2 University Of Patras, Physics Department, Greece 3 INAOE, Mexico 4 Max -Planck Institute for Astronomy, Garching, Germany
KOUTOULIDIS ET AL 2014 (in prep.)
WHY CLUSTERING ?
Large scale clustering measurements are an independent method to identify and constrain the physical processes that turn an inactive galaxy into an AGN and are responsible for AGN/galaxy evolution.
WHY AGN ?
AGNs are more luminous than galaxies. They allow the study of the matter distribution in the Universe out to higher redshifts. Furthermore their clustering properties can provide important contstraints both on:
structure formation theories, on the relation between AGN activity and DM halo hosts and on Cosmological Parameters.
The clustering of AGN has been studied with excellent number statistics mainly in the optical particularly in large area surveys such as 2QZ ( Croom 2005, Porciani & Norberg 2006) and the SDSS (Li 2006, Shen 2009, Ross 2009)
However optical QSO may represent only the tip of the iceberg
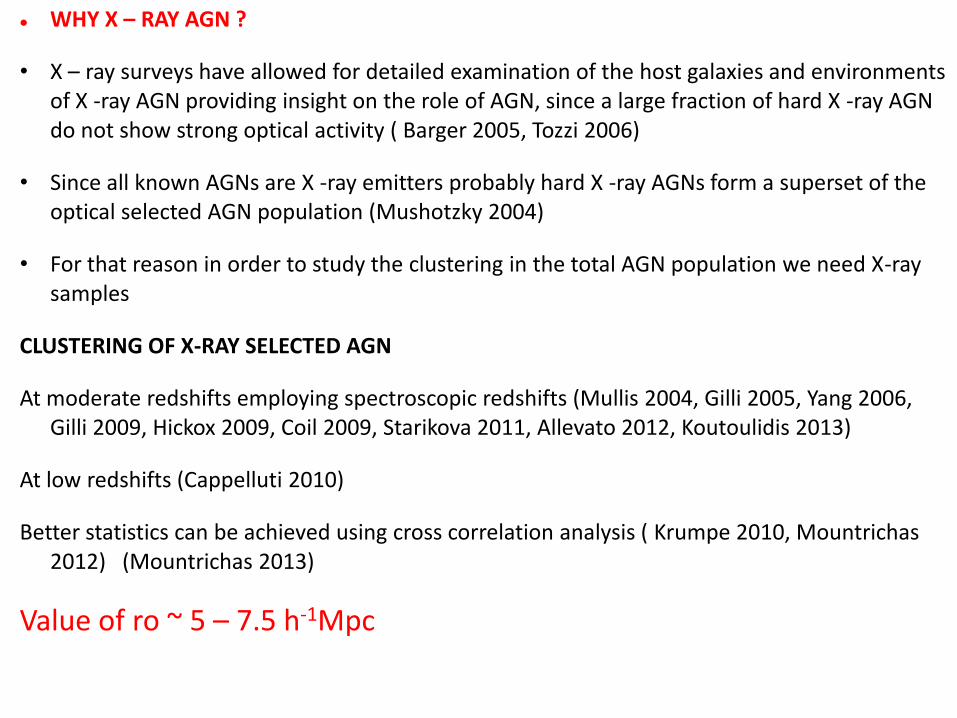
WHY X – RAY AGN ?
• X – ray surveys have allowed for detailed examination of the host galaxies and environments of X -ray AGN providing insight on the role of AGN, since a large fraction of hard X -ray AGN do not show strong optical activity ( Barger 2005, Tozzi 2006)
• Since all known AGNs are X -ray emitters probably hard X -ray AGNs form a superset of the optical selected AGN population (Mushotzky 2004)
• For that reason in order to study the clustering in the total AGN population we need X-ray samples
CLUSTERING OF X-RAY SELECTED AGN
At moderate redshifts employing spectroscopic redshifts (Mullis 2004, Gilli 2005, Yang 2006, Gilli 2009, Hickox 2009, Coil 2009, Starikova 2011, Allevato 2012, Koutoulidis 2013)
At low redshifts (Cappelluti 2010)
Better statistics can be achieved using cross correlation analysis ( Krumpe 2010, Mountrichas 2012) (Mountrichas 2013)
Value of ro ~ 5 – 7.5 h-1Mpc
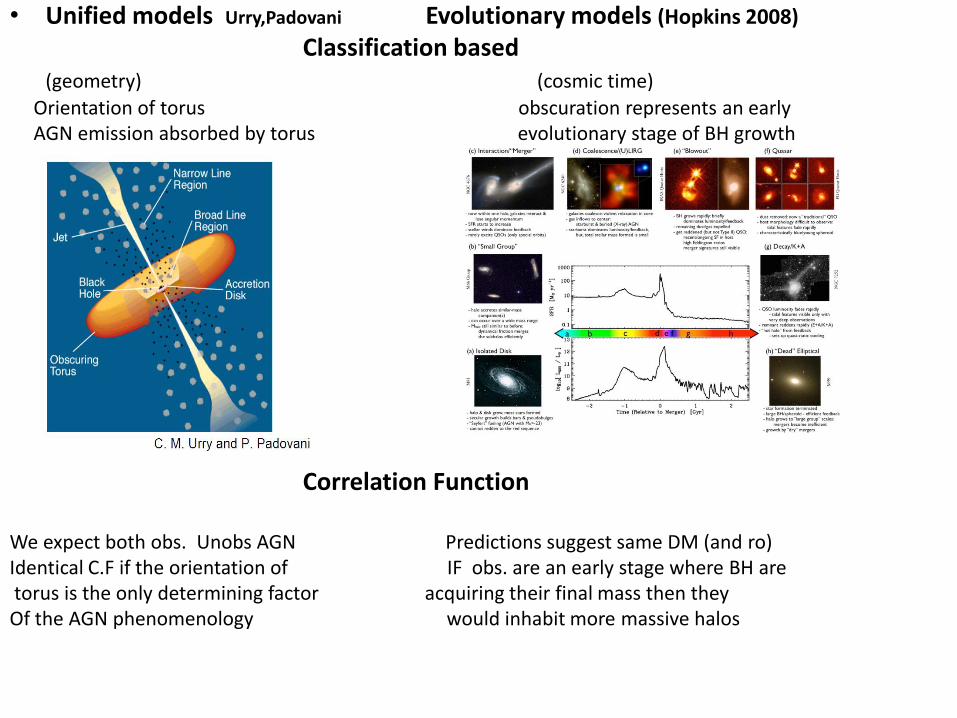
• Unified models Urry,Padovani Evolutionary models (Hopkins 2008)
Classification based (geometry) (cosmic time)
Orientation of torus obscuration represents an early AGN emission absorbed by torus evolutionary stage of BH growth
Correlation Function We expect both obs. Unobs AGN Predictions suggest same DM (and ro) Identical C.F if the orientation of IF obs. are an early stage where BH are torus is the only determining factor acquiring their final mass then they Of the AGN phenomenology would inhabit more massive halos
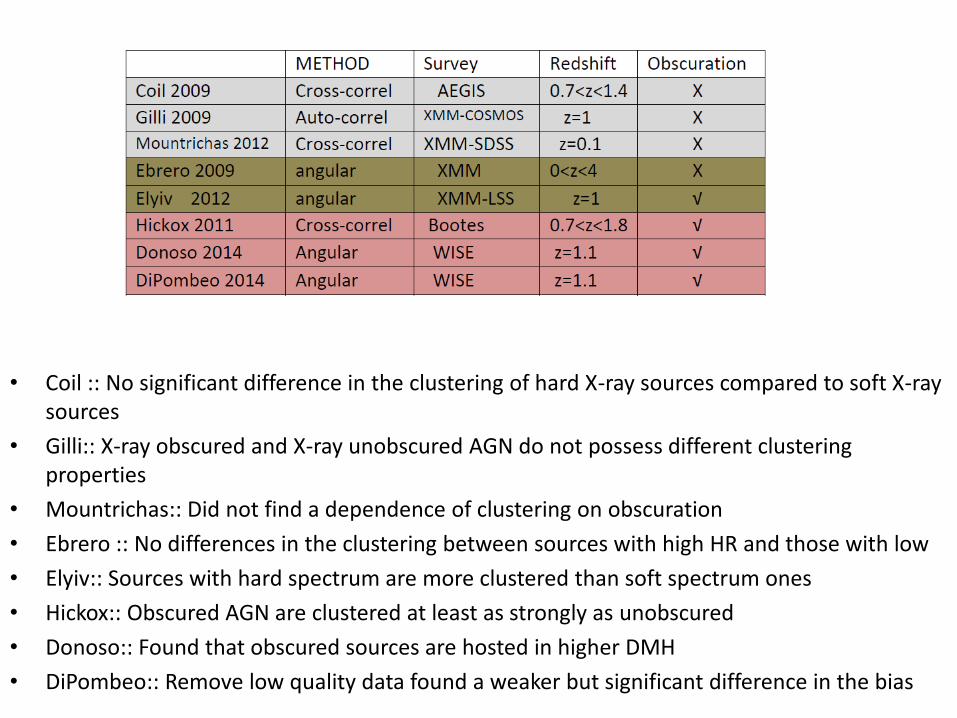
• Coil :: No significant difference in the clustering of hard X-ray sources compared to soft X-ray
sources
• Gilli:: X-ray obscured and X-ray unobscured AGN do not possess different clustering properties
• Mountrichas:: Did not find a dependence of clustering on obscuration
• Ebrero :: No differences in the clustering between sources with high HR and those with low
• Elyiv:: Sources with hard spectrum are more clustered than soft spectrum ones
• Hickox:: Obscured AGN are clustered at least as strongly as unobscured
• Donoso:: Found that obscured sources are hosted in higher DMH
• DiPombeo:: Remove low quality data found a weaker but significant difference in the bias
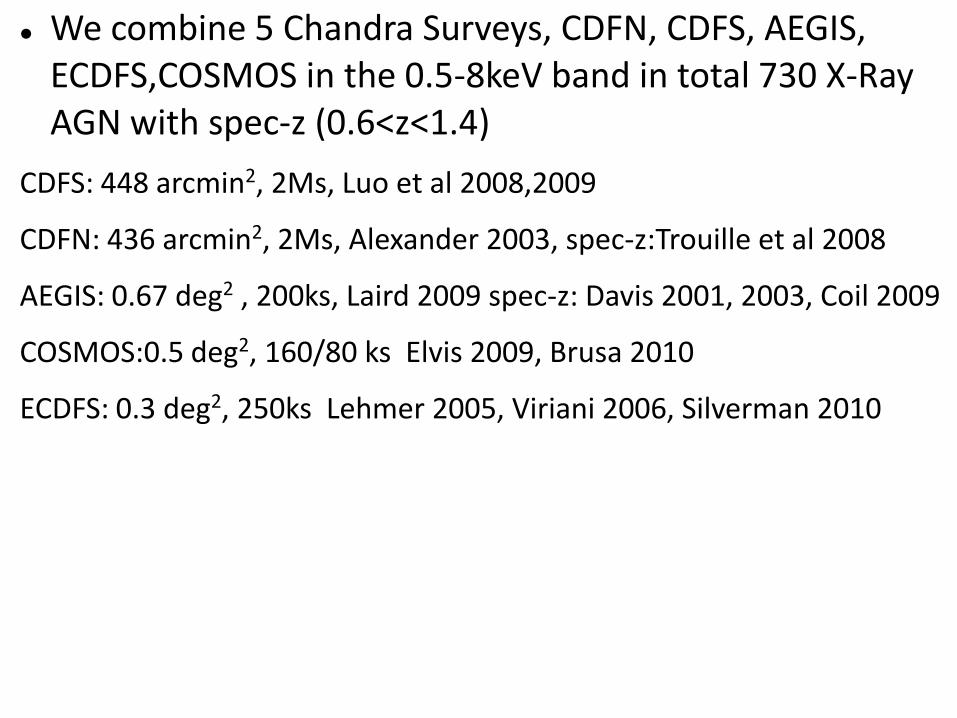
We combine 5 Chandra Surveys, CDFN, CDFS, AEGIS, ECDFS,COSMOS in the 0.5-8keV band in total 730 X-Ray AGN with spec-z (0.6<z<1.4)
CDFS: 448 arcmin2, 2Ms, Luo et al 2008,2009
CDFN: 436 arcmin2, 2Ms, Alexander 2003, spec-z:Trouille et al 2008
AEGIS: 0.67 deg2 , 200ks, Laird 2009 spec-z: Davis 2001, 2003, Coil 2009
COSMOS:0.5 deg2, 160/80 ks Elvis 2009, Brusa 2010
ECDFS: 0.3 deg2, 250ks Lehmer 2005, Viriani 2006, Silverman 2010
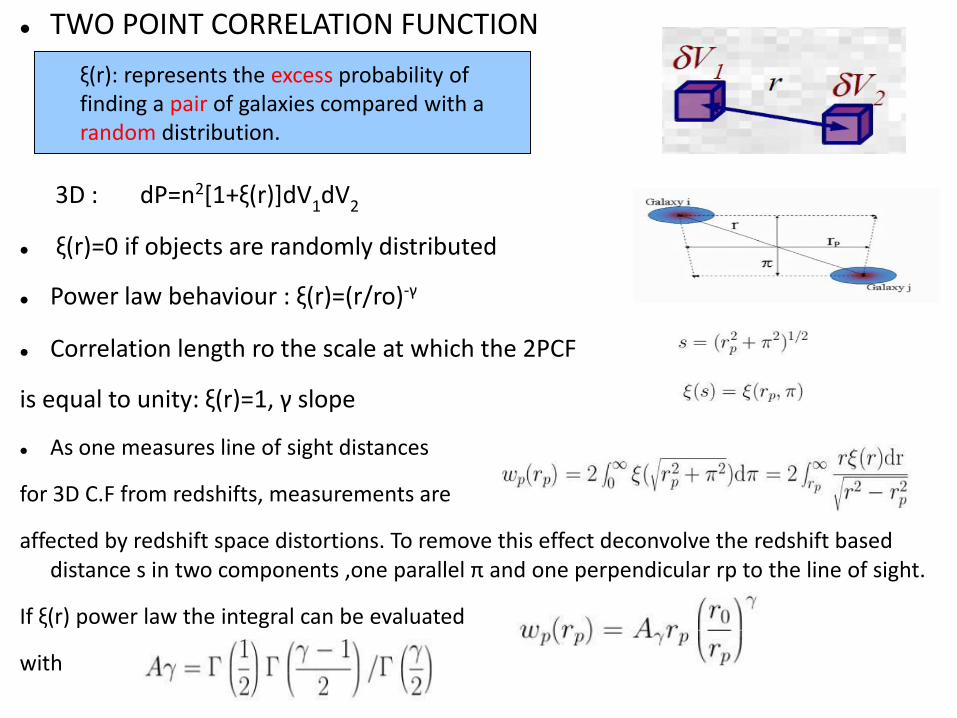
TWO POINT CORRELATION FUNCTION
3D : dP=n2[1+ξ(r)]dV1dV2
ξ(r)=0 if objects are randomly distributed
Power law behaviour : ξ(r)=(r/ro)-γ
Correlation length ro the scale at which the 2PCF
is equal to unity: ξ(r)=1, γ slope
As one measures line of sight distances
for 3D C.F from redshifts, measurements are
affected by redshift space distortions. To remove this effect deconvolve the redshift based distance s in two components ,one parallel π and one perpendicular rp to the line of sight.
If ξ(r) power law the integral can be evaluated
with
ξ(r): represents the excess probability of finding a pair of galaxies compared with a random distribution.
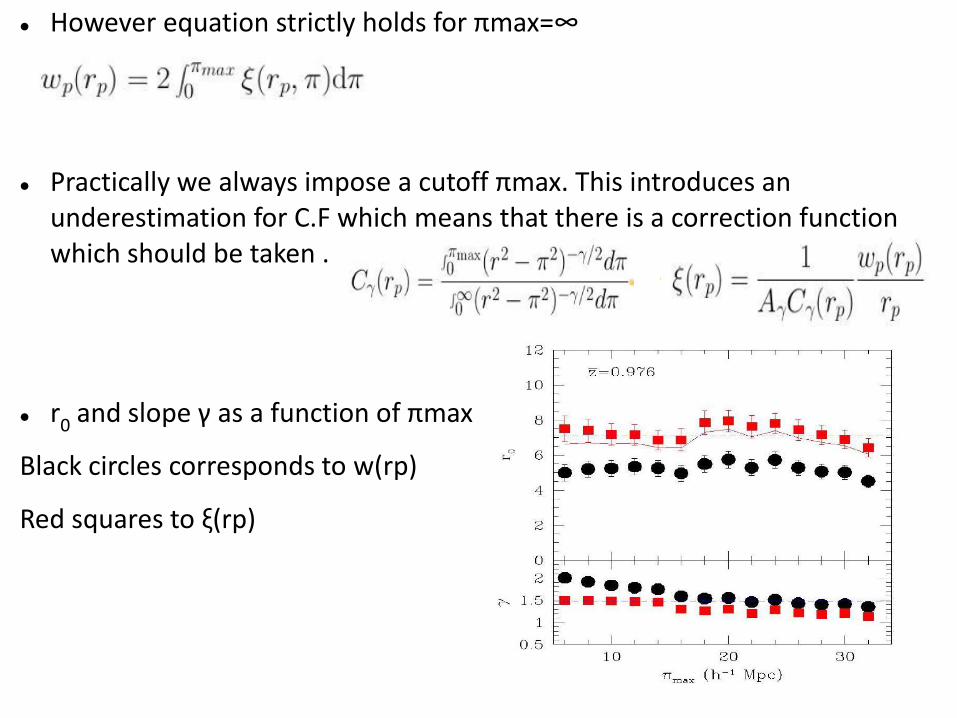
However equation strictly holds for πmax=∞
Practically we always impose a cutoff πmax. This introduces an underestimation for C.F which means that there is a correction function which should be taken .
r0 and slope γ as a function of πmax
Black circles corresponds to w(rp)
Red squares to ξ(rp)
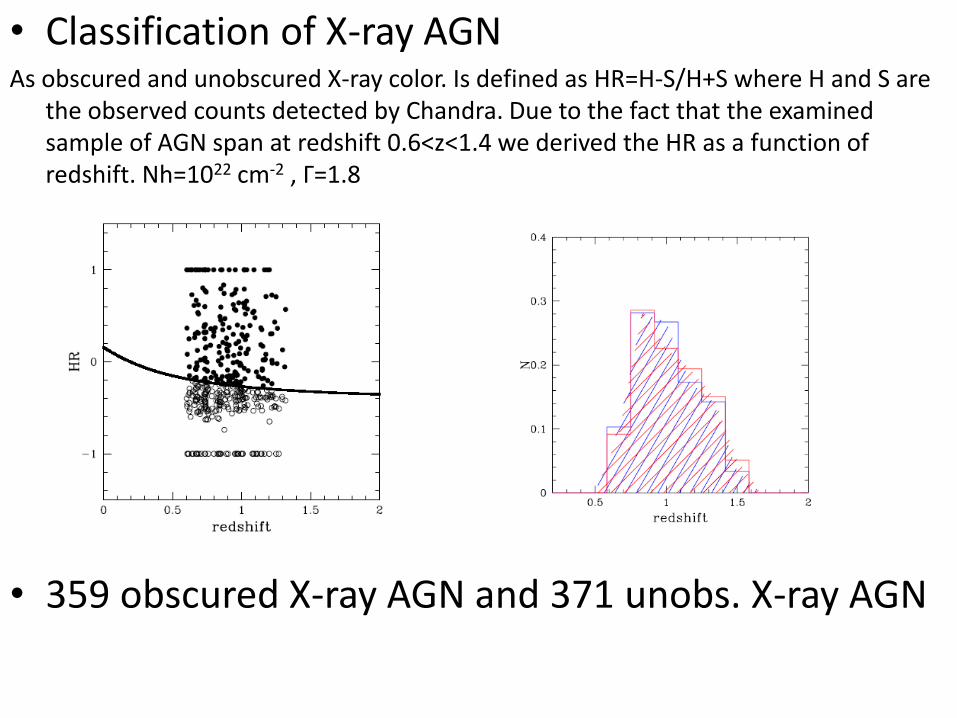
• Classification of X-ray AGN As obscured and unobscured X-ray color. Is defined as HR=H-S/H+S where H and S are
the observed counts detected by Chandra. Due to the fact that the examined sample of AGN span at redshift 0.6<z<1.4 we derived the HR as a function of redshift. Nh=1022 cm-2 , Γ=1.8
• 359 obscured X-ray AGN and 371 unobs. X-ray AGN
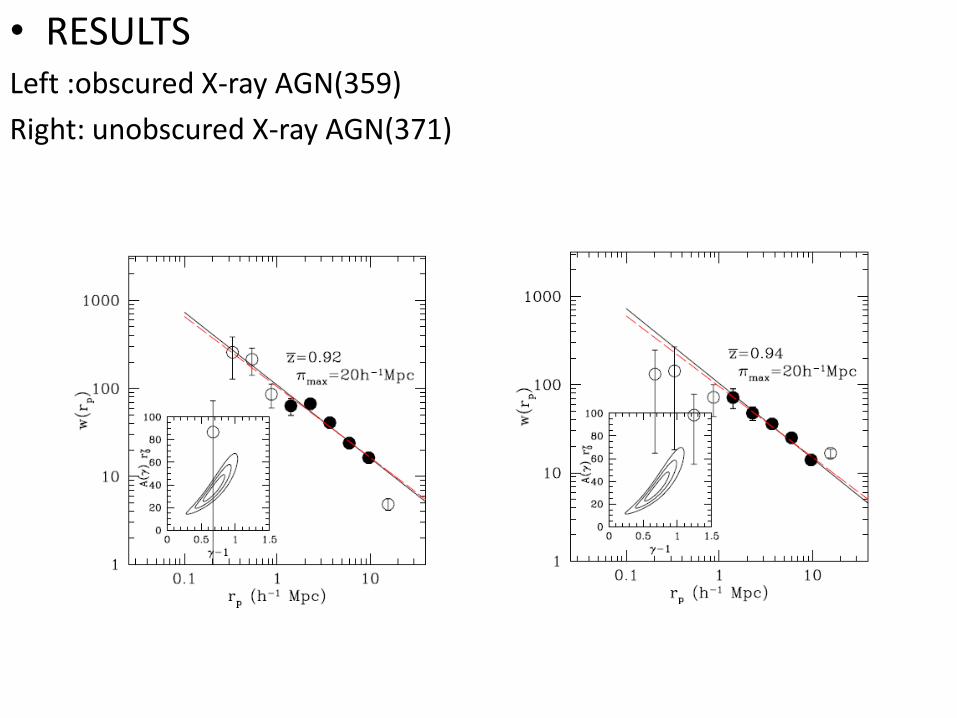
• RESULTS Left :obscured X-ray AGN(359)
Right: unobscured X-ray AGN(371)
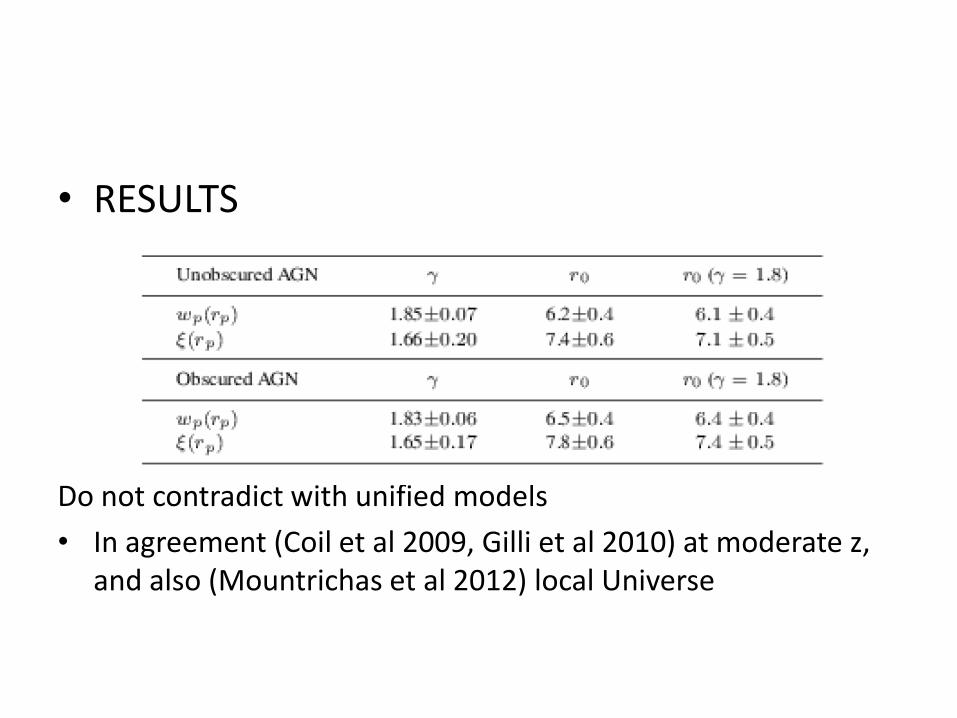
• RESULTS
Do not contradict with unified models
• In agreement (Coil et al 2009, Gilli et al 2010) at moderate z, and also (Mountrichas et al 2012) local Universe
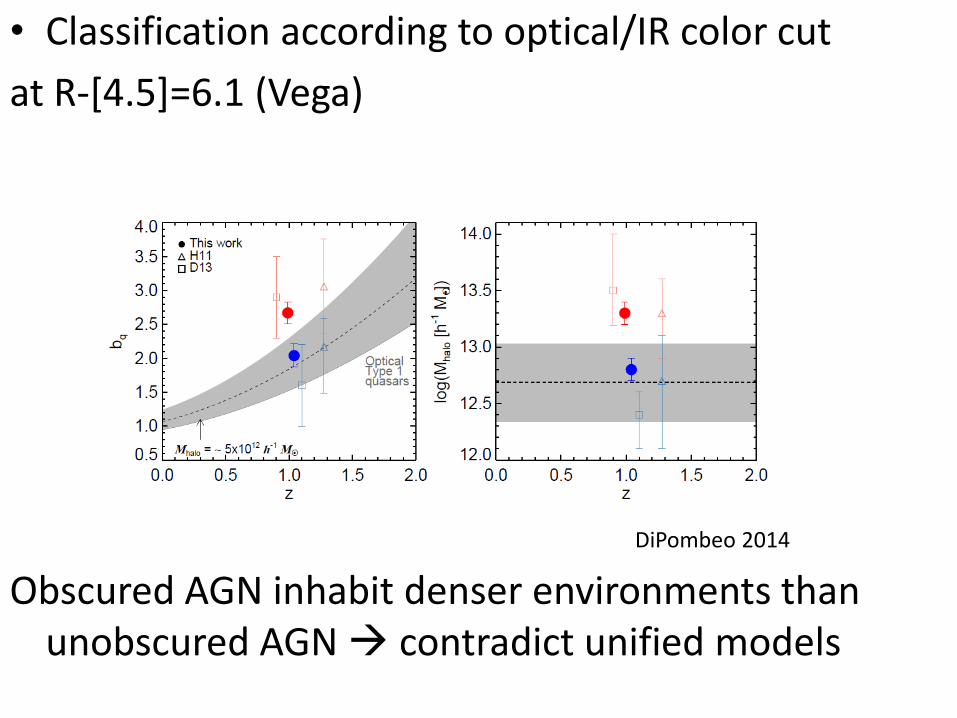
• Classification according to optical/IR color cut
at R-[4.5]=6.1 (Vega)
DiPombeo 2014
Obscured AGN inhabit denser environments than unobscured AGN contradict unified models
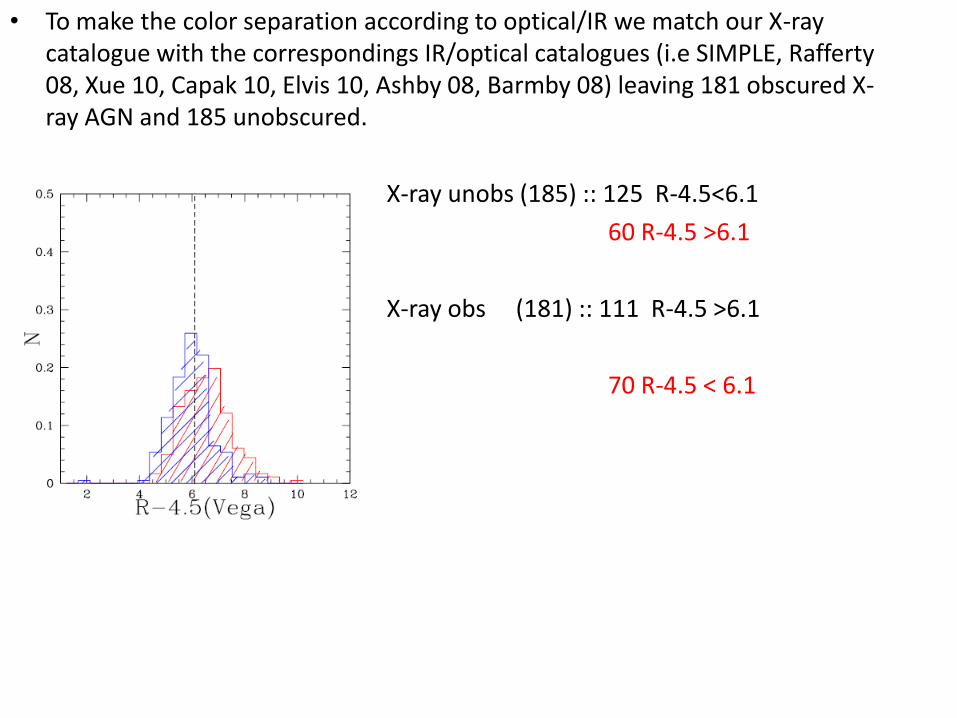
• To make the color separation according to optical/IR we match our X-ray catalogue with the correspondings IR/optical catalogues (i.e SIMPLE, Rafferty 08, Xue 10, Capak 10, Elvis 10, Ashby 08, Barmby 08) leaving 181 obscured X-ray AGN and 185 unobscured.
• X-ray unobs (185) :: 125 R-4.5<6.1
• 60 R-4.5 >6.1
• X-ray obs (181) :: 111 R-4.5 >6.1
• 70 R-4.5 < 6.1
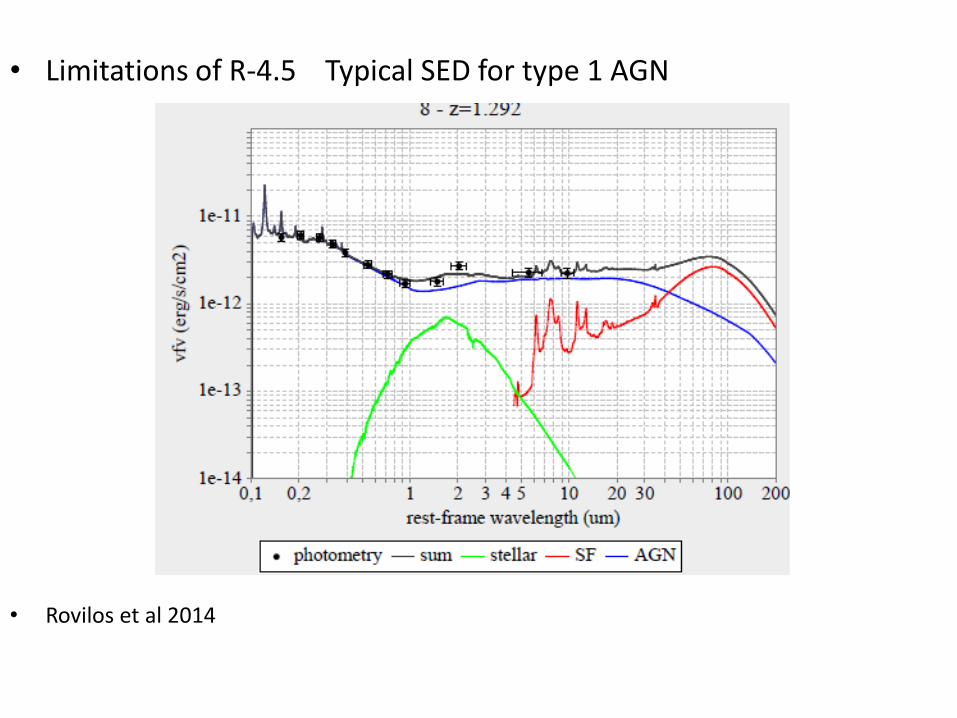
• Limitations of R-4.5 Typical SED for type 1 AGN
• Rovilos et al 2014
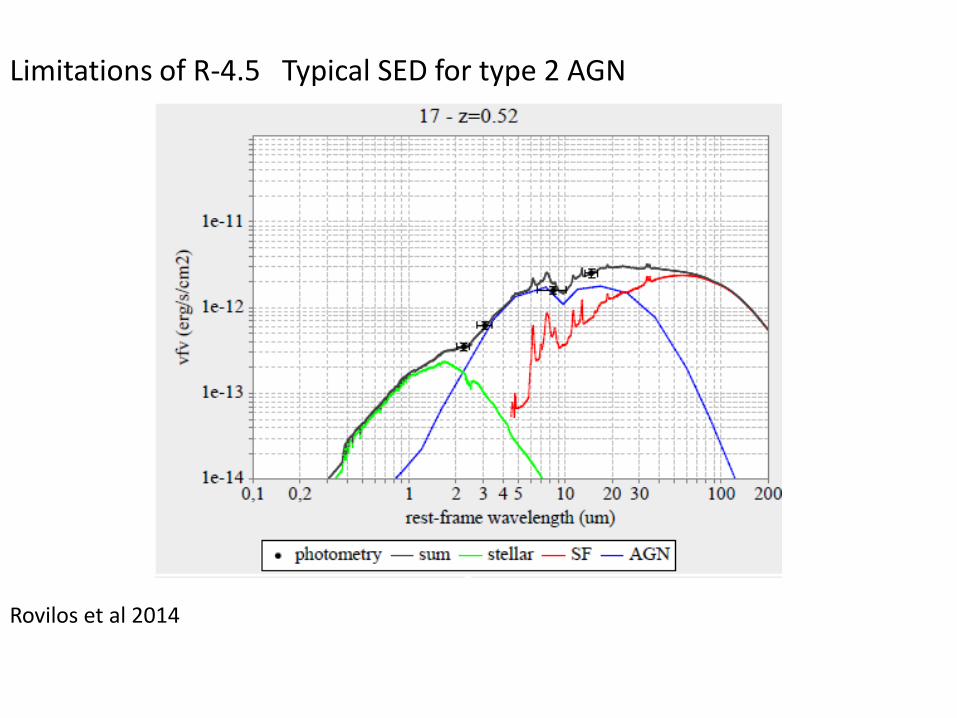
Limitations of R-4.5 Typical SED for type 2 AGN
Rovilos et al 2014
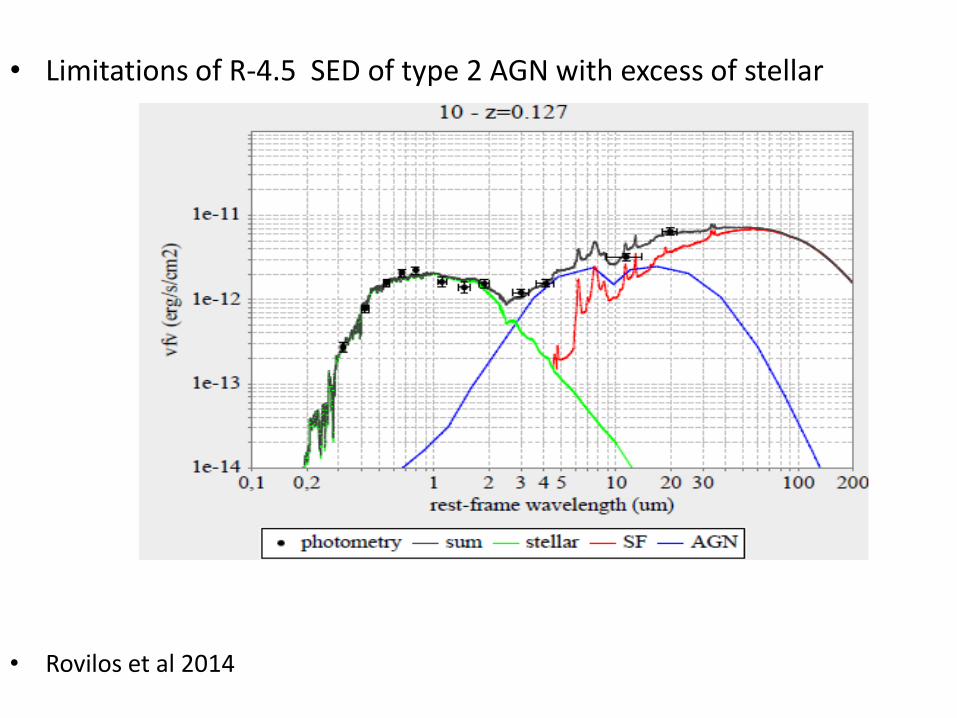
• Limitations of R-4.5 SED of type 2 AGN with excess of stellar
• Rovilos et al 2014
CONCLUSIONS
We have accurately determined the X-ray AGN spatial correlation function for 359 X-ray obscured AGN and 371 X-ray unobscured AGN using X-ray AGN with spec -redshift to provide for the usual power law model a clustering length of ro=7.2±0.6 , γ=1.8 for both populations.
The results do not contradict the unified models
Differences of HR color cut with optical/IR color cut for obscured and unobscured AGN
Possible explanation through the contamination of the host galaxy of AGN
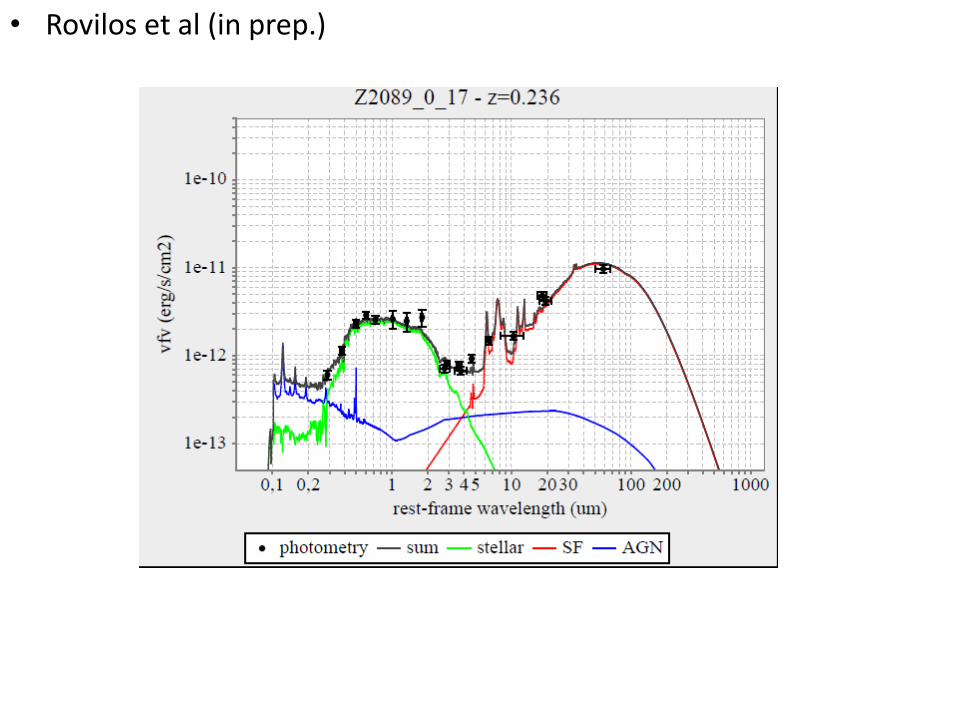
• Rovilos et al (in prep.)


![X-ray Emission From Accretion Disks of AGN: Signatures of ... · arXiv:0903.0978v1 [astro-ph.GA] 5 Mar 2009 X-ray Emission From Accretion Disks of AGN: Signatures of Supermassive](https://img.pdfslide.us/doc/110x75/6021efd9e2c9d557cd6da57f/x-ray-emission-from-accretion-disks-of-agn-signatures-of-arxiv09030978v1.jpg)