Embed Size (px)
Citation preview

Anil K. Jain (with Radha Chitta and Rong Jin)
Department of Computer Science
Michigan State University November 29, 2012
Clustering Big Data

Outline
• Big Data
• How to extract “information”?
• Data clustering
• Clustering Big Data
• Kernel K-means & approximation
• Summary

How Big is Big Data?
As of June 2012
• Big is a fast moving target: kilobytes, megabytes, gigabytes, terabytes (1012), petabytes (1015), exabytes (1018), zettabytes (1021),……
• Over 1.8 zb created in 2011; ~8 zb by 2015
Source: IDC’s Digital Universe study, sponsored by EMC, June 2011
http://idcdocserv.com/1142
http://www.emc.com/leadership/programs/digital-universe.htm
Data size
Exabytes
Nature of Big Data: Volume, Velocity and Variety

Big Data on the Web
http://techcrunch.com/2012/08/22/how-big-is-facebooks-data-2-5-billion-pieces-of-content-and-500-terabytes-ingested-every-day/ http://royal.pingdom.com/2012/01/17/internet-2011-in-numbers/ http://www.dataversity.net/the-growth-of-unstructured-data-what-are-we-going-to-do-with-all-those-zettabytes/
~900 million users, 2.5 billion content items, 105 terabytes of data each half hour, 300M photos and 4M videos posted per day
Over 225 million users generating over 800 tweets per second
Big Data on the Web
~4.5 million photos uploaded/day
Over 50 billion pages indexed and more than 2 million queries/min
48 hours of video uploaded/min; more than 1 trillion video views
Articles from over 10,000 sources in real time
No. of mobile phones will exceed the world’s population by the end of 2012
What to do with Big Data?
• Extract information to make decisions
• Evidence-based decision: data-driven vs. analysis based on intuition & experience
• Analytics, business intelligence, data mining, machine learning, pattern recognition
• Big Data computing: IBM is promoting Watson (Jeopardy champion) to tackle Big Data in healthcare, finance, drug design,..
Steve Lohr, “Amid the Flood, A Catchphrase is Born”, NY Times, August 12, 2012
Decision Making
• Data Representation • Features and similarity
• Learning • Classification (labeled data)
• Clustering (unlabeled data)
Most big data problems have unlabeled objects

Pattern Matrix
n x d pattern matrix
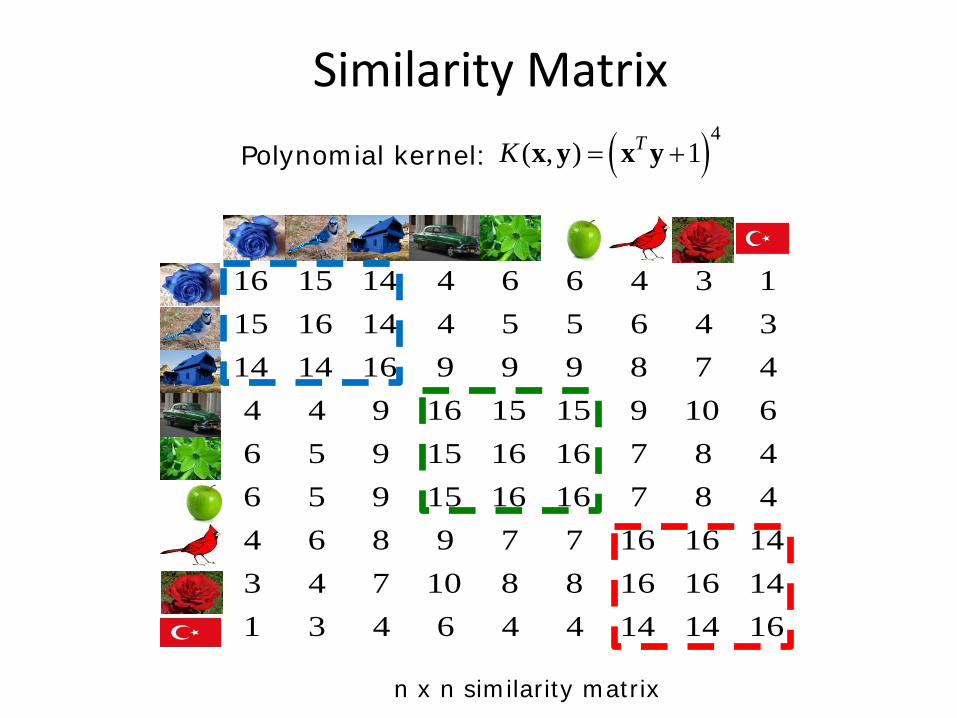
Similarity Matrix
n x n similarity matrix
( )4( , ) 1TK = +x y x y
16 15 14 4 6 6 4 3 115 16 14 4 5 5 6 4 314 14 16 9 9 9 8 7 44 4 9 16 15 15 9 10 66 5 9 15 16 16 7 8 46 5 9 15 16 16 7 8 44 6 8 9 7 7 16 16 143 4 7 10 8 8 16 16 141 3 4 6 4 4 14 14 16
Polynomial kernel:
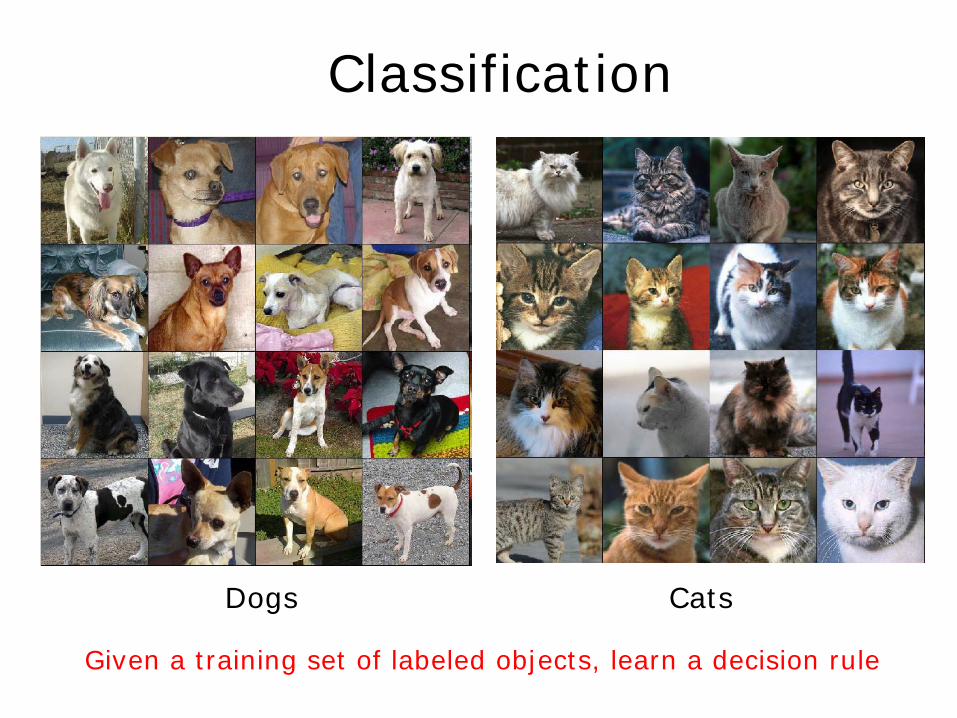
Classification
Cats Dogs
Given a training set of labeled objects, learn a decision rule

Clustering
Given a collection of (unlabeled) objects, find meaningful groups
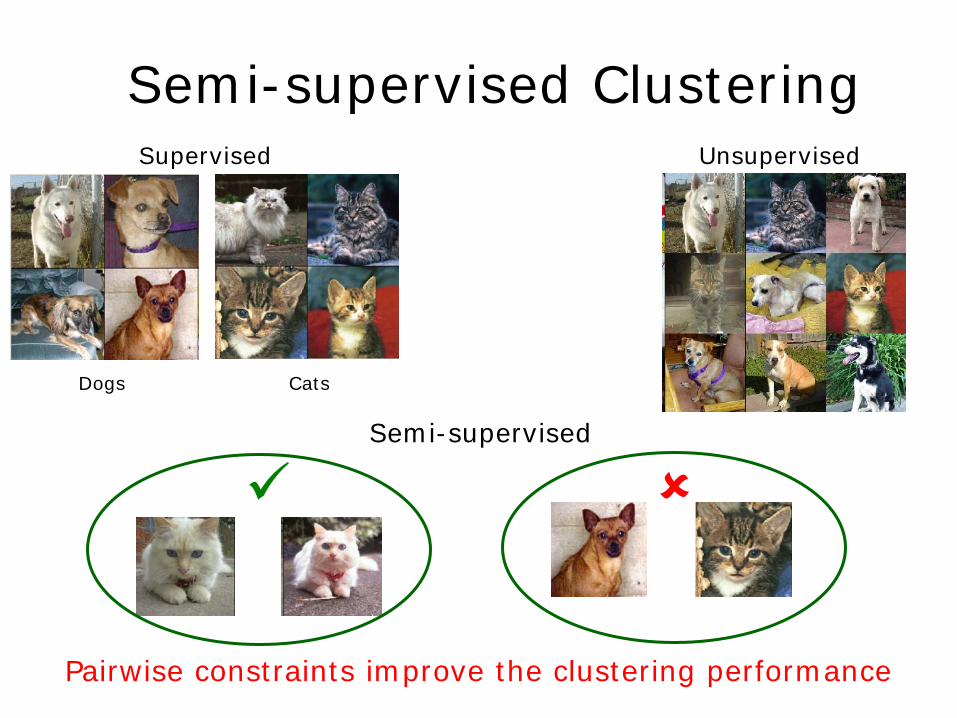
Semi-supervised Clustering
Cats
Supervised
Dogs
Unsupervised
Semi-supervised
Pairwise constraints improve the clustering performance

What is a cluster?
Hongkeng Tulou cluster
Birdhouse clusters
Cluster lights
“A group of the same or similar elements gathered or occurring closely together”
Cluster munition
Cluster computing
Galaxy clusters
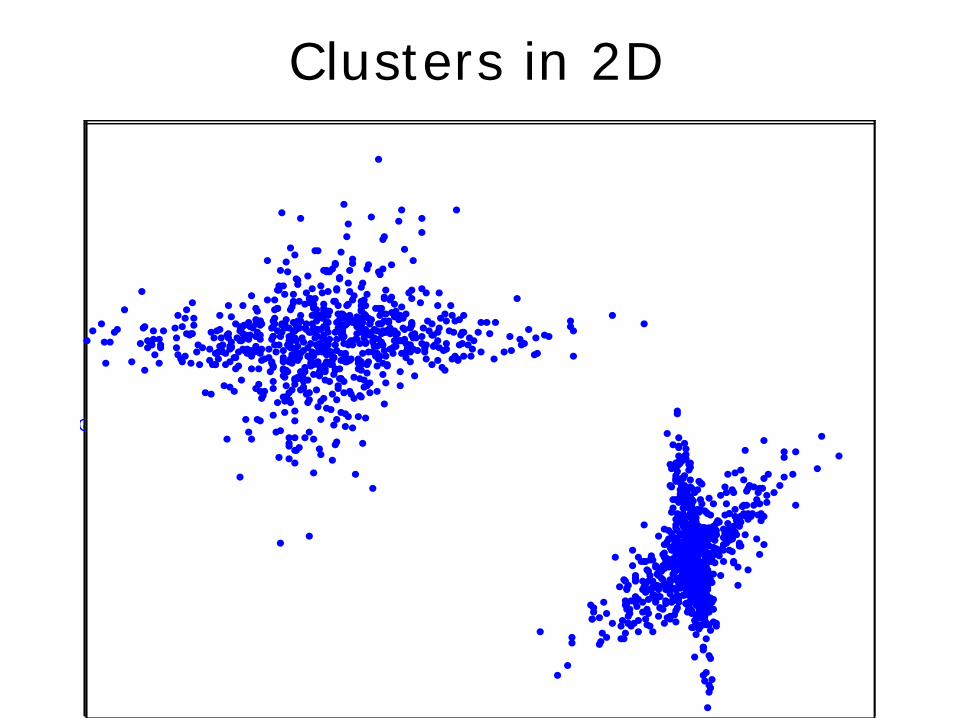
Clusters in 2D

Challenges in Data Clustering
• Measure of similarity • No. of clusters • Cluster validity • Outliers
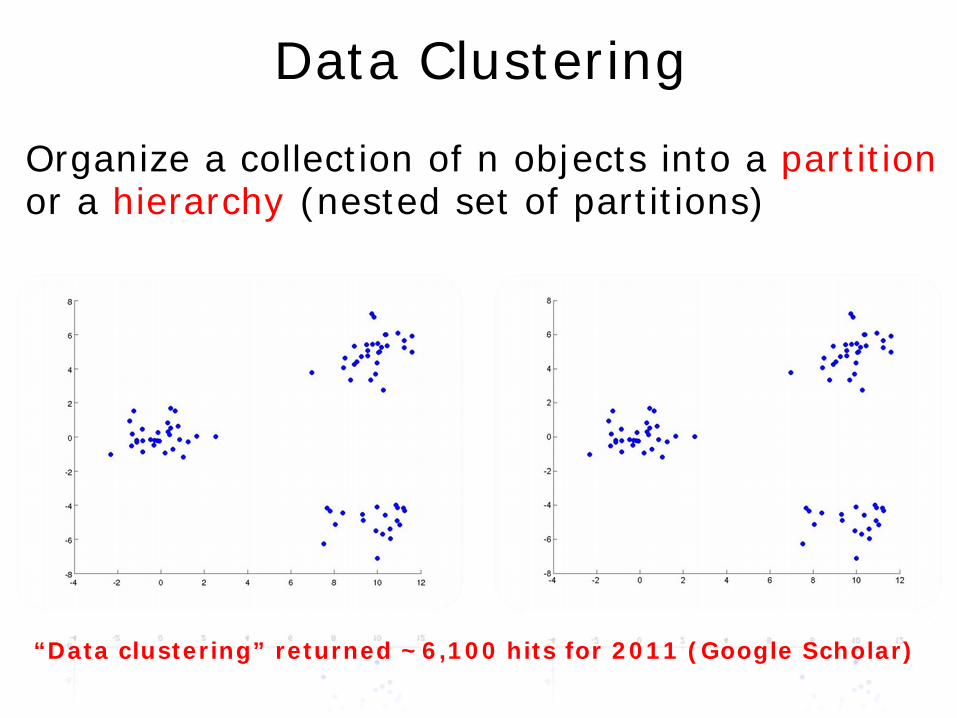
Organize a collection of n objects into a partition or a hierarchy (nested set of partitions)
Data Clustering
“Data clustering” returned ~6,100 hits for 2011 (Google Scholar)

• Not feasible to “label” large collection of objects
• No prior knowledge of the number and nature of groups (clusters) in data
• Clusters may evolve over time
• Clustering provides efficient browsing, search, recommendation and organization of data
Clustering is the Key to Big Data Problem

Clustering Users on Facebook
• ~300,000 status updates per minute on tens of thousands of topics
• Cluster users based on topic of status messages
http://www.insidefacebook.com/2011/08/08/posted-about-page/ http://searchengineland.com/by-the-numbers-twitter-vs-facebook-vs-google-buzz-36709

Clustering Articles on Google News
http://blogoscoped.com/archive/2006-07-28-n49.html
Topic cluster
Article Listings
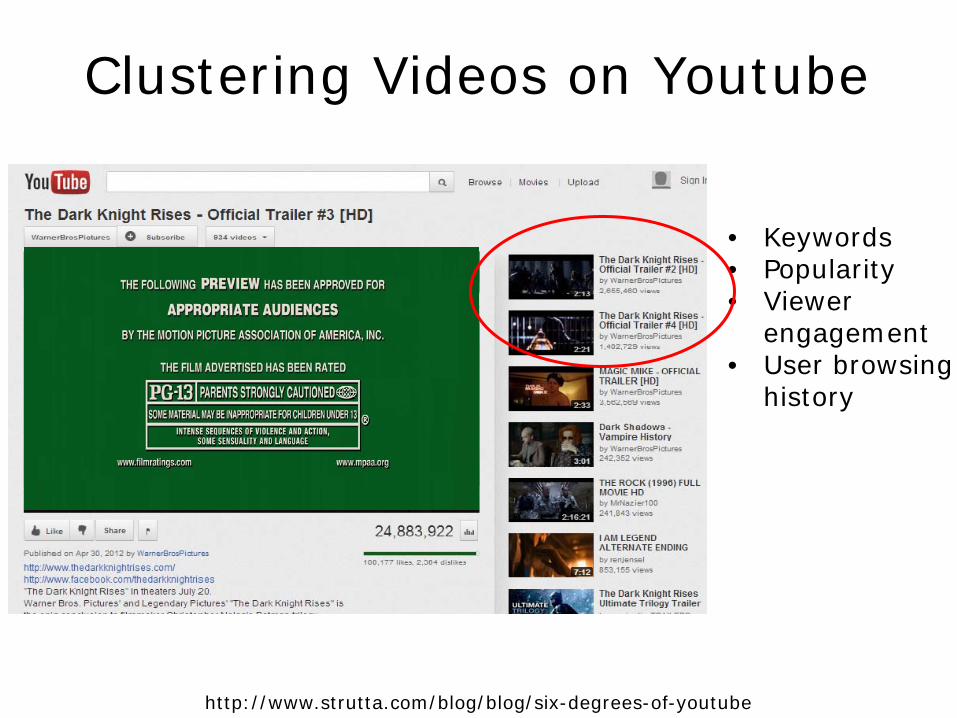
Clustering Videos on Youtube
http://www.strutta.com/blog/blog/six-degrees-of-youtube
• Keywords • Popularity • Viewer
engagement • User browsing
history
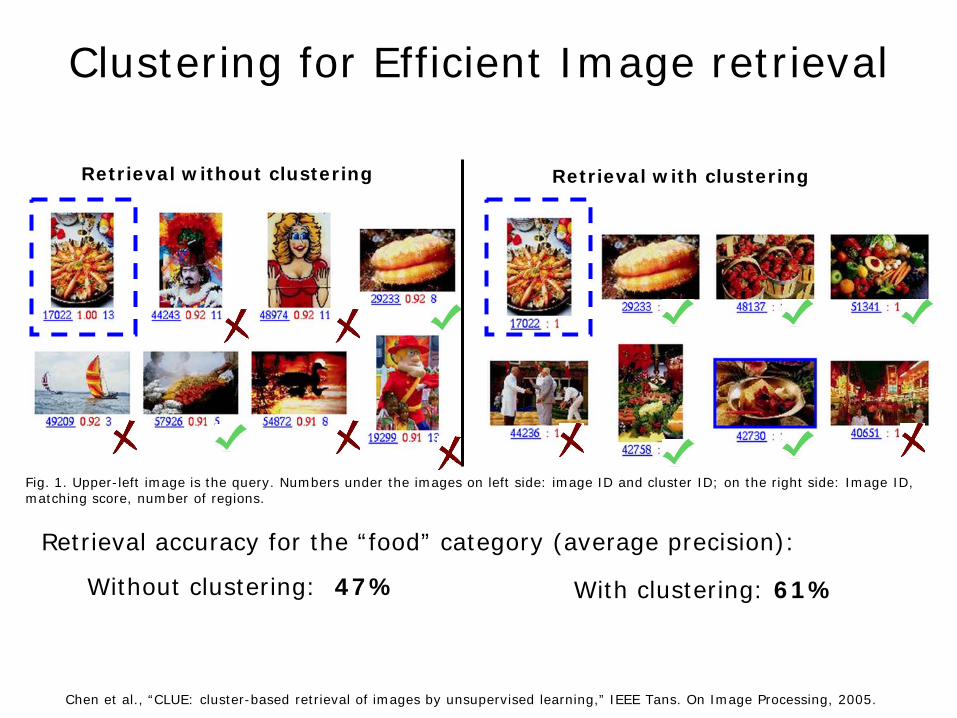
Clustering for Efficient Image retrieval
Chen et al., “CLUE: cluster-based retrieval of images by unsupervised learning,” IEEE Tans. On Image Processing, 2005.
Retrieval accuracy for the “food” category (average precision):
With clustering: 61% Without clustering: 47%
Fig. 1. Upper-left image is the query. Numbers under the images on left side: image ID and cluster ID; on the right side: Image ID, matching score, number of regions.
Retrieval with clustering Retrieval without clustering
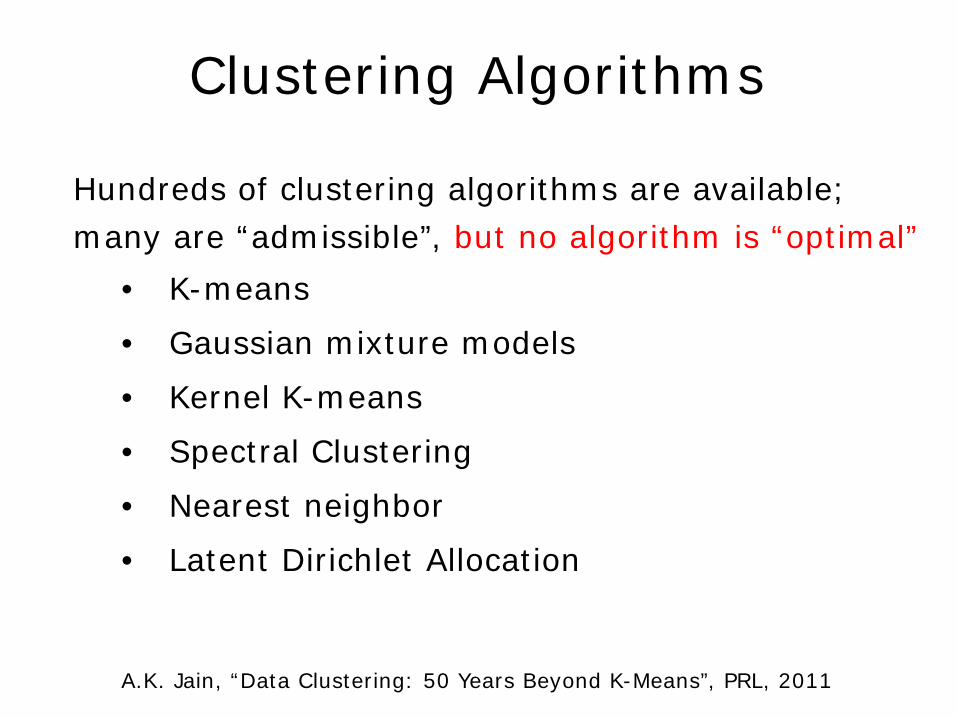
Clustering Algorithms
Hundreds of clustering algorithms are available; many are “admissible”, but no algorithm is “optimal”
• K-means
• Gaussian mixture models
• Kernel K-means
• Spectral Clustering
• Nearest neighbor
• Latent Dirichlet Allocation
A.K. Jain, “Data Clustering: 50 Years Beyond K-Means”, PRL, 2011
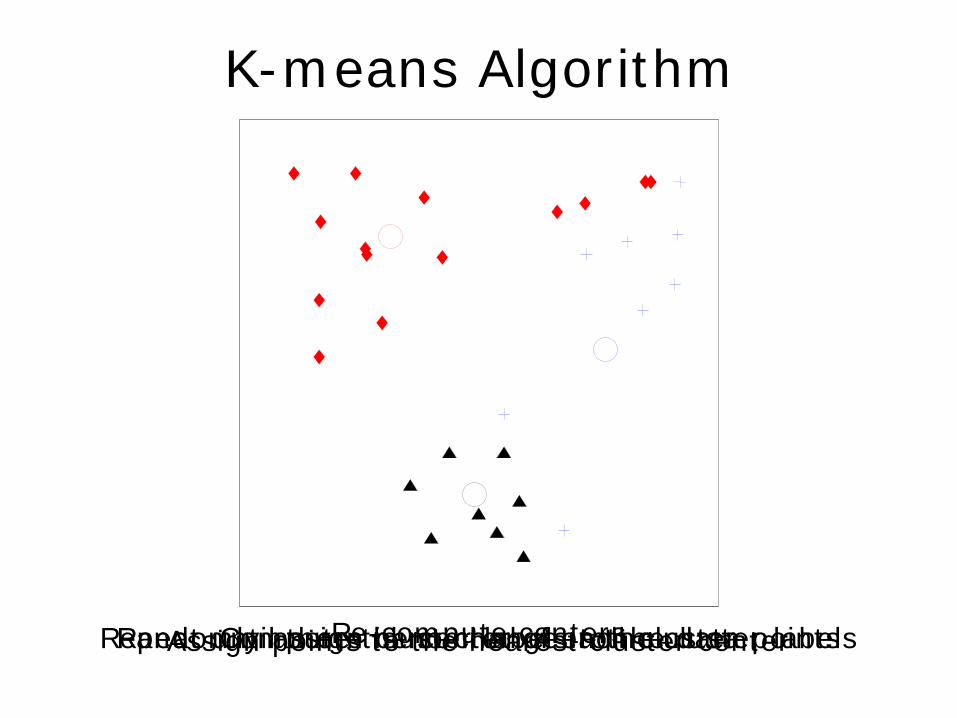
K-means Algorithm
Randomly assign cluster labels to the data points Compute the center of each cluster Assign points to the nearest cluster center Re-compute centers Repeat until there is no change in the cluster labels

K-means: Limitations
Prefers “compact” and “isolated” clusters

Gaussian Mixture Model
Figueiredo & Jain, “Unsupervised Learning of Finite Mixture Models”, PAMI, 2002
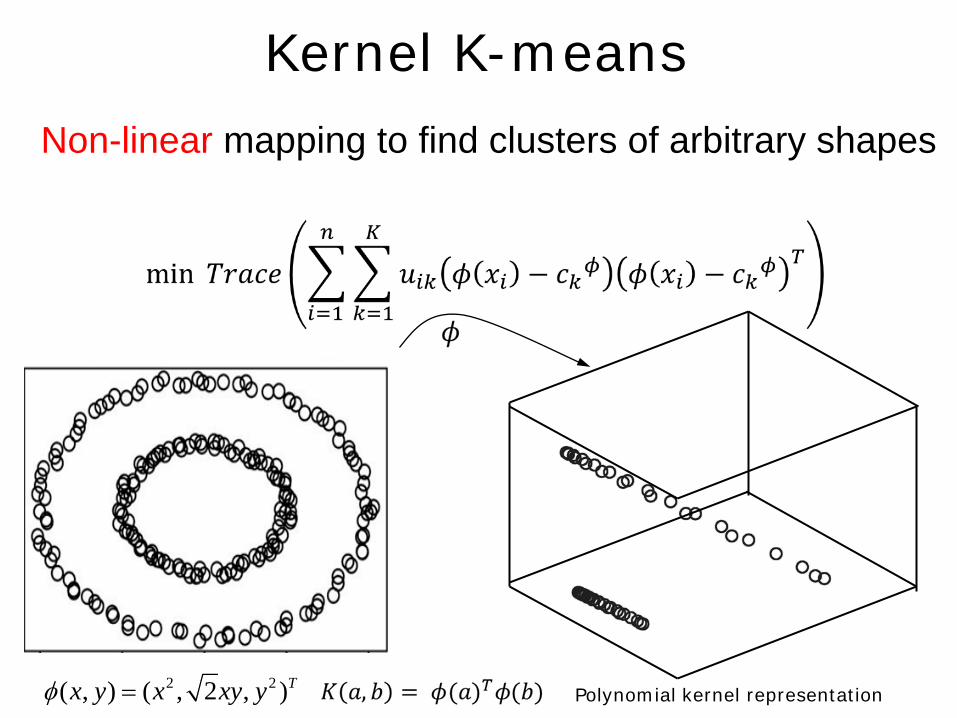
Kernel K-means
Non-linear mapping to find clusters of arbitrary shapes
Polynomial kernel representation 2 2( , ) ( , 2 , )Tx y x xy yφ =
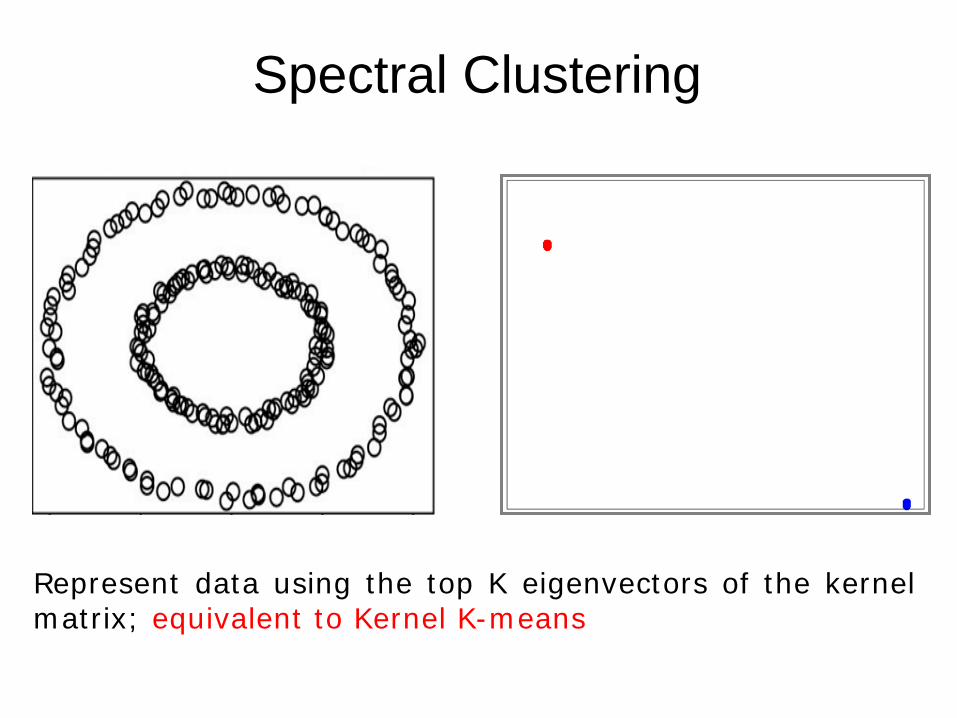
Spectral Clustering
Represent data using the top K eigenvectors of the kernel matrix; equivalent to Kernel K-means

K-means vs. Kernel K-means
Kernel clustering is able to find “complex” clusters
How to choose the right kernel? RBF kernel is the default
K-means Kernel K-means Data

Kernel K-means is Expensive
No. of Objects (n)
No. of operations
K-means Kernel K-means
O(nKd) O(n2K)
1M 1013 (6412*) 1016
10M 1014 1018
100M 1015 1020
1B 1016 1022
A petascale supercomputer (IBM Sequoia, June 2012) with ~1 exabyte memory is needed to run kernel K-means on 1 billion points!
d = 10,000; K=10
* Runtime in seconds on Intel Xeon 2.8 GHz processor using 40 GB memory
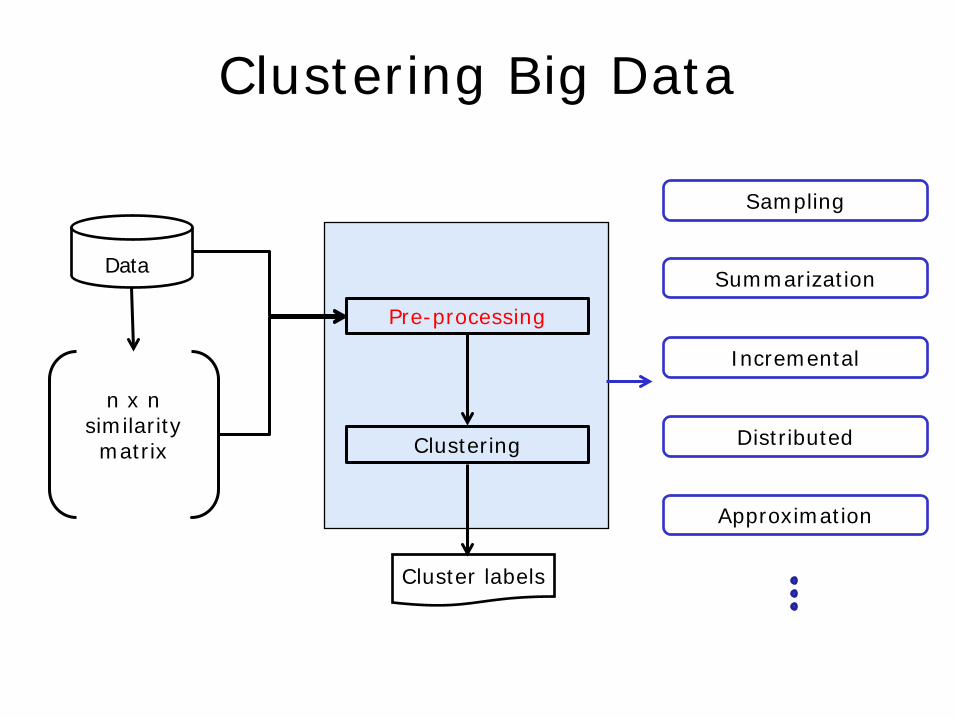
Clustering Big Data
Data
n x n similarity matrix
Pre-processing
Clustering
Sampling
Summarization
Incremental
Distributed
Approximation
Cluster labels

Distributed Clustering
Number of processors
Speedup
K-means Kernel
K-means
2 1.1 1.3 3 2.4 1.5 4 3.1 1.6 5 3.0 3.8 6 3.1 1.9 7 3.3 1.5 8 1.2 1.5
Network communication cost increases with the no. of processors
Clustering 100,000 2-D points with 2 clusters on 2.3 GHz quad-core
Intel Xeon processors, with 8GB memory in intel07 cluster
K-means
Kernel K-means

Approximate kernel K-means
Tradeoff between clustering accuracy and running time
Chitta, Jin, Havens & Jain, Approximate Kernel k-means: solution to Large Scale Kernel Clustering, KDD, 2011
Given n points in d-dimensional space Obtain the final cluster labels
Linear runtime and memory complexity
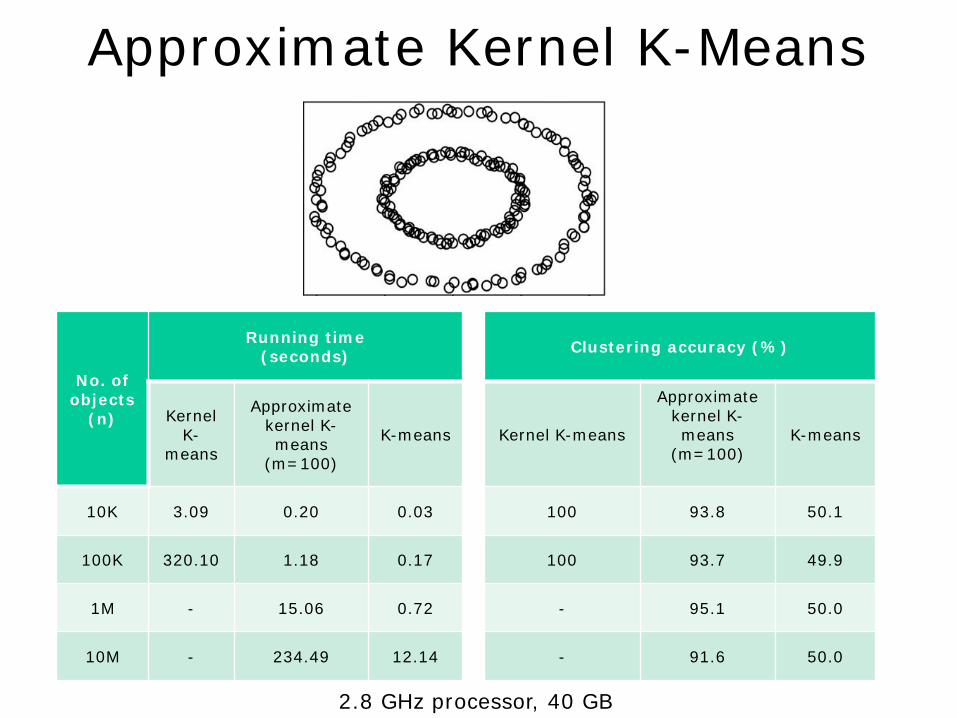
Approximate Kernel K-Means
2.8 GHz processor, 40 GB
No. of objects
(n)
Running time (seconds) Clustering accuracy (%)
Kernel K-
means
Approximate kernel K-means
(m=100)
K-means Kernel K-means
Approximate kernel K-means
(m=100)
K-means
10K 3.09 0.20 0.03 100 93.8 50.1
100K 320.10 1.18 0.17 100 93.7 49.9
1M - 15.06 0.72 - 95.1 50.0
10M - 234.49 12.14 - 91.6 50.0
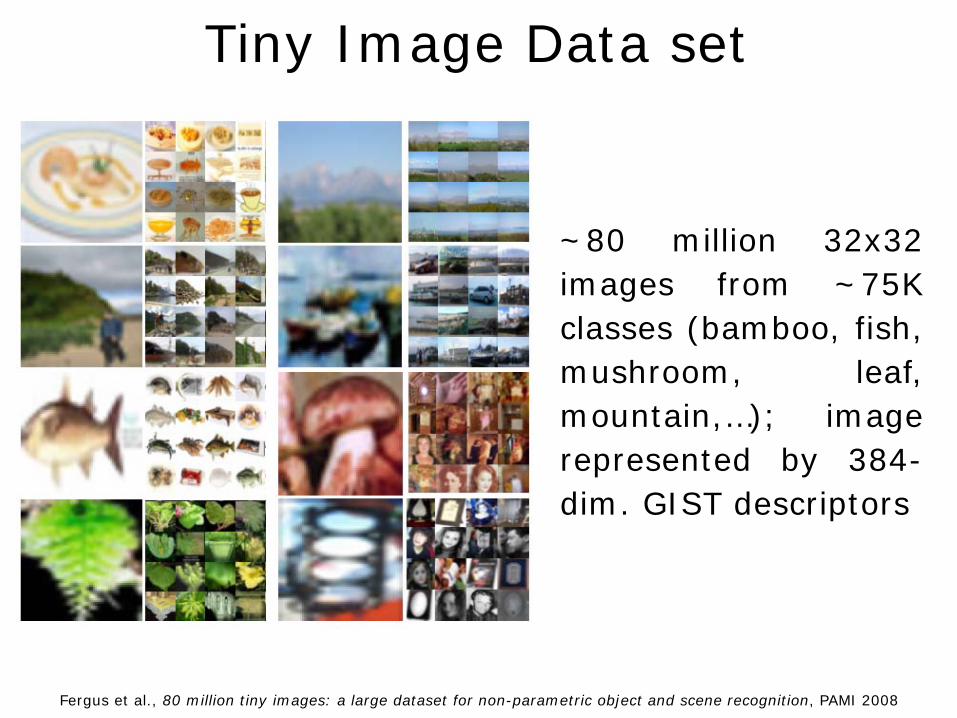
Tiny Image Data set
Fergus et al., 80 million tiny images: a large dataset for non-parametric object and scene recognition, PAMI 2008
~80 million 32x32 images from ~75K classes (bamboo, fish, mushroom, leaf, mountain,…); image represented by 384-dim. GIST descriptors
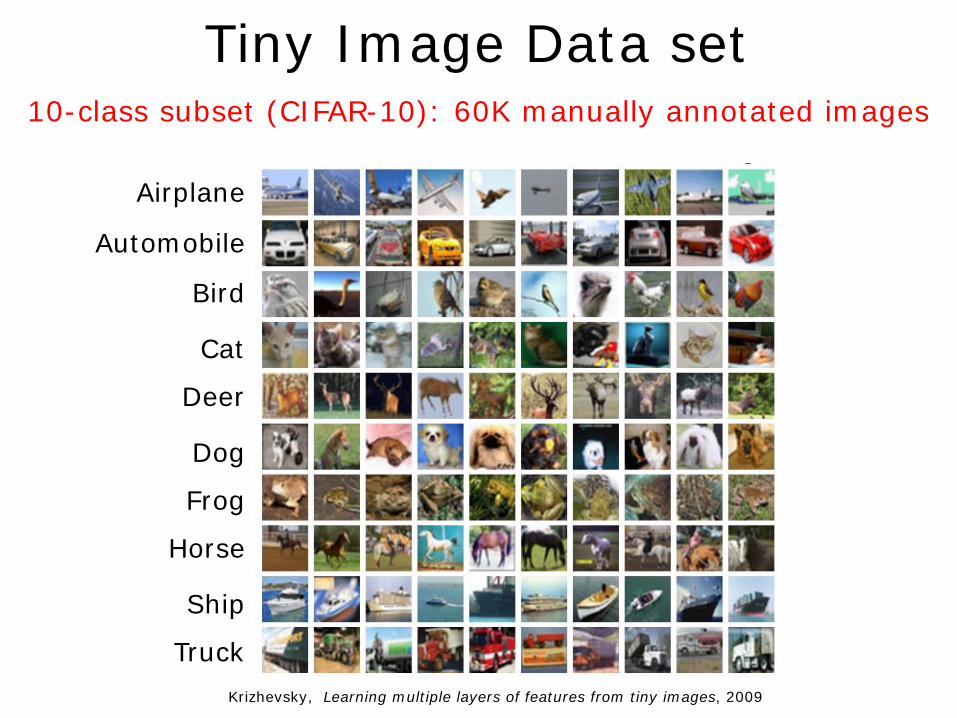
Tiny Image Data set
Krizhevsky, Learning multiple layers of features from tiny images, 2009
10-class subset (CIFAR-10): 60K manually annotated images
Airplane
Automobile
Bird
Cat
Deer
Dog
Frog
Horse
Ship
Truck

Clustering Tiny Images
Average clustering time (100 clusters)
Approximate kernel K-means (m=1,000)
8.5 hours
K-means 6 hours
Example Clusters
C1
C2
C3
C4
C5
2.3GHz, 150GB memory

Clustering Tiny Images
Clustering accuracy
Kernel K-means 29.94%
Approximate kernel K-means (m = 5,000) 29.76%
Spectral clustering 27.09%
K-means 26.70%
Ranzato et. Al., Modeling pixel means and covariances using factorized third-order boltzmann machines, CVPR 2010 Fowlkes et al., Spectral grouping using the Nystrom method, PAMI 2004
Best Supervised Classification Accuracy on CIFAR-10: 54.7%
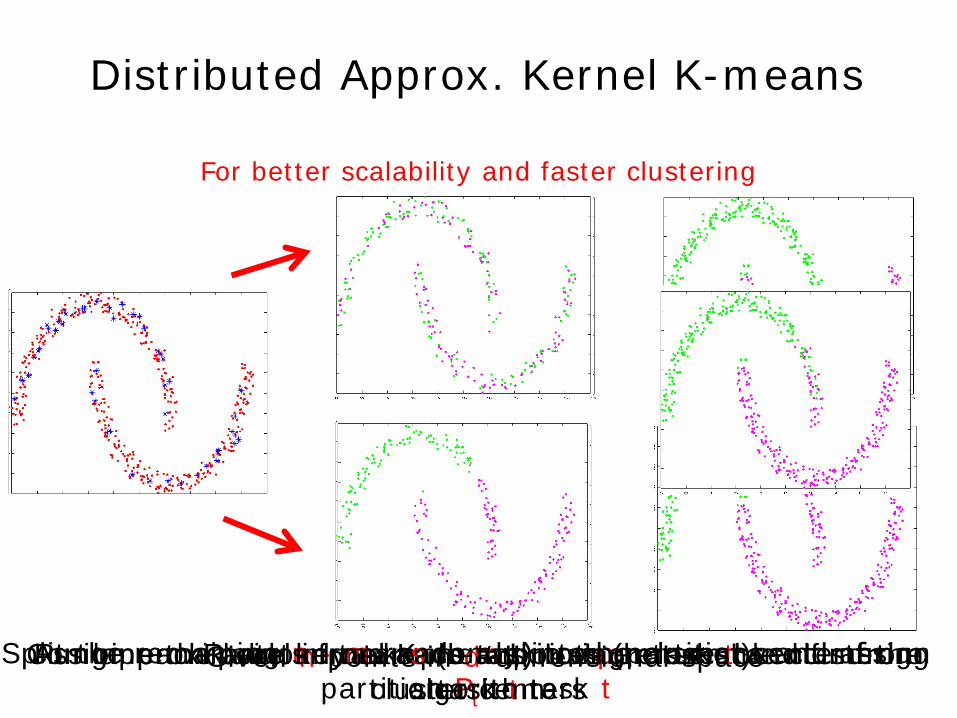
Distributed Approx. Kernel K-means
For better scalability and faster clustering
Given n points in d-dimensional space Randomly sample m points (m << n) Split the remaining n - m randomly into p partitions and assign partition Pt to task t
Run approximate kernel K-means in each task t and find the cluster centers
Assign each point in task s (s ≠ t) to the closest center from task t
Combine the labels from each task using ensemble clustering algorithm
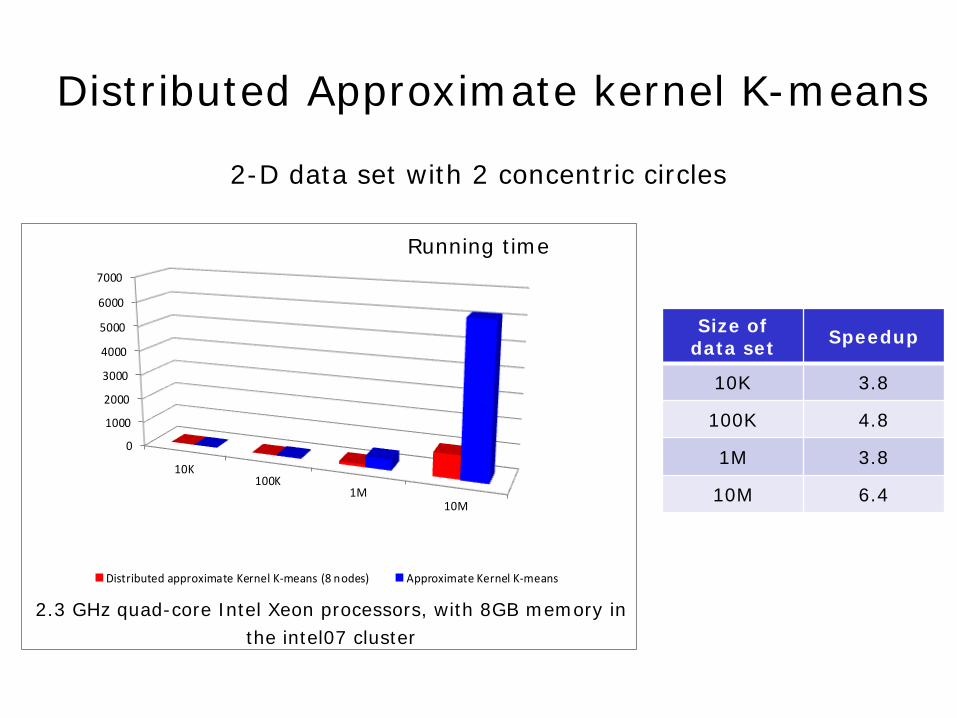
0
1000
2000
3000
4000
5000
6000
7000
10K100K
1M10M
Distributed approximate Kernel K-means (8 nodes) Approximate Kernel K-means
Size of data set Speedup
10K 3.8
100K 4.8
1M 3.8
10M 6.4
2-D data set with 2 concentric circles
Running time
2.3 GHz quad-core Intel Xeon processors, with 8GB memory in the intel07 cluster
Distributed Approximate kernel K-means

Limitations of Approx. kernel K-means Clustering data with more than 10 million points will
require terabytes of memory!
Sample and Cluster Algorithm (SnC)
Sample s points from data Run approximate kernel K-means on the s points
Assign remaining points to the nearest cluster center
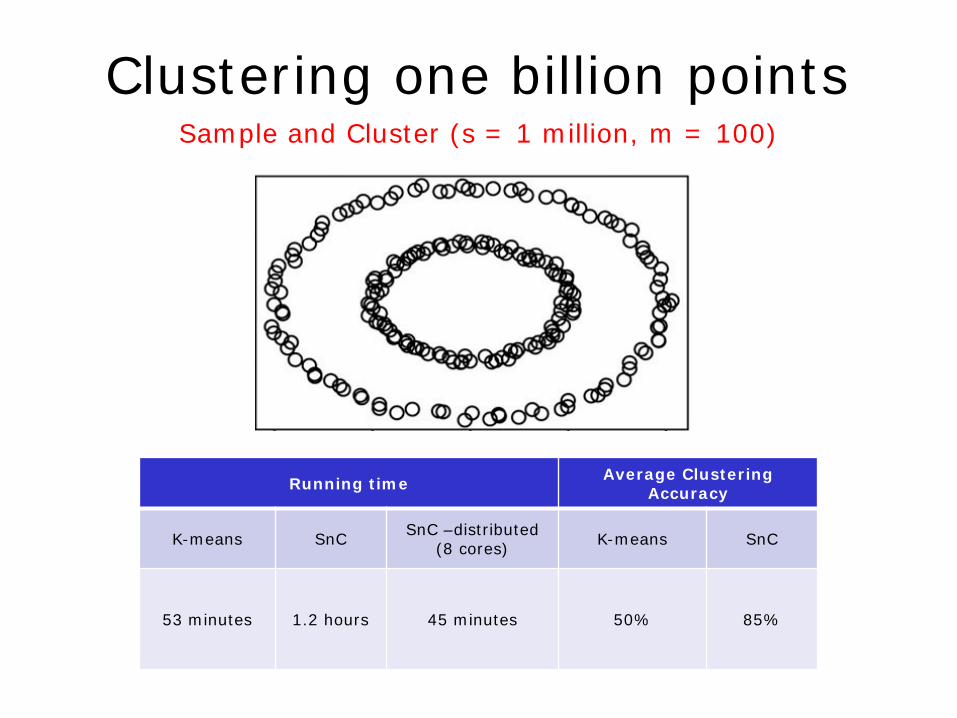
Clustering one billion points
Running time Average Clustering Accuracy
K-means SnC SnC –distributed (8 cores) K-means SnC
53 minutes 1.2 hours 45 minutes 50% 85%
Sample and Cluster (s = 1 million, m = 100)
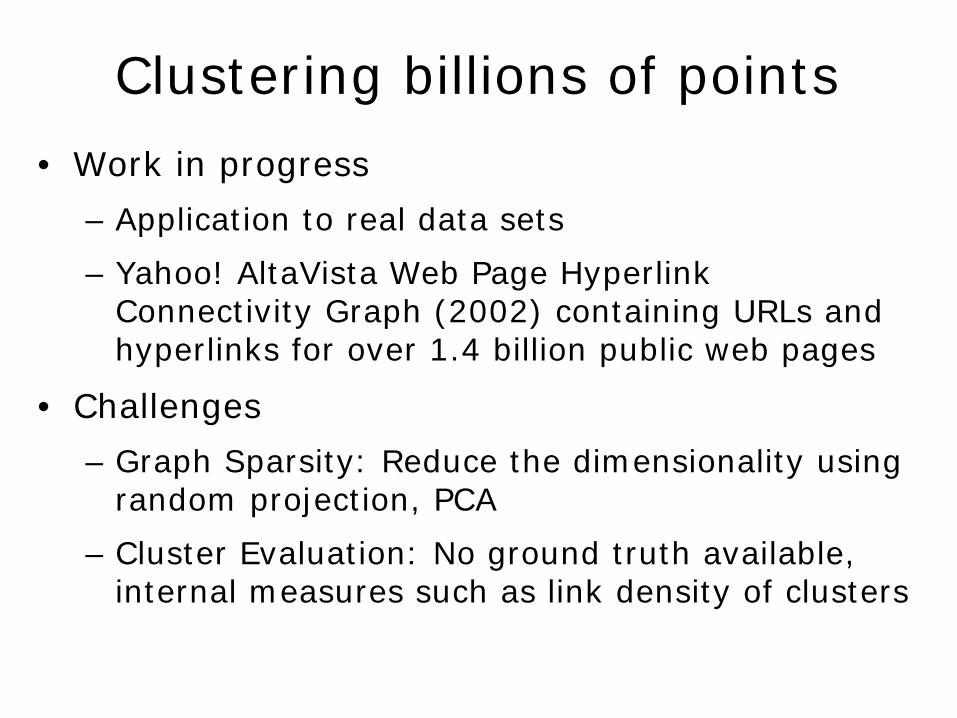
Clustering billions of points
• Work in progress
– Application to real data sets
– Yahoo! AltaVista Web Page Hyperlink Connectivity Graph (2002) containing URLs and hyperlinks for over 1.4 billion public web pages
• Challenges
– Graph Sparsity: Reduce the dimensionality using random projection, PCA
– Cluster Evaluation: No ground truth available, internal measures such as link density of clusters

• Clustering is an exploratory technique; used in every scientific field that collects data
• Choice of clustering algorithm & its parameters is data dependent
• Clustering is essential for “Big Data” problem
• Approximate kernel K-means provides good tradeoff between scalability & clustering accuracy
• Challenges: Scalability, very large no. of clusters, heterogeneous data, streaming data, validity
Summary
Big Data
http://dilbert.com/strips/comic/2012-07-29/
Big Data


![A Quantitative Analysis of Big Data Clustering Algorithms ...people.cs.ksu.edu/.../Munir_BigData_Hospitality_av... · customer recommendation[12]. One of these processes is data clustering](https://img.pdfslide.us/doc/110x75/6048cb0de24a562ba434e869/a-quantitative-analysis-of-big-data-clustering-algorithms-customer-recommendation12.jpg)