Embed Size (px)
Citation preview
Center for Information Services and High Performance Computing (ZIH)
August 1, 2016
Clustering and Alignment Methods for Structural Comparison of Parallel Applications
Scalable Tools Workshop 2016 Lake Tahoe, California, USA
Matthias Weber
Slide 2
Outline
- Motivation - Structural Clustering of Processes
- Determining Similarity - Efficient Computation and Storage of Clusters - Applicability Study
- Structural Alignment of Processes
- Alignment of Multiple Process Sequences - Merged Call Graph
- Conclusion
August 1, 2016
Slide 3
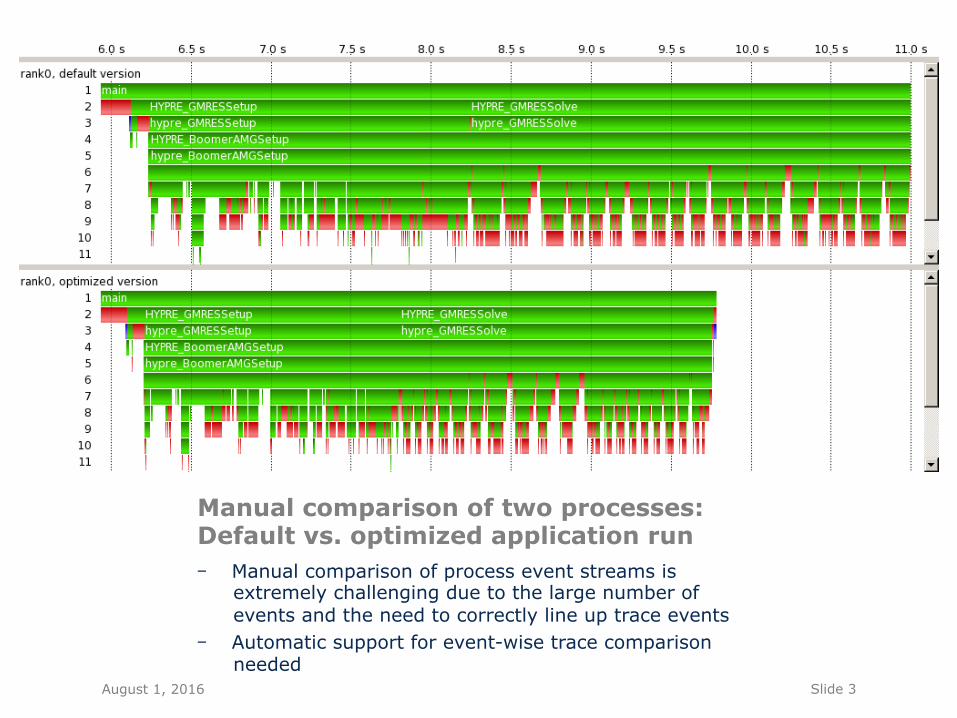
Manual comparison of two processes: Default vs. optimized application run - Manual comparison of process event streams is
extremely challenging due to the large number of events and the need to correctly line up trace events
- Automatic support for event-wise trace comparison needed
August 1, 2016
Slide 4
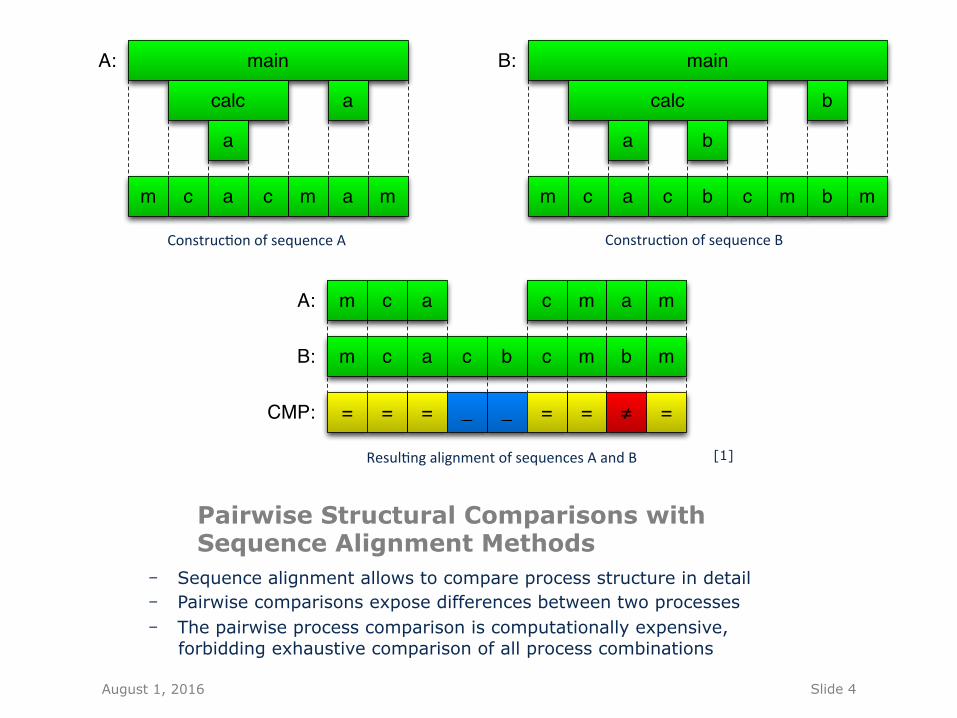
Pairwise Structural Comparisons with Sequence Alignment Methods
- Sequence alignment allows to compare process structure in detail - Pairwise comparisons expose differences between two processes - The pairwise process comparison is computationally expensive,
forbidding exhaustive comparison of all process combinations
A:
B:
m c c m aa
= = _ =CMP: _ =≠
m
m c c m ba m
= =
c b
Resul&ngalignmentofsequencesAandB
m c m aa mc
A:
a
calc a
main
m c c m ba mc b
B:
a b
calc b
main
Construc&onofsequenceA Construc&onofsequenceB
August 1, 2016
[1]
Slide 5
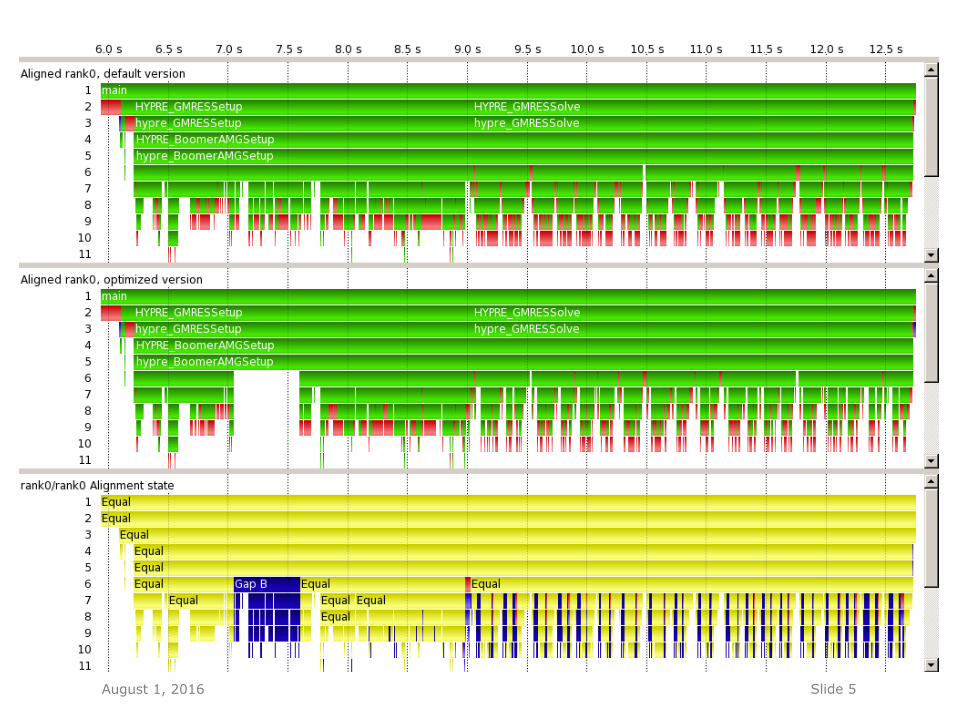
AMG2006 – A parallel algebraic multigrid solver for linear systems - Comparison of the default version with an optimized
version that performs less coarsening, avoiding a lot of expensive communication
- Shown are the unaligned rank0 processes - Exact differences are hard to spot
August 1, 2016
[2]
Slide 6
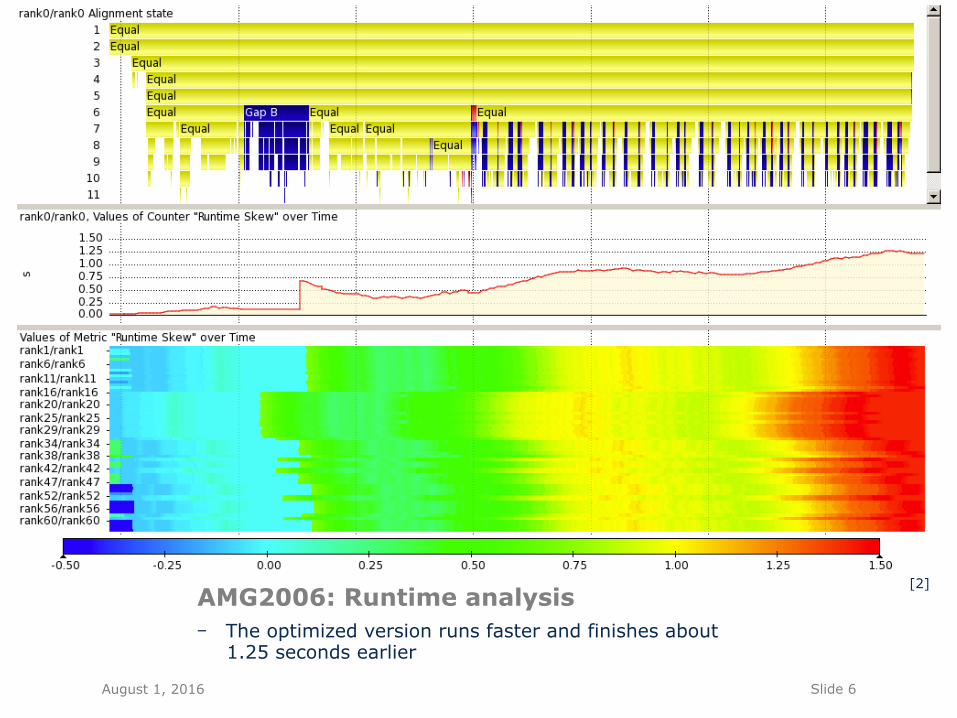
- The optimized version runs faster and finishes about 1.25 seconds earlier
AMG2006: Runtime analysis [2]
August 1, 2016
Slide 7
Outline
- Motivation - Structural Clustering of Processes
- Determining Similarity - Efficient Computation and Storage of Clusters - Applicability Study
- Structural Alignment of Processes
- Alignment of Multiple Process Sequences - Merged Call Graph
- Conclusion
August 1, 2016
Slide 8
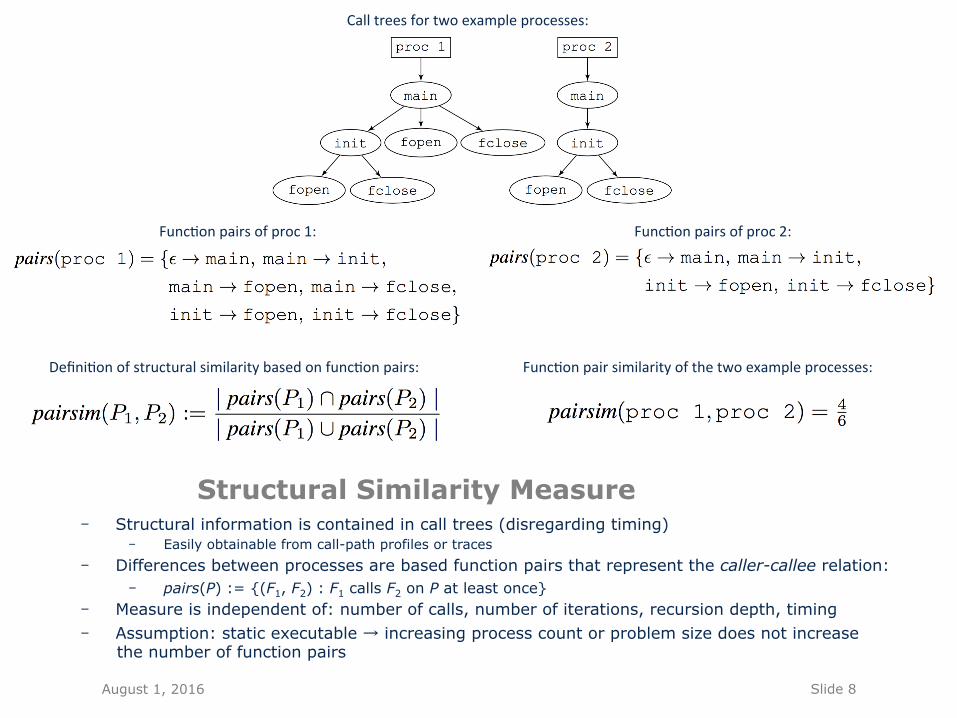
Structural Similarity Measure - Structural information is contained in call trees (disregarding timing)
- Easily obtainable from call-path profiles or traces - Differences between processes are based function pairs that represent the caller-callee relation:
- pairs(P) := {(F1, F2) : F1 calls F2 on P at least once} - Measure is independent of: number of calls, number of iterations, recursion depth, timing - Assumption: static executable → increasing process count or problem size does not increase
the number of function pairs
Func&onpairsofproc1:
Func&onpairsimilarityofthetwoexampleprocesses:
Calltreesfortwoexampleprocesses:
Func&onpairsofproc2:
Defini&onofstructuralsimilaritybasedonfunc&onpairs:
August 1, 2016
Slide 9
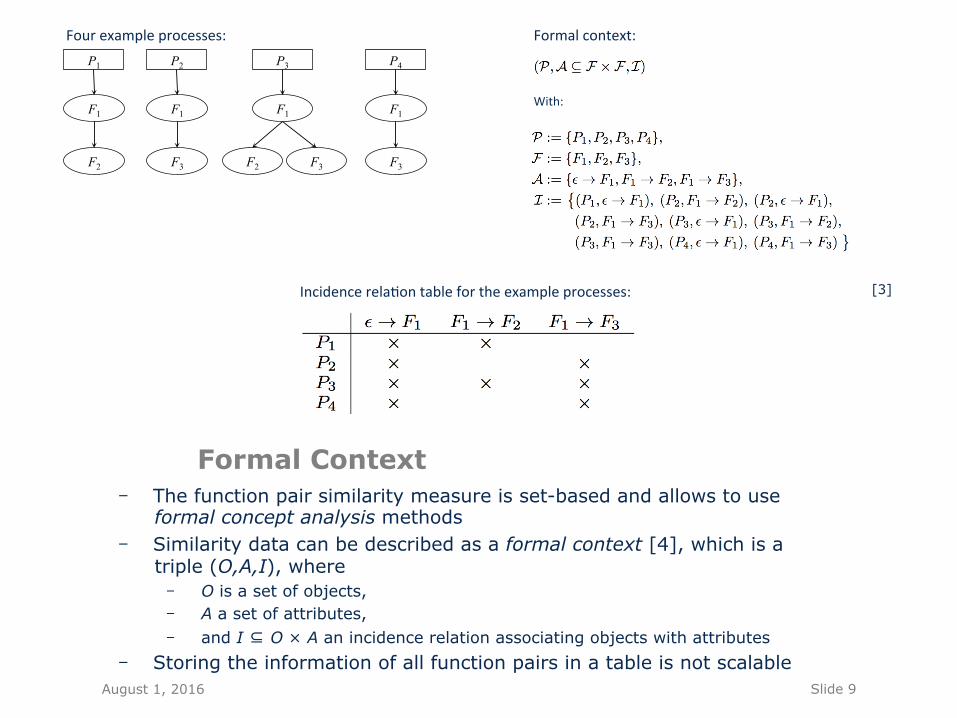
Formal Context - The function pair similarity measure is set-based and allows to use
formal concept analysis methods - Similarity data can be described as a formal context [4], which is a
triple (O,A,I), where - O is a set of objects, - A a set of attributes, - and I ⊆ O × A an incidence relation associating objects with attributes
- Storing the information of all function pairs in a table is not scalable
P1
F1
F2 F3 F2
P2
F1
F3
P4
F1
F3
P3
F1
Formalcontext:Fourexampleprocesses:
With:
Incidencerela&ontablefortheexampleprocesses:
August 1, 2016
[3]
Slide 10
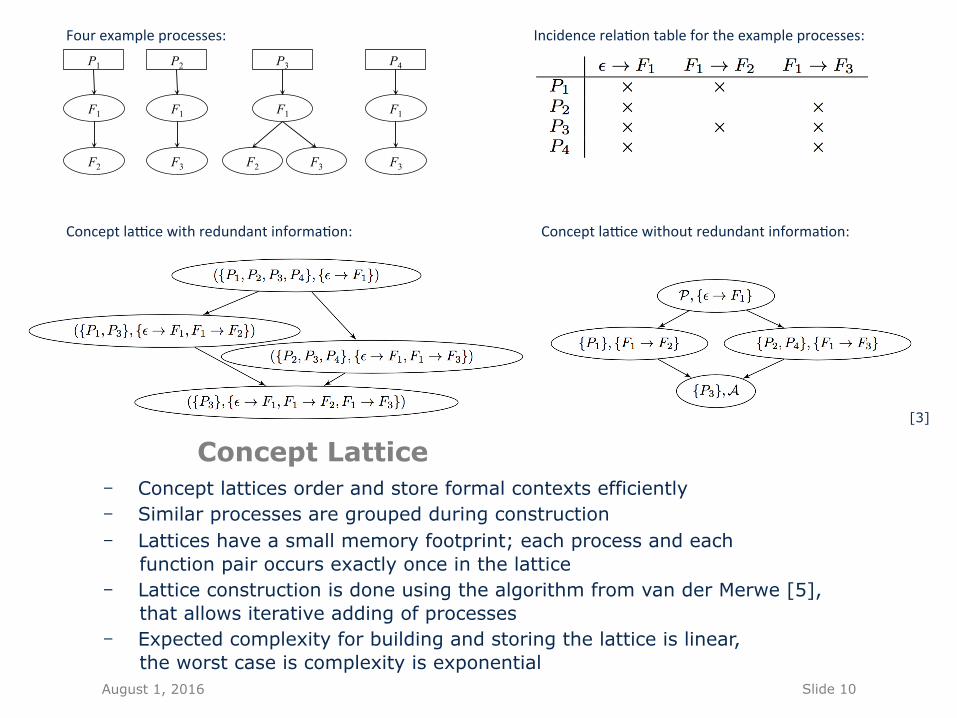
Concept Lattice - Concept lattices order and store formal contexts efficiently - Similar processes are grouped during construction - Lattices have a small memory footprint; each process and each
function pair occurs exactly once in the lattice - Lattice construction is done using the algorithm from van der Merwe [5],
that allows iterative adding of processes - Expected complexity for building and storing the lattice is linear,
the worst case is complexity is exponential
P1
F1
F2 F3 F2
P2
F1
F3
P4
F1
F3
P3
F1
Fourexampleprocesses: Incidencerela&ontablefortheexampleprocesses:
ConceptlaEcewithredundantinforma&on: ConceptlaEcewithoutredundantinforma&on:
August 1, 2016
[3]
Slide 11
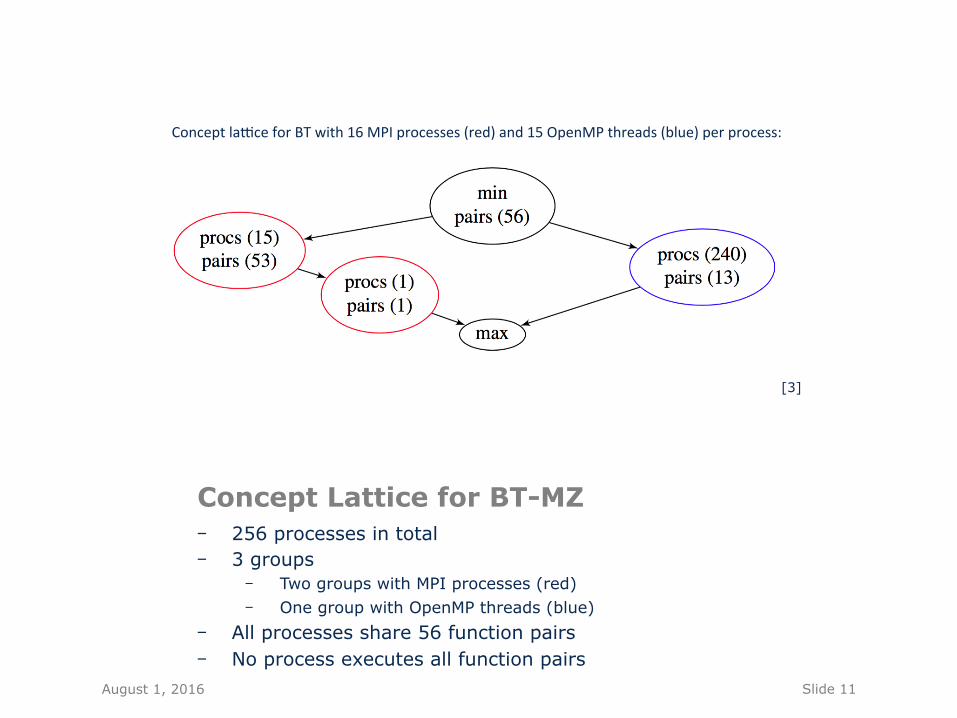
Concept Lattice for BT-MZ - 256 processes in total - 3 groups
- Two groups with MPI processes (red) - One group with OpenMP threads (blue)
- All processes share 56 function pairs - No process executes all function pairs
ConceptlaEceforBTwith16MPIprocesses(red)and15OpenMPthreads(blue)perprocess:
August 1, 2016
[3]
Slide 12
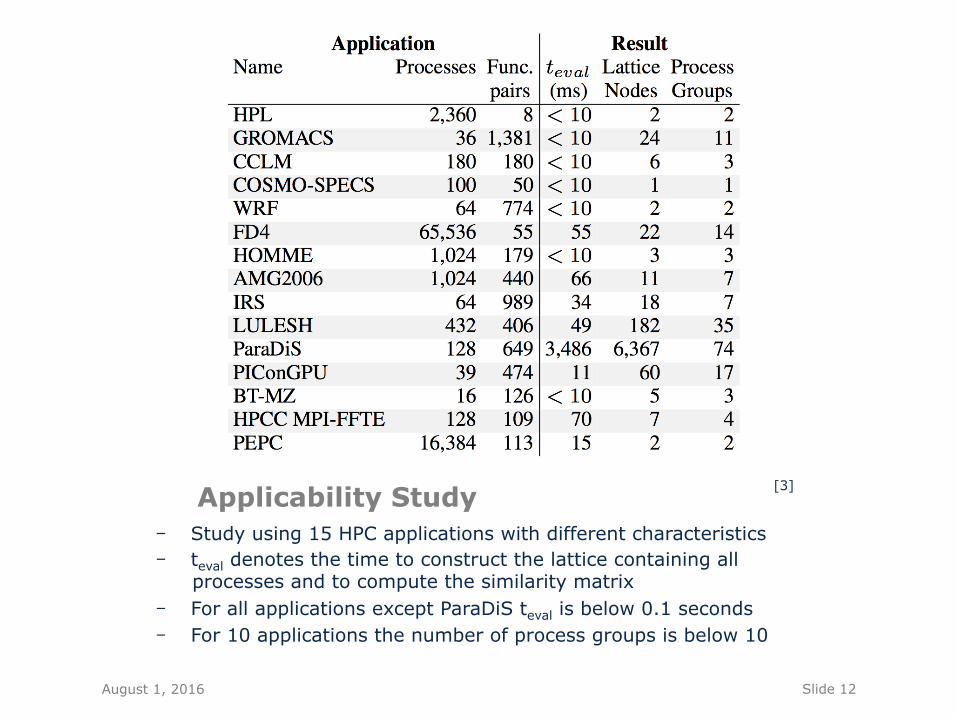
Applicability Study - Study using 15 HPC applications with different characteristics - teval denotes the time to construct the lattice containing all
processes and to compute the similarity matrix - For all applications except ParaDiS teval is below 0.1 seconds - For 10 applications the number of process groups is below 10
August 1, 2016
[3]
Slide 13
Outline
- Motivation - Structural Clustering of Processes
- Determining Similarity - Efficient Computation and Storage of Clusters - Applicability Study
- Structural Alignment of Processes
- Alignment of Multiple Process Sequences - Merged Call Graph
- Conclusion
August 1, 2016
Slide 14
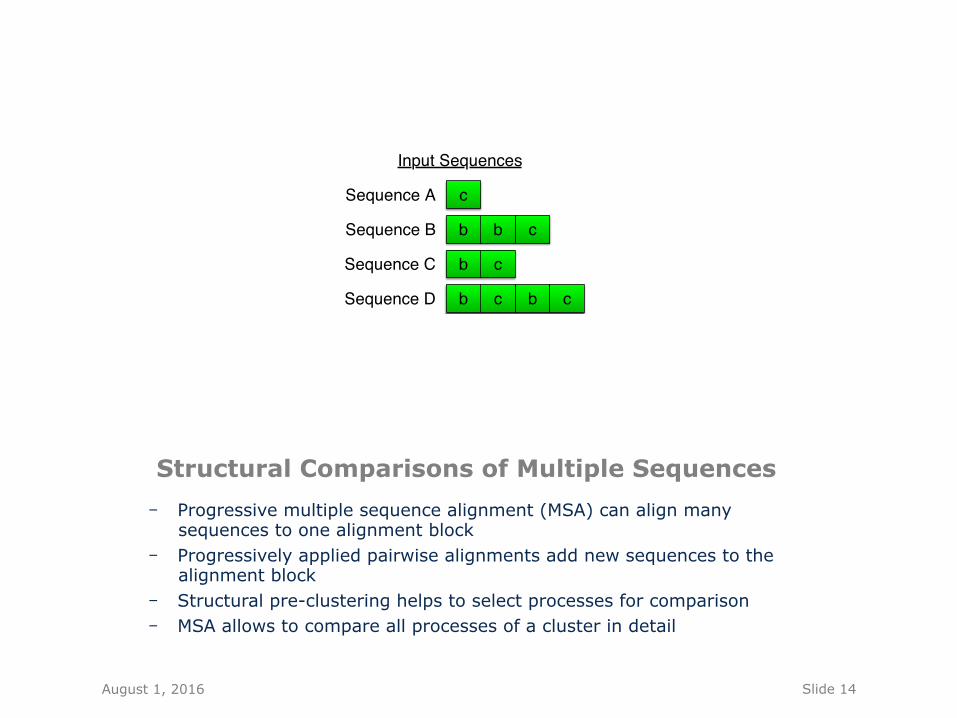
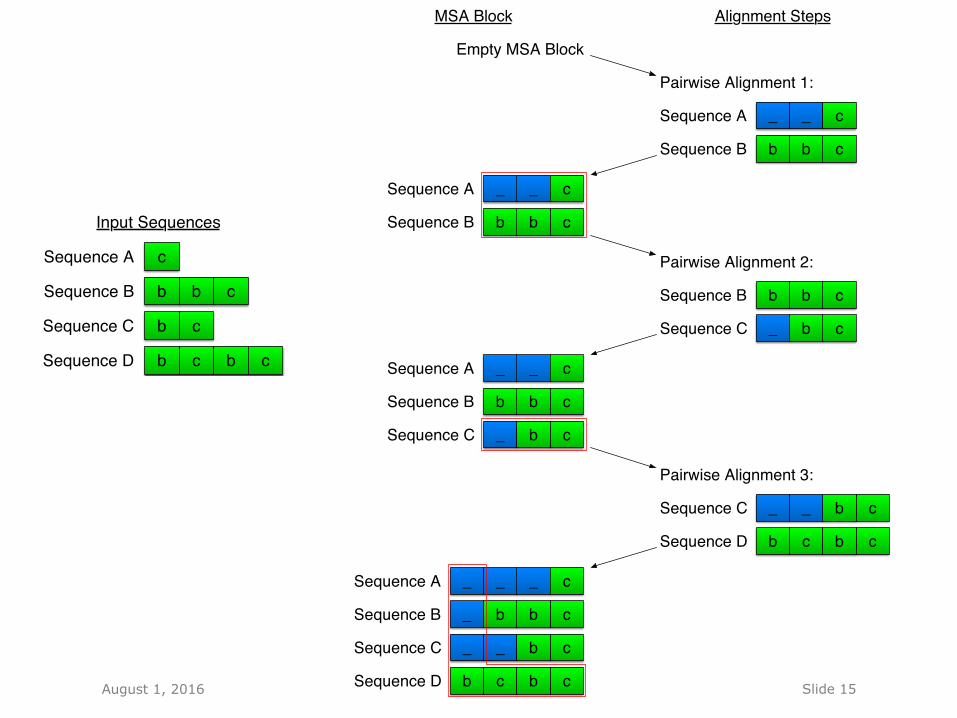
Structural Comparisons of Multiple Sequences - Progressive multiple sequence alignment (MSA) can align many
sequences to one alignment block - Progressively applied pairwise alignments add new sequences to the
alignment block - Structural pre-clustering helps to select processes for comparison - MSA allows to compare all processes of a cluster in detail
August 1, 2016
Sequence A
c
b
Sequence B
Sequence D
Sequence C c
c
b
c
b
b
b
c
Input Sequences
Slide 15 August 1, 2016
Sequence A
c
b
Sequence B
Sequence D
Sequence C c
c
b
c
b
b
b
c
Input Sequences
Sequence A
Sequence B
Pairwise Alignment 1:
Sequence A
cSequence B b
_
b
c_
MSA Block
Empty MSA Block
cb
_
b
c_
Sequence B c
Sequence C
bb
c_ b
Sequence A
Sequence B cb
_
b
c_
Sequence C c_ b
Sequence C c_ b
Sequence D c
_
b cb
Sequence A
Sequence B cb
_
b
c_
Sequence C c_ b
Sequence D cb cb
_
_
_
Pairwise Alignment 2:
Pairwise Alignment 3:
Alignment Steps
Slide 16
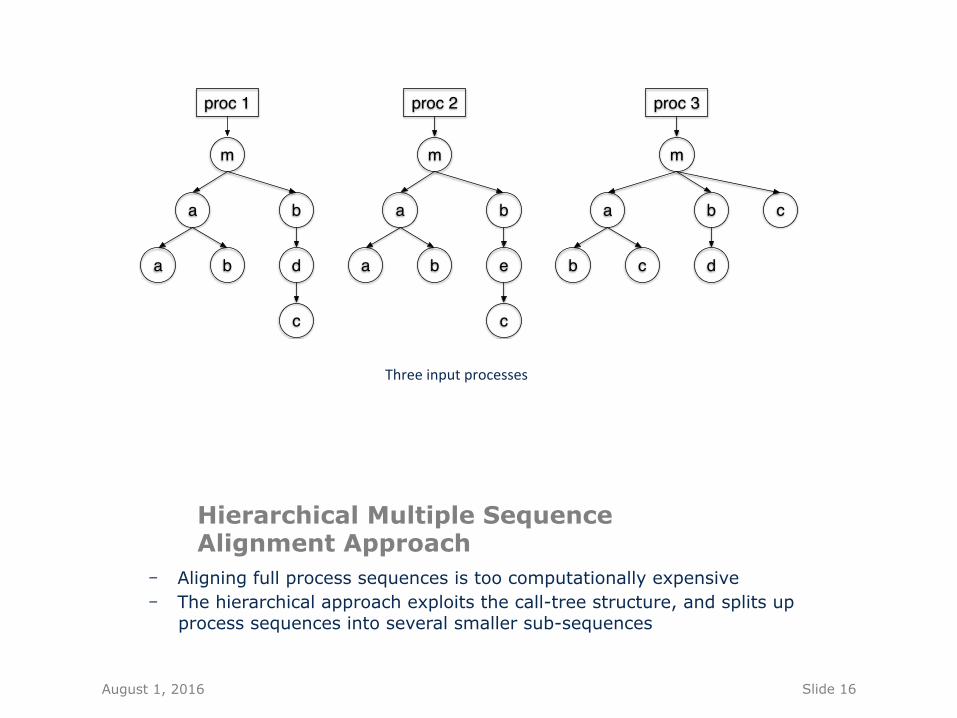
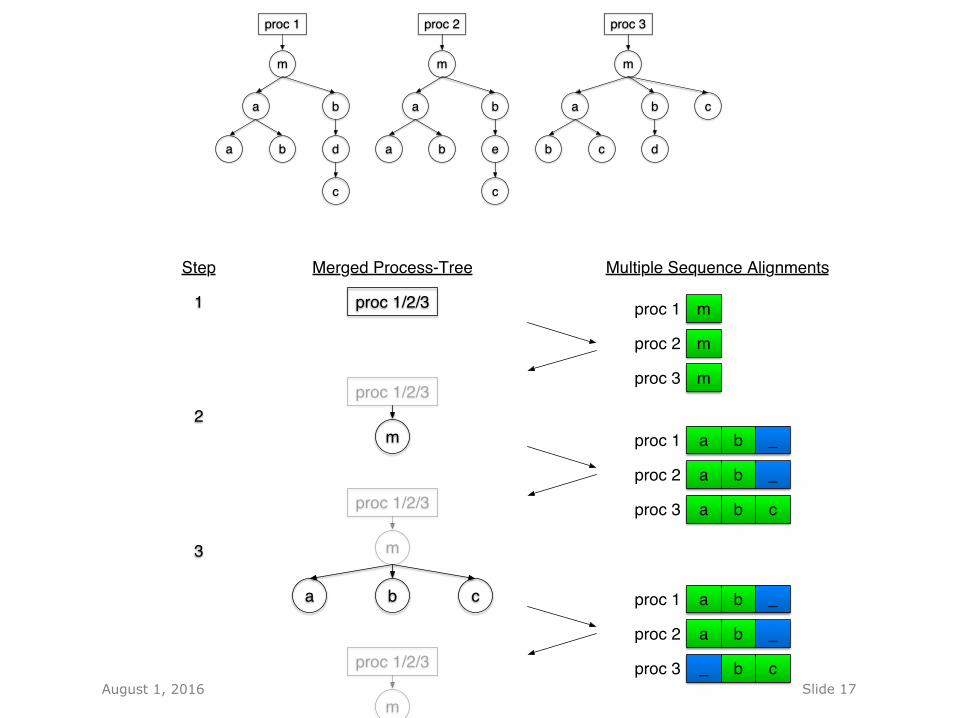
Hierarchical Multiple Sequence Alignment Approach
- Aligning full process sequences is too computationally expensive - The hierarchical approach exploits the call-tree structure, and splits up
process sequences into several smaller sub-sequences
Threeinputprocesses
August 1, 2016
m
proc 1
a
b
b
d
c
a
m
proc 2
a
b
b
e
c
a
m
proc 3
a
c
b
d
c
b
Slide 17 August 1, 2016
proc 1
proc 2 m
m
Merged Process-Tree
cba
a
_
b
Multiple Sequence Alignments
proc 1/2/3
proc 1/2/3
m
proc 3 m
proc 1
proc 2
proc 3
a
_
b
proc 1/2/3
m
a b c
cb
a
_
b
proc 1
proc 2
proc 3
a
_
b
_proc 1/2/3
m
a b c
a b c
e
d
proc 1
proc 2
proc 3
d
proc 1/2/3
m
a b c
a b c d/e
c
proc 1
proc 2
proc 3
c
_proc 1/2/3
m
a b c
a b c d/e
c
Step
1
2
3
4
5
6
m
proc 1
a
b
b
d
c
a
m
proc 2
a
b
b
e
c
a
m
proc 3
a
c
b
d
c
b
Slide 18
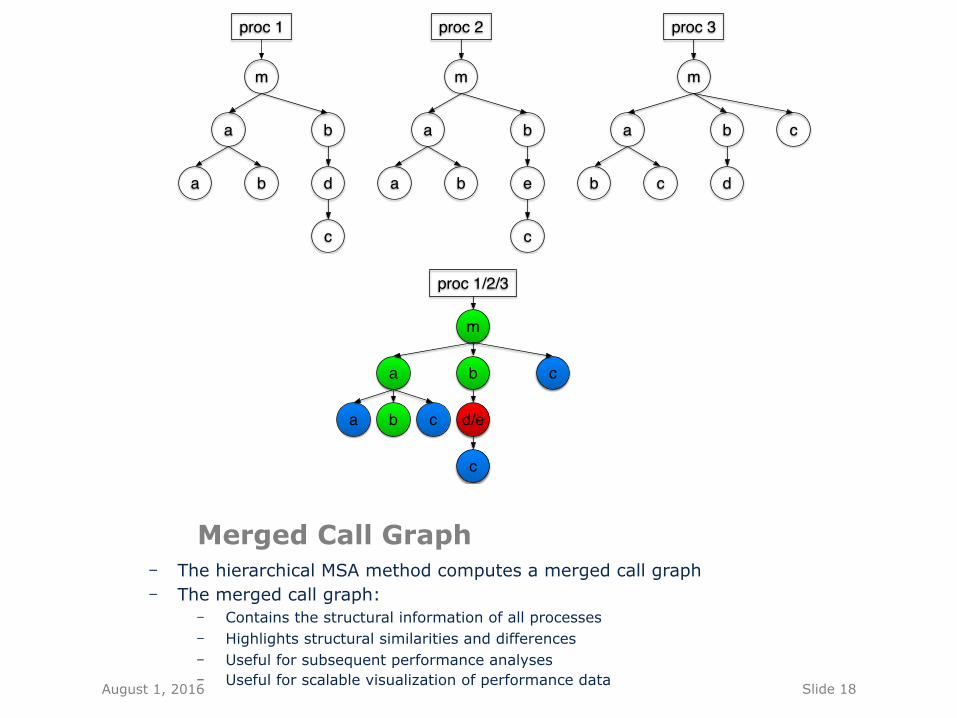
Merged Call Graph - The hierarchical MSA method computes a merged call graph - The merged call graph:
- Contains the structural information of all processes - Highlights structural similarities and differences - Useful for subsequent performance analyses - Useful for scalable visualization of performance data
August 1, 2016
proc 1/2/3
m
a b c
a b c d/e
c
m
proc 1
a
b
b
d
c
a
m
proc 2
a
b
b
e
c
a
m
proc 3
a
c
b
d
c
b
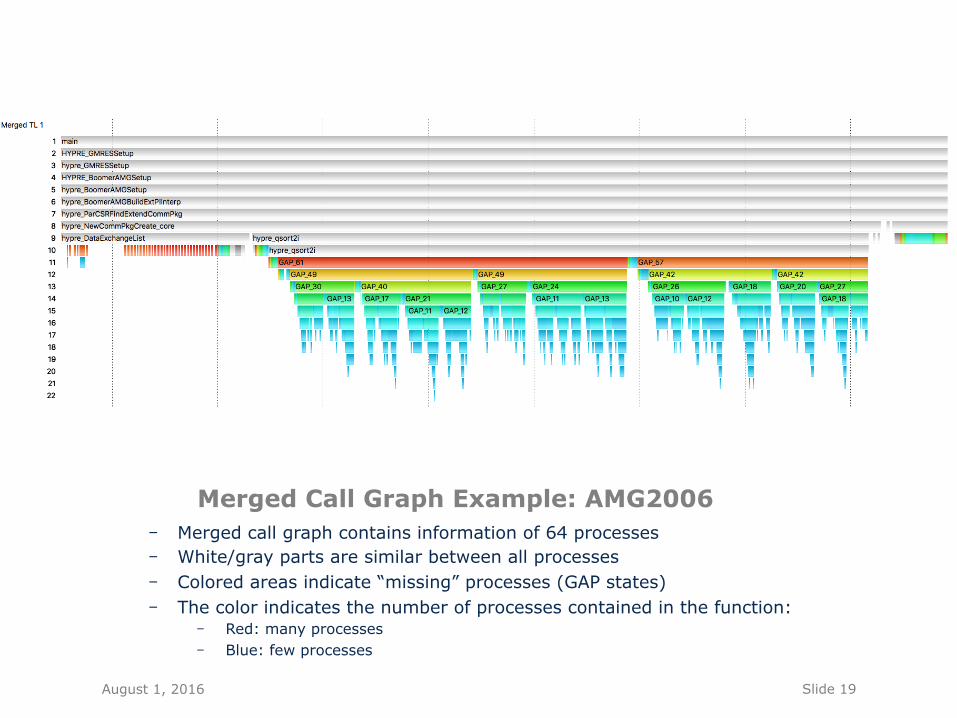
Slide 19
Merged Call Graph Example: AMG2006 - Merged call graph contains information of 64 processes - White/gray parts are similar between all processes - Colored areas indicate “missing” processes (GAP states) - The color indicates the number of processes contained in the function:
- Red: many processes - Blue: few processes
August 1, 2016
Slide 20
Conclusion - Introduced a novel grouping method based on the
structure of processes - Applicable for most application types - Grouping can be efficiently stored and computed - In most cases linear time complexity - In many cases the number of generated clusters remains
low and stable for increasing process counts - Useful as pre-clustering step to improve improve the
effectiveness of traditional analysis techniques - Introduced a hierarchical multiple sequence alignment
approach to compare the structure of processes - Compares the function call structure in detail - Merged call graph combines the complete structural
information of multiple processes and highlights differences
August 1, 2016
Slide 21
[1] Matthias Weber, Ronny Brendel, and Holger Brunst. Trace File Comparison with a Hierarchical Sequence Alignment Algorithm. ISPA ’12, 2012.
[2] Matthias Weber, Kathryn Mohror, Martin Schulz, Bronis R. de
Supinski, Holger Brunst, and Wolfgang E. Nagel. Alignment- Based Metrics for Trace Comparison. Euro-Par’13, 2013.
[3] Matthias Weber, Ronny Brendel, Tobias Hilbrich, Kathryn Mohror,
Martin Schulz, and Holger Brunst. Structural Clustering: A New Approach to Support Performance Analysis at Scale. IPDPS, 2016.
[4] Bernhard Ganter and Rudolf Wille.
Formal concept analysis, volume 284. Springer Berlin, 1999. [5] Dean Van Der Merwe, Sergei Obiedkov, and Derrick Kourie.
A new incremental algorithm for constructing concept lattices. In Concept Lattices, 2004.
August 1, 2016