Embed Size (px)
Citation preview
Cluster Analysis using SaTScan
Patrick DeLuca, M.A.APHEO 2007 Conference, Ottawa
October 16th, 2007
28 September 2007 APHEO Conference 2007 2
Outline
Clusters & Cluster Detection Spatial Scan StatisticCase Study
Clusters & Cluster Detection
28 September 2007 APHEO Conference 2007 4
What is a cluster?
An unusual collection of eventsUnusual aggregation of real or perceived health eventsA geographically and/or temporally bounded collection of occurrences:
of a disease already known to occur typically in clusters, orof sufficient size and concentration to be unlikely to have occurred by chance, orrelated to each other through some social or biological mechanism, or having a common relationship with some other event or circumstance (Knox, 1989)
28 September 2007 APHEO Conference 2007 5
Cluster Detection
GIS can be used as a quick screening tool to identify clusters
Identification of clusters can lead to interventions, even when etiology is uncertain
28 September 2007 APHEO Conference 2007 6
Interesting Questions to be Asked
Over what scale does any clustering occur?Are clusters merely a result of some obvious a priori heterogeneity in the study region?Are they associated with proximity to other features of interest, such as transport arteries or possible point sources of pollution?Are events that cluster in space also clustered in time?
28 September 2007 APHEO Conference 2007 7
Global and Local Tests
Global tests detect the presence or absence of clustering over the whole study region without specifying the spatial location.Local tests additionally specify the location and if extended to consider temporal patterns, can specify spatio-temporal clusters.
A special case of local tests is the focused test which is used to detect raised incidence of disease around some pre-specified source, such as an incinerator.
28 September 2007 APHEO Conference 2007 8
Point Based Methods
Global MeasuresRipley’s K Function (and its variants)
CrimeStat, Splus/R
Local MeasuresKernel Density Estimation
ArcGIS, CrimeStat, Splus
Kuldorff’s Spatial Scan Statistic
28 September 2007 APHEO Conference 2007 9
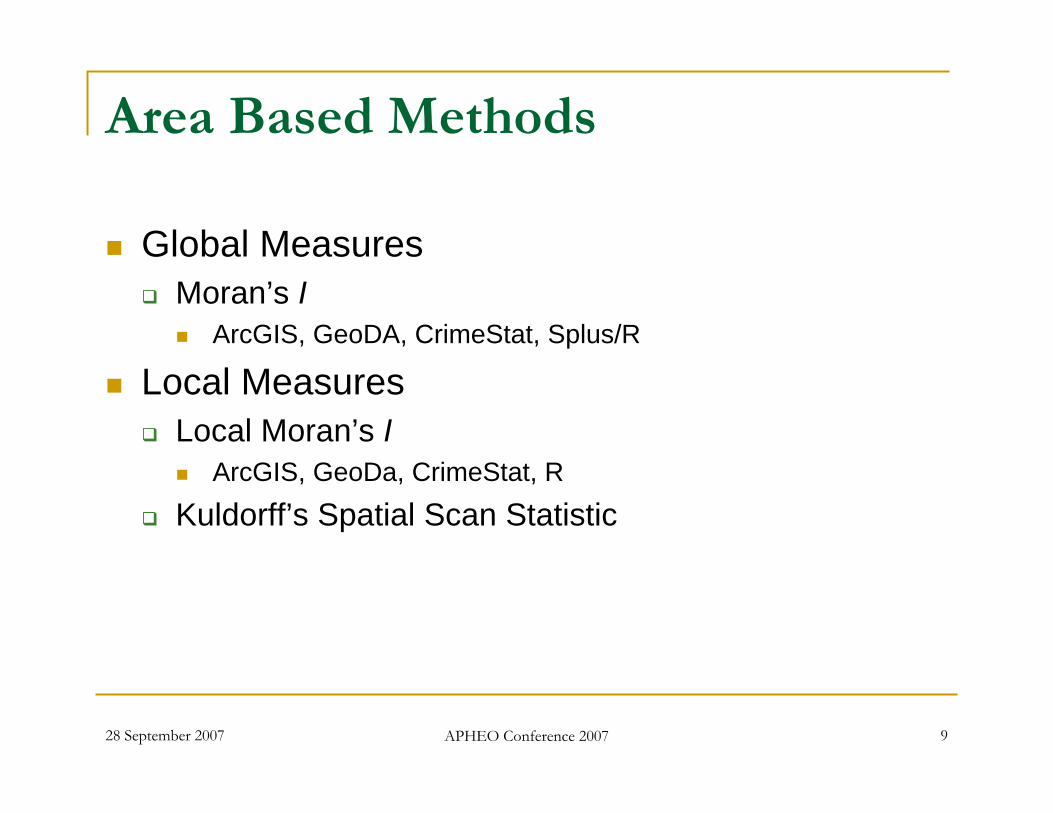
Area Based Methods
Global MeasuresMoran’s I
ArcGIS, GeoDA, CrimeStat, Splus/R
Local MeasuresLocal Moran’s I
ArcGIS, GeoDa, CrimeStat, R
Kuldorff’s Spatial Scan Statistic
SaTScan 7.0.3
28 September 2007 APHEO Conference 2007 11
Introduction to SaTScan 7.0.3
Analyzes spatial, temporal and spatio-temporal data through a scan statisticQuick assessment of potential clustersDeveloped by Martin Kuldorff for the National Cancer InstituteFreely available from www.satscan.org
28 September 2007 APHEO Conference 2007 12
Objectives of the software (1)
To perform geographical surveillance of disease, to detect areas of significantly high or low rates
To test whether a disease is randomly distributed over space, over time or over space and time.
28 September 2007 APHEO Conference 2007 13
To evaluate reported spatial or space-time disease clusters, to see if they are statistically significant
To perform repeated time-periodic disease surveillance for the early detection of disease outbreaks.
Objectives of the software (2)
28 September 2007 APHEO Conference 2007 14
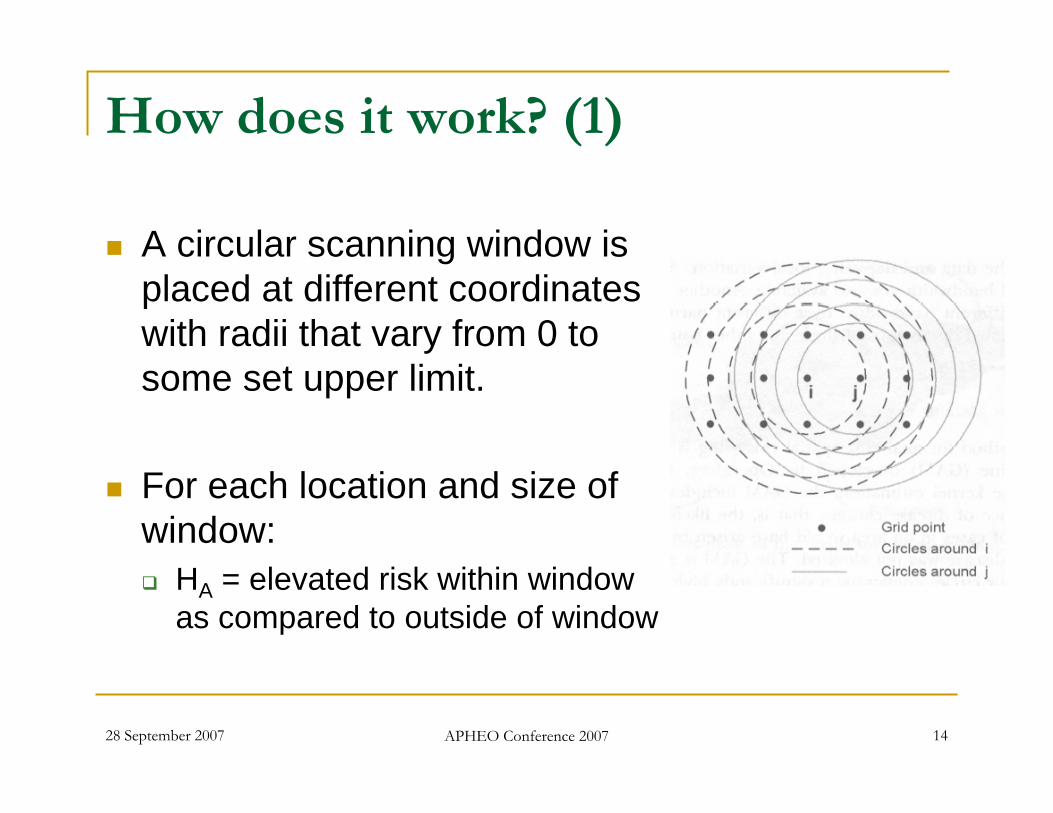
How does it work? (1)
A circular scanning window is placed at different coordinates with radii that vary from 0 to some set upper limit.
For each location and size of window:
HA = elevated risk within window as compared to outside of window
28 September 2007 APHEO Conference 2007 15
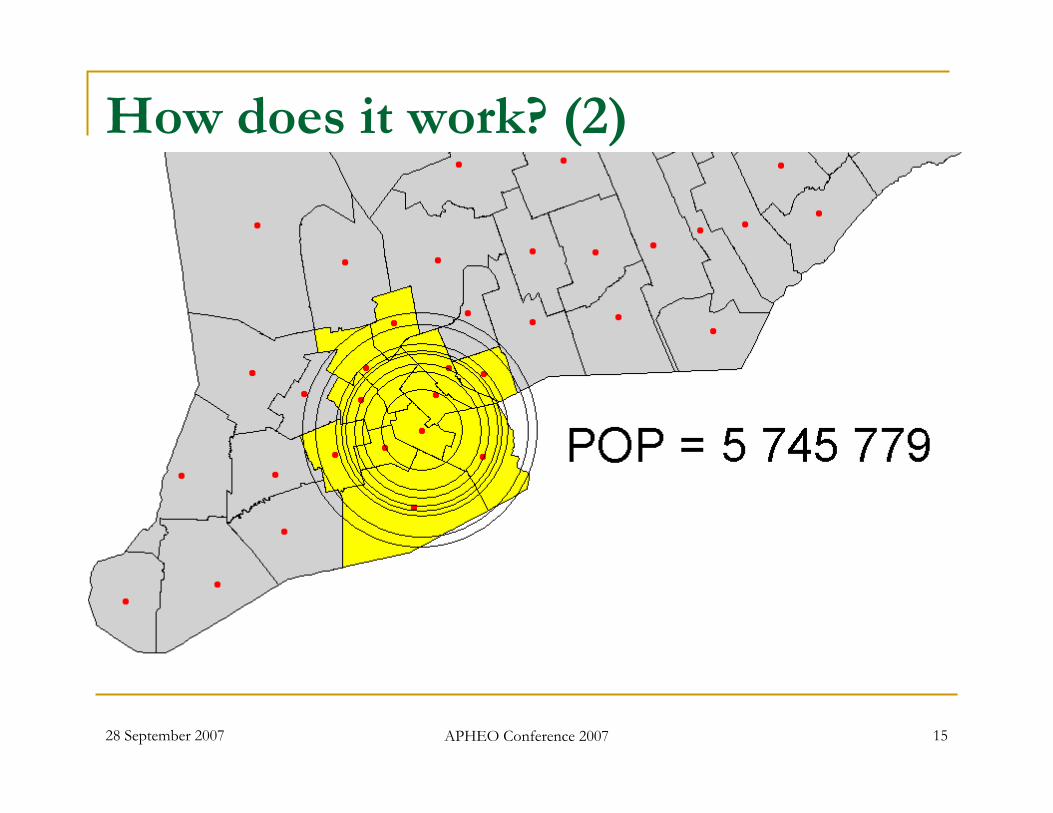
How does it work? (2)
28 September 2007 APHEO Conference 2007 16
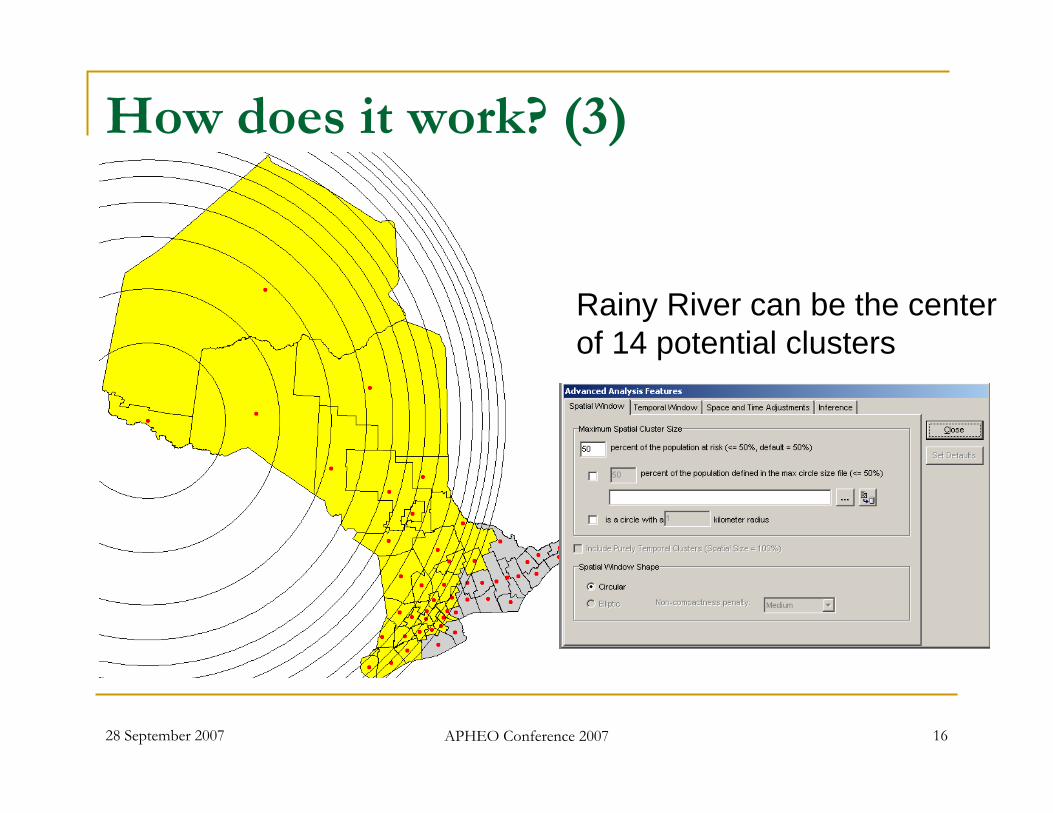
How does it work? (3)
Rainy River can be the centerof 14 potential clusters
28 September 2007 APHEO Conference 2007 17
How does it work? (4)
Likelihood function is created depending on model selected (more later…..)
Likelihood = hypothetical probability that an event that has already occurred would yield a specific outcomeFunction is maximized over all window locations and sizes
The one with the maximum likelihood is most likely cluster (least likely to have occurred by chance)Likelihood ratio for this window becomes maximum likelihood ratio test statisticA p-value is obtained for the cluster by Monte Carlo hypothesis testing
28 September 2007 APHEO Conference 2007 18
How does it work? (5)
Indicates whether there is clusteringShows us where it is (text description)Evaluates its statistical significanceProduces a relative risk for the cluster
Which can be low or high riskSolves the Texas Sharpshooter problem --does not rely on a priori knowledge of any cluster
28 September 2007 APHEO Conference 2007 19
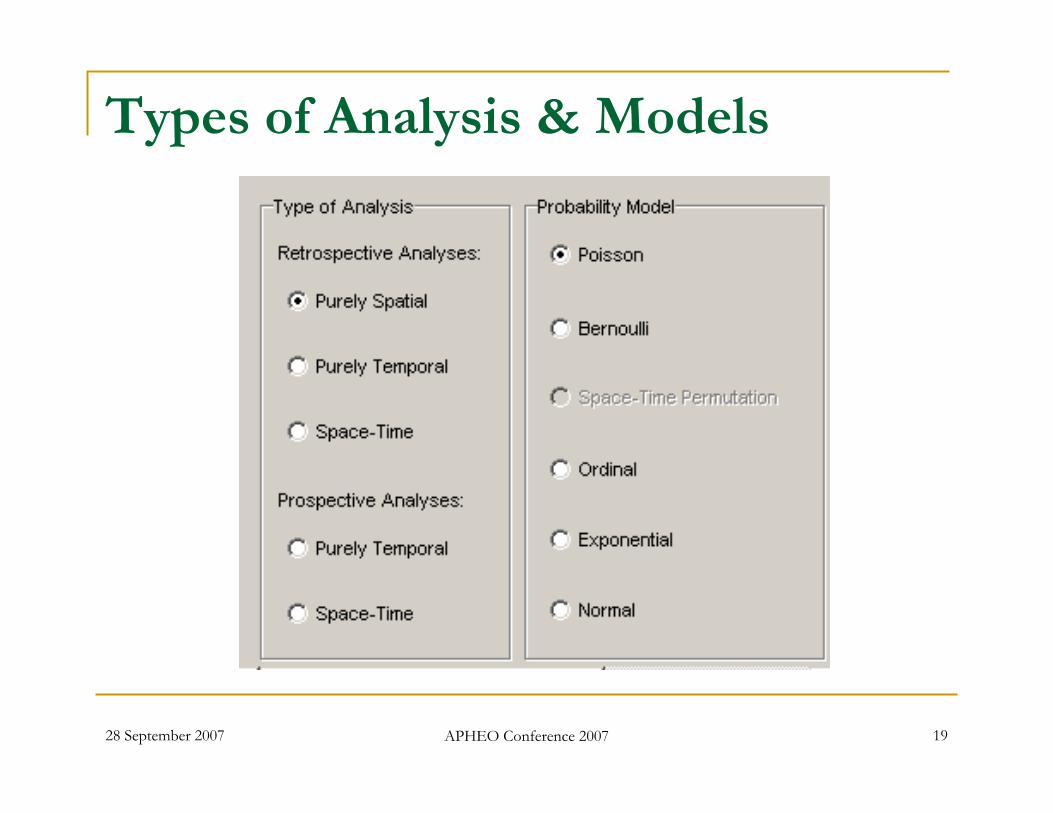
Types of Analysis & Models
28 September 2007 APHEO Conference 2007 20
Poisson models
Should be used when background population reflects a certain risk mass such as total persons in an area
Expected number of cases is directly proportional to the total number of persons
Example – # cases of cancer per 100,000 persons
28 September 2007 APHEO Conference 2007 21
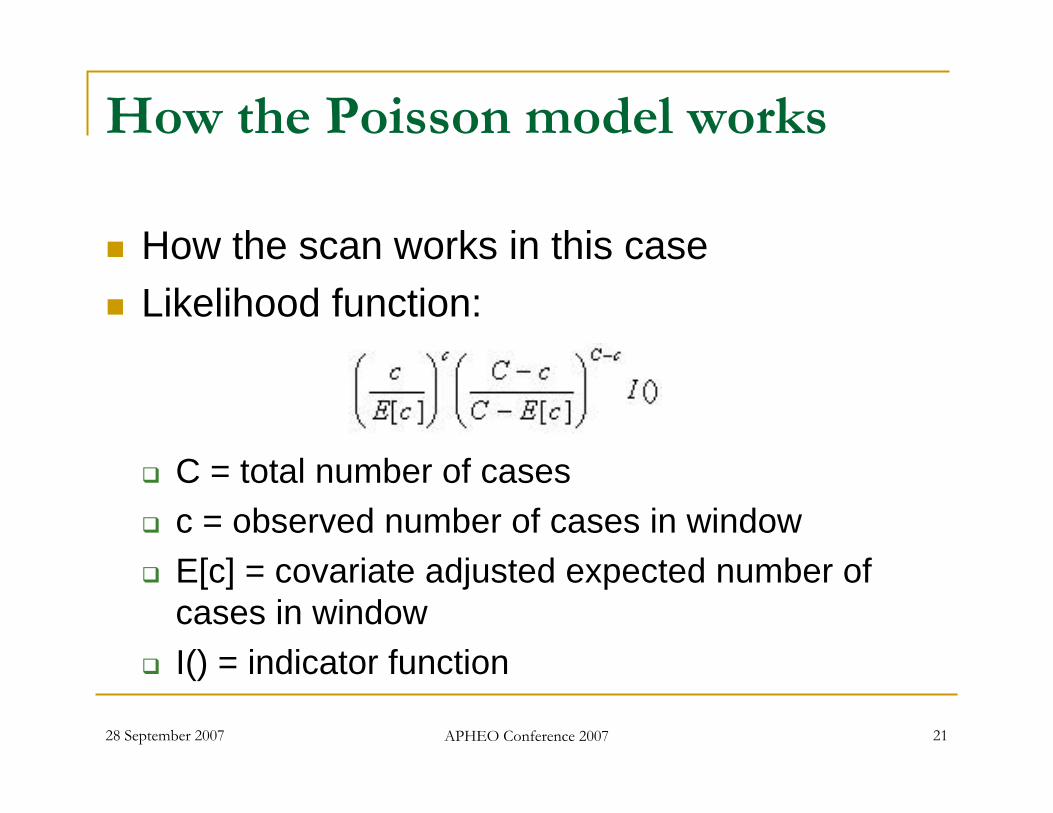
How the Poisson model works
How the scan works in this caseLikelihood function:
C = total number of casesc = observed number of cases in windowE[c] = covariate adjusted expected number of cases in windowI() = indicator function
28 September 2007 APHEO Conference 2007 22
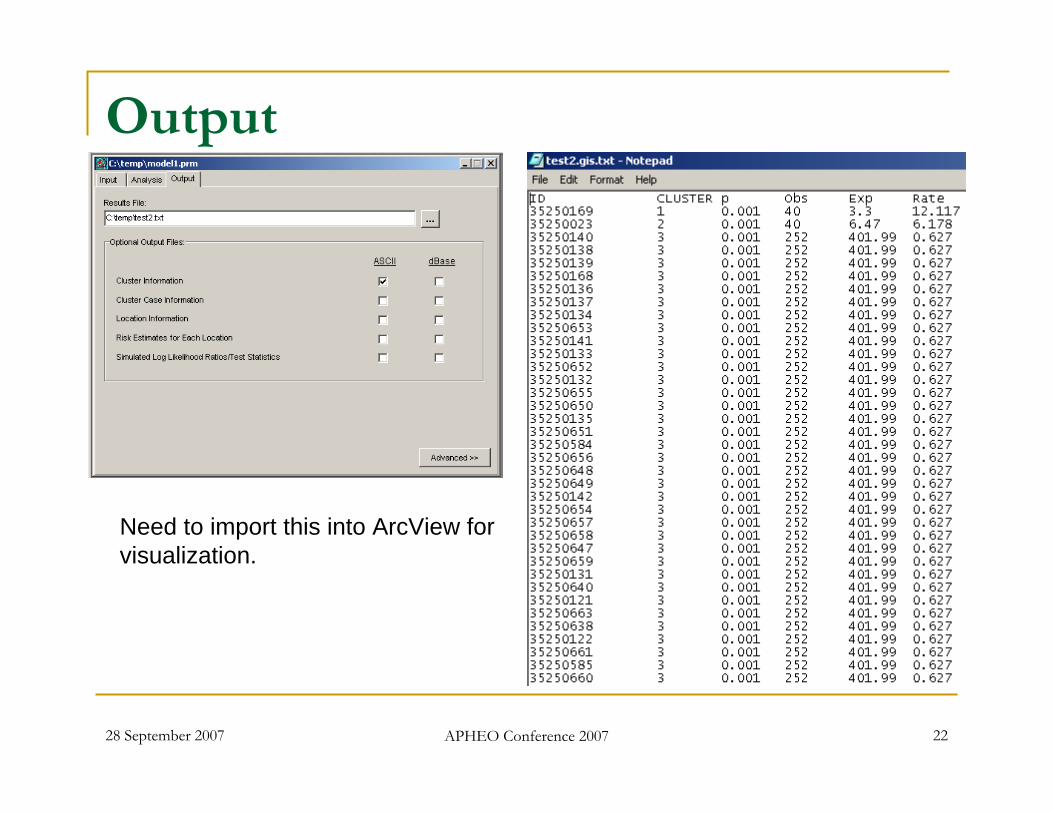
Output
Need to import this into ArcView forvisualization.
28 September 2007 APHEO Conference 2007 23
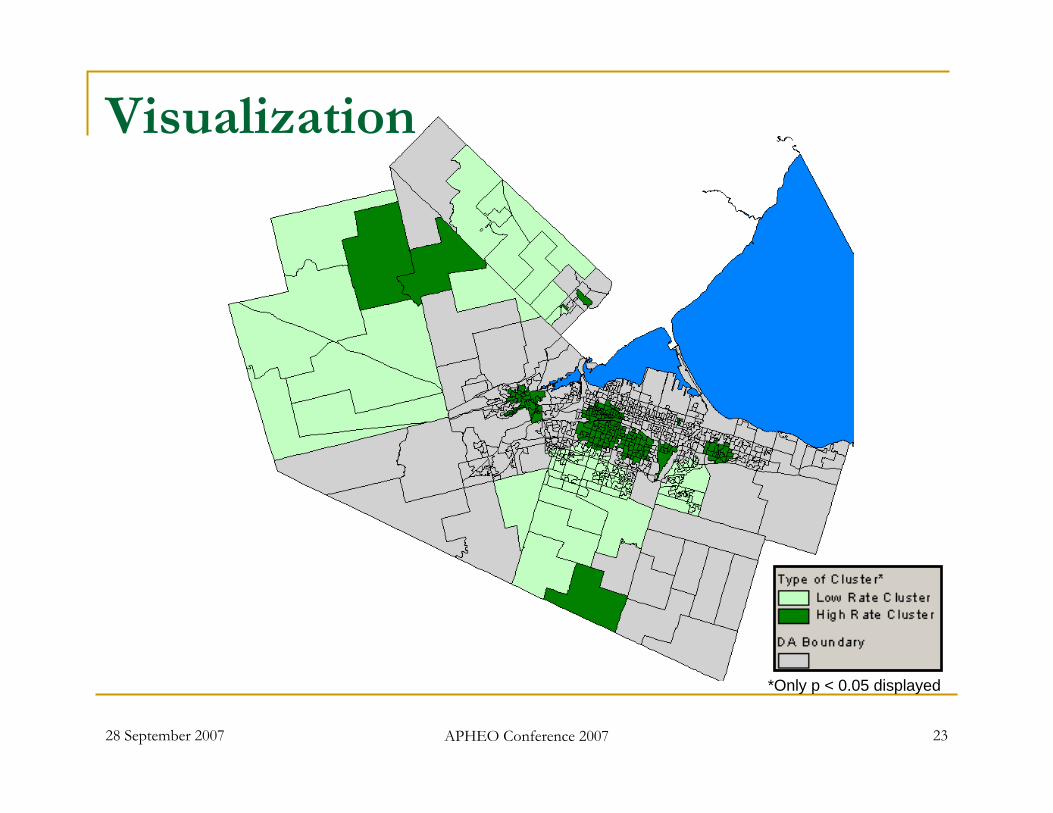
Visualization
*Only p < 0.05 displayed
28 September 2007 APHEO Conference 2007 24
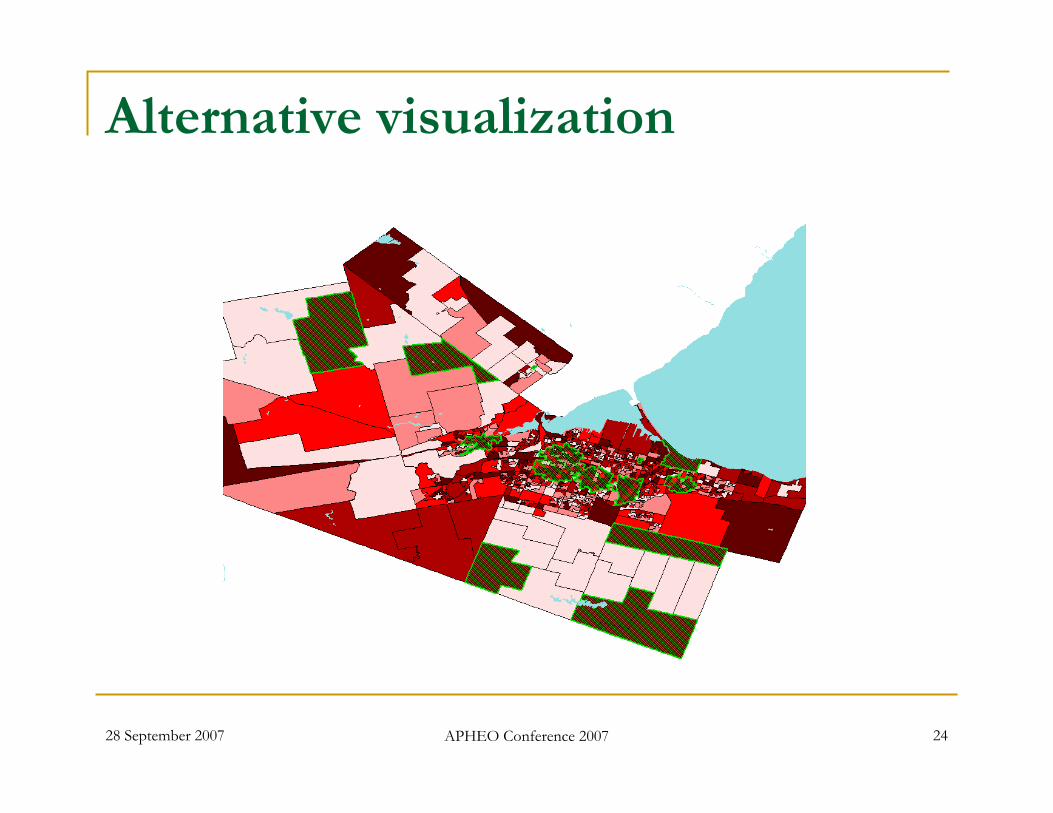
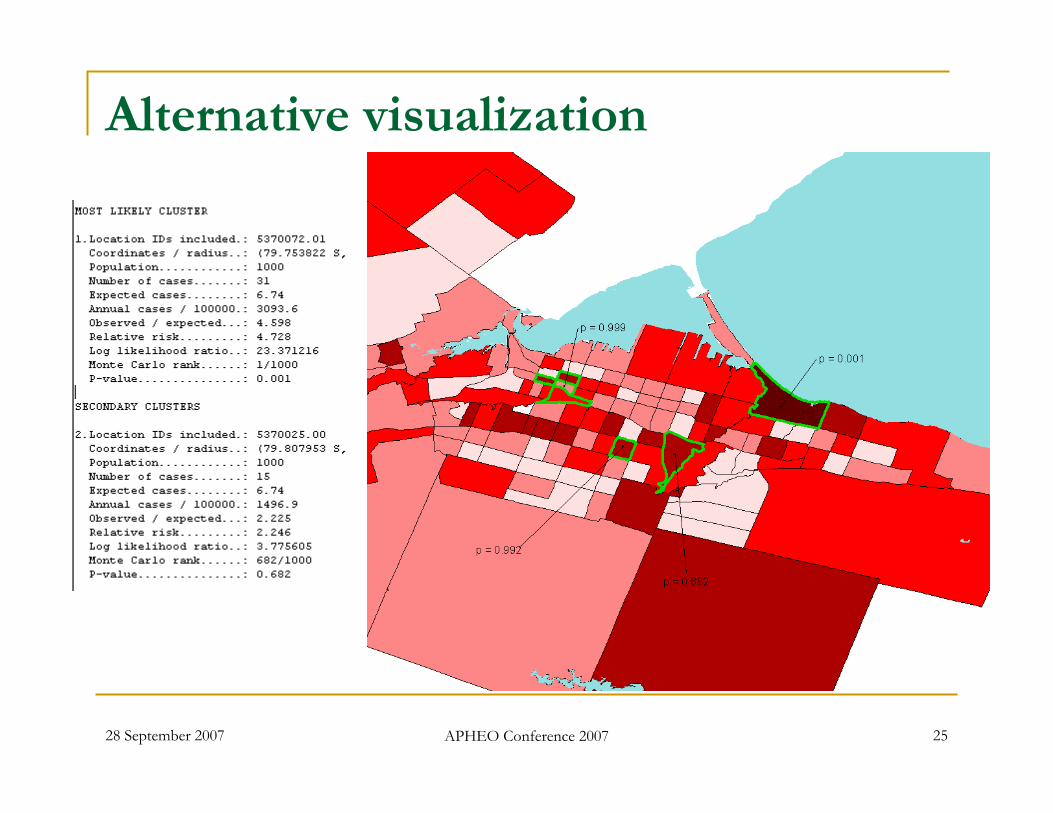
Alternative visualization
28 September 2007 APHEO Conference 2007 25
Alternative visualization
28 September 2007 APHEO Conference 2007 26
Bernoulli models
Bernoulli process is a discrete-time stochastic process based on Bernoulli trials
An experiment whose outcome is random and can be either of two possible outcomes, “success” and “failure”Values expressed as 0 or 1 (non-cases or cases)
28 September 2007 APHEO Conference 2007 27
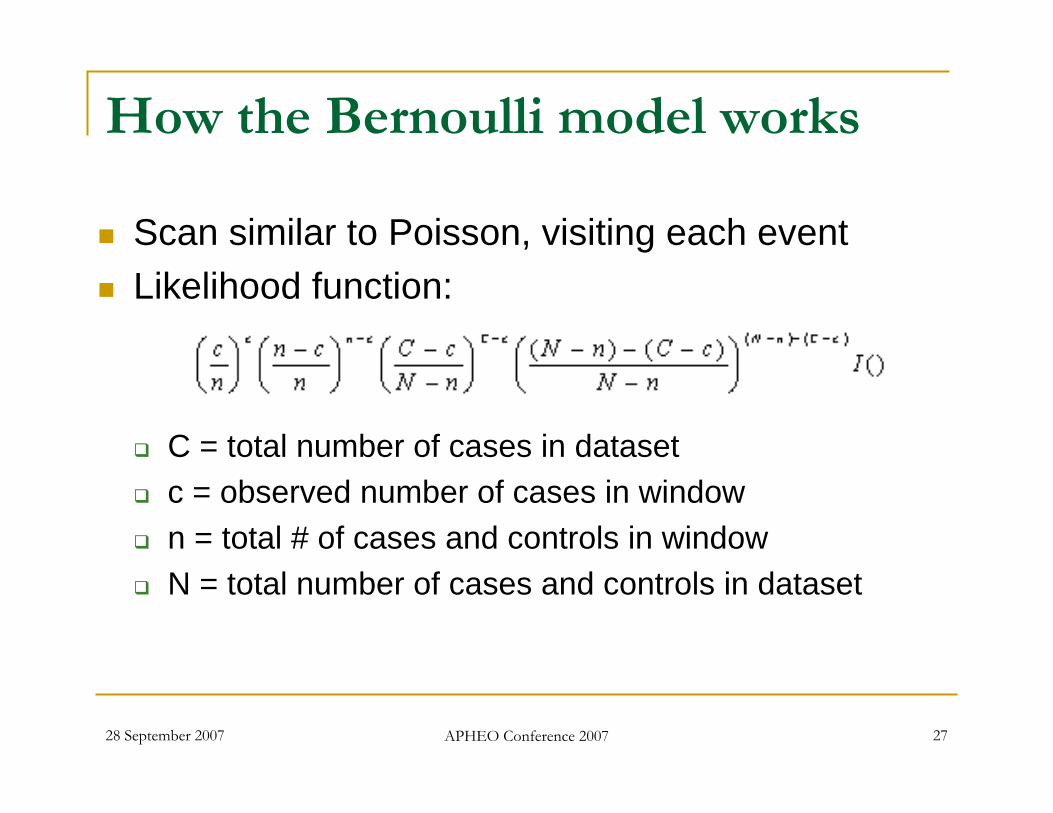
Scan similar to Poisson, visiting each eventLikelihood function:
C = total number of cases in datasetc = observed number of cases in windown = total # of cases and controls in windowN = total number of cases and controls in dataset
How the Bernoulli model works
28 September 2007 APHEO Conference 2007 28
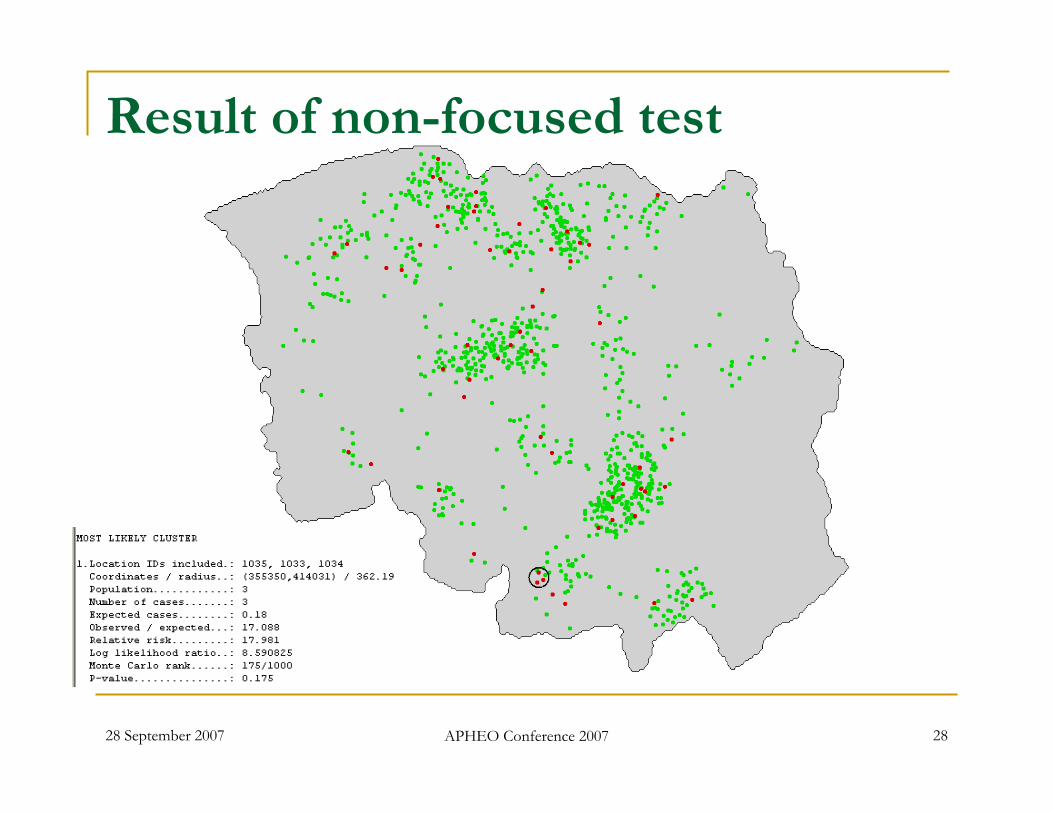
Result of non-focused test
28 September 2007 APHEO Conference 2007 29
Focused tests
Focused tests can be conducted by providing the coordinates of one or more point sources. In these instances, the scan will only evaluate clusters around these sources and bypass the rest of the coordinates
28 September 2007 APHEO Conference 2007 30
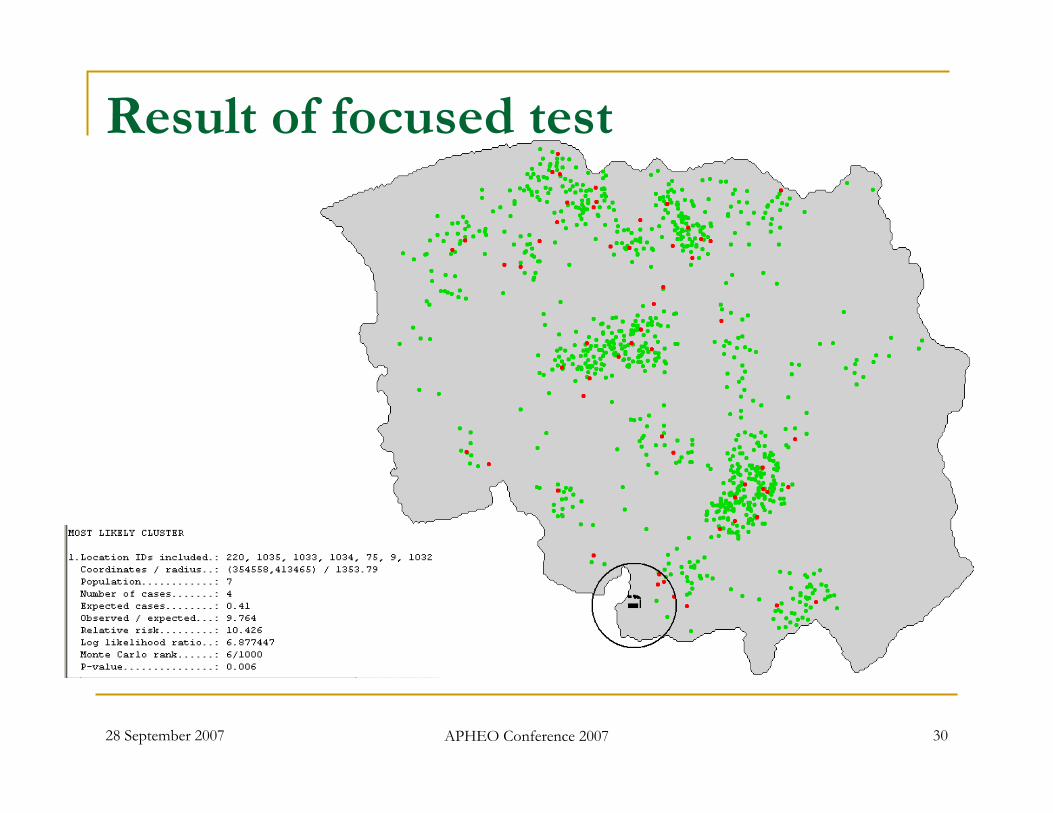
Result of focused test
28 September 2007 APHEO Conference 2007 31
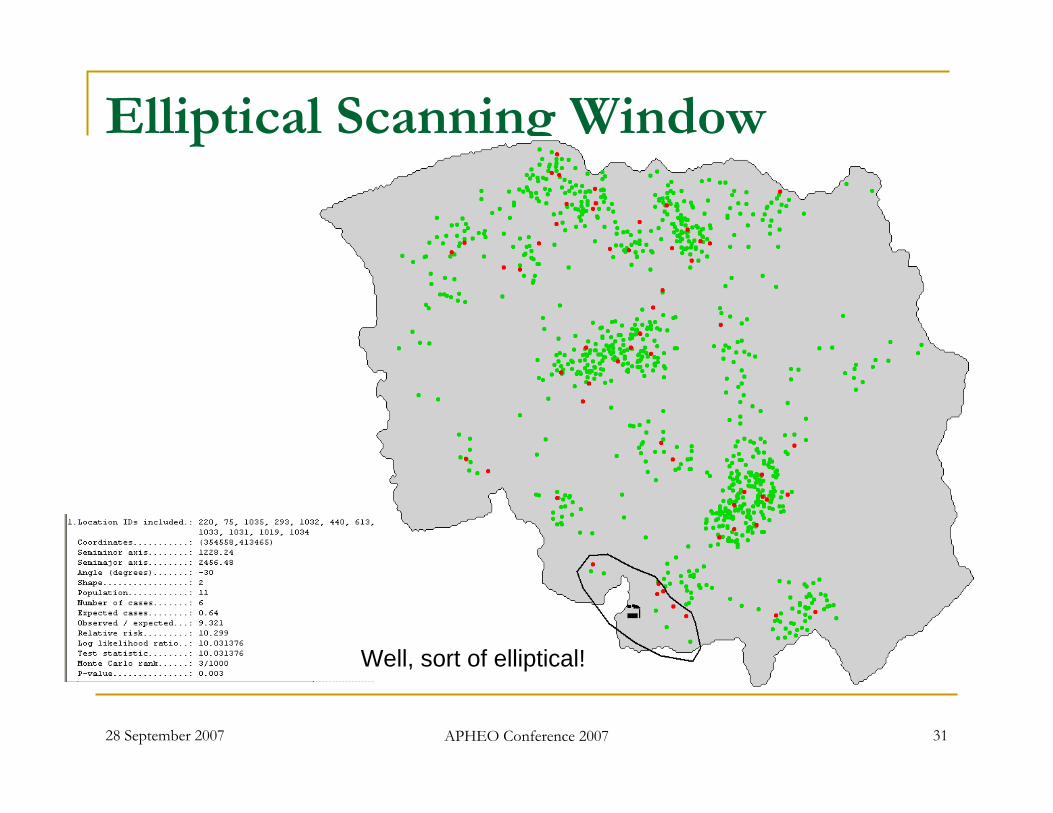
Elliptical Scanning Window
Well, sort of elliptical!
Case Study(Suppressed)
QUESTIONS?