Embed Size (px)
Citation preview
7/29/2019 Cluster Analysis Tutorial
http://slidepdf.com/reader/full/cluster-analysis-tutorial 1/42
SPSS Tutorial
AEB 37 / AE 802
Marketing Research MethodsWeek 7

7/29/2019 Cluster Analysis Tutorial
http://slidepdf.com/reader/full/cluster-analysis-tutorial 2/42
Cluster analysis
Lecture / Tutorial outline
• Cluster analysis
• Example of cluster analysis
• Work on the assignment
7/29/2019 Cluster Analysis Tutorial
http://slidepdf.com/reader/full/cluster-analysis-tutorial 3/42
Cluster Analysis
• It is a class of techniques used to
classify cases into groups that are
relatively homogeneous withinthemselves and heterogeneous
between each other, on the basis of
a defined set of variables. Thesegroups are called clusters.

7/29/2019 Cluster Analysis Tutorial
http://slidepdf.com/reader/full/cluster-analysis-tutorial 4/42
Cluster Analysis and
marketing research• Market segmentation. E.g. clustering of consumers according to their attributepreferences
• Understanding buyers behaviours.Consumers with similarbehaviours/characteristics are clustered
• Identifying new product opportunities.
Clusters of similar brands/products can helpidentifying competitors / market opportunities
• Reducing data. E.g. in preference mapping

7/29/2019 Cluster Analysis Tutorial
http://slidepdf.com/reader/full/cluster-analysis-tutorial 5/42
Steps to conduct a Cluster
Analysis1. Select a distance measure
2. Select a clustering algorithm
3. Determine the number of clusters
4. Validate the analysis

7/29/2019 Cluster Analysis Tutorial
http://slidepdf.com/reader/full/cluster-analysis-tutorial 6/42
REGR factor score 2 for analysis 1
43210-1-2-3
3
2
1
0
-1
-2
-3
-4

7/29/2019 Cluster Analysis Tutorial
http://slidepdf.com/reader/full/cluster-analysis-tutorial 7/42
Defining distance: the
Euclidean distance
Dij distance between cases i and j
x ki value of variable X k for case j
Problems:
• Different measures = different weights• Correlation between variables (double
counting)
Solution: Principal component analysis
2
1
n
ij ki kj
k
D x x

7/29/2019 Cluster Analysis Tutorial
http://slidepdf.com/reader/full/cluster-analysis-tutorial 8/42
Clustering procedures
• Hierarchical procedures
– Agglomerative (start from n clusters,
to get to 1 cluster) – Divisive (start from 1 cluster, to get to
n cluster)
• Non hierarchical procedures – K-means clustering

7/29/2019 Cluster Analysis Tutorial
http://slidepdf.com/reader/full/cluster-analysis-tutorial 9/42
Agglomerative clustering

7/29/2019 Cluster Analysis Tutorial
http://slidepdf.com/reader/full/cluster-analysis-tutorial 10/42
Agglomerative clustering
• Linkage methods – Single linkage (minimum distance)
– Complete linkage (maximum distance)
– Average linkage• Ward’s method
1. Compute sum of squared distances within clusters
2. Aggregate clusters with the minimum increase in theoverall sum of squares
• Centroid method – The distance between two clusters is defined as the
difference between the centroids (cluster averages)

7/29/2019 Cluster Analysis Tutorial
http://slidepdf.com/reader/full/cluster-analysis-tutorial 11/42
K-means clustering1. The number k of cluster is fixed2. An initial set of k “seeds” (aggregation centres) is
provided• First k elements
• Other seeds
3. Given a certain treshold, all units are assigned tothe nearest cluster seed
4. New seeds are computed
5. Go back to step 3 until no reclassification is
necessary
Units can be reassigned in successive steps ( optimising partioning )

7/29/2019 Cluster Analysis Tutorial
http://slidepdf.com/reader/full/cluster-analysis-tutorial 12/42
Hierarchical vs Non
hierarchical methodsHierarchical
clustering
• No decision about thenumber of clusters
• Problems when datacontain a high level of error
• Can be very slow• Initial decision are
more influential (one-step only)
Non hierarchical
clustering
• Faster, more reliable
• Need to specify the
number of clusters
(arbitrary)
• Need to set the initialseeds (arbitrary)

7/29/2019 Cluster Analysis Tutorial
http://slidepdf.com/reader/full/cluster-analysis-tutorial 13/42
Suggested approach
1. First perform a hierarchical
method to define the number of
clusters2. Then use the k -means procedure
to actually form the clusters

7/29/2019 Cluster Analysis Tutorial
http://slidepdf.com/reader/full/cluster-analysis-tutorial 14/42
Defining the number of
clusters: elbow rule (1)Agglomeration Schedule
4 7 .015 0 0 4
6 10 .708 0 0 5
8 9 .974 0 0 4
4 8 1.042 1 3 6
1 6 1.100 0 2 7
4 5 3.680 4 0 71 4 3.492 5 6 8
1 11 6.744 7 0 9
1 2 8.276 8 0 10
1 12 8.787 9 0 11
1 3 11.403 10 0 0
Stage1
2
3
4
5
67
8
9
10
11
Cluster 1 Cluster 2
Cluster Combined
Coefficients Cluster 1 Cluster 2
Stage Cluster First
Appears
Next Stage
Stage Number of cluster
0 12
1 11
2 10
3 9
4 8
5 7
6 6
7 5
8 4
9 3
10 2
11 1
n

7/29/2019 Cluster Analysis Tutorial
http://slidepdf.com/reader/full/cluster-analysis-tutorial 15/42
Elbow rule (2): the scree
diagram
0
2
4
6
8
10
12
11 10 9 8 7 6 5 4 3 2 1
Number of clusters
D i s t a n c e

7/29/2019 Cluster Analysis Tutorial
http://slidepdf.com/reader/full/cluster-analysis-tutorial 16/42
Validating the analysis
• Impact of initial seeds / order of
cases
• Impact of the selected method
• Consider the relevance of the
chosen set of variables

7/29/2019 Cluster Analysis Tutorial
http://slidepdf.com/reader/full/cluster-analysis-tutorial 17/42
SPSS Example

7/29/2019 Cluster Analysis Tutorial
http://slidepdf.com/reader/full/cluster-analysis-tutorial 18/42
Component1
2.01.51.0.50.0-.5-1.0-1.5
1.5
1.0
.5
0.0
-.5
-1.0
-1.5
-2.0
LUCY
JULIA
FRED
ARTHUR
JENNIFER
THOMAS
MATTHEW
NICOLE
PAMELAJOHN

7/29/2019 Cluster Analysis Tutorial
http://slidepdf.com/reader/full/cluster-analysis-tutorial 19/42
Agglomeration Schedule
3 6 .026 0 0 8
2 5 .078 0 0 7
4 9 .224 0 0 5
1 7 .409 0 0 6
4 10 .849 3 0 8
1 8 1.456 4 0 7
1 2 4.503 6 2 9
3 4 9.878 1 5 9
1 3 18.000 7 8 0
Stage
1
2
3
4
5
6
7
8
9
Cluster 1 Cluster 2
Cluster Combined
Coefficients Cluster 1 Cluster 2
Stage Cluster First
Appears
Next Stage
Number of clusters: 10 – 6 = 4

7/29/2019 Cluster Analysis Tutorial
http://slidepdf.com/reader/full/cluster-analysis-tutorial 20/42
Component1
2.01.51.0.50.0-.5-1.0-1.5
1.5
1.0
.5
0.0
-.5
-1.0
-1.5
-2.0
Cluster Number of Ca
4
3
2
1
LUCY
JULIA
FRED
ARTHUR
JENNIFER
THOMAS
MATTHEW
NICOLE
PAMELA
JOHN

7/29/2019 Cluster Analysis Tutorial
http://slidepdf.com/reader/full/cluster-analysis-tutorial 21/42
Open the dataset
supermarkets.savFrom your N: directory (if you saved it
there last time
Or download it from:http://www.rdg.ac.uk/~aes02mm/
supermarket.sav
• Open it in SPSS

7/29/2019 Cluster Analysis Tutorial
http://slidepdf.com/reader/full/cluster-analysis-tutorial 22/42
The supermarkets.sav
dataset

7/29/2019 Cluster Analysis Tutorial
http://slidepdf.com/reader/full/cluster-analysis-tutorial 23/42
Run Principal Components
Analysis and save scores• Select the variables to perform the
analysis
• Set the rule to extract principalcomponents
• Give instruction to save the
principal components as newvariables

7/29/2019 Cluster Analysis Tutorial
http://slidepdf.com/reader/full/cluster-analysis-tutorial 24/42
Cluster analysis: basic
steps• Apply Ward‟s methods on the
principal components score
• Check the agglomeration schedule
• Decide the number of clusters
• Apply the k -means method

7/29/2019 Cluster Analysis Tutorial
http://slidepdf.com/reader/full/cluster-analysis-tutorial 25/42
Analyse / Classify

7/29/2019 Cluster Analysis Tutorial
http://slidepdf.com/reader/full/cluster-analysis-tutorial 26/42
Select the component scores
Select from here Untick this

7/29/2019 Cluster Analysis Tutorial
http://slidepdf.com/reader/full/cluster-analysis-tutorial 27/42
Select Ward’s algorithm
Click here
first
Select
method here

7/29/2019 Cluster Analysis Tutorial
http://slidepdf.com/reader/full/cluster-analysis-tutorial 28/42
Output: Agglomeration schedule

7/29/2019 Cluster Analysis Tutorial
http://slidepdf.com/reader/full/cluster-analysis-tutorial 29/42
Number of clustersIdentify the step where the “distance coefficients” makes a bigger
jump
7/29/2019 Cluster Analysis Tutorial
http://slidepdf.com/reader/full/cluster-analysis-tutorial 30/42
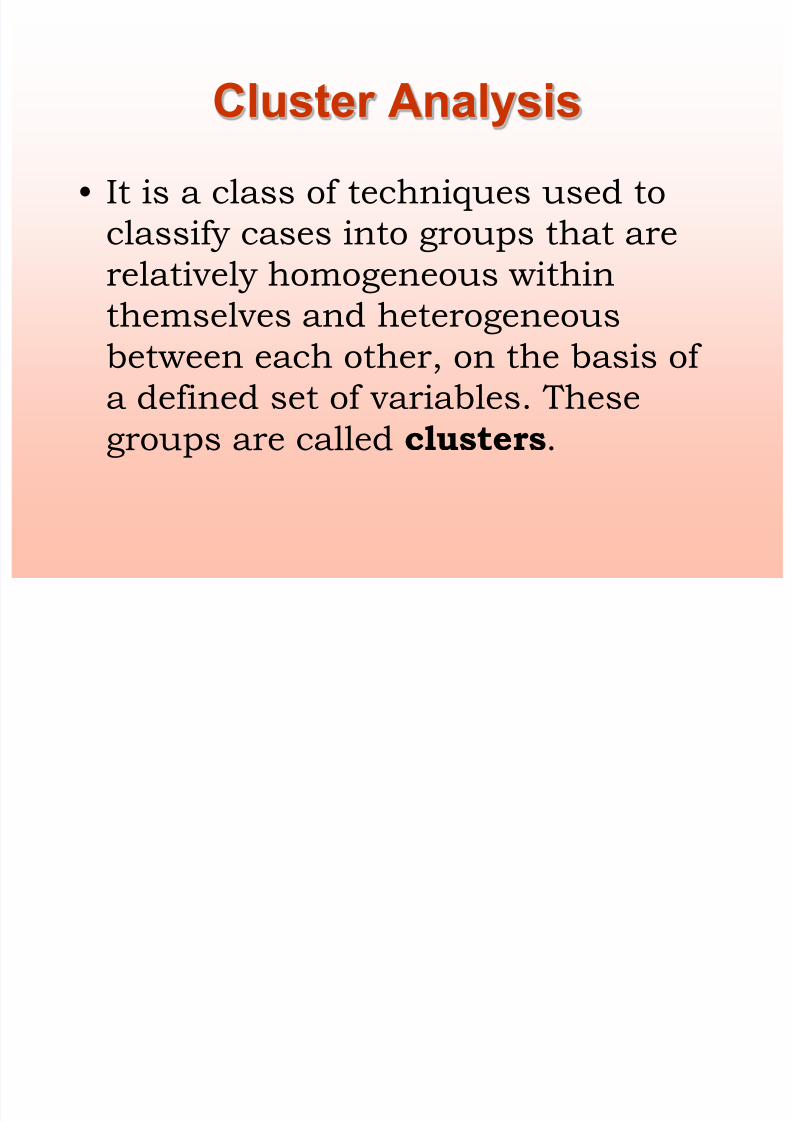
The scree diagram (Excel
needed)
Distance
0
100
200
300
400
500
600
700
800
1 1 8
1 2 0
1 2 2
1 2 4
1 2 6
1 2 8
1 3 0
1 3 2
1 3 4
1 3 6
1 3 8
1 4 0
1 4 2
1 4 4
1 4 6
1 4 8
Step

7/29/2019 Cluster Analysis Tutorial
http://slidepdf.com/reader/full/cluster-analysis-tutorial 31/42
Number of clusters
Number of cases 150
Step of „elbow‟ 144
__________________________________
Number of clusters 6

7/29/2019 Cluster Analysis Tutorial
http://slidepdf.com/reader/full/cluster-analysis-tutorial 32/42
Now repeat the analysis
• Choose the k -means technique
• Set 6 as the number of clusters
• Save cluster number for each case
• Run the analysis

7/29/2019 Cluster Analysis Tutorial
http://slidepdf.com/reader/full/cluster-analysis-tutorial 33/42
K-means

7/29/2019 Cluster Analysis Tutorial
http://slidepdf.com/reader/full/cluster-analysis-tutorial 34/42
K-means dialog box
Specify
number of
clusters

7/29/2019 Cluster Analysis Tutorial
http://slidepdf.com/reader/full/cluster-analysis-tutorial 35/42
Save cluster membership
Click here
first Thick here
Fi l t t
7/29/2019 Cluster Analysis Tutorial
http://slidepdf.com/reader/full/cluster-analysis-tutorial 36/42
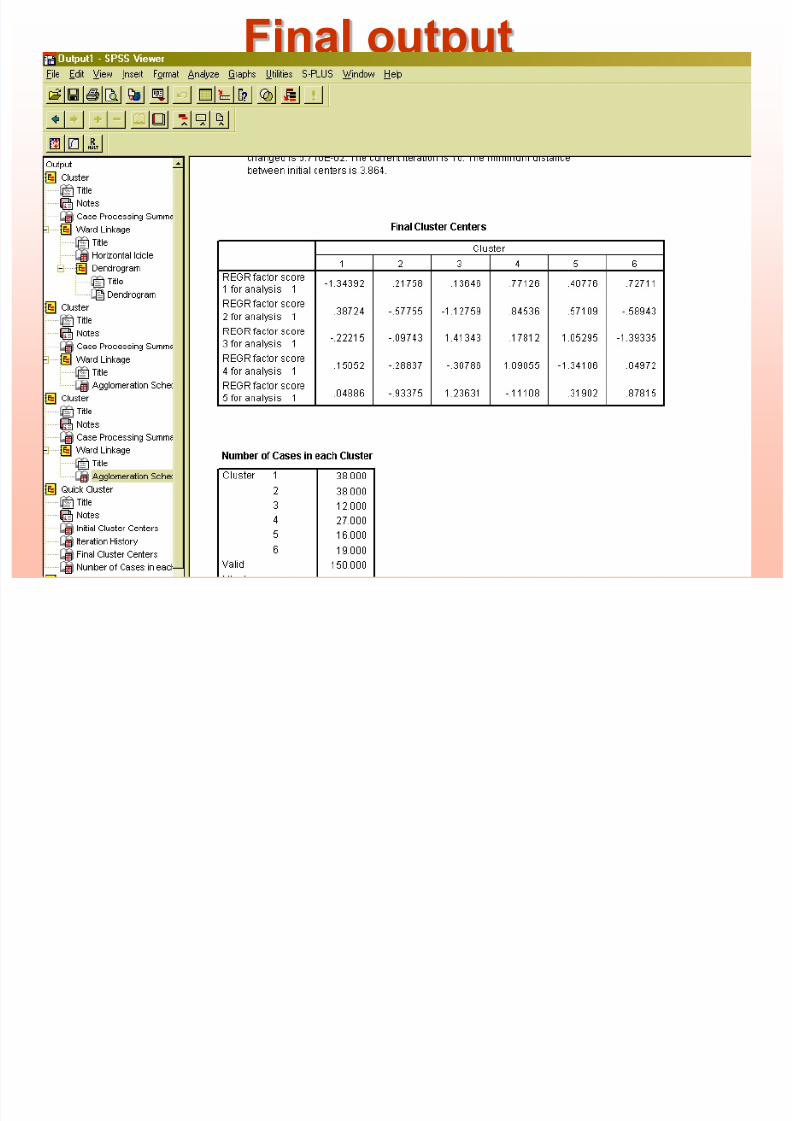
Final output

7/29/2019 Cluster Analysis Tutorial
http://slidepdf.com/reader/full/cluster-analysis-tutorial 37/42
Cluster membership
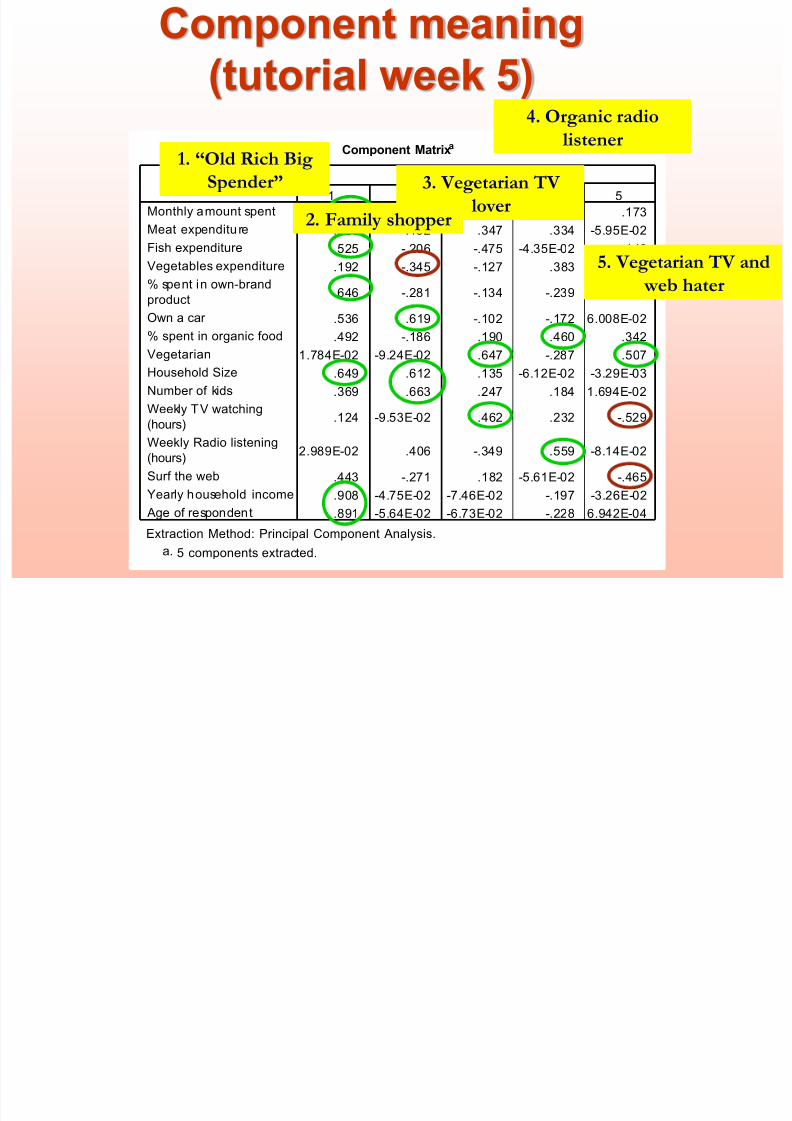
Component meaning
7/29/2019 Cluster Analysis Tutorial
http://slidepdf.com/reader/full/cluster-analysis-tutorial 38/42
Component Matrixa
.810 -.294 -4.26E-02 .183 .173
.480 -.152 .347 .334 -5.95E-02
.525 -.206 -.475 -4.35E-02 .140
.192 -.345 -.127 .383 .199
.646 -.281 -.134 -.239 -.207
.536 .619 -.102 -.172 6.008E-02
.492 -.186 .190 .460 .342
1.784E-02 -9.24E-02 .647 -.287 .507
.649 .612 .135 -6.12E-02 -3.29E-03
.369 .663 .247 .184 1.694E-02
.124 -9.53E-02 .462 .232 -.529
2.989E-02 .406 -.349 .559 -8.14E-02
.443 -.271 .182 -5.61E-02 -.465
.908 -4.75E-02 -7.46E-02 -.197 -3.26E-02
.891 -5.64E-02 -6.73E-02 -.228 6.942E-04
Monthly amount spent
Meat expenditu re
Fish expenditure
Vegetables expenditure
% spent in own-brand
product
Own a car
% spent in organic food
Vegetarian
Household Size
Number of kids
Weekly TV watching(hours)
Weekly Radio listening
(hours)
Surf the web
Yearly household income
Age of respondent
1 2 3 4 5
Component
Extraction Method: Principal Component Analysis.
5 components extracted.a.
Component meaning
(tutorial week 5)
1. “Old Rich Big
Spender” 3. Vegetarian TV
lover
4. Organic radio
listener
2. Family shopper
5. Vegetarian TV and
web hater

7/29/2019 Cluster Analysis Tutorial
http://slidepdf.com/reader/full/cluster-analysis-tutorial 39/42
Final Cluster Centers
-1.34392 .21758 .13646 .77126 .40776 .72711
.38724 -.57755 -1.12759 .84536 .57109 -.58943
-.22215 -.09743 1.41343 .17812 1.05295 -1.39335
.15052 -.28837 -.30786 1.09055 -1.34106 .04972
.04886 -.93375 1.23631 -.11108 .31902 .87815
REGR factor score
1 for analysis 1
REGR factor score
2 for analysis 1
REGR factor score
3 for analysis 1
REGR factor score
4 for analysis 1
REGR factor score
5 for analysis 1
1 2 3 4 5 6Cluster
Cl i i h h

7/29/2019 Cluster Analysis Tutorial
http://slidepdf.com/reader/full/cluster-analysis-tutorial 40/42
Cluster interpretation through mean
component values
• Cluster 1 is very far from profile 1 (-1.34) andmore similar to profile 2 (0.38)
• Cluster 2 is very far from profile 5 (-0.93) andnot particularly similar to any profile
• Cluster 3 is extremely similar to profiles 3 and 5and very far from profile 2
• Cluster 4 is similar to profiles 2 and 4
• Cluster 5 is very similar to profile 3 and very far
from profile 4• Cluster 6 is very similar to profile 5 and very far
from profile 3
7/29/2019 Cluster Analysis Tutorial
http://slidepdf.com/reader/full/cluster-analysis-tutorial 41/42
Which cluster to target?
• Objective: target the organic
consumer
• Which is the cluster that looks more“organic”?
• Compute the descriptive statistics
on the original variables for thatcluster

7/29/2019 Cluster Analysis Tutorial
http://slidepdf.com/reader/full/cluster-analysis-tutorial 42/42
Representation of factors 1 and 4(and cluster membership)
REGR factor score 1 for analysis 1
210-1-2-3
3
2
1
0
-1
-2
-3
Cluster Number of Ca
6
5
4
3
2
1