Embed Size (px)
Citation preview
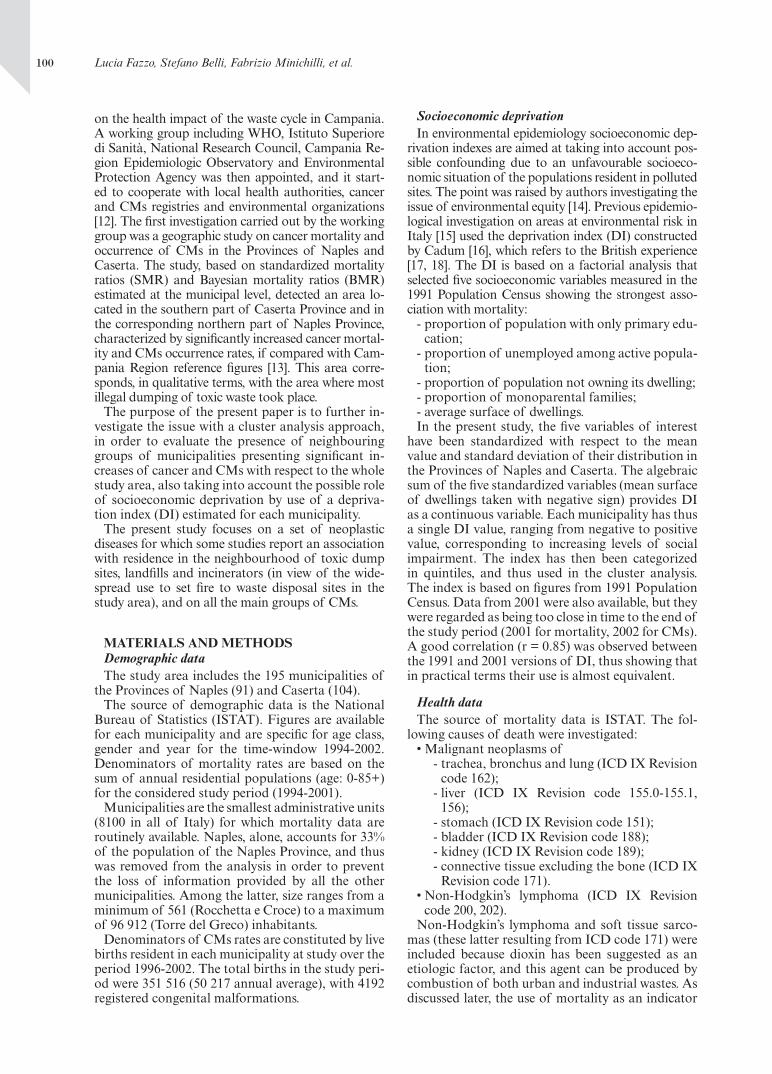
99Ann Ist super sAnItà 2008 | Vol. 44, no. 1: 99-111
re
seA
rc
h f
ro
m A
nIm
Al t
est
Ing
to
cl
InIc
Al e
xp
er
Ien
ce
Summary. The possible adverse health effects associated with the residence in the neighbourhood of toxic dump sites have been the object of many epidemiological studies in the last two decades; some of these reported increases of various health outcomes. The present study reports the cluster analysis of mortality and malformations at municipality level, standardized by socioeconomic dep-rivation index, in an area of the Campania Region characterized by a widespread illegal practice of dumping toxic and urban waste. Clusters have been observed with significant excess of mortality by lung, liver, gastric, kidney and bladder cancers and of prevalence of total malformations and malformations of limb, cardiovascular and urogenital system. The clusters are concentrated in a sub-area where most of the illegal practice of dumping toxic waste has taken place.
Key words: cluster, mortality, malformations, toxic waste. Riassunto (Analisi dei cluster di mortalità e malformazioni congenite nelle province di Napoli e Caserta, regione Campania). I possibili effetti sanitari associati alla residenza in prossimità di siti di smalti-mento di rifiuti tossici sono stati oggetto di diverse indagini epidemiologiche, alcune delle quali han-no riportato incrementi di patologie. Il presente studio illustra le analisi dei cluster della mortalità e delle malformazioni congenite a livello comunale, svolte in un’area della Campania caratterizzata da siti di smaltimento illegale di rifiuti tossici e urbani. Sono stati evidenziati cluster con eccessi signi-ficativi della mortalità per tumore del polmone, fegato, stomaco, rene e vescica e di prevalenza delle malformazioni congenite totali, degli arti, del sistema cardiovascolare e dell’apparato urogenitale. I cluster sono concentrati in una sub-area a cavallo delle due province nella quale sono più numerosi i siti di smaltimento illegale dei rifiuti tossici.
Parole chiave: cluster, mortalità, malformazioni congenite, rifiuti tossici.
Cluster analysis of mortality and malformations in the Provinces
of Naples and Caserta (Campania Region)Lucia Fazzo(a), Stefano Belli(a), Fabrizio Minichilli(b), Francesco Mitis(c), Michele Santoro(d), Lucia Martina(d), Renato Pizzuti(d), Pietro Comba(a),
Marco Martuzzi(c), Fabrizio Bianchi(b) and the Working Group(*)
(a)Dipartimento di Ambiente e Connessa Prevenzione Primaria, Istituto Superiore di Sanità, Rome, Italy(b) Istituto di Fisiologia Clinica,Consiglio Nazionale delle Ricerche, Pisa, Italy
(c)European Centre for Environment and Health,World Health Organization, Rome, Italy(d)Osservatorio Epidemiologico Regione Campania, Naples, Italy
INTRODUCTIONThe issue of possible adverse health effects associ-
ated with residence in the neighbourhood of toxic waste dump sites has been the object of a number of epidemiological studies performed in different countries in the last two decades; several studies re-port increased risks of cancer, congenital malforma-tions (CMs) and other diseases, but no causal link has been so far adequately assessed [1-5]. A recent WHO workshop [6] stated that the evidence so far available of health risks in the neighbourhood of waste dumping sites deserves attention even if a causal link has not yet been proven.
A widespread illegal practice of dumping or burn-
ing toxic and industrial wastes, as well as solid ur-ban waste, took place since the ’80s in an area of Campania Region located North of Naples and South of Caserta (for a recent review, [7]). The awareness of this problem dates back to the mid Nineties prompting some early exploratory studies aimed at estimating:
- its possible health impact [8, 9], and - some methodological discussion on how to prop-
erly investigate such a complex issue [10, 11].In this frame, in 2004, the Department of Civil De-
fence of the Italian Government requested the World Health Organization – European Centre for Environ-ment and Health – to conduct an epidemiological study
(*)The members of the Working Group are listed before the References.
Address for correspondence: Lucia Fazzo, Dipartimento di Ambiente e Connessa Prevenzione Primaria, Istituto Superiore di Sanità, Viale Regina Elena 299, 00161 Rome, Italy. E-mail: [email protected].
100 Lucia Fazzo, Stefano Belli, Fabrizio Minichilli, et al.
on the health impact of the waste cycle in Campania. A working group including WHO, Istituto Superiore di Sanità, National Research Council, Campania Re-gion Epidemiologic Observatory and Environmental Protection Agency was then appointed, and it start-ed to cooperate with local health authorities, cancer and CMs registries and environmental organizations [12]. The first investigation carried out by the working group was a geographic study on cancer mortality and occurrence of CMs in the Provinces of Naples and Caserta. The study, based on standardized mortality ratios (SMR) and Bayesian mortality ratios (BMR) estimated at the municipal level, detected an area lo-cated in the southern part of Caserta Province and in the corresponding northern part of Naples Province, characterized by significantly increased cancer mortal-ity and CMs occurrence rates, if compared with Cam-pania Region reference figures [13]. This area corre-sponds, in qualitative terms, with the area where most illegal dumping of toxic waste took place.
The purpose of the present paper is to further in-vestigate the issue with a cluster analysis approach, in order to evaluate the presence of neighbouring groups of municipalities presenting significant in-creases of cancer and CMs with respect to the whole study area, also taking into account the possible role of socioeconomic deprivation by use of a depriva-tion index (DI) estimated for each municipality.
The present study focuses on a set of neoplastic diseases for which some studies report an association with residence in the neighbourhood of toxic dump sites, landfills and incinerators (in view of the wide-spread use to set fire to waste disposal sites in the study area), and on all the main groups of CMs.
MATERIALS AND METHODSDemographic data The study area includes the 195 municipalities of
the Provinces of Naples (91) and Caserta (104).The source of demographic data is the National
Bureau of Statistics (ISTAT). Figures are available for each municipality and are specific for age class, gender and year for the time-window 1994-2002. Denominators of mortality rates are based on the sum of annual residential populations (age: 0-85+) for the considered study period (1994-2001).
Municipalities are the smallest administrative units (8100 in all of Italy) for which mortality data are routinely available. Naples, alone, accounts for 33% of the population of the Naples Province, and thus was removed from the analysis in order to prevent the loss of information provided by all the other municipalities. Among the latter, size ranges from a minimum of 561 (Rocchetta e Croce) to a maximum of 96 912 (Torre del Greco) inhabitants.
Denominators of CMs rates are constituted by live births resident in each municipality at study over the period 1996-2002. The total births in the study peri-od were 351 516 (50 217 annual average), with 4192 registered congenital malformations.
Socioeconomic deprivation In environmental epidemiology socioeconomic dep-
rivation indexes are aimed at taking into account pos-sible confounding due to an unfavourable socioeco-nomic situation of the populations resident in polluted sites. The point was raised by authors investigating the issue of environmental equity [14]. Previous epidemio-logical investigation on areas at environmental risk in Italy [15] used the deprivation index (DI) constructed by Cadum [16], which refers to the British experience [17, 18]. The DI is based on a factorial analysis that selected five socioeconomic variables measured in the 1991 Population Census showing the strongest asso-ciation with mortality:
- proportion of population with only primary edu-cation;
- proportion of unemployed among active popula-tion;
- proportion of population not owning its dwelling;- proportion of monoparental families;- average surface of dwellings.In the present study, the five variables of interest
have been standardized with respect to the mean value and standard deviation of their distribution in the Provinces of Naples and Caserta. The algebraic sum of the five standardized variables (mean surface of dwellings taken with negative sign) provides DI as a continuous variable. Each municipality has thus a single DI value, ranging from negative to positive value, corresponding to increasing levels of social impairment. The index has then been categorized in quintiles, and thus used in the cluster analysis. The index is based on figures from 1991 Population Census. Data from 2001 were also available, but they were regarded as being too close in time to the end of the study period (2001 for mortality, 2002 for CMs). A good correlation (r = 0.85) was observed between the 1991 and 2001 versions of DI, thus showing that in practical terms their use is almost equivalent.
Health data The source of mortality data is ISTAT. The fol-
lowing causes of death were investigated:• Malignant neoplasms of - trachea, bronchus and lung (ICD IX Revision
code 162); - liver (ICD IX Revision code 155.0-155.1,
156); - stomach (ICD IX Revision code 151); - bladder (ICD IX Revision code 188); - kidney (ICD IX Revision code 189); - connective tissue excluding the bone (ICD IX
Revision code 171).• Non-Hodgkin’s lymphoma (ICD IX Revision
code 200, 202).Non-Hodgkin’s lymphoma and soft tissue sarco-
mas (these latter resulting from ICD code 171) were included because dioxin has been suggested as an etiologic factor, and this agent can be produced by combustion of both urban and industrial wastes. As discussed later, the use of mortality as an indicator
101mortAlIty And mAlformAtIons In cAmpAnIA
of the occurrence of these neoplasms is not entirely satisfactory. They have been included, though, be-cause any major departure of observed from ex-pected figures would have pointed to an underlying actual increase in incidence.
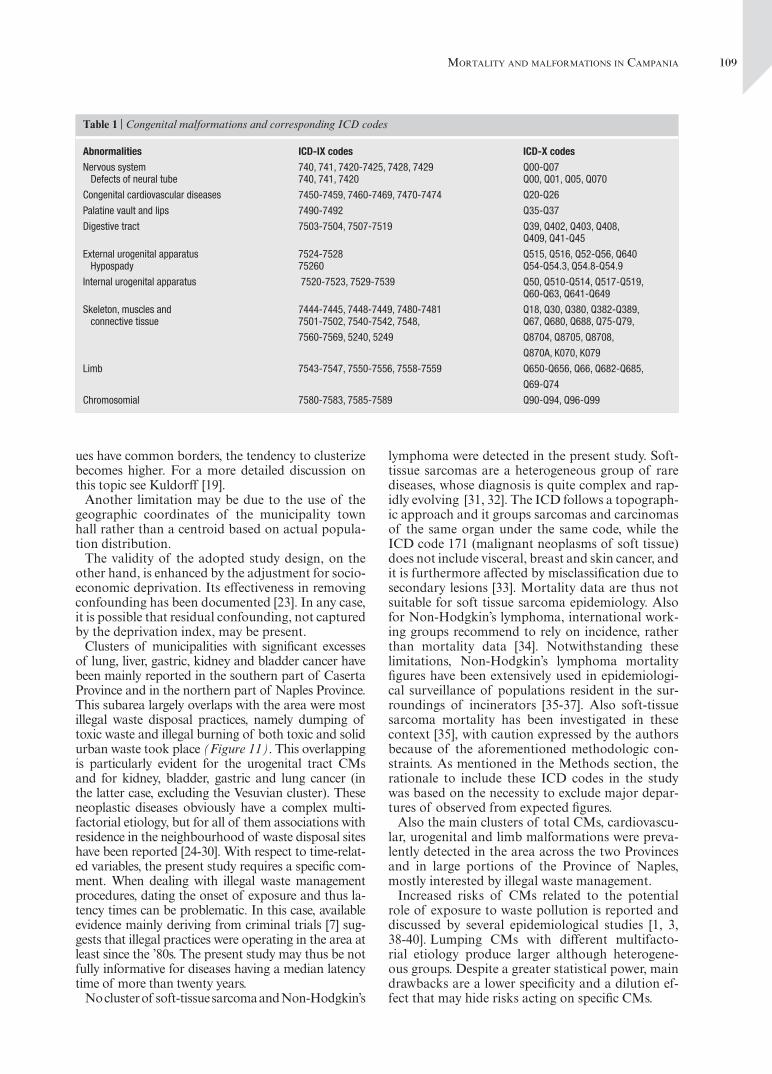
The source of data on CMs is the Campania Region Registry of Birth Defects with reference to the Prov-inces of Naples and Caserta, 1996-2002. The CMs object of the present study, with the corresponding ICD IX and ICD X codes (WHO, 1992-1994) are listed in Table 1. The case list includes:
• induced abortions subsequent to prenatal diag-noses of CMs through 24th week of pregnancy;
• fetal deaths since 20th week of pregnancy; • live births for which CMs were ascertained both
at birth or in the postnatal period. Cluster analysis usually investigates spatial aggrega-
tion of individual cases. In geographic mortality studies based on municipality data, like the present one, clusters are defined as sums of cases resident in neighbouring municipalities significantly exceeding expected figures. The latter are computed by indirect standardization using mortality rates of the population resident in the Provinces of Naples and Caserta, with the exclusion of Naples (for the reasons described above).
Cluster analysis was performed according to the procedure Spatial Scan Statistics [19]. The number of cases in each municipality is assumed to follow a Poisson distribution. The procedure employs a circu-lar window of varying radius that moves on the whole study area. The window is centred at each step on one
of the municipalities, identified by the x, y coordinates of its townhall. The radius is calculated as the distance between the different townhalls; it varies from 0 (when-ever a single municipality is included in the cluster) to a fixed maximum (10 km). The procedure identifies for each municipality the circular area with the maxi-mum excess of cases (maximum value of standardized mortality/morbidity ratio) and selects all those show-ing significant departures from expected values based on likelyhood ratio test (LRT). Significance levels were fixed at p < 0.05 (LRT > 7.16).
Both cluster analyses (mortality and CMs) were standardized for DI; mortality analyses were also age standardized and performed both separately for each gender and in the overall population.
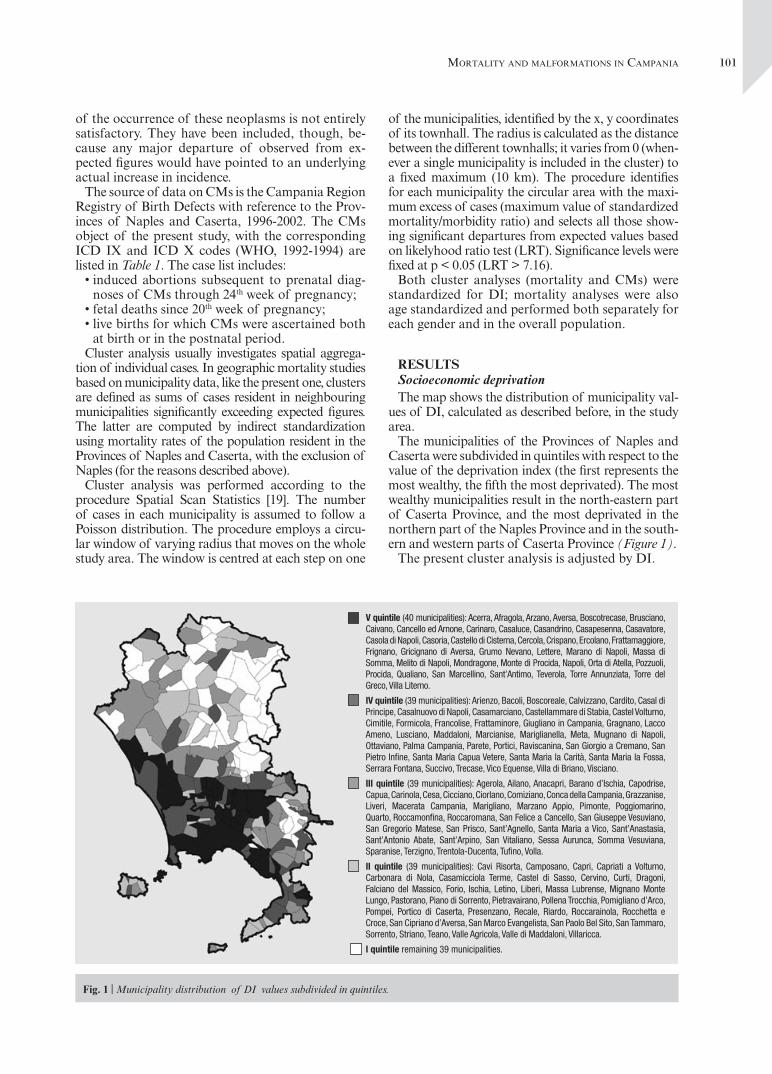
RESULTSSocioeconomic deprivationThe map shows the distribution of municipality val-
ues of DI, calculated as described before, in the study area.
The municipalities of the Provinces of Naples and Caserta were subdivided in quintiles with respect to the value of the deprivation index (the first represents the most wealthy, the fifth the most deprivated). The most wealthy municipalities result in the north-eastern part of Caserta Province, and the most deprivated in the northern part of the Naples Province and in the south-ern and western parts of Caserta Province (Figure 1).
The present cluster analysis is adjusted by DI.
Fig. 1 | Municipality distribution of DI values subdivided in quintiles.
V quintile (40 municipalities): Acerra, Afragola, Arzano, Aversa, Boscotrecase, Brusciano, Caivano, Cancello ed Arnone, Carinaro, Casaluce, Casandrino, Casapesenna, Casavatore, Casola di Napoli, Casoria, Castello di Cisterna, Cercola, Crispano, Ercolano, Frattamaggiore, Frignano, Gricignano di Aversa, Grumo Nevano, Lettere, Marano di Napoli, Massa di Somma, Melito di Napoli, Mondragone, Monte di Procida, Napoli, Orta di Atella, Pozzuoli, Procida, Qualiano, San Marcellino, Sant’Antimo, Teverola, Torre Annunziata, Torre del Greco, Villa Literno.
IV quintile (39 municipalities): Arienzo, Bacoli, Boscoreale, Calvizzano, Cardito, Casal di Principe, Casalnuovo di Napoli, Casamarciano, Castellammare di Stabia, Castel Volturno, Cimitile, Formicola, Francolise, Frattaminore, Giugliano in Campania, Gragnano, Lacco Ameno, Lusciano, Maddaloni, Marcianise, Mariglianella, Meta, Mugnano di Napoli, Ottaviano, Palma Campania, Parete, Portici, Raviscanina, San Giorgio a Cremano, San Pietro Infine, Santa Maria Capua Vetere, Santa Maria la Carità, Santa Maria la Fossa, Serrara Fontana, Succivo, Trecase, Vico Equense, Villa di Briano, Visciano.
III quintile (39 municipalities): Agerola, Ailano, Anacapri, Barano d’Ischia, Capodrise, Capua, Carinola, Cesa, Cicciano, Ciorlano, Comiziano, Conca della Campania, Grazzanise, Liveri, Macerata Campania, Marigliano, Marzano Appio, Pimonte, Poggiomarino, Quarto, Roccamonfina, Roccaromana, San Felice a Cancello, San Giuseppe Vesuviano, San Gregorio Matese, San Prisco, Sant’Agnello, Santa Maria a Vico, Sant’Anastasia, Sant’Antonio Abate, Sant’Arpino, San Vitaliano, Sessa Aurunca, Somma Vesuviana, Sparanise, Terzigno, Trentola-Ducenta, Tufino, Volla.
II quintile (39 municipalities): Cavi Risorta, Camposano, Capri, Capriati a Volturno, Carbonara di Nola, Casamicciola Terme, Castel di Sasso, Cervino, Curti, Dragoni, Falciano del Massico, Forio, Ischia, Letino, Liberi, Massa Lubrense, Mignano Monte Lungo, Pastorano, Piano di Sorrento, Pietravairano, Pollena Trocchia, Pomigliano d’Arco, Pompei, Portico di Caserta, Presenzano, Recale, Riardo, Roccarainola, Rocchetta e Croce, San Cipriano d’Aversa, San Marco Evangelista, San Paolo Bel Sito, San Tammaro, Sorrento, Striano, Teano, Valle Agricola, Valle di Maddaloni, Villaricca.
I quintile remaining 39 municipalities.
102 Lucia Fazzo, Stefano Belli, Fabrizio Minichilli, et al.
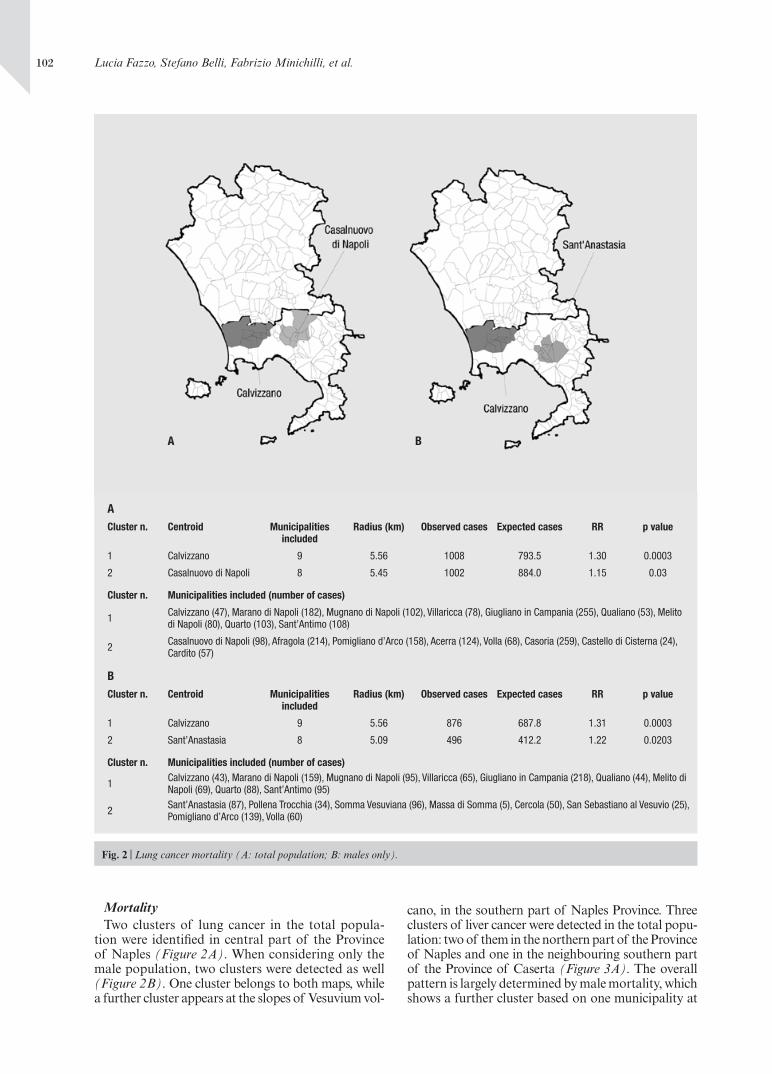
Mortality Two clusters of lung cancer in the total popula-
tion were identified in central part of the Province of Naples (Figure 2A). When considering only the male population, two clusters were detected as well (Figure 2B). One cluster belongs to both maps, while a further cluster appears at the slopes of Vesuvium vol-
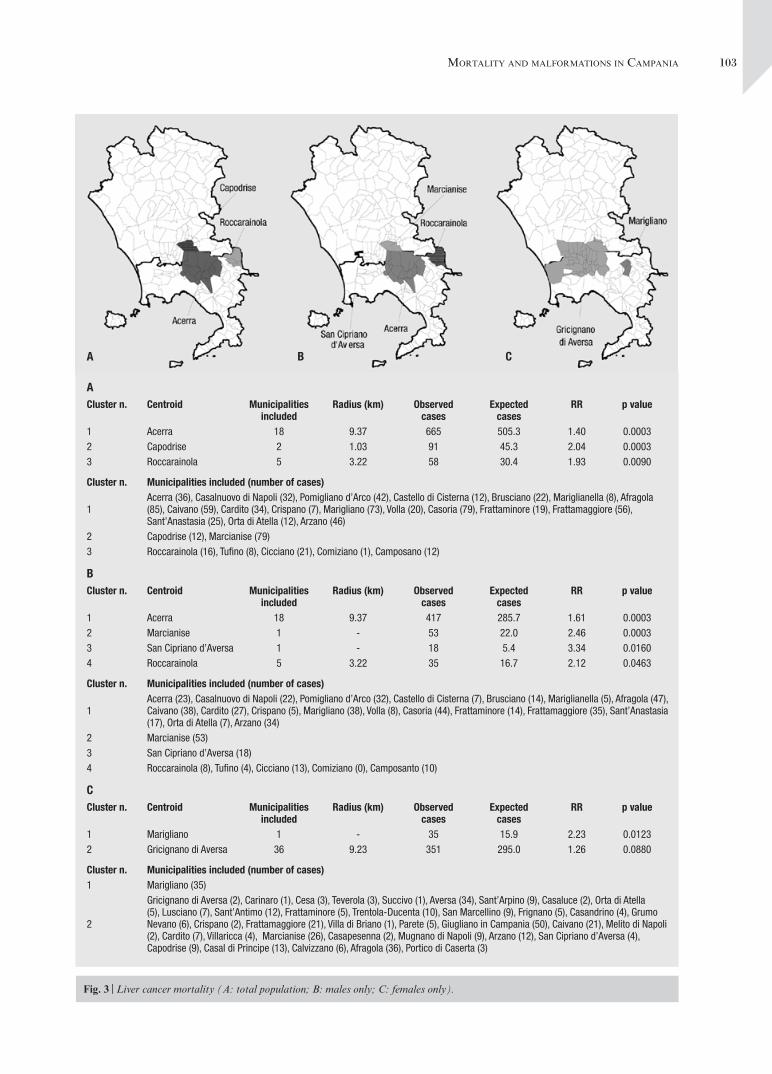
cano, in the southern part of Naples Province. Three clusters of liver cancer were detected in the total popu-lation: two of them in the northern part of the Province of Naples and one in the neighbouring southern part of the Province of Caserta (Figure 3A). The overall pattern is largely determined by male mortality, which shows a further cluster based on one municipality at
Fig. 2 | Lung cancer mortality (A: total population; B: males only).
A B
ACluster n. Centroid Municipalities
includedRadius (km) Observed cases Expected cases RR p value
1 Calvizzano 9 5.56 1008 793.5 1.30 0.0003
2 Casalnuovo di Napoli 8 5.45 1002 884.0 1.15 0.03
Cluster n. Municipalities included (number of cases)
1 Calvizzano (47), Marano di Napoli (182), Mugnano di Napoli (102), Villaricca (78), Giugliano in Campania (255), Qualiano (53), Melito di Napoli (80), Quarto (103), Sant’Antimo (108)
2 Casalnuovo di Napoli (98), Afragola (214), Pomigliano d’Arco (158), Acerra (124), Volla (68), Casoria (259), Castello di Cisterna (24), Cardito (57)
BCluster n. Centroid Municipalities
includedRadius (km) Observed cases Expected cases RR p value
1 Calvizzano 9 5.56 876 687.8 1.31 0.0003
2 Sant’Anastasia 8 5.09 496 412.2 1.22 0.0203
Cluster n. Municipalities included (number of cases)
1 Calvizzano (43), Marano di Napoli (159), Mugnano di Napoli (95), Villaricca (65), Giugliano in Campania (218), Qualiano (44), Melito di Napoli (69), Quarto (88), Sant’Antimo (95)
2 Sant’Anastasia (87), Pollena Trocchia (34), Somma Vesuviana (96), Massa di Somma (5), Cercola (50), San Sebastiano al Vesuvio (25), Pomigliano d’Arco (139), Volla (60)
103mortAlIty And mAlformAtIons In cAmpAnIA
Fig. 3 | Liver cancer mortality (A: total population; B: males only; C: females only).
ACluster n. Centroid Municipalities
includedRadius (km) Observed
casesExpected
casesRR p value
1 Acerra 18 9.37 665 505.3 1.40 0.00032 Capodrise 2 1.03 91 45.3 2.04 0.00033 Roccarainola 5 3.22 58 30.4 1.93 0.0090
Cluster n. Municipalities included (number of cases)
1Acerra (36), Casalnuovo di Napoli (32), Pomigliano d’Arco (42), Castello di Cisterna (12), Brusciano (22), Mariglianella (8), Afragola (85), Caivano (59), Cardito (34), Crispano (7), Marigliano (73), Volla (20), Casoria (79), Frattaminore (19), Frattamaggiore (56), Sant’Anastasia (25), Orta di Atella (12), Arzano (46)
2 Capodrise (12), Marcianise (79)3 Roccarainola (16), Tufino (8), Cicciano (21), Comiziano (1), Camposano (12)
BCluster n. Centroid Municipalities
includedRadius (km) Observed
casesExpected
casesRR p value
1 Acerra 18 9.37 417 285.7 1.61 0.00032 Marcianise 1 - 53 22.0 2.46 0.00033 San Cipriano d’Aversa 1 - 18 5.4 3.34 0.01604 Roccarainola 5 3.22 35 16.7 2.12 0.0463
Cluster n. Municipalities included (number of cases)
1Acerra (23), Casalnuovo di Napoli (22), Pomigliano d’Arco (32), Castello di Cisterna (7), Brusciano (14), Mariglianella (5), Afragola (47), Caivano (38), Cardito (27), Crispano (5), Marigliano (38), Volla (8), Casoria (44), Frattaminore (14), Frattamaggiore (35), Sant’Anastasia (17), Orta di Atella (7), Arzano (34)
2 Marcianise (53)3 San Cipriano d’Aversa (18)4 Roccarainola (8), Tufino (4), Cicciano (13), Comiziano (0), Camposanto (10)
CCluster n. Centroid Municipalities
includedRadius (km) Observed
casesExpected
casesRR p value
1 Marigliano 1 - 35 15.9 2.23 0.01232 Gricignano di Aversa 36 9.23 351 295.0 1.26 0.0880
Cluster n. Municipalities included (number of cases)1 Marigliano (35)
2
Gricignano di Aversa (2), Carinaro (1), Cesa (3), Teverola (3), Succivo (1), Aversa (34), Sant’Arpino (9), Casaluce (2), Orta di Atella (5), Lusciano (7), Sant’Antimo (12), Frattaminore (5), Trentola-Ducenta (10), San Marcellino (9), Frignano (5), Casandrino (4), Grumo Nevano (6), Crispano (2), Frattamaggiore (21), Villa di Briano (1), Parete (5), Giugliano in Campania (50), Caivano (21), Melito di Napoli (2), Cardito (7), Villaricca (4), Marcianise (26), Casapesenna (2), Mugnano di Napoli (9), Arzano (12), San Cipriano d’Aversa (4), Capodrise (9), Casal di Principe (13), Calvizzano (6), Afragola (36), Portico di Caserta (3)
A B C
104 Lucia Fazzo, Stefano Belli, Fabrizio Minichilli, et al.
the border between Naples and Caserta Provinces (Figure 3B). Liver cancer in women shows a big cluster around the border of the Provinces, and a smaller cluster in the Province of Naples based on one municipality (Figure 3C).
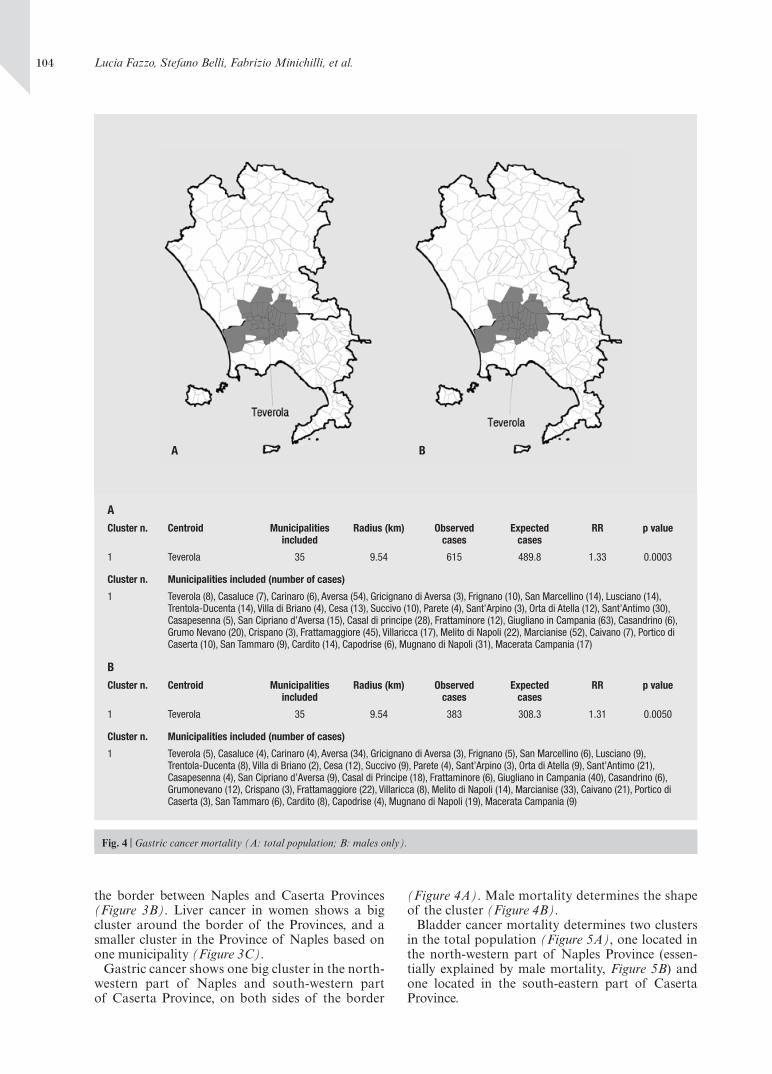
Gastric cancer shows one big cluster in the north-western part of Naples and south-western part of Caserta Province, on both sides of the border
(Figure 4A). Male mortality determines the shape of the cluster (Figure 4B).
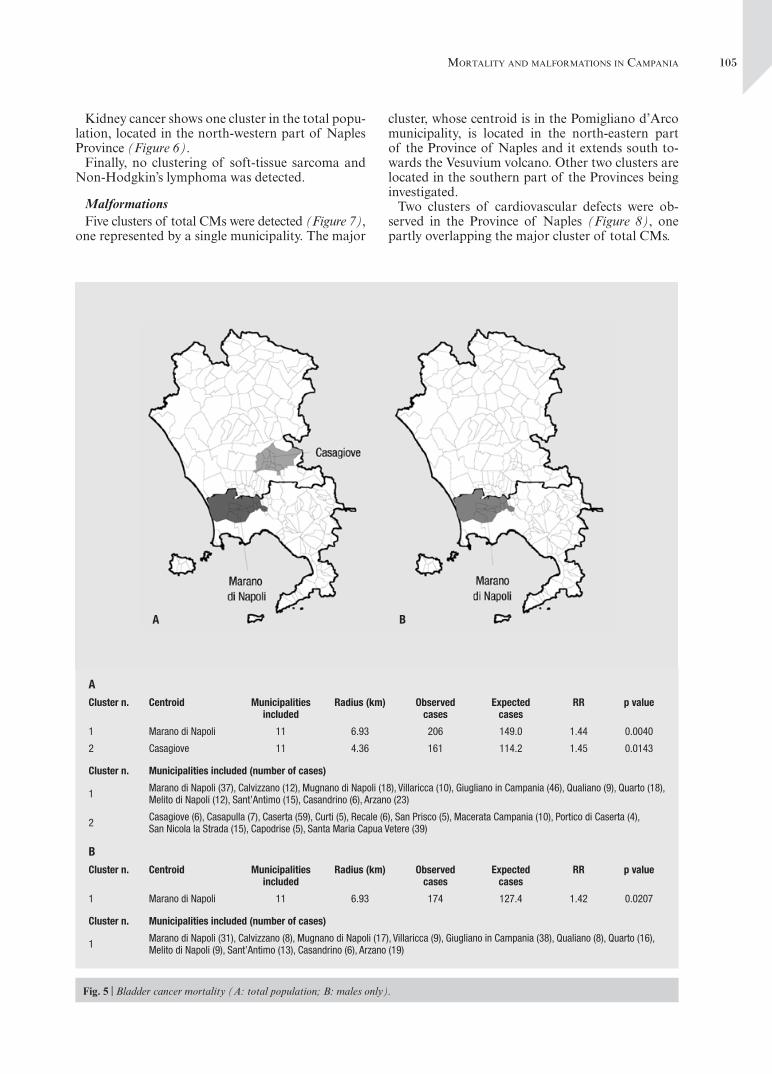
Bladder cancer mortality determines two clusters in the total population (Figure 5A), one located in the north-western part of Naples Province (essen-tially explained by male mortality, Figure 5B) and one located in the south-eastern part of Caserta Province.
Fig. 4 | Gastric cancer mortality (A: total population; B: males only).
A B
ACluster n. Centroid Municipalities
includedRadius (km) Observed
casesExpected
casesRR p value
1 Teverola 35 9.54 615 489.8 1.33 0.0003
Cluster n. Municipalities included (number of cases)
1 Teverola (8), Casaluce (7), Carinaro (6), Aversa (54), Gricignano di Aversa (3), Frignano (10), San Marcellino (14), Lusciano (14), Trentola-Ducenta (14), Villa di Briano (4), Cesa (13), Succivo (10), Parete (4), Sant’Arpino (3), Orta di Atella (12), Sant’Antimo (30), Casapesenna (5), San Cipriano d’Aversa (15), Casal di principe (28), Frattaminore (12), Giugliano in Campania (63), Casandrino (6), Grumo Nevano (20), Crispano (3), Frattamaggiore (45), Villaricca (17), Melito di Napoli (22), Marcianise (52), Caivano (7), Portico di Caserta (10), San Tammaro (9), Cardito (14), Capodrise (6), Mugnano di Napoli (31), Macerata Campania (17)
BCluster n. Centroid Municipalities
includedRadius (km) Observed
casesExpected
casesRR p value
1 Teverola 35 9.54 383 308.3 1.31 0.0050
Cluster n. Municipalities included (number of cases)
1 Teverola (5), Casaluce (4), Carinaro (4), Aversa (34), Gricignano di Aversa (3), Frignano (5), San Marcellino (6), Lusciano (9), Trentola-Ducenta (8), Villa di Briano (2), Cesa (12), Succivo (9), Parete (4), Sant’Arpino (3), Orta di Atella (9), Sant’Antimo (21), Casapesenna (4), San Cipriano d’Aversa (9), Casal di Principe (18), Frattaminore (6), Giugliano in Campania (40), Casandrino (6), Grumonevano (12), Crispano (3), Frattamaggiore (22), Villaricca (8), Melito di Napoli (14), Marcianise (33), Caivano (21), Portico di Caserta (3), San Tammaro (6), Cardito (8), Capodrise (4), Mugnano di Napoli (19), Macerata Campania (9)
105mortAlIty And mAlformAtIons In cAmpAnIA
Kidney cancer shows one cluster in the total popu-lation, located in the north-western part of Naples Province (Figure 6).
Finally, no clustering of soft-tissue sarcoma and Non-Hodgkin’s lymphoma was detected.
MalformationsFive clusters of total CMs were detected (Figure 7),
one represented by a single municipality. The major
cluster, whose centroid is in the Pomigliano d’Arco municipality, is located in the north-eastern part of the Province of Naples and it extends south to-wards the Vesuvium volcano. Other two clusters are located in the southern part of the Provinces being investigated.
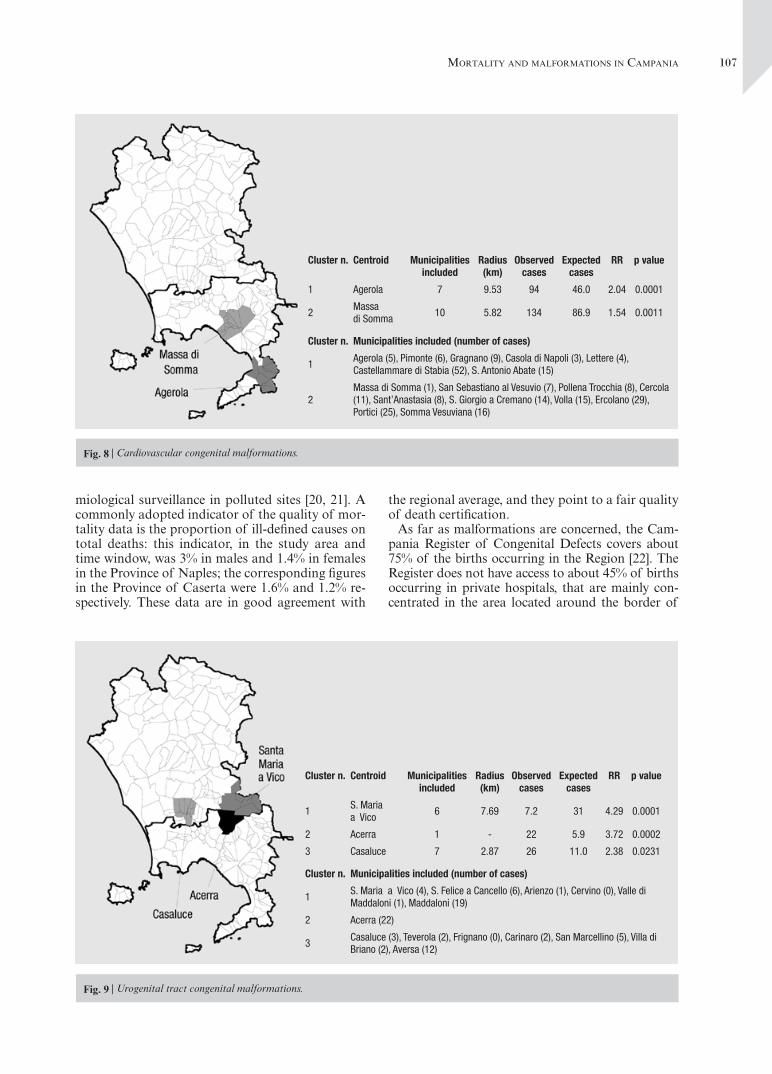
Two clusters of cardiovascular defects were ob-served in the Province of Naples (Figure 8), one partly overlapping the major cluster of total CMs.
Fig. 5 | Bladder cancer mortality (A: total population; B: males only).
ACluster n. Centroid Municipalities
includedRadius (km) Observed
casesExpected
casesRR p value
1 Marano di Napoli 11 6.93 206 149.0 1.44 0.0040
2 Casagiove 11 4.36 161 114.2 1.45 0.0143
Cluster n. Municipalities included (number of cases)
1 Marano di Napoli (37), Calvizzano (12), Mugnano di Napoli (18), Villaricca (10), Giugliano in Campania (46), Qualiano (9), Quarto (18), Melito di Napoli (12), Sant’Antimo (15), Casandrino (6), Arzano (23)
2 Casagiove (6), Casapulla (7), Caserta (59), Curti (5), Recale (6), San Prisco (5), Macerata Campania (10), Portico di Caserta (4), San Nicola la Strada (15), Capodrise (5), Santa Maria Capua Vetere (39)
BCluster n. Centroid Municipalities
includedRadius (km) Observed
casesExpected
casesRR p value
1 Marano di Napoli 11 6.93 174 127.4 1.42 0.0207
Cluster n. Municipalities included (number of cases)
1 Marano di Napoli (31), Calvizzano (8), Mugnano di Napoli (17), Villaricca (9), Giugliano in Campania (38), Qualiano (8), Quarto (16), Melito di Napoli (9), Sant’Antimo (13), Casandrino (6), Arzano (19)
A B

106 Lucia Fazzo, Stefano Belli, Fabrizio Minichilli, et al.
Three clusters of urogenital tract anomalies were identified in the south of Caserta and north of Naples Provinces, the latter partly overlapping the clusters observed for total CMs (Figure 9).
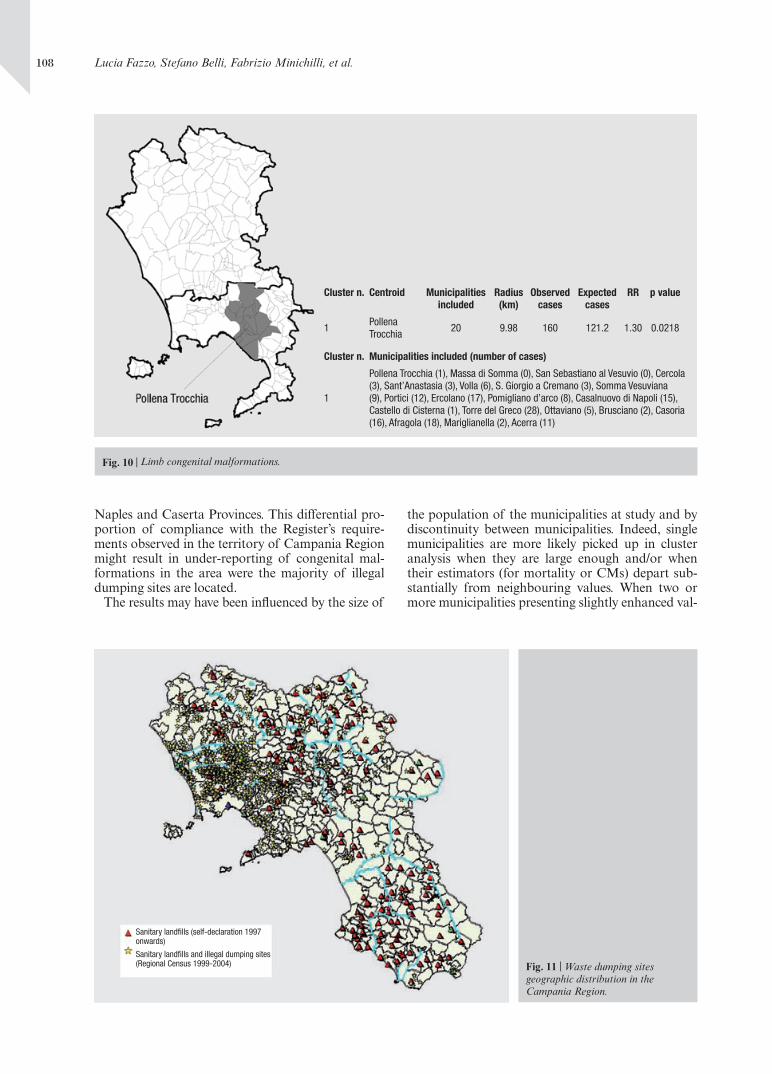
A cluster of limb malformations is located in a large area of the Province of Naples (Figure 10).
No other category of CMs shows any significant clustering.
DISCUSSIONIn order to critically evaluate the findings of the
present study, it seems appropriate to firstly examine the issue of data quality.
Mortality data in Italy are largely used in epide-miology, and the specific issues associated with their use in geographic studies on environmental health have been recently addressed in the frame of epide-
Fig. 6 | Kidney cancer mortality (total population).
Cluster n. Centroid Municipalities included
Radius (km)
Observed cases
Expected cases
RR p value
1 Giugliano in Campania 9 4.45 82 51.0 1.70 0.0157
Cluster n. Municipalities included (number of cases)
1 Giugliano in Campania (21), Villaricca (3), Mugnano di Napoli (11), Melito di Napoli (5), Calvizzano (2), Sant’Antimo (9), Casandrino (8),Marano di Napoli (19), Cesa (4)
Fig. 7 | Total congenital malformations.
Cluster n. Centroid Municipalities included
Radius (km)
Observed cases
Expected cases
RR p value
1Pomigliano D’arco
13 6.82 561 437.5 1.28 0.0001
2 Meta 8 8.92 216 146.8 1.47 0.0001
3Trentola Ducenta
8 3.35 194 136.7 1.42 0.0016
4 Portici 2 1.23 157 111.4 1.41 0.0130
5 Liveri 1 - 9 1.5 5.85 0.0159
Cluster n. Municipalities included (number of cases)
1
Pomigliano D’arco (43), Castello Di Cisterna (5), Casalnuovo Di Napoli (82), Brusciano (18), Acerra (89), Mariglianella (10), Sant’anastasia (33), Volla (40), Somma Vesuviana (42), Marigliano (42), Pollena Trocchia (20), Cercola (25), Afragola (112)
2Meta (5), Piano Di Sorrento (13), Sant’agnello (4), Vico Equense (23), Sorrento (19), Massa Lubrense (20), Pimonte (11), Castellammare Di Stabia (121)
3Trentola Ducenta (27), San Marcellino (21), Lusciano (12), Aversa (85), Parete (15), Frignano (9), Villa Di Briano (11), Teverola (14)
4 Portici (69), Ercolano (88)
5 Liveri (9)
107mortAlIty And mAlformAtIons In cAmpAnIA
miological surveillance in polluted sites [20, 21]. A commonly adopted indicator of the quality of mor-tality data is the proportion of ill-defined causes on total deaths: this indicator, in the study area and time window, was 3% in males and 1.4% in females in the Province of Naples; the corresponding figures in the Province of Caserta were 1.6% and 1.2% re-spectively. These data are in good agreement with
the regional average, and they point to a fair quality of death certification.
As far as malformations are concerned, the Cam-pania Register of Congenital Defects covers about 75% of the births occurring in the Region [22]. The Register does not have access to about 45% of births occurring in private hospitals, that are mainly con-centrated in the area located around the border of
Fig. 8 | Cardiovascular congenital malformations.
Cluster n. Centroid Municipalities included
Radius (km)
Observed cases
Expected cases
RR p value
1 Agerola 7 9.53 94 46.0 2.04 0.0001
2Massa di Somma
10 5.82 134 86.9 1.54 0.0011
Cluster n. Municipalities included (number of cases)
1Agerola (5), Pimonte (6), Gragnano (9), Casola di Napoli (3), Lettere (4), Castellammare di Stabia (52), S. Antonio Abate (15)
2Massa di Somma (1), San Sebastiano al Vesuvio (7), Pollena Trocchia (8), Cercola (11), Sant’Anastasia (8), S. Giorgio a Cremano (14), Volla (15), Ercolano (29), Portici (25), Somma Vesuviana (16)
Fig. 9 | Urogenital tract congenital malformations.
Cluster n. Centroid Municipalities included
Radius (km)
Observed cases
Expected cases
RR p value
1S. Maria a Vico
6 7.69 7.2 31 4.29 0.0001
2 Acerra 1 - 22 5.9 3.72 0.0002
3 Casaluce 7 2.87 26 11.0 2.38 0.0231
Cluster n. Municipalities included (number of cases)
1S. Maria a Vico (4), S. Felice a Cancello (6), Arienzo (1), Cervino (0), Valle di Maddaloni (1), Maddaloni (19)
2 Acerra (22)
3Casaluce (3), Teverola (2), Frignano (0), Carinaro (2), San Marcellino (5), Villa di Briano (2), Aversa (12)
108 Lucia Fazzo, Stefano Belli, Fabrizio Minichilli, et al.
Naples and Caserta Provinces. This differential pro-portion of compliance with the Register’s require-ments observed in the territory of Campania Region might result in under-reporting of congenital mal-formations in the area were the majority of illegal dumping sites are located.
The results may have been influenced by the size of
the population of the municipalities at study and by discontinuity between municipalities. Indeed, single municipalities are more likely picked up in cluster analysis when they are large enough and/or when their estimators (for mortality or CMs) depart sub-stantially from neighbouring values. When two or more municipalities presenting slightly enhanced val-
Fig. 10 | Limb congenital malformations.
Cluster n. Centroid Municipalities included
Radius (km)
Observed cases
Expected cases
RR p value
1Pollena Trocchia
20 9.98 160 121.2 1.30 0.0218
Cluster n. Municipalities included (number of cases)
1
Pollena Trocchia (1), Massa di Somma (0), San Sebastiano al Vesuvio (0), Cercola (3), Sant’Anastasia (3), Volla (6), S. Giorgio a Cremano (3), Somma Vesuviana (9), Portici (12), Ercolano (17), Pomigliano d’arco (8), Casalnuovo di Napoli (15), Castello di Cisterna (1), Torre del Greco (28), Ottaviano (5), Brusciano (2), Casoria (16), Afragola (18), Mariglianella (2), Acerra (11)
Fig. 11 | Waste dumping sites geographic distribution in the Campania Region.
Sanitary landfills (self-declaration 1997 onwards)
Sanitary landfills and illegal dumping sites (Regional Census 1999-2004)
109mortAlIty And mAlformAtIons In cAmpAnIA
ues have common borders, the tendency to clusterize becomes higher. For a more detailed discussion on this topic see Kuldorff [19].
Another limitation may be due to the use of the geographic coordinates of the municipality town hall rather than a centroid based on actual popula-tion distribution.
The validity of the adopted study design, on the other hand, is enhanced by the adjustment for socio-economic deprivation. Its effectiveness in removing confounding has been documented [23]. In any case, it is possible that residual confounding, not captured by the deprivation index, may be present.
Clusters of municipalities with significant excesses of lung, liver, gastric, kidney and bladder cancer have been mainly reported in the southern part of Caserta Province and in the northern part of Naples Province. This subarea largely overlaps with the area were most illegal waste disposal practices, namely dumping of toxic waste and illegal burning of both toxic and solid urban waste took place (Figure 11). This overlapping is particularly evident for the urogenital tract CMs and for kidney, bladder, gastric and lung cancer (in the latter case, excluding the Vesuvian cluster). These neoplastic diseases obviously have a complex multi-factorial etiology, but for all of them associations with residence in the neighbourhood of waste disposal sites have been reported [24-30]. With respect to time-relat-ed variables, the present study requires a specific com-ment. When dealing with illegal waste management procedures, dating the onset of exposure and thus la-tency times can be problematic. In this case, available evidence mainly deriving from criminal trials [7] sug-gests that illegal practices were operating in the area at least since the ’80s. The present study may thus be not fully informative for diseases having a median latency time of more than twenty years.
No cluster of soft-tissue sarcoma and Non-Hodgkin’s
lymphoma were detected in the present study. Soft-tissue sarcomas are a heterogeneous group of rare diseases, whose diagnosis is quite complex and rap-idly evolving [31, 32]. The ICD follows a topograph-ic approach and it groups sarcomas and carcinomas of the same organ under the same code, while the ICD code 171 (malignant neoplasms of soft tissue) does not include visceral, breast and skin cancer, and it is furthermore affected by misclassification due to secondary lesions [33]. Mortality data are thus not suitable for soft tissue sarcoma epidemiology. Also for Non-Hodgkin’s lymphoma, international work-ing groups recommend to rely on incidence, rather than mortality data [34]. Notwithstanding these limitations, Non-Hodgkin’s lymphoma mortality figures have been extensively used in epidemiologi-cal surveillance of populations resident in the sur-roundings of incinerators [35-37]. Also soft-tissue sarcoma mortality has been investigated in these context [35], with caution expressed by the authors because of the aforementioned methodologic con-straints. As mentioned in the Methods section, the rationale to include these ICD codes in the study was based on the necessity to exclude major depar-tures of observed from expected figures.
Also the main clusters of total CMs, cardiovascu-lar, urogenital and limb malformations were preva-lently detected in the area across the two Provinces and in large portions of the Province of Naples, mostly interested by illegal waste management.
Increased risks of CMs related to the potential role of exposure to waste pollution is reported and discussed by several epidemiological studies [1, 3, 38-40]. Lumping CMs with different multifacto-rial etiology produce larger although heterogene-ous groups. Despite a greater statistical power, main drawbacks are a lower specificity and a dilution ef-fect that may hide risks acting on specific CMs.
Table 1 | Congenital malformations and corresponding ICD codes
Abnormalities ICD-IX codes ICD-X codesNervous system 740, 741, 7420-7425, 7428, 7429 Q00-Q07 Defects of neural tube 740, 741, 7420 Q00, Q01, Q05, Q070
Congenital cardiovascular diseases 7450-7459, 7460-7469, 7470-7474 Q20-Q26
Palatine vault and lips 7490-7492 Q35-Q37
Digestive tract 7503-7504, 7507-7519 Q39, Q402, Q403, Q408, Q409, Q41-Q45
External urogenital apparatus 7524-7528 Q515, Q516, Q52-Q56, Q640 Hypospady 75260 Q54-Q54.3, Q54.8-Q54.9
Internal urogenital apparatus 7520-7523, 7529-7539 Q50, Q510-Q514, Q517-Q519, Q60-Q63, Q641-Q649
Skeleton, muscles and 7444-7445, 7448-7449, 7480-7481 Q18, Q30, Q380, Q382-Q389, connective tissue 7501-7502, 7540-7542, 7548, Q67, Q680, Q688, Q75-Q79,
7560-7569, 5240, 5249 Q8704, Q8705, Q8708,
Q870A, K070, K079
Limb 7543-7547, 7550-7556, 7558-7559 Q650-Q656, Q66, Q682-Q685,
Q69-Q74
Chromosomial 7580-7583, 7585-7589 Q90-Q94, Q96-Q99
110 Lucia Fazzo, Stefano Belli, Fabrizio Minichilli, et al.
CONCLUSIONSIn conclusion, the present study has detected a ten-
dency towards clustering of several cancer sites and CMs (namely, urogenital malformations) in a fairly well defined area encompassing the northern part of Naples and the southern part of Caserta Provinces. These results have been adjusted for the possible confounding effect of socioeconomic deprivation.
The area identified in this study for hosting most observed clusters:
a) is the same indicated by the previous study for showing peculiar SMR and BMR values, with respect the whole Region;
b) corresponds to the part of Campania Region where most of the illegal practices of dumping toxic wastes took place over time.
The adopted study design was not aimed at evalu-ating cause-effect relationships, since it does not take into account the different possible risk factors, like smoking, life style, occupation, but rather at pursuing a better knowledge of the spatial distribu-tion of the diseases of interest in an area in which a long-lasting practice of illegal waste management had taken place. This approach represents a step in the construction of an epidemiological framework, consistently with the indications provided by several authors [41, 42], who recommend the implementa-tion of studies both at individual and at population level. Causal relations will then be evaluated inte-grating epidemiological, clinical and toxicological sources of evidence. It is intended that the scientific
background for these evaluation should be coherent with the conclusions of the aforementioned WHO Report [6], according to which there is some evi-dence of an adverse health effect of residence near waste dumping sites, but a causal link has not yet been ascertained.
Environmental monitoring and epidemiological surveillance will continue in the area, where priori-ties for environmental reclamation and health inves-tigations can now be selected with more confidence.
Members of the Working GroupR. Bertollini, M. Martuzzi, F. Mitis (WHO European Centre for Environment and Health), M. Bellino, C. Carboni, P. Comba, L. Cossa, P. De Nardo, F. Falleni, L. Fazzo, L. Musmeci, A. Piccardi, S. Trinca (Istituto Superiore di Sanità), F. Bianchi, N. Linzalone, F. Minichilli, A. Pierini (Consiglio Nazionale della Ricerca), E. Lorenzo, L. Martina, R. Pizzuti, M. Santoro (Osservatorio Epidemiologico Regione Campania), E. Lionetti, M. Menegozzo (Agenzia Regionale Protezione Ambiente della Campania), M. Fusco (Registro Tumori di Napoli), G. Scarano (Registro Difetti Congeniti della Regione Campania), S. Menegozzo (Registro Mesoteliomi della Regione Campania), G. Doddi, M. Leonardi, L. Madeo, G. Martini, M. Matteucci, N. Mazzei, R. Pizzi (Dipartimento della Protezione Civile), A. Savarese (Legambiente Campania), C. Bove (Unità Sanitaria Locale Caserta 1), A. D’Argenzio (Unità Sanitaria Locale Caserta 2), A. Simonetti (Unità Sanitaria Locale Napoli 1), A. Parlato (Unità Sanitaria Locale Napoli 2), F. Peluso (Unità Sanitaria Locale Napoli 3), R. Palombino (Unità Sanitaria Locale Napoli 4), and F. Giugliano (Unità Sanitaria Locale Napoli 5).
Received on 20 September 2007. Accepted on 29 January 2008.
References 1. Dolk H, Vrijheid M, Armstrong B, Abramsky L, Bianchi F,
Garne E, Nelen V, Robert E, Scott JE, Stone D, Tenconi R. Risk of congenital anomalies near hazardous-waste landfill sites in Europe: the EUROHAZCON study. Lancet 1998;352:423-7.
2. Vrijheid M. Health effects of residence near hazardous waste landfill sites: a review of epidemiologic literature. Environ Health Perspect 2000;108 (Suppl 1):101-12.
3. Vrijheid M, Dolk H, Armstrong B, Abramsky L, Bianchi F, Fazarinc I, Garne E, Ide R, Nelen V, Robert E, Scott JES, Stone D, Tenconi R. Chromosomal congenital anomalies and residence near hazardous waste landfill sites. Lancet 2002;359:320-2.
4. Linzalone N, Bianchi F. Studi sul rischio per la salute umana in prossimità di discariche di rifiuti: aggiornamento e pros-pettive. Epidemiol Prev 2005;29:51-3.
5. Dearwent SM, Moiz Mumtaz M, Godfrey G, Sinks T, Falk H. Health effects of hazardous waste. Ann NY Acad Sci 2006;1076:439-48.
6. World Health Organization. Regional Office for Europe. Population health and waste management: scientific data and policy options. Report on WHO workshop. Rome, Italy, 29-30 March 2007.
7. Legambiente. Osservatorio Ambiente e Legalità. Rapporto Ecomafia 2007. I numeri e le storie della criminalità ambien-tale. Roma: Legambiente; 2007.
8. Trinca S, Comba P, Felli A, Forte T, Musmeci L, Piccardi A. Childhood mortality in an area of southern Italy with numerous dumping grounds: application of GIS and pre-liminary findings. In: First European Conference Geographic Information Sciences in Public Health. Sheffield, UK 2001.
9. Altavista P, Belli S, Bianchi F, Binazzi A, Comba P, Del Giudice R, Fazzo L, Felli A, Mastrantonio M, Menegozzo M, Musmeci L, Pizzuti R, Savarese A, Trinca S, Uccelli R. Mortalità per causa in un’area della Campania con numerose discariche di rifiuti. Epidemiol Prev 2004; 28:311-21.
10. Senior K, Mazza A. Italian “Triangle of death” linked to waste crisis. Lancet Oncol 2004;5:525-7.
11. Bianchi F, Comba P, Martuzzi M, Palombino R, Pizzuti R. Reflection and reaction: Italian “Triangle of death”. Lancet Oncol 2004;5:710.
12. Martuzzi M, Bianchi F, Comba P, Fazzo L, Martina L, Minichilli F, Mitis F, Pizzuti R, Santoro M. Patologia ne-oplastica e malformazioni congenite nelle province della Campania con maggiore presenza di discariche. Not Ist Super Sanità 2005;18:3-8.
13. Comba P, Bianchi F, Fazzo L, Martina L, Menegozzo M, Minichilli F, Mitis F, Musmeci L, Pizzuti R, Santoro M, Trinca S, Martuzzi M. Cancer mortality in an area of Campania (Italy) characterized by multiple toxic dumping sites. Ann NY Acad Sci 2006;1076:449-61.
14. Bullard RD, Wright BH. Environmental justice for all: com-munity perspectives on health and research needs. Toxicol Ind Health 1993;9:821-41.
15. Martuzzi M, Mitis F, Biggeri A, Terracini B, Bertollini R. Environment and health status of the population in areas with high risk of environmental crisis in Italy. Epidemiol Prev 1992;26(Suppl.6):1-53.
16. Cadum E, Costa G, Biggeri A, Martuzzi M. Deprivation
111mortAlIty And mAlformAtIons In cAmpAnIA
and mortality: a deprivation index suitable for geographical analysis of inequalities. Epidemiol Prev 1999;23:175-87.
17. Townsend P. Deprivation. Journal of Social Policy 1987;16:125-46.
18. Carstairs V, Morris R. Deprivation: explaining differences in mortality between Scotland and England and Wales. BMJ 1989;299:886-9.
19. Kulldorf M. A spatial scan statistic. Communications in sta-tistics: theory and methods 1997;26:481-96.
20. Martuzzi M, Mitis F. Metodi e strumenti per studi epidemio-logici di mortalità su base geografica in Italia. In: Cori L, Cocchi M, Comba P (Ed.). Indagini epidemiologiche nei siti di interesse nazionale per le bonifiche delle regioni italiane previste dai fondi strutturali dell’Unione Europea. Roma: Istituto Superiore di Sanità; 2005. p. 68-74. (Rapporti ISTISAN, 05/1).
21. Bianchi F, Biggeri A, Cadum E, Comba P, Forastiere F, Martuzzi M, Terracini B. Epidemiologia ambientale e aree inquinate in Italia. Epidemiol Prev 2006;30:146-51.
22. Bianchi F, Taruscio D (Ed.). Registro Nazionale Malattie Rare. Epidemiologia di 44 malformazioni congenite rare in Italia. Roma: Istituto Superiore di Sanità; 2002. p. 5. (Rapporti ISTISAN 02/36).
23. Grisotto L, Catelan D, Lagazio C, Biggeri A. Uso dell’indice di deprivazione materiale in epidemiologia descrittiva. In: Comba P, Iavarone I, Pirastu R (Eds.). Impatto sulla scelta dei siti inquinati: metodi e strumenti per la ricerca e le valutazioni. Roma: Istituto Superore di Sanità; 2007. p. 123-34. (Rapporti ISTISAN, 07/50).
24. Budnick LD, Logue JN, Sokal DC, Fox JM, Falk H. Cancer and birth defects near the Drake Superfund site, Pennsylva-nia. Arch Environ Health 1984;39:409-13.
25. Griffith J, Duncan RC, Riggan WB, Pellom AC. Cancer mor-tality in US counties with hazardous waste sites and ground water pollution. Arch Environ Health 1989;44:69-74.
26. Mallin K. Investigation of a bladder cancer cluster in north-western Illinois. Am J Epidemiol 1990;132 (Suppl 1):S96-S106.
27. Goldberg MS, Alhomsi N, Goulet L, Riberdy H. Incidence of cancer among persons living near a municipal solid waste landfill site in Montreal, Quebec. Arch Environ Health 1995;50:416-24.
28. Lewis-Michl EL, Kallenbach LR, Geary NS, Melius JM, Ju CL, Orr MF, Forand SP. Investigation of cancer incidence and residence near 38 landfills with soil gas migration condi-tions: New York State, 1980-1989. ATSDR/HS-98-93. Atlanta: Agency for Toxic Substances and Disease Registry; 1998.
29. Goldberg MS, Siemiatycki J, Dewar R, Désy M, Riberdy H. Risks of developing cancer relative to living near a municipal
solid waste landfill site in Montreal, Quebec, Canada. Arch Environ Health 1999;54:291-6.
30. Mitis F, Martuzzi M, Bertollini R, Cadum E, Demaria M. Studio di mortalità nelle vicinanze di due discariche di rifiuti di Torino. In: Musmeci L (Ed.). Valutazione del rischio sanitario e ambien-tale nello smaltimento di rifiuti urbani e pericolosi. Roma: Istituto Superiore di Sanità; 2004. p. 73-85. (Rapporti ISTISAN, 04/5).
31. Weiss SW, Goldblum JR (Ed.). Enzinger and Weiss’s soft tis-sue tumors. St. Louis, Mo: Mosby Inc.; 2001.
32. Fletcher C, Unni KK, Mertens F (Ed.). WHO classification of tumors. Pathology and genetics of tumors of soft tissues and bone. Lyon: IARC Press; 2002.
33. Berrino F. Epidemiologia dei sarcomi, In: Santoro A (Ed.). I sarcomi. Pavia: Medico Scientifiche; 1994. p.9-17.
34. Morton LM, Turner JJ, Cerhan JR, Linet MS, Treseler PA, Clarke CA,Jack A, Cozen W, Maynadie´ M, Spinelli JJ, Seniori Costantini A, Rudiger T, Scarpa A, Zheng T, Weisenburger DD. Proposed classification of lymphoid neoplasms for epidemiologic research from the Pathology Working Group of the International Lymphoma Epidemiology Consortium (InterLymph). Blood 2007;110:695-708.
35. Biggeri A, Catelan D. Mortalità per linfoma non Hodgkin e sarcomi dei tessuti molli nel territorio circostante un impian-to di incenerimento di rifiuti solidi urbani. Campi Bisenzio (Toscana, Italia) 1981-2001. Epidemiol Prev 2005;29:156-9.
36. Biggeri A, Catelan D. NHL mortality in Tuscan municipali-ties with urban solid waste incinerators active in 1970-1998. Epidemiol Prev 2006;30:14-5.
37. Bianchi F, Minichilli F. Mortalità per linfomi non Hodgkin nel periodo 1981-2001 in comuni italiani con inceneritori di rifiuti solidi urbani. Epidemiol Prev 2006;30:80-1.
38. Elliott P, Briggs D, Morris S, de Hoogh C, Hurt C, Jensen TK, Maitland I, Richardson S, Wakefield J, Jarup L. Risk of adverse birth outcomes in populations living near landfill sites. BMJ 2001;323:363-8. Erratum in: BMJ 2001;323:1182.
39. Croen LA, Shaw GM, Sanbonmatsu L, Selvin S, Buffler PA. Maternal residential proximity to hazardous waste sites and risk for selected congenital malformations. Epidemiology 1997;8:347-54.
40. Cordier S, Chevrier C, Robert-Gnansia E, Lorente C, Brula P, Hours M. Risk of congenital anomalies in the vicinity of munici-pal solid waste incinerators. Occup Environ Med 2004;61:8-15.
41. Schwartz BS, Rischitelli G, Hu H. The future of environmental medicine in Environmental Health Perspectives: Where should we be headed? Environ Health Perspectives 2005;113:A574-6.
42. Pearce N. Traditional epidemiology, modern epidemiology, and public health. Am J Public Health 1996;86:678-83.