Embed Size (px)
Citation preview
Cluster Analysis
Class web site:
http://statwww.epfl.ch/davison/teaching/Microarrays/ETHZ/
Statistics for Microarrays
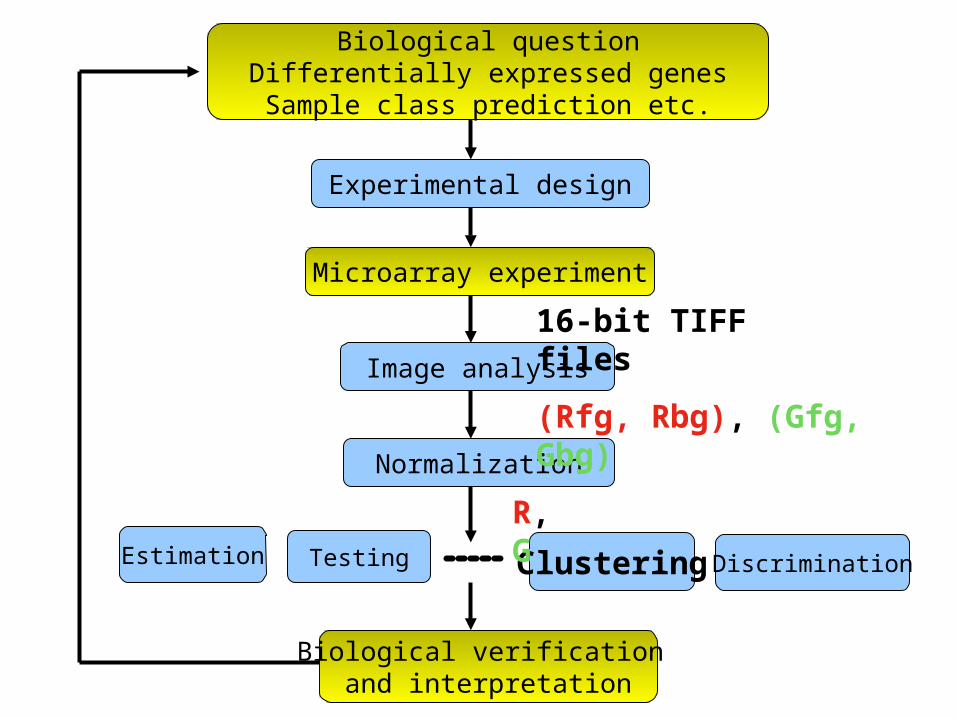
Biological questionDifferentially expressed genesSample class prediction etc.
Testing
Biological verification and interpretation
Microarray experiment
Estimation
Experimental design
Image analysis
Normalization
Clustering Discrimination
R, G
16-bit TIFF files
(Rfg, Rbg), (Gfg, Gbg)
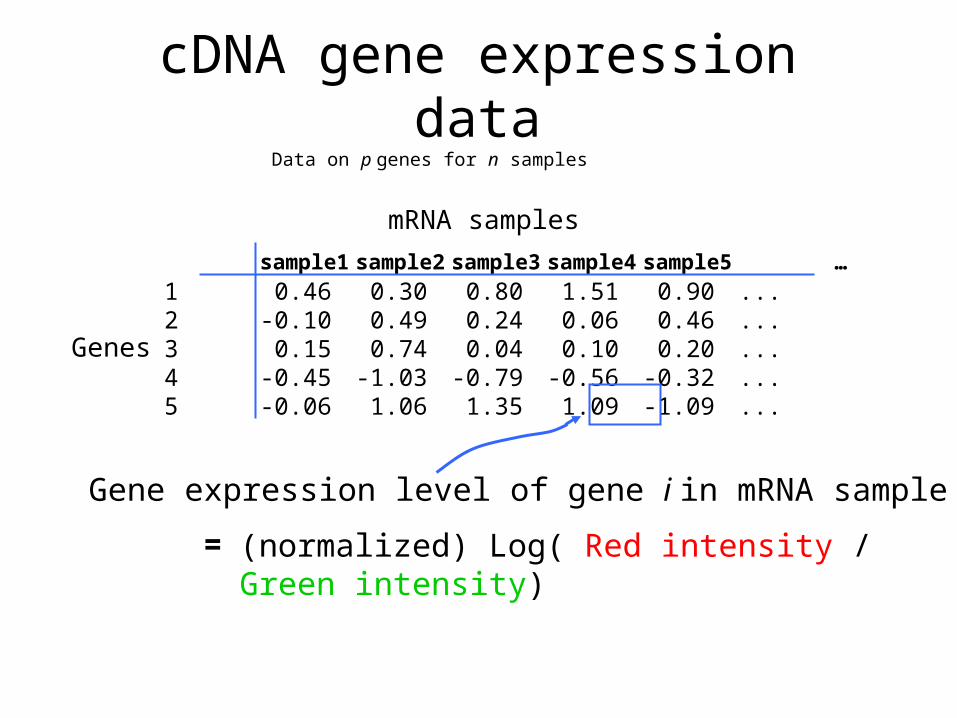
cDNA gene expression data
Data on p genes for n samples
Genes
mRNA samples
Gene expression level of gene i in mRNA sample j
= (normalized) Log( Red intensity / Green intensity)
sample1 sample2 sample3 sample4 sample5 …
1 0.46 0.30 0.80 1.51 0.90 ...2 -0.10 0.49 0.24 0.06 0.46 ...3 0.15 0.74 0.04 0.10 0.20 ...4 -0.45 -1.03 -0.79 -0.56 -0.32 ...5 -0.06 1.06 1.35 1.09 -1.09 ...
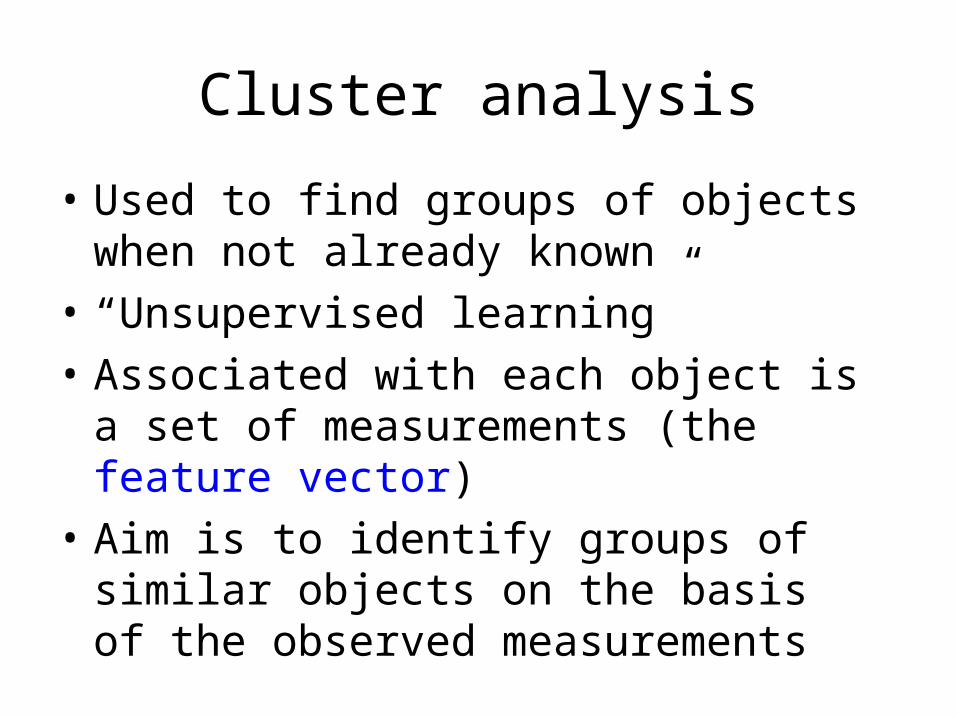
Cluster analysis
• Used to find groups of objects when not already known
• “Unsupervised learning”• Associated with each object is a set
of measurements (the feature vector)
• Aim is to identify groups of similar objects on the basis of the observed measurements
Clustering Gene Expression Data
• Can cluster genes (rows), e.g. to (attempt to) identify groups of co-regulated genes
• Can cluster samples (columns), e.g. to identify tumors based on profiles
• Can cluster both rows and columns at the same time
Clustering Gene Expression Data
• Leads to readily interpretable figures
• Can be helpful for identifying patterns in time or space
• Useful (essential?) when seeking new subclasses of samples
• Can be used for exploratory purposes
Similarity
• Similarity sij indicates the strength of relationship between two objects i and j
• Usually 0 ≤ sij ≤1
• Correlation-based similarity ranges from –1 to 1

Problems using correlation
Dissimilarity and Distance
• Associated with similarity measures sij
bounded by 0 and 1 is a dissimilarity dij = 1 - sij
• Distance measures have the metric property (dij +dik ≥ djk)
• Many examples: Euclidean, Manhattan, etc.
• Distance measure has a large effect on performance
• Behavior of distance measure related to scale of measurement
Partitioning Methods
• Partition the objects into a prespecified number of groups K
• Iteratively reallocate objects to clusters until some criterion is met (e.g. minimize within cluster sums of squares)
• Examples: k-means, partitioning around medoids (PAM), self-organizing maps (SOM), model-based clustering
Hierarchical Clustering
• Produce a dendrogram• Avoid prespecification of the number
of clusters K • The tree can be built in two distinct
ways: – Bottom-up: agglomerative clustering– Top-down: divisive clustering
Agglomerative Methods• Start with n mRNA sample (or p gene) clusters• At each step, merge the two closest clusters
using a measure of between-cluster dissimilarity which reflects the shape of the clusters
• Examples of between-cluster dissimilarities: – Unweighted Pair Group Method with Arithmetic Mean
(UPGMA): average of pairwise dissimilarities– Single-link (NN): minimum of pairwise dissimilarities– Complete-link (FN): maximum of pairwise
dissimilarities
Divisive Methods
• Start with only one cluster• At each step, split clusters into two
parts• Advantage: Obtain the main structure
of the data (i.e. focus on upper levels of dendrogram)
• Disadvantage: Computational difficulties when considering all possible divisions into two groups
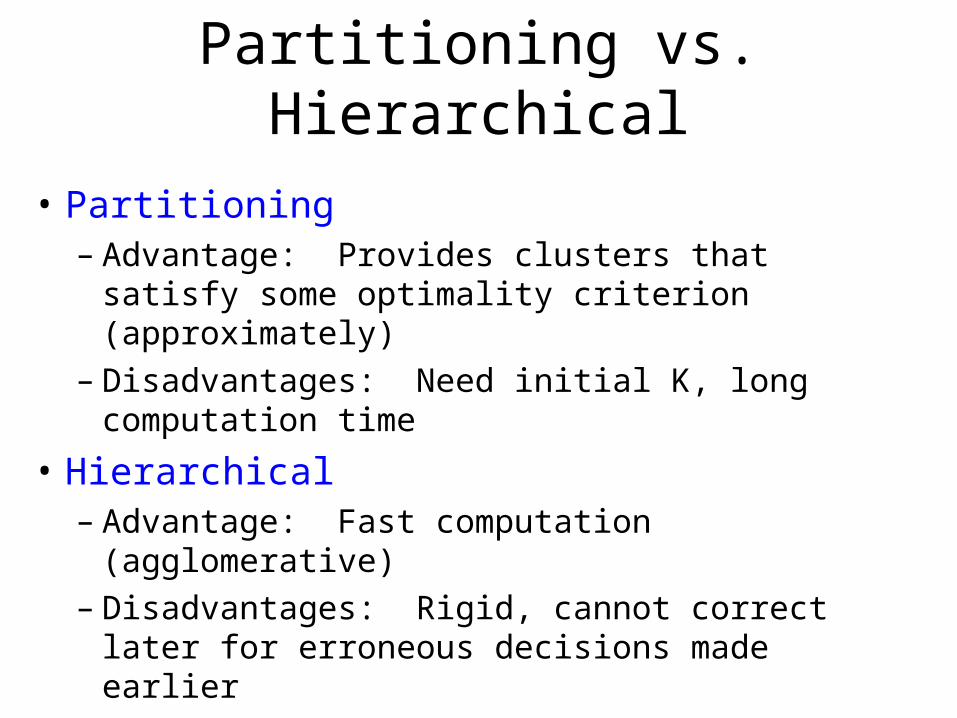
Partitioning vs. Hierarchical
• Partitioning– Advantage: Provides clusters that satisfy
some optimality criterion (approximately)– Disadvantages: Need initial K, long
computation time
• Hierarchical– Advantage: Fast computation
(agglomerative)– Disadvantages: Rigid, cannot correct later
for erroneous decisions made earlier
Generic Clustering Tasks
• Estimating number of clusters
• Assigning each object to a cluster
• Assessing strength/confidence of cluster assignments for individual objects
• Assessing cluster homogeneity
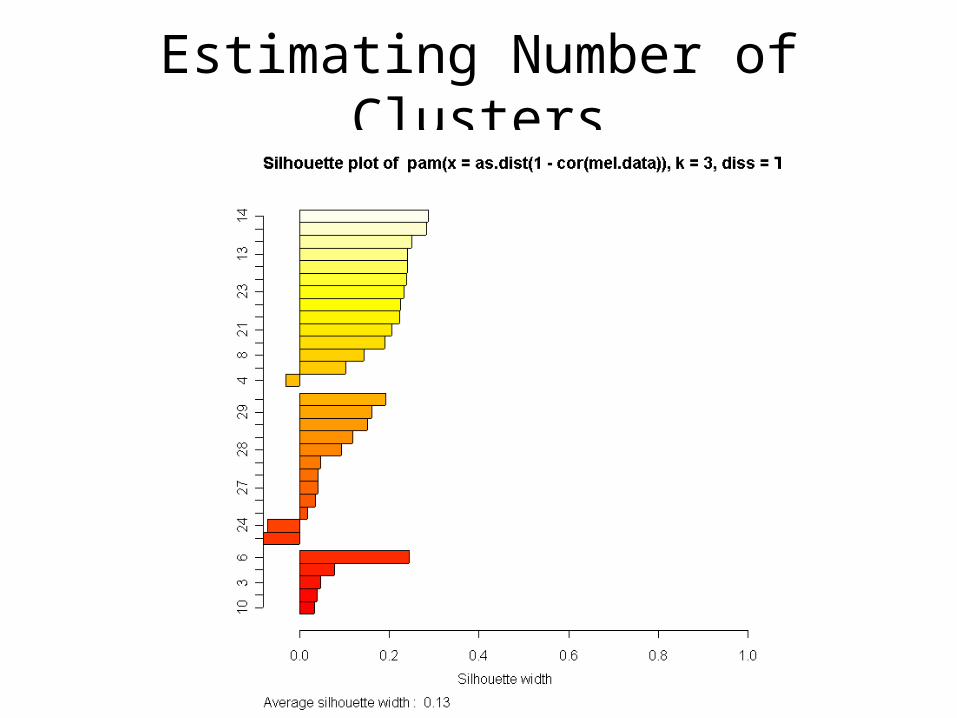
Estimating Number of Clusters
Bittner et al.
It has been proposed (by many) that a
cancer taxonomy can be identified
from gene expression experiments.
Dataset description
• 31 melanomas (from a variety of tissues/cell lines)
• 7 controls• 8150 cDNAs• 6971 unique genes• 3613 genes ‘strongly detected’
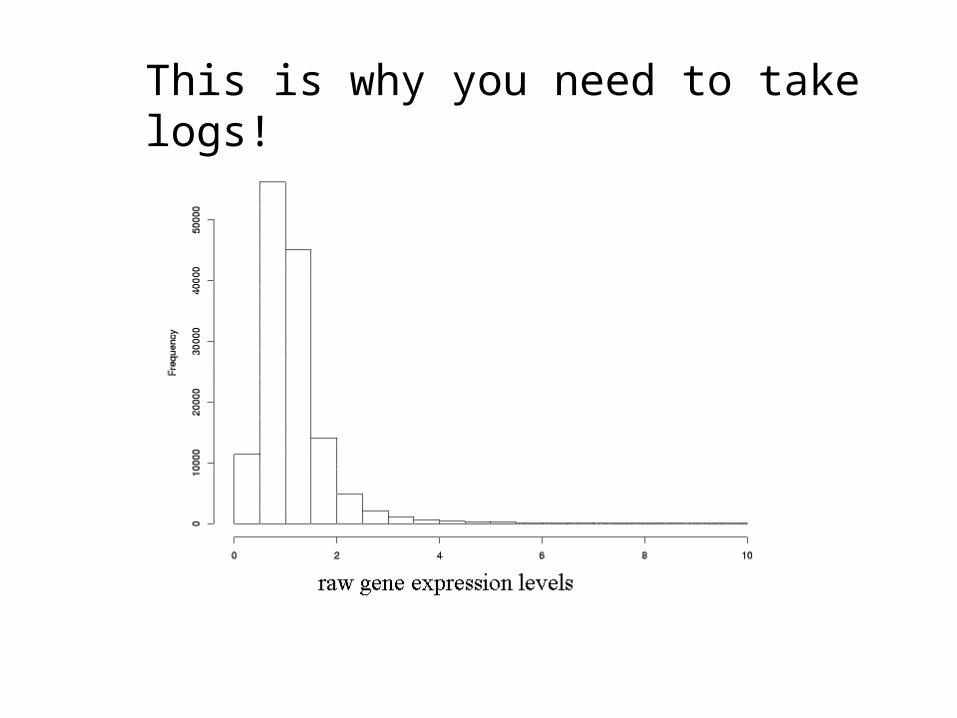
This is why you need to take logs!
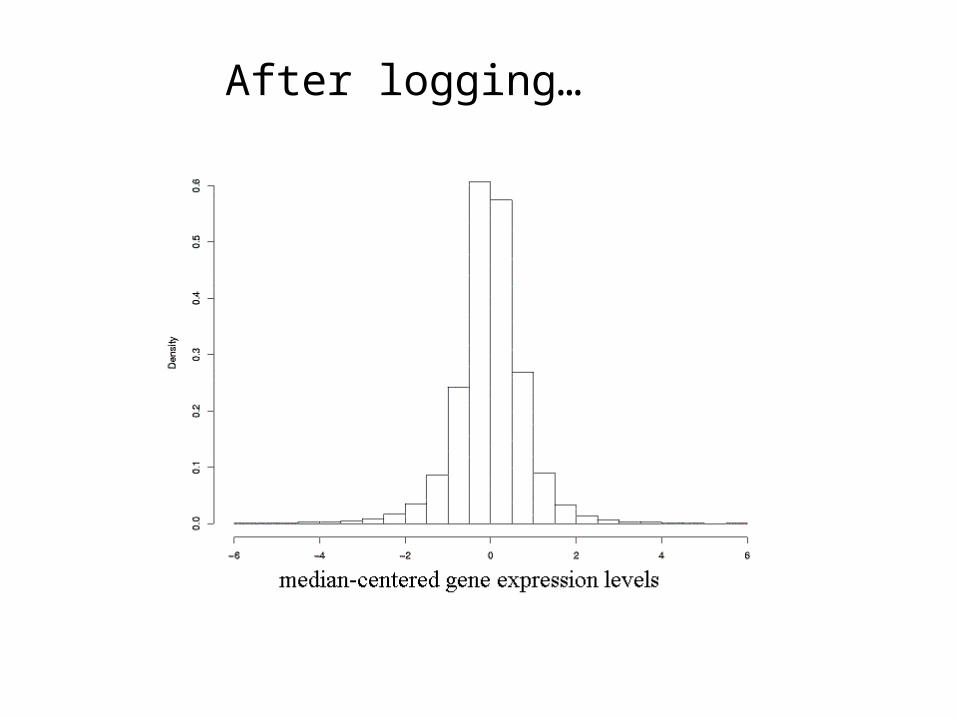
After logging…
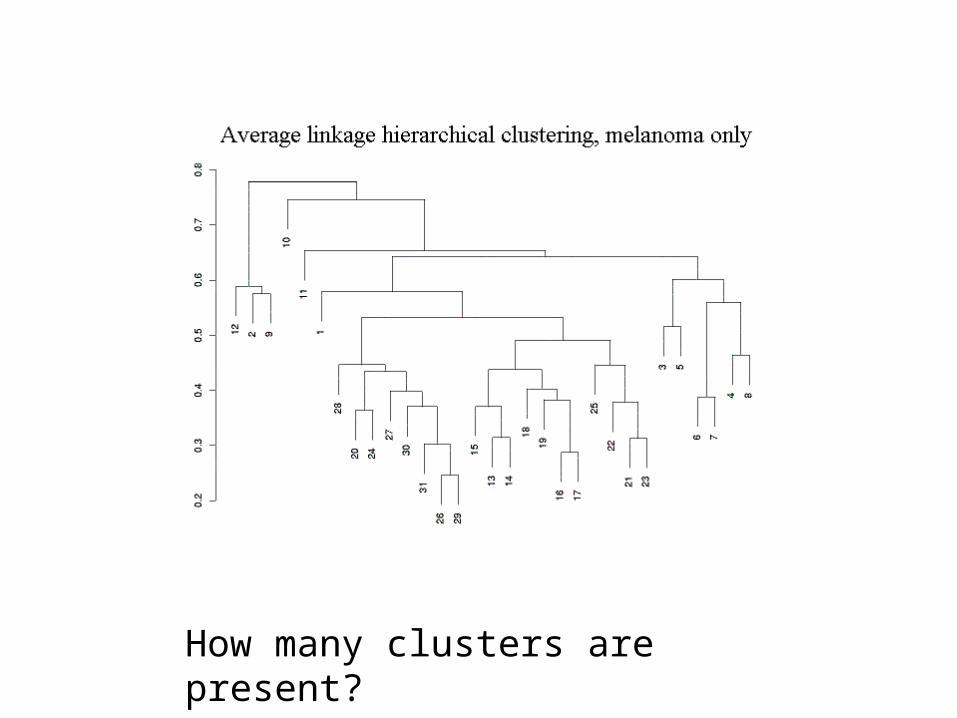
How many clusters are present?

‘cluster’
unclustered
Average linkage hierarchical clustering, melanoma only
1- = .54
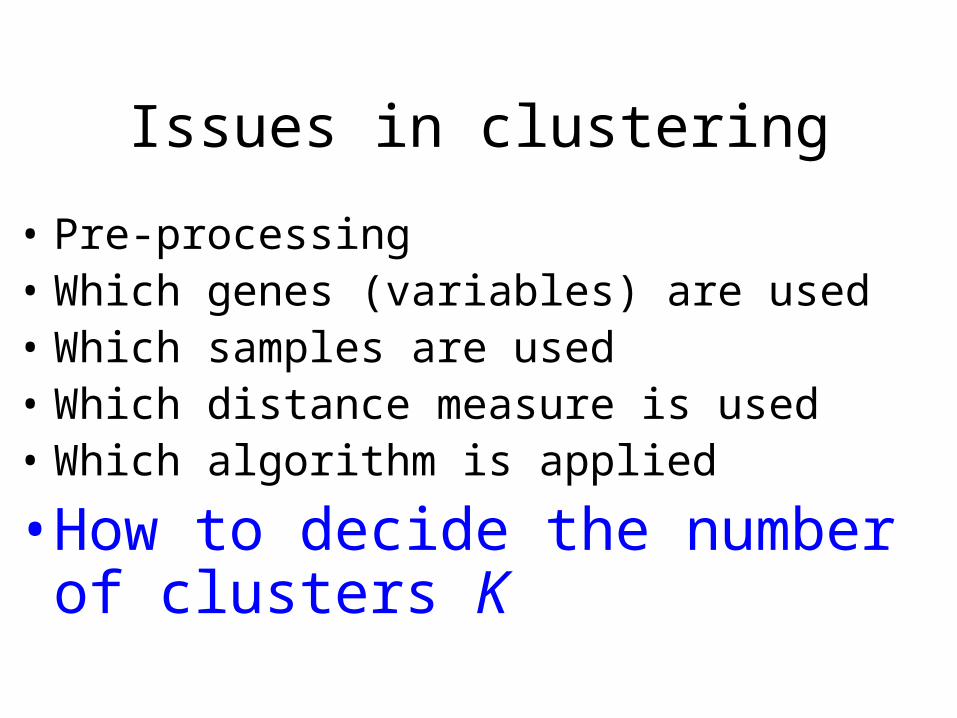
Issues in Clustering
• Pre-processing (Image analysis and Normalization)
• Which genes (variables) are used • Which samples are used• Which distance measure is used• Which algorithm is applied• How to decide the number of clusters K
Issues in Clustering
• Pre-processing (Image analysis and Normalization)
•Which genes (variables) are used
• Which samples are used• Which distance measure is used• Which algorithm is applied• How to decide the number of clusters K
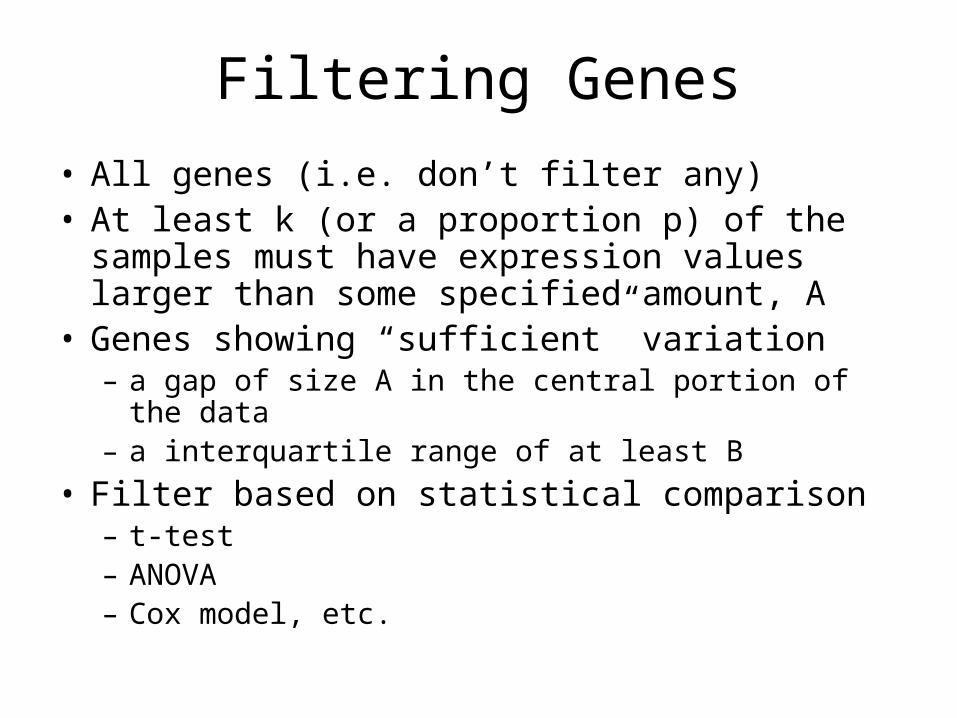
Filtering Genes
• All genes (i.e. don’t filter any)• At least k (or a proportion p) of the
samples must have expression values larger than some specified amount, A
• Genes showing “sufficient” variation– a gap of size A in the central portion of the
data– a interquartile range of at least B
• Filter based on statistical comparison– t-test– ANOVA– Cox model, etc.
Issues in Clustering
• Pre-processing (Image analysis and Normalization)
• Which genes (variables) are used
•Which samples are used• Which distance measure is used• Which algorithm is applied• How to decide the number of clusters K
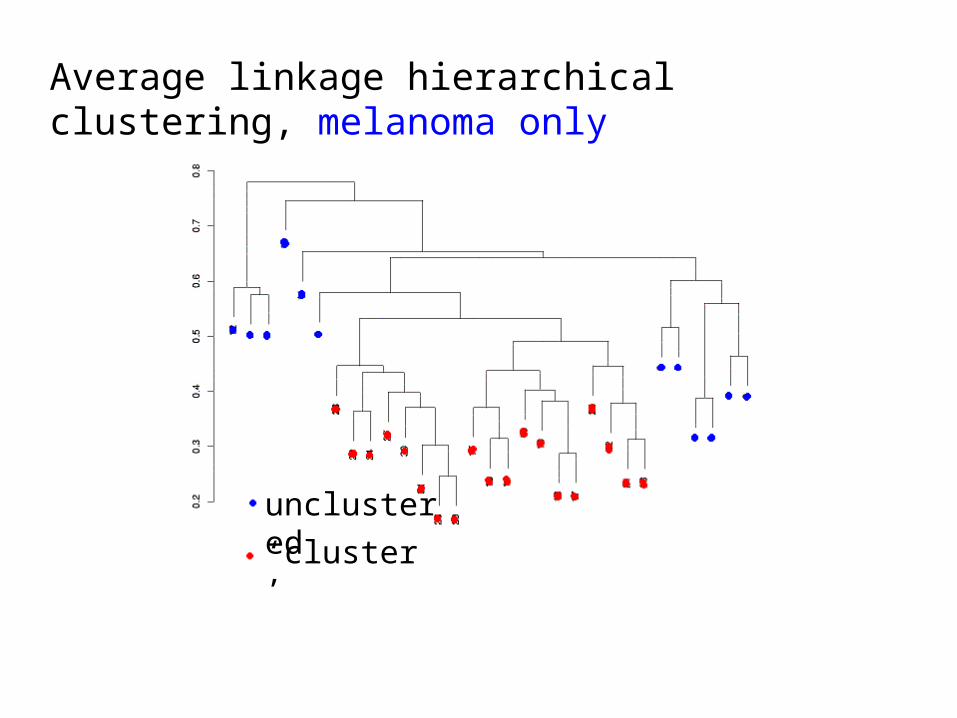
‘cluster’
unclustered
Average linkage hierarchical clustering, melanoma only
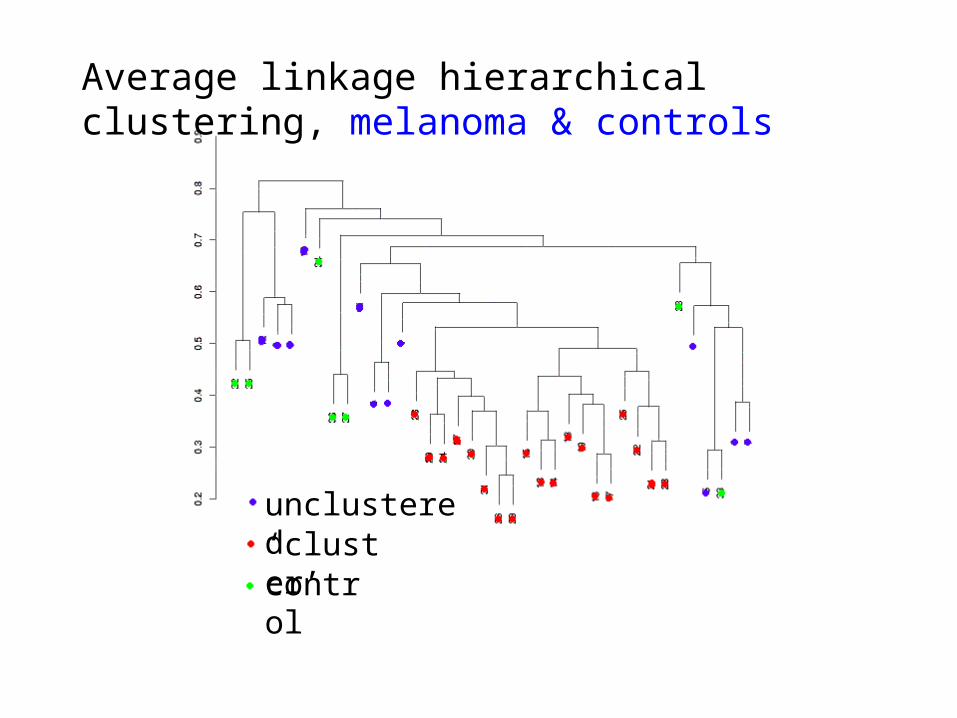
‘cluster’control
unclustered
Average linkage hierarchical clustering, melanoma & controls
Issues in clustering
• Pre-processing• Which genes (variables) are used• Which samples are used
•Which distance measure is used
• Which algorithm is applied• How to decide the number of clusters K
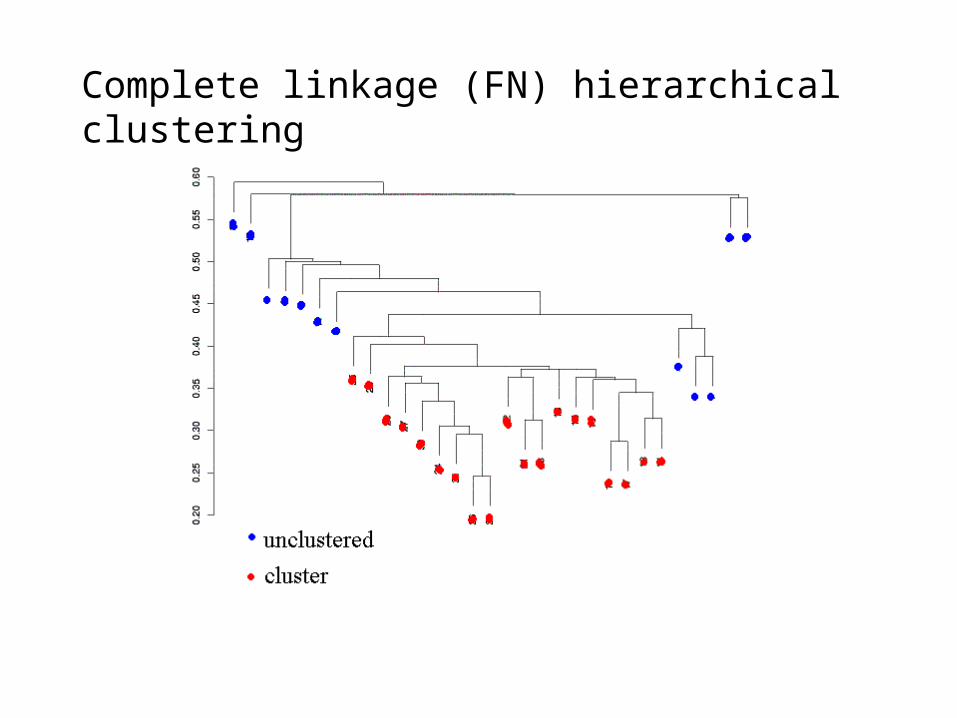
Complete linkage (FN) hierarchical clustering
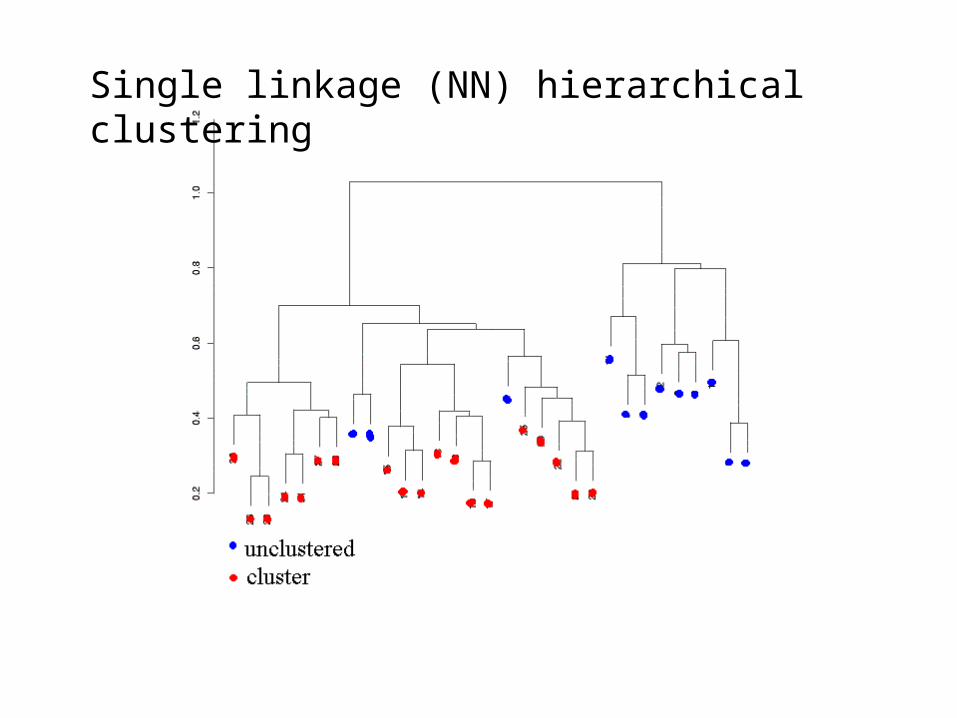
Single linkage (NN) hierarchical clustering
Issues in clustering
• Pre-processing• Which genes (variables) are used• Which samples are used• Which distance measure is used
•Which algorithm is applied• How to decide the number of clusters
K
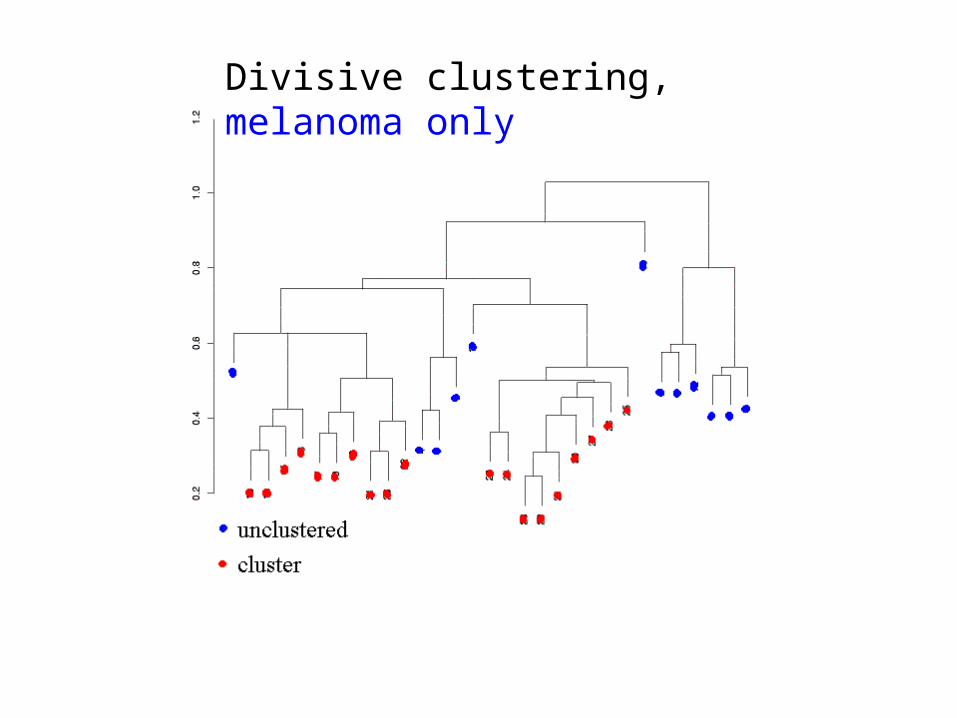
Divisive clustering, melanoma only
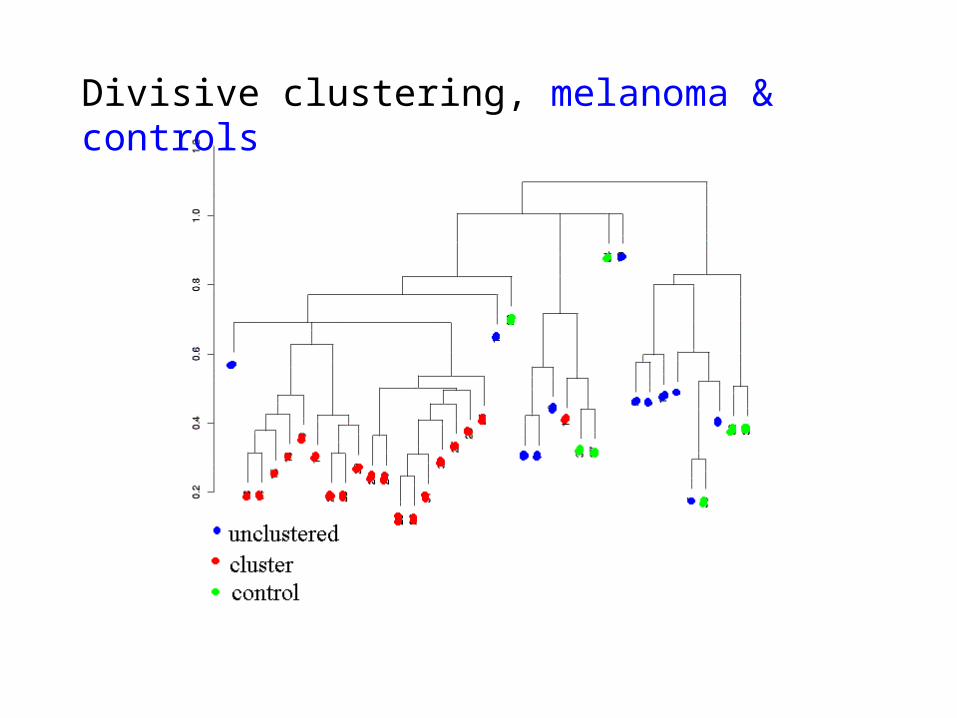
Divisive clustering, melanoma & controls
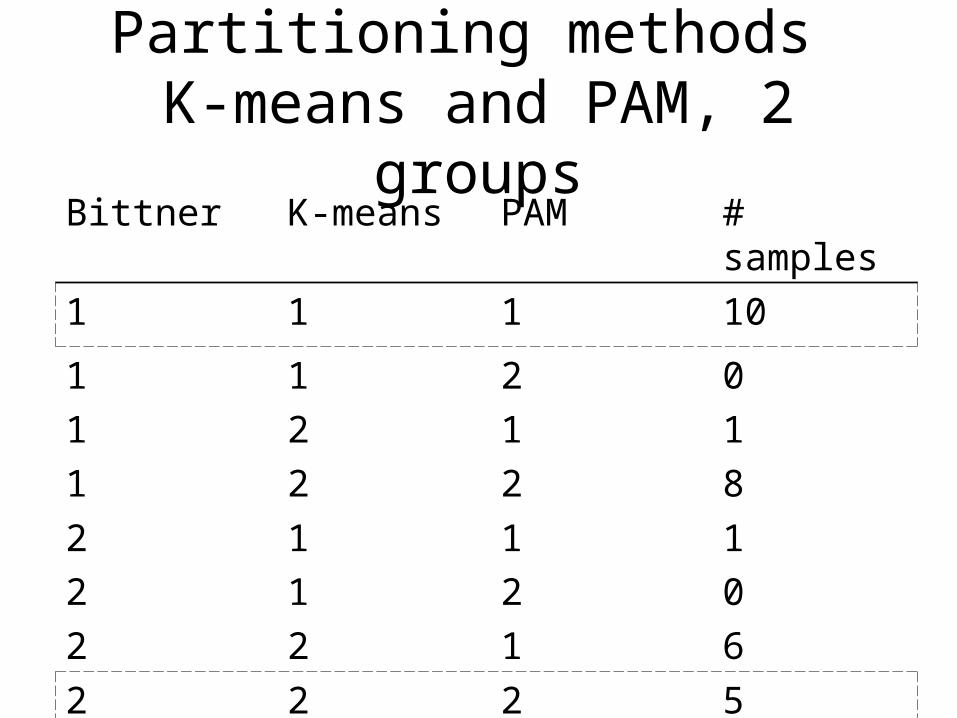
Partitioning methods K-means and PAM, 2
groupsBittner K-means PAM #
samples
1 1 1 10
111
122
212
018
222
112
121
106
2 2 2 5
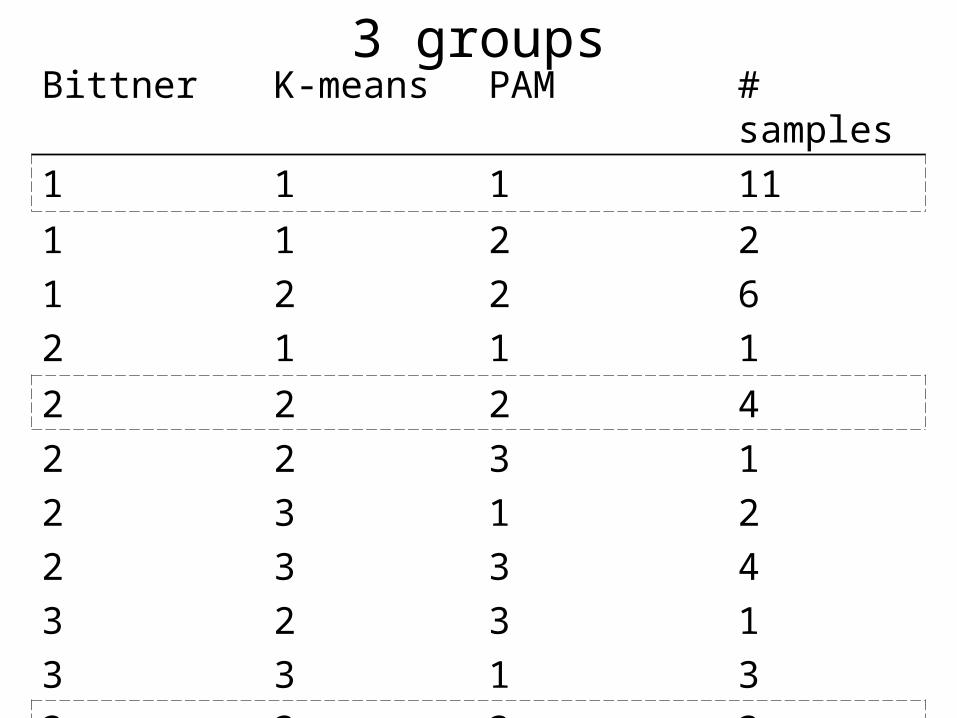
3 groupsBittner K-means PAM #
samples
1 1 1 11
112
121
221
261
2 2 2 4
22233
23323
31331
12413
3 3 3 3
Issues in clustering
• Pre-processing• Which genes (variables) are used• Which samples are used• Which distance measure is used• Which algorithm is applied
•How to decide the number of clusters K
How many clusters K?
• Many suggestions for how to decide this!• Milligan and Cooper (Psychometrika
50:159-179, 1985) studied 30 methods• Some new methods include GAP (Tibshirani
) and clest (Fridlyand and Dudoit)• Applying several methods yielded
estimates of K = 2 (largest cluster has 27 members) to K = 8 (largest cluster has 19 members)
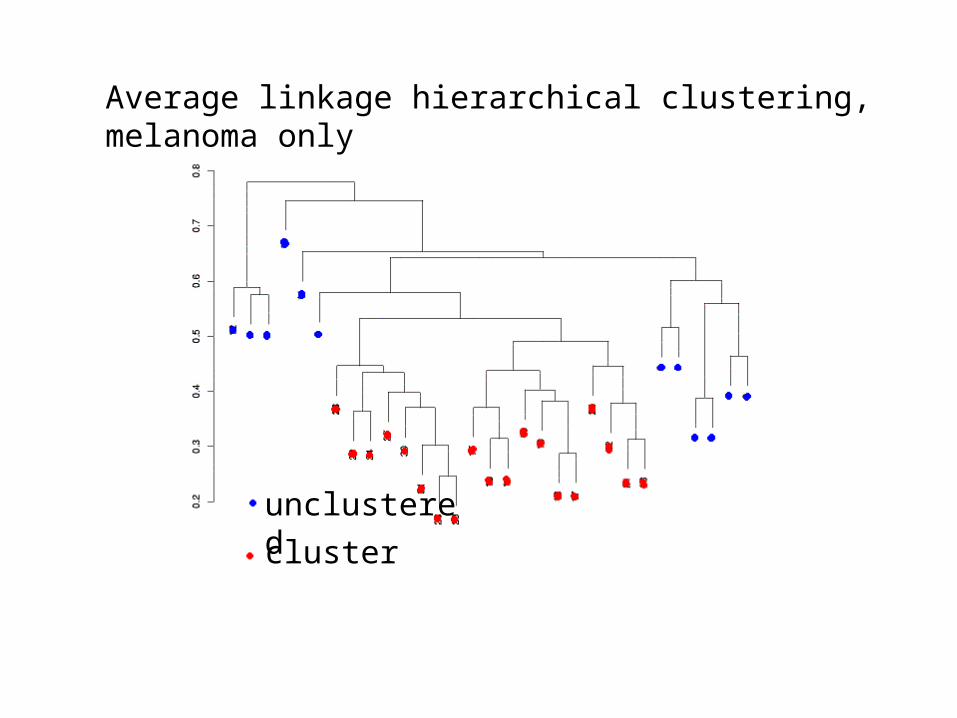
cluster
unclustered
Average linkage hierarchical clustering, melanoma only

Summary
• ‘Buyer beware’ – results of cluster analysis should be treated with GREAT CAUTION and ATTENTION TO SPECIFICS, because…
• Many things can vary in a cluster analysis
• If covariates/group labels are known, then clustering is usually inefficient
Acknowledgements
IPAM Group, UCLA:Debashis GhoshErin ConlonDirk HolsteSteve HorvathLei LiHenry LuEduardo NevesMarcia SalzanoXianghong Zhao
Others:Sandrine DudoitJane FridlyandJose CorreaTerry SpeedWilliam LemonFred Wright