Embed Size (px)
Citation preview
CLUP Volume 3 – The Sectoral Studies
Physical Environment Page 17
Chapter 2 Physical Environment
2.1 Geography
2.1.1 Location
Cagayan de Oro City is the gateway to Northern Mindanao. It is geographically nestled between the central coastline of Macajalar Bay to the North and the naturally-rich plateaus and mountains of Bukidnon and Lanao del Norte to the South. The municipality of Opol bounds the City on the west while the municipality of Tagoloan, with its heavy industrial activities, is its immediate neighbor to the east. The City lies between the latitude 8°14’00” to 8°31’00” north and longitude 124°27’00” and 124°49’00” east.
2.1.2 Land Area
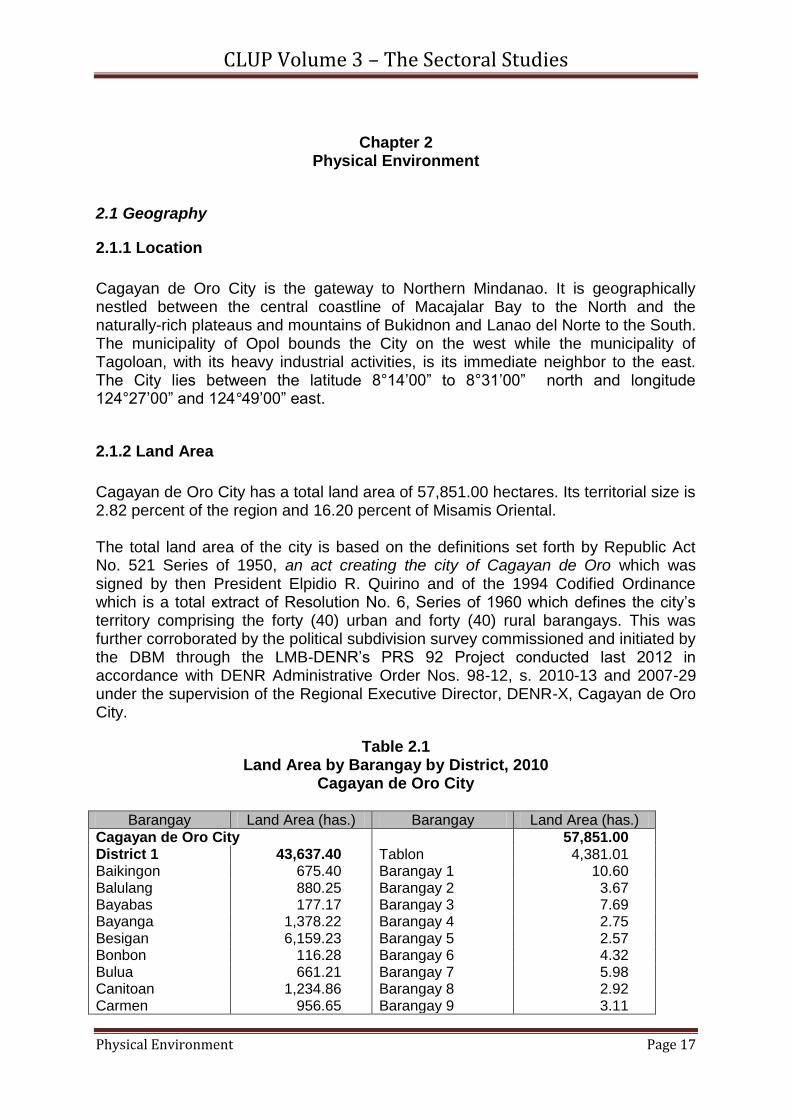
Cagayan de Oro City has a total land area of 57,851.00 hectares. Its territorial size is 2.82 percent of the region and 16.20 percent of Misamis Oriental. The total land area of the city is based on the definitions set forth by Republic Act No. 521 Series of 1950, an act creating the city of Cagayan de Oro which was signed by then President Elpidio R. Quirino and of the 1994 Codified Ordinance which is a total extract of Resolution No. 6, Series of 1960 which defines the city’s territory comprising the forty (40) urban and forty (40) rural barangays. This was further corroborated by the political subdivision survey commissioned and initiated by the DBM through the LMB-DENR’s PRS 92 Project conducted last 2012 in accordance with DENR Administrative Order Nos. 98-12, s. 2010-13 and 2007-29 under the supervision of the Regional Executive Director, DENR-X, Cagayan de Oro City.
Table 2.1 Land Area by Barangay by District, 2010
Cagayan de Oro City
Barangay Land Area (has.) Barangay Land Area (has.)
Cagayan de Oro City 57,851.00 District 1 43,637.40 Tablon 4,381.01 Baikingon 675.40 Barangay 1 10.60 Balulang 880.25 Barangay 2 3.67 Bayabas 177.17 Barangay 3 7.69 Bayanga 1,378.22 Barangay 4 2.75 Besigan 6,159.23 Barangay 5 2.57 Bonbon 116.28 Barangay 6 4.32 Bulua 661.21 Barangay 7 5.98 Canitoan 1,234.86 Barangay 8 2.92 Carmen 956.65 Barangay 9 3.11
CLUP Volume 3 – The Sectoral Studies
Physical Environment Page 18
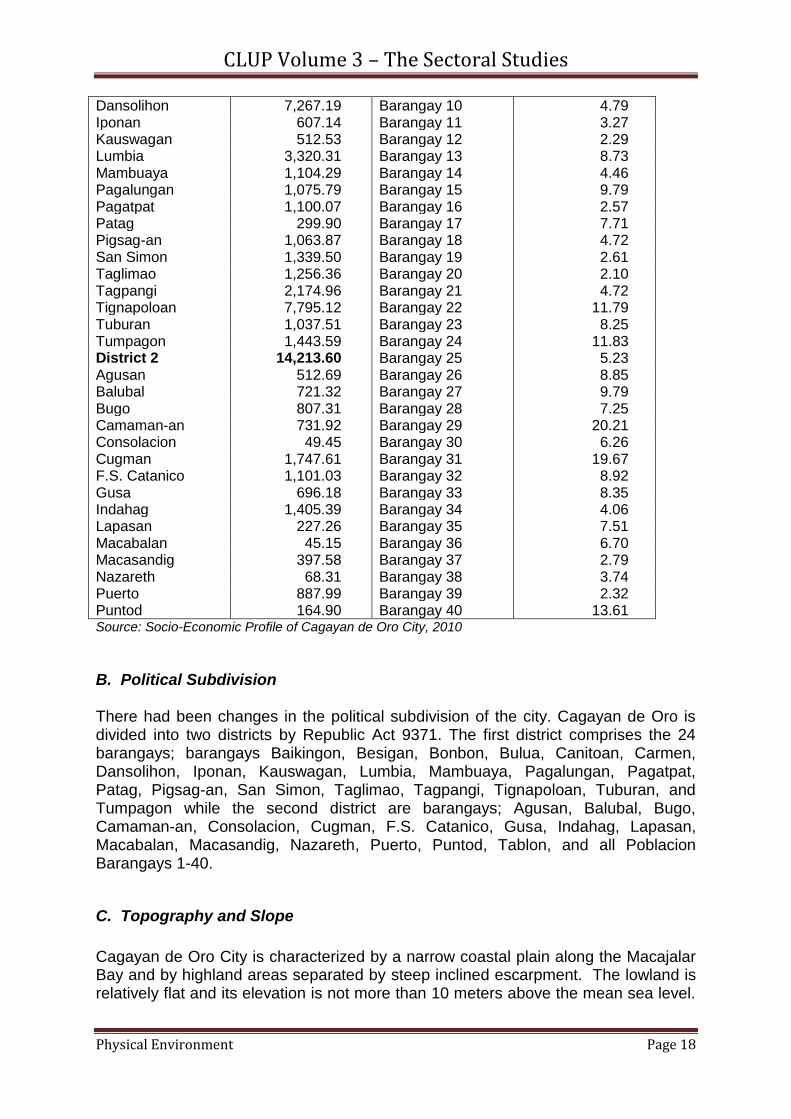
Dansolihon 7,267.19 Barangay 10 4.79 Iponan 607.14 Barangay 11 3.27 Kauswagan 512.53 Barangay 12 2.29 Lumbia 3,320.31 Barangay 13 8.73 Mambuaya 1,104.29 Barangay 14 4.46 Pagalungan 1,075.79 Barangay 15 9.79 Pagatpat 1,100.07 Barangay 16 2.57 Patag 299.90 Barangay 17 7.71 Pigsag-an 1,063.87 Barangay 18 4.72 San Simon 1,339.50 Barangay 19 2.61 Taglimao 1,256.36 Barangay 20 2.10 Tagpangi 2,174.96 Barangay 21 4.72 Tignapoloan 7,795.12 Barangay 22 11.79 Tuburan 1,037.51 Barangay 23 8.25 Tumpagon 1,443.59 Barangay 24 11.83 District 2 14,213.60 Barangay 25 5.23 Agusan 512.69 Barangay 26 8.85 Balubal 721.32 Barangay 27 9.79 Bugo 807.31 Barangay 28 7.25 Camaman-an 731.92 Barangay 29 20.21 Consolacion 49.45 Barangay 30 6.26 Cugman 1,747.61 Barangay 31 19.67 F.S. Catanico 1,101.03 Barangay 32 8.92 Gusa 696.18 Barangay 33 8.35 Indahag 1,405.39 Barangay 34 4.06 Lapasan 227.26 Barangay 35 7.51 Macabalan 45.15 Barangay 36 6.70 Macasandig 397.58 Barangay 37 2.79 Nazareth 68.31 Barangay 38 3.74 Puerto 887.99 Barangay 39 2.32 Puntod 164.90 Barangay 40 13.61 Source: Socio-Economic Profile of Cagayan de Oro City, 2010
B. Political Subdivision
There had been changes in the political subdivision of the city. Cagayan de Oro is divided into two districts by Republic Act 9371. The first district comprises the 24 barangays; barangays Baikingon, Besigan, Bonbon, Bulua, Canitoan, Carmen, Dansolihon, Iponan, Kauswagan, Lumbia, Mambuaya, Pagalungan, Pagatpat, Patag, Pigsag-an, San Simon, Taglimao, Tagpangi, Tignapoloan, Tuburan, and Tumpagon while the second district are barangays; Agusan, Balubal, Bugo, Camaman-an, Consolacion, Cugman, F.S. Catanico, Gusa, Indahag, Lapasan, Macabalan, Macasandig, Nazareth, Puerto, Puntod, Tablon, and all Poblacion Barangays 1-40.
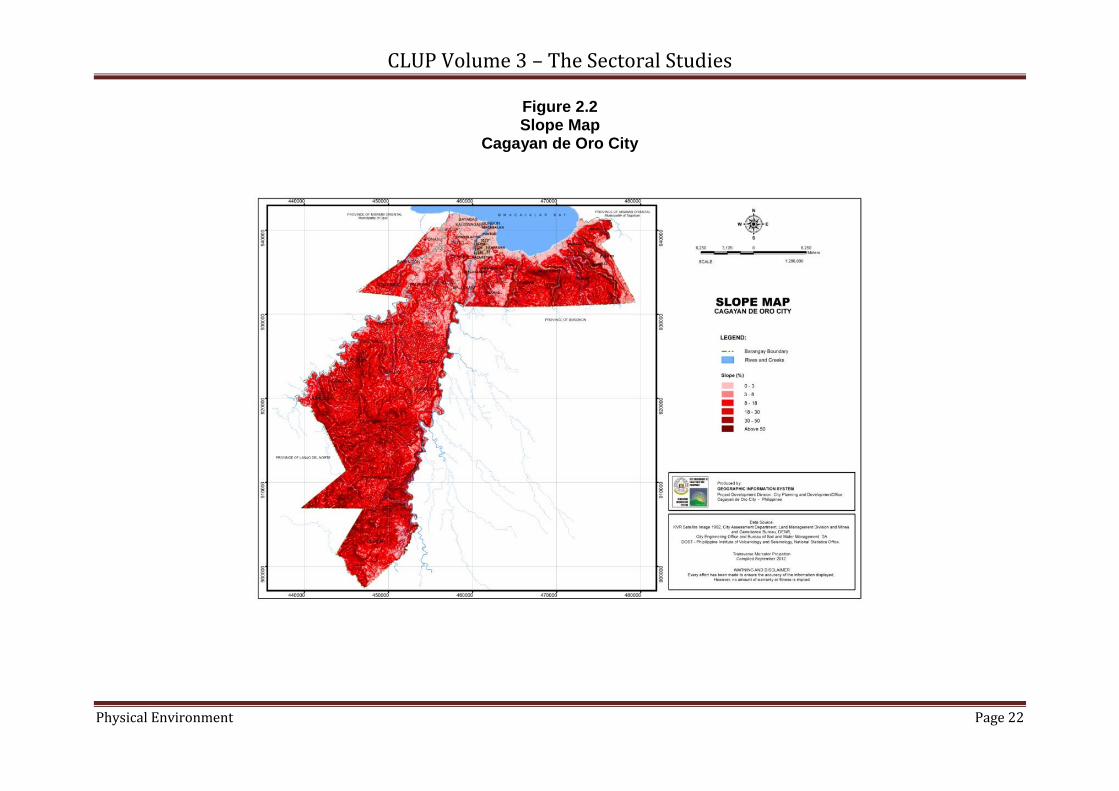
C. Topography and Slope
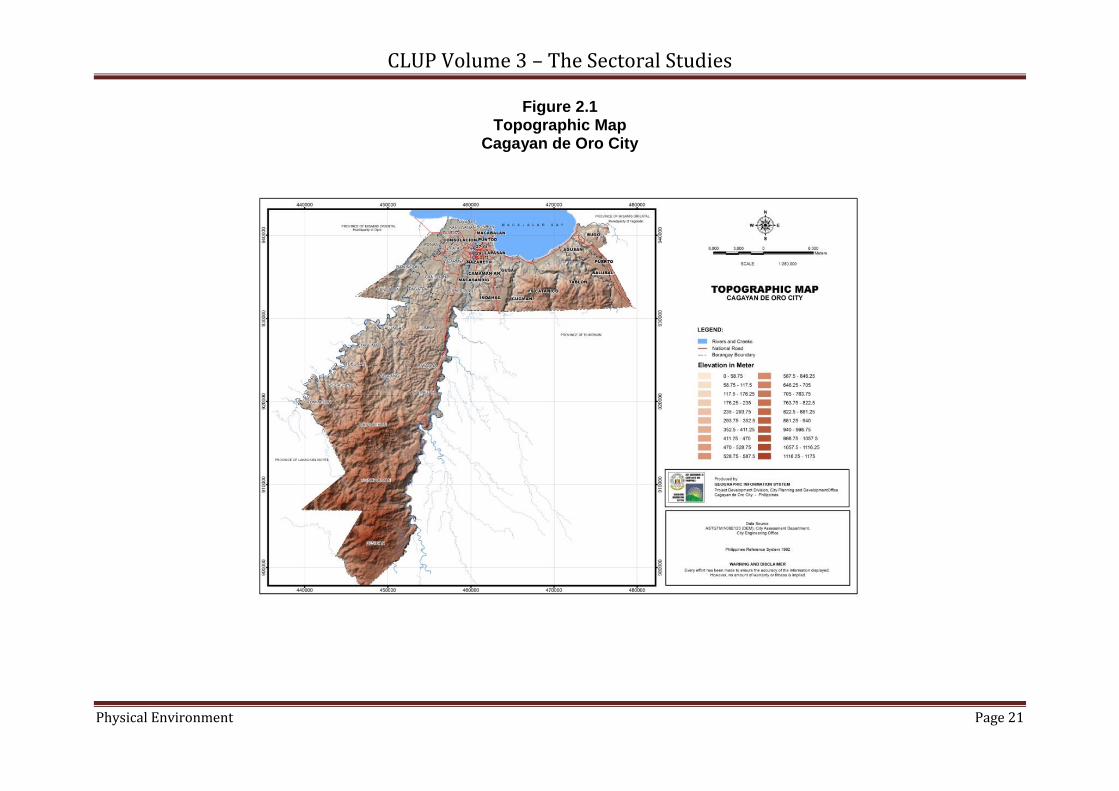
Cagayan de Oro City is characterized by a narrow coastal plain along the Macajalar Bay and by highland areas separated by steep inclined escarpment. The lowland is relatively flat and its elevation is not more than 10 meters above the mean sea level.
CLUP Volume 3 – The Sectoral Studies
Physical Environment Page 19
The highlands bound the City in the south from east to west, which consist of plateaus, terraces and gorges. Creeks and rivers traverse and drain to Macajalar Bay. There are seven rivers, namely: Cagayan River, Iponan River, Bigaan River, Cugman River, Umalag River, Agusan River and Alae River. The more notable creeks are Binono-an, Bitan-ag, Indulong, Kolambog, Sapong, and Umalag. About 13,587 hectares or 28 percent of the City's land area have a slope between 0 to 8 percent, which is appropriate for most land uses. Such areas are concentrated on the narrow coastal plain, the flood plain areas of the Cagayan and Iponan Rivers, and in the upland terraces. The remaining 72 percent of the land have slopes that are greater than eight percent which pose a challenge to development.
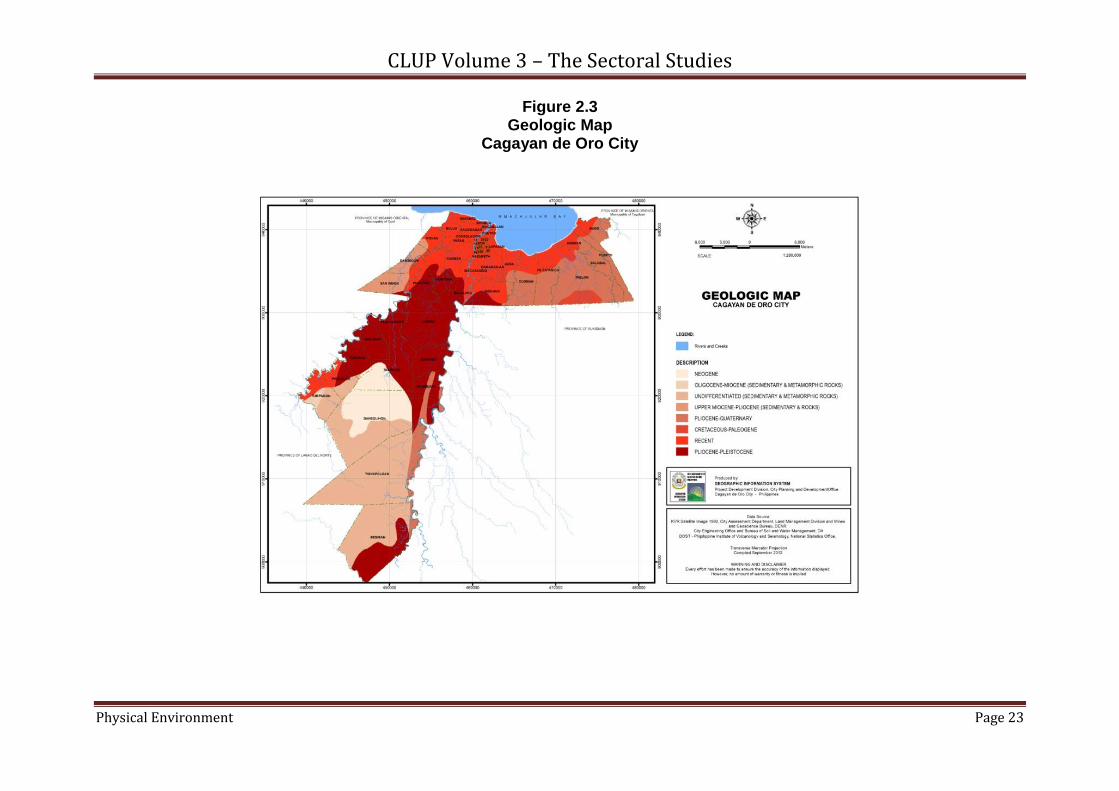
D. Geology
D.1 Geomorphological
Cagayan de Oro can be classified into three broad landforms: lowlands; level uplands; and hills/mountains. The lowlands contain five distinct forms, namely:
Sandbars. These are narrow, elongated strips of sand deposits formed by wave action on some sections of the coastline. The extent is insignificant.
Tidal Flats. These are low coastal areas, subjected to tidal influence found mainly between the mouths of Cagayan River and Iponan River.
Coastal Alluvial Plain. This is the narrow strip of level area from Puerto in the southeast to the center of the city.
Broad Alluvial Plain. This is found in a limited patch around a small hill south of the City.
River Flood Plain. The Iponan and Cagayan Rivers formed as extensive flood plain that coalesced north of the Cagayan-Iligan Highway. Such areas may be subjected to brief flooding during extraordinary rainfall events.
The uplands are classified into three forms:
Terrace or Plateau. There are three distinct plateaus that exist within the city limits. The most extensive one occupies the southeastern region. Another plateau is situated west of Cagayan River along the road to Lumbia, and Talakag of Bukidnon. The third is in the south-central region just north of Barangay Indahag.
Piedmont. This is an extensive upland area located along the road to Barangay Indahag and along the road to Malaybalay, Bukidnon.
Canyon/Gorge. These are the almost vertical walls along the very deeply incised river channels. The width of the canyon/gorges ranges from 500 to 1000 meters.
The hills/mountains take five different forms, as follows:
CLUP Volume 3 – The Sectoral Studies
Physical Environment Page 20
Escarpment. This is the steep slope separating the lowland plains from the hilly areas. In some sections, the slope is almost vertical.
Conglomerate Hill. Immediately above the escarpment area is a formation of conglomerate hills.
Limestone Hill. South of Lumbia is an extensive rolling hills made up of limestone. A smaller limestone area is located on the right side of Bigaan River.
Shale/Sandstone Hill. West of the Lumbia Airport is another sedimentary formation of shale/sandstone hills.
Volcanic Hill or Mountain. On the farthest end of the City along the Misamis Oriental - Bukidnon boundary are rugged and steep hills and mountains of volcanic origin.
E. Soil Types
Cagayan de Oro soils are predominantly clayey. Other soil structures are sand, sulfaquent, loam, and clayey loam. Soils which are good for agricultural production are San Manuel Loam and Bantog Clay. The Matima Clay and Umingan Clay Loam are of lesser quality for agricultural production. Other soil types which do not have any agricultural value are hydrosol, beach sand and stony clay. Some of these soils are in rough mountain regions not suitable for exploitation; others are in lowland which is suitable for resort and urban-related uses.
F. Climate and Rainfall
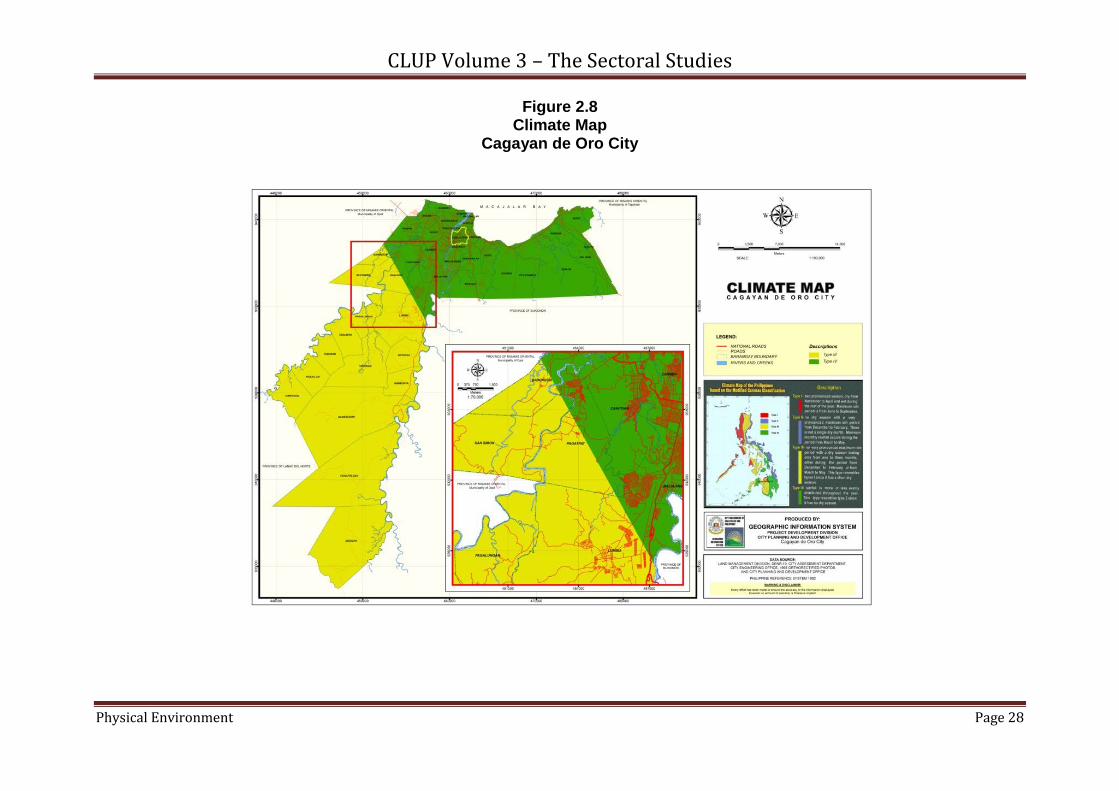
Cagayan de Oro City’s climate falls under Type III and IV of the Coronas Climate
Classification System of PAGASA. The western portion of Cagayan de Oro is
classified under Type III which is characterized by a short dry season, usually from
February to April, and Type IV climate in the eastern part of the City, characterized
by an almost evenly distributed rainfall during the whole year.
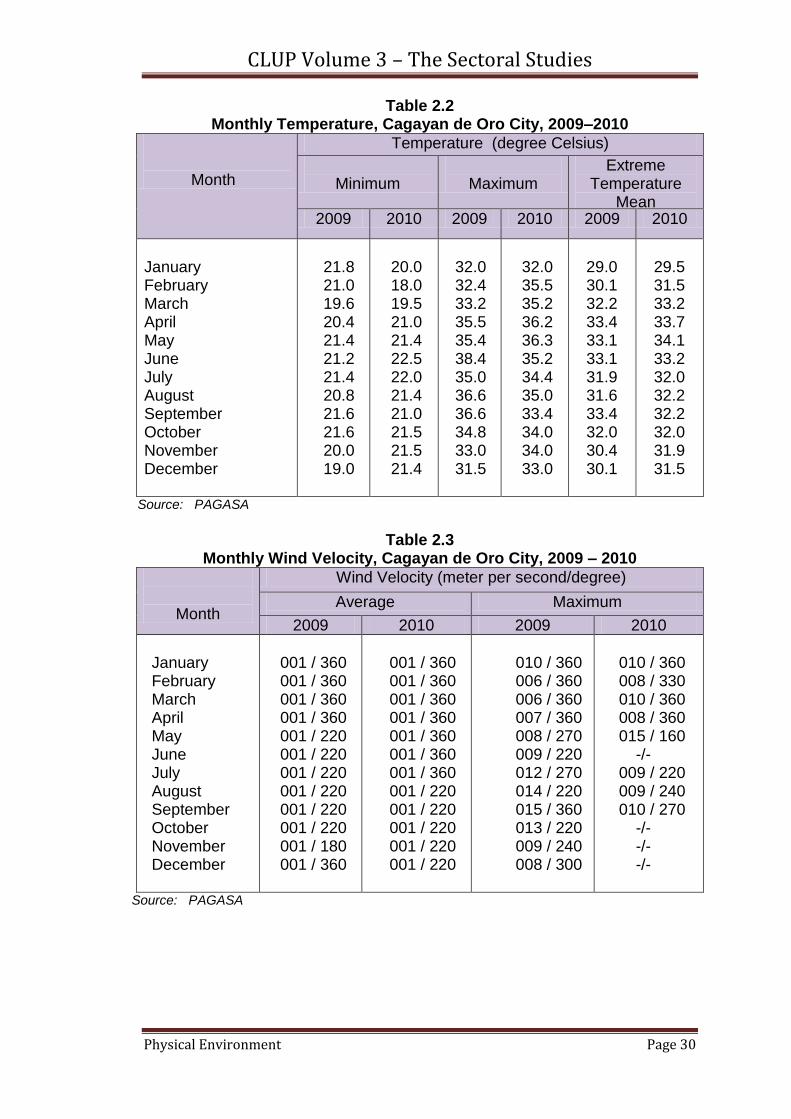
PAG-ASA records show that the average yearly total of rainfall is 1,806 millimeters. The average wind that ran in the city was registered at 002 meter per second in January until September and 001 meter per second for the month of August, October, November and December 2010. The coldest temperature in the city is at 18 degrees Celsius and was experienced in February. The hottest month which registered a temperature of 36.3 degrees Celsius was in May 2010.
CLUP Volume 3 – The Sectoral Studies
Physical Environment Page 21
Figure 2.1 Topographic Map
Cagayan de Oro City
CLUP Volume 3 – The Sectoral Studies
Physical Environment Page 22
Figure 2.2 Slope Map
Cagayan de Oro City
CLUP Volume 3 – The Sectoral Studies
Physical Environment Page 23
Figure 2.3 Geologic Map
Cagayan de Oro City

CLUP Volume 3 – The Sectoral Studies
Physical Environment Page 24
Figure 2.4 Soil Map
Cagayan de Oro City
CLUP Volume 3 – The Sectoral Studies
Physical Environment Page 25
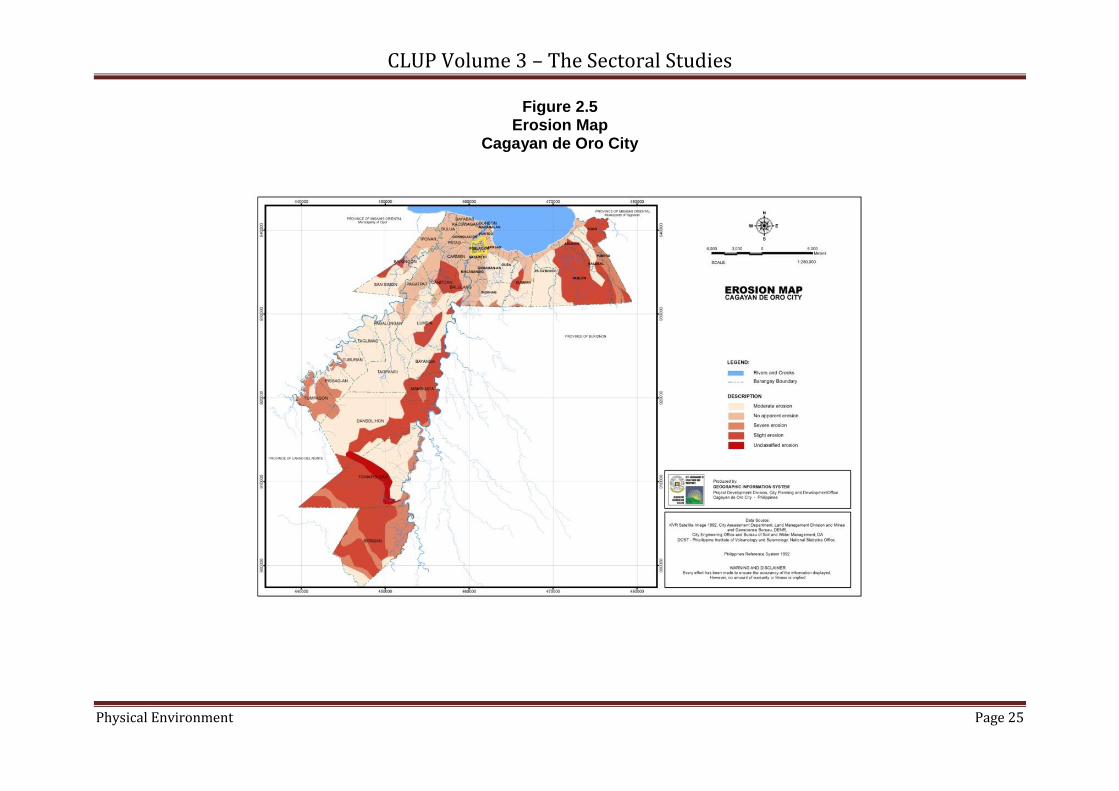
Figure 2.5 Erosion Map
Cagayan de Oro City
CLUP Volume 3 – The Sectoral Studies
Physical Environment Page 26
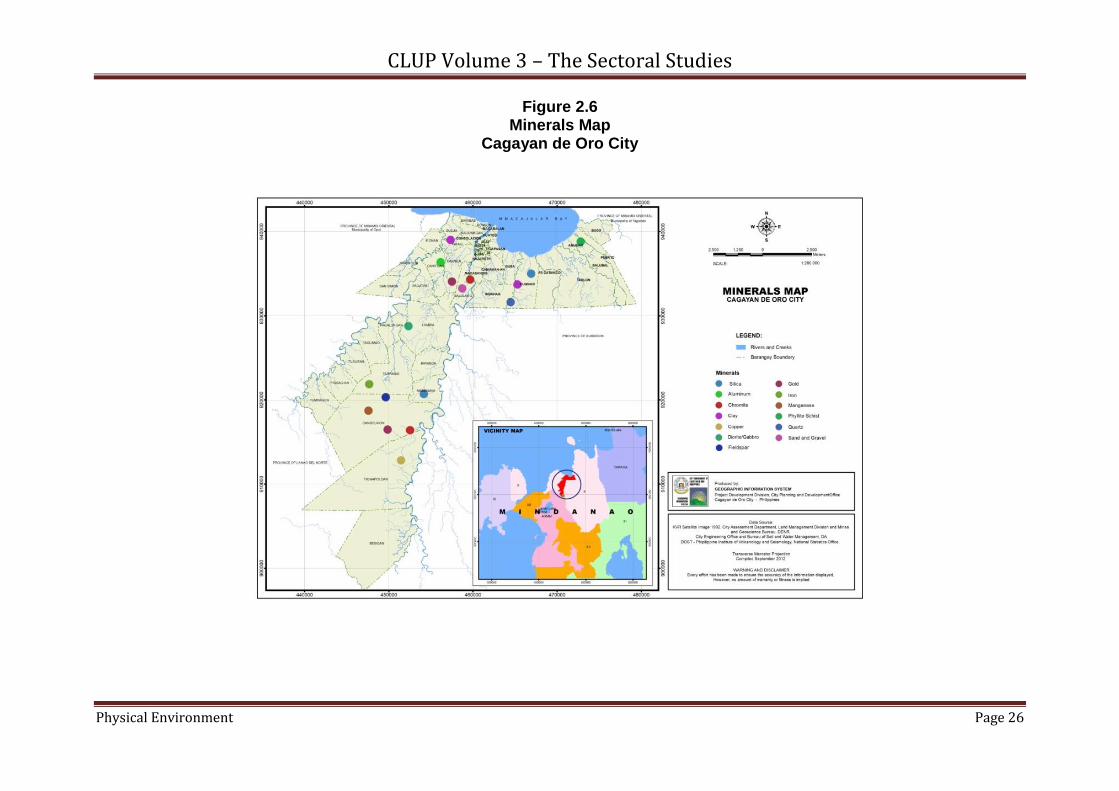
Figure 2.6 Minerals Map
Cagayan de Oro City
CLUP Volume 3 – The Sectoral Studies
Physical Environment Page 27
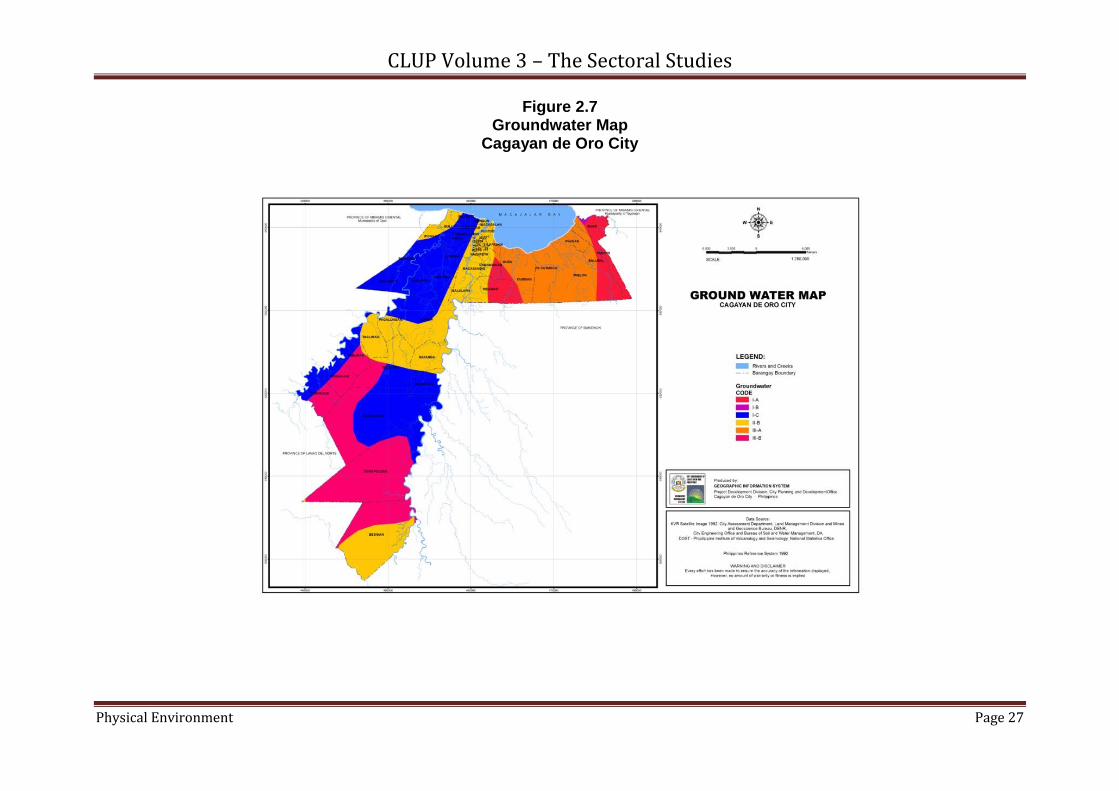
Figure 2.7 Groundwater Map
Cagayan de Oro City
CLUP Volume 3 – The Sectoral Studies
Physical Environment Page 28
Figure 2.8 Climate Map
Cagayan de Oro City

CLUP Volume 3 – The Sectoral Studies
Physical Environment Page 29
Figure 2.9 Climatological Data, Cagayan de Oro City, 2009-2010
Source: PAGASA
0
50
100
150
200
250
300
350
400
450
500
Jan Feb Mar Apr May Jun July Aug Sep Oct Nov Dec
457
207.
1
1
155
233.
7
189.
9
308.
1
138.
6
209.
7
107.
1
329.
3
36.2
153.
2
0.4 23
.3
16.4
153.
5
155.
3
353.
2
212.
2 264.
8
279.
7
62.8
131.
8
(mm
)
Monthly Rainfall
2009 2010
0
5
10
15
20
25
30
Jan Feb Mar Apr May Jun July Aug Sep Oct Nov Dec
21
13
0
911
19
26
1312
1715
9
14
1
43
11
23
26
1820
21
17
10
Num
ber o
f Days
Monthly Rainy Days
2009 2010
68
70
72
74
76
78
80
82
84
86
Jan Feb Mar Apr May Jun July Aug Sep Oct Nov Dec
84
86
79 79
83
80
85
77
7980
8483
86
77
75
77
79
8384
83 83 8384
85
(%)
Monthly Relative Humidity
2009 2010
CLUP Volume 3 – The Sectoral Studies
Physical Environment Page 30
Table 2.2 Monthly Temperature, Cagayan de Oro City, 2009–2010
Month
Temperature (degree Celsius)
Minimum
Maximum
Extreme Temperature
Mean 2009 2010 2009 2010 2009 2010
January February March April May June July August September October November December
21.8 21.0 19.6 20.4 21.4 21.2 21.4 20.8 21.6 21.6 20.0 19.0
20.0 18.0 19.5 21.0 21.4 22.5 22.0 21.4 21.0 21.5 21.5 21.4
32.0 32.4 33.2 35.5 35.4 38.4 35.0 36.6 36.6 34.8 33.0 31.5
32.0 35.5 35.2 36.2 36.3 35.2 34.4 35.0 33.4 34.0 34.0 33.0
29.0 30.1 32.2 33.4 33.1 33.1 31.9 31.6 33.4 32.0 30.4 30.1
29.5 31.5 33.2 33.7 34.1 33.2 32.0 32.2 32.2 32.0 31.9 31.5
Source: PAGASA
Table 2.3
Monthly Wind Velocity, Cagayan de Oro City, 2009 – 2010
Month
Wind Velocity (meter per second/degree)
Average
Maximum
2009 2010 2009 2010
January February March April May June July August September October November December
001 / 360 001 / 360 001 / 360 001 / 360 001 / 220 001 / 220 001 / 220 001 / 220 001 / 220 001 / 220 001 / 180 001 / 360
001 / 360 001 / 360 001 / 360 001 / 360 001 / 360 001 / 360 001 / 360 001 / 220 001 / 220 001 / 220 001 / 220 001 / 220
010 / 360 006 / 360 006 / 360 007 / 360 008 / 270 009 / 220 012 / 270 014 / 220 015 / 360 013 / 220
009 / 240 008 / 300
010 / 360 008 / 330 010 / 360 008 / 360 015 / 160
-/- 009 / 220 009 / 240 010 / 270
-/- -/- -/-
Source: PAGASA
CLUP Volume 3 – The Sectoral Studies
Physical Environment Page 31
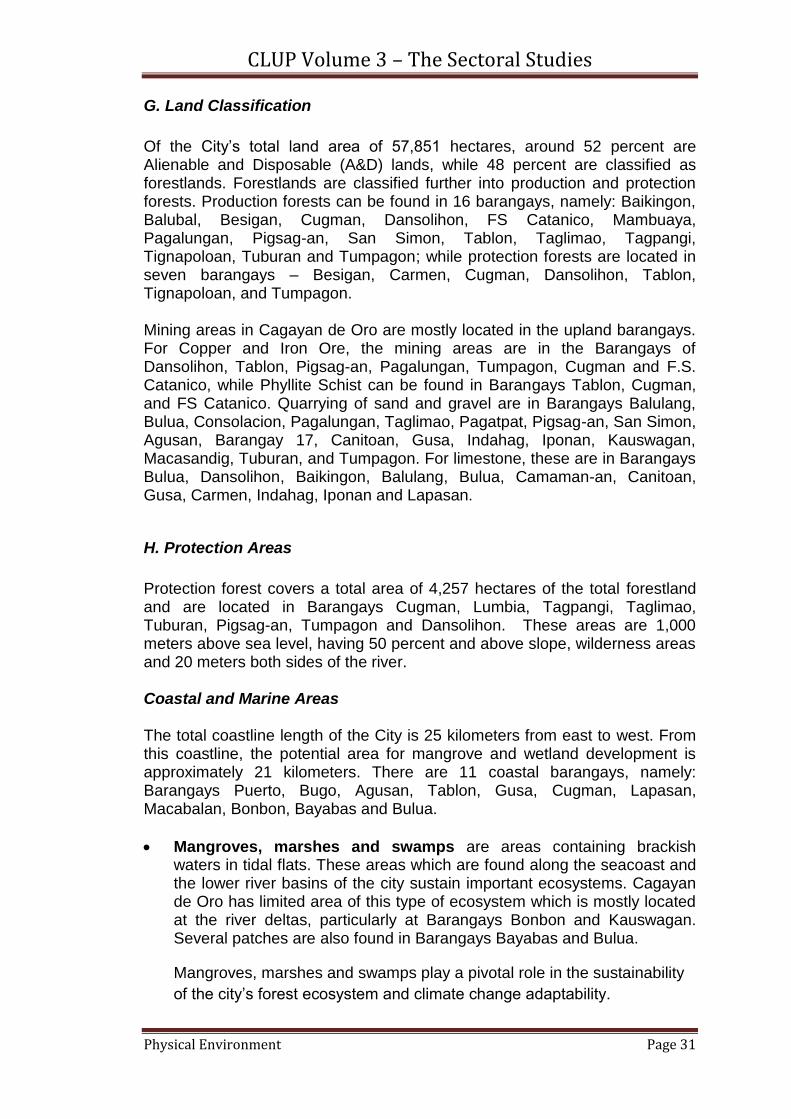
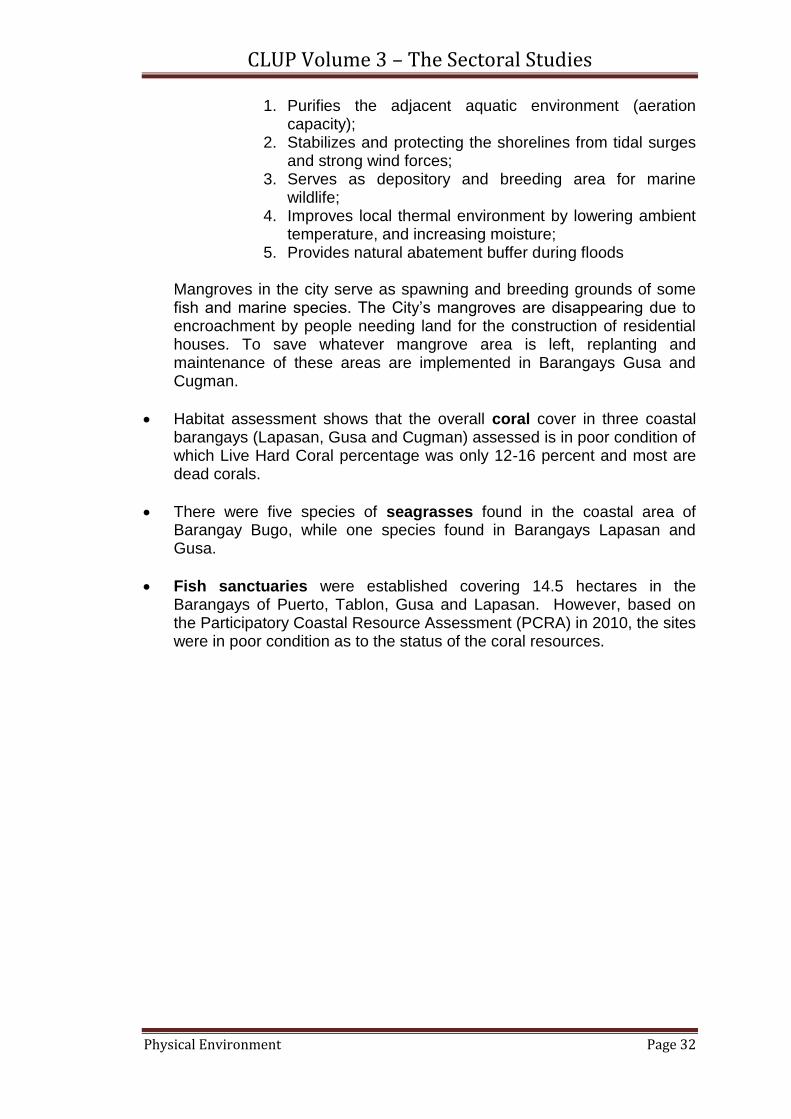
G. Land Classification
Of the City’s total land area of 57,851 hectares, around 52 percent are Alienable and Disposable (A&D) lands, while 48 percent are classified as forestlands. Forestlands are classified further into production and protection forests. Production forests can be found in 16 barangays, namely: Baikingon, Balubal, Besigan, Cugman, Dansolihon, FS Catanico, Mambuaya, Pagalungan, Pigsag-an, San Simon, Tablon, Taglimao, Tagpangi, Tignapoloan, Tuburan and Tumpagon; while protection forests are located in seven barangays – Besigan, Carmen, Cugman, Dansolihon, Tablon, Tignapoloan, and Tumpagon. Mining areas in Cagayan de Oro are mostly located in the upland barangays. For Copper and Iron Ore, the mining areas are in the Barangays of Dansolihon, Tablon, Pigsag-an, Pagalungan, Tumpagon, Cugman and F.S. Catanico, while Phyllite Schist can be found in Barangays Tablon, Cugman, and FS Catanico. Quarrying of sand and gravel are in Barangays Balulang, Bulua, Consolacion, Pagalungan, Taglimao, Pagatpat, Pigsag-an, San Simon, Agusan, Barangay 17, Canitoan, Gusa, Indahag, Iponan, Kauswagan, Macasandig, Tuburan, and Tumpagon. For limestone, these are in Barangays Bulua, Dansolihon, Baikingon, Balulang, Bulua, Camaman-an, Canitoan, Gusa, Carmen, Indahag, Iponan and Lapasan.
H. Protection Areas
Protection forest covers a total area of 4,257 hectares of the total forestland and are located in Barangays Cugman, Lumbia, Tagpangi, Taglimao, Tuburan, Pigsag-an, Tumpagon and Dansolihon. These areas are 1,000 meters above sea level, having 50 percent and above slope, wilderness areas and 20 meters both sides of the river. Coastal and Marine Areas The total coastline length of the City is 25 kilometers from east to west. From this coastline, the potential area for mangrove and wetland development is approximately 21 kilometers. There are 11 coastal barangays, namely: Barangays Puerto, Bugo, Agusan, Tablon, Gusa, Cugman, Lapasan, Macabalan, Bonbon, Bayabas and Bulua.
Mangroves, marshes and swamps are areas containing brackish waters in tidal flats. These areas which are found along the seacoast and the lower river basins of the city sustain important ecosystems. Cagayan de Oro has limited area of this type of ecosystem which is mostly located at the river deltas, particularly at Barangays Bonbon and Kauswagan. Several patches are also found in Barangays Bayabas and Bulua.
Mangroves, marshes and swamps play a pivotal role in the sustainability
of the city’s forest ecosystem and climate change adaptability.
CLUP Volume 3 – The Sectoral Studies
Physical Environment Page 32
1. Purifies the adjacent aquatic environment (aeration capacity);
2. Stabilizes and protecting the shorelines from tidal surges and strong wind forces;
3. Serves as depository and breeding area for marine wildlife;
4. Improves local thermal environment by lowering ambient temperature, and increasing moisture;
5. Provides natural abatement buffer during floods Mangroves in the city serve as spawning and breeding grounds of some fish and marine species. The City’s mangroves are disappearing due to encroachment by people needing land for the construction of residential houses. To save whatever mangrove area is left, replanting and maintenance of these areas are implemented in Barangays Gusa and Cugman.
Habitat assessment shows that the overall coral cover in three coastal barangays (Lapasan, Gusa and Cugman) assessed is in poor condition of which Live Hard Coral percentage was only 12-16 percent and most are dead corals.
There were five species of seagrasses found in the coastal area of Barangay Bugo, while one species found in Barangays Lapasan and Gusa.
Fish sanctuaries were established covering 14.5 hectares in the Barangays of Puerto, Tablon, Gusa and Lapasan. However, based on the Participatory Coastal Resource Assessment (PCRA) in 2010, the sites were in poor condition as to the status of the coral resources.
CLUP Volume 3 – The Sectoral Studies
Physical Environment Page 33
Figure 2.10 Land Classification Map
Cagayan de Oro City
CLUP Volume 3 – The Sectoral Studies
Physical Environment Page 34
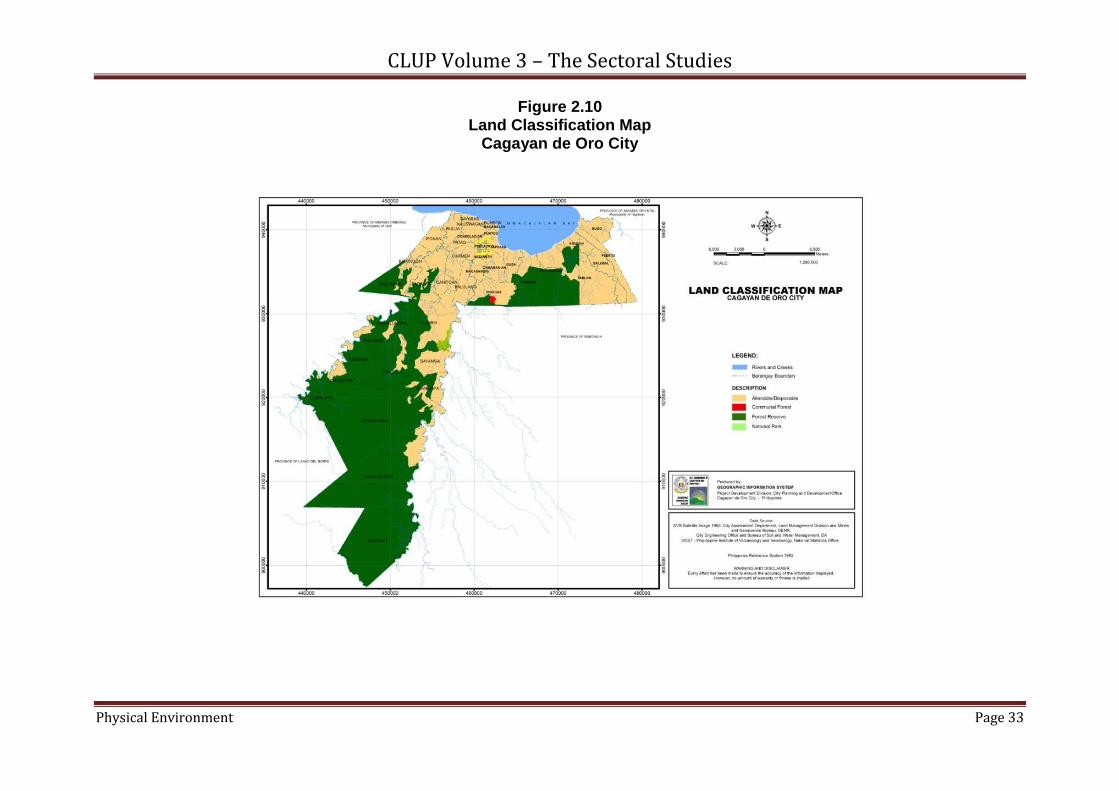
Figure 2.11 Land Cover Map
Cagayan de Oro City
CLUP Volume 3 – The Sectoral Studies
Physical Environment Page 35
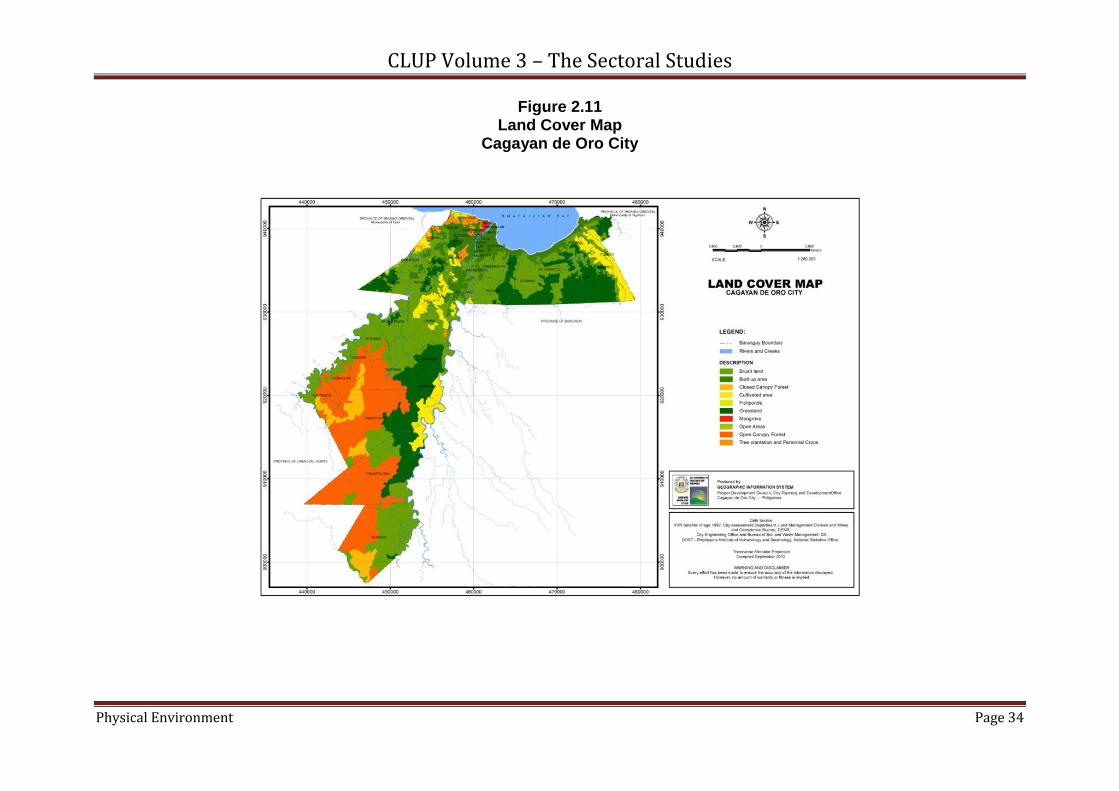
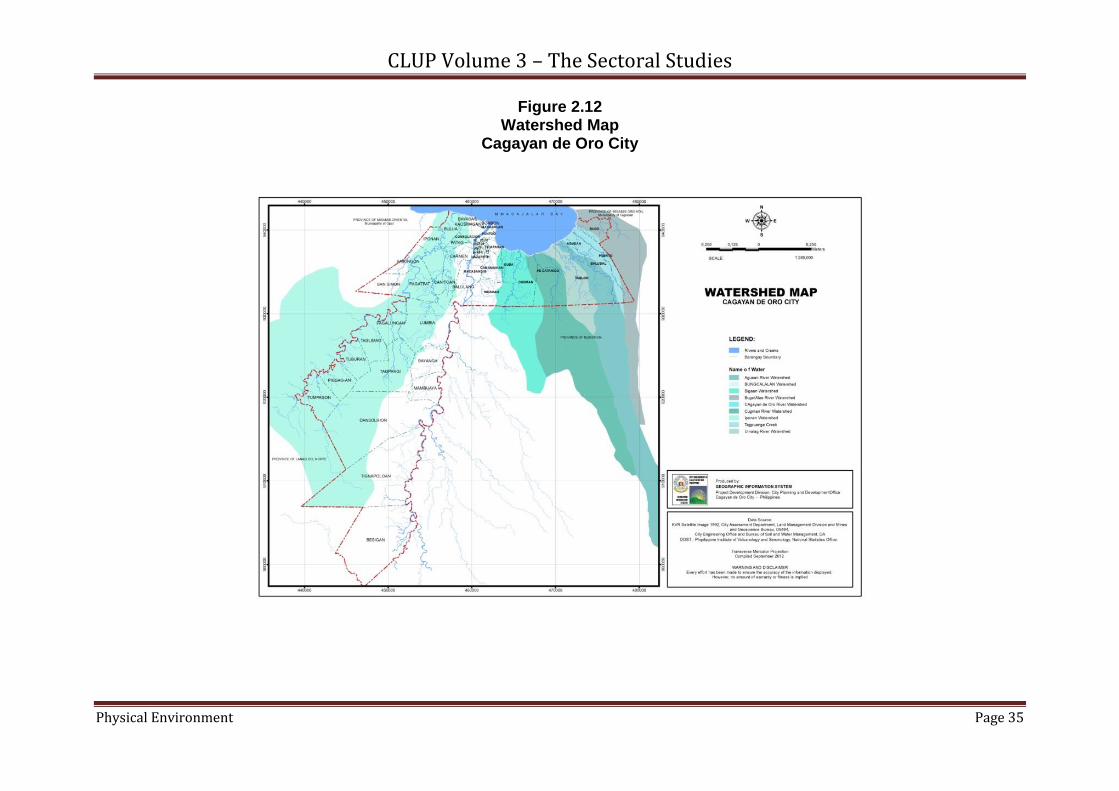
Figure 2.12 Watershed Map
Cagayan de Oro City