Embed Size (px)
Citation preview

Clover Industries LimitedIntegrated Report for the year ended 30 June 2018

OUR JOURNEY
Some 112 years later Clover’s shareholders took a giant visionary stride into the future by listing on the JSE on 14 December 2010 to raise the capital needed to grow a Way Better Clover upon its fundamental dairy base. Clover has since embarked on a value creation journey that in 2018 saw Clover being acclaimed as South Africa’s most reputable company for a third time in the Reputation Institutes RepTrak® South Africa 2018 survey.
AS THE 19TH CENTURY DREW TO A CLOSE, A GROUP OF DAIRY FARMERS SPREAD ACROSS THE FERTILE NATAL MIDLANDS DECIDED TO ORGANISE THEMSELVES BY FOUNDING A DAIRY CO-OPERATIVE. THROUGH ASTUTE VISION AND LEADERSHIP, THEIR HUMBLE CO-OPERATIVE GREW INTO SOUTH AFRICA’S LEADING DAIRY BUSINESS.
2010 CLOVER SELLS ITS 45% SHAREHOLDING IN DANONE CLOVER (PTY) LTD TO GROUP DANONE. Clover Industries Limited undergoes a capital restructuring – removes condition that only milk producers may hold ordinary shares. De-link-S ordinary share from milk supply. Repurchase 34.9% ordinary shares from Hosken Consolidated Investments Ltd. Convert preference shares to debt-only instruments.
2010 CLOVER INDUSTRIES LIMITED LISTED ON MAIN BOARD of the JSE Limited on 14 December.
1898
Clover Industries Limited Integrated Report for the year ended 30 June 2018
2013THE CLOVER WATERS JOINT VENTURE (IN TERMS OF WHICH CLOVER OWNS 70% AND NESTLÉ OWNS 30%) IS FORMED, expanding Clover’s portfolio of value added and branded beverage products. Clover is associated with global brands such as Nestlé Purelife which opens up opportunities in the sub-Saharan market.
2014THE REAL BEVERAGES COMPANY (PTY) LTD, a wholly-owned subsidiary of Clover SA (Pty) Ltd, was acquired from Dairybelle (Pty) Ltd with effect from 1 December.
2017CLOVER ESTABLISHES CLOVER PRIDE (PTY) LTD, which provides the Company with an entry into the olive and olive oil business.
CLOVER ESTABLISHES DAIRY FARMERS OF SOUTH AFRICA (PTY) LTD to allow Clover to continue its strategy of developing higher margin, value added products, while continuing to support its producers’ volume growth goals.
2015CLOVER AND FRANKIES OLDE SOFT DRINK COMPANY FORMED A NEW COMPANY CALLED CLOVER FRANKIES (PTY) LTD, which acquired the entire soft drink business from Frankies Olde Soft Drink Company (Pty) Ltd with effect from 1 November.
2016CLOVER SA (PTY) LTD AND GOOD HOPE INTERNATIONAL BEVERAGES SA (PTY) LTD FORMED A NEW COMPANY CALLED CLOVER GOOD HOPE (PTY) LTD, which acquired the entire soya milk business from Good Hope International Beverages SA (Pty) Ltd. Clover SA (Pty) Ltd owns 51% of Clover Good Hope (Pty) Ltd with effect from 1 May.
Clover Industries Limited Integrated Report for the year ended 30 June 2018 1

CONTENTS
IN THE SPOTLIGHT FOR 20182018 highlights and challenges
Chairman’s report
INTRODUCING CLOVER’S STORYMeet Clover
Clover’s business model
Directorate and management
Governance structure
Report on governance, risk and compliance
Reputation as a value driver
ANALYSING CLOVER’S VALUE CREATIONHow our stakeholders’ needs inform our reality
Our strategy
LEADERSHIP REVIEWSCEO’s report
CFO’s report
7
8
10
15
16
18
20
22
24
32
35
36
40
43
44
49
This section of the report provides a summarised review of the year’s performance and a snapshot of the highlights and risks of 2018.
If you want to get to know Clover as an organisation, read this section to gain insight into the fundamentals of our business: Who we are, what we do, how we create value and how we are governed. This is an analysis of Clover’s internal operating environment.
In this section we take you through the process that we follow in analysing our ability to create value. We unpack the external variables that impact on our ability to deliver value; we present the findings from a process of stakeholder engagement; we define the material issues and we analyse the top risks and opportunities. We then use this information to help us determine and evaluate a strategy that will ensure sustainable value creation.
Using the analysis from the section above, our CEO and CFO provide a review of the Group’s performance by taking a closer look at how the operational, strategic and financial performance have translated into value-enhancing outcomes. This section also provides a summary of the board’s milestone achievements for 2018.
Clover Industries Limited Integrated Report for the year ended 30 June 20182
PERFORMANCE OUTCOMES OF THE SIX CAPITALSHuman capital
Natural capital
Manufactured capital
Intellectual capital
Social and relationship capital
Financial capital
Combined assurance on the six capitals
REMUNERATION REPORT
ANNUAL FINANCIAL RESULTS
SHAREHOLDER INFORMATIONShareholder analysis
57
60
64
66
70
72
78
83
87 103 199
199
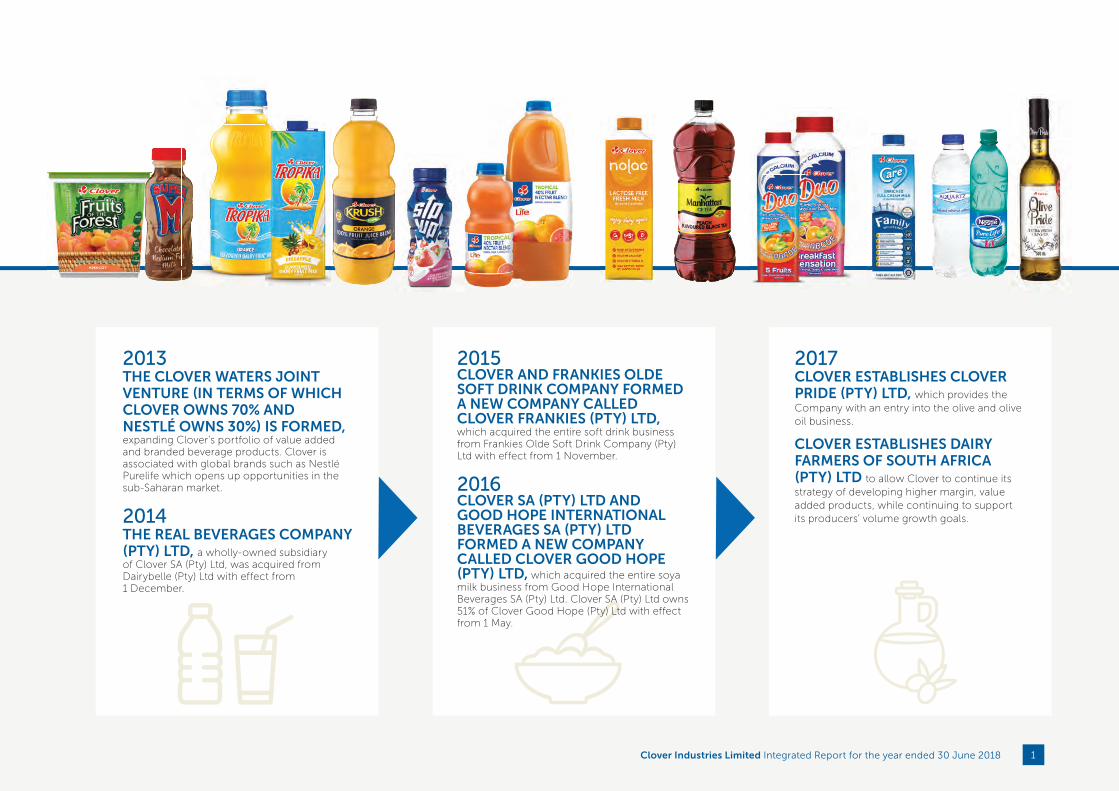
This section of the report provides a detailed account of the outcomes achieved as a result of our strategic initiatives in 2018. We unpack the inputs and outcomes for each of the six capitals.
This section of the report presents our remuneration report and remuneration policy for the year ended 30 June 2018.
The annual financial statements provide a touchstone to Clover’s ability to perform and create value. This section provides the audited financial statements for the 12-month reporting period from the 1st of July 2017 to the 30th of June 2018.
This section provides insight into our shareholder base as well as our share price performance for the year ended 30 June 2018.
Clover Industries Limited Integrated Report for the year ended 30 June 2018 3

ABOUT THIS REPORT
SCOPE AND BOUNDARYTHIS INTEGRATED REPORT IS A CONCISE ACCOUNT OF THE OPERATIONAL AND FINANCIAL AFFAIRS OF CLOVER INDUSTRIES LIMITED (“CLOVER” OR THE “COMPANY” OR THE “GROUP”) FOR THE FINANCIAL PERIOD 1 JULY 2017 TO 30 JUNE 2018.
The scope of this report covers Clover’s South African operations and will in time be extended to our subsidiaries in other countries. This report focuses on the most relevant and material issues that could impact significantly on Clover’s ability to create and sustain value for its stakeholders in the long-term.
It deals with how Clover delivered against stated objectives and the way it executed its strategies. Throughout this integrated report we address Clover’s challenges, opportunities and the external factors that impact our operations and the broader communities we serve.
This report also covers the processes through which Clover interacts and communicates with its stakeholders, as well as how the Group has adopted and applied the principles and practices of sound corporate governance to safeguard the interests of all our stakeholders.
COMPLIANCE The board has satisfied itself that Clover has conformed to the requirements of the Companies Act, 71 of 2008 (Regulation 43), the JSE Listings Requirements and IFRS. The integrated reporting process, as well as the content of this report has been guided by the recommended principles and practices of the International Integrated Reporting Framework and King IV™ (copyright and trademarks are owned by the Institute of Directors in Southern Africa NPC and all of its rights are reserved).
A detailed application register of the King IV™ principles can be found on the Group’s website at www.clover.co.za.
MATERIALITYOnly matters considered by the board and executive management as material to the business and its sustainability have been included in this integrated report.
Clover’s potential material matters emerge through our risk management process and stakeholder feedback. The board and Audit and Risk Committee meets at least once a quarter to review all risk management processes, procedures and outcomes.
FORWARD-LOOKING STATEMENTSThis report may contain forward-looking statements that reflect the Group’s expectations at year-end. Whilst due care has been applied in the preparation of this report, readers are cautioned not to place undue reliance on these statements as
forecasts are subject to uncertainty and contingencies outside Clover’s control. Actual results may vary materially from the Group’s expectations.
INTEGRATED COMBINED ASSURANCEAll disclosures included in this report are intended to provide meaningful, accurate, complete, transparent and balanced information to stakeholders. Page 83 elaborates on the combined assurance on the six capitals.
Together with the horizontal and vertical relationships with assurance providers, this integrated, combined assurance model assists the board in assessing the adequacy of the internal control environment and assessing the integrity of information used for decision-making and reporting. Clover understands that insightful reporting for our shareholders is an important consideration for establishing this assurance model.
More information on the Company, its operations and impact on the environment and communities it serves is available at www.clover.co.za.
Clover Industries Limited Integrated Report for the year ended 30 June 20184
SOCIAL AND RELATIONSHIP CAPITAL
INTELLECTUAL CAPITAL
MANUFACTURED CAPITAL
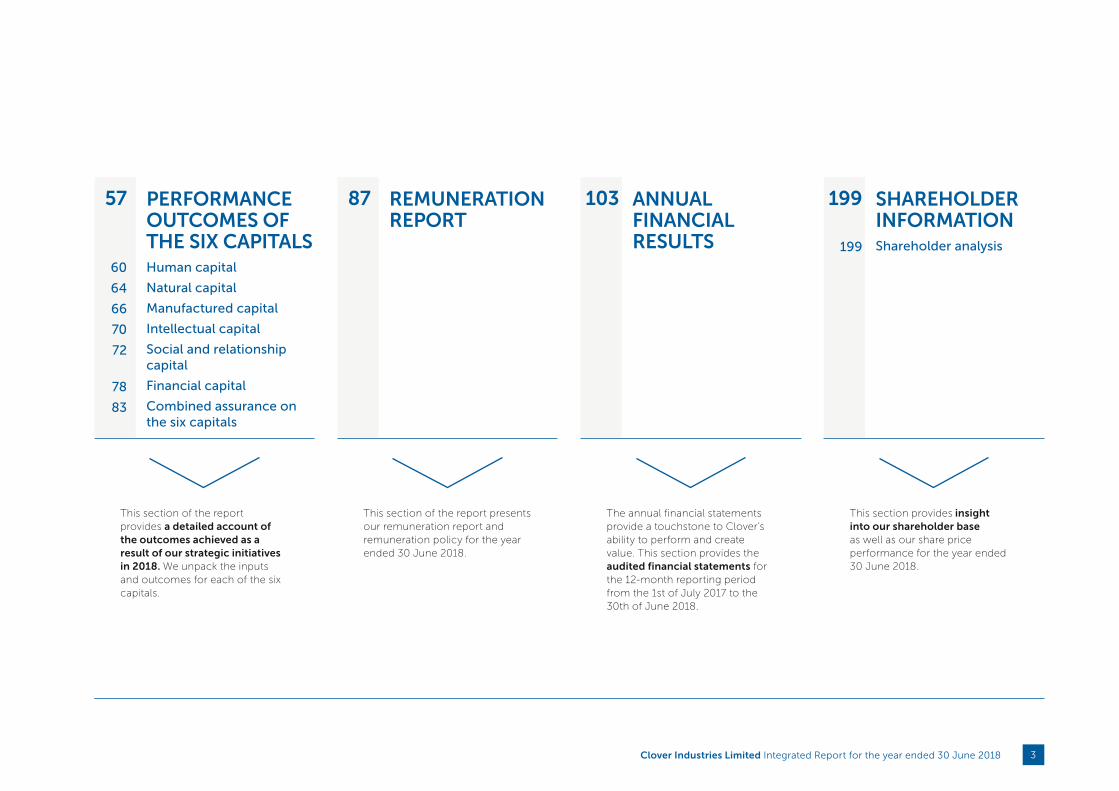
BOARD APPROVAL AND RESPONSIBILITY STATEMENTClover’s Board of Directors (the board) acknowledge their responsibility for ensuring the accuracy of this 2018 integrated report. The board has applied its collective expertise to this report and, in their opinion, this report addresses all material issues and presents an integrated and accurate view of Clover’s performance in the year under review.
Based on the recommendations of the board committees, the board approved this integrated report on 26 September 2018 for release prior to 30 September 2018.
W Basson S Booysen W Buchner
N Mokhesi F Morgan B Ngonyama
F Scheepers N Smith J Vorster
FINANCIAL CAPITAL
NATURAL CAPITAL
HUMAN CAPITAL
NAVIGATION BARSIX CAPITALS
PAGE REFERENCE
WEBSITE REFERENCE
STRATEGIC FOCUS AREAS FURTHER REFERENCES
92
GROWTH THROUGH PRODUCT AND BRAND DEVELOPMENTSFA 1
DISTRIBUTION EFFECTIVENESS AND REACH (INCLUDING AFRICA EXPANSION)
SFA 3
VOLUME GROWTH AND MARKET SHARE RECOVERYSFA 2
COST MANAGEMENT AND PRODUCTION EFFICIENCIESSFA 4
WIN-WIN STAKEHOLDER RELATIONSHIPSSFA 5
Clover Industries Limited Integrated Report for the year ended 30 June 2018 5
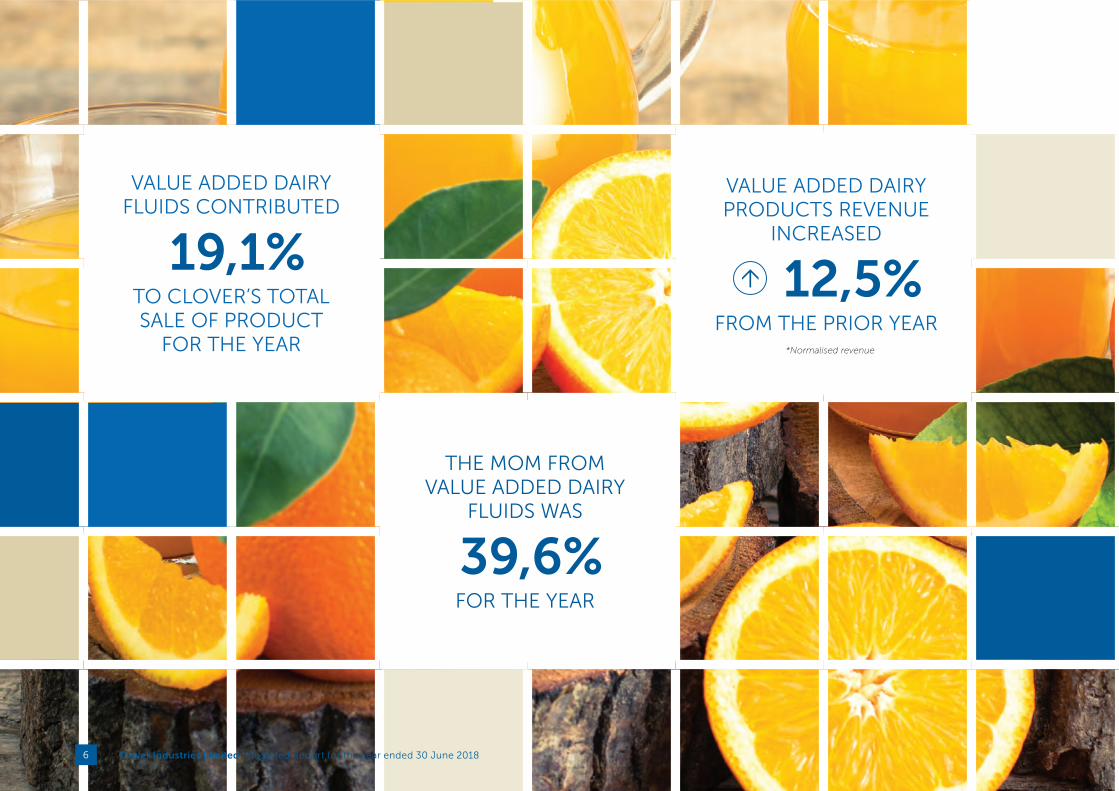
VALUE ADDED DAIRY FLUIDS CONTRIBUTED
19,1%TO CLOVER’S TOTAL SALE OF PRODUCT
FOR THE YEAR
THE MOM FROM VALUE ADDED DAIRY
FLUIDS WAS
39,6%FOR THE YEAR
VALUE ADDED DAIRY PRODUCTS REVENUE
INCREASED
12,5%FROM THE PRIOR YEAR
*Normalised revenue
Clover Industries Limited Integrated Report for the year ended 30 June 20186

IN THE SPOTLIGHT FOR 2018
Clover Industries Limited Integrated Report for the year ended 30 June 2018 7
IN T
HE
SP
OT
LIGH
T
FOR
20
18IN
TR
OD
UC
ING
CLO
VE
R’S S
TO
RY
AN
ALY
SIN
G C
LOV
ER
’S V
ALU
E C
RE
AT
ION
LEA
DE
RS
HIP
R
EV
IEW
SP
ER
FOR
MA
NC
E O
UT
CO
ME
S O
F TH
E S
IX C
AP
ITA
LS
RE
MU
NE
RA
TIO
N
RE
PO
RT
AN
NU
AL FIN
AN
CIA
L R
ES
ULT
SS
HA
RE
HO
LDE
R
INFO
RM
AT
ION

2018 HIGHLIGHTS AND RISKS
EXECUTION OF EFFICIENCY DRIVE
SUCCESSFUL LAUNCHES OF NEW PRODUCTS AND GROWTH IN VOLUMES OF VALUE ADDED PRODUCT PORTFOLIO
RECLAIMED MARKET SHARES IN SELECTED CATEGORIES
3MARKET SHARE FOR PROCESSED CHEESE
5.6%
MARKET SHARE FOR MAAS
3.7%
MARKET SHARE FOR FETA CHEESE
3.3%
HIGHLIGHTS
1MANUFACTURING COSTS CONTAINED AT
1.9%*COST OF SALES CONTAINED AT
6.9%• Consolidation of factories
• Retendering led to better prices and terms from suppliers
• Reduce complexities in the business
• Reduced impact of sugar taxes by re-formulating recipes
SUCCESSFUL ROLL-OUT OF WIDER DISTRIBUTION REACH (MASAKHANE)
DESPITE EXTERNAL MACRO CHALLENGES BEYOND OUR CONTROL, CLOVER ACHIEVED SOME REMARKABLE RESULTS IN 2018.
2NEW LAUNCHES
Krush Cranberry (April 2018)
Rooibos Ice Tea (April 2018)
Cream O’Naise (August 2017)
Whistling Chef (June 2018)
GROWTH IN VOLUMES OF VALUE-ADDED PRODUCT PORTFOLIO
• Yoghurt 23,2%
• Numel 93,4%
4SECONDARY DISTRIBUTION COSTS
3.6%AN INCREASE IN OUR DELIVERY POINTS TO
46 810FROM 30 887 IN THE
PREVIOUS YEAR
• Africa expansion is gaining traction
• Increased our reach to smaller customers
* Normalised, referring to the comparative numbers adjusted for the unbundling of DFSA in the current year
Clover Industries Limited Integrated Report for the year ended 30 June 20188

FINANCIAL PERFORMANCE RETURNED TO HISTORIC PROFITABILITY LEVELS (BASED ON NORMALISED PROFITABILITY
5HEPS AS REPORTED
136.2%TO (23.1 CENTS)
HEADLINE EARNINGS AS REPORTED
136.3%TO (R44.2 MILLION)
NORMALISED HEPS*
223.8%TO 206.9 CENTS
NORMALISED HEADLINE EARNINGS*
224.7%TO R394.9 MILLION
OPERATING PROFIT
94.3%TO R611 MILLION
TOTAL DIVIDEND PER SHARE
210.8%TO 75.24 CENTS
Risks are addressed or mitigated by continuously adapting our strategy and focusing on emerging and material risks faced by the Group.
Governance of risks and actions to mitigate material risks are explained on page 27 to 29.
HOW DO WE MITIGATE THESE RISKS
UPSKILLING AND TRAINING OF OUR PEOPLE AND DEVELOPMENT OF A NEW HR STRATEGY
6• Minimisation of job losses
during the business restructuring process undertaken during the period under review through upskilling and placement in alternative positions throughout the business.
• Focused implementation of learning interventions resulting in optimisation of funding opportunities whilst contributing to skills development in alignment with the national skills development strategy.
• Development of new HR strategy (refer to page 63)
RISKS
FOOD HEALTH AND SAFETY• Stricter regulatory
compliance is expected to promote consumer
health and safety
VOLATILE LABOUR ENVIRONMENT WITH
INCREASED PRESSURE ON LABOUR COSTS
DFSA’S SUSTAINABILITY IMPACTING CLOVER’S SERVICES RENDERED INCOME AND RECOVERABILITY OF REVOLVING CREDIT FACILITY
CHANGES IN COMPETITIVE LANDSCAPE• Increased competition
for consumer spend from retailer own brands, other branded dairy offerings
• Retail centralisation
06
04 03
01
0205NON-COMPLIANCE WITH LEGISLATION
PRINCIPAL INCOME UNDER PRESSURE AND LOSS OF PRINCIPAL INCOME• On 5 September 2018, Remgro gave
notice of termination of the distribution and warehousing services relating to the margarine and spreads business
• The distribution agreement will terminate on 3 March 2019
* Refer to Annexure II on page 206
Clover Industries Limited Integrated Report for the year ended 30 June 2018 9
IN T
HE
SP
OT
LIGH
T
FOR
20
18IN
TR
OD
UC
ING
CLO
VE
R’S S
TO
RY
AN
ALY
SIN
G C
LOV
ER
’S V
ALU
E C
RE
AT
ION
LEA
DE
RS
HIP
R
EV
IEW
SP
ER
FOR
MA
NC
E O
UT
CO
ME
S O
F TH
E S
IX C
AP
ITA
LS
RE
MU
NE
RA
TIO
N
RE
PO
RT
AN
NU
AL FIN
AN
CIA
L R
ES
ULT
SS
HA
RE
HO
LDE
R
INFO
RM
AT
ION
CHAIRMAN’S REPORT
Dear Stakeholder,
The 2018 financial year was pivotal for Clover as it rebounded from a disappointing prior period to deliver an excellent performance by facing challenges head on and mitigating those within its control.
MACRO-ECONOMIC BACKDROPGlobal economic growth prospects strengthened during the first half of our financial period with a notable recovery in global trade mainly underpinned by a rebound in commodity exports, investment in developed economies and upbeat growth prospects in several emerging markets. The global operating environment was stable up to a point where we started to see an uptick in oil prices, a critical component and cost in doing business. The global environment gradually deteriorated during the second half of our financial year as protectionist and counter protectionism policies worsened trade relations and resulted in trade imbalances.
After a stagnation in Gross Domestic Product (GDP) growth, South Africa experienced an upturn in the second half of 2017 and while expectations were for this to continue in the short-term, the market was dealt a blow when it was announced that GDP contracted by 2.2% in the first quarter of 2018.
Political uncertainty was rife during the second half of 2017 with the private sector hoarding their resources as corruption and state capture allegations eroded business confidence. The appointment of Mr Cyril Ramaphosa as president in February 2018 with promises of the rooting out of corruption, stabilisation of state owned enterprises and an over R1.2 trillion investment drive brought much needed optimism to the country. This optimism was however overshadowed by poor economic growth, policy uncertainty (especially around an escalating drive to accelerate expropriation of land without compensation), high unemployment figures and increasing fuel and electricity costs. These factors weighed heavily on consumers and businesses alike, fuelling competitive trade activity. Added to this, the health promotion levy (sugar tax) and VAT increase took effect from April 2018.
From a retail perspective, the quarter to December 2017 was marked by sales growth exceeding market expectations specifically due to the volume increase experienced in November 2017 which was driven by consumers taking advantage of Black Friday promotions. Retail sales in the first half of 2018 were however disappointing following increased pressures on consumers and disposable income. While Clover benefitted from the normalisation of weather conditions in terms of lower raw milk and fruit pulp costs, the cooler and rainy weather in some parts of the country during the first part of December impacted volumes.
For context on the global and domestic dairy industry, readers should refer to the Bureau for Food and Agricultural Policy’s baseline agricultural outlook for 2018 to 2027. It provides a good perspective and is available at http://www.bfap.co.za/wp-content/uploads/2018/08/BFAPBaseline-2018.pdf.
STRATEGIC DIRECTIONA rigorous series of efficiency improvement initiatives were implemented in the latter part of the 2017 financial year
THE 2018 FINANCIAL YEAR WAS PIVOTAL FOR CLOVER AS IT REBOUNDED FROM A DISAPPOINTING PRIOR PERIOD TO DELIVER AN EXCELLENT PERFORMANCE BY FACING CHALLENGES HEAD ON AND MITIGATING THOSE WITHIN ITS CONTROL
Clover Industries Limited Integrated Report for the year ended 30 June 201810

to re-align the business to the new ‘normal’ described previously. These initiatives include, but are not limited to, the unbundling of the volume- driven side of the business through the establishment of Dairy Farmers South Africa (“DFSA”), the launch of Project Sencillo (asset optimisation program), the ongoing roll-out of Project Masakhane, new product launches, and product reformulations to lower ingredients and sugar costs. Clover’s strategic emphasis was centred around consumers, looking at ways to lessen the pressure they faced and to produce products that they value. Accordingly, the decision was taken to plough back savings achieved through the above-mentioned efficiency drives into Clover’s selling prices and to launch products that add value to consumers and for which they are willing to pay a premium.
The executive team diligently executed these strategic initiatives which started yielding encouraging results as evidenced in the positive performance.
Last year I unpacked the DFSA restructuring in detail and I provide an update below. The other strategic initiatives are discussed in detail in the CEO section on page 44 of this integrated report while detail on the financial performance can be found in the CFO report on page 49.
DAIRY FARMERS OF SOUTH AFRICA (“DFSA”) RESTRUCTURINGSince listing, Clover has followed a strategy of diversifying away from bulk, commoditised food stuffs, to focus more on value-added, branded products. This year saw Clover moving closer to becoming a fully-fledged FMCG business following the exit and transfer of its non-value added dairy business to DFSA, a separate entity in which Clover retained a 26% strategic shareholding. As part of the agreement, Clover provides production, distribution, merchandising and other services to DFSA who became Clover’s largest principal.
This being a substantial transaction, and a change from the norm for the past 120 years, some teething problems were experienced. I appreciate the hard work by both Clover management and the board of DFSA in bedding down
the restructure. The bulk of DFSA products are exposed to the cyclical nature of the dairy industry and as such, the underlying business performance of DFSA can only be evaluated over time once a full cycle has been completed.
Due to the current supply and demand cycle in the dairy industry, DFSA reported a loss during the review period as can be seen on page 133 in the financial section of this report. Clover’s exposure to this business lies in the significant principal fee income from DFSA, as well as the supply of working capital. Given the strategic nature of the relationship and the important inter dependencies, Clover has to provide ongoing support to DFSA in the form of subordinating a portion of the working capital revolving facility to DFSA in favour of other creditors until such time that the DFSA assets, fairly valued, exceeds its liabilities. On 11 September 2018, the board received unexpected notification that DFSA’s CEO has resigned with effect from 30 April 2019. I understand that the huge conflict between losing market share or losing milk producers during what has been a particularly challenging time for the dairy industry in general played, a large role in his decision.
Subsequently, DFSA’s chairman also tendered his resignation, providing the DFSA’s producer shareholders an opportunity to appoint their own, independent CEO and chairman. The DFSA board will begin the process to identify replacements and the current CEO will stay on to assist with identifying a suitable replacement and to ensure a seamless handover.
Based on this information, Clover’s board deemed it prudent to adopt a conservative approach and provide for the full impairment of the R439 million revolving credit facility it extended to DFSA as at year-end, although the accumulated loss at 30 June 2018 is only R133.2 million.
The impairment of the revolving credit facility will be assessed on a continuous basis, taking into consideration the lien that Clover holds over the DFSA inventory and debtors’ balances that is being controlled/managed by Clover as part of Clover’s services rendered agreement, as well as the DFSA board approved plans to manage the business through the cycle.
A rigorous series of efficiency improvement initiatives were implemented in the latter part of the 2017 financial year to re-align the business to the new ‘normal’ described previously. These initiatives include, but are not limited to, the unbundling of the volume- driven side of the business through the establishment of Dairy Farmers South Africa (“DFSA”), the launch of Project Sencillo (asset optimisation program), the ongoing roll-out of Project Masakhane, new product launches, and product reformulations to lower ingredients and sugar costs.
11Clover Industries Limited Integrated Report for the year ended 30 June 2018
IN T
HE
SP
OT
LIGH
T
FOR
20
18IN
TR
OD
UC
ING
CLO
VE
R’S S
TO
RY
AN
ALY
SIN
G C
LOV
ER
’S V
ALU
E C
RE
AT
ION
LEA
DE
RS
HIP
R
EV
IEW
SP
ER
FOR
MA
NC
E O
UT
CO
ME
S O
F TH
E S
IX C
AP
ITA
LS
RE
MU
NE
RA
TIO
N
RE
PO
RT
AN
NU
AL FIN
AN
CIA
L R
ES
ULT
SS
HA
RE
HO
LDE
R
INFO
RM
AT
ION
More detail on our decision in this regard is available in the report on governance, risk and compliance, directors’ report and note 13 to the annual financial statements.
Due to the fact that Clover sources all its raw milk requirements for its value-added products from DFSA and the fact that DFSA is its largest principal, DFSA and its milk producers will remain an extremely important business partner and stakeholder to Clover.
REGULATORY ENVIRONMENTThe health promotion levy (“sugar tax”) was introduced with effect from 1 April 2018. Most significantly, both intrinsic and added sugars will now be included when calculating the tax. In addition, Treasury has implemented a threshold that would make the first 4g of sugar per 100ml beverage exempt from the sugar tax. An important step forward includes the fact that 100% fruit juices and milk products will be considered exempt from the tax. We have been working tirelessly to reduce the impact of the tax by revising the composition of some of our products to ensure that we do not compromise on quality or taste whilst reducing the overall sugar content.
Additionally, the Minister of Finance announced an increase in the VAT rate to 15% with effect from 1 April 2018. This too will add to the pressure being felt by businesses and consumers alike.
TRANSFORMATION AND EMPOWERMENT
Clover’s Broad-Based Black Economic Empowerment (B-BBEE) status was assessed in September 2017 and we maintained our rating as a level 4 contributor. New B-BBEE codes for the broader agricultural sector were gazetted and legislated with effect from 8 December 2017. The verification process is underway and based on our internal assessment Clover will temporarily drop to a level 8 given the new minimum requirements for priority elements (ownership, skills development, enterprise and supplier development), however, plans are in place to move to a level 6 within the next 12 months. Clover is fully committed to achieving B-BBEE as outlined by the Department of Trade and Industry and is taking steps to align itself with the new codes as a priority.
For further detail on Clover’s transformation journey see page 77 of this report.
THE ENVIRONMENT AND OUR COMMUNITIESDuring the reporting period, our industry suffered a regrettable incident with one of the largest outbreaks of listeriosis which resulted in the loss of many lives and brought into question the safety of food in general. This incident emphasised the importance of quality control measures at all stages of the food value chain. Clover takes this very seriously and takes every precaution to ensure that its products are safe for consumers and of the highest quality.
Despite the normalisation of weather patterns across most regions during the reporting period, the drought in the Western Cape proved to be particularly stubborn, giving rise to the prospect of Day Zero – when water would no longer be available in the region. Thankfully Day Zero did not materialise. Clover is however well protected against any future water shortages having made the necessary investments in alternative water supply and identified contingency plans for production at our affected factories.
Throughout our endeavours to create shareholder value and growth, we remain cognisant of our responsibility towards our stakeholders and our operating environment. Our report on six capitals detailing how we interacted as a corporate citizen with our stakeholders is available on page 57 of this report.
GOVERNANCEKing IV™ is the latest code on corporate governance which builds on the principles contained in King III, aligning the approach to integrated thinking across all six capitals, new governance structures, emerging risks and opportunities, from new technologies and new reporting and disclosure requirements.
The new reporting requirements in terms of King IV™ have been adopted for this report as per the JSE Listings Requirements and further details around our compliance can be found on the Company website www.clover.co.za.
This year corporate South Africa experienced a number of governance failures which impacted its reputation. Corporate governance has been under a magnifying glass since, with the market scrutinising every aspect that it involves.
Clover has a strong board with a high emphasis on governance and risk control while allowing sufficient room for innovation and entrepreneurial spirit. Avoiding over-regulation and achieving this balance is important for a growing business, like Clover.
I am pleased to report that Clover’s consistency in practicing good corporate governance has paid off. For the third consecutive year, Clover has been acknowledged as the country’s most reputable company in the Reputation Institute’s Reptrak© South Africa 2018 survey. This accomplishment is testament to the astute leadership of Johann and his executive team. The board commends them for upholding Clover’s reputation across all spheres of the business during a particularly challenging number of years.
BOARD CHANGESMr Elton Bosch resigned as financial director at the beginning of the period under review to pursue personal interests. He leaves a legacy at Clover, having contributed significantly to the risk and governance areas of the business, over and above his financial acumen. On behalf of the board, I thank Elton for his valued contribution.
Mr Frantz Scheepers was appointed as CFO designate with effect from 1 November 2017 and formally assumed the role of CFO and executive director from 1 January 2018.
We further strengthened the Clover Board of Directors with the appointment of Dr James Wellwood (Whitey) Basson and Mr Flemming Morgan as independent non-executive directors with effect from 1 January 2018.
These gentlemen bring a wealth of experience to the board in their respective fields of expertise.
The fresh insights that these members have brought to the board have been most beneficial.
CHAIRMAN’S REPORT continued
Clover Industries Limited Integrated Report for the year ended 30 June 201812
For more information about our governance structure and processes, please refer to the governance report on pages 24 to 31 of this report.
DIVIDENDThe Company declared and paid an interim dividend of 26,56 cents per share during April 2018. A final dividend of 48,68 cents per share was declared by the board, which will bring the total dividend for the current financial year to 75,24 cents, representing a divided cover of 2,75 times on a normalised basis.
LOOKING TO THE FUTURETough macro-economic and trading conditions are expected to continue for the year ahead and are expected to deteriorate in some respects. Inflationary cost pressures, specifically for sugar, fuel and electricity continue to take their toll while the Rand has significantly depreciated against major currencies and the outlook for economic growth is unclear. Policy uncertainty remains in force locally while threats of trade wars between the US and certain emerging economies have had a knock-on effect on other markets including South Africa.
This environment requires tight cost controls and innovative ways of doing business. Clover’s drive to derive value from efficiency improvements and growth through the expansion of its value-added product portfolio continues to be the main focus for the year ahead. Management remains committed to improving on the positive performance this year and the board believes that measures put in place will buffer the business for the future and support sustainable value creation.
APPRECIATIONThank you to my fellow board members for their support and contribution and to Johann and his executive team for their grit and tenacity in managing the business through the downward cycle to ensure the recovery and stability of the business through achieving significant efficiencies and driving savings throughout the supply chain. I also extend my appreciation to the rest of the Clover employees for their resilience, commitment and incredibly hard work demonstrated during a very trying period. This collective effort demonstrated the spirit of the Clover Way Better philosophy.
Werner BüchnerChairman of the board
26 September 2018
Clover Industries Limited Integrated Report for the year ended 30 June 2018 13
IN T
HE
SP
OT
LIGH
T
FOR
20
18IN
TR
OD
UC
ING
CLO
VE
R’S S
TO
RY
AN
ALY
SIN
G C
LOV
ER
’S V
ALU
E C
RE
AT
ION
LEA
DE
RS
HIP
R
EV
IEW
SP
ER
FOR
MA
NC
E O
UT
CO
ME
S O
F TH
E S
IX C
AP
ITA
LS
RE
MU
NE
RA
TIO
N
RE
PO
RT
AN
NU
AL FIN
AN
CIA
L R
ES
ULT
SS
HA
RE
HO
LDE
R
INFO
RM
AT
ION
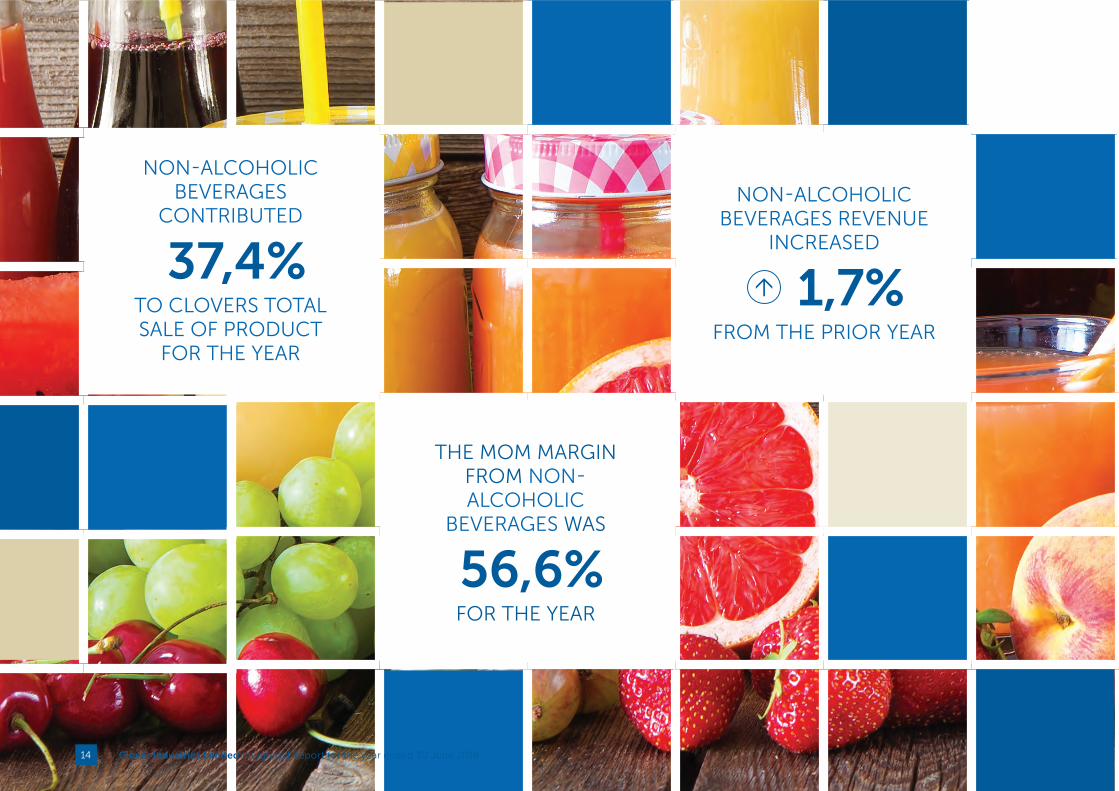
NON-ALCOHOLIC BEVERAGES
CONTRIBUTED
37,4%TO CLOVERS TOTAL SALE OF PRODUCT
FOR THE YEAR
THE MOM MARGIN FROM NON-ALCOHOLIC
BEVERAGES WAS
56,6%FOR THE YEAR
NON-ALCOHOLIC BEVERAGES REVENUE
INCREASED
1,7%FROM THE PRIOR YEAR
Clover Industries Limited Integrated Report for the year ended 30 June 201814

INTRODUCING CLOVER’S STORY
Clover Industries Limited Integrated Report for the year ended 30 June 2018 15
IN T
HE
SP
OT
LIGH
T
FOR
20
18IN
TR
OD
UC
ING
CLO
VE
R’S S
TO
RY
AN
ALY
SIN
G C
LOV
ER
’S V
ALU
E C
RE
AT
ION
LEA
DE
RS
HIP
R
EV
IEW
SP
ER
FOR
MA
NC
E O
UT
CO
ME
S O
F TH
E S
IX C
AP
ITA
LS
RE
MU
NE
RA
TIO
N
RE
PO
RT
AN
NU
AL FIN
AN
CIA
L R
ES
ULT
SS
HA
RE
HO
LDE
R
INFO
RM
AT
ION
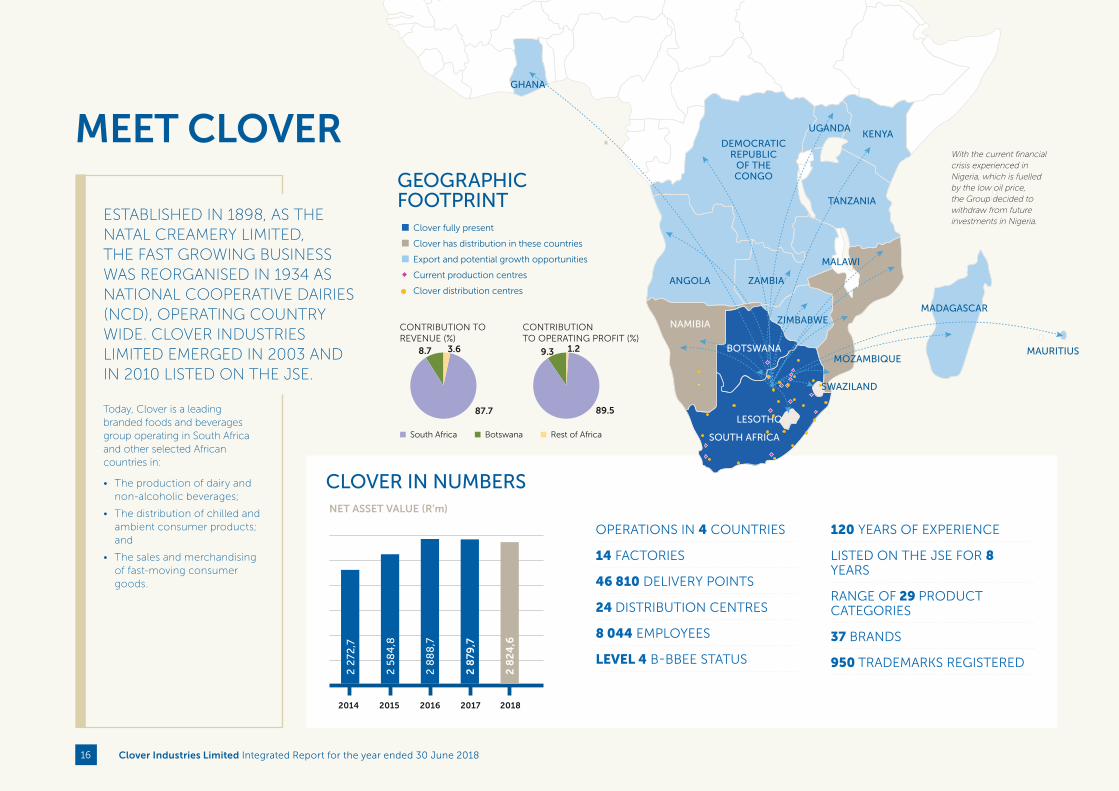
CLOVER IN NUMBERS
OPERATIONS IN 4 COUNTRIES
14 FACTORIES
46 810 DELIVERY POINTS
24 DISTRIBUTION CENTRES
8 044 EMPLOYEES
LEVEL 4 B-BBEE STATUS
Today, Clover is a leading branded foods and beverages group operating in South Africa and other selected African countries in:
• The production of dairy and non-alcoholic beverages;
• The distribution of chilled and ambient consumer products; and
• The sales and merchandising of fast-moving consumer goods.
ESTABLISHED IN 1898, AS THE NATAL CREAMERY LIMITED, THE FAST GROWING BUSINESS WAS REORGANISED IN 1934 AS NATIONAL COOPERATIVE DAIRIES (NCD), OPERATING COUNTRY WIDE. CLOVER INDUSTRIES LIMITED EMERGED IN 2003 AND IN 2010 LISTED ON THE JSE.
MEET CLOVER
NET ASSET VALUE (R’m)
20182017201620152014
2 2
72,7
2 5
84
,8
2 8
88
,7
2 8
79,7
2 8
24
,6
120 YEARS OF EXPERIENCE
LISTED ON THE JSE FOR 8 YEARS
RANGE OF 29 PRODUCT CATEGORIES
37 BRANDS
950 TRADEMARKS REGISTERED
GHANA
DEMOCRATIC REPUBLIC
OF THE CONGO
UGANDAKENYA
TANZANIA
ZIMBABWE
MALAWI
MOZAMBIQUE
MADAGASCAR
MAURITIUS
SWAZILAND
LESOTHO
BOTSWANA
NAMIBIA
SOUTH AFRICA
ANGOLA ZAMBIA
GEOGRAPHIC FOOTPRINT
Clover fully present
Clover has distribution in these countries
Export and potential growth opportunities
Current production centres
Clover distribution centres
With the current financial crisis experienced in Nigeria, which is fuelled by the low oil price, the Group decided to withdraw from future investments in Nigeria.
8.7
87.7
3.6
South Africa Botswana Rest of Africa
CONTRIBUTION TO REVENUE (%)
89.5
1.29.3
CONTRIBUTION TO OPERATING PROFIT (%)
Clover Industries Limited Integrated Report for the year ended 30 June 201816
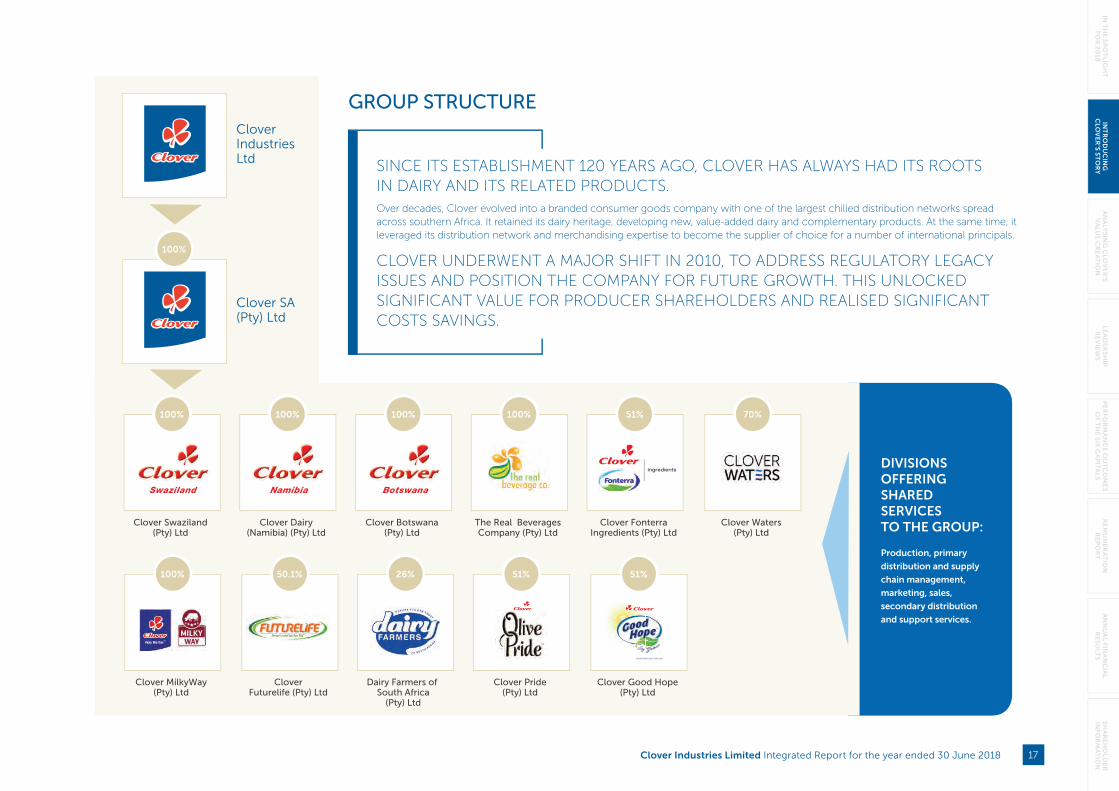
GROUP STRUCTURE
Clover Waters(Pty) Ltd
Clover Swaziland (Pty) Ltd
Clover MilkyWay (Pty) Ltd
Clover Dairy(Namibia) (Pty) Ltd
Clover Futurelife (Pty) Ltd
Clover Botswana (Pty) Ltd
Dairy Farmers of South Africa
(Pty) Ltd
The Real Beverages Company (Pty) Ltd
Clover Pride (Pty) Ltd
Clover Fonterra Ingredients (Pty) Ltd
Clover Good Hope (Pty) Ltd
Clover Industries Ltd
Clover SA (Pty) Ltd
70%100%
100%
100%
50.1%
100%
26%
100%
51%
51%
51%
DIVISIONS OFFERING SHARED SERVICES TO THE GROUP:
Production, primary
distribution and supply
chain management,
marketing, sales,
secondary distribution
and support services.
SINCE ITS ESTABLISHMENT 120 YEARS AGO, CLOVER HAS ALWAYS HAD ITS ROOTS IN DAIRY AND ITS RELATED PRODUCTS. Over decades, Clover evolved into a branded consumer goods company with one of the largest chilled distribution networks spread across southern Africa. It retained its dairy heritage, developing new, value-added dairy and complementary products. At the same time, it leveraged its distribution network and merchandising expertise to become the supplier of choice for a number of international principals.
CLOVER UNDERWENT A MAJOR SHIFT IN 2010, TO ADDRESS REGULATORY LEGACY ISSUES AND POSITION THE COMPANY FOR FUTURE GROWTH. THIS UNLOCKED SIGNIFICANT VALUE FOR PRODUCER SHAREHOLDERS AND REALISED SIGNIFICANT COSTS SAVINGS.
100%
Clover Industries Limited Integrated Report for the year ended 30 June 2018 17
IN T
HE
SP
OT
LIGH
T
FOR
20
18IN
TR
OD
UC
ING
CLO
VE
R’S S
TO
RY
AN
ALY
SIN
G C
LOV
ER
’S V
ALU
E C
RE
AT
ION
LEA
DE
RS
HIP
R
EV
IEW
SP
ER
FOR
MA
NC
E O
UT
CO
ME
S O
F TH
E S
IX C
AP
ITA
LS
RE
MU
NE
RA
TIO
N
RE
PO
RT
AN
NU
AL FIN
AN
CIA
L R
ES
ULT
SS
HA
RE
HO
LDE
R
INFO
RM
AT
ION

CLOVER’S BUSINESS MODEL
OUR MISSIONOUR VISION
CLOVER’S VALUE CREATION PROCESS STARTS WITH OUR VISION AND MISSION, AS THE BUSINESS MODEL IS DESIGNED TO PUT THESE INTO EFFECT. Our business model is the engine of Clover’s value creation and is driven by the resources fed through it in accordance with Clover’s strategy. Its outputs and outcomes are the short-, medium- and long-term value created in terms of Clover’s vision and mission. Clover’s leadership, support services and our people at all levels must ensure that Clover’s vision flows seamlessly and accurately through the entire value chain and the business model to be transformed into outputs and outcomes that actualise this vision.
TO BE A LEADING BRANDED FOODS AND BEVERAGES GROUP IN SOUTH AFRICA AND SELECTED OTHER AFRICAN COUNTRIES, PROVIDING ACCESSIBLE NUTRITION TO ALL CONSUMERS.
HUMAN CAPITALHuman capital refers to our employees, their talent, skills and personal attributes that play a vital role in creating value for all our stakeholders.
NATURAL CAPITALNatural capital includes all the environmental resources used by the Company in its value creation process.
MANUFACTURED CAPITALManufactured capital refers to our infrastructure, including our large distribution network, which we use in the production of goods and services.
INTELLECTUAL CAPITALIntellectual capital represents the intangible value of the business.
FINANCIAL CAPITALFinancial capital represent the economic resources used by the business in its value creation process.
SOCIAL AND RELATIONSHIP CAPITALSocial and relationship capital plays an important role in Clover’s value creation process. It involves the business itself, our customers and consumers, suppliers, employees and the communities we operate in.
Clover products are produced in accordance with international best
practices for quality, hygiene and food safety. All South African Clover
factories are HACCP certified. All factories are FSSC 22000 accredited.
PRODUCTION (14 factories)
CONCENTRATE AND INGREDIENT SUPPLIERS
MILK PRODUCERS (DFSA)
Milk producers are contracted through DFSA to ensure a
consistent supply of good quality milk in order to match market demands.
Four main regions: Eastern Cape, KwaZulu-Natal, western Highveld
and eastern Highveld.
SUPPLIERSPackaging, transport and other
PROCUREMENT AND SUPPLY CHAIN PLANNING
Procures high quality ingredients and packaging materials from carefully
selected suppliers.
MILK PROCUREMENT (DFSA)
Procurement, collection and transport of raw milk.
RISKS
STAKEHOLDER RELATIONSHIPS
THE VALUE CREATION PROCESSOUR CAPITAL RESOURCES
SALES AND MERCHANDISING
DISTRIBUTION FACILITY
AFRICA EXPANSION
CONSOLIDATE INDUSTRY
PRINCIPAL FACTORIES
MILK PROCUREMENT
PRODUCTIONSUPPORT SERVICES
PROCUREMENT AND SUPPLY CHAIN
PLANNING
Way Better operations across supply chain to provide sustainable shareholder value
Develop or acquire brands to occupy number one or two position in chosen segments
Being a responsible corporate citizen
Preferred employer
Providing consumers with quality and trusted products
Reaching Clover’s widely dispersed customers everyday
BRANDS AND MARKETING
™
nutri ™
refer to page 28
refer to page 36
Clover Industries Limited Integrated Report for the year ended 30 June 201818
See page 61 for this Capitals Outcomes
See page 65 for this Capitals Outcomes
See page 67 for this Capitals Outcomes
See page 71 for this Capitals Outcomes
See page 78 for this Capitals Outcomes
See page 73 for this Capitals Outcomes
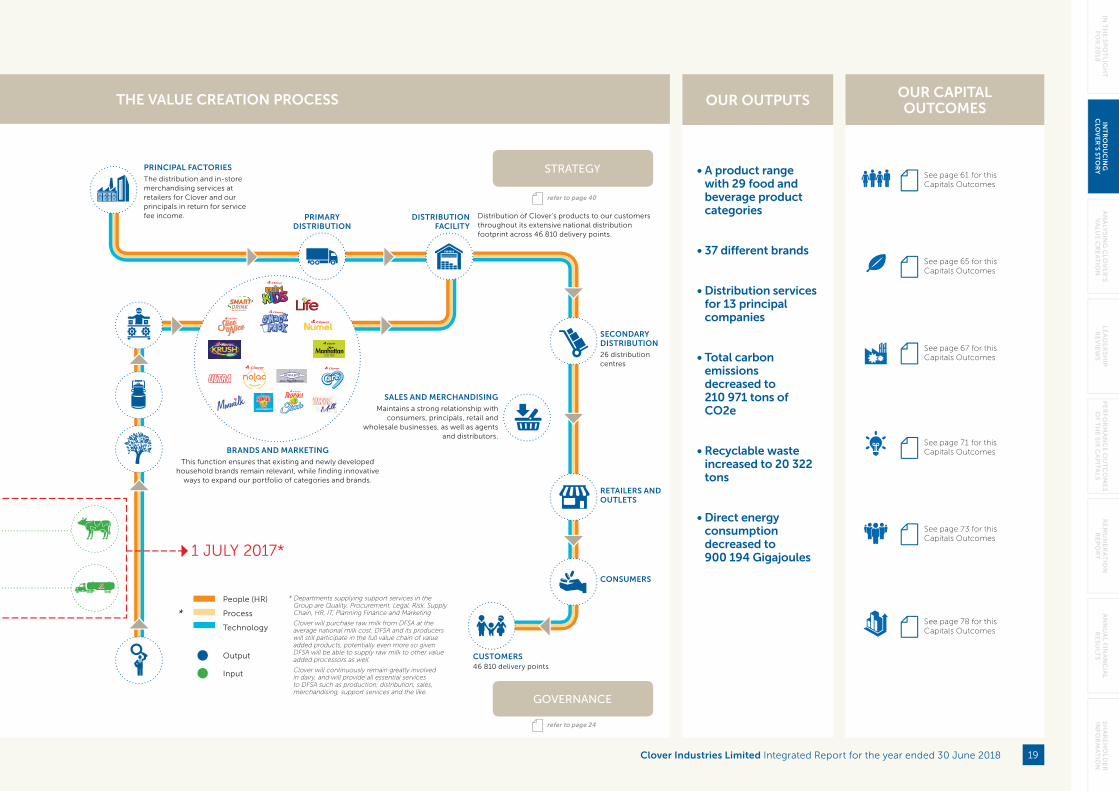
Distribution of Clover’s products to our customers throughout its extensive national distribution footprint across 46 810 delivery points.
Maintains a strong relationship with consumers, principals, retail and
wholesale businesses, as well as agents and distributors.
BRANDS AND MARKETING
This function ensures that existing and newly developed household brands remain relevant, while finding innovative
ways to expand our portfolio of categories and brands.
PRIMARY DISTRIBUTION
RETAILERS ANDOUTLETS
CUSTOMERS46 810 delivery points
CONSUMERS
SALES AND MERCHANDISING
PRINCIPAL FACTORIES
The distribution and in-store merchandising services at retailers for Clover and our principals in return for service fee income.
SECONDARY DISTRIBUTION26 distribution centres
DISTRIBUTION FACILITY
STRATEGY
GOVERNANCE
™
nutri ™
THE VALUE CREATION PROCESS OUR OUTPUTS OUR CAPITAL OUTCOMES
* Departments supplying support services in the Group are Quality, Procurement, Legal, Risk, Supply Chain, HR, IT, Planning Finance and Marketing
Clover will purchase raw milk from DFSA at the average national milk cost. DFSA and its producers will still participate in the full value chain of value added products, potentially even more so given DFSA will be able to supply raw milk to other value added processors as well.
Clover will continuously remain greatly involved in dairy, and will provide all essential services to DFSA such as production, distribution, sales, merchandising, support services and the like.
Technology
People (HR)
Process*
Output
Input
1 JULY 2017*
• A product range with 29 food and beverage product categories
• 37 different brands
• Distribution services for 13 principal companies
• Total carbon emissions decreased to 210 971 tons of CO2e
• Recyclable waste increased to 20 322 tons
• Direct energy consumption decreased to 900 194 Gigajoules
refer to page 40
refer to page 24
Clover Industries Limited Integrated Report for the year ended 30 June 2018 19
IN T
HE
SP
OT
LIGH
T
FOR
20
18IN
TR
OD
UC
ING
CLO
VE
R’S S
TO
RY
AN
ALY
SIN
G C
LOV
ER
’S V
ALU
E C
RE
AT
ION
LEA
DE
RS
HIP
R
EV
IEW
SP
ER
FOR
MA
NC
E O
UT
CO
ME
S O
F TH
E S
IX C
AP
ITA
LS
RE
MU
NE
RA
TIO
N
RE
PO
RT
AN
NU
AL FIN
AN
CIA
L R
ES
ULT
SS
HA
RE
HO
LDE
R
INFO
RM
AT
ION
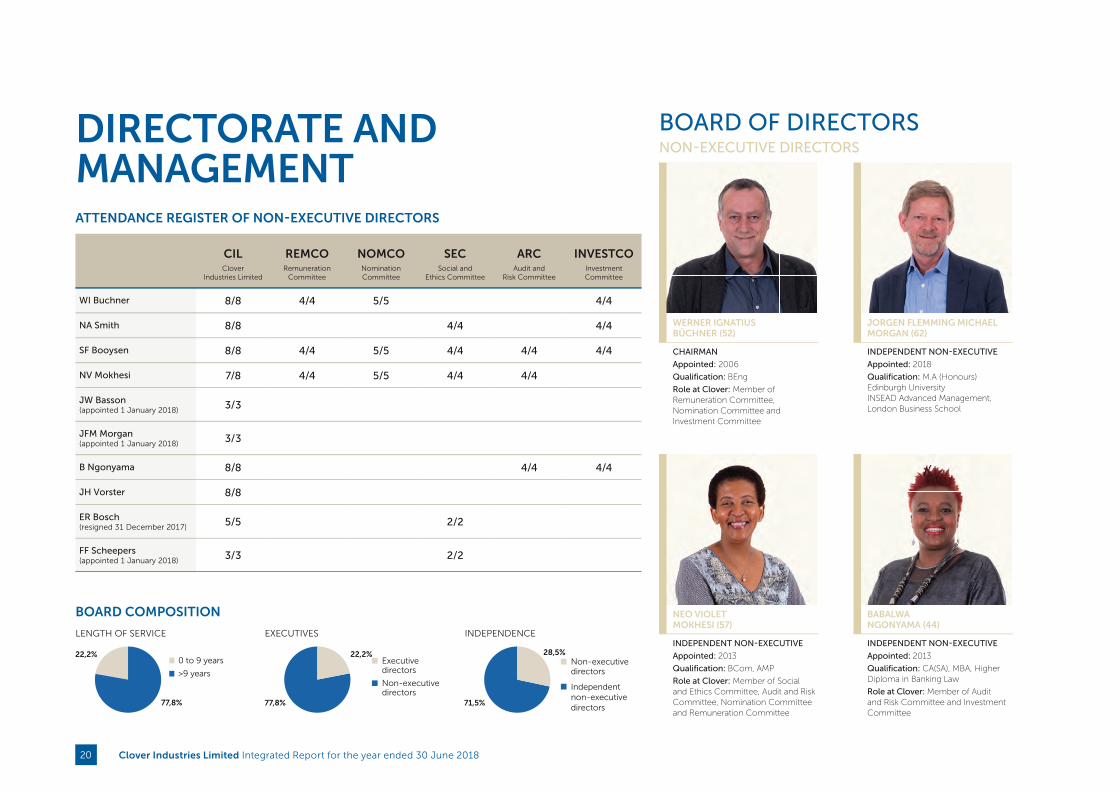
DIRECTORATE AND MANAGEMENT
BOARD OF DIRECTORS
WERNER IGNATIUS BÜCHNER (52)
CHAIRMAN
Appointed: 2006
Qualification: BEng
Role at Clover: Member of Remuneration Committee, Nomination Committee and Investment Committee
JORGEN FLEMMING MICHAEL MORGAN (62)
INDEPENDENT NON-EXECUTIVE
Appointed: 2018
Qualification: M.A (Honours) Edinburgh UniversityINSEAD Advanced Management, London Business School
BABALWA NGONYAMA (44)
INDEPENDENT NON-EXECUTIVE
Appointed: 2013
Qualification: CA(SA), MBA, Higher Diploma in Banking Law
Role at Clover: Member of Audit and Risk Committee and Investment Committee
NEO VIOLET MOKHESI (57)
INDEPENDENT NON-EXECUTIVE
Appointed: 2013
Qualification: BCom, AMP
Role at Clover: Member of Social and Ethics Committee, Audit and Risk Committee, Nomination Committee and Remuneration Committee
NON-EXECUTIVE DIRECTORS
BOARD COMPOSITION
ATTENDANCE REGISTER OF NON-EXECUTIVE DIRECTORS
CIL REMCO NOMCO SEC ARC INVESTCOClover
Industries LimitedRemuneration
CommitteeNomination Committee
Social and Ethics Committee
Audit and Risk Committee
Investment Committee
WI Buchner 8/8 4/4 5/5 4/4
NA Smith 8/8 4/4 4/4
SF Booysen 8/8 4/4 5/5 4/4 4/4 4/4
NV Mokhesi 7/8 4/4 5/5 4/4 4/4
JW Basson(appointed 1 January 2018) 3/3
JFM Morgan(appointed 1 January 2018) 3/3
B Ngonyama 8/8 4/4 4/4
JH Vorster 8/8
ER Bosch (resigned 31 December 2017) 5/5 2/2
FF Scheepers (appointed 1 January 2018) 3/3 2/2
77,8%
22,2%0 to 9 years
>9 years
Executive directors
Non-executive directors
LENGTH OF SERVICE
22,2%
77,8%
28,5%
71,5%
EXECUTIVES INDEPENDENCE
Non-executivedirectors
Independent non-executive directors
Clover Industries Limited Integrated Report for the year ended 30 June 201820

EXECUTIVE COMMITTEE
DR JAMES HENRY FERREIRA BOTES (55)
Executive: Commercial
Appointed: 2009
Qualification: DPhil
MARCELO MARQUES PALMEIRO (52)
Executive: Brands and Corporate Development
Appointed: 2012
Qualification: BA, IME
HENDRIKUS LUBBE (47)
Executive: Supply Chain Distribution
Appointed: 2006
Qualification: MCom (Transport Economics) MBA
JACQUES VAN HEERDEN (33)
Executive: Legal, Secretarial and Human Resources
Appointed: 2014
Qualification: LLB (Cum Laude), ACIS
JOHANN HENDRIKVORSTER (54)
CHIEF EXECUTIVE
Appointed: Exco in 2000 and as CE in 2006
Qualification: BCompt (Hons), CA(SA), MBA
NIGEL ATHOL SMITH (62)
NON-EXECUTIVE
Appointed: 2011
Qualification: Agric Dip
Role at Clover: Member of Investment Committee and Social and Ethics Committee
DR STEFANES FRANCOIS BOOYSEN (55)
LEAD INDEPENDENT DIRECTOR
Appointed: 2010
Qualification: BCompt (Acc) (Hons), MCompt (Unisa), DCom (Acc), CA(SA)
Role at Clover: Member of Audit and Risk Committee, Remuneration Committee, Social and Ethics Committee, Nomination Committee, Investment Committee.
EXECUTIVE DIRECTORS EXECUTIVES
FRANTZ FREDERIKSCHEEPERS (47)
CHIEF FINANCIAL OFFICER
Appointed: 2018
Qualification: BCom (Hons),CA(SA)
DR JAMES WELLWOOD BASSON (72)
INDEPENDENT NON-EXECUTIVE
Appointed: 2018
Qualification: BCom CTA CA(SA) DCom (hc)
Clover Industries Limited Integrated Report for the year ended 30 June 2018 21
IN T
HE
SP
OT
LIGH
T
FOR
20
18IN
TR
OD
UC
ING
CLO
VE
R’S S
TO
RY
AN
ALY
SIN
G C
LOV
ER
’S V
ALU
E C
RE
AT
ION
LEA
DE
RS
HIP
R
EV
IEW
SP
ER
FOR
MA
NC
E O
UT
CO
ME
S O
F TH
E S
IX C
AP
ITA
LS
RE
MU
NE
RA
TIO
N
RE
PO
RT
AN
NU
AL FIN
AN
CIA
L R
ES
ULT
SS
HA
RE
HO
LDE
R
INFO
RM
AT
ION
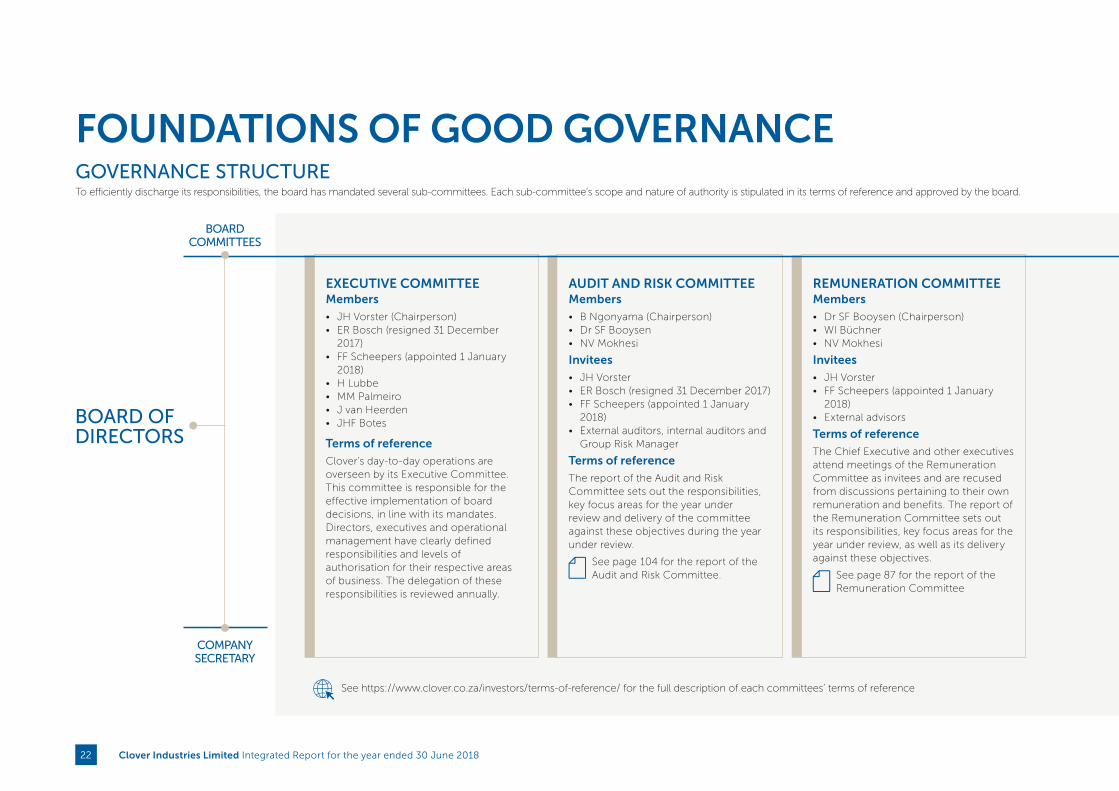
FOUNDATIONS OF GOOD GOVERNANCE
BOARD OF DIRECTORS
COMPANYSECRETARY
BOARDCOMMITTEES
GOVERNANCE STRUCTURETo efficiently discharge its responsibilities, the board has mandated several sub-committees. Each sub-committee’s scope and nature of authority is stipulated in its terms of reference and approved by the board.
See https://www.clover.co.za/investors/terms-of-reference/ for the full description of each committees’ terms of reference
EXECUTIVE COMMITTEEMembers
• JH Vorster (Chairperson)• ER Bosch (resigned 31 December
2017)• FF Scheepers (appointed 1 January
2018)• H Lubbe• MM Palmeiro• J van Heerden• JHF Botes
Terms of reference
Clover’s day-to-day operations are overseen by its Executive Committee. This committee is responsible for the effective implementation of board decisions, in line with its mandates.Directors, executives and operational management have clearly defined responsibilities and levels of authorisation for their respective areas of business. The delegation of these responsibilities is reviewed annually.
AUDIT AND RISK COMMITTEEMembers
• B Ngonyama (Chairperson)• Dr SF Booysen• NV Mokhesi
Invitees
• JH Vorster• ER Bosch (resigned 31 December 2017)• FF Scheepers (appointed 1 January
2018)• External auditors, internal auditors and
Group Risk Manager
Terms of reference
The report of the Audit and Risk Committee sets out the responsibilities, key focus areas for the year under review and delivery of the committee against these objectives during the year under review.
See page 104 for the report of the Audit and Risk Committee.
REMUNERATION COMMITTEEMembers
• Dr SF Booysen (Chairperson)• WI Büchner• NV Mokhesi
Invitees
• JH Vorster• FF Scheepers (appointed 1 January
2018)• External advisors
Terms of reference
The Chief Executive and other executives attend meetings of the Remuneration Committee as invitees and are recused from discussions pertaining to their own remuneration and benefits. The report of the Remuneration Committee sets out its responsibilities, key focus areas for the year under review, as well as its delivery against these objectives.
See page 87 for the report of the Remuneration Committee
Clover Industries Limited Integrated Report for the year ended 30 June 201822
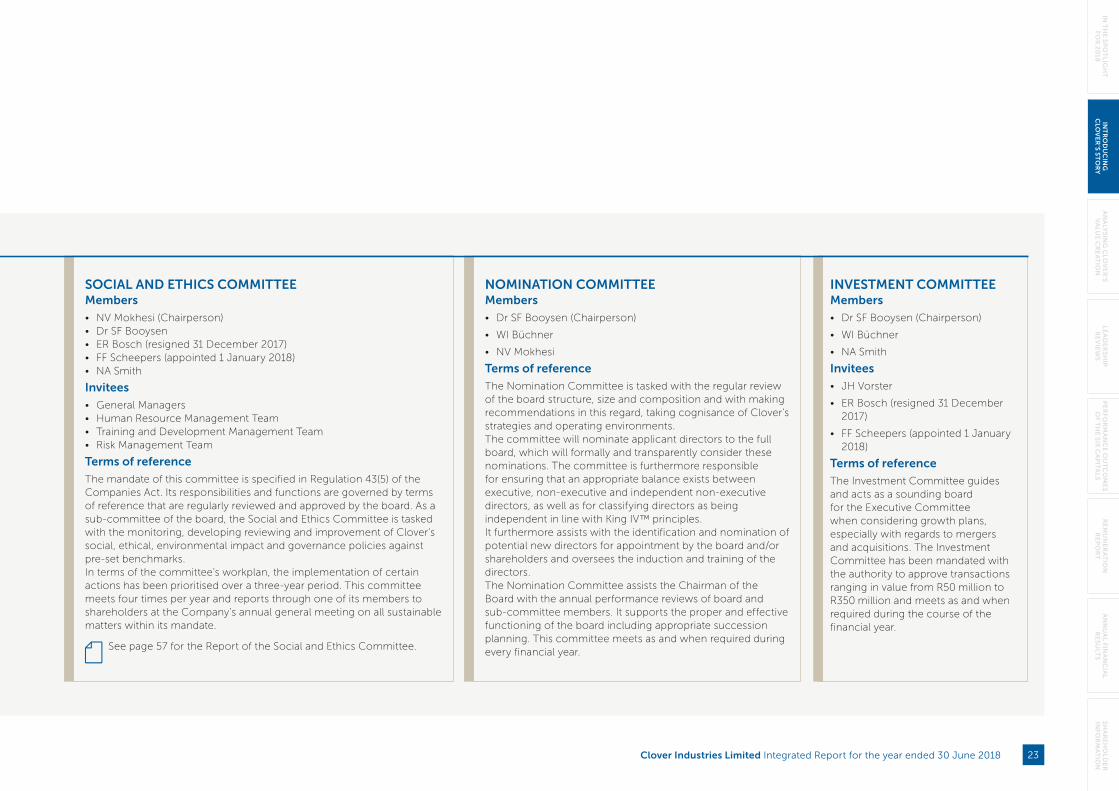
SOCIAL AND ETHICS COMMITTEEMembers
• NV Mokhesi (Chairperson)• Dr SF Booysen• ER Bosch (resigned 31 December 2017)• FF Scheepers (appointed 1 January 2018)• NA Smith
Invitees
• General Managers • Human Resource Management Team• Training and Development Management Team• Risk Management Team
Terms of reference
The mandate of this committee is specified in Regulation 43(5) of the Companies Act. Its responsibilities and functions are governed by terms of reference that are regularly reviewed and approved by the board. As a sub-committee of the board, the Social and Ethics Committee is tasked with the monitoring, developing reviewing and improvement of Clover’s social, ethical, environmental impact and governance policies against pre-set benchmarks. In terms of the committee’s workplan, the implementation of certain actions has been prioritised over a three-year period. This committee meets four times per year and reports through one of its members to shareholders at the Company’s annual general meeting on all sustainable matters within its mandate.
See page 57 for the Report of the Social and Ethics Committee.
INVESTMENT COMMITTEEMembers
• Dr SF Booysen (Chairperson)
• WI Büchner
• NA Smith
Invitees
• JH Vorster
• ER Bosch (resigned 31 December 2017)
• FF Scheepers (appointed 1 January 2018)
Terms of reference
The Investment Committee guides and acts as a sounding board for the Executive Committee when considering growth plans, especially with regards to mergers and acquisitions. The Investment Committee has been mandated with the authority to approve transactions ranging in value from R50 million to R350 million and meets as and when required during the course of the financial year.
NOMINATION COMMITTEEMembers
• Dr SF Booysen (Chairperson)
• WI Büchner
• NV Mokhesi
Terms of reference
The Nomination Committee is tasked with the regular review of the board structure, size and composition and with making recommendations in this regard, taking cognisance of Clover’s strategies and operating environments. The committee will nominate applicant directors to the full board, which will formally and transparently consider these nominations. The committee is furthermore responsible for ensuring that an appropriate balance exists between executive, non-executive and independent non-executive directors, as well as for classifying directors as being independent in line with King IV™ principles. It furthermore assists with the identification and nomination of potential new directors for appointment by the board and/or shareholders and oversees the induction and training of the directors. The Nomination Committee assists the Chairman of the Board with the annual performance reviews of board and sub-committee members. It supports the proper and effective functioning of the board including appropriate succession planning. This committee meets as and when required during every financial year.
Clover Industries Limited Integrated Report for the year ended 30 June 2018 23
IN T
HE
SP
OT
LIGH
T
FOR
20
18IN
TR
OD
UC
ING
CLO
VE
R’S S
TO
RY
AN
ALY
SIN
G C
LOV
ER
’S V
ALU
E C
RE
AT
ION
LEA
DE
RS
HIP
R
EV
IEW
SP
ER
FOR
MA
NC
E O
UT
CO
ME
S O
F TH
E S
IX C
AP
ITA
LS
RE
MU
NE
RA
TIO
N
RE
PO
RT
AN
NU
AL FIN
AN
CIA
L R
ES
ULT
SS
HA
RE
HO
LDE
R
INFO
RM
AT
ION
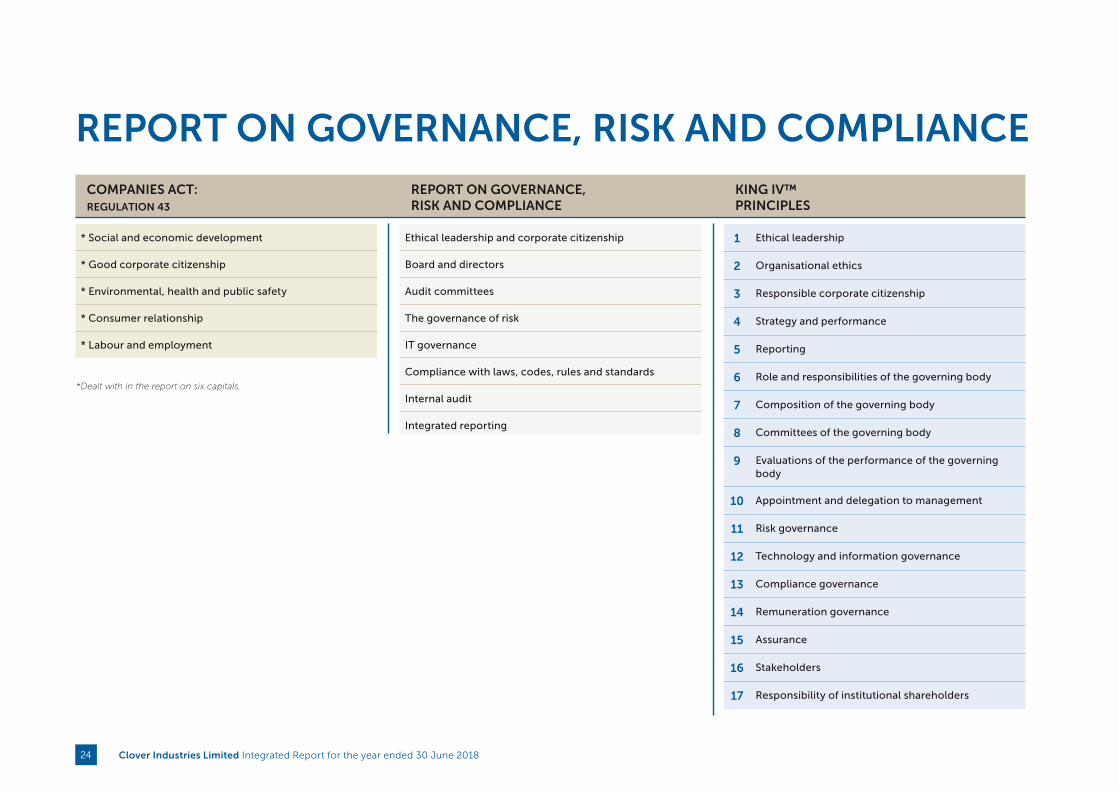
REPORT ON GOVERNANCE, RISK AND COMPLIANCECOMPANIES ACT: REGULATION 43
REPORT ON GOVERNANCE, RISK AND COMPLIANCE
KING IV™ PRINCIPLES
* Social and economic development
* Good corporate citizenship
* Environmental, health and public safety
* Consumer relationship
* Labour and employment
Ethical leadership and corporate citizenship
Board and directors
Audit committees
The governance of risk
IT governance
Compliance with laws, codes, rules and standards
Internal audit
Integrated reporting
1 Ethical leadership
2 Organisational ethics
3 Responsible corporate citizenship
4 Strategy and performance
5 Reporting
6 Role and responsibilities of the governing body
7 Composition of the governing body
8 Committees of the governing body
9 Evaluations of the performance of the governing body
10 Appointment and delegation to management
11 Risk governance
12 Technology and information governance
13 Compliance governance
14 Remuneration governance
15 Assurance
16 Stakeholders
17 Responsibility of institutional shareholders
*Dealt with in the report on six capitals.
Clover Industries Limited Integrated Report for the year ended 30 June 201824
INTRODUCTIONThe board was continuously updated on topical matters relevant to and impacting on the business, and new developments in regulatory compliance. This is the first year that Clover has applied the provisions of the King IV Report on Corporate Governance™ (Copyright and trademarks are owned by the Institute of Directors in Southern Africa NPC and all of its rights are reserved) (King IV™) with additional disclosures, particularly around remuneration assimilated in this integrated report.
RESPONSIBILITY TO ENSURE GOOD GOVERNANCEGood corporate governance promotes transparency, fairness, integrity and accountability and guides Clover’s daily interaction with all stakeholders and its impact on the environment.
The underlying objective of governance is to balance the interests of all stakeholders in a fair and equitable manner.
STATEMENT OF COMPLIANCEKing IV™ was launched in November 2016, and its application is mandatory in terms of the JSE Listings Requirements. The board has familiarised itself with the requirements of King IV™ and has evaluated and benchmarked its governance practices and reporting against the principles of King IV™. For the year under review, the application of the King IV™ principles was a key focus area of the board. The board believes that the Group prescribes to the principles of King IV™ to a material degree. A detailed application register of
the King IV™ principles can be found on the Group’s website at www.clover.co.za.
Deloitte Touche Tohmatsu Limited (Deloitte) performed the function of internal auditor and assessed the governance structures and processes that executive management has established. Deloitte reported that the internal controls over reviewed operations and related activities are adequate and effective in all significant respects. Governance practices were found to be adequate and effective.
ETHICAL LEADERSHIP AND CORPORATE CITIZENSHIPClover’s primary ethical standards of responsibility, integrity, fairness, accountability and respect is defined in a code of ethics as adopted by the board. This code is reviewed and updated on an ongoing basis, as required. The code provides guidelines on what constitutes unethical conduct and disclosure requirements for gifts and outside interests that would require pre-approval.
The importance of ethical behaviour remains top of mind with employees through regular awareness sessions at branch level. During these sessions, Clover’s ethics hotline is reinforced as a key platform for feedback and employees are familiarised on how and when it should be used. Management, employees and other stakeholders are encouraged to make use of the ethics hotline as it facilitates reporting of any suspicion and/or awareness of transgression against the Company’s code of ethics. Deloitte independently manages Clover’s ethics hotline and every incident reported is treated as confidential.
Clover’s code of ethics sets a benchmark against which the Company is managed, paying cognisance to the social, political, operating and other environments in which the business conducts itself. As South Africa’s most reputable brand, Clover vigilantly protects its reputation. No material ethical leadership or corporate citizenship deficiencies were identified or reported during the year under review.
The board, through the Audit and Risk Committee as well as the Social and Ethics Committee oversees and monitors compliance with the code of ethics through various reporting channels, including:
• Clover’s internal audit department, outsourced to Deloitte
• The ethics hotline
• Clover’s Competition Law Centre of Excellence
Clover complied in all material aspects with all relevant legislation and was not subject to any penalties, fines or criminal procedures.
The board’s terms of reference are formalised in a board charter (Board Charter). The Board Charter sets out responsibilities which are reviewed annually. Ultimately, the board is responsible for effective corporate governance. All board sub-committees operate under board approved mandates and terms of reference. Except for the Executive Committee, all other committees are chaired by an independent non-executive director. During the year under review the board’s terms of reference and all committees’ terms of reference were updated to align with the principles set out in King IV™.
THE BOARDThe board is accountable to shareholders and ultimately responsible for the management of Clover’s business, including the setting of strategies and policies as well as approving the Group’s financial objectives and targets.
Shareholders appoint board members, although the board has the authority to appoint directors to fill any vacancy that may arise from time to time. Shareholder ratify these appointments at the subsequent annual general meeting.
CLOVER VIGILANTLY PROTECTS AND BUILDS ON ITS REPUTATION AND IS EXTREMELY PROUD TO HAVE BEEN VOTED THE MOST REPUTABLE BRAND IN SOUTH AFRICA IN 2018*, AN ACCOLADE IT HAS CONSISTENTLY ACHIEVED SINCE 2016.*South Africa RepTrak® Study 2016, 2017 and 2018.
Clover Industries Limited Integrated Report for the year ended 30 June 2018 25
IN T
HE
SP
OT
LIGH
T
FOR
20
18IN
TR
OD
UC
ING
CLO
VE
R’S S
TO
RY
AN
ALY
SIN
G C
LOV
ER
’S V
ALU
E C
RE
AT
ION
LEA
DE
RS
HIP
R
EV
IEW
SP
ER
FOR
MA
NC
E O
UT
CO
ME
S O
F TH
E S
IX C
AP
ITA
LS
RE
MU
NE
RA
TIO
N
RE
PO
RT
AN
NU
AL FIN
AN
CIA
L R
ES
ULT
SS
HA
RE
HO
LDE
R
INFO
RM
AT
ION

Director appointments are based on specific skillsets, industry experience and expertise as well as the overall contribution that an applicant may offer. The Nomination Committee, as a sub-committee of the board, is responsible for identifying and recommending suitable candidates for the board’s formal consideration.
Clover’s empowerment and transformation objectives are considered as part of the process. The board has adopted a gender and race diversity policy with the objective of guiding and assisting the board in promoting gender and race diversity at board level. The board will use its best endeavours to ensure that at least two female board members serve at all times. This target has been achieved during the year under review.
Notwithstanding these voluntary targets, all appointments to the board are made on merit, taking into account suitability for the role, board balance and composition, the required blend of skills, background, experience and gender.
The board will in addition consider the balance and mix of skills, experience, independence and knowledge and the diversity representation on the board, including gender and race, how the board functions as a unit and any other factors relevant to its effectiveness when considering the appointment of any director.
The Nomination Committee annually considers the adequacy of existing voluntary diversity targets and make the appropriate recommendations to the board for approval and adoption.
New appointees are formally inducted and familiarised with Clover’s business.
Clover’s Memorandum of Incorporation gives the board the authority to indemnify directors. Deeds of indemnification have been issued to all directors and prescribed officers of Clover, to the extent permitted by the Companies Act. During the year under review, appropriate director and prescribed officer liability insurance was in place.
Board members annually provide a general disclosure of their personal financial interests in terms of Section 75 of the Companies Act 2008, to ensure that conflicts of interest are avoided. Board members are further reminded at the
commencement of every board and board committee meeting to declare any material financial interests that they may have in contracts entered into or authorised by the Company or in any matters to be discussed at the meeting, as well as any changes to their interests previously declared.
The board is required to assess its performance against the Board Charter requirements on an annual basis. During the year under review, and following a formal board assessment, it was identified that the board requires additional commercial skills, preferably with exposure to the fast-moving consumer goods (FMCG) industry. Following an extensive recruitment process, Dr Basson and Mr Morgan were appointed. Dr Basson holds a BCom CTA from the University of Stellenbosch and received an honourable doctorate in Commerce (DComm) from the Chancellor of Stellenbosch University. In 1970, he qualified as Chartered Accountant after serving his articles with Ernst & Young Chartered Accountants, at the time known as ER Syfret & Co. Dr Basson has 45 years’ experience in retail, having built the Shoprite Group from a small eight-store business to the largest retail chain in Africa, currently with a market capitalisation in excess of c. R135 billion. His vast experience in the retail sector will bring invaluable knowledge to the board. Mr Morgan holds an MA (Hons) Degree from the University of Edinburgh. He was previously a member of the Groupe Danone Executive Committee and CEO of Nutricia, Danone’s Medical Nutrition Division. Mr Morgan has a wealth of experience in the FMCG sector having held various senior positions at British American Tobacco, the Coca-Cola Company and Groupe Danone.
The Chairman continuously monitors and manages the participation of board members and considers development requirements of each director, if required.
The Board Charter is available on the Group’s website at https://www.clover.co.za/investors/board-charter/
BOARD COMPOSITIONDuring the year under review, the board consisted of two executive directors and seven non-executive directors, five of whom are independent. Clover’s board comprises a majority of independent non-executive directors to achieve a desirable balance of power and authority. No individual director has unfettered powers of decision-making.
During the year under review the following changes to the board occurred:
Resignations:• Mr ER Bosch resigned as the Company’s Chief Financial
Officer and stepped down on 31 December 2017.
Appointments:• Mr F Scheepers was appointed as the Company’s Chief
Financial Officer effective from 1 January 2018.
• Dr JW Basson was appointed as an independent non-executive director of the Board effective 1 January 2018.
• Mr F Morgan was appointed as an independent non-executive director of the Board effective 1 January 2018.
In terms of the Company’s Memorandum of Incorporation and best practice, at least one-third of the board’s members retire each year at the annual general meeting. Retiring directors are eligible for re-election.
Details of directors are available on pages 20 and 21 of this report.
COMPANY SECRETARYMr J van Heerden has been Clover’s appointed Company Secretary since 1 September 2012. He is not a director of Clover, although he serves in such a capacity on numerous subsidiary boards. This relationship does not affect his arm’s length relationship with the board.
The Company Secretary is appointed and removed by the board and is responsible to the board for ensuring that procedures and regulations are complied with and that directors are conversant with their duties and responsibilities. Clover’s directors have unfettered access to the advice and services of the Company Secretary and may seek independent professional advice on Clover’s affairs if they believe such actions will best serve the interests of Clover.
The Company Secretary is responsible for the duties set out in Section 88 of the Companies Act and ensuring compliance with the Listings Requirements of the JSE Limited. The Company Secretary also provides an important communication function to investors and liaises with the Group’s transfer secretaries and sponsors on relevant matters. The Company Secretary, along with the Chief Executive and Chief Financial Officer, is the only designated spokesperson on investor matters.
REPORT ON GOVERNANCE, RISK AND COMPLIANCE continued
Clover Industries Limited Integrated Report for the year ended 30 June 201826

As required by King IV™ the Company Secretary also acts as secretary to the various sub-committees of the board and attends all meetings of the board and its committees. The Company Secretary is also the compliance officer and ensures that the Group complies with all the required legislation and regulations applicable to its various business activities.
In compliance with the JSE Listings Requirements, a detailed assessment was conducted by the board to satisfy itself of the competence, qualifications and experience of the Company Secretary. This was performed by way of:
• A review of qualifications and experience: Mr Van Heerden holds an LLB (cum laude) degree from the University of Pretoria and is an associate of the Chartered Secretaries of Southern Africa.
• Assessments by the directors of the competency of the Company Secretary: A formal assessment is done by the board annually, requesting the views of each director on the competence, qualifications and experience of the Company Secretary. No exceptions were noted during any of these assessments conducted since the appointment of Mr Van Heerden.
Having duly considered the above, the board is satisfied that Mr Van Heerden holds the necessary qualifications and has the competence and experience to act as Company Secretary.
Furthermore, the board is satisfied that the Company Secretary maintains an arm’s length relationship with the board and individual directors as required by King IVTM.
The certificate of Mr Jacques van Heerden, the Company Secretary, appears on page 107 of this Integrated Annual Report.
GOVERNANCE OF RISKEffective risk management aligns risk and opportunities to Clover’s vision and mission. Proactive risk management practices ensure governance mechanisms are effective
across the value chain, and focuses on both strategic and operational risks, while aligning enterprise-wide risks and opportunities. Growing shareholder value forms the basis of our risk management strategy and allows Clover to take calculated risks in a manner that does not jeopardise the direct interests of stakeholders. Clover’s risk profile stipulates a prudent approach to risks, as shown in decisions on risk tolerance and mitigation.
Clover’s board assumes full responsibility for the governance of risk through a formal risk management framework. It effects its duties through the Audit and Risk Committee.
To ensure a consistent approach to risk management throughout Clover, the board annually approves the Enterprise Wide Risk Management (“ERM”) Framework and Policy that defines Clover’s risk-bearing capacity, risk appetite and risk tolerance. This policy and framework incorporates generally accepted risk management practices and the integrated framework on enterprise risk management disseminated by the Committee of Sponsoring Organisations (COSO), while strengthening the link between risk and strategy. The policy and framework is essential to embed risk management into key decision processes of all subsidiaries, support functions, processes, projects and entities controlled by Clover.
Management continues to mature and integrate risk processes into business processes, and risk limits are reviewed annually. This exercise includes setting authorisation thresholds for pursuing strategies within the predetermined levels of risk appetite, as well as setting risk tolerances for operational functions. These risk limits are used to compile the risk impact categorisation table, which is used for measuring and prioritising risks according to the materiality of the risk’s potential impact values.
Management has been charged with the design, implementation and monitoring of Clover’s risk management structures. Each business unit conducts quarterly risk assessments to monitor the efficiency of these structures.
Clover records and manages its risk universe on the BarnOwl risk management system, which prioritises material, inherent and residual risks.
The Management Risk Committee meets each quarter to table Clover’s key risks as well as the status of mitigating action plans. Key risks and mitigating actions are reported to the Audit and Risk Committee quarterly. On material inherent risks, dependent on effective control measures in keeping residual risks at acceptable levels, Clover annually revises its combined assurance plan for material risks to gain assurance from internal and/or external identified assurance providers in accordance to the five levels of defence.
In the 2016 financial year, Deloitte was appointed by Clover as part of the internal audit coverage plan to review the maturity and effectiveness of risk management function against Clover’s Enterprise Wide Risk Management Framework and the principles of the King Code. Deloitte was tasked with providing appropriate recommendations for improving Clover’s risk management policy and processes. Deloitte concluded that management had solidly embedded risk management processes across the organisation to establish a well-defined risk function. As part of Clover’s rolling three-yearly internal audit plan, Clover will audit its risk management process against best practice, including the principals of King IV™.
Clover has reviewed the principals of King IV™ and amended its risk processes and company policies in adopting the enhancements recommended by King IV™.
Clover runs ongoing fraud awareness campaigns at branch level across all levels of staff to raise awareness of Clover’s ethics policy, the use of the ethics hotline and the fact that all calls to this line are treated confidentially by an independent party. Furthermore, new staff are required to sign acceptance of receipt of Clover’s ethics policy. Tip-offs received are actively investigated, followed-up on and resolved. The board, assisted by the Audit and Risk Committee, are satisfied with the effectiveness of Clover’s risk management function.
Clover Industries Limited Integrated Report for the year ended 30 June 2018 27
IN T
HE
SP
OT
LIGH
T
FOR
20
18IN
TR
OD
UC
ING
CLO
VE
R’S S
TO
RY
AN
ALY
SIN
G C
LOV
ER
’S V
ALU
E C
RE
AT
ION
LEA
DE
RS
HIP
R
EV
IEW
SP
ER
FOR
MA
NC
E O
UT
CO
ME
S O
F TH
E S
IX C
AP
ITA
LS
RE
MU
NE
RA
TIO
N
RE
PO
RT
AN
NU
AL FIN
AN
CIA
L R
ES
ULT
SS
HA
RE
HO
LDE
R
INFO
RM
AT
ION

REPORT ON GOVERNANCE, RISK AND COMPLIANCE continued
FOOD HEALTH AND SAFETY• Stricter regulatory
compliance is expected to promote consumer
health and safety
VOLATILE LABOUR ENVIRONMENT WITH
INCREASED PRESSURE ON LABOUR COSTS
PRINCIPAL INCOME UNDER PRESSURE AND LOSS OF PRINCIPAL INCOME• On 5 September 2018, Remgro
gave notice of termination of the distribution and warehousing services relating to the margarine and spreads business
• The distribution agreement will terminate on 3 March 2019
DFSA’S SUSTAINABILITY IMPACTING CLOVER’S SERVICES RENDERED INCOME AND RECOVERABILITY OF REVOLVING CREDIT FACILITY
CHANGES IN COMPETITIVE LANDSCAPE• Increased competition
for consumer spend from retailer own brands, other branded dairy offerings
• Retail centralisation
RISKS
MITIGATING ACTIONS MITIGATING ACTIONS
06
04 03
01
02
• All South African Clover factories are HACCP certified and accredited by third-party auditors.
• In line with international best practices for quality, hygiene and food safety Clover has accredited systems and processes in place according to which products are produced.
• Clover is a FSSC 22000 accredited manufacturer of food and beverages. Clover’s food safety systems comply with international standards.
• Communication channels with labour are being enhanced to address business risks.
• Business continuity plans have been updated to mitigate potential industrial action.
• Arbitration channels employed to amicably settle wage disputes.
• Management will continue to identify new principals and alternative distribution opportunities.
• Clover is focused on enhancing its distribution model to extract efficiencies.
• Expansion opportunities of Clover’s merchandising services is currently being considered as a growth area.
• Following a thorough strategic review of the business environment and the expected continued muted economic environment, efficiency drives in Clover’s infrastructure have been introduced to adapt to changes in the competitive landscape, which will bode well for future cost savings.
• Clover embarked on continued cost savings through various initiatives including Project Sencillo to improve efficiencies in the supply chain and Project Meglio to reduce product unit cost from recipe reformulations. PIT is considering further product reformulations.
• Re-strategise and optimise costs for specific retailer changes in distribution model to ensure Clover remains cost competitive in each of the distribution channels affected.
05
• Clover established a Competition Law Policy with continuous compliance monitoring and training of personnel.
• Clover established the Competition Law Centre of Excellence and is supported by Herbert Smith Freehills LLP.
• Clover implemented process to ensure compliance to the Health Promotion Levy on sugary beverages.
• Clover is in process to evaluate the impact of upcoming legislation such as POPIA, Carbon Tax and AARTO.
NON-COMPLIANCE WITH LEGISLATION
Clover Industries Limited Integrated Report for the year ended 30 June 201828

DFSA’S SUSTAINAIBILITY IMPACTING CLOVER’S SERVICES RENDERED INCOME AND RECOVERABILITY OF REVOLVING CREDIT FACILITYDFSA incurred a loss of R128,8 million for the financial year ended 30 June 2018 mainly as a result of national milk surpluses which were stimulated by higher than normal milk prices paid to producers from July 2017 through to December 2017 as well as favourable weather conditions over most parts of the country during the summer months.
The above mentioned was compounded by favourable exchange rates which created room for cheap imports of UHT milk has put tremendous pressure on the recovery of sustainable pricing on non-value-added milk and commodity related milk products in the market. These conditions have put strain on the local milk industry and DFSA in particular.
At current market pricing some of DFSA’s volumes could be at risk, which also impact service fees Clover generates through DFSA on volumes processed through Clover’s factories and distribution channel. However, the volumes from the non-value-added drinking milk business have been relatively stable over last 5 years.
MITIGATING ACTIONSCyclicality is not uncommon in the dairy industry and experience showed that surplus years, which leads to a reduction in the milk price paid to producers are followed by a recovery of the industry as normal market forces lead to a natural decrease in raw milk availability and consequential recovery of sustainable pricing in the market as well as prices paid to milk producers.
Historically, the dairy business transferred to DFSA has been exposed to seasonal cyclicality, from time to time, and therefore it will not be possible to synchronise prices paid to producers with prices recouped in the market within a specific financial year or cycle. A longer investment horizon is required to establish a trendline. The below sets out the historical performance of the non-value added dairy business when it was part of Clover’s product portfolio:
• 2012/2013 – Operating loss of R62,7 million;
• 2013/2014 – Operating loss of R126,4 million;
• 2014/2015 – Operating profit R60,5 million;
• 2015/2016 – Operating profit R77,0 million; and
• 2016/2017 – Operating profit R23,8 million.
Based on the above, it is not unexpected that DFSA may make losses, however, as market forces align (i.e. supply and demand), it is expected that profits and losses will balance out.
In view of future sustainability, DFSA implemented a strategy to navigate through the current down cycle by introducing a new system whereby it will adjust the milk price paid to producers on a more frequent basis, depending on the market conditions that influence DFSA’s financial performance against budget.
The above has been put into practice and DFSA announced a milk price reduction to producers effective 1 August 2018. The board of DFSA decided that a portion of the aforementioned reduction will be used to build up a restricted reserve of R90 million to assist DFSA to strengthen its balance sheet.
As a result of continued strong milk flow and the muted economy, selling prices in the trade remained under pressure and DFSA announced a further milk price reduction of on 31 August, which will be effective 1 October 2018.
The above confirms the implementation of DFSA’s board decision and the subsequent communication to milk producers that DFSA would adjust the milk price, depending on DFSA’s actual financial performance against its budgeted financial performance.
Clover has an interest in the stability and growth of DFSA, as growth in volumes will directly benefit services income and the dilapidation of volumes will negatively affect Clover’s services income and profitability.
Following DFSA’s intention to build up a restricted reserve as alluded to above, Clover also made a R 90 million cash injection in DFSA that will be capitalized once shareholder approval is obtained as required by DFSA’s Memorandum of Incorporation. This will not increase Clover’s voting rights or shareholding and underpins Clover’s ongoing commitment to support its milk source, service fees and the sustainability of DFSA.
The build-up of the aforementioned reserve by DFSA and Clover’s capitalisation will add stability to DFSA to navigate through future cycles.
Clover has granted DFSA two 20 year revolving credit facilities (RCF) of R450 million and R100 million respectively. Given the loss situation, management tested the revolving credit facility for impairment in terms of IAS39 and other recognised impairment tests.
Following the unexpected resignation of DFSA’s CEO and Chairman on 11 September 2018, Clover’s Board deemed it prudent to adopt a conservative approach and provide for a full impairment of the R439 million revolving credit facility extended to DFSA to date.
As the revolving credit facility was granted over a period of 20 years, repayment is not expected over the short-term.
Clover Industries Limited Integrated Report for the year ended 30 June 2018 29
IN T
HE
SP
OT
LIGH
T
FOR
20
18IN
TR
OD
UC
ING
CLO
VE
R’S S
TO
RY
AN
ALY
SIN
G C
LOV
ER
’S V
ALU
E C
RE
AT
ION
LEA
DE
RS
HIP
R
EV
IEW
SP
ER
FOR
MA
NC
E O
UT
CO
ME
S O
F TH
E S
IX C
AP
ITA
LS
RE
MU
NE
RA
TIO
N
RE
PO
RT
AN
NU
AL FIN
AN
CIA
L R
ES
ULT
SS
HA
RE
HO
LDE
R
INFO
RM
AT
ION

REPORT ON GOVERNANCE, RISK AND COMPLIANCE continued
GOVERNANCE OF INFORMATION TECHNOLOGY (IT)Information technology is fundamental to the sustainable functioning of operations. Considering the strategic importance of IT, Clover’s business requirements are aligned to available resources and technology that support the formulation of an appropriate IT strategy to improve Clover’s competitiveness and sustainability.
Clover’s IT department has developed an IT governance framework that considers relevant structures and processes for meeting Clover’s business requirements. Applicable IT best practice, including those in the COBIT framework, have been adopted to ensure appropriate mitigation of IT risks.
IT governance imposes management and control disciplines on IT activities to help ensure the integrity and protection of IT operations, whilst achieving business goals. This is achieved with input from all stakeholders, including the board, internal customers and particular departments, such as finance.
The board, through the Audit and Risk Committee is ultimately responsible for IT governance, which is included in the board’s workplan. The Audit and Risk Committee oversees and manages the implementation of the IT governance framework, taking into account the major IT risks and opportunities on a quarterly basis.
In the year under review, as part of the combined assurance plan Clover implemented a test plan to verify its security footprint, cyber maturity and processes to ensure that the level of security is maintained and continuously improved. This plan also covers regular penetrations tests by accredited institutions like Ernst & Young to proactively identify possible security vulnerabilities that need remediation.
COMPLIANCE WITH LAWS, CODES, RULES AND STANDARDSThe Company Secretary is responsible for facilitating compliance throughout Clover and an analysis of current and pending legislation and regulation relevant to the Group is presented at board meetings.
All employees are inducted and are continuously updated to ensure a consistent understanding of compliance policies and procedures.
Clover subscribes to various alerts, licenses and key sources of regulatory information and the Group’s legal and compliance department reviews compliance alerts on an ongoing basis. Regulatory changes applicable to Clover are communicated to all relevant internal stakeholders on an ongoing basis. Changes are also incorporated into the Group’s risk management framework as and when required.
Clover’s regulatory universe is reviewed annually and includes assessing the completeness and accuracy of those regulatory requirements identified by management and industry experts.
During the year under review, the following acts and other regulations have been identified as priority areas:
• Competition Act, 89 of 1998
• National Building Regulations and Building Standards Act, 49 of 1995
• Consumer Protection Act, 68 of 2008
• Foodstuffs, Cosmetics and Disinfectants Act, No 54 of 1972
• Income Tax Act, 58 of 1962 (as amended)
• JSE Listings Requirements
• Occupational Health and Safety Act, 85 of 1993
• Value-Added Tax Act, 89 of 1991 (as amended)
• Tax Administration Act, 28 of 2011 (as amended)
• Employment Equity Act, 47 of 2013
• Labour Relations Amendment Act 2014
• Companies Act, 71 of 2008
• Agricultural Product Standards Act, No 119 of 1990
• Protection of Personal Information Act, (POPIA)
• Rates and Monetary Amounts and Revenue Laws Amendment Act, No 14 of 2017 (Sugar Beverages Levy)
COMPLIANCE WITH PROVISIONS OF THE PROTECTION OF PERSONAL INFORMATION ACT (POPIA)Following the recent publication of the draft regulations to POPIA, Clover has retained Deloitte’s to assist with identifying Clover’s high-risk privacy gaps and implementation of the required remedial actions. Clover has elected to implement a phased approach towards compliance and focus on the high-risk areas. Clover believes that the focus on these high-risk privacy gaps will go a long way towards full compliance with the POPIA taking into consideration that the regulations have not yet been finalised.
Clover has appointed a Privacy Officer and privacy champions from various departments to, in conjunction with Deloitte, assist with addressing the gaps identified.
COMPLIANCE WITH PROVISIONS OF THE CONSUMER PROTECTION ACT AND COMPETITION ACTClover has established a Competition Law Centre of Excellence (CLCE) in conjunction with its competition law advisors. The primary function of the CLCE is to ensure proper standards of competition law compliance are maintained within Clover.
All staff are trained on compliance and this culture is entrenched through ongoing online educational campaigns and updates on the requirements of the Competition Act and the Consumer Protection Act. It is compulsory for all incumbents in managerial positions to those who may be exposed to anti-competitive or collusive behaviour to complete the training.
Herbert Smith Freehills LLP is retained as Clover’s competition law advisors. A full review of Clover’s compliance with the Competition Act did not identify any contravention of the Act.
LEGACY COMPETITION COMMISSION CASES PENDINGComplaint initiated 13 March 2014: Possible alleged contravention of Section 4(1)(b)(1) (i) of the Competition Act, 89 of 1998 (as amended) (the “Competition Act”):
• On 13 March 2014 the acting commissioner of the Competition Commission initiated a complaint against Clover Industries Limited, Parmalat (Pty) Ltd and Midlands Milk (Pty) Ltd, alleging that the three parties agreed, at some stage in or around 2012, to fix the purchase price of raw milk or trading conditions in terms of which raw milk is purchased.
• The complaint only came to Clover’s attention in March 2015 and the Company immediately conducted an internal investigation, assisted by Bowman Gilfillan Inc. Bowman Gilfillan Inc’s investigation did not reveal any conduct on Clover’s part that suggests that in 2012 it directly or indirectly co-ordinated with Parmalat and Midlands Milk to fix the purchase price of raw milk or trading conditions in terms of which raw milk is purchased, as alleged by the commission.
• At the time of writing, no further communication from the Commission about regarding the above complaint has been received.
Complaint initiated 20 June 2017: Possible alleged contravention of Section 9(c)(i) of the Competition Act, 89 of 1998:
• On the above date, Mr Frank Wilcox, a director of Ndlovu Corporate Suppliers, filed a complaint with the Competition Commission against an employee of Clover in his capacity as Food Safety Initiative Manager. The complainant alleges that Clover offers more favourable prices for its UHT milk to wholesalers and retailers than to the complainant.
Clover Industries Limited Integrated Report for the year ended 30 June 201830
• Clover immediately investigated the complaint with the assistance of Herbert Smith Freehills South Africa LLP, which did not reveal any conduct on Clover’s part that suggests its employees contravened Section 9(c)(i) of the Competition Act.
• At the time of writing, Clover has received no further communication from the commission regarding the above complaint.
Complaint initiated on 6 September 2017: Alleged contravention of Section 8(c) of the Competition Act:
• On the above date, Ravhudzulo Makhuva Tshidimaki CC filed a complaint with the Competition Commission against Clover alleging that Clover’s conduct of refusing and/or delaying its application to open an account, inter alia, prevents it from participating in the market.
• The matter was non-referred on the basis that the commission was of the view that the conduct complained of did not contravene the Competition Act.
During the year under review, Clover complied in all material aspects with all relevant legislation. Apart from a number of legal proceedings arising as part of the normal course of business, the board is satisfied that Clover does not face any material pending or threatening legal actions.
INSIDER TRADINGThe board has approved a price-sensitive information policy and an insider trading policy for Clover. Directors, officers, relevant employees and service providers have been informed that they are compelled to comply with these policies.
Salient features of these policies include:
• No Clover employee may deal directly or indirectly in Clover shares on the basis of unpublished price-sensitive information on Clover.
• No director or officer of Clover may disclose trade information of the business.
• Directors and officers are precluded from trading in Clover shares during closed periods or prohibited periods as determined by the board.
Closed periods are effective from:
• The end of the first six-month results period to the time of publication of the interim financial results on the JSE’s Securities Exchange News Service (SENS).
• The financial year-end date to the time of the publication of the annual financial results on the JSE’s Securities Exchange News Service (SENS).
Any director wishing to trade in Clover’s shares must obtain clearance from the Chairman of the Board or the designated director prior to trading in these shares.
CONSUMER GOODS AND SERVICES OMBUD (CGSO) AND CODEClover is a committed participating member of the CGSO Ombud. The objective of the Ombud’s office is to operate as an alternative dispute resolution mechanism, aimed at safeguarding the interests of consumers.
No disputes were referred to or filed with the CGSO during the year under review.
INVESTOR RELATIONSThe objective of Clover’s investor relations policy is compliance with all legislation, regulation and voluntary codes pertaining to disclosure, communication and dissemination of information, while simultaneously safeguarding management and limiting Clover’s reputational risk.
Management is committed to engaging with local and international fund managers and analyst to support informed investment decision-making.
The board also engaged with shareholders whom voted against the Remuneration Policy and the implementation of the Remuneration Policy at the AGM and formally tabled all concerns raised by its shareholders at its Remuneration Committee meeting.
The CE, CFO and Company Secretary are the only designated investor spokespersons. An investor relations consultant is retained to advise the Group on its investor relations strategy and activities.
Clover aims to ensure proactive and timely communication with the investment community.
INTERNAL AUDITDeloitte has been tasked with implementing the annual internal audit plan approved by Clover’s Audit and Risk Committee. The board recognises that an effective internal control system can only provide reasonable assurance with regards to preparing financial statements and safeguarding assets. As with any policy or protocol, there are inherent limitations to the effectiveness of any system due to human error or a deliberate circumnavigation or overriding of controls.
Clover’s internal controls and systems are designed and monitored to provide reasonable assurance on the reliability of the financial statements and to protect, verify and maintain
accountability for its assets. These controls are based on established policies and procedures, as implemented by trained personnel with segregated duties and responsibilities.
Internal control systems are managed by way of a documented organisational structure with segregated responsibilities and established policies and procedures which are communicated throughout the business. Internal audit personnel are carefully selected, trained and developed to effectively execute their duties. Significant findings are reported to the Executive Committee as well as the Audit and Risk Committee, which will take corrective actions to address identified deficiencies in internal control.
During the year under review, recommendations were made to enhance certain aspects of the internal control environment, although no material breakdowns in internal controls were reported within the overall environment. These valuations were the main input considered by the board in reporting on internal control effectiveness.
A limited assurance review of management’s assessments of internal controls for financial reporting was conducted by Clover’s external auditors, Ernst & Young Incorporated. This was a separate exercise in addition to the internal audit conducted by Deloitte. No material findings were reported to the Audit and Risk Committee and nothing has been brought to the attention of the directors or the auditors that indicates any material breakdown in the effectiveness of the internal controls during the year under review.
DISCLOSURE OF COMPLIANCE WITH CODEThe board has satisfied itself that Clover has conformed throughout the reporting period to all principles of King IV™ and the JSE Listings Requirements.
Jacques van Heerden
Company Secretary
26 September 2018
Clover Industries Limited Integrated Report for the year ended 30 June 2018 31
IN T
HE
SP
OT
LIGH
T
FOR
20
18IN
TR
OD
UC
ING
CLO
VE
R’S S
TO
RY
AN
ALY
SIN
G C
LOV
ER
’S V
ALU
E C
RE
AT
ION
LEA
DE
RS
HIP
R
EV
IEW
SP
ER
FOR
MA
NC
E O
UT
CO
ME
S O
F TH
E S
IX C
AP
ITA
LS
RE
MU
NE
RA
TIO
N
RE
PO
RT
AN
NU
AL FIN
AN
CIA
L R
ES
ULT
SS
HA
RE
HO
LDE
R
INFO
RM
AT
ION
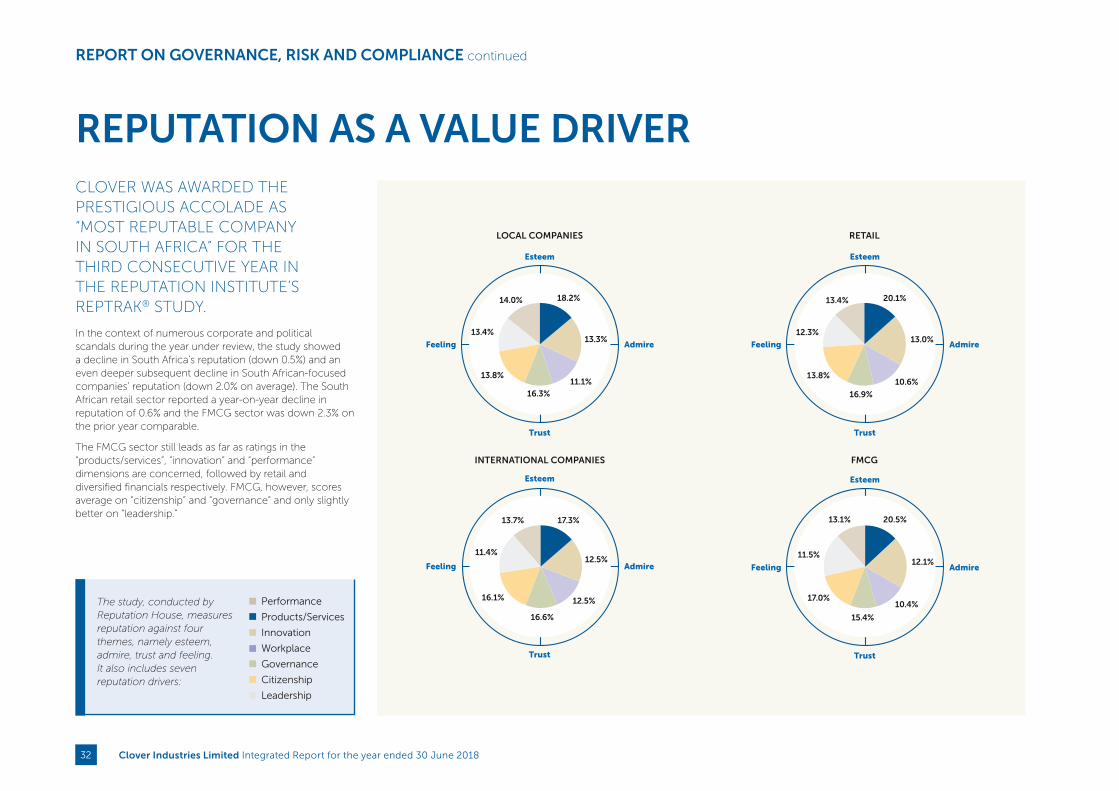
11.1%
13.4%
14.0% 18.2%
13.3%
13.8%
16.3%
LOCAL COMPANIES
Esteem
AdmireFeeling
Trust
12.5%
11.4%
13.7% 17.3%
12.5%
16.1%
16.6%
Esteem
AdmireFeeling
Trust
INTERNATIONAL COMPANIES
Esteem
AdmireFeeling
Trust
10.6%
12.3%
13.4% 20.1%
13.0%
13.8%
16.9%
RETAIL
Esteem
AdmireFeeling
Trust
10.4%
11.5%
13.1% 20.5%
12.1%
17.0%
15.4%
FMCG
REPUTATION AS A VALUE DRIVERCLOVER WAS AWARDED THE PRESTIGIOUS ACCOLADE AS “MOST REPUTABLE COMPANY IN SOUTH AFRICA” FOR THE THIRD CONSECUTIVE YEAR IN THE REPUTATION INSTITUTE’S REPTRAK® STUDY.
In the context of numerous corporate and political scandals during the year under review, the study showed a decline in South Africa’s reputation (down 0.5%) and an even deeper subsequent decline in South African-focused companies’ reputation (down 2.0% on average). The South African retail sector reported a year-on-year decline in reputation of 0.6% and the FMCG sector was down 2.3% on the prior year comparable.
The FMCG sector still leads as far as ratings in the “products/services”, “innovation” and “performance” dimensions are concerned, followed by retail and diversified financials respectively. FMCG, however, scores average on “citizenship” and “governance” and only slightly better on “leadership.”
REPORT ON GOVERNANCE, RISK AND COMPLIANCE continued
Performance
Products/Services
Innovation
Workplace
Governance
Citizenship
Leadership
The study, conducted by Reputation House, measures reputation against four themes, namely esteem, admire, trust and feeling. It also includes seven reputation drivers:
Clover Industries Limited Integrated Report for the year ended 30 June 201832

Clover Industries Limited Integrated Report for the year ended 30 June 2018 33
IN T
HE
SP
OT
LIGH
T
FOR
20
18IN
TR
OD
UC
ING
CLO
VE
R’S S
TO
RY
AN
ALY
SIN
G C
LOV
ER
’S V
ALU
E C
RE
AT
ION
LEA
DE
RS
HIP
R
EV
IEW
SP
ER
FOR
MA
NC
E O
UT
CO
ME
S O
F TH
E S
IX C
AP
ITA
LS
RE
MU
NE
RA
TIO
N
RE
PO
RT
AN
NU
AL FIN
AN
CIA
L R
ES
ULT
SS
HA
RE
HO
LDE
R
INFO
RM
AT
ION

OLIVE OIL AND SOYA CONTRIBUTED
2,0%TO CLOVER’S TOTAL SALE OF PRODUCT
FOR THE YEAR
THE MOM FROM OLIVE OIL AND
SOYA WAS
30,4%FOR THE YEAR
OLIVE OIL AND SOYA REVENUE INCREASED
93,0%FROM THE PRIOR YEAR
Clover Industries Limited Integrated Report for the year ended 30 June 201834
ANALYSING CLOVER’S VALUE CREATION
Clover Industries Limited Integrated Report for the year ended 30 June 2018 35
IN T
HE
SP
OT
LIGH
T
FOR
20
18IN
TR
OD
UC
ING
CLO
VE
R’S S
TO
RY
AN
ALY
SIN
G C
LOV
ER
’S V
ALU
E C
RE
AT
ION
LEA
DE
RS
HIP
R
EV
IEW
SP
ER
FOR
MA
NC
E O
UT
CO
ME
S O
F TH
E S
IX C
AP
ITA
LS
RE
MU
NE
RA
TIO
NR
EP
OR
TA
NN
UA
L FINA
NC
IAL
RE
SU
LTS
SH
AR
EH
OLD
ER
IN
FOR
MA
TIO
N

Clover actively engages with all our stakeholders throughout the year on its strategic aspirations as well as understanding stakeholders’ needs, interests and perspectives. Material matters arising from stakeholder engagements are managed as part of the risk management process. The review of material risks and opportunities include stakeholders’ perspectives, ensuring alignment of Clover’s business model with those of its respective stakeholders.
Clover’s material stakeholder groups are described in the table below:
HOW OUR STAKEHOLDERS’ NEEDS INFORM OUR REALITY
How Clover supports our stakeholders’ needs • Ongoing commitment to our core strategic social
investment initiatives• Employment opportunities across South Africa
Means of engagement
Direct interaction through various corporate social investment initiatives, such as:
• Clover Mama Afrika• Food donation after Clover’s successful world
record attempt at the longest sandwich• Choc foundation
Benefits to Clover through support and engagement with our stakeholders
Engagement with our communities helps us determine our impact on the communities and gives Clover the opportunity to develop new product offerings
How Clover supports our stakeholders’ needs
• Timely payment and fair terms• Long-term sustainable contracts
Means of engagement
Supplier meetings, site visits and performance evaluations
Benefits to Clover through support and engagement with our stakeholders
• High-quality raw materials or services that enable us to produce quality products for our consumers
• Reliability of supply
Reality
Weakening/volatile Rand increases costs and uncertainty of supply
Clover’s response/strategy
SFA 5 Clover makes timely payments to our suppliers and offers equitable opportunities to all suppliers
SFA 5 Clover builds strategic relationships with key suppliers
COMMUNITIES, TRADITIONAL AND CIVIC SOCIETY SUPPLIERS
HOW CLOVER CREATES VALUE TODAY: GOVERNING STAKEHOLDER RELATIONSHIPS In order to achieve Clover’s strategic objectives as described in Clover’s vision and mission, the Company relies on effectively executing all value creation processes in its business model, which are interdependent of Clover’s material stakeholders’ contributions. These stakeholder groups or individuals can be affected by Clover’s actions and operations or their processes can materially impact on Clover’s business.
Reality
High unemployment rates, rising inflation and poverty in the communities we serve
Clover’s response/strategy
SFA 5 Clover Mama Afrika programme, supporting over 15 000 people in various communities
SFA 3 Clover Masakhane distribution model, which increases our reach into rural communities, providing access to our quality products
Clover Industries Limited Integrated Report for the year ended 30 June 201836

How Clover supports our stakeholders’ needs
• Long-term service agreements to provide stability• A stable market for the milk produced
Means of engagement
• Monthly milk source meetings with DFSA• Through DFSA’s producer roadshow
Benefits to Clover through support and engagement with our stakeholders
• High-quality raw milk to be used in the manufacturing of our dairy products, at the right price
• Consistency of the milk supply and price
How Clover supports our stakeholders’ needs
• High-quality products that are priced competitively, without compromising on quality or service delivery to their stores, that service the needs of their consumers
Means of engagement
• Through orders placed by the retailers through the customer service centre
• Clover sales representatives meet with retail representatives
Benefits to Clover through support and engagement with our stakeholders
• Clover’s brand expansion through retail growth, increasing revenue in the medium- to long-term
• Consistently high volumes
How Clover supports our stakeholders’ needs
• A stimulating and gratifying work environment• Competitive remuneration• Safe working conditions
Means of engagement
• CE briefs and strategic conferences• Training programmes• Formal performance reviews against agreed
objectives• Regular meetings with trade unions
Benefits to Clover through support and engagement with our stakeholders
Employees acting in accordance with Clover’s values of respect, integrity, fairness and responsibility
How Clover supports our stakeholders’ needs
High-quality and trusted branded products, at competitive prices that are easily accessible
Means of engagement
In-store promotions, TV advertising, our Tropika island of treasure TV show as well as through our interactions on our social media pages
Benefits to Clover through support and engagement with our stakeholders
To increase our market share and improve brand loyalty by providing high-quality products at an affordable price to our consumers
Reality
Oversupply of raw milk and cheap imports increase the cost to balance excess milk
Clover’s response/strategy
SFA 4 SFA 5 Balancing facilities are available. We have always and will continue to support our milk producers
Reality
Pressure on selling prices, volumes and margins
Clover’s response/Strategy
SFA 5 Ethical, fair and supportive business practices
SFA 3 Clover makes timeous deliveries and provides quality affordable products
Reality
Wage increases are greater than inflation and the price recoveries from the market
Struggling to retain qualified individuals as a result of approaches by multi-nationals
Clover’s response/strategy
SFA 5 Clover’s staff are remunerated fairly, as the recent benchmarking study has proven
Various employee development and training programmes
RealityConsumers are under pressure due to taxes and the rising fuel priceConsumers want the right quality product to be always available at the right price, and will buy on promotion to get value for money
Clover’s response/Strategy
SFA 3 SFA 4 Clover’s extensive distribution network means that our products and those of our principals are widely available. Our products are fairly priced, as we consider the needs of our consumers in determining our price points
MILK PRODUCERS
RETAILERS/TRADE
EMPLOYEES
CONSUMERS
Clover Industries Limited Integrated Report for the year ended 30 June 2018 37
IN T
HE
SP
OT
LIGH
T
FOR
20
18IN
TR
OD
UC
ING
CLO
VE
R’S S
TO
RY
AN
ALY
SIN
G C
LOV
ER
’S V
ALU
E C
RE
AT
ION
LEA
DE
RS
HIP
R
EV
IEW
SP
ER
FOR
MA
NC
E O
UT
CO
ME
S O
F TH
E S
IX C
AP
ITA
LS
RE
MU
NE
RA
TIO
N
RE
PO
RT
AN
NU
AL FIN
AN
CIA
L R
ES
ULT
SS
HA
RE
HO
LDE
R
INFO
RM
AT
ION
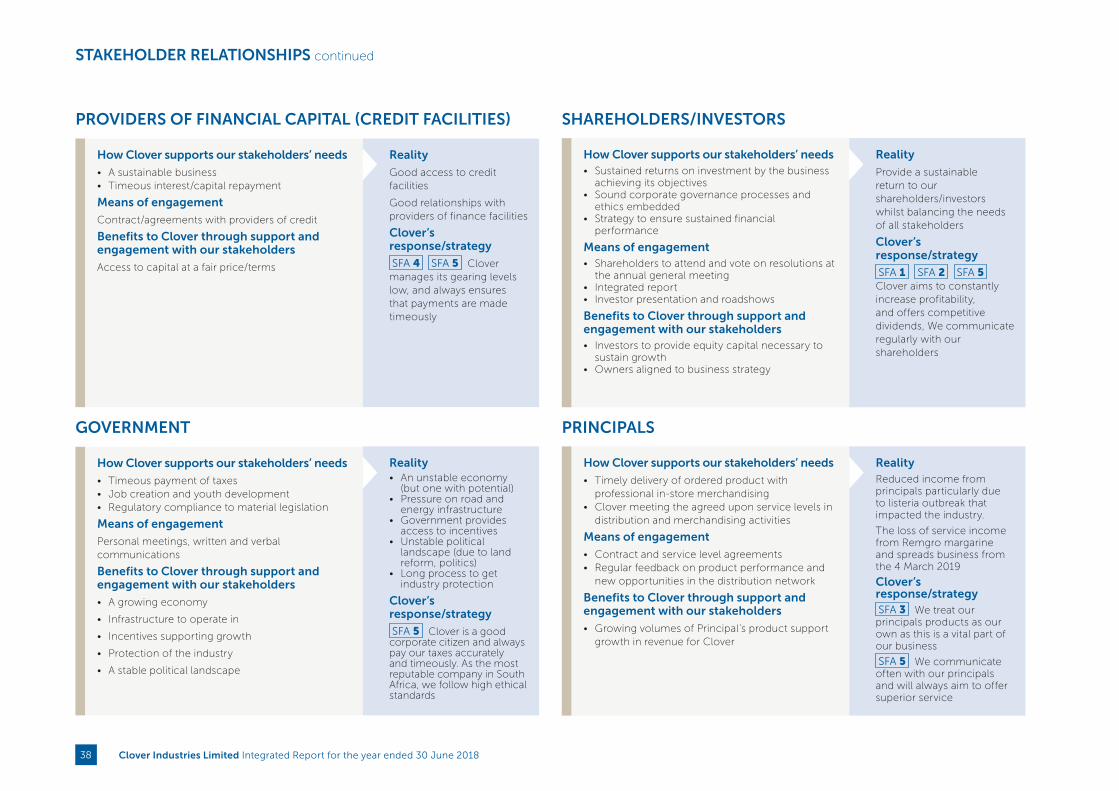
STAKEHOLDER RELATIONSHIPS continued
How Clover supports our stakeholders’ needs
• A sustainable business• Timeous interest/capital repayment
Means of engagement
Contract/agreements with providers of credit
Benefits to Clover through support and engagement with our stakeholders
Access to capital at a fair price/terms
Reality
Good access to credit facilities
Good relationships with providers of finance facilities
Clover’s response/strategy
SFA 4 SFA 5 Clover manages its gearing levels low, and always ensures that payments are made timeously
PROVIDERS OF FINANCIAL CAPITAL (CREDIT FACILITIES)
PRINCIPALS
How Clover supports our stakeholders’ needs• Sustained returns on investment by the business
achieving its objectives• Sound corporate governance processes and
ethics embedded• Strategy to ensure sustained financial
performance
Means of engagement• Shareholders to attend and vote on resolutions at
the annual general meeting• Integrated report• Investor presentation and roadshows
Benefits to Clover through support and engagement with our stakeholders• Investors to provide equity capital necessary to
sustain growth• Owners aligned to business strategy
Reality
Provide a sustainable return to our shareholders/investors whilst balancing the needs of all stakeholders
Clover’s response/strategy
SFA 1 SFA 2 SFA 5 Clover aims to constantly increase profitability, and offers competitive dividends, We communicate regularly with our shareholders
SHAREHOLDERS/INVESTORS
GOVERNMENT
How Clover supports our stakeholders’ needs
• Timeous payment of taxes• Job creation and youth development• Regulatory compliance to material legislation
Means of engagement
Personal meetings, written and verbal communications
Benefits to Clover through support and engagement with our stakeholders
• A growing economy
• Infrastructure to operate in
• Incentives supporting growth
• Protection of the industry
• A stable political landscape
Reality• An unstable economy
(but one with potential)• Pressure on road and
energy infrastructure• Government provides
access to incentives• Unstable political
landscape (due to land reform, politics)
• Long process to get industry protection
Clover’s response/strategy
SFA 5 Clover is a good corporate citizen and always pay our taxes accurately and timeously. As the most reputable company in South Africa, we follow high ethical standards
How Clover supports our stakeholders’ needs
• Timely delivery of ordered product with professional in-store merchandising
• Clover meeting the agreed upon service levels in distribution and merchandising activities
Means of engagement
• Contract and service level agreements• Regular feedback on product performance and
new opportunities in the distribution network
Benefits to Clover through support and engagement with our stakeholders
• Growing volumes of Principal’s product support growth in revenue for Clover
RealityReduced income from principals particularly due to listeria outbreak that impacted the industry.
The loss of service income from Remgro margarine and spreads business from the 4 March 2019
Clover’s response/strategySFA 3 We treat our principals products as our own as this is a vital part of our business
SFA 5 We communicate often with our principals and will always aim to offer superior service
Clover Industries Limited Integrated Report for the year ended 30 June 201838

Clover Industries Limited Integrated Report for the year ended 30 June 2018 39
IN T
HE
SP
OT
LIGH
T
FOR
20
18IN
TR
OD
UC
ING
CLO
VE
R’S S
TO
RY
AN
ALY
SIN
G C
LOV
ER
’S V
ALU
E C
RE
AT
ION
LEA
DE
RS
HIP
R
EV
IEW
SP
ER
FOR
MA
NC
E O
UT
CO
ME
S O
F TH
E S
IX C
AP
ITA
LS
RE
MU
NE
RA
TIO
N
RE
PO
RT
AN
NU
AL FIN
AN
CIA
L R
ES
ULT
SS
HA
RE
HO
LDE
R
INFO
RM
AT
ION
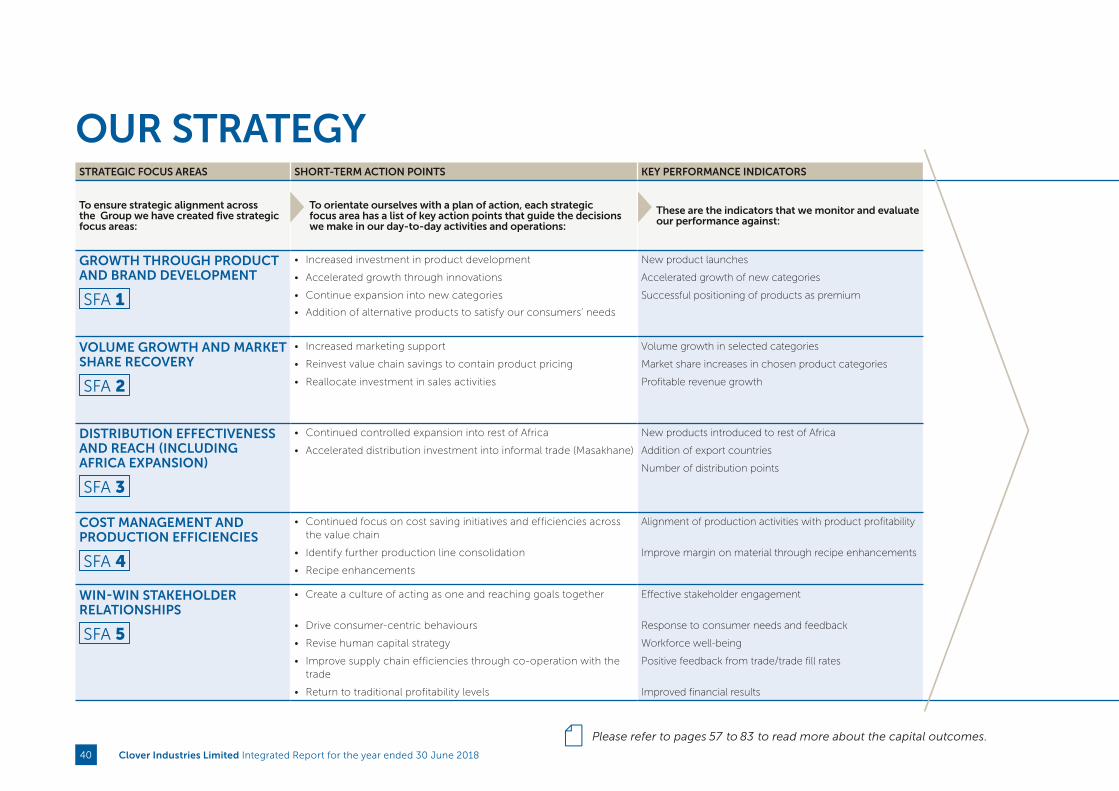
OUR STRATEGYSTRATEGIC FOCUS AREAS SHORT-TERM ACTION POINTS KEY PERFORMANCE INDICATORS 2018 PERFORMANCE UPDATE LONG-TERM INTENTIONS FOR CAPITAL OUTCOMES
To ensure strategic alignment across the Group we have created five strategic focus areas:
To orientate ourselves with a plan of action, each strategic focus area has a list of key action points that guide the decisions we make in our day-to-day activities and operations:
These are the indicators that we monitor and evaluate our performance against:
The strategy was launched at the beginning of the 2018 financial year, making this the benchmark year:
To evaluate our strategic performance, we look at the performance against our KPIs and determine whether we are on track to implement our strategy:
Our strategy has been dictated by the value that we intend to create in the long-term:
GROWTH THROUGH PRODUCT AND BRAND DEVELOPMENT
SFA 1
• Increased investment in product development New product launches Launch new projects successfully
✓Our ability to create shared value depends heavily on our ability to deliver quality outputs at low prices that satisfy the needs of our consumers. We prioritise the quality of our products and services, and the reputation of our brands. We must ensure that we continue to maintain or increase the value of our intellectual capital as this will translate into long-term value for the other capitals.
• Accelerated growth through innovations Accelerated growth of new categories Acquire high potential products/categories
• Continue expansion into new categories
• Addition of alternative products to satisfy our consumers’ needs
Successful positioning of products as premium
VOLUME GROWTH AND MARKET SHARE RECOVERY
SFA 2
• Increased marketing support Volume growth in selected categories Optimise trade spend vs revenue growth
✓By managing the efficiency of our financial capital inputs, manufactured capital inputs and our human capital inputs, we aim to produce outputs that result in positive financial capital outcomes. Although it is important to manage the cost of production, it is imperative that we maintain high quality standards. We therefore invest in our intellectual capital to help us balance cost savings with quality outputs for the long-term.
• Reinvest value chain savings to contain product pricing Market share increases in chosen product categories Implement and roll out Project Kolabo (big data analytics)
• Reallocate investment in sales activities Profitable revenue growth Improve/maintain market shares in key categories
DISTRIBUTION EFFECTIVENESS AND REACH (INCLUDING AFRICA EXPANSION)
SFA 3
• Continued controlled expansion into rest of Africa New products introduced to rest of Africa Reduced supply chain costs
✓To increase financial capital, we need to increase the sales volume and profitability of our outputs. By investing in our manufactured capital and our intellectual capital we aim to expand our distribution footprint in order to diversify our social and relationship capital inputs and our financial capital outcomes.
• Accelerated distribution investment into informal trade (Masakhane) Addition of export countries Increase reach of Masakhane project
Number of distribution points Increase sales volumes into rest of Africa
Reach agreed or targeted service levels
Optimise efficiencies between traditional and Masakhane distribution
COST MANAGEMENT AND PRODUCTION EFFICIENCIES
SFA 4
• Continued focus on cost saving initiatives and efficiencies across the value chain
Alignment of production activities with product profitability Improved profitability per brand or product group
✓By managing the volume of natural capital inputs efficiently, we aim to reduce the financial capital needed to conduct our operations in order to protect the financial capital of our consumers and employees. Downstream, we intend to enhance investors cost savings in a way that results in positive outcomes for our natural capital.
• Identify further production line consolidation Improve margin on material through recipe enhancements Reduced supply chain costs
• Recipe enhancements Redesign and consolidation of factories
WIN-WIN STAKEHOLDER RELATIONSHIPS
SFA 5
• Create a culture of acting as one and reaching goals together Effective stakeholder engagement Restructure commercially to maximise sales and merchandising efficiencies
✓Creating shared value sustainably and successfully requires a strategic approach to balancing the needs and expectations of our stakeholders. Although trade-offs amongst the different stakeholder groups are inevitable, we strive to carry out our operations in a way that creates mutually beneficial value for all stakeholders.
• Drive consumer-centric behaviours Response to consumer needs and feedback Implement and roll out Project Kolabo (big data analytics)
• Revise human capital strategy Workforce well-being Implement joint business plans for major customers and principals
• Improve supply chain efficiencies through co-operation with the trade
Positive feedback from trade/trade fill rates Identify new merger and acquisition opportunities
• Return to traditional profitability levels Improved financial results
Please refer to pages 57 to 83 to read more about the capital outcomes.
Clover Industries Limited Integrated Report for the year ended 30 June 201840

STRATEGIC FOCUS AREAS SHORT-TERM ACTION POINTS KEY PERFORMANCE INDICATORS 2018 PERFORMANCE UPDATE LONG-TERM INTENTIONS FOR CAPITAL OUTCOMES
To ensure strategic alignment across the Group we have created five strategic focus areas:
To orientate ourselves with a plan of action, each strategic focus area has a list of key action points that guide the decisions we make in our day-to-day activities and operations:
These are the indicators that we monitor and evaluate our performance against:
The strategy was launched at the beginning of the 2018 financial year, making this the benchmark year:
To evaluate our strategic performance, we look at the performance against our KPIs and determine whether we are on track to implement our strategy:
Our strategy has been dictated by the value that we intend to create in the long-term:
GROWTH THROUGH PRODUCT AND BRAND DEVELOPMENT
SFA 1
• Increased investment in product development New product launches Launch new projects successfully
✓Our ability to create shared value depends heavily on our ability to deliver quality outputs at low prices that satisfy the needs of our consumers. We prioritise the quality of our products and services, and the reputation of our brands. We must ensure that we continue to maintain or increase the value of our intellectual capital as this will translate into long-term value for the other capitals.
• Accelerated growth through innovations Accelerated growth of new categories Acquire high potential products/categories
• Continue expansion into new categories
• Addition of alternative products to satisfy our consumers’ needs
Successful positioning of products as premium
VOLUME GROWTH AND MARKET SHARE RECOVERY
SFA 2
• Increased marketing support Volume growth in selected categories Optimise trade spend vs revenue growth
✓By managing the efficiency of our financial capital inputs, manufactured capital inputs and our human capital inputs, we aim to produce outputs that result in positive financial capital outcomes. Although it is important to manage the cost of production, it is imperative that we maintain high quality standards. We therefore invest in our intellectual capital to help us balance cost savings with quality outputs for the long-term.
• Reinvest value chain savings to contain product pricing Market share increases in chosen product categories Implement and roll out Project Kolabo (big data analytics)
• Reallocate investment in sales activities Profitable revenue growth Improve/maintain market shares in key categories
DISTRIBUTION EFFECTIVENESS AND REACH (INCLUDING AFRICA EXPANSION)
SFA 3
• Continued controlled expansion into rest of Africa New products introduced to rest of Africa Reduced supply chain costs
✓To increase financial capital, we need to increase the sales volume and profitability of our outputs. By investing in our manufactured capital and our intellectual capital we aim to expand our distribution footprint in order to diversify our social and relationship capital inputs and our financial capital outcomes.
• Accelerated distribution investment into informal trade (Masakhane) Addition of export countries Increase reach of Masakhane project
Number of distribution points Increase sales volumes into rest of Africa
Reach agreed or targeted service levels
Optimise efficiencies between traditional and Masakhane distribution
COST MANAGEMENT AND PRODUCTION EFFICIENCIES
SFA 4
• Continued focus on cost saving initiatives and efficiencies across the value chain
Alignment of production activities with product profitability Improved profitability per brand or product group
✓By managing the volume of natural capital inputs efficiently, we aim to reduce the financial capital needed to conduct our operations in order to protect the financial capital of our consumers and employees. Downstream, we intend to enhance investors cost savings in a way that results in positive outcomes for our natural capital.
• Identify further production line consolidation Improve margin on material through recipe enhancements Reduced supply chain costs
• Recipe enhancements Redesign and consolidation of factories
WIN-WIN STAKEHOLDER RELATIONSHIPS
SFA 5
• Create a culture of acting as one and reaching goals together Effective stakeholder engagement Restructure commercially to maximise sales and merchandising efficiencies
✓Creating shared value sustainably and successfully requires a strategic approach to balancing the needs and expectations of our stakeholders. Although trade-offs amongst the different stakeholder groups are inevitable, we strive to carry out our operations in a way that creates mutually beneficial value for all stakeholders.
• Drive consumer-centric behaviours Response to consumer needs and feedback Implement and roll out Project Kolabo (big data analytics)
• Revise human capital strategy Workforce well-being Implement joint business plans for major customers and principals
• Improve supply chain efficiencies through co-operation with the trade
Positive feedback from trade/trade fill rates Identify new merger and acquisition opportunities
• Return to traditional profitability levels Improved financial results
Please refer to the CEO’s Report and the CFO’s Report for more information about our strategic performance.
Clover Industries Limited Integrated Report for the year ended 30 June 2018 41
IN T
HE
SP
OT
LIGH
T
FOR
20
18IN
TR
OD
UC
ING
CLO
VE
R’S S
TO
RY
AN
ALY
SIN
G C
LOV
ER
’S V
ALU
E C
RE
AT
ION
LEA
DE
RS
HIP
R
EV
IEW
SP
ER
FOR
MA
NC
E O
UT
CO
ME
S O
F TH
E S
IX C
AP
ITA
LS
RE
MU
NE
RA
TIO
N
RE
PO
RT
AN
NU
AL FIN
AN
CIA
L R
ES
ULT
SS
HA
RE
HO
LDE
R
INFO
RM
AT
ION

FERMENTED PRODUCTS
AND DESSERTS CONTRIBUTED
15,5%TO CLOVER’S SALE OF PRODUCTS FOR THE
YEAR
THE MOM FROM FERMENTED
PRODUCTS AND DESSERTS WAS
35,7%FOR THE YEAR
FERMENTED PRODUCTS AND
DESSERTS REVENUE INCREASED
25,7%FROM THE PRIOR YEAR
Clover Industries Limited Integrated Report for the year ended 30 June 201842
LEADERSHIP REVIEWS
Clover Industries Limited Integrated Report for the year ended 30 June 2018 43
IN T
HE
SP
OT
LIGH
T
FOR
20
18IN
TR
OD
UC
ING
CLO
VE
R’S S
TO
RY
AN
ALY
SIN
G C
LOV
ER
’S V
ALU
E C
RE
AT
ION
LEA
DE
RS
HIP
R
EV
IEW
SP
ER
FOR
MA
NC
E O
UT
CO
ME
S O
F TH
E S
IX C
AP
ITA
LS
RE
MU
NE
RA
TIO
N R
EP
OR
TA
NN
UA
L FINA
NC
IAL
RE
SU
LTS
SH
AR
EH
OLD
ER
IN
FOR
MA
TIO
N
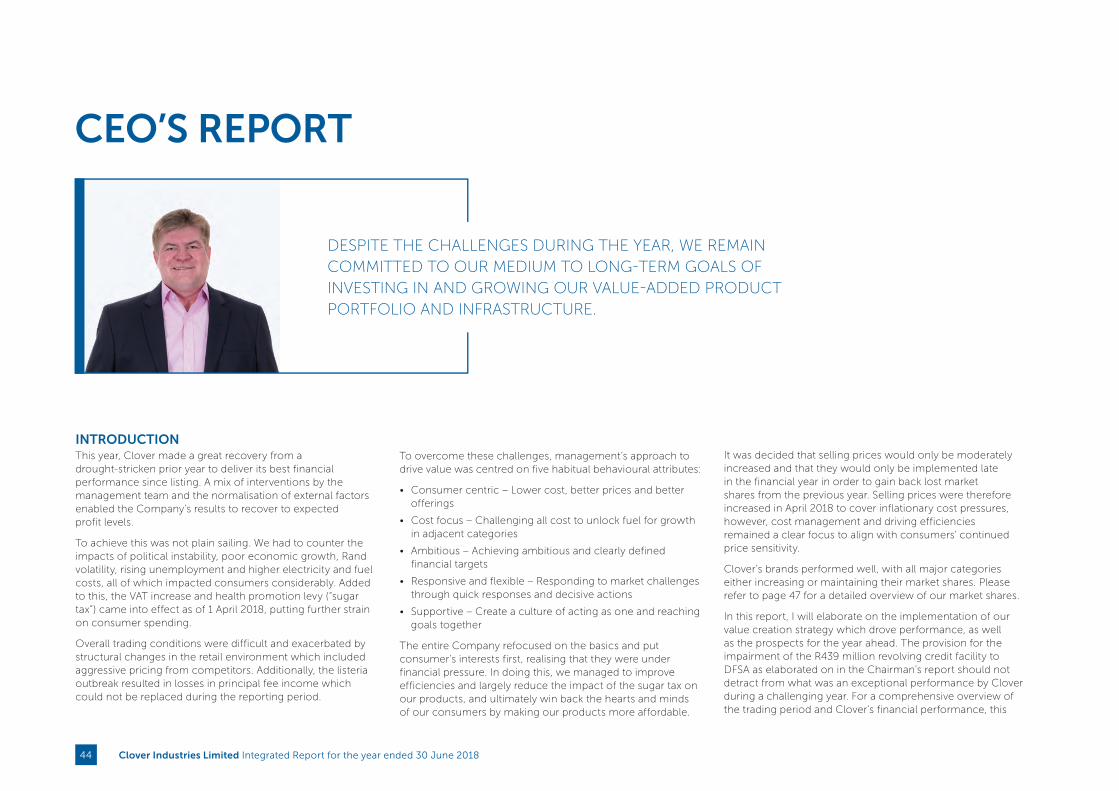
CEO’S REPORT
INTRODUCTIONThis year, Clover made a great recovery from a drought-stricken prior year to deliver its best financial performance since listing. A mix of interventions by the management team and the normalisation of external factors enabled the Company’s results to recover to expected profit levels.
To achieve this was not plain sailing. We had to counter the impacts of political instability, poor economic growth, Rand volatility, rising unemployment and higher electricity and fuel costs, all of which impacted consumers considerably. Added to this, the VAT increase and health promotion levy (“sugar tax”) came into effect as of 1 April 2018, putting further strain on consumer spending.
Overall trading conditions were difficult and exacerbated by structural changes in the retail environment which included aggressive pricing from competitors. Additionally, the listeria outbreak resulted in losses in principal fee income which could not be replaced during the reporting period.
To overcome these challenges, management’s approach to drive value was centred on five habitual behavioural attributes:
• Consumer centric – Lower cost, better prices and better offerings
• Cost focus – Challenging all cost to unlock fuel for growth in adjacent categories
• Ambitious – Achieving ambitious and clearly defined financial targets
• Responsive and flexible – Responding to market challenges through quick responses and decisive actions
• Supportive – Create a culture of acting as one and reaching goals together
The entire Company refocused on the basics and put consumer’s interests first, realising that they were under financial pressure. In doing this, we managed to improve efficiencies and largely reduce the impact of the sugar tax on our products, and ultimately win back the hearts and minds of our consumers by making our products more affordable.
It was decided that selling prices would only be moderately increased and that they would only be implemented late in the financial year in order to gain back lost market shares from the previous year. Selling prices were therefore increased in April 2018 to cover inflationary cost pressures, however, cost management and driving efficiencies remained a clear focus to align with consumers’ continued price sensitivity.
Clover’s brands performed well, with all major categories either increasing or maintaining their market shares. Please refer to page 47 for a detailed overview of our market shares.
In this report, I will elaborate on the implementation of our value creation strategy which drove performance, as well as the prospects for the year ahead. The provision for the impairment of the R439 million revolving credit facility to DFSA as elaborated on in the Chairman’s report should not detract from what was an exceptional performance by Clover during a challenging year. For a comprehensive overview of the trading period and Clover’s financial performance, this
DESPITE THE CHALLENGES DURING THE YEAR, WE REMAIN COMMITTED TO OUR MEDIUM TO LONG-TERM GOALS OF INVESTING IN AND GROWING OUR VALUE-ADDED PRODUCT PORTFOLIO AND INFRASTRUCTURE.
Clover Industries Limited Integrated Report for the year ended 30 June 201844

report should be read in conjunction with the Chairman’s and Chief Financial Officer’s reports on page 10 and 49 respectively.
STRATEGY IN ACTIONConsumer-centric value-added focus
Since listing in 2010, we have been working towards diversifying Clover’s business away from low-margin commoditised bulk dairy products, focusing on higher margin, value-added branded food and beverages to improve operating margins across the portfolio.
This translated into a medium- to long-term strategy of:
• promoting and developing value-added products in dairy and other related food categories;
• expanding our non-alcoholic beverages portfolio; and
• developing and enhancing our key competencies in brand development, production, distribution and merchandising.
Aligned to this strategy, this year saw Clover successfully exit and transfer the cyclical low margin drinking milk business to Dairy Farmers of South Africa (“DFSA”) while retaining DFSA as a principal - providing it with distribution, production and merchandising services amongst others.
We have made good progress in leveraging our brand to introduce value-added products in recent years and this year was no exception, with the main focus being on consumer needs and what they perceive as adding value.
Products that were launched recently include:
• Numel
• Sip Up
• Snack Pack
• Cream O’Naise
• Whistling Chef
• Bliss Yoghurt Double Cream
• Krush flavour extensions
• Olive oil and soya products
Of course, this meant that we had to increase our marketing spend to support the successful launch of these new products. The increased marketing spend also related to the re-launch of the Clover mother brand which was also met with great excitement and response from the market.
Award winning
This year, we received a number of awards in recognition of our brand, reputation, financial reporting and social impact.
Our brand dominated in the milk category in the 2017 Sunday Times Top Brand survey with Clover featuring amongst the top 10 brands in South Africa for the Overall Consumer Grand Prix category.
Clover won the South Africa RepTrak© Pulse reputation survey as the most reputable company in South Africa for the third consecutive year.
Clover was once again voted as the leader in reporting and communications for companies with a market capitalisation below R5 billion by the Investment Analysts Society of South Africa members.
The Clover Mama Afrika project, a practical and authentic means of channelling self-empowerment, skills development and dignity into marginalised communities was again recognised by winning PMR’s prestigious Diamond Arrow Award having been rated the highest in the Food Manufacturer/Processors category.
In the Icon Brands 2017 Awards Clover was a winner in the following categories:
• Long Life milk
• Feta cheese
• Processed cheese
• Condensed milk
• Yoghurt
• Cream
Clover Krush received Icon Brand status and was the winner of the fruit juice, smoothies and vegetable category.
The strategy to grow value- added products that places consumers’ perceptions of what value means front of mind continues to be implemented in a responsible and sustainable way while efficiency drives will remain a key focus into the future. We are optimistic that the actions taken will ensure that the business is managed successfully through potential downward cycles and will support Clover’s continued drive for improvement in profitability levels over the short to medium-term.
45Clover Industries Limited Integrated Report for the year ended 30 June 2018
IN T
HE
SP
OT
LIGH
T
FOR
20
18IN
TR
OD
UC
ING
CLO
VE
R’S S
TO
RY
AN
ALY
SIN
G C
LOV
ER
’S V
ALU
E C
RE
AT
ION
LEA
DE
RS
HIP
R
EV
IEW
SP
ER
FOR
MA
NC
E O
UT
CO
ME
S O
F TH
E S
IX C
AP
ITA
LS
RE
MU
NE
RA
TIO
N
RE
PO
RT
AN
NU
AL FIN
AN
CIA
L R
ES
ULT
SS
HA
RE
HO
LDE
R
INFO
RM
AT
ION
Value extraction and selective investmentReduction of costs, improvement of efficiencies, strict control of capital expenditure and expansion of our distribution reach were key focus areas for the year to ensure sustainable value creation. A number of projects were under implementation during the year to achieve these objectives and we have already begun to see the benefits.
One of the key projects under way was Project Sencillo which has four pillars namely, the optimisation of manufacturing platforms, milk flow and yield optimisation, consolidation of distribution facilities and optimisation of our distribution operations.
In essence, this project involves the moving of equipment around to factories within the Group to optimise each factory according to demand and length of production runs, better matching the raw materials and by-products.
Significant progress was made during the year with the majority of the underlying initiatives related to the optimisation of our manufacturing platforms and consolidation of our distribution facilities having been fully implemented by year-end. These include: the reduction of our Tetratop and Galdi platforms; consolidation of our fresh milk and UHT production in Eastern and Western Cape; consolidation of our concentrated products factories; integration of our Clayville and City Deep distribution centres, opening of a new facility at Cape Town International Airport in the Western Cape; and changes to our Northern Cape infrastructure. Consolidation of our fresh juice and fresh milk production for KZN and Inland remain to be fully implemented as do the expansion of our Clayville factory.
Project Meglio, which involves product reformulations to reduce the impact of sugar taxes and improve price competitiveness, forms part of the milk flow and yield optimisation pillar. This project was only partially implemented with further benefits to be derived in the 2019 financial year.
Optimisation of our distribution operations will ensure load optimality on pallets and in crates thereby reducing transportation costs and active management of the SKU portfolio through a “fix, grow, exit” strategy. This pillar is also still in implementation phase with additional benefits to be derived going forward.
Efficiencies were realised through the implementation of several innovations across the supply chain such as an increase in the frequency of deliveries; using different
methods to deliver products; rationalisation of product lines, lengthening production runs and using alternative ways of processing products.
Capital expenditure was normalised this year to R214,7 million and focused on consolidation, optimisation and necessary expansion.
Our successful project called Masakhane (literally meaning “Let’s build together”) gained further momentum as its roll-out was accelerated during the year. Masakhane aims to grow the “emerging market” customer base by increasing Clover’s reach and footprint into informal and formal Food Service Industry (FSI) trading systems such as spaza shops, tuck shops, corner cafés, general traders, hotels, schools, B&B, restaurants and bottle stores.
We also continued with our pragmatic approach to growth across our borders through the introduction of our full product portfolio to select African countries by duplicating our successful distribution model with the help of local distributors. Our growth in Mozambique and Tanzania is testament to the success of this model.
OUTLOOKWhilst it is pleasing to see profitability levels returning to expected levels, the challenging macro-economic and trading conditions experienced this year are expected to continue over the next year.
Specifically, inflationary cost pressures in the form of wages, fuel and electricity will continue to take their toll with consumers opting for cheaper alternatives while trade competition for growth and market share remains a key concern with there being a disproportionate number of promotions leading to erosion of margins.
Additionally, the high milk flow might affect DFSA volumes through our network which adds to the impact of the depressed processed meat market on principal volumes following the listeria outbreak.
Against this backdrop, Clover has secured strategic trading partnerships and is confident that it can provide cost and value effective solutions to alleviate the pressure faced by consumers. We are also working on technological advancements in the IT area of the business to provide further support.
The strategy to grow value-added products that places consumers’ perceptions of what value means front of mind
CEO’S REPORT continued
continues to be implemented in a responsible and sustainable way while efficiency drives will remain a key focus into the future.
We continue to explore synergistic opportunities to leverage our infrastructure. Investigations to further consolidate production plants are under way to ensure that the business is optimally structured.
A longer-term ambition is to pragmatically centralise all our major production facilities into a strategically located and purpose-built industrial park strategically located near supply sources, other production facilities and major transportation routes.
We are optimistic that the actions taken will ensure that the business is managed successfully through potential downward cycles and will support Clover’s continued drive for improvement in profitability levels over the short to medium-term.
Unfortunately, we have been provided with a notice of termination of the distribution and warehousing services relating to the Remgro margarine and spreads business with effect from 3 March 2019. We are however in the process of developing plans to mitigate the loss of this service income. On a positive side, this will provide us with an exciting opportunity to potentially enter the huge margarine market.
APPRECIATIONThank you to DFSA and their milk producers for their support and high quality milk during the transition period, a period which included industrial action.
Thank you to the board, led by Mr Werner Büchner, for its continued support and guidance. The executive team and all Clover employees were integral to the achievement of our objectives this year as it truly required a collective effort to achieve the results we did. Thank you to the executive team for energising the business and to all employees for coming together in agreement on a Way Better team approach.
Johann VorsterChief Executive
26 September 2018
Clover Industries Limited Integrated Report for the year ended 30 June 201846
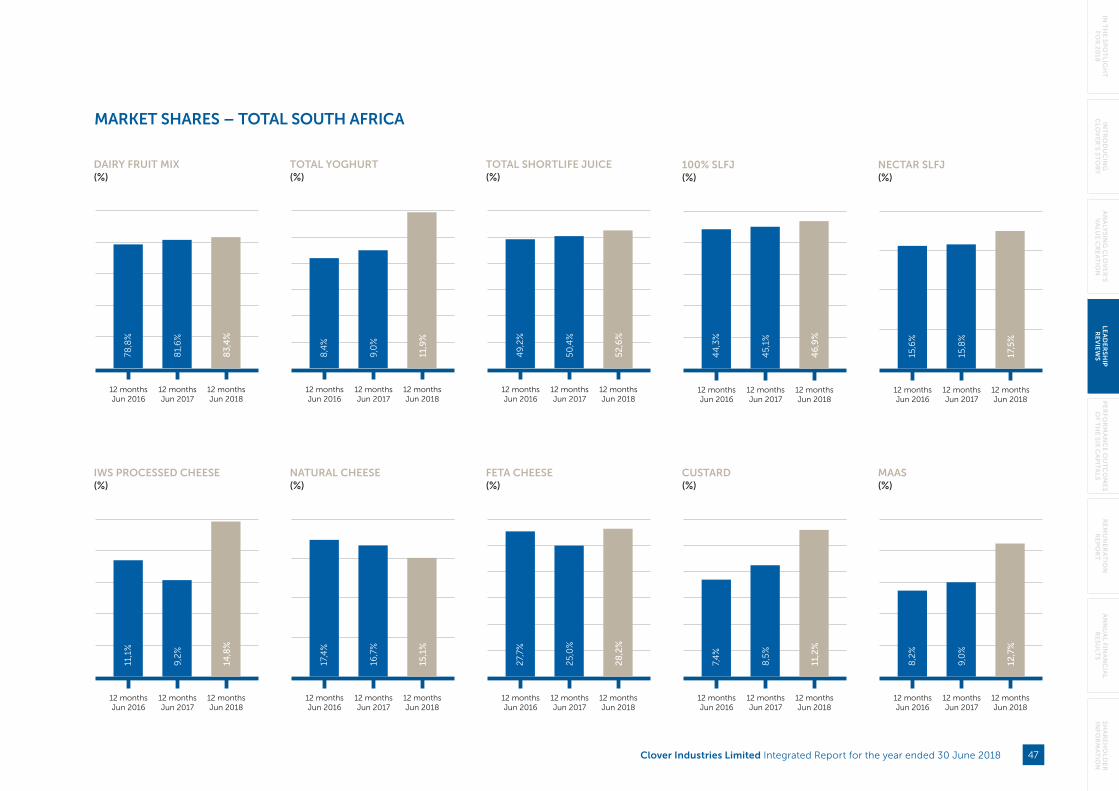
MARKET SHARES – TOTAL SOUTH AFRICA
NATURAL CHEESE(%)
12 monthsJun 2016
12 monthsJun 2017
12 monthsJun 2018
17,4
%
16,7
%
15,1
%
FETA CHEESE(%)
12 monthsJun 2016
12 monthsJun 2017
12 monthsJun 2018
27,
7%
25,
0%
28
,2%
CUSTARD(%)
12 monthsJun 2016
12 monthsJun 2017
12 monthsJun 2018
7,4
%
8,5
%
11,2
%
DAIRY FRUIT MIX(%)
12 monthsJun 2016
12 monthsJun 2017
12 monthsJun 2018
78,8
%
81,
6%
83
,4%
TOTAL YOGHURT(%)
12 monthsJun 2016
12 monthsJun 2017
12 monthsJun 2018
8,4
%
9,0
%
11,9
%
TOTAL SHORTLIFE JUICE(%)
12 monthsJun 2016
12 monthsJun 2017
12 monthsJun 2018
49
,2%
50
,4%
52
,6%
100% SLFJ(%)
12 monthsJun 2016
12 monthsJun 2017
12 monthsJun 2018
44
,3%
45,
1%
46
,9%
NECTAR SLFJ(%)
12 monthsJun 2016
12 monthsJun 2017
12 monthsJun 2018
15,6
%
15,8
%
17,5
%
IWS PROCESSED CHEESE(%)
12 monthsJun 2016
12 monthsJun 2017
12 monthsJun 2018
11,1
%
9,2
%
14,8
%
MAAS(%)
12 monthsJun 2016
12 monthsJun 2017
12 monthsJun 2018
8,2
%
9,0
%
12,7
%
Clover Industries Limited Integrated Report for the year ended 30 June 2018 47
IN T
HE
SP
OT
LIGH
T
FOR
20
18IN
TR
OD
UC
ING
CLO
VE
R’S S
TO
RY
AN
ALY
SIN
G C
LOV
ER
’S V
ALU
E C
RE
AT
ION
LEA
DE
RS
HIP
R
EV
IEW
SP
ER
FOR
MA
NC
E O
UT
CO
ME
S O
F TH
E S
IX C
AP
ITA
LS
RE
MU
NE
RA
TIO
N
RE
PO
RT
AN
NU
AL FIN
AN
CIA
L R
ES
ULT
SS
HA
RE
HO
LDE
R
INFO
RM
AT
ION

FLAVOURED MILK(%)
12 monthsJun 2016
12 monthsJun 2017
12 monthsJun 2018
30
,0%
32
,6%
32
,1%
SOY MILK(%)
12 monthsJun 2016
12 monthsJun 2017
12 monthsJun 2018
61,
2%
67,
7%
70,2
%
OLIVE PRIDE(%)
12 monthsJun 2016
12 monthsJun 2017
12 monthsJun 2018
36
,5%
32
,3%
26
,9%
CEO’S REPORT continued
WATER(%)
12 monthsJun 2016
12 monthsJun 2017
12 monthsJun 2018
8,8
%
6,0
%
5,2
%
BUTTER(%)
12 monthsJun 2016
12 monthsJun 2017
12 monthsJun 2018
32
,0%
29
,0%
26
,1%
CONDENSED MILK(%)
12 monthsJun 2016
12 monthsJun 2017
12 monthsJun 2018
15,4
%
14,1
%
14,6
%
CREAM(%)
12 monthsJun 2016
12 monthsJun 2017
12 monthsJun 2018
28
,3%
23
,1%
22
,8%
ICE TEA(%)
12 monthsJun 2016
12 monthsJun 2017
12 monthsJun 2018
17,2
%
14,2
%
12,8
%
LONGLIFE FRUIT JUICE(%)
12 monthsJun 2016
12 monthsJun 2017
12 monthsJun 2018
5,4
%
5,7%
4,2
%
Clover Industries Limited Integrated Report for the year ended 30 June 201848

CHIEF FINANCIAL OFFICER’S REPORT
MANAGEMENT WILL CONTINUE TO DRIVE VOLUMES AND MARKET SHARES AND EXPAND OUR VALUE-ADDED PRODUCT PORTFOLIO WHICH IS NOW A CORE BUSINESS FOCUS. WE WILL ALSO EXPLORE FURTHER COST-EFFICIENCIES AND SYNERGISTIC OPPORTUNITIES TO LEVERAGE CLOVER’S ASSET BASE AND INFRASTRUCTURE.
Clover’s board and management believe the financial statements published in this integrated report present fairly, in all material respects, the financial position, financial performance and cash flows of Clover Industries Limited in accordance with International Financial Reporting Standards (IFRS) and without any material misstatements.
Significant accounting policies adopted in preparation of the financial statements are appropriately described in the financial statements section of this integrated report. The board and senior management are confident that Clover’s internal control system is adequate for preparing accurate financial statements in accordance with IFRS and the requirements of the Companies Act.
OVERVIEW AND ENVIRONMENTRising fuel and transport prices, electricity, medical insurance and other increases continued to place pressure on South African consumers, which was further negatively impacted by a 1% increase in value added tax in the latter part of the financial year under review.
The erosion of available discretionary spend reflected in buying patterns as consumers increasingly elected to buy on price promotions. This trend tested the inelasticity of
historically premium-branded products and resulted in fierce competition amongst FMCG companies in an attempt to maintain and grow volumes and market share.
From this perspective, Clover’s strategy to re-invest savings obtained through efficiencies to maintain optimal price points, served as a critical underpin to its performance during the year.
GROUP OVERVIEWAs detailed elsewhere in this report, the board took the conservative and prudent decision to impair the full R439 million revolving credit facility Clover had extended to DFSA as at year-end.
In line with the objective to improve the predictive value of the financial statements, the impairment of the DFSA RCF was reversed in the pro forma results to better reflect the operational performance of the Group. Refer to Annexure I and II for further infomation.
Despite the impact of the impairment, Clover’s hard-fought efforts made a number of significant improvements across key performance areas.
The prior financial year was impacted by severe drought, currency volatility and above-inflation input costs. Price increases in a subdued market, amidst aggressive competitor pricing, resulted in Clover reporting volume and market share losses.
During that year, Clover initiated its strategy to sustainably align the business to a new “normal” in the context of protracted low-growth cycle in the domestic economy.
These rigorous initiatives identified several efficiency improvement opportunities, allowing management to offset inevitable production increases against savings to the benefit of consumers.
Clover’s continued delivery against its diversification strategy away from bulk, commoditised food stuffs and focus on growing its presence in branded, value-added product categories continued to gain traction during the review period and – along with sustainable efficiency improvements remain a key priority for management in the 2019 financial year and into the future.
Clover Industries Limited Integrated Report for the year ended 30 June 2018 49
IN T
HE
SP
OT
LIGH
T
FOR
20
18IN
TR
OD
UC
ING
CLO
VE
R’S S
TO
RY
AN
ALY
SIN
G C
LOV
ER
’S V
ALU
E C
RE
AT
ION
LEA
DE
RS
HIP
R
EV
IEW
SP
ER
FOR
MA
NC
E O
UT
CO
ME
S O
F TH
E S
IX C
AP
ITA
LS
RE
MU
NE
RA
TIO
N R
EP
OR
TA
NN
UA
L FINA
NC
IAL
RE
SU
LTS
SH
AR
EH
OLD
ER
IN
FOR
MA
TIO
N

FINANCIAL RESULTSAs indicated in the 2017 financial statements, Clover transferred the non-value added dairy business to its wholly-owned subsidiary, DFSA with effect from 1 April 2017. Subsequently, shares were issued to the milk producers with the result that Clover lost control of DFSA. Clover has a 26% voting right and no economic interest in DFSA.
The result of the transaction is that Clover maintained ownership and control of the relevant manufacturing and distribution (warehousing and logistics) activities and charges a fee for these services. The sales of the relevant products are for the benefit of DFSA, and no longer form part of the revenue or cost of sales of the CIL group.
The revenue and cost of sales of the DFSA business were significant to Clover in the 2017 the financial year, as is the revenue earned from the rendering of the manufacturing and distribution services in the 2018 financial year. Given the significance of the revenue, costs of sales and the income from manufacturing and distribution services in the respective years, it is important to reflect the impact of the transaction to understand the key revenue streams retained (and related cost of sales); and the change in the services revenues now earned as a result of the transaction. The changes are reflected in Annexure I and II at the back of this report.
Headline lossClover incurred a headline loss of R44,2 million compared to a headline earnings of R121,6 million in the comparative period as reflected in note 7.4 in the financial statement section. The headline loss is primarily as a result of the impairment of the DFSA revolving credit facility as alluded to in the Group Overview.
Loss attributable to shareholders of Clover amounting to R38,0 million represents a decrease of R196,3 million from the profit attributable to shareholders of Clover in 2017 of R158,3 million. This is R30,5 million less than the decrease in headline loss of R165,8 million. This difference is mainly due to profits of a capital nature in the prior year (which is excluded from headline earnings). Capital profits to the same extent were not realised in the current year.
Headline loss per share for the year amounted to 23,1 cents per share compared to a headline earnings per share of 63,9 cents per share in the comparative period.
Normalised headline earnings Normalised headline earnings (arrived at by adding back the impairment of the RCF) increased by 224,7% or R273,2 million to R394,9 million when compared to the 2017 reported results. The increase in normalised headline earnings is primarily because of headline operating profit, which increased by 122,3% or R332,5 million; net finance costs, which decreased by 29,2% or R38,9 million; headline tax expense, which increased by 296,2% or R103,9 million; share of profit from a joint venture, which increased by 14,2% or R2,6 million; and non-controlling interests, which decreased from a R0,5 million profit to a R2,6 million expense. Normalised headline earnings per share increased by 224,0% (143,0 cents). The normalised effective tax rate base increased by 5,4% to 25,9% that is explained in more detail under “Profit for the year” later in this report;
Normalised profit attributable to shareholders of Clover increased by R242,8 million which is R30,4 million less than the increase in normalised headline earnings of R273,3 million for reasons similar to those as discussed under Headline loss.
Revenue, cost of sales and gross profitWith the unbundling of DFSA from the operations of Clover (effective from 1 July 2017) as discussed in detail in the 2017 integrated report, the comparative financial information for revenue (comprising mainly of sale of product and rendering of services), cost of sales and gross profit are not comparable with those line items reported in the June 2017 reporting period. It will therefore be of more value to compare pro forma information taking the effect of the operational restructuring of DFSA into account when commenting on the current year’s performance compared to the previous year. The pro forma adjustments on 30 June 2017 had no effect on the profit for that year as illustrated below.
The table below is an extract of the audited and pro forma comparable information that will be used for the further review (on a like-for-like basis) of the current year financial results
30 June 2018
Audited
30 June 2018
Pro forma normalised(1)
30 June2017
Pro forma Adjusted(2)
30 June 2017
AuditedR’000 R’000 R’000 R’000
Sales of products 6 435 663 6 435 663 5 852 036 9 401 842 Rendering of services 1 873 581 1 873 581 1 834 421 641 499 Sale of raw milk 335 335 11 907 11 907 Rental income 2 898 2 898 3 351 3 351
Revenue 8 312 477 8 312 477 7 701 715 10 058 599 Cost of sales (5 357 424) (5 357 424) (5 012 009) (7 333 041)
Gross profit 2 955 053 2 955 053 2 689 706 2 725 558 Other operating income 82 913 82 913 60 040 60 040 Selling and distribution costs (2 117 936) (2 117 936) (2 089 364) (2 089 364) Administrative expenses (273 310) (273 310) (284 721) (284 721) Restructuring expenses (4 123) (4 123) (48 098) (48 098) Other operating expenses (31 548) (31 548) (48 936) (48 936)
Operating profit 611,049 611,049 278 627 314 479 Impairment of RCF to DFSA (439 042) – – –Finance income 47 618 47 618 48 499 12 647 Finance costs (141 880) (141 880) (145 765) (145 765) Share of profit in a joint venture 21 104 21 104 18 486 18 486
Profit before tax 98 849 537 891 199 847 199 847 Taxation (139 509) (139 509) (41 105) (41 105)
(Loss)/Profit for the year (40 660) 398 382 158 742 158 742(1) As per the pro forma consolidated statement of comprehensive income for the year ended 30 June 2018 as disclosed in Annexure II to the consolidated
financial statements for the year ended 30 June 2018.(2) As per the pro forma consolidated statement of comprehensive income for the year ended 30 June 1017 as disclosed in Annexure I to the consolidated
financial statements for the year ended 30 June 2018. Please refer to Annexure I for more details regarding the basis for the pro forma consolidated statement of comprehensive income.
CHIEF FINANCIAL OFFICER’S REPORT continued
Clover Industries Limited Integrated Report for the year ended 30 June 201850

Revenue
Revenue increased by 7.9% or R610,8 million to R8 312,5 million.
Sale of products showed an increase of 10.0% to R6 435,7 million
Percentage
change
30 June2018
AuditedR’000
After pro formaadjustments
30 June 2017R’000
30 June2017
AuditedR’000
Revenue from sale of products 10,0 6 435 663 5 852 036 9 401 842
– Non-alcoholic beverages 1,7 2 409 724 2 369 071 2 369 071
– Concentrated products 13,7 1 492 849 1 312 575 1 312 575
– Value-added dairy fluids 12,5 1 230 831 1 093 794 4 643 600
– Fermented products and desserts 25,7 998 847 794 403 794 403
– Ingredients (18,5) 176 484 216 424 216 424
– Olive oil and soya 93,0 126 928 65 769 65 769
The increase of 10,0% in revenue from sale of products, compared on a like-for-like basis, was achieved through increased volumes in certain categories – most notably in fermented products and deserts as well as value-added dairy fluids (up 12,5%) where optimal pricing were rewarded with higher volumes. In the dairy concentrated product category (up 13,7%), the shortage of butterfat during most part of the year led to above-inflationary price increases on butter, but lower volumes, whilst volumes in cheese increased on the back of no price increases.
Revenue from non-alcoholic beverages were up by a moderate 1,7%, largely as a result of flat overall volumes. Revenue was lifted by moderate price increases towards the end of the financial year and the launch of Rooibos ice tea and Cranberry Krush during April 2018.
The addition and launch of new products including olive oil and soya products to the portfolio further supplemented revenue growth.
Services rendered to principals contributed R1 873,6 million to revenue, which increased moderately by 2,1% or R39,3 million on a comparable like-for-like basis. The marginal growth in rendering of services income was primarily because of subdued market conditions impacting our principals, which was further compounded by the outbreak of listerioses, and the subsequent withdrawal of products by one of our principals. Although the creation of DFSA saw services rendered revenue increase substantially, economic strain on consumers placed pressure on non-value-added drinking milk volumes and pricing, which resulted in service fee income to Clover also coming under pressure. Clover will continue to maximise the return on its distribution and merchandising infrastructure with new products listings and signing of new principals.
Cost of sales
Cost of sales increased by 6,9% or R345,4 million compared on a like-for-like basis. This compares favourably to the 7.9% increase in total revenue. Savings were achieved through a continued and intense focus on efficiencies, recipe reformulations and robust drives to reduce input costs such as ingredients and packaging material. Pressure on primary distribution costs, driven by fuel inflation and transport of product between factories and distribution centres eroded some of the gains.
The cost of raw materials and ingredients increased by 7,6% or R252,9 million, while volumes increased by 8,2%. The cost of basic raw materials (which include milk and or constituents thereof) were 8,3% higher than the previous year, mainly due to the shortage of butterfat which drove up costs. Other ingredients costs increased by 2,3% mainly due to retendering.
Packaging costs increased by 4,2%, primarily because of favourable exchange rates for a large part of the year and retendering.
Manufacturing costs rose by 1,87% year-on-year. Considering the volume increase, this marginal increase was primarily as a result of aggressive cost saving drives and optimisation of production schedules.
Primary distribution costs increased 15,8% or R69,1 million on the back of higher volumes. The majority of this cost is outsourced and driven largely by fuel price and transporters’ wage increases.
Gross profit
Cost of sales increased by 6,9% which compares favourably to the like-for-like increase of 7,9% in revenue. As a result, the like for like gross profit margin increased from 34.9% to 35,5%.
Other operating income
Other operating income of R82,9 million mainly comprise of:
• R25,3 million royalty income earned from DFSA;
• R25,3 million from supplier settlement claims;
• R1,2 million from the sale of PPE;
• R4,4 million gain from unbundling of DFSA;
• R3,6 million gain from fair value adjustments; and
• Sundry income of R12,1 million, largely from the canteen.
Selling and distribution costs
Selling and distribution costs increased marginally by 1,4% or R28,5 million. As explained in the prior year, Clover’s staff structure was optimised and new positions were limited, except for the Masakhane roll-out for which the Group received grant funding income from the DTI of R9.8 million. The benefits of these initiatives led to below inflationary cost increases. Clover further managed to stabilise and contain costs through an efficiency drive, and secondary distribution costs decreased with 3,6% or R44,8 million.
Clover Industries Limited Integrated Report for the year ended 30 June 2018 51
IN T
HE
SP
OT
LIGH
T
FOR
20
18IN
TR
OD
UC
ING
CLO
VE
R’S S
TO
RY
AN
ALY
SIN
G C
LOV
ER
’S V
ALU
E C
RE
AT
ION
LEA
DE
RS
HIP
R
EV
IEW
SP
ER
FOR
MA
NC
E O
UT
CO
ME
S O
F TH
E S
IX C
AP
ITA
LS
RE
MU
NE
RA
TIO
N
RE
PO
RT
AN
NU
AL FIN
AN
CIA
L R
ES
ULT
SS
HA
RE
HO
LDE
R
INFO
RM
AT
ION

In total, Clover spent 6,3% or R15,4 million more on advertising, marketing, research and development costs compared to the prior year. The higher spend on advertising was strategic to achieve volume growth in the current year as well as to promote new product launches and innovations on existing product lines.
Administrative expenses
Administrative expenses reduced by 4,0% or R11,4 million.
This saving was primarily achieved by reducing head office-related expenses for which overall spend reduced by 12,9% or R30,7 million through:
• subsidising training spend through higher Skills Development Levy (SDL) grants received in this period;
• a reduced level of spend on legal and consulting fees; and
• not filling vacant positions, particularly at executive level.
Restructuring expenses
Approximately R4,1 million was spent on retrenchment costs, which are classified as restructuring expenses. Restructuring expenses is markedly down compared to the previous year and relates primarily to the cost of relocating assets as part of project Sencillo (asset optimisation drive).
Operating profit
Operating profit increased by 94,3% to R611,0 million. Headline operating profit increased by 102,7% to R605,0 million when excluding capital profits. The operating margin increased to 7,4%, a significant improvement over the previous year.
Loss for the year
Loss for the year amounted to R40,7 million compared to a profit for the year amounting to R158,7 million in the comparative period. This result was the outcome of a R296,6 million increase in operating profit, a R439 million impairment of the DFSA revolving credit facility, a R38,9 million decrease in net finance charges, a R98,4 million increase in the income tax expense, and a R2,6 million increase in the share of profits from joint ventures. Normalised profit for the year ended 151,0% or R239,6 million higher at R398,4 million.
Clover’s actual effective tax rate is 141,1% which is primarily as a result of the impairment, however, the normalised effective tax rate was calculated at 25,9%. This is below the 28% SA corporate tax rate. The normalised effective tax rate was lower primarily as a result of:
• Prior year adjustments – (1,7%)
• Botswana lower tax – (0,6%)
• Foreign withholding tax – 0,7%
• Joint Venture Equity accounted – (1,1%)
• Various other adjustments – 0,6%
Return on equity adjusted for exceptional items
The Group experienced a constrained economic and operating environment with variable costs increasing ahead of inflation. However, given the Group’s continued focus on cost containment and the winning back of market shares, the Group’s return on equity adjusted for exceptional items (most notably the RCF impairment) increased from 5,4% to 13,9%.
DIVIDENDSThe Company declared and paid an interim dividend of 26,56 cents per share during April 2018. A final dividend of 48,68 cents per share was declared by the board, which will bring the total dividend for the current financial year to 75,24 cents, representing a divided cover of 2,75 times on a normalised basis.
FINANCIAL POSITIONNon-current assets
Clover has invested methodically in acquisitions as well as capacity building and rightsizing of factories and distribution assets to support our high standards on product quality and growth ambitions. The level of investment required to support Clover’s outstanding reputation for quality is balanced by our ambition to grow through acquisitions and internal development of brands and products. Our status as South Africa’s most reputable company was confirmed for the third year in a row by Reptrak, and our brand reputation is underpinned by Clover’s chilled distribution network, which continues to be regarded as one of South Africa’s finest. This invaluable asset also required a significant investment to maintain its hard-earned reputation.
Clover invested R214,7 million on capitalised maintenance, factories, IT upgrades and other tangible assets.
The net decrease in property, plant and equipment and intangible assets amounted to R33,6 million, consisting of R218,1 million additions, less R228 million depreciation and the balance being disposals, transfer to held-for-sale and scrapping of assets.
Major capital projects during the year were:
R’m
Clayville/Queensburg/Milkyway Milk and Juice consolidation 16,6
RBC yogurt capacity upgrade 21,4
Numel capacity expansion 9,4
PE UHT optimisation project 9,1
Milnerton capacity expansion 8,2
Cape Town CDC upgrade 7,8
PE Pallet optimisation project 7,2
Lichtenburg AFE Filler 5,3
84,9
Revolving credit facility granted to DFSA
As part of the operational restructure, the Group made available a revolving credit facility (“RCF”) to DFSA, enabling DFSA to fund its operations and the stock it acquired from the Group when it was established. The facility has been made available to DFSA for an initial period of 20 years and will increase annually with CPI.
The Group will only be able to call this facility if certain default events occur. The maximum amount of the RCF is capped at R550 million for the current year, of which DFSA utilised R439 million. As part of the Group’s mitigation of credit risk, a general notarial bond has been registered over the stock of DFSA.
DFSA made a loss of R128,8 million for the period ended June 2018 and has negative equity of R133,3 million.
Historically the dairy business transferred to DFSA is exposed to seasonal cyclicality and a longer investment horizon is required to establish a trendline.
CHIEF FINANCIAL OFFICER’S REPORT continued
Clover Industries Limited Integrated Report for the year ended 30 June 201852

The below sets out the historical performance of the non-value added dairy business:
• 2012/2013 – Operating loss of R62,7 million;
• 2013/2014 – Operating loss of R126,4 million;
• 2014/2015 – Operating profit R60,5 million;
• 2015/2016 – Operating profit R77,0 million; and
• 2016/2017 – Operating profit R23,8 million.
Based on the above, it is not unexpected that DFSA may make losses, however, as market forces align (i.e. supply and demand), it is expected that profits and losses will balance out.
As the revolving credit facility was granted over a period of 20 years, repayment is not expected over the short-term.
On 11 September 2018, the board received unexpected notification that DFSA’s CEO and subsequently, its chairman, resigned.
Based on this information, Clover’s board deemed it prudent to adopt a conservative approach and provide for the full impairment of the R439 million revolving credit facility it extended to DFSA as at year-end, although the accumulated loss at 30 June 2018 is only R133.2 million.
The impairment of the revolving credit facility will be assessed on a continuous basis, taking into consideration the general notarial bond that Clover holds over the DFSA inventory and debtors’ balances that is being managed by Clover as part of Clover’s services rendered agreement, as well as the DFSA board approved plans to manage the business through the cycle.
More detail is available in note 13 to the annual financial statements.
CURRENT ASSETS
InventoryInventory levels decreased by 9,9% or R95,6 million
The establishment of DFSA led to a reduction of R244 million in UHT milk inventory as UHT is no longer carried by Clover. Inventory carried on other products increased because of normal business growth and new products added to Clover’s portfolio.
Trade and other receivables Trade and other receivables increased by 10,3% or R137,7 million.
The increase is as a result of manufacturing, distribution and sales and merchandising services rendered to DFSA as well as volume growth achieved in the current period.
Trade receivable days outstanding and bad debts remained at minimal levels when compared to the combined sales of Clover and those principals for which we provide credit management. (Analysts should note that trade receivable days outstanding cannot be deduced from the financial statements as the full receivables of certain distribution principals are included in trade receivables while the revenue of such principals is not included in the Statement of Comprehensive Income. Only fees earned from providing the services involved are included in revenue).
EQUITYShare premiumThe share premium account remained unchanged from the prior financial year.
Other capital reservesDuring the year the Group remeasured the put option liability. The liability decreased from R57,1 million to R23,2 million and in terms of the Group’s accounting policy, any adjustment to the liability will be recorded in equity. Accordingly, the movement of R33,9 million movement was recorded in equity and is disclosed as part of other capital reserves. The remainder of the movement (R6,8 million) relates to the exercise of share appreciation rights.
Non-current liabilitiesHigher normalised operating profit, reduced investment in working capital, and contained capital expenditure were the primary contributors to a R131,2 million net decrease in interest-bearing debt (both current and non-current).
Apart from interest-bearing debt, non-current liabilities were similar to the previous year, with the exception of the deferred tax liability that increased by R39,2 million. This increase is primarily driven by accelerated depreciation allowances claimed for tax purposes and the utilisation of assessed losses in some of the Group’s subsidiaries.
Current liabilitiesTrade and other payables increased by R401,5 million or 31,5%. This increase is driven by the addition of DFSA as a principal, where Clover collects sales revenue on behalf of
DFSA and pays the same over to DFSA after 30 days from statement. Clover also negotiated more favourable payment terms with certain suppliers.
The increase in other current financial liabilities of R7,5 million is mainly as a result of the shares forward purchases maturing in the next 12 months.
Employee-related obligations increased by 107,5% or R10,5 million which is largely offset by the R7.2 million reduction in employee-related obligations under non-current liabilities. Overall the obligation increased by 3,6% which is below average salary increases and mainly due to DFSA employees no longer forming part of the Group.
GEARINGGroup gearing decreased from 51,4% to 47,8% at 30 June 2018. Net working capital (including the RCF advanced to DFSA) increased year-on-year by R92,9 million or 9,2%. Clover’s gearing is well within its ability to service interest and repayments.
CASH FLOWClover’s net current asset ratio decreased from 1,4 to 1,3. Excluding inventory, the position remained unchanged at 1,0.
Cash generated from operations, before working capital changes, totalled R769,5 million compared to R439,2 million reported in the prior year. Better cash generation was primarily due to the higher profit recorded (excludes the DFSA revolving credit facility impairment which is a non-cash item) as explained above and a reduction in finance changes. In the current year, working capital generated R348,2 million of cash compared to R162,2 million in the prior year. Clover held R95,5 million less inventory in comparison to the previous corresponding period. Trade and other receivable increased by R134,7 million compared to last year given the overall growth in revenue and services rendered to DFSA.
Investment activities consumed R578,7 million in cash compared to R277,7 million in the previous year, following the RCF advanced to DFSA. Clover also spent R104,4 million less capital on tangible and intangible assets.
Under financing activities, R163,0 million was paid for finance costs and dividends, compared to R260,9 million in the previous year. Clover reported a net reduction in interest-bearing borrowings of R163,3 million at the end of the year.
The Group’s cash position for the year increased by R215,8 million.
Clover Industries Limited Integrated Report for the year ended 30 June 2018 53
IN T
HE
SP
OT
LIGH
T
FOR
20
18IN
TR
OD
UC
ING
CLO
VE
R’S S
TO
RY
AN
ALY
SIN
G C
LOV
ER
’S V
ALU
E C
RE
AT
ION
LEA
DE
RS
HIP
R
EV
IEW
SP
ER
FOR
MA
NC
E O
UT
CO
ME
S O
F TH
E S
IX C
AP
ITA
LS
RE
MU
NE
RA
TIO
N
RE
PO
RT
AN
NU
AL FIN
AN
CIA
L R
ES
ULT
SS
HA
RE
HO
LDE
R
INFO
RM
AT
ION

SEGMENTAL PERFORMANCESegmental information is only disclosed to Margin on Materials (MOM) level as Clover’s assets and operations are largely integrated between segments, which makes the allocation of overhead costs to the different segments impractical. Overheads are managed at Group level.
MOM refers to revenue, less raw material, ingredients and packaging costs. Clover’s entry into the yoghurt and custard markets under our own brands necessitated the establishment of a dedicated fermented products and desserts segment to manage our yoghurt, custard and maas. A segment for Olives and Soy products was also added.
Value-added dairy fluidsThe dairy fluids segment consists of value-added dairy fluids sold in SA, and dairy fluids sales in Namibia, Botswana, Swaziland as well as through Clover Milkyway.
Revenue for this segment was down by 73,5%, primarily due to DFSA sales no longer forming part of the Group. However, on a like-for-like basis, revenue in this segment increased by 12,5% mainly due to volume growth achieved by Numel.
Average selling prices remained largely unchanged except for cream that increased 11,8% due to a shortage of butterfat. As a result, cream volumes decreased by 3,8% (partially due to the inability to meet market demand). MOM from value added dairy fluids was 39,6%.
Concentrated productsThe concentrated dairy products segment consists of cheese, butter, condensed milk and retail milk powders.
Revenue in concentrated products increased by 13,7% and was supported by with higher selling prices of 8,6 %, mainly on butter due to the butterfat shortage, and overall increase in volumes of 5,1%. MOM increased from 30,0% to 36,5%.
Due to an increase in global demand for butter, and limited availability of cream, butter and spreads volumes were down 3,1%.
Natural pre-packed cheese volumes increased by 3,1% whilst average selling prices remained flat. Clover entered the sliced processed cheese category in the prior year and aggressively pursued market share in the current year. Volumes increased 24,4% compared to the prior year.
Feta volumes were up 6,4% and condensed milk volumes flat.
From 1 July 2017, the bulk of milk collection cost is included in the price of milk purchased from DFSA. The remaining portion relates to milk collection costs associated Clover Milkyway.
As milk collection cost now forms part of material cost, the comparison for all remaining segments is done inclusive of milk collection cost. The price and mix variance for the segment on packaging, material and milk collection increased by 3,3% on average.
IngredientsAlthough Clover does not at present participate actively in the international dairy ingredients market, we balance seasonal milk and cheese production by annually selling excess skimmed milk and whey powder into the local ingredients market.
Revenue for this segment was down 18,5% because of volume losses. Notwithstanding MOM increased from 32,9% to 36,8% due to lower input costs.
Average selling prices decreased by 8,1% and volumes decreased by 10,4% for the period.
Non-alcoholic beveragesNon-alcoholic beverages consist of pure juices, dairy fruit mix (Tropika), nectar, ice-tea, water, flavoured milk and long-life juices.
Revenue for this segment increased by 1,7% where price increases offset volume losses.
Average selling prices were flat for the current year and the segment’s volumes grew by 1.7% for the period. The category’s performance is largely driven by dairy fruit mix, juices and waters. Volumes for pure juice was up 3,4%, dairy fruit mix up 1,4%, ice-tea down 15,5% and water down 4%.
The price and mix variance for raw materials and packaging includes the effects of sugar tax which became effective 1 April 2018, however, this was mitigated by decreased cost in sugar and pulp in the form of supplier rebates. The cost of material, packaging and milk collection decreased 5,9% on average. MOM from non-alcoholic beverages was 56,6%.
Fermented products and desserts This product segment consists of yoghurt, maas and custard.
Clover’s reinvestment in selling prices led to volume increases and revenue for this segment increased by 25,7%. The cost of materials, ingredient, packaging and milk collection on average increased by 8.9% notwithstanding volume increases
of 32,5%. This was largely as a result of robust packaging retender initiatives and significant savings from recipe reformulation. As a result, MOM was up 8,0% to 35,7%.
Maas volumes increased 54,9%, yoghurt 23,2%, and custard 6,5%.
Olive oil and soya The Group recently entered the olive oil market and has been participating in the dairy alternative market (soya) for almost two years now.
Revenue from this segment increased 93,0% mainly due to the prior year only containing three months of trading in the olive oil market. Volumes and average selling prices from soya decreased by 1,6% and 5,8% respectively.
The olive oil business benefited from good exchange rates during the year, however, towards the latter part margins came under pressure as the exchange rates started to increase. A meaningful analysis of volumes and revenue will be available in the next financial year, once a comparable benchmark has been established.
CONCLUSIONEncouraging signs of improving business and economic prospects at the beginning of 2018 has dissipated at the time of writing.
The consumer landscape remains challenging with a general inability to raise discretionary spending levels as a result of above-inflationary living cost increases and persistent high levels of unemployment.
Looking through the cycle, management remains confident of the Group’s continued performance as the full impact of actions taken to date are expected to benefit the business over time.
Management will continue to drive volume and market share growth whilst expanding Clover’s value-added product portfolio. Further cost efficiencies and synergistic opportunities to leverage the Group’s asset base and infrastructure will be explored.
Frantz ScheepersChief Financial Officer
26 September 2018
CHIEF FINANCIAL OFFICER’S REPORT continued
Clover Industries Limited Integrated Report for the year ended 30 June 201854
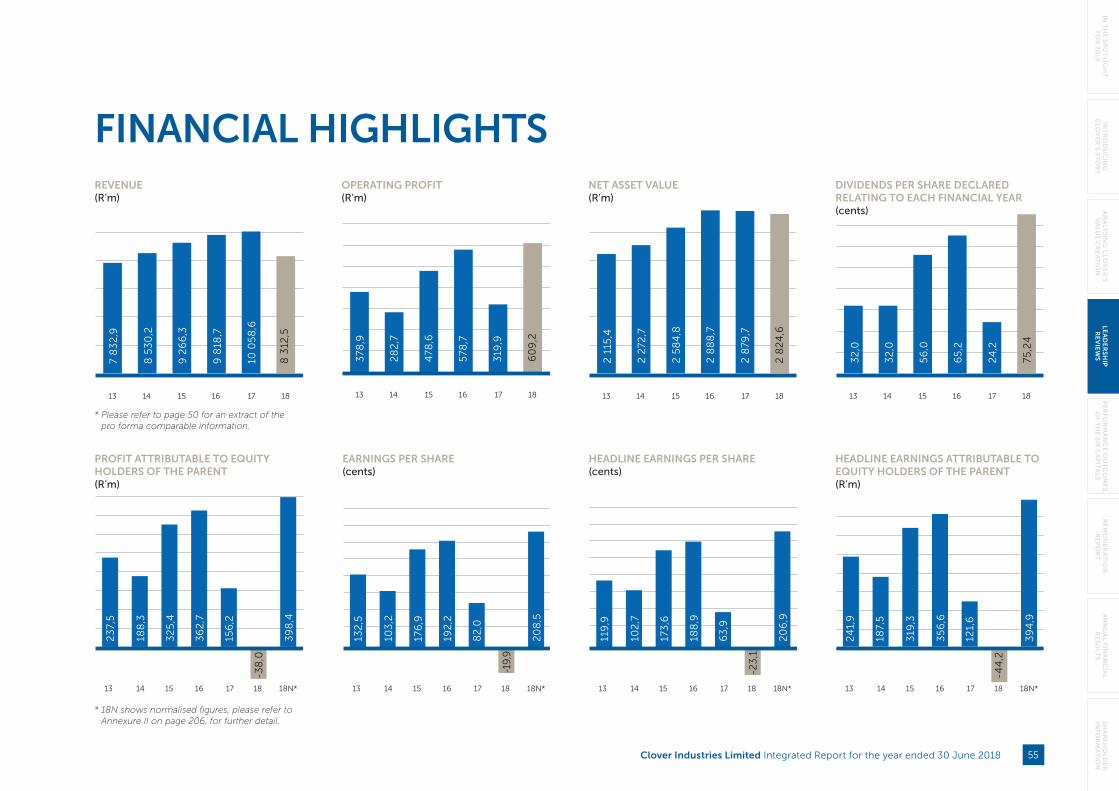
FINANCIAL HIGHLIGHTSREVENUE(R’m)
13 14 15 16 17 18
10 0
58
,6
7 8
32
,9
8 5
30
,2
9 2
66
,3
9 8
18,7
8 3
12,5
OPERATING PROFIT(R’m)
13 14 15 16 17 18
378
,9
28
2,7
478
,6
578
,7
319
,9
60
9,2
NET ASSET VALUE(R’m)
13 14 15 16 17 18
2 1
15,4
2 2
72,7
2 5
84
,8
2 8
88
,7
2 8
79,7
2 8
24
,6
HEADLINE EARNINGS ATTRIBUTABLE TO EQUITY HOLDERS OF THE PARENT(R’m)
13 14 15 16 17 18N*18
24
1,9
187,
5
319
,3
35
6,6
121,
6
39
4,9
-44
,2
PROFIT ATTRIBUTABLE TO EQUITY HOLDERS OF THE PARENT(R’m)
23
7,5
188
,3
32
5,4
36
2,7
156
,2
39
8,4
-38
,0
13 14 15 16 17 18N*18
EARNINGS PER SHARE(cents)
132
,5
103
,2
176
,9
192
,2
82
,0
20
8,5
-19,
9
13 14 15 16 17 18N*18
HEADLINE EARNINGS PER SHARE(cents)
119
,9
102
,7
173
,6
188
,9
63
,9
20
6,9
-23
,1
13 14 15 16 17 18N*18
DIVIDENDS PER SHARE DECLARED RELATING TO EACH FINANCIAL YEAR(cents)
13 14 15 16 17 18
32
,0
32
,0
56
,0
65
,2
24
,2
75,2
4
* Please refer to page 50 for an extract of the pro forma comparable information.
* 18N shows normalised figures, please refer to Annexure II on page 206, for further detail.
Clover Industries Limited Integrated Report for the year ended 30 June 2018 55
IN T
HE
SP
OT
LIGH
T
FOR
20
18IN
TR
OD
UC
ING
CLO
VE
R’S S
TO
RY
AN
ALY
SIN
G C
LOV
ER
’S V
ALU
E C
RE
AT
ION
LEA
DE
RS
HIP
R
EV
IEW
SP
ER
FOR
MA
NC
E O
UT
CO
ME
S O
F TH
E S
IX C
AP
ITA
LS
RE
MU
NE
RA
TIO
N
RE
PO
RT
AN
NU
AL FIN
AN
CIA
L R
ES
ULT
SS
HA
RE
HO
LDE
R
INFO
RM
AT
ION

DAIRY FRUIT MIX MARKET SHARE
1,8%FOR THE PERIOD
SOYA MILK MARKET SHARE
70,2%AT 30 JUNE 2018
SHORT-LIFE FRUIT JUICE MARKET SHARE
52,6%AT 30 JUNE 2018
Clover Industries Limited Integrated Report for the year ended 30 June 201856

PERFORMANCE OUTCOMES OF THE SIX CAPITALS
Clover Industries Limited Integrated Report for the year ended 30 June 2018 57
IN T
HE
SP
OT
LIGH
T
FOR
20
18IN
TR
OD
UC
ING
CLO
VE
R’S S
TO
RY
AN
ALY
SIN
G C
LOV
ER
’S V
ALU
E C
RE
AT
ION
LEA
DE
RS
HIP
R
EV
IEW
SP
ER
FOR
MA
NC
E OU
TC
OM
ES
OF T
HE S
IX C
AP
ITAL
SR
EM
UN
ER
AT
ION
R
EP
OR
TA
NN
UA
L FINA
NC
IAL
RE
SU
LTS
SH
AR
EH
OLD
ER
IN
FOR
MA
TIO
N
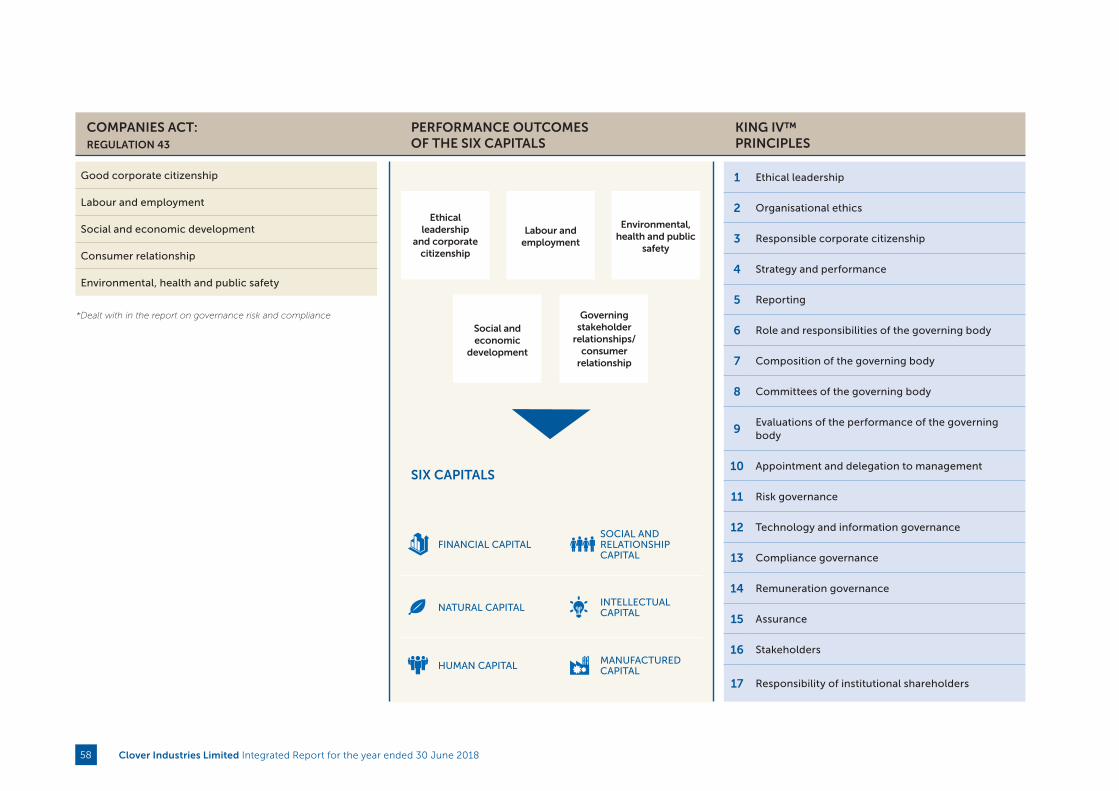
Ethical leadership
and corporate citizenship
Labour and employment
Environmental, health and public
safety
Governing stakeholder
relationships/consumer
relationship
Social and economic
development
COMPANIES ACT: REGULATION 43
SIX CAPITALS
PERFORMANCE OUTCOMES OF THE SIX CAPITALS
KING IV™ PRINCIPLES
Good corporate citizenship
Labour and employment
Social and economic development
Consumer relationship
Environmental, health and public safety
1 Ethical leadership
2 Organisational ethics
3 Responsible corporate citizenship
4 Strategy and performance
5 Reporting
6 Role and responsibilities of the governing body
7 Composition of the governing body
8 Committees of the governing body
9Evaluations of the performance of the governing body
10 Appointment and delegation to management
11 Risk governance
12 Technology and information governance
13 Compliance governance
14 Remuneration governance
15 Assurance
16 Stakeholders
17 Responsibility of institutional shareholders
*Dealt with in the report on governance risk and compliance
FINANCIAL CAPITALSOCIAL AND RELATIONSHIP CAPITAL
NATURAL CAPITAL INTELLECTUAL CAPITAL
HUMAN CAPITAL MANUFACTURED CAPITAL
Clover Industries Limited Integrated Report for the year ended 30 June 201858

REPORT ON THE SIX CAPITALS AND THE SOCIAL AND ETHICS COMMITTEE REPORTThis report is structured in accordance with the concept of the six capitals as defined by the International Integrated Reporting Council (IIRC) which takes into consideration the material inputs or resources required to create and preserve value.
OVERVIEWClover’s vision and mission has been aligned to the value chain as we consider strategy, risk, governance, performance and sustainability to be inseparable. This report is structured to incorporate the requirements of the Companies Act, 71 of 2008 (Regulation 43) and King IV™. Clover also utilises the Integrated Reporting Framework (<IR> framework) as issued by IIRC in December 2013.
The <IR> framework provides a principle-based approach through which Clover describes how the key components of the value chain (or business model) are applied to create and sustain value for our stakeholders.
SCOPE AND BOUNDARYThe scope of this report covers Clover’s South African operations and will in time be extended to our subsidiaries in other countries. This report focuses on the most relevant and material issues that could impact significantly on Clover’s ability to create and sustain value for its stakeholders in the long term.
Clover is one of a few South African businesses that has thrived for well over 100 years. We recognise that to survive and prosper, we need to ensure that Clover’s operations and planning is geared towards long-term sustainability. Clover’s Social and Ethics Committee is chaired by an independent director and includes a further two independent directors and one executive director. Details of the committee membership, meetings held and attendance in this financial year are set out on page 20 to 23.
The Social and Ethics Committee has considered the matters of the integrated report that are pertinent to Clover.
The responsibilities and functioning of the Social and Ethics Committee are governed by formal terms of reference approved by the board and is subject to regular review. The main objective of the committee is to assist the board in ensuring that Clover remains a responsible corporate citizen that utilises sustainable
business practices. The committee monitors, develops, reviews and enhances Clover’s social, ethical, environmental and governance impact. To fulfil its responsibilities, the Social and Ethics Committee adopted a formal workplan that accords with its functions as set out in Regulation 43 of the Companies Act and King IV™. This workplan is designed to enable Clover to fully discharge its statutory functions. The board supports the committee by setting the appropriate tone and Clover’s “Way Better” philosophy across the organisation contributes to Clover’s ethical culture. This report describes the work and conclusions of the committee in its seventh year of establishment. Over and above the requirements of the Act, this report’s scope includes guidelines from the <IR> framework and the sustainability reporting guidelines (G4 version) of the Global Reporting Initiative (GRI). In short, the aspects of Clover’s business most critical to its long-term value creation are summarised in terms of the six capitals principle.
Every year, Clover redefines its risk bearing capacity and risk appetite, and utilises these as the basis for setting materiality levels. Following that exercise, these materiality levels are used to adjust the thresholds of Clover’s delegation of authority, so that appropriate levels of managerial approval are set. These same materiality levels are used in Clover’s Enterprise Wide Risk Management Framework, which ultimately ensures that all material risks are reported to the board committees and considered for inclusion in Clover’s integrated report.
In line with the <IR> framework, Clover only reported on issues it believes to be sufficiently material for inclusion in this integrated report. Less significant matters are reported on the website and elsewhere.
KEY FOCUS AREASThe following are the key and significant issues considered by the committee during the year under review:
• Review of the Company’s compliance with all legislation, other legal requirements or prevailing codes of best practise;
• Review of the Company’s standing in terms of the goals and purposes of the 10 principles set out in the United Nations Global Compact Principles;
• Review of Company’s standing in terms of the goals and purposes of the OECD recommendations regarding corruption;
• Review of the Company’s standing in terms of the goals and purposes of the Employment Equity Act;
• Review of the Company’s standing in terms of the goals and purposes of the Broad-Based Black Economic Empowerment Act;
• Monitored the Company’s activities with regard to matters relating to the promotion of equality, prevention of unfair discrimination and the reduction of corruption;
• Monitored the Company’s activities with regard to matters relating to the Company’s contribution to development of the communities in which its activities are predominantly conducted or within which its products or services are predominantly marketed;
• Monitored the Company’s activities with regard to matters relating to sponsorships, donations and charitable giving;
• Monitored the Company’s activities with regard to matters relating the environment, health and public safety, including the impact of the Company’s activities and of its products or services. Ensure that all health and safety procedures are uniformly, as far as possible, implemented throughout the organisation;
• Monitored the Company’s activities with regard to matters relating consumer relationships, including the Company’s advertising, public relations and compliance with consumer laws;
• Reviewed the annual sustainability review for publication in the integrated report;
• Reviewed Company’s code of ethics;
• Reviewed the committee’s terms of reference;
• Review the report on the Company’s ethics hotline;
• Monitored the Company’s activities regarding government policies and other legislation that impact on food security; and
• Reviewed the report on excessive overtime and garnishee orders in the Company.
Clover Industries Limited Integrated Report for the year ended 30 June 2018 59
IN T
HE
SP
OT
LIGH
T
FOR
20
18IN
TR
OD
UC
ING
CLO
VE
R’S S
TO
RY
AN
ALY
SIN
G C
LOV
ER
’S V
ALU
E C
RE
AT
ION
LEA
DE
RS
HIP
R
EV
IEW
SP
ER
FOR
MA
NC
E OU
TC
OM
ES
OF T
HE S
IX C
AP
ITAL
SR
EM
UN
ER
AT
ION
R
EP
OR
TA
NN
UA
L FINA
NC
IAL
RE
SU
LTS
SH
AR
EH
OLD
ER
IN
FOR
MA
TIO
N
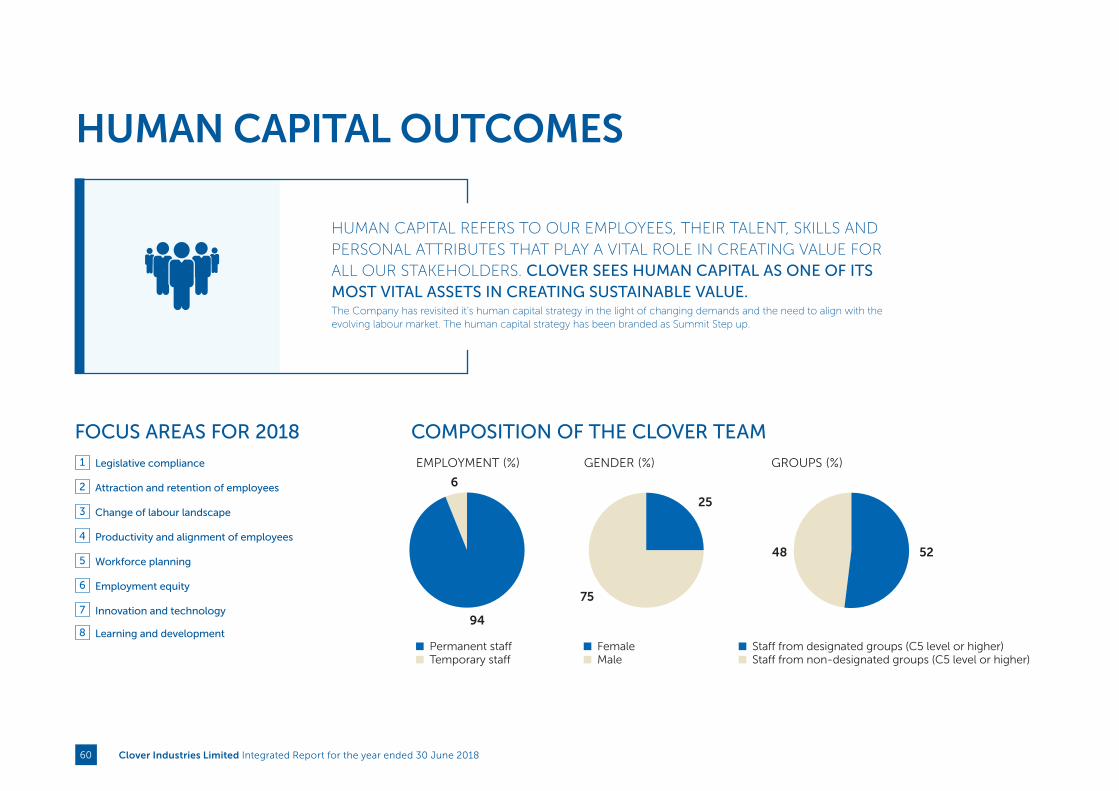
HUMAN CAPITAL OUTCOMES
FOCUS AREAS FOR 20181 Legislative compliance
2 Attraction and retention of employees
3 Change of labour landscape
4 Productivity and alignment of employees
5 Workforce planning
6 Employment equity
7 Innovation and technology
8 Learning and development
COMPOSITION OF THE CLOVER TEAM
HUMAN CAPITAL REFERS TO OUR EMPLOYEES, THEIR TALENT, SKILLS AND PERSONAL ATTRIBUTES THAT PLAY A VITAL ROLE IN CREATING VALUE FOR ALL OUR STAKEHOLDERS. CLOVER SEES HUMAN CAPITAL AS ONE OF ITS MOST VITAL ASSETS IN CREATING SUSTAINABLE VALUE.The Company has revisited it’s human capital strategy in the light of changing demands and the need to align with the evolving labour market. The human capital strategy has been branded as Summit Step up.
Permanent staff Temporary staff
Female Male
Staff from designated groups (C5 level or higher) Staff from non-designated groups (C5 level or higher)
EMPLOYMENT (%) GENDER (%) GROUPS (%)
25
6
94
48 52
75
Clover Industries Limited Integrated Report for the year ended 30 June 201860

Inputs Change 2018 2017
Total number of employees (and contractors) (7.89%) 8 044 8 733
Total amount paid in salaries and wages (R’000) (6.07) R1 794m R1 910 m
Total number of employees trained (19.64% 2 030 2 526
Rand value of training spend +25.63% R20 647m R16 435m
Percentage of permanent employees belonging to a trade union +22% 61% 50%
Number of employees enrolled on learnerships, skills programmes and apprenticeships
(2.71%) 682 701
Number of employees on formal workplace experience and in-service training programmes
+12.20% 46 41
Number of bursaries (employed/ unemployed) granted for degree and diploma studies
(88.89%) 1 9
MATERIAL TRADE-OFFSDue to the constrained economic environment in South Africa, and the challenging trading conditions, the Group implemented various initiatives, to streamline and optimise business operations. This unfortunately resulted in a number of employees being retrenched.
While this benefitted financial capital due to lower costs, it had a negative impact on human capital.
FUTURE OUTLOOKThe revised human capital strategy has been rebranded as Step up, and includes the following focus areas:
INPUTS
1 Fully compliant with relation to all human capital and legislative requirements.
2 Attraction and retention of employees received continued focus and the turnover rate remained low at 7.79% for the year. The Company, in partnership with PWC embarked on a national salary benchmarking exercise to ensure alignment with external market norms.
3 Union relations improved in the period under review and days lost due to industrial action were limited.
4 Structures were optimised and business restructuring commenced in the latter part of the period under review.
5 Talent management processes were improved and recruitment cost was substantially reduced.
6 Continued progress towards employment equity targets and objectives were made.
7 Approval was obtained to invest in new human resource information system technology and the development commenced.
8 The Company’s competence profile was improved in specific focus areas and aligned with national skills development priorities.
OUTCOMES
• Visionary leadership
• A Way Better performance culture
• Talented and competent employees
• A performance-based management system
• A Way Better employee experience
• Empowerment through advanced technology
• A stable labour landscape
Clover Industries Limited Integrated Report for the year ended 30 June 2018 61
IN T
HE
SP
OT
LIGH
T
FOR
20
18IN
TR
OD
UC
ING
CLO
VE
R’S S
TO
RY
AN
ALY
SIN
G C
LOV
ER
’S V
ALU
E C
RE
AT
ION
LEA
DE
RS
HIP
R
EV
IEW
SP
ER
FOR
MA
NC
E OU
TC
OM
ES
OF T
HE S
IX C
AP
ITAL
SR
EM
UN
ER
AT
ION
R
EP
OR
TA
NN
UA
L FINA
NC
IAL
RE
SU
LTS
SH
AR
EH
OLD
ER
IN
FOR
MA
TIO
N
HUMAN CAPITAL OUTCOMES continued
THE FOCUS AREAS UP CLOSE
1 Legislative compliance
The legislative environment remained a prominent focus and various initiatives were undertaken to ensure compliance. The Company’s master data, payroll processes and controls were subject to an audit by Deloitte and compliance was confirmed. Process improvement suggestions are being implemented where justified. A framework has been established that will guide the implementation of POPIA once promulgated. The management of working hours remains a key focus given the Company’s challenging operational requirements.
2 Attraction and retention of employees
Various mechanisms are in place to ensure the attraction and retention of suitable talent. The Company’s working climate is such that it supports stability in workforce turnover. This results in adequate depth in the scarce and critical skills areas of the business. The revision of service providers in the talent sourcing space was undertaken to ensure alignment with the Company’s talent acquisition needs. The Company has embarked on various initiatives to enhance its attraction and retention methodologies. These initiatives are focussed on strengthening the Company’s employment brand and systems to improve employee experience.
3 Change of labour landscape
The Company has managed the transition to a multi-union environment positively with minimum disruption to the business. Relations with the various unions remained complex. Management had to find practical and innovative ways to communicate with employees in the absence of a dominant union. The Company believes in sound relations with trade unions based on mutual respect and collaboration on issues of mutual interest and will continue to take steps in this regard.
4 Productivity and alignment of employees
During the year under review initiatives were implemented to streamline and optimise structures and operations. This resulted in a number of positions being abolished. Affected employees were identified and where possible re-deployed in other parts
of the business where deployment opportunities existed. In addition, a number of employees exercised the option to accept voluntary severance packages. Formal restructuring processes took place at the Nelspruit and Clayville sites.
Alignment of employees to the business strategy and objectives is of vital importance. Business objectives are cascaded down and result in individual performance agreements which are formally managed. This business process is well embedded in the Company and is the foundation of the Company’s incentive scheme for the recognition of individual performance. Various communication platforms are utilised to engage employees on challenges facing the business and the strategy and plans to ensure sustainability and growth.
5 Workforce planning
The Company continuously focus on roles and structures to ensure optimal integration and alignment of functions. Talent acquisition, staff movement and succession management is a planned process to ensure the appointment and development of the right people. The Company is currently investing in new technology that will improve its capability to manage these processes more effectively.
6 Employment equity
Clover fully supports employment equity in the workplace and various measures are in place to contribute to our employment equity objectives. Consultation is taking place at employment equity forums at different levels in the business. Clover continues to make progress in establishing a more diverse workforce profile. Numerical targets at junior and middle management level for the year under review have been met. Clover supports the relevant codes of good practice and does not accept unfair discrimination of any type. The Company purposefully strives to provide equal opportunities for employees to grow and develop, based on merit and ability. Clover’s employment equity policy clearly sets out responsibilities for different levels of management in managing employment equity.
7 Innovation and technology
A detailed Learning Management System (LMS) was scoped and the Company will be rolling out the system in the new financial year with focus on the following modules: recruitment and onboarding, learning and talent management. This will assist Clover managers to better manage these critical business processes in line with best practice. Once fully implemented, LMS will greatly improve the reporting capability in respect of compliance and management requirements. The Company additionally embarked on a project to identify, define and implement a standardised reporting framework and to enhance all human resources user system and reporting capability in order to provide accurate and insightful human resources analytics to the business.
8 Learning and development
Clover remained committed to the broadening of the competence levels of their employees in alignment with the growth strategy of the business. Skills development initiatives in the year under review focussed on:
• Management and leadership development
• Scarce and critical skills with a job technical focus
The development of skills in partnership with government skills development initiatives was continued for the period under review. The Company is continuously exploring opportunities to support viable programs in alignment with business needs that will contribute to the National Skills Development Strategy.
Clover Industries Limited Integrated Report for the year ended 30 June 201862
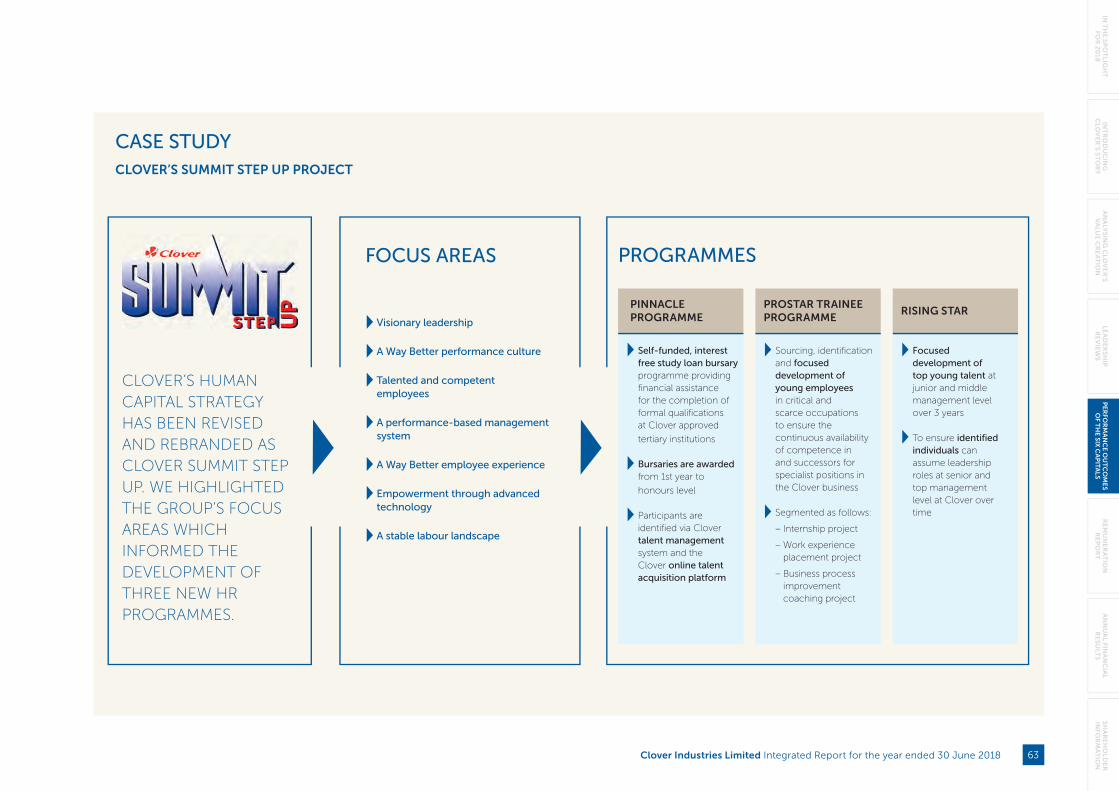
CASE STUDYCLOVER’S SUMMIT STEP UP PROJECT
FOCUS AREAS
Visionary leadership
A Way Better performance culture
Talented and competent employees
A performance-based management system
A Way Better employee experience
Empowerment through advanced technology
A stable labour landscape
PINNACLE PROGRAMME
Self-funded, interest free study loan bursary programme providing financial assistance for the completion of formal qualifications at Clover approved
tertiary institutions
Bursaries are awarded from 1st year to
honours level
Participants are identified via Clover talent management system and the Clover online talent acquisition platform
PROSTAR TRAINEE PROGRAMME
Sourcing, identification and focused development of young employees in critical and scarce occupations to ensure the continuous availability of competence in and successors for specialist positions in the Clover business
Segmented as follows:
– Internship project
– Work experience placement project
– Business process improvement coaching project
RISING STAR
Focused development of top young talent at junior and middle management level over 3 years
To ensure identified individuals can assume leadership roles at senior and top management level at Clover over time
PROGRAMMES
CLOVER’S HUMAN CAPITAL STRATEGY HAS BEEN REVISED AND REBRANDED AS CLOVER SUMMIT STEP UP. WE HIGHLIGHTED THE GROUP’S FOCUS AREAS WHICH INFORMED THE DEVELOPMENT OF THREE NEW HR PROGRAMMES.
Clover Industries Limited Integrated Report for the year ended 30 June 2018 63
IN T
HE
SP
OT
LIGH
T
FOR
20
18IN
TR
OD
UC
ING
CLO
VE
R’S S
TO
RY
AN
ALY
SIN
G C
LOV
ER
’S V
ALU
E C
RE
AT
ION
LEA
DE
RS
HIP
R
EV
IEW
SP
ER
FOR
MA
NC
E OU
TC
OM
ES
OF T
HE S
IX C
AP
ITAL
SR
EM
UN
ER
AT
ION
R
EP
OR
TA
NN
UA
L FINA
NC
IAL
RE
SU
LTS
SH
AR
EH
OLD
ER
IN
FOR
MA
TIO
N
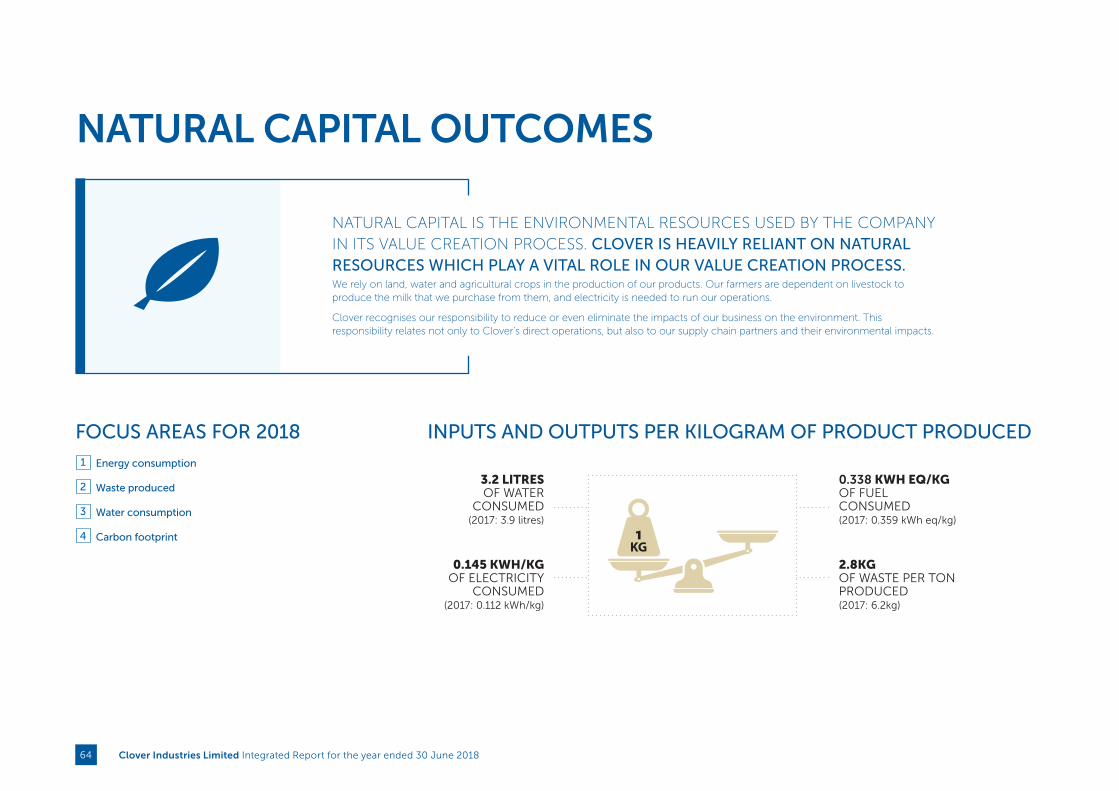
NATURAL CAPITAL OUTCOMES
FOCUS AREAS FOR 20181 Energy consumption
2 Waste produced
3 Water consumption
4 Carbon footprint
INPUTS AND OUTPUTS PER KILOGRAM OF PRODUCT PRODUCED
NATURAL CAPITAL IS THE ENVIRONMENTAL RESOURCES USED BY THE COMPANY IN ITS VALUE CREATION PROCESS. CLOVER IS HEAVILY RELIANT ON NATURAL RESOURCES WHICH PLAY A VITAL ROLE IN OUR VALUE CREATION PROCESS.We rely on land, water and agricultural crops in the production of our products. Our farmers are dependent on livestock to produce the milk that we purchase from them, and electricity is needed to run our operations.
Clover recognises our responsibility to reduce or even eliminate the impacts of our business on the environment. This responsibility relates not only to Clover’s direct operations, but also to our supply chain partners and their environmental impacts.
3.2 LITRES OF WATER
CONSUMED (2017: 3.9 litres)
0.145 KWH/KG OF ELECTRICITY
CONSUMED (2017: 0.112 kWh/kg)
0.338 KWH EQ/KGOF FUEL CONSUMED (2017: 0.359 kWh eq/kg)
2.8KG OF WASTE PER TON PRODUCED (2017: 6.2kg)
Clover Industries Limited Integrated Report for the year ended 30 June 201864
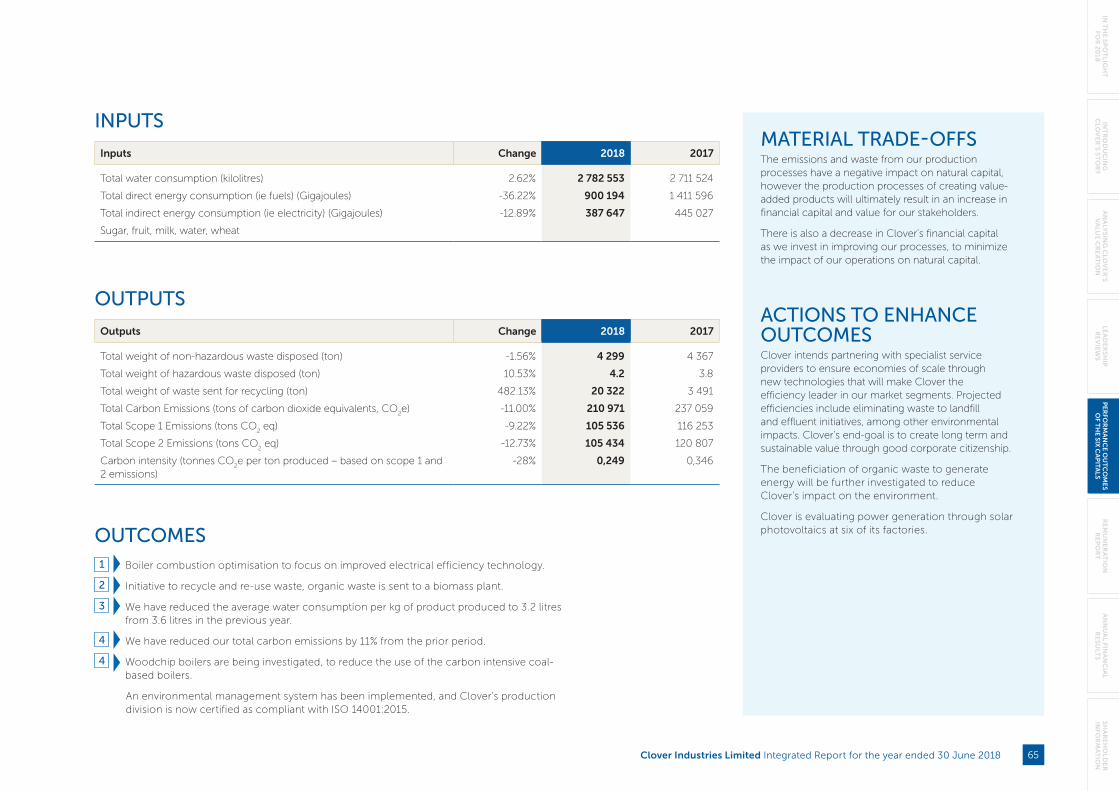
Inputs Change 2018 2017
Total water consumption (kilolitres) 2.62% 2 782 553 2 711 524
Total direct energy consumption (ie fuels) (Gigajoules) -36.22% 900 194 1 411 596
Total indirect energy consumption (ie electricity) (Gigajoules) -12.89% 387 647 445 027
Sugar, fruit, milk, water, wheat
Outputs Change 2018 2017
Total weight of non-hazardous waste disposed (ton) -1.56% 4 299 4 367
Total weight of hazardous waste disposed (ton) 10.53% 4.2 3.8
Total weight of waste sent for recycling (ton) 482.13% 20 322 3 491
Total Carbon Emissions (tons of carbon dioxide equivalents, CO2e) -11.00% 210 971 237 059
Total Scope 1 Emissions (tons CO2 eq) -9.22% 105 536 116 253
Total Scope 2 Emissions (tons CO2 eq) -12.73% 105 434 120 807
Carbon intensity (tonnes CO2e per ton produced – based on scope 1 and
2 emissions)-28% 0,249 0,346
MATERIAL TRADE-OFFSThe emissions and waste from our production processes have a negative impact on natural capital, however the production processes of creating value-added products will ultimately result in an increase in financial capital and value for our stakeholders.
There is also a decrease in Clover’s financial capital as we invest in improving our processes, to minimize the impact of our operations on natural capital.
ACTIONS TO ENHANCE OUTCOMESClover intends partnering with specialist service providers to ensure economies of scale through new technologies that will make Clover the efficiency leader in our market segments. Projected efficiencies include eliminating waste to landfill and effluent initiatives, among other environmental impacts. Clover’s end-goal is to create long term and sustainable value through good corporate citizenship.
The beneficiation of organic waste to generate energy will be further investigated to reduce Clover’s impact on the environment.
Clover is evaluating power generation through solar photovoltaics at six of its factories.
INPUTS
OUTPUTS
OUTCOMES1 Boiler combustion optimisation to focus on improved electrical efficiency technology.
2 Initiative to recycle and re-use waste, organic waste is sent to a biomass plant.
3 We have reduced the average water consumption per kg of product produced to 3.2 litres from 3.6 litres in the previous year.
4 We have reduced our total carbon emissions by 11% from the prior period.
4 Woodchip boilers are being investigated, to reduce the use of the carbon intensive coal-based boilers.
An environmental management system has been implemented, and Clover’s production division is now certified as compliant with ISO 14001:2015.
Clover Industries Limited Integrated Report for the year ended 30 June 2018 65
IN T
HE
SP
OT
LIGH
T
FOR
20
18IN
TR
OD
UC
ING
CLO
VE
R’S S
TO
RY
AN
ALY
SIN
G C
LOV
ER
’S V
ALU
E C
RE
AT
ION
LEA
DE
RS
HIP
R
EV
IEW
SP
ER
FOR
MA
NC
E OU
TC
OM
ES
OF T
HE S
IX C
AP
ITAL
SR
EM
UN
ER
AT
ION
R
EP
OR
TA
NN
UA
L FINA
NC
IAL
RE
SU
LTS
SH
AR
EH
OLD
ER
IN
FOR
MA
TIO
N

MANUFACTURED CAPITAL OUTCOMES
FOCUS AREAS FOR 20181 Supply chain planning and procurement
2 Production efficiencies
3 Product quality and food safety
4 Distribution
5 Masakhane
OUR MANUFACTURED CAPITAL GREATLY ASSISTS US IN FACILITATING VALUE CREATING ACTIVITIES, AS THE QUALITY OF OUR MANUFACTURED CAPITAL DETERMINES THE QUALITY OF OUR PRODUCTS AND SERVICES. Along with the manufacturing of our products, Clover also has agreements with several major customers, for whom we provide distribution and in-store merchandising services
Description 2018 2017
Fatalities – People working under our control 0 0
Total number of recordable injuries, including medically treated cases, lost time injuries (LTI) and fatalities 37 83
First aid cases – persons working under our control 79 38
Reportable (Compensation Commissioner) lost time injuries for this financial year 26 45
Fatal injury frequency rate (i.e. number of fatalities per 200 000 person hours worked) 0 0
Lost time injury frequency rate (i.e. the number of LTIs per 200 000 person hours worked) 4,07 2,56
HEALTH AND SAFETY AT CLOVER’S PRODUCTION FACILITIES
Clover Industries Limited Integrated Report for the year ended 30 June 201866
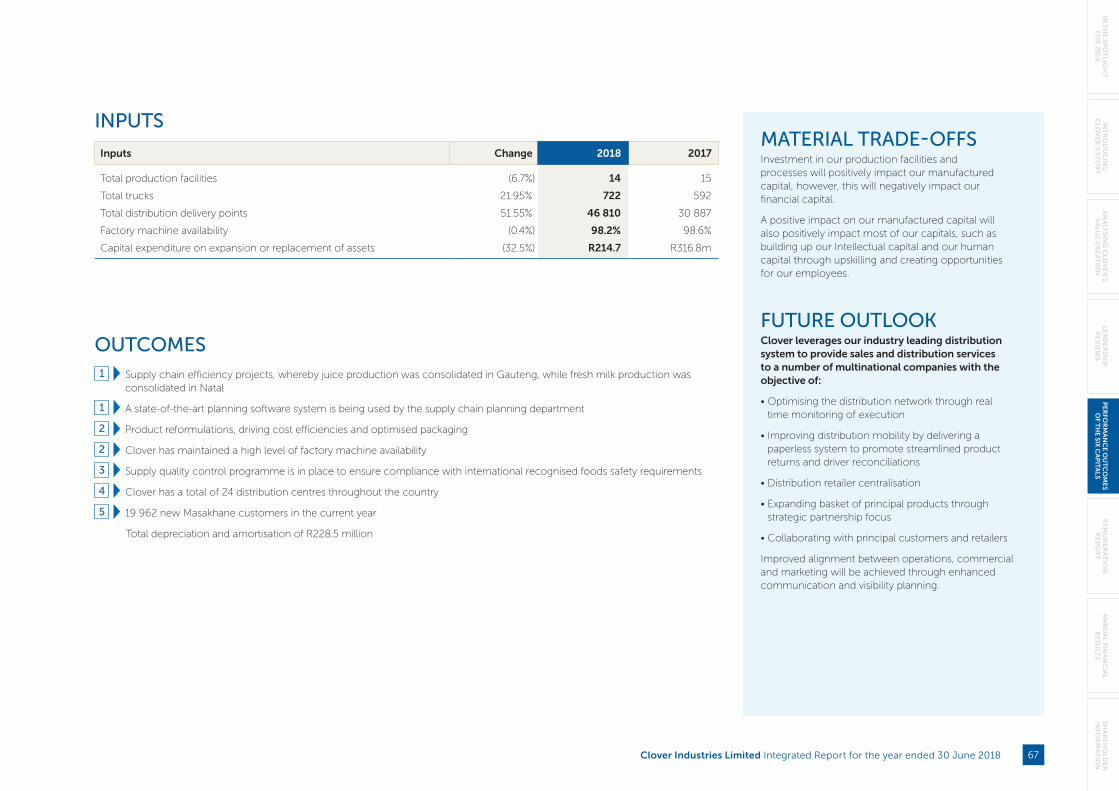
Inputs Change 2018 2017
Total production facilities (6.7%) 14 15
Total trucks 21.95% 722 592
Total distribution delivery points 51.55% 46 810 30 887
Factory machine availability (0.4%) 98.2% 98.6%
Capital expenditure on expansion or replacement of assets (32.5%) R214.7 R316.8m
MATERIAL TRADE-OFFSInvestment in our production facilities and processes will positively impact our manufactured capital, however, this will negatively impact our financial capital.
A positive impact on our manufactured capital will also positively impact most of our capitals, such as building up our Intellectual capital and our human capital through upskilling and creating opportunities for our employees.
FUTURE OUTLOOKClover leverages our industry leading distribution system to provide sales and distribution services to a number of multinational companies with the objective of:
• Optimising the distribution network through real time monitoring of execution
• Improving distribution mobility by delivering a paperless system to promote streamlined product returns and driver reconciliations
• Distribution retailer centralisation
• Expanding basket of principal products through strategic partnership focus
• Collaborating with principal customers and retailers
Improved alignment between operations, commercial and marketing will be achieved through enhanced communication and visibility planning.
INPUTS
OUTCOMES1 Supply chain efficiency projects, whereby juice production was consolidated in Gauteng, while fresh milk production was
consolidated in Natal
1 A state-of-the-art planning software system is being used by the supply chain planning department
2 Product reformulations, driving cost efficiencies and optimised packaging
2 Clover has maintained a high level of factory machine availability
3 Supply quality control programme is in place to ensure compliance with international recognised foods safety requirements
4 Clover has a total of 24 distribution centres throughout the country
5 19 962 new Masakhane customers in the current year
Total depreciation and amortisation of R228.5 million
Clover Industries Limited Integrated Report for the year ended 30 June 2018 67
IN T
HE
SP
OT
LIGH
T
FOR
20
18IN
TR
OD
UC
ING
CLO
VE
R’S S
TO
RY
AN
ALY
SIN
G C
LOV
ER
’S V
ALU
E C
RE
AT
ION
LEA
DE
RS
HIP
R
EV
IEW
SP
ER
FOR
MA
NC
E OU
TC
OM
ES
OF T
HE S
IX C
AP
ITAL
SR
EM
UN
ER
AT
ION
R
EP
OR
TA
NN
UA
L FINA
NC
IAL
RE
SU
LTS
SH
AR
EH
OLD
ER
IN
FOR
MA
TIO
N

MANUFACTURED CAPITAL OUTCOMES continued
THE FOCUS AREAS UP CLOSE1 Supply chain planning and procurement
Clover’s Supply Chain Planning Department centrally plans all manufacturing, purchasing, storing and deployment of finished goods throughout Clover’s integrated supply chain.
Production requirements, stock levels and deployment plans are based on predicted future market demand for Clover’s products. Consumer demand is predicted through a sales and operations planning process that utilises statistical forecasting models as the baseline. These results are further checked in collaboration with Clover’s Commercial and Marketing divisions.
The Supply Chain Planning Department is also responsible for managing all primary transportation between factories and distribution depots, as well as bulk deliveries to selected customers.
Clover’s Centralised Procurement Department is responsible for procuring ingredients and packaging materials from qualifying suppliers including DFSA for raw milk, to provide consistent high-quality materials for production. Clover’s procurement philosophy is to build partnerships that shift the understanding beyond monetary considerations to also include socio-economic objectives and long-term value creation.
2 Production efficiencies
Factory machine availability: Maintaining a high level of machine availability is vital for achieving higher throughput per hour, reducing product losses and reducing energy consumption. A further benefit is that assets are properly utilised, and the need for additional equipment to accommodate a higher level of production is reduced when availability improves. Clover’s machine availability averages have increased substantially over the past five years.
Depreciation vs capital expenditure: The quality of Clover’s manufactured capital will deteriorate if we do not continually invest in it. Clover invests to improve efficiency and effectiveness as opposed to maintaining assets. In the first two years of the three-year period shown, we allocated substantial capital resources to enhance the quality of our manufacturing assets.
Capacity utilisation: Sales growth is only possible if the manufacturing capacity exists to meet the higher volumes of production required. Clover’s ability to manage manufacturing capacities is vital for ramping up to meet unexpected demand, or to reduce production when needed to keep unit production costs down. Clover’s capacity utilisation per product group must remain within best practice parameters. Milk intake is seasonal, with an increased milk intake between August and January in any given year, so that certain factories work at full capacity in the seasonal peak cycle. Production reduces substantially in the lower-milk flow season. Clover’s capacity during the seasonal peak determines limits for increased milk intake. As some products are highly seasonal, the average value and the peak (October) value have been utilised as being the most illustrative.
LIQUID FACTORIES CAPACITY VS UTILISATION (LITRES)
MACHINE AVAILABILITY (YEARLY AVERAGE AVAILABILITY
CONCENTRATED FACTORIES CAPACITY VS UTILISATION (KGS)
0
5 000 000
10 000 000
15 000 000
20 000 000
BO
TSW
AN
A
CLO
VE
R
MIL
NE
RT
ON
BLO
EM
FON
TE
IN
CLO
VE
R
WA
TE
RS
SILV
ER
TO
N
PIN
ET
OW
N
CA
PE
TO
WN
PO
RT
ELI
ZA
BE
TH
QU
EE
NSB
UR
GH
CL
AY
VIL
LE
0
500000
1000000
1500000
2000000
HEILBRONLICHTENBURG FRANKFORT ESTCOURT
96,0
96,5
97,0
97,5
98,0
98,5
99,0
FY 17/18FY 16/17FY 15/16FY 14/15FY 13/14
Clover Industries Limited Integrated Report for the year ended 30 June 201868
3 Product quality and food safety
All Clover products are produced according to international best practice standards for quality, hygiene and food safety. Products are only formally released by the Quality Control Department once assessed against these specifications. All of Clovers’ factories in South Africa are HACCP certified and accredited by third party auditors. We comply with all international standards required for food safety and quality risk management systems. Clover Quality Assurance and Control deploys highly trained technicians in well-equipped laboratories to test our products at all production stages. Clover implemented the latest and world-wide accepted FSSC 22000 quality management system and also introduced a supplier quality control programme to ensure that all raw materials and packaging materials comply with internationally recognised food safety requirements.
4 Distribution
Clover’s Primary Distribution Department moves all our products from factories to distribution facilities across South Africa. Every day, our customer call centre receives electronic or telephonic customer orders and arranges deliveries from one of Clover’s 24 distribution centres to approximately 46 810 delivery points in South Africa.
5 Masakhane – Let’s build together
Masakhane (literally meaning “let’s build together”) was initiated in 2012 as Clover’s first targeted approach to informal (emerging market) trading environments. The Masakhane objective is to grow the “emerging market” customer base and revenue stream by selling to stores that do not form part of a Clover key account or buying group. Masakhane has enabled Clover to rapidly increase our reach and footprint into informal and formal food service industry (FSI) trading systems such as spaza shops, tuck shops, corner cafés, general traders, hotels, schools, B&B, restaurants and bottle stores.
Masakhane aims to create 1 004 new and permanent jobs within the distribution and informal retail sector by reaching 61 603 customer stores by 2020. Masakhane recruits undergo sales, marketing and distribution training that equip Masakhane entrepreneurs with the ability to carry out their daily responsibilities, while preparing and developing them for formal trade. Furthermore, Masakhane provides training directly to the informal store owners to equip them with the required commercial and supply chain expertise to further develop and sustain their stores. Masakhane contributes to alleviating unemployment in South Africa as it is a catalyst for growth and job creation.
The Masakhane sales channel has evolved from a strictly informal trade focus to now include the formal and informal FSI sales channel. The results have been so successful that Clover Masakhane has expanded into the Swaziland and Namibia, where Clover has a sales and distribution infrastructure presence and “route to market” footprint.
Clover Industries Limited Integrated Report for the year ended 30 June 2018 69
IN T
HE
SP
OT
LIGH
T
FOR
20
18IN
TR
OD
UC
ING
CLO
VE
R’S S
TO
RY
AN
ALY
SIN
G C
LOV
ER
’S V
ALU
E C
RE
AT
ION
LEA
DE
RS
HIP
R
EV
IEW
SP
ER
FOR
MA
NC
E OU
TC
OM
ES
OF T
HE S
IX C
AP
ITAL
SR
EM
UN
ER
AT
ION
R
EP
OR
TA
NN
UA
L FINA
NC
IAL
RE
SU
LTS
SH
AR
EH
OLD
ER
IN
FOR
MA
TIO
N

INTELLECTUAL CAPITAL OUTCOMES
FOCUS AREAS FOR 20181 Trademarks and patents
2 Brands and reputation
3 Information systems
4 Distribution system for third parties
5 Product innovation and technology
INTELLECTUAL CAPITAL REPRESENTS THE INTANGIBLE VALUE OF THE BUSINESS. Innovation in our business is important for Clover in our value creation process. From new product innovations and product reformulations, to improved business processes, Clover is constantly looking for opportunities to increase value for all our stakeholders.
Over the years, Clover’s Marketing and New Product Development (“NPD”) Departments have developed several iconic household brands. These include Clover, Tropika, Butro and Krush, among others.
Clover’s in-house Information Technology (IT) Department provides the digital backbone for all our management systems and applications. Clover’s IT governance and its independent assurance is outlined in the governance, risk and compliance report, on page 24.
20
40
60
80
100
TO
TA
L S
HO
RT
LIFE
JU
ICE
OLI
VE
PR
IDE
SO
Y M
ILK
FRE
SH
MIL
K
FRE
SH
MIL
K
UH
T M
ILK
EX
CL
SO
Y
DR
INK
ING
YO
GH
UR
T
CH
UN
KY
YO
GH
UR
T
SM
OO
TH
YO
GH
UR
T
TO
TA
L Y
OG
HU
RT
DA
IRY
FR
UIT
MIX
NE
CT
AR
SLF
J
100
% S
LFJ
FLA
VO
UR
ED
MIL
K
IWS
PR
OC
ES
SE
D C
HE
ES
E
FET
A C
HE
ES
E
NA
TU
RA
L C
HE
ES
E
MA
AS
LON
GLI
FE F
RU
IT J
UIC
E
ICE
TE
A
CR
EA
M
CU
ST
AR
D
CO
ND
EN
SE
D M
ILK
BU
TT
ER
WA
TE
R
VOLUME SHARES - TOTAL SOUTH AFRICA (%)
Clover Industries Limited Integrated Report for the year ended 30 June 201870

Inputs Change 2018 2017
Trademarks registered 4.28% 950 911
Patents registered in South Africa and Namibia – 11 11
Investment in research and development 33.55% R66.67m R49.62m
IT licenses and memberships for software that automates and/or enhances business functions
Market leading distribution system to provide sales and distribution services
Employee memberships for industry networks and professional institutions
Portfolio of existing brands: 37
MATERIAL TRADE-OFFSInvestment in research and development to increase our brand portfolio or to improve business processes will result in a decrease in our financial capital in the short term, and increase our intellectual capital, however this should result in great benefits to our financial capital over the long term.
Investments to improve business processes will also increase our manufactured capital.
FUTURE OUTLOOKCOLLABORATION WITH BIG DATACollaboration is critical to maintaining close working relationships with our retailer partners. Clover embarked on an initiative, called Project Kolabo that enabled Clover to make use of big data analytics to provide insights into market dynamics, consumption trends and the needs of our retailers, allowing for more informed decisions across all levels of management.
PRODUCT INNOVATION AND TECHNOLOGYClover will continue to invest in product innovation, to develop new value-added products for integration into our brand portfolios.
INPUTS
OUTCOMES1 39 new trademarks registered
2 Clover continues to win various awards that confirms its status as a household name. Just a few of these awards:
• For the 3rd year running, Clover has won the RepTrak® most reputable company in South Africa award
• Clover fresh milk, feta cheese, yoghurt, cream and condensed milk all took 1st prize in the Kasi Star brands 2018 awards
2 Clover has established strong market share in the following categories as at 30 June 2018:
• Dairy fruit mix (83.4%)
• Feta cheese (28.2%)
• Short-life juice (52.6%)
• Fresh milk (22.9%)
3 Updated Clover website during the period
3 Improvements to various systems increasing speed and security
4 Clover leverages our market leading distribution system to provide sales and distribution services to many leading companies
5 Clover has entered into the following new product categories during this year:
• Mayonnaise (Clover Cream o’Naise)
• Ready to eat meals (Our Whistling chef range)
5 Clover’s cheese portfolio was relaunched in the current year, focusing on differentiating colour coded packaging
Clover Industries Limited Integrated Report for the year ended 30 June 2018 71
IN T
HE
SP
OT
LIGH
T
FOR
20
18IN
TR
OD
UC
ING
CLO
VE
R’S S
TO
RY
AN
ALY
SIN
G C
LOV
ER
’S V
ALU
E C
RE
AT
ION
LEA
DE
RS
HIP
R
EV
IEW
SP
ER
FOR
MA
NC
E OU
TC
OM
ES
OF T
HE S
IX C
AP
ITAL
SR
EM
UN
ER
AT
ION
R
EP
OR
TA
NN
UA
L FINA
NC
IAL
RE
SU
LTS
SH
AR
EH
OLD
ER
IN
FOR
MA
TIO
N
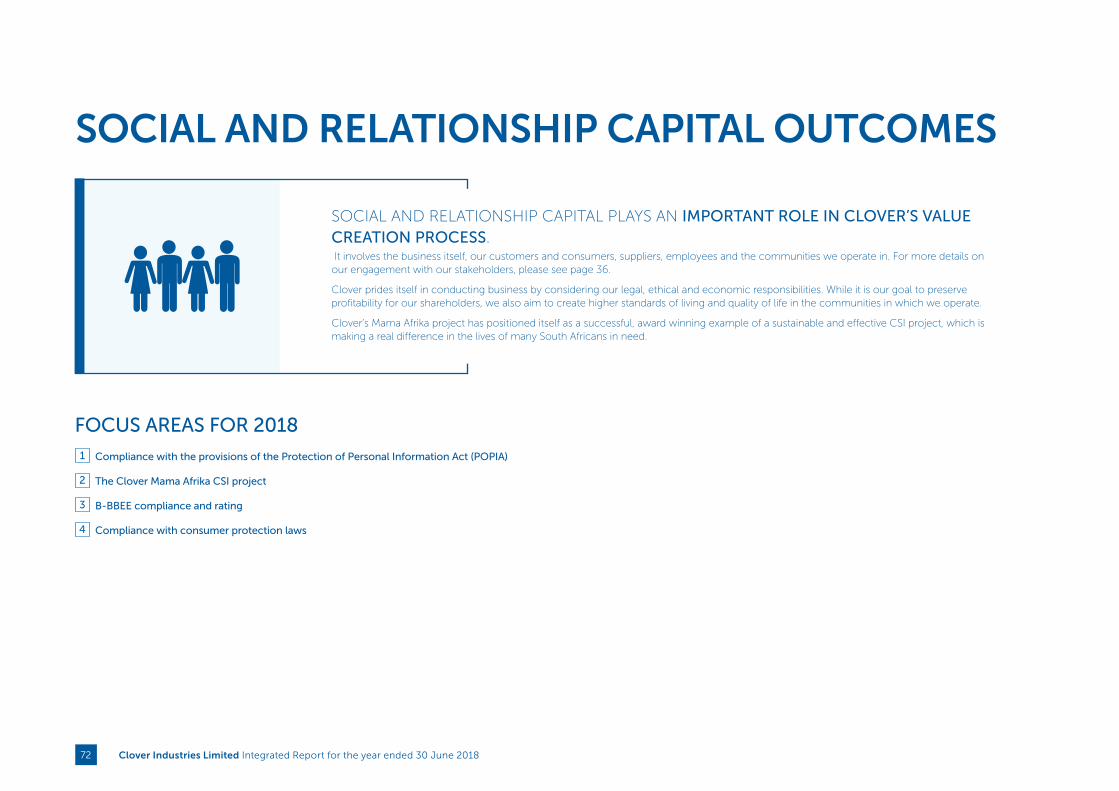
SOCIAL AND RELATIONSHIP CAPITAL OUTCOMES
FOCUS AREAS FOR 20181 Compliance with the provisions of the Protection of Personal Information Act (POPIA)
2 The Clover Mama Afrika CSI project
3 B-BBEE compliance and rating
4 Compliance with consumer protection laws
SOCIAL AND RELATIONSHIP CAPITAL PLAYS AN IMPORTANT ROLE IN CLOVER’S VALUE CREATION PROCESS. It involves the business itself, our customers and consumers, suppliers, employees and the communities we operate in. For more details on our engagement with our stakeholders, please see page 36.
Clover prides itself in conducting business by considering our legal, ethical and economic responsibilities. While it is our goal to preserve profitability for our shareholders, we also aim to create higher standards of living and quality of life in the communities in which we operate.
Clover’s Mama Afrika project has positioned itself as a successful, award winning example of a sustainable and effective CSI project, which is making a real difference in the lives of many South Africans in need.
Clover Industries Limited Integrated Report for the year ended 30 June 201872
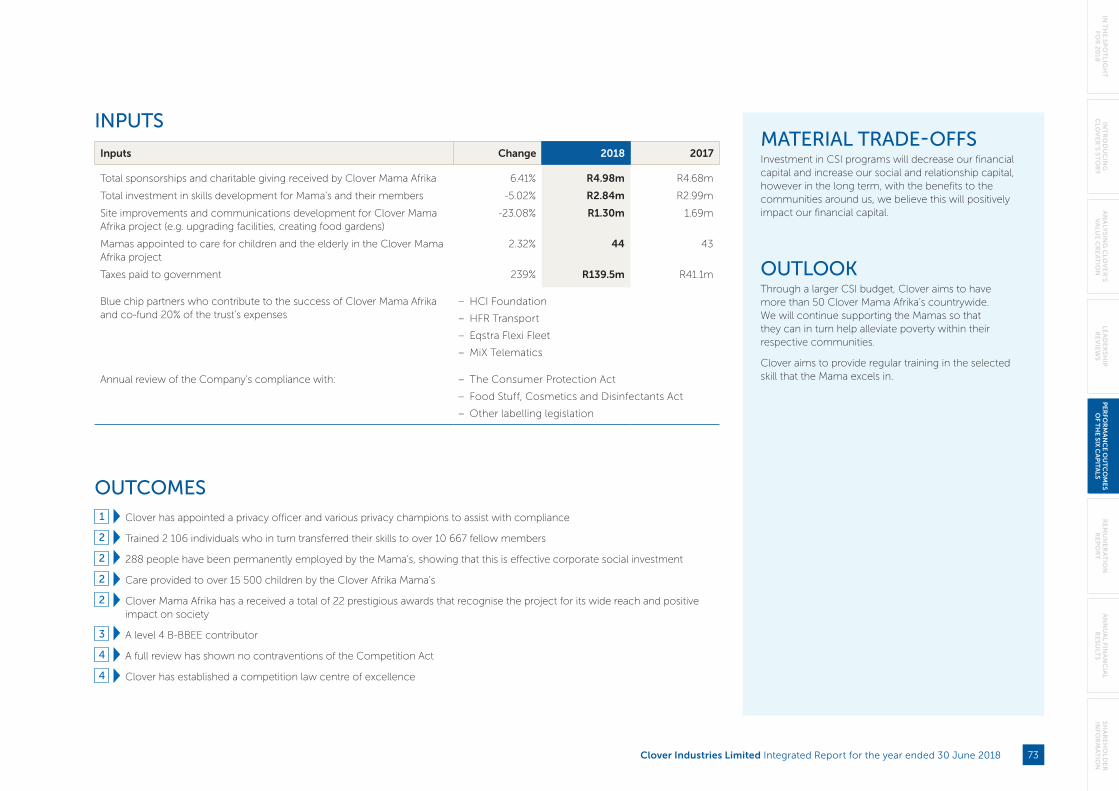
Inputs Change 2018 2017
Total sponsorships and charitable giving received by Clover Mama Afrika 6.41% R4.98m R4.68m
Total investment in skills development for Mama’s and their members -5.02% R2.84m R2.99m
Site improvements and communications development for Clover Mama Afrika project (e.g. upgrading facilities, creating food gardens)
-23.08% R1.30m 1.69m
Mamas appointed to care for children and the elderly in the Clover Mama Afrika project
2.32% 44 43
Taxes paid to government 239% R139.5m R41.1m
Blue chip partners who contribute to the success of Clover Mama Afrika and co-fund 20% of the trust’s expenses
– HCI Foundation
– HFR Transport
– Eqstra Flexi Fleet
– MiX Telematics
Annual review of the Company’s compliance with: – The Consumer Protection Act
– Food Stuff, Cosmetics and Disinfectants Act
– Other labelling legislation
MATERIAL TRADE-OFFSInvestment in CSI programs will decrease our financial capital and increase our social and relationship capital, however in the long term, with the benefits to the communities around us, we believe this will positively impact our financial capital.
OUTLOOKThrough a larger CSI budget, Clover aims to have more than 50 Clover Mama Afrika’s countrywide. We will continue supporting the Mamas so that they can in turn help alleviate poverty within their respective communities.
Clover aims to provide regular training in the selected skill that the Mama excels in.
INPUTS
OUTCOMES1 Clover has appointed a privacy officer and various privacy champions to assist with compliance
2 Trained 2 106 individuals who in turn transferred their skills to over 10 667 fellow members
2 288 people have been permanently employed by the Mama’s, showing that this is effective corporate social investment
2 Care provided to over 15 500 children by the Clover Afrika Mama’s
2 Clover Mama Afrika has a received a total of 22 prestigious awards that recognise the project for its wide reach and positive impact on society
3 A level 4 B-BBEE contributor
4 A full review has shown no contraventions of the Competition Act
4 Clover has established a competition law centre of excellence
Clover Industries Limited Integrated Report for the year ended 30 June 2018 73
IN T
HE
SP
OT
LIGH
T
FOR
20
18IN
TR
OD
UC
ING
CLO
VE
R’S S
TO
RY
AN
ALY
SIN
G C
LOV
ER
’S V
ALU
E C
RE
AT
ION
LEA
DE
RS
HIP
R
EV
IEW
SP
ER
FOR
MA
NC
E OU
TC
OM
ES
OF T
HE S
IX C
AP
ITAL
SR
EM
UN
ER
AT
ION
R
EP
OR
TA
NN
UA
L FINA
NC
IAL
RE
SU
LTS
SH
AR
EH
OLD
ER
IN
FOR
MA
TIO
N

SOCIAL AND RELATIONSHIP CAPITAL OUTCOMES continued
CASE STUDYCLOVER MAMA AFRIKA PROJECTOver the last 14 years, Clover Mama Afrika has accomplished what it set out to do from the onset and continues to contribute towards social economic development within various communities in South Africa. It is also one of the most recognised corporate social investment projects in South Africa, having won 22 prestigious awards to date.
The Clover Mama Afrika initiative will continue to provide the skills training opportunities for each operating Mama and their members. Skills training opportunities include: Bread baking, cooking and baking, sewing, quilting, food garden, small scale chicken egg farming, hairdressing and mosaic. Viable skills training includes progressive and more specialised training which helps the Mamas and their members improve on their accessible service delivery within their respective communities.
Value drivers of the Clover Mama Afrika initiative:
• Skills selection centres: Relevant, employable and marketable skills are aligned to the needs of each respective community to ensure that the centres become self-sustainable. After skills-training, Clover Mama Afrika provides start-up equipment to allow for immediate income generation and passing on of skills.
• Site improvement: Clover Mama Afrika assists communities with the repairs and renovations to basic facilities such as appropriate ablution facilities. It is important to create a safe haven for all the children in the care of a Clover Mama Afrika.
• Monitoring and evaluation: Regular monitoring and evaluation of each self-help project is implemented, which allows for the identification of strengths and weaknesses on an individual basis. Immediate support and assistance is provided where necessary.
• Partners: Clover is of the firm belief that the best way for Clover Mama Afrika to have the greatest possible impact is through partnership and collaboration with other organisations and individuals that want to embed sustainability into the fabric of South African society.
Clover Industries Limited Integrated Report for the year ended 30 June 201874

Reason for starting the bakery: “There are different reasons why I initiated or started this project of Sipho & Mary Bakery.
• Community development – to create employment and eradicate poverty.
• Food provision – food is a basic need of the society therefore I wanted to fulfill that.
• Economic development – to generate income thereby contributing to income circulation.
• Self-employment – I wanted the project to sustain my life and those closely related to me and the community at large.”
How did Clover Mama Afrika change my life? “It empowered me in self-job creation. It made me to be a socially responsible person by creating employment and fulfilling government objectives of generating income and relationship building.
Clover Mama Afrika made me to be in link with suppliers supporting my business and the community and meet business people whom I can share ideas with. I developed the spirit of humanitarian (ubuntu)- living together in harmony, peace and tranquillity.”
MEET THE MAMAS
MAMA SELESTIEN MOSES KHAYALETHU CARE CENTRE
ASHBURY
WESTERN CAPE Facts about Mama Selestien:Joined Clover Mama Afrika: April 2007 Nationality and language: South African
Afrikaans Date of birth: 11 September 1979 Marital status: Married Own children: 2 sons Children in her care: 290 Elderly in her care: 84 Outreach programme: Open door policy to
Ashbury community
Her inspiring message: “It is nice to know where you come from but it is more important to know where you are going with life. If you know how to do something properly, show others how it should be done.”
Reason for starting the centre: “I went through a lot of pain myself. I know what it was to be hungry. The feeling of ‘there’s never money’ and the rejection. I saw the same in my community and I wanted to be different. I did not want to be ordinary but extraordinary.”
How did Clover Mama Afrika change my life? “I used to be a very shy person and only spoke when spoken to – that is how I was brought up. But when you look at me now, I am a woman empowered on so many levels. I know my place and won’t let anybody walk over me. I know to speak up for myself and for those I love. I started working alone but as time passed by, I got people to help me. I know that their lives have changed so much for the better – like one of my ladies, Aunt Ommies; she used to be an alcoholic but five years later she is still sober and has her own bank account – she also had no teeth but has been able to afford false teeth. Rozelle who did the sewing, cannot thank me enough for having given her the opportunity. They know that by working at my centre, I will always give my best for them.”
MAMA MIRRIAM MAKAMU SIPHO & MARY BAKERY
TEMBISA
GAUTENG Facts about Mama Mirriam: Started her bakery: 2008 Joined Clover Mama Afrika: March 2015 Nationality and language: South African Zulu Date of birth: 21 March 1968 Marital status: Married
Clover Industries Limited Integrated Report for the year ended 30 June 2018 75
IN T
HE
SP
OT
LIGH
T
FOR
20
18IN
TR
OD
UC
ING
CLO
VE
R’S S
TO
RY
AN
ALY
SIN
G C
LOV
ER
’S V
ALU
E C
RE
AT
ION
LEA
DE
RS
HIP
R
EV
IEW
SP
ER
FOR
MA
NC
E OU
TC
OM
ES
OF T
HE S
IX C
AP
ITAL
SR
EM
UN
ER
AT
ION
R
EP
OR
TA
NN
UA
L FINA
NC
IAL
RE
SU
LTS
SH
AR
EH
OLD
ER
IN
FOR
MA
TIO
N

MEET THE MAMAS continued
Her inspiring message: “Is this not the kind of fasting I have chosen, to divide your bread with the hungry and bring the homeless poor into the house: when you see the naked to cover him, give yourself to the hungry. Isaiah 58:6-10.”
Reason for starting the centre: “The centre was formed on 3 January 1997 by myself after a painful sight of a child’s sores sitting outside the place where we used to worship. What a touching sight! Then the Lord spoke to me immediately and said, “BLESS THESE CHILDREN”! I couldn’t concentrate on the service that day. After the service I went to find out if there was any crèche or day care centre available in the area and the answer was no. The challenge was bigger than what I saw because I discovered that the greater percentages of the children in the area were loitering around the streets either abandoned, destitute or mothers were at work. Most of these children were a very moving sight, full of dry tears on their faces, some with a lot of running noses, very big tummies showing the signs of malnutrition, extremely dirty, some of them were without clothes, and on talking to some of them they were very meekly.”
How did Clover Mama Afrika change my life? “• My life has changed tremendously, people call me Mama Clover Afrika!
• Renovated my office as it was old!
• Changed the lives of 14 people who are employed at the Bakery and at the Catering Department.
• Changing lives of the community by giving them opportunities to get skills!
• Clover Mama Afrika Trust has positively impacted my life the most. I have different skills that transfer to others.
• With the help of Clover Mama Afrika Trust, my perspective on life changed.
• Thank you so much Clover Mama Afrika Trust, what you do to us will be done to you hundred folds.“
MAMA NONDUMISO MPITIMPITI STEP AHEAD EARLY CHILDHOOD DEVELOPMENT CENTRE
AMALINDA FOREST
EAST LONDON
EASTERN CAPE Facts about Mama Nondumiso: Started her centre: 1997 Joined Clover Mama Afrika: May 2016 Nationality and language: South African Xhosa Date of birth: 30 May 1963 Marital status: Married Own children: 5 children & 8 grandchildren Children in her care: 104 Outreach programme: 210 crèches & 5 foster homes with 37 orphans
Clover Industries Limited Integrated Report for the year ended 30 June 201876
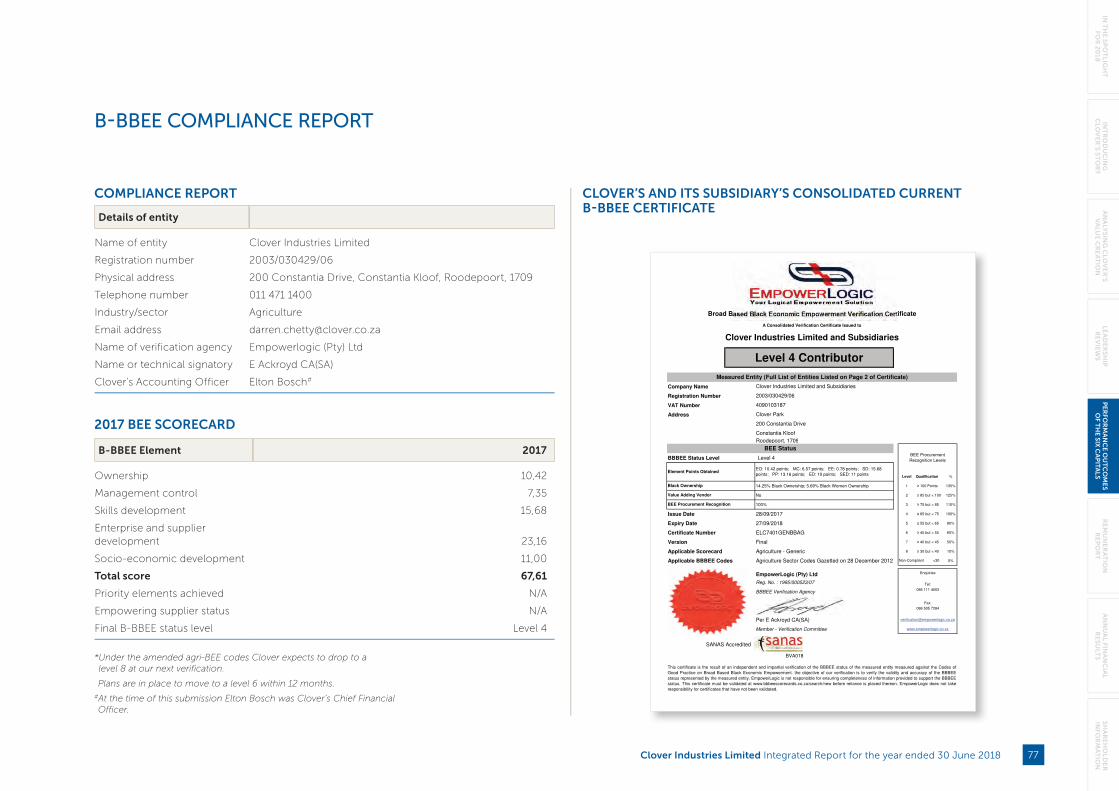
B-BBEE COMPLIANCE REPORT
CLOVER’S AND ITS SUBSIDIARY’S CONSOLIDATED CURRENT B-BBEE CERTIFICATE
Company Name
Registration Number
VAT Number
Address
BBBEE Status Level Level 4
Level Qualification %
14.25% Black Ownership; 5.69% Black Women Ownership 1 100 Points 135%
No 2 85 but < 100 125%
100% 3 75 but < 85 110%
Issue Date 28/09/2017 4 65 but < 75 100%
Expiry Date 27/09/2018 5 55 but < 65 80%
Certificate Number ELC7401GENBBAG 6 45 but < 55 60%
Version Final 7 40 but < 45 50%
Applicable Scorecard Agriculture - Generic 8 30 but < 40 10%
Applicable BBBEE Codes Agriculture Sector Codes Gazetted on 28 December 2012 0%
EmpowerLogic (Pty) Ltd
Reg. No. : 1995/000523/07
BBBEE Verification Agency
Per E Ackroyd CA(SA)
Member - Verification Committee
SANAS Accredited
BVA018
200 Constantia Drive
Constantia Kloof
BEE Status
Enquiries
Tel:
EO: 10.42 points; MC: 6.57 points; EE: 0.78 points; SD: 15.68
points; PP: 13.16 points; ED: 10 points; SED: 11 pointsElement Points Obtained
Black Ownership
Value Adding Vendor
BEE Procurement Recognition
BEE Procurement
Recognition Levels
Fax:
086 505 7284
www.empowerlogic.co.za
This certificate is the result of an independent and impartial verification of the BBBEE status of the measured entity measured against the Codes of
Good Practice on Broad Based Black Economic Empowerment. the objective of our verification is to verify the validity and accuracy of the BBBEE
status represented by the measured entity. EmpowerLogic is not responsible for ensuring completeness of information provided to support the BBBEE
status. This certificate must be validated at www.bbbeescorecards.co.za/search/new before reliance is placed thereon. EmpowerLogic does not take
responsibility for certificates that have not been validated.
Clover Industries Limited and Subsidiaries
Level 4 Contributor
086 111 4003
Non-Compliant <30
Roodepoort, 1709
Broad Based Black Economic Empowerment Verification Certificate
A Consolidated Verification Certificate Issued to
Clover Industries Limited and Subsidiaries
Measured Entity (Full List of Entities Listed on Page 2 of Certificate)
2003/030429/06
4090103187
Clover Park
Certificate Page 1 of 2
COMPLIANCE REPORT
Details of entity
Name of entity Clover Industries Limited
Registration number 2003/030429/06
Physical address 200 Constantia Drive, Constantia Kloof, Roodepoort, 1709
Telephone number 011 471 1400
Industry/sector Agriculture
Email address [email protected]
Name of verification agency Empowerlogic (Pty) Ltd
Name or technical signatory E Ackroyd CA(SA)
Clover’s Accounting Officer Elton Bosch#
2017 BEE SCORECARD
B-BBEE Element 2017
Ownership 10,42
Management control 7,35
Skills development 15,68
Enterprise and supplier development 23,16
Socio-economic development 11,00
Total score 67,61
Priority elements achieved N/A
Empowering supplier status N/A
Final B-BBEE status level Level 4
* Under the amended agri-BEE codes Clover expects to drop to a level 8 at our next verification.
Plans are in place to move to a level 6 within 12 months.#At the time of this submission Elton Bosch was Clover’s Chief Financial Officer.
Clover Industries Limited Integrated Report for the year ended 30 June 2018 77
IN T
HE
SP
OT
LIGH
T
FOR
20
18IN
TR
OD
UC
ING
CLO
VE
R’S S
TO
RY
AN
ALY
SIN
G C
LOV
ER
’S V
ALU
E C
RE
AT
ION
LEA
DE
RS
HIP
R
EV
IEW
SP
ER
FOR
MA
NC
E OU
TC
OM
ES
OF T
HE S
IX C
AP
ITAL
SR
EM
UN
ER
AT
ION
R
EP
OR
TA
NN
UA
L FINA
NC
IAL
RE
SU
LTS
SH
AR
EH
OLD
ER
IN
FOR
MA
TIO
N

FINANCIAL CAPITAL OUTCOMES
THE ROLE FINANCIAL CAPITAL PLAYS IN VALUE CREATION.Our financial capital inputs consist of cash generated by our operations, as well as debt and equity financing.
We use our financial capital to create value through investing in new product innovations, investing in our manufacturing process and investing in our people
FOCUS AREAS FOR 20181 Restore profitability to June 2016 levels
2 Optimised cashflow
3 Manage gearing levels
4 Manage capex spend
Inputs Change 2018 2017
Revenue (sale of product) 10.0% R6 435m *R5 852m
Total equity -1.9% R2 825m R2 880m
Working capital -33.9% R678m R1 026m
Net interest-bearing debt -8,9% R1 350m R1 482m
INPUTS
OUTCOMES1 Despite a headline earnings loss of R44.2m after the impairment of the
DFSA revolving credit facility, normalised headline earnings increased
224,7% to R394,9 million.
1 An increase in normalised operating profit of 94.3%
1 Normalised earnings per share increased to 210.1c
1 Interest paid decreased to R141.9m
2 Cash generated from operations increased to R1 118m
3 Net gearing level reduced to 47.8%
4 R214,7m capital expenditure on expansion or replacement of assets
MATERIAL TRADE-OFFSWe create value for all stakeholders through the use of our financial capital, which has a positive impact on all the other capitals. By using financial capital to improve production processes or invest in product innovation, we will increase our manufacturing capital and intellectual capital.
An unbalanced allocation of capital will inhibit profitable growth.
ACTIONS TO ENHANCE OUTCOMESFinance strives to bring insight to the business, educate on the financial consequences of decisions, warn of threats and alert the business to scope for opportunities and efficiencies.
* Normalised referring to the comparative numbers adjusted for the unbundling of DFSA in the current year
Clover Industries Limited Integrated Report for the year ended 30 June 201878
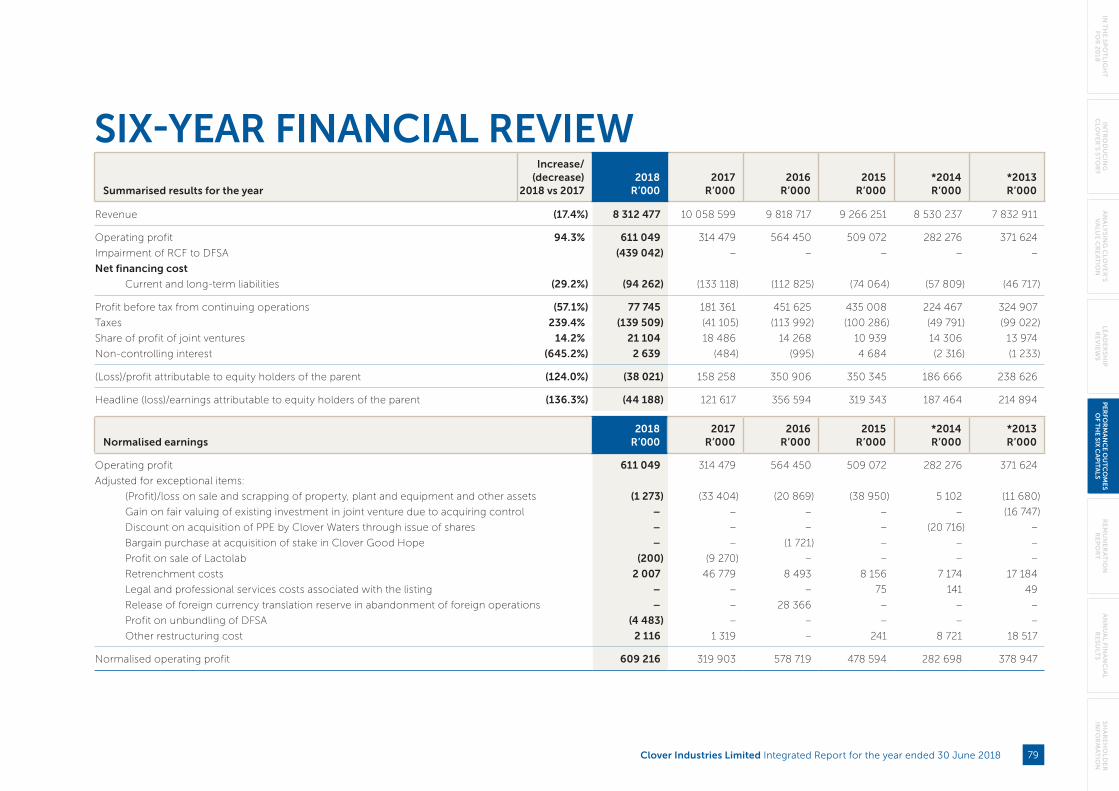
SIX-YEAR FINANCIAL REVIEWSummarised results for the year
Increase/(decrease)
2018 vs 20172018
R’0002017
R’0002016
R’0002015
R’000*2014 R’000
*2013 R’000
Revenue (17.4%) 8 312 477 10 058 599 9 818 717 9 266 251 8 530 237 7 832 911
Operating profit 94.3% 611 049 314 479 564 450 509 072 282 276 371 624
Impairment of RCF to DFSA (439 042) – – – – –
Net financing cost
Current and long-term liabilities (29.2%) (94 262) (133 118) (112 825) (74 064) (57 809) (46 717)
Profit before tax from continuing operations (57.1%) 77 745 181 361 451 625 435 008 224 467 324 907
Taxes 239.4% (139 509) (41 105) (113 992) (100 286) (49 791) (99 022)
Share of profit of joint ventures 14.2% 21 104 18 486 14 268 10 939 14 306 13 974
Non-controlling interest (645.2%) 2 639 (484) (995) 4 684 (2 316) (1 233)
(Loss)/profit attributable to equity holders of the parent (124.0%) (38 021) 158 258 350 906 350 345 186 666 238 626
Headline (loss)/earnings attributable to equity holders of the parent (136.3%) (44 188) 121 617 356 594 319 343 187 464 214 894
Normalised earnings 2018
R’0002017
R’0002016
R’0002015
R’000*2014 R’000
*2013 R’000
Operating profit 611 049 314 479 564 450 509 072 282 276 371 624
Adjusted for exceptional items:
(Profit)/loss on sale and scrapping of property, plant and equipment and other assets (1 273) (33 404) (20 869) (38 950) 5 102 (11 680)
Gain on fair valuing of existing investment in joint venture due to acquiring control – – – – – (16 747)
Discount on acquisition of PPE by Clover Waters through issue of shares – – – – (20 716) –
Bargain purchase at acquisition of stake in Clover Good Hope – – (1 721) – – –
Profit on sale of Lactolab (200) (9 270) – – – –
Retrenchment costs 2 007 46 779 8 493 8 156 7 174 17 184
Legal and professional services costs associated with the listing – – – 75 141 49
Release of foreign currency translation reserve in abandonment of foreign operations – – 28 366 – – –
Profit on unbundling of DFSA (4 483) – – – – –
Other restructuring cost 2 116 1 319 – 241 8 721 18 517
Normalised operating profit 609 216 319 903 578 719 478 594 282 698 378 947
Clover Industries Limited Integrated Report for the year ended 30 June 2018 79
IN T
HE
SP
OT
LIGH
T
FOR
20
18IN
TR
OD
UC
ING
CLO
VE
R’S S
TO
RY
AN
ALY
SIN
G C
LOV
ER
’S V
ALU
E C
RE
AT
ION
LEA
DE
RS
HIP
R
EV
IEW
SP
ER
FOR
MA
NC
E OU
TC
OM
ES
OF T
HE S
IX C
AP
ITAL
SR
EM
UN
ER
AT
ION
R
EP
OR
TA
NN
UA
L FINA
NC
IAL
RE
SU
LTS
SH
AR
EH
OLD
ER
IN
FOR
MA
TIO
N
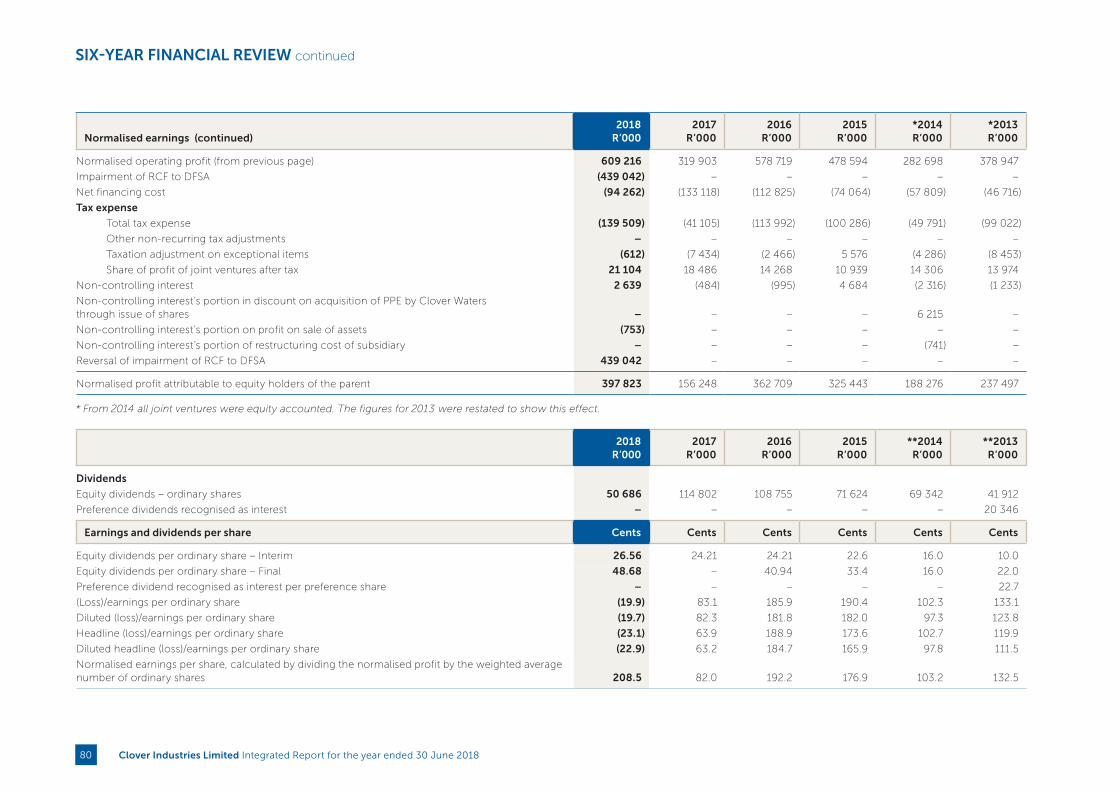
Normalised earnings (continued)2018
R’0002017
R’0002016
R’0002015
R’000*2014 R’000
*2013 R’000
Normalised operating profit (from previous page) 609 216 319 903 578 719 478 594 282 698 378 947
Impairment of RCF to DFSA (439 042) – – – – –
Net financing cost (94 262) (133 118) (112 825) (74 064) (57 809) (46 716)
Tax expense
Total tax expense (139 509) (41 105) (113 992) (100 286) (49 791) (99 022)
Other non-recurring tax adjustments – – – – – –
Taxation adjustment on exceptional items (612) (7 434) (2 466) 5 576 (4 286) (8 453)
Share of profit of joint ventures after tax 21 104 18 486 14 268 10 939 14 306 13 974
Non-controlling interest 2 639 (484) (995) 4 684 (2 316) (1 233)
Non-controlling interest’s portion in discount on acquisition of PPE by Clover Waters through issue of shares – – – – 6 215 –
Non-controlling interest’s portion on profit on sale of assets (753) – – – – –
Non-controlling interest’s portion of restructuring cost of subsidiary – – – – (741) –
Reversal of impairment of RCF to DFSA 439 042 – – – – –
Normalised profit attributable to equity holders of the parent 397 823 156 248 362 709 325 443 188 276 237 497
* From 2014 all joint ventures were equity accounted. The figures for 2013 were restated to show this effect.
2018
R’0002017
R’0002016
R’0002015
R’000**2014 R’000
**2013 R’000
Dividends
Equity dividends – ordinary shares 50 686 114 802 108 755 71 624 69 342 41 912
Preference dividends recognised as interest – – – – – 20 346
Earnings and dividends per share Cents Cents Cents Cents Cents Cents
Equity dividends per ordinary share – Interim 26.56 24.21 24.21 22.6 16.0 10.0
Equity dividends per ordinary share – Final 48.68 – 40.94 33.4 16.0 22.0
Preference dividend recognised as interest per preference share – – – – – 22.7
(Loss)/earnings per ordinary share (19.9) 83.1 185.9 190.4 102.3 133.1
Diluted (loss)/earnings per ordinary share (19.7) 82.3 181.8 182.0 97.3 123.8
Headline (loss)/earnings per ordinary share (23.1) 63.9 188.9 173.6 102.7 119.9
Diluted headline (loss)/earnings per ordinary share (22.9) 63.2 184.7 165.9 97.8 111.5
Normalised earnings per share, calculated by dividing the normalised profit by the weighted average number of ordinary shares 208.5 82.0 192.2 176.9 103.2 132.5
SIX-YEAR FINANCIAL REVIEW continued
Clover Industries Limited Integrated Report for the year ended 30 June 201880

2018 2017 2016 2015 2014 2013
Summarised statement of financial position R’000 R’000 R’000 R’000 R’000 R’000
Non-current assets 3 096 287 3 120 227 2 972 730 2 752 656 2 302 052 1 997 482
Deferred taxation asset 30 203 45 496 37 019 32 696 8 919 6 722
Current assets 3 132 124 2 882 420 2 856 294 2 689 485 2 298 621 2 413 733
Total assets 6 258 614 6 048 143 5 866 043 5 474 837 4 609 592 4 417 937
Shareholders’ funds 2 842 405 2 894 862 2 865 412 2 571 338 2 252 270 2 113 116
Non-controlling interest (17 818) (15 179) 23 305 13 510 20 471 2 309
Non-current portion of interest-bearing borrowings 665 059 767 621 931 455 681 601 662 357 666 640
Non-current portion of provisions 75 424 82 595 73 474 74 901 67 615 60 814
Non-current portion of trade and other payables 11 448 25 492 19 311 21 459 4 351 9 267
Other non-current financial liabilities 26 002 66 771 2 199 2 716 – –
Deferred taxation liability 260 309 221 065 192 358 188 253 179 023 137 313
Current portion of interest-bearing borrowings 685 691 714 304 343 015 573 576 214 495 172 646
Current liabilities excluding interest-bearing borrowings 1 710 094 1 290 612 1 415 514 1 350 199 1 209 010 1 255 832
Total equity and liabilities 6 258 614 6 048 143 5 866 043 5 474 837 4 609 592 4 417 937
Net assets 2 824 587 2 879 682 2 888 717 2 584 848 2 272 741 2 115 425
Replacement value of property, plant and machinery* 10 469 703 9 771 296 9 116 408 7 577 153 7 577 153 6 106 300
* Replacement value of property, plant and machinery is determined by an external valuator.
** From 2014 all joint ventures were equity accounted. The figures for 2013 were restated to show this effect.
A list of all definitions used in the above calculation is set out on page 198.
Number of shares in issue 2018 2017 2016 2015 *2014 *2013
Number of ordinary shares in issue at year-end 190 835 364 190 835 364 190 314 350 187 731 138 182 478 589 181 218 149
Weighted average number of ordinary shares 190 835 364 190 433 237 188 733 409 183 989 596 182 478 589 179 267 674
Weighted average number of ordinary shares for calculation of diluted earnings 192 680 105 192 358 073 193 021 978 192 466 775 191 767 408 192 750 186
Clover Industries Limited Integrated Report for the year ended 30 June 2018 81
IN T
HE
SP
OT
LIGH
T
FOR
20
18IN
TR
OD
UC
ING
CLO
VE
R’S S
TO
RY
AN
ALY
SIN
G C
LOV
ER
’S V
ALU
E C
RE
AT
ION
LEA
DE
RS
HIP
R
EV
IEW
SP
ER
FOR
MA
NC
E OU
TC
OM
ES
OF T
HE S
IX C
AP
ITAL
SR
EM
UN
ER
AT
ION
R
EP
OR
TA
NN
UA
L FINA
NC
IAL
RE
SU
LTS
SH
AR
EH
OLD
ER
IN
FOR
MA
TIO
N

Cash flow 2018
R’0002017
R’0002016
R’000 2015
R’000 2014
R’000 2013
R’000
Cash flow from operating activities 1 117 732 276 956 673 448 160 185 403 067 219 198
Cash used in investment activities (578 647) (277 708) (332 629) (556 822) (351 734) (515 811)
Cash (outflow)/inflow from financing activities (326 288) (57 982) (212 426) 218 097 (97 780) 297 159
Cash flow from operating activities per share (cents) 585,7 145,4 356,8 87,1 220,9 122,3
Ratios and returns % % % % % %
Operating profit to revenue 7.4 3.1 5.7 5.5 3.3 4.7
Normalised operating profit 7.3 3.2 5.9 5.2 3.3 4.8
Return on net assets 13.1 6.8 13.2 13.5 8.6 13.1
Return on net assets excluding exceptional items 13.1 6.9 13.5 12.7 8.6 13.4
Return on equity holders’ funds (1.3) 5.5 12.9 14.5 8.6 11.9
Return on equity holders’ funds excluding exceptional items 13.9 5.4 13.3 13.5 8.6 11.9
Gearing percentage (net of cash) 20.9 32.5 23.2 30.2 9.8 6.4
Effective tax rate 141.1 20.6 24.5 22.5 20.9 29.3
Times Times Times Times Times Times
Net asset turn 3.8 4.4 4.5 5 5.6 6.2
Current ratio 1.3 1.4 1.6 1.4 1.6 1.7
Employees’ statistics Number Number Number Number Number Number
Average number of employees 8 044 8 796 8 456 7 177 6 393 6 519
R’000 R’000 R’000 R’000 R’000 R’000
Revenue per employee 1 033.4 1 143.5 1 161.2 1 291.1 1 334.3 1 201.6
Operating profit per employee 76.0 35.8 66.8 70.9 44.2 57
Normalised operating profit 75.7 36.4 68.4 66.7 44.2 58
Average net assets per employee 354.6 327.9 323.6 338.4 343.2 307.7
* From 2014 all joint ventures were equity accounted. The figures for 2013 were restated to show this effect.
A list of all definitions used in the above calculation is set out on page 198.
SIX YEAR FINANCIAL REVIEW continued
Clover Industries Limited Integrated Report for the year ended 30 June 201882
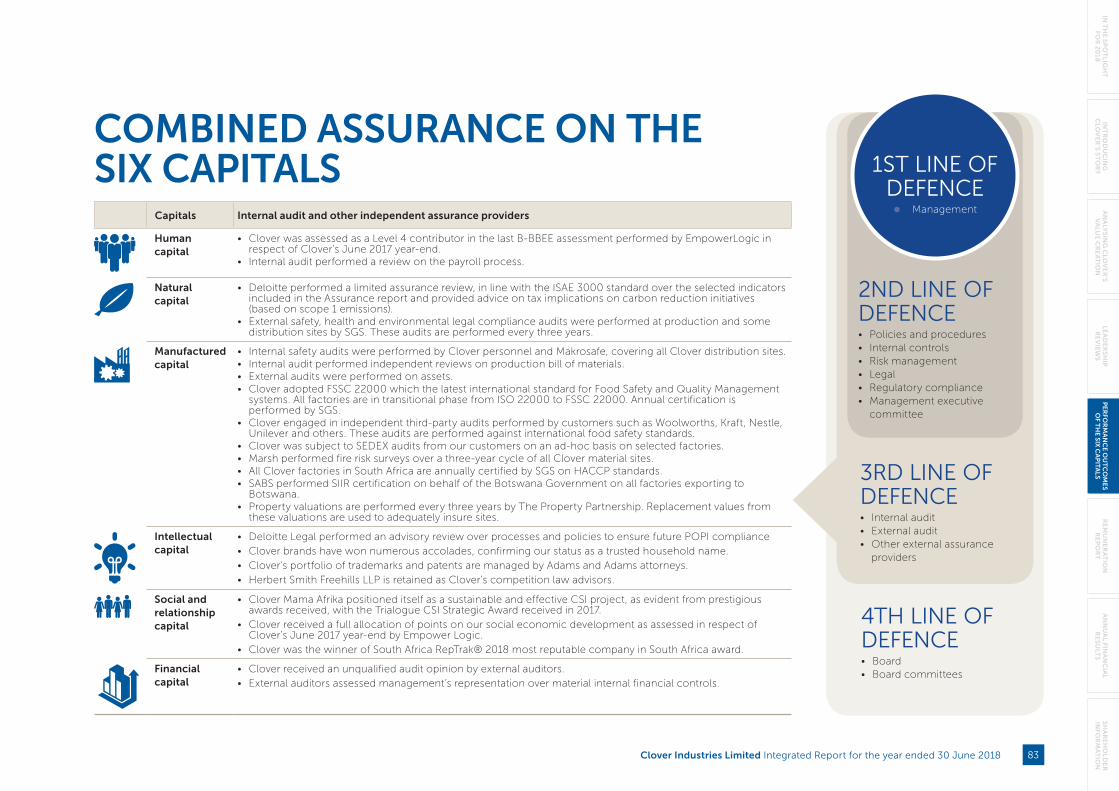
COMBINED ASSURANCE ON THE SIX CAPITALS
Capitals Internal audit and other independent assurance providers
Human capital
• Clover was assessed as a Level 4 contributor in the last B-BBEE assessment performed by EmpowerLogic in respect of Clover’s June 2017 year- end.
• Internal audit performed a review on the payroll process.
Natural capital
• Deloitte performed a limited assurance review, in line with the ISAE 3000 standard over the selected indicators included in the Assurance report and provided advice on tax implications on carbon reduction initiatives (based on scope 1 emissions).
• External safety, health and environmental legal compliance audits were performed at production and some distribution sites by SGS. These audits are performed every three years.
Manufactured capital
• Internal safety audits were performed by Clover personnel and Makrosafe, covering all Clover distribution sites. • Internal audit performed independent reviews on production bill of materials. • External audits were performed on assets. • Clover adopted FSSC 22000 which the latest international standard for Food Safety and Quality Management
systems. All factories are in transitional phase from ISO 22000 to FSSC 22000. Annual certification is performed by SGS.
• Clover engaged in independent third-party audits performed by customers such as Woolworths, Kraft, Nestle, Unilever and others. These audits are performed against international food safety standards.
• Clover was subject to SEDEX audits from our customers on an ad-hoc basis on selected factories. • Marsh performed fire risk surveys over a three-year cycle of all Clover material sites. • All Clover factories in South Africa are annually certified by SGS on HACCP standards. • SABS performed SIIR certification on behalf of the Botswana Government on all factories exporting to
Botswana. • Property valuations are performed every three years by The Property Partnership. Replacement values from
these valuations are used to adequately insure sites.
Intellectual capital
• Deloitte Legal performed an advisory review over processes and policies to ensure future POPI compliance • Clover brands have won numerous accolades, confirming our status as a trusted household name. • Clover’s portfolio of trademarks and patents are managed by Adams and Adams attorneys. • Herbert Smith Freehills LLP is retained as Clover’s competition law advisors.
Social and relationship capital
• Clover Mama Afrika positioned itself as a sustainable and effective CSI project, as evident from prestigious awards received, with the Trialogue CSI Strategic Award received in 2017.
• Clover received a full allocation of points on our social economic development as assessed in respect of Clover’s June 2017 year-end by Empower Logic.
• Clover was the winner of South Africa RepTrak® 2018 most reputable company in South Africa award.
Financial capital
• Clover received an unqualified audit opinion by external auditors. • External auditors assessed management’s representation over material internal financial controls.
2ND LINE OF DEFENCE • Policies and procedures • Internal controls • Risk management • Legal • Regulatory compliance • Management executive
committee
3RD LINE OF DEFENCE• Internal audit • External audit • Other external assurance
providers
4TH LINE OF DEFENCE• Board • Board committees
1ST LINE OF DEFENCE• Management
Clover Industries Limited Integrated Report for the year ended 30 June 2018 83
IN T
HE
SP
OT
LIGH
T
FOR
20
18IN
TR
OD
UC
ING
CLO
VE
R’S S
TO
RY
AN
ALY
SIN
G C
LOV
ER
’S V
ALU
E C
RE
AT
ION
LEA
DE
RS
HIP
R
EV
IEW
SP
ER
FOR
MA
NC
E OU
TC
OM
ES
OF T
HE S
IX C
AP
ITAL
SR
EM
UN
ER
AT
ION
R
EP
OR
TA
NN
UA
L FINA
NC
IAL
RE
SU
LTS
SH
AR
EH
OLD
ER
IN
FOR
MA
TIO
N

COMPLIANCE WITH CONSUMER RELATIONSHIP LEGISLATIONRegulation 43(5)(a)(iv) of the Companies Act (Act No 71 of 2008) requires companies to monitor their consumer relationship activities. These activities include Clover’s advertising, public relations and compliance with consumer protection laws.
We manage our consumer relations through the Clover Consumer Centre (CCC), which deals with complaints and enquiries. Clover deploys expert consultants to manage queries and protect our brands, while ensuring compliance with the Consumer Protection Act.
During the year under review, Clover received 10 360 complaints of which 1 654 were accepted and 8 706 were rejected due consumers being at fault in handling products or products being mishandled at distribution or store level.
Type of call Description
Priority 1 Critical calls
Complaint which can:
• damage the image of Clover or the Clover brand name
• threaten the health or safety of the consumer and/or Clover personnel
• hold a contamination threat to the environment
• result in a consumer suffering damages as a result of a Clover product
• possibly result in negative publication in the media
• possibly result in legal action against Clover
• possibly result in the consumer referring the matter to the Consumer Council.
Priority 2 Client requests feedback in writing
The complaint receives urgent attention and the consumer is kept informed by the head of the consumer centre until such time as the investigation is completed and complies with the requirements of the consumer.
Priority 3 Client wants to speak with manager
Complaints, which are not satisfactorily dealt with by the consultant and where the consumer insists on communicating with the head of the consumer centre, the complaint must be escalated for attention.
Priority 4 Completed by consultants Complaints are attended to by the consultant with the information at hand and no further escalation of the complaint/incident is necessary.
Priority 5 Completed by consultants These are complaints that are received through social media.
PUBLIC AND INVESTOR RELATIONS Clover’s Corporate Services Department is responsible for public relations. No Clover employee may comment or conduct any interviews with the media on behalf of Clover without the express permission of Marcelo Palmeiro, who is assisted by Company Secretary Jacques van Heerden and Prof Elain Vlok (Manager: Corporate Services) when required. With regards to investor relations, this function is delegated to Johann Vorster (Chief Executive), Frantz Scheepers (Chief Financial Officer) and Jacques van Heerden (Company Secretary), who are responsible for all investor communications. They are assisted by an independent and professional agency.
Clover Industries Limited Integrated Report for the year ended 30 June 201884

COMPLIANCE WITH CONSUMER PROTECTION LAWS Clover has taken proactive steps to be fully prepared for the application of the Consumer Protection Act (CPA). Key Clover individuals continue to attend high-level induction programmes on the potential effect of the application of the CPA. The process of establishing a CPA Centre of Excellence, which will enable Clover to maintain its commitment towards compliance with laws and regulations, is underway. The Marketing Department provides the Social and Ethics Committee with regular reports on its activities, enabling the committee to monitor compliance with the CPA. Furthermore, logs are maintained for any promotional and trade coupon promotions in line with the CPA. The Company Secretary together with the Group Manager of Product Innovation and Technology are responsible for the annual review of the Company’s compliance with regards to the following acts:
• the Consumer Protection Act
• Food stuff, Cosmetics and Disinfectants Act
• other labelling legislation
• various other acts that impact our stakeholders.
Please refer to the report on governance, risk and compliance where this has been discussed in detail on pages 24 to 31.
COMBINED ASSURANCEClover intends enhancing our qualitative and quantitative information as systems are progressively bedded down. All material risks considering the sustainability of Clover’s business model and in complying with Regulation 43 of the Companies Act, as well as King IV™, are incorporated into Clover’s risk universe. These are monitored under Clover’s risk management process as described more comprehensively in the governance section.
Furthermore, legal compliance with Regulation 43 of the Act is described fully under the Six Capitals report, while compliance with Clover’s regulatory universe is described under compliance in the governance section. All legal compliance falls under the supervision of the Company Secretary who ensures that the full regulatory universe is monitored. During the year under review, the Social and Ethics Committee monitored and addressed all levels of assurance as depicted on the table on page 83. In the opinion of the Social and Ethics Committee, based on the information provided to it, the statements made in our report, fairly reflect Clover’s standing.
REPORT OF THE SOCIAL AND ETHICS COMMITTEEThe Social and Ethics Committee is a committee of the Board of Clover. Its membership and functions are set out on page 22. As required by the Companies Act of 2008, the committee has reviewed the information reported by management in the Report on the Six Capitals. In the opinion of the committee the report fairly sets out Clover’s standing in terms of the matters specified in Regulation 43 to the Companies Act 2008 in respect of the year ended 30 June 2018 and will be presented to shareholders at the forthcoming annual general meeting.
Ms Neo Mokhesi
Chairperson: Social and Ethics Committee
26 September 2018
Clover Industries Limited Integrated Report for the year ended 30 June 2018 85
IN T
HE
SP
OT
LIGH
T
FOR
20
18IN
TR
OD
UC
ING
CLO
VE
R’S S
TO
RY
AN
ALY
SIN
G C
LOV
ER
’S V
ALU
E C
RE
AT
ION
LEA
DE
RS
HIP
R
EV
IEW
SP
ER
FOR
MA
NC
E OU
TC
OM
ES
OF T
HE S
IX C
AP
ITAL
SR
EM
UN
ER
AT
ION
R
EP
OR
TA
NN
UA
L FINA
NC
IAL
RE
SU
LTS
SH
AR
EH
OLD
ER
IN
FOR
MA
TIO
N

PROCESSED CHEESE MARKET SHARE
5,6%FOR THE PERIOD
CUSTARD MARKET SHARE
11,2%AT 30 JUNE 2018
FETA CHEESE MARKET SHARE
3,3%FOR THE PERIOD
Clover Industries Limited Integrated Report for the year ended 30 June 201886
REMUNERATIONREPORT
Clover Industries Limited Integrated Report for the year ended 30 June 2018 87
IN T
HE
SP
OT
LIGH
T
FOR
20
18IN
TR
OD
UC
ING
CLO
VE
R’S S
TO
RY
AN
ALY
SIN
G C
LOV
ER
’S V
ALU
E C
RE
AT
ION
LEA
DE
RS
HIP
R
EV
IEW
SP
ER
FOR
MA
NC
E O
UT
CO
ME
S O
F TH
E S
IX C
AP
ITA
LS
RE
MU
NE
RA
TIO
NR
EP
OR
TA
NN
UA
L FINA
NC
IAL
RE
SU
LTS
SH
AR
EH
OLD
ER
IN
FOR
MA
TIO
N
LETTER TO SHAREHOLDERSINTRODUCTIONOn behalf of the Remuneration Committee and the board, I am pleased to present the report on remuneration and remuneration policy for 2018.
KING IV™This report on remuneration (“Report”) applies to the period 1 July 2017 to 30 June 2018 and complies with the provisions of King IV™ (copyright and trademarks are owned by the Institute of Directors in Southern Africa NPC and all of its rights are reserved).
As such, the Report will contain three major sections:
• Background statement
• Remuneration policy
• Implementation report
The Report should be read in conjunction with note 32 to the annual financial statements which forms part of this integrated report and contains a number of statutory disclosures on Clover’s remuneration.
COMPANY PERFORMANCE AND SALARY REVIEWDespite a constrained and – in some instances worsening – macro environment impacted by increased unemployment, a contraction in GDP, rand volatility and ongoing price inflation driven by fuel and electricity increases, Clover produced record breaking financial results - on a normalised basis - during the year under review.
The provision for the impairment of the revolving credit facility to DFSA significantly impacted these results.
The Group’s strategy to unbundle the volume-driven side of Clover’s business and grow branded, value added products has nonetheless gained significant traction and continues to be implemented in a responsible and sustainable way while efficiency improvements remain a key management priority into the future.
REPORT ON REMUNERATION
Considering the Group’s overall performance, and the executive, management and staff’s ability to adjust to continuous improvements and innovations, the Remuneration Committee mandated PricewaterhouseCoopers to conduct an enterprise-wide remuneration benchmarking study during the reporting period.
Based on the findings of this report, staff in the Paterson C to E Bands were awarded individual increases in line with the benchmark with the overall target of limiting the total increase in the salary bill to 5% and taking into consideration that a potential higher percentage settlement will be reached with trade unions for Paterson A and B Band employees.
The Remuneration Committee subsequently mandated PricewaterhouseCoopers to conduct a formal benchmarking of executive remuneration (Paterson Band F) against a pre-selected peer group. The benchmarking report indicated that Clover’s executives’ guaranteed remuneration is at the upper quartile of the peer-group, with some executives earning at the median.
SHORT-TERM INCENTIVE (STI) BONUSESExecutives’ participation in STIs are dependent on profit growth and personal performance measures. The remuneration policy on page 91 sets out the ratios that determine the level of participation.
Executives’ individual key performance indicators are approved annually by the Remuneration Committee and determined through the usual performance management process allocated to all qualifying staff in Paterson C5 to E band.
Performance indicators include areas such as investor relations, employment equity, successful completion of capital projects, mergers and acquisitions and rest of Africa, as well as the optimisation of the brand portfolio and increase of market shares through sales and distribution achievements.
In the prior financial year, the relevant profit targets to qualify for STI bonuses were not achieved and subsequently, no STI bonuses were paid out. In collaboration with the executives and considering the financial performance of the Group at the time, the Remuneration Committee also decided to not pay STI bonuses linked to key individual performance indicators, notwithstanding that a substantial part of these indicators were met during the prior year.
In the year under review executives did not qualify for STI bonuses relating to financial performance targets of the Group, but STI bonuses linked to key individual performance targets were met and paid.
STIs are self-funded since all bonuses are budgeted for in full before the profit target is approved annually by the Remuneration Committee.
LONG-TERM INCENTIVE (LTI) BONUSESVesting of the 7th allocation of Share Appreciation Rights (SAR)Individual performanceThe Remuneration Committee, with input from the Chief Executive, sets individual targets for each individual. Full vesting of the individual performance portion of the 7th allocation of SAR has been achieved for the year under review.
Financial performanceThe Remuneration Committee can confirm that the financial performance conditions relating to the vesting of the 7th allocation of SAR has not been met and that subsequently no vesting will take place. It should be noted that the financial performance conditions relating to the vesting of the 6th allocation of SAR was also not met previously. Thus, no vesting took place in the past two years.
Clover Industries Limited Integrated Report for the year ended 30 June 201888
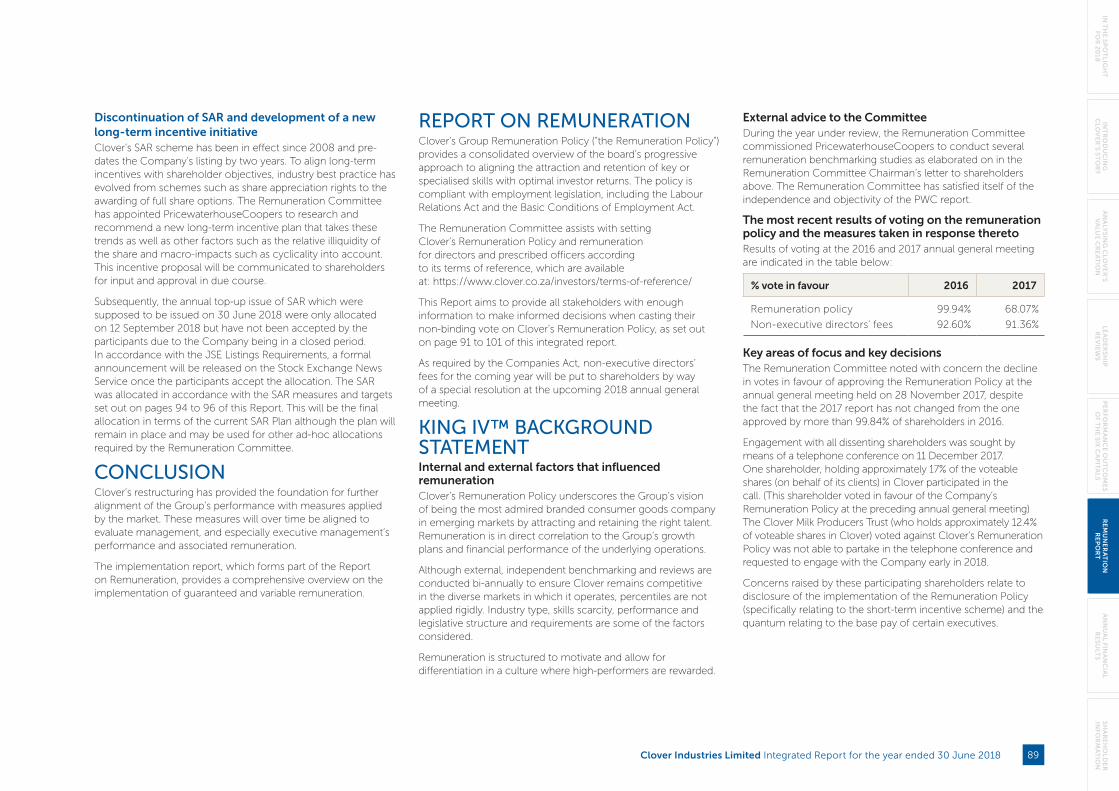
Discontinuation of SAR and development of a new long-term incentive initiativeClover’s SAR scheme has been in effect since 2008 and pre-dates the Company’s listing by two years. To align long-term incentives with shareholder objectives, industry best practice has evolved from schemes such as share appreciation rights to the awarding of full share options. The Remuneration Committee has appointed PricewaterhouseCoopers to research and recommend a new long-term incentive plan that takes these trends as well as other factors such as the relative illiquidity of the share and macro-impacts such as cyclicality into account. This incentive proposal will be communicated to shareholders for input and approval in due course.
Subsequently, the annual top-up issue of SAR which were supposed to be issued on 30 June 2018 were only allocated on 12 September 2018 but have not been accepted by the participants due to the Company being in a closed period. In accordance with the JSE Listings Requirements, a formal announcement will be released on the Stock Exchange News Service once the participants accept the allocation. The SAR was allocated in accordance with the SAR measures and targets set out on pages 94 to 96 of this Report. This will be the final allocation in terms of the current SAR Plan although the plan will remain in place and may be used for other ad-hoc allocations required by the Remuneration Committee.
CONCLUSIONClover’s restructuring has provided the foundation for further alignment of the Group’s performance with measures applied by the market. These measures will over time be aligned to evaluate management, and especially executive management’s performance and associated remuneration.
The implementation report, which forms part of the Report on Remuneration, provides a comprehensive overview on the implementation of guaranteed and variable remuneration.
REPORT ON REMUNERATIONClover’s Group Remuneration Policy (“the Remuneration Policy”) provides a consolidated overview of the board’s progressive approach to aligning the attraction and retention of key or specialised skills with optimal investor returns. The policy is compliant with employment legislation, including the Labour Relations Act and the Basic Conditions of Employment Act.
The Remuneration Committee assists with setting Clover’s Remuneration Policy and remuneration for directors and prescribed officers according to its terms of reference, which are available at: https://www.clover.co.za/investors/terms-of-reference/
This Report aims to provide all stakeholders with enough information to make informed decisions when casting their non-binding vote on Clover’s Remuneration Policy, as set out on page 91 to 101 of this integrated report.
As required by the Companies Act, non-executive directors’ fees for the coming year will be put to shareholders by way of a special resolution at the upcoming 2018 annual general meeting.
KING IV™ BACKGROUND STATEMENTInternal and external factors that influenced remunerationClover’s Remuneration Policy underscores the Group’s vision of being the most admired branded consumer goods company in emerging markets by attracting and retaining the right talent. Remuneration is in direct correlation to the Group’s growth plans and financial performance of the underlying operations.
Although external, independent benchmarking and reviews are conducted bi-annually to ensure Clover remains competitive in the diverse markets in which it operates, percentiles are not applied rigidly. Industry type, skills scarcity, performance and legislative structure and requirements are some of the factors considered.
Remuneration is structured to motivate and allow for differentiation in a culture where high-performers are rewarded.
External advice to the CommitteeDuring the year under review, the Remuneration Committee commissioned PricewaterhouseCoopers to conduct several remuneration benchmarking studies as elaborated on in the Remuneration Committee Chairman’s letter to shareholders above. The Remuneration Committee has satisfied itself of the independence and objectivity of the PWC report.
The most recent results of voting on the remuneration policy and the measures taken in response theretoResults of voting at the 2016 and 2017 annual general meeting are indicated in the table below:
% vote in favour 2016 2017
Remuneration policy 99.94% 68.07%
Non-executive directors’ fees 92.60% 91.36%
Key areas of focus and key decisionsThe Remuneration Committee noted with concern the decline in votes in favour of approving the Remuneration Policy at the annual general meeting held on 28 November 2017, despite the fact that the 2017 report has not changed from the one approved by more than 99.84% of shareholders in 2016.
Engagement with all dissenting shareholders was sought by means of a telephone conference on 11 December 2017. One shareholder, holding approximately 17% of the voteable shares (on behalf of its clients) in Clover participated in the call. (This shareholder voted in favour of the Company’s Remuneration Policy at the preceding annual general meeting) The Clover Milk Producers Trust (who holds approximately 12.4% of voteable shares in Clover) voted against Clover’s Remuneration Policy was not able to partake in the telephone conference and requested to engage with the Company early in 2018.
Concerns raised by these participating shareholders relate to disclosure of the implementation of the Remuneration Policy (specifically relating to the short-term incentive scheme) and the quantum relating to the base pay of certain executives.
Clover Industries Limited Integrated Report for the year ended 30 June 2018 89
IN T
HE
SP
OT
LIGH
T
FOR
20
18IN
TR
OD
UC
ING
CLO
VE
R’S S
TO
RY
AN
ALY
SIN
G C
LOV
ER
’S V
ALU
E C
RE
AT
ION
LEA
DE
RS
HIP
R
EV
IEW
SP
ER
FOR
MA
NC
E O
UT
CO
ME
S O
F TH
E S
IX C
AP
ITA
LS
RE
MU
NE
RA
TIO
N
RE
PO
RT
AN
NU
AL FIN
AN
CIA
L R
ES
ULT
SS
HA
RE
HO
LDE
R
INFO
RM
AT
ION
These concerns were formally tabled and considered at the Remuneration Committee meetings held on 14 February 2018 and 15 May 2018 respectively. In view of the independent benchmark study conducted by PricewaterhouseCoopers (referenced above in the Remuneration Committee Chairman’s letter to shareholders) the Remuneration Committee concluded that executive remuneration to be fair and reasonable and in line with the Company’s peer group.
Apart from the above, the Remuneration Committee conducted the following activities during the year:
• reviewed the remuneration packages of the executive directors and other executives;
• reviewed performance targets applicable to the short-term incentives;
• established the future performance targets applicable to the short-term incentives;
• considered management’s recommendations for non-executive directors’ fees and the fees for the board sub-committees before recommending to the board and then to shareholders for approval;
• reviewed vesting of long-term incentives; and
• reviewed salary increases for executive directors and other executives.
Delivery against objectivesIn the context of historic and ongoing engagement with shareholders and the resolution of legacy issues that resulted amendments to Clover’s Remuneration Policy in 2015, the Remuneration Committee is satisfied that the current Remuneration Policy delivers against the Group’s objectives of attracting and retaining scarce or specialist skills whilst optimising shareholder returns.
Notwithstanding functionality and compliance, the Remuneration Committee reiterates that its approach to remuneration is progressive and it will continue to further enhance the balance through best practice.
Future focus areasThe Remuneration Committee, in consultation with PricewaterhouseCoopers is currently developing a new long-term incentive scheme that will replace the current SARs scheme. This scheme will be presented to shareholders for input and approval in due course.
REPORT ON REMUNERATION continued
Clover Industries Limited Integrated Report for the year ended 30 June 201890
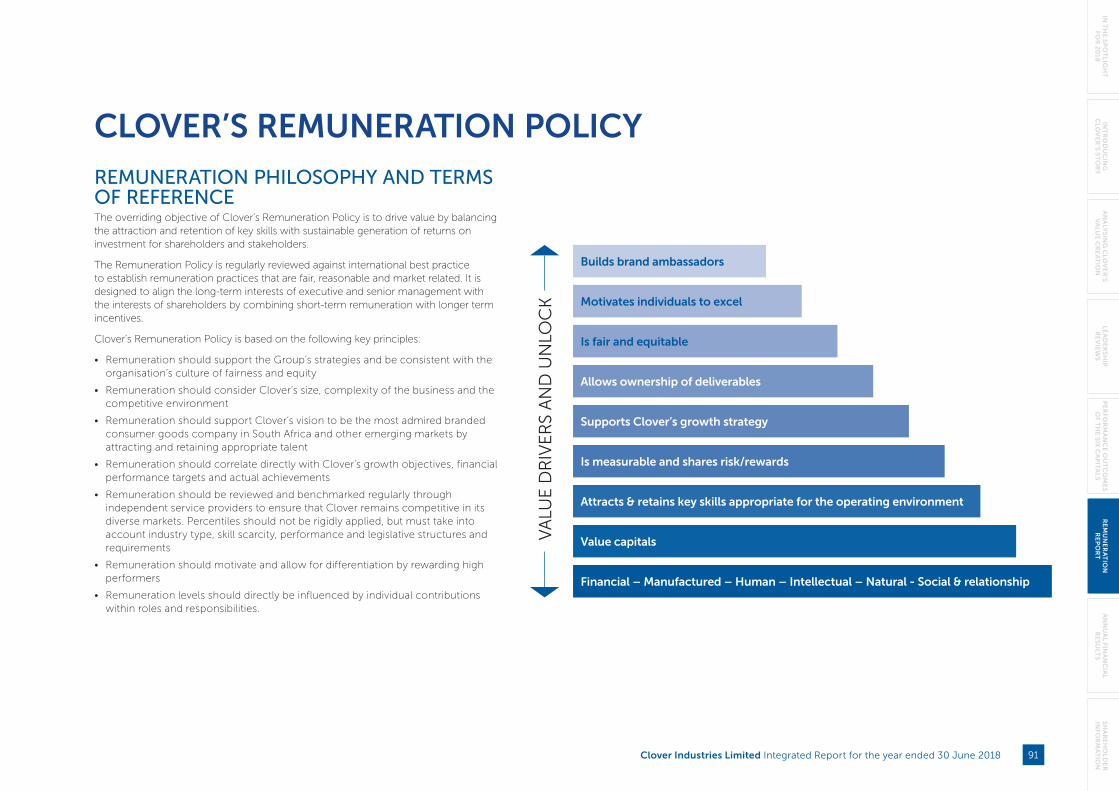
CLOVER’S REMUNERATION POLICY
REMUNERATION PHILOSOPHY AND TERMS OF REFERENCEThe overriding objective of Clover’s Remuneration Policy is to drive value by balancing the attraction and retention of key skills with sustainable generation of returns on investment for shareholders and stakeholders.
The Remuneration Policy is regularly reviewed against international best practice to establish remuneration practices that are fair, reasonable and market related. It is designed to align the long-term interests of executive and senior management with the interests of shareholders by combining short-term remuneration with longer term incentives.
Clover’s Remuneration Policy is based on the following key principles:
• Remuneration should support the Group’s strategies and be consistent with the organisation’s culture of fairness and equity
• Remuneration should consider Clover’s size, complexity of the business and the competitive environment
• Remuneration should support Clover’s vision to be the most admired branded consumer goods company in South Africa and other emerging markets by attracting and retaining appropriate talent
• Remuneration should correlate directly with Clover’s growth objectives, financial performance targets and actual achievements
• Remuneration should be reviewed and benchmarked regularly through independent service providers to ensure that Clover remains competitive in its diverse markets. Percentiles should not be rigidly applied, but must take into account industry type, skill scarcity, performance and legislative structures and requirements
• Remuneration should motivate and allow for differentiation by rewarding high performers
• Remuneration levels should directly be influenced by individual contributions within roles and responsibilities.
VA
LUE
DR
IVE
RS
AN
D U
NLO
CK
Financial – Manufactured – Human – Intellectual – Natural - Social & relationship
Value capitals
Attracts & retains key skills appropriate for the operating environment
Is measurable and shares risk/rewards
Supports Clover’s growth strategy
Allows ownership of deliverables
Is fair and equitable
Motivates individuals to excel
Builds brand ambassadors
Clover Industries Limited Integrated Report for the year ended 30 June 2018 91
IN T
HE
SP
OT
LIGH
T
FOR
20
18IN
TR
OD
UC
ING
CLO
VE
R’S S
TO
RY
AN
ALY
SIN
G C
LOV
ER
’S V
ALU
E C
RE
AT
ION
LEA
DE
RS
HIP
R
EV
IEW
SP
ER
FOR
MA
NC
E O
UT
CO
ME
S O
F TH
E S
IX C
AP
ITA
LS
RE
MU
NE
RA
TIO
N
RE
PO
RT
AN
NU
AL FIN
AN
CIA
L R
ES
ULT
SS
HA
RE
HO
LDE
R
INFO
RM
AT
ION
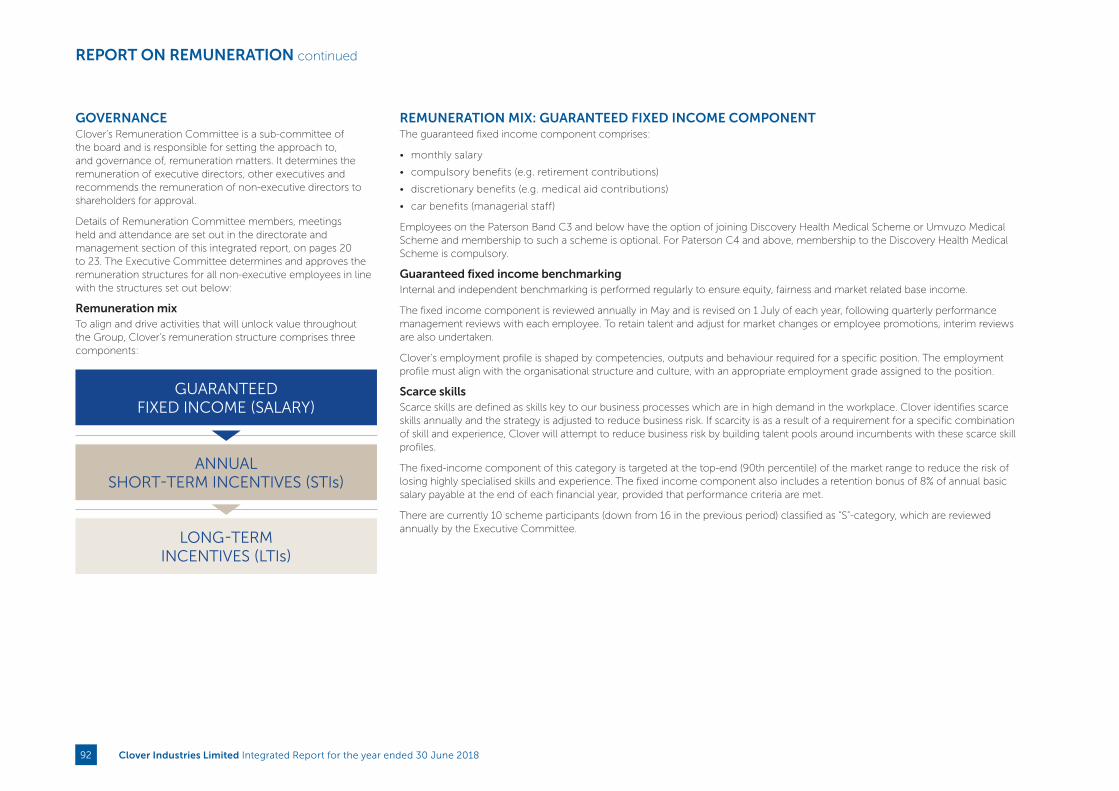
GOVERNANCEClover’s Remuneration Committee is a sub-committee of the board and is responsible for setting the approach to, and governance of, remuneration matters. It determines the remuneration of executive directors, other executives and recommends the remuneration of non-executive directors to shareholders for approval.
Details of Remuneration Committee members, meetings held and attendance are set out in the directorate and management section of this integrated report, on pages 20 to 23. The Executive Committee determines and approves the remuneration structures for all non-executive employees in line with the structures set out below:
Remuneration mixTo align and drive activities that will unlock value throughout the Group, Clover’s remuneration structure comprises three components:
REMUNERATION MIX: GUARANTEED FIXED INCOME COMPONENTThe guaranteed fixed income component comprises:
• monthly salary
• compulsory benefits (e.g. retirement contributions)
• discretionary benefits (e.g. medical aid contributions)
• car benefits (managerial staff)
Employees on the Paterson Band C3 and below have the option of joining Discovery Health Medical Scheme or Umvuzo Medical Scheme and membership to such a scheme is optional. For Paterson C4 and above, membership to the Discovery Health Medical Scheme is compulsory.
Guaranteed fixed income benchmarkingInternal and independent benchmarking is performed regularly to ensure equity, fairness and market related base income.
The fixed income component is reviewed annually in May and is revised on 1 July of each year, following quarterly performance management reviews with each employee. To retain talent and adjust for market changes or employee promotions, interim reviews are also undertaken.
Clover’s employment profile is shaped by competencies, outputs and behaviour required for a specific position. The employment profile must align with the organisational structure and culture, with an appropriate employment grade assigned to the position.
Scarce skillsScarce skills are defined as skills key to our business processes which are in high demand in the workplace. Clover identifies scarce skills annually and the strategy is adjusted to reduce business risk. If scarcity is as a result of a requirement for a specific combination of skill and experience, Clover will attempt to reduce business risk by building talent pools around incumbents with these scarce skill profiles.
The fixed-income component of this category is targeted at the top-end (90th percentile) of the market range to reduce the risk of losing highly specialised skills and experience. The fixed income component also includes a retention bonus of 8% of annual basic salary payable at the end of each financial year, provided that performance criteria are met.
There are currently 10 scheme participants (down from 16 in the previous period) classified as “S”-category, which are reviewed annually by the Executive Committee.
ANNUAL SHORT-TERM INCENTIVES (STIs)
LONG-TERM INCENTIVES (LTIs)
GUARANTEED FIXED INCOME (SALARY)
REPORT ON REMUNERATION continued
Clover Industries Limited Integrated Report for the year ended 30 June 201892

PATERSON GRADES IN RELATION TO FIXED INCOME, STIs AND LTIs
Paterson Band Guaranteed fixed income Short-term incentive Long-term incentive
B5 and lower Base pay and benefits: 13th cheque Not applicable Not applicable
C1 to C5 Base pay and benefits: 13th cheque Merit bonus based on formal performance review. Short-term incentive scheme for selected Paterson Grade C5 employees
Not applicable
D1 to D5 Base pay and benefits Short-term incentive scheme Long-term incentive scheme for selected employees (deferred profit share)
E Base pay and benefits Short-term incentive scheme Long-term incentive scheme (deferred profit share)
F Base pay and benefits Short-term incentive scheme Share appreciation rights scheme
REMUNERATION MIX: ANNUAL SHORT-TERM INCENTIVE COMPONENT: CATALYST FOR ANNUAL PERFORMANCE
Paterson Band
Individual performance
weighting (%)Group profit
weighting (%)
Individual performance
cap (%)Group profit
cap (%)
Entitlement (months’
base salary)#
Max entitlement (months’
base salary)# Profit target
C5 66.7 33.3 100 200 1.5 2 Operating profit
D1 – D2 50 50 100 150 2 2.5 Operating profit
D3 – D5 33.3 66.7 100 175 3 4.5 Operating profit
E* 30 70 100 171 5 7.5 Operating profit
Other executives (F) ¥ 30 70 100 171 10 15 Normalised attributable profit
Chief Financial Officer (F) 30 70 100 171 10 15 Normalised attributable profit
Chief Executive (F) 30 70 100 171 12 18 Normalised attributable profit
* As example: If a staff member on Paterson E Band achieves a 100% individual performance bonus and a 171% Group profit bonus (maximum bonus), the employee will be entitled to 7.5 months’ additional base salary in bonusses.
# For Paterson Band D1 to D5, the base salary consists of monthly basic salary. For Paterson Band E, the base salary consists of monthly basic salary, plus 22% car allowance, plus 10% pension fund contribution. For Paterson Band F, the base salary consists of total monthly guaranteed fixed income.
¥ Marcelo Palmeiro’s STI structure differs from the above, as agreed to between him and the Company.
Clover Industries Limited Integrated Report for the year ended 30 June 2018 93
IN T
HE
SP
OT
LIGH
T
FOR
20
18IN
TR
OD
UC
ING
CLO
VE
R’S S
TO
RY
AN
ALY
SIN
G C
LOV
ER
’S V
ALU
E C
RE
AT
ION
LEA
DE
RS
HIP
R
EV
IEW
SP
ER
FOR
MA
NC
E O
UT
CO
ME
S O
F TH
E S
IX C
AP
ITA
LS
RE
MU
NE
RA
TIO
N
RE
PO
RT
AN
NU
AL FIN
AN
CIA
L R
ES
ULT
SS
HA
RE
HO
LDE
R
INFO
RM
AT
ION
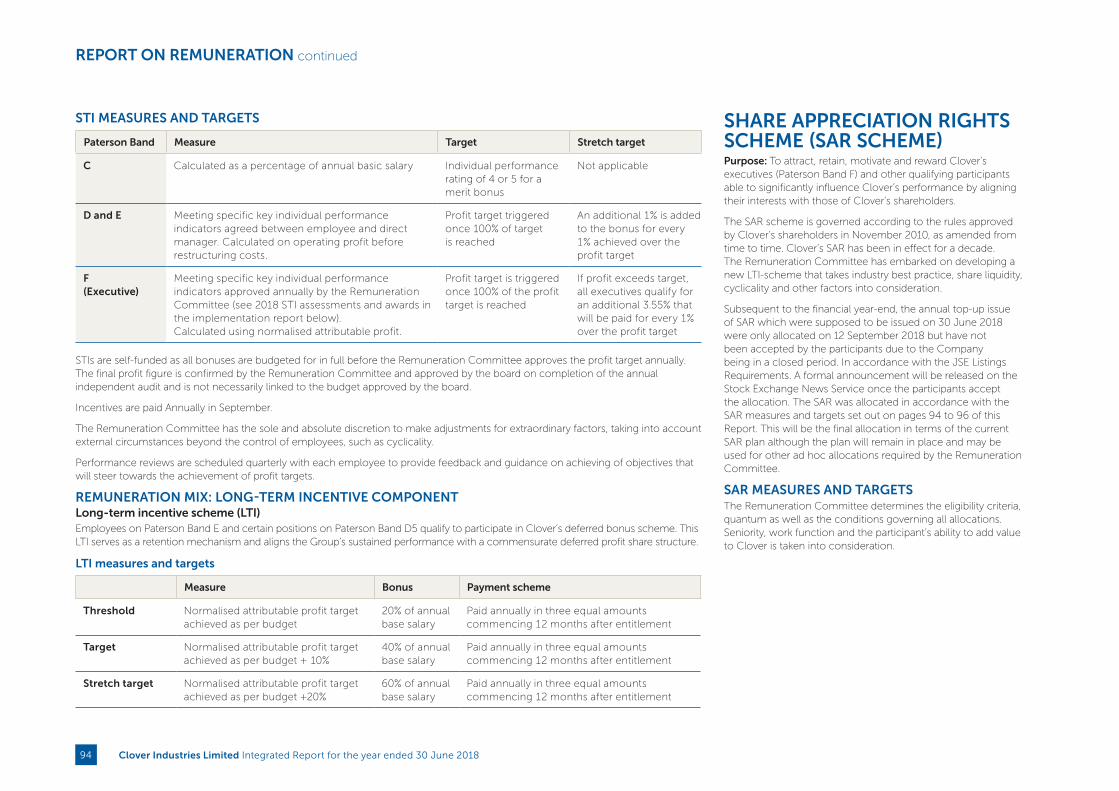
STI MEASURES AND TARGETS
Paterson Band Measure Target Stretch target
C Calculated as a percentage of annual basic salary Individual performance rating of 4 or 5 for a merit bonus
Not applicable
D and E Meeting specific key individual performance indicators agreed between employee and direct manager. Calculated on operating profit before restructuring costs.
Profit target triggered once 100% of target is reached
An additional 1% is added to the bonus for every 1% achieved over the profit target
F (Executive)
Meeting specific key individual performance indicators approved annually by the Remuneration Committee (see 2018 STI assessments and awards in the implementation report below).Calculated using normalised attributable profit.
Profit target is triggered once 100% of the profit target is reached
If profit exceeds target, all executives qualify for an additional 3.55% that will be paid for every 1% over the profit target
STIs are self-funded as all bonuses are budgeted for in full before the Remuneration Committee approves the profit target annually. The final profit figure is confirmed by the Remuneration Committee and approved by the board on completion of the annual independent audit and is not necessarily linked to the budget approved by the board.
Incentives are paid Annually in September.
The Remuneration Committee has the sole and absolute discretion to make adjustments for extraordinary factors, taking into account external circumstances beyond the control of employees, such as cyclicality.
Performance reviews are scheduled quarterly with each employee to provide feedback and guidance on achieving of objectives that will steer towards the achievement of profit targets.
REMUNERATION MIX: LONG-TERM INCENTIVE COMPONENTLong-term incentive scheme (LTI)Employees on Paterson Band E and certain positions on Paterson Band D5 qualify to participate in Clover’s deferred bonus scheme. This LTI serves as a retention mechanism and aligns the Group’s sustained performance with a commensurate deferred profit share structure.
LTI measures and targets
Measure Bonus Payment scheme
Threshold Normalised attributable profit target achieved as per budget
20% of annual base salary
Paid annually in three equal amounts commencing 12 months after entitlement
Target Normalised attributable profit target achieved as per budget + 10%
40% of annual base salary
Paid annually in three equal amounts commencing 12 months after entitlement
Stretch target Normalised attributable profit target achieved as per budget +20%
60% of annual base salary
Paid annually in three equal amounts commencing 12 months after entitlement
REPORT ON REMUNERATION continued
SHARE APPRECIATION RIGHTS SCHEME (SAR SCHEME)Purpose: To attract, retain, motivate and reward Clover’s executives (Paterson Band F) and other qualifying participants able to significantly influence Clover’s performance by aligning their interests with those of Clover’s shareholders.
The SAR scheme is governed according to the rules approved by Clover’s shareholders in November 2010, as amended from time to time. Clover’s SAR has been in effect for a decade. The Remuneration Committee has embarked on developing a new LTI-scheme that takes industry best practice, share liquidity, cyclicality and other factors into consideration.
Subsequent to the financial year-end, the annual top-up issue of SAR which were supposed to be issued on 30 June 2018 were only allocated on 12 September 2018 but have not been accepted by the participants due to the Company being in a closed period. In accordance with the JSE Listings Requirements. A formal announcement will be released on the Stock Exchange News Service once the participants accept the allocation. The SAR was allocated in accordance with the SAR measures and targets set out on pages 94 to 96 of this Report. This will be the final allocation in terms of the current SAR plan although the plan will remain in place and may be used for other ad hoc allocations required by the Remuneration Committee.
SAR MEASURES AND TARGETSThe Remuneration Committee determines the eligibility criteria, quantum as well as the conditions governing all allocations. Seniority, work function and the participant’s ability to add value to Clover is taken into consideration.
Clover Industries Limited Integrated Report for the year ended 30 June 201894
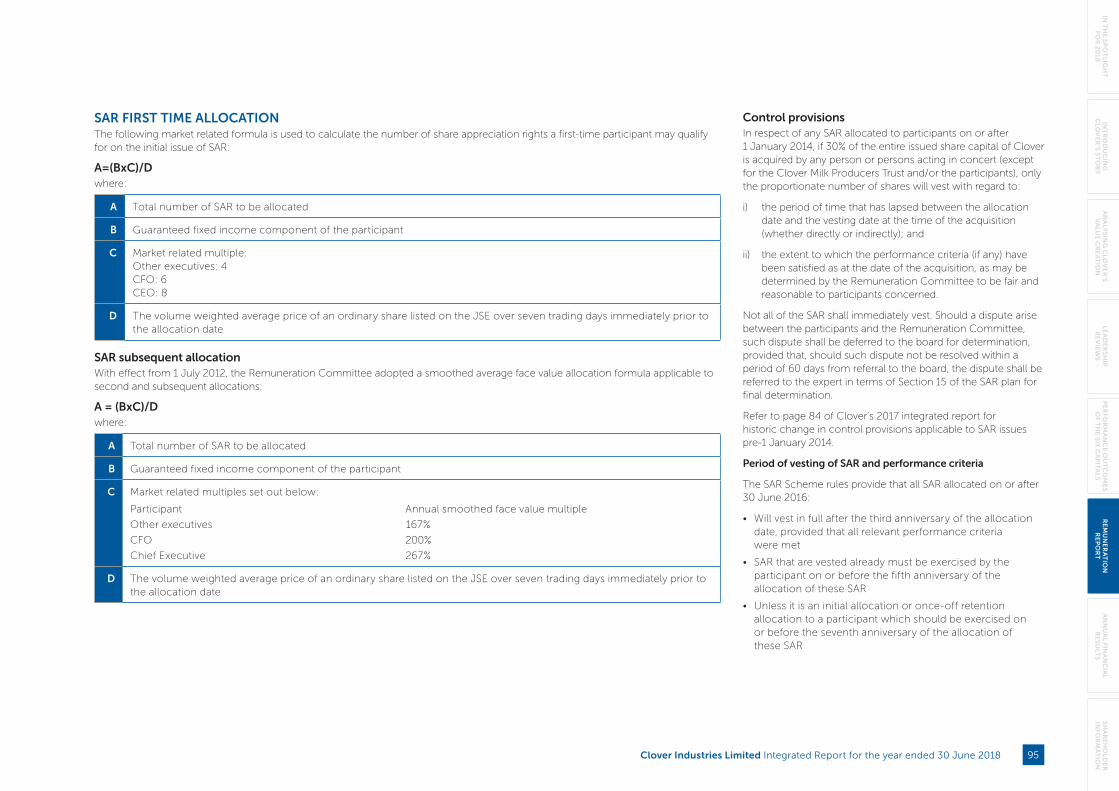
SAR FIRST TIME ALLOCATIONThe following market related formula is used to calculate the number of share appreciation rights a first-time participant may qualify for on the initial issue of SAR:
A=(BxC)/Dwhere:
A Total number of SAR to be allocated
B Guaranteed fixed income component of the participant
C Market related multiple:Other executives: 4CFO: 6CEO: 8
D The volume weighted average price of an ordinary share listed on the JSE over seven trading days immediately prior to the allocation date
SAR subsequent allocationWith effect from 1 July 2012, the Remuneration Committee adopted a smoothed average face value allocation formula applicable to second and subsequent allocations:
A = (BxC)/Dwhere:
A Total number of SAR to be allocated
B Guaranteed fixed income component of the participant
C Market related multiples set out below:
Participant Annual smoothed face value multiple
Other executives 167%
CFO 200%
Chief Executive 267%
D The volume weighted average price of an ordinary share listed on the JSE over seven trading days immediately prior to the allocation date
Control provisionsIn respect of any SAR allocated to participants on or after 1 January 2014, if 30% of the entire issued share capital of Clover is acquired by any person or persons acting in concert (except for the Clover Milk Producers Trust and/or the participants), only the proportionate number of shares will vest with regard to:
i) the period of time that has lapsed between the allocation date and the vesting date at the time of the acquisition (whether directly or indirectly); and
ii) the extent to which the performance criteria (if any) have been satisfied as at the date of the acquisition, as may be determined by the Remuneration Committee to be fair and reasonable to participants concerned.
Not all of the SAR shall immediately vest. Should a dispute arise between the participants and the Remuneration Committee, such dispute shall be deferred to the board for determination, provided that, should such dispute not be resolved within a period of 60 days from referral to the board, the dispute shall be referred to the expert in terms of Section 15 of the SAR plan for final determination.
Refer to page 84 of Clover’s 2017 integrated report for historic change in control provisions applicable to SAR issues pre-1 January 2014.
Period of vesting of SAR and performance criteria
The SAR Scheme rules provide that all SAR allocated on or after 30 June 2016:
• Will vest in full after the third anniversary of the allocation date, provided that all relevant performance criteria were met
• SAR that are vested already must be exercised by the participant on or before the fifth anniversary of the allocation of these SAR
• Unless it is an initial allocation or once-off retention allocation to a participant which should be exercised on or before the seventh anniversary of the allocation of these SAR
Clover Industries Limited Integrated Report for the year ended 30 June 2018 95
IN T
HE
SP
OT
LIGH
T
FOR
20
18IN
TR
OD
UC
ING
CLO
VE
R’S S
TO
RY
AN
ALY
SIN
G C
LOV
ER
’S V
ALU
E C
RE
AT
ION
LEA
DE
RS
HIP
R
EV
IEW
SP
ER
FOR
MA
NC
E O
UT
CO
ME
S O
F TH
E S
IX C
AP
ITA
LS
RE
MU
NE
RA
TIO
N
RE
PO
RT
AN
NU
AL FIN
AN
CIA
L R
ES
ULT
SS
HA
RE
HO
LDE
R
INFO
RM
AT
ION
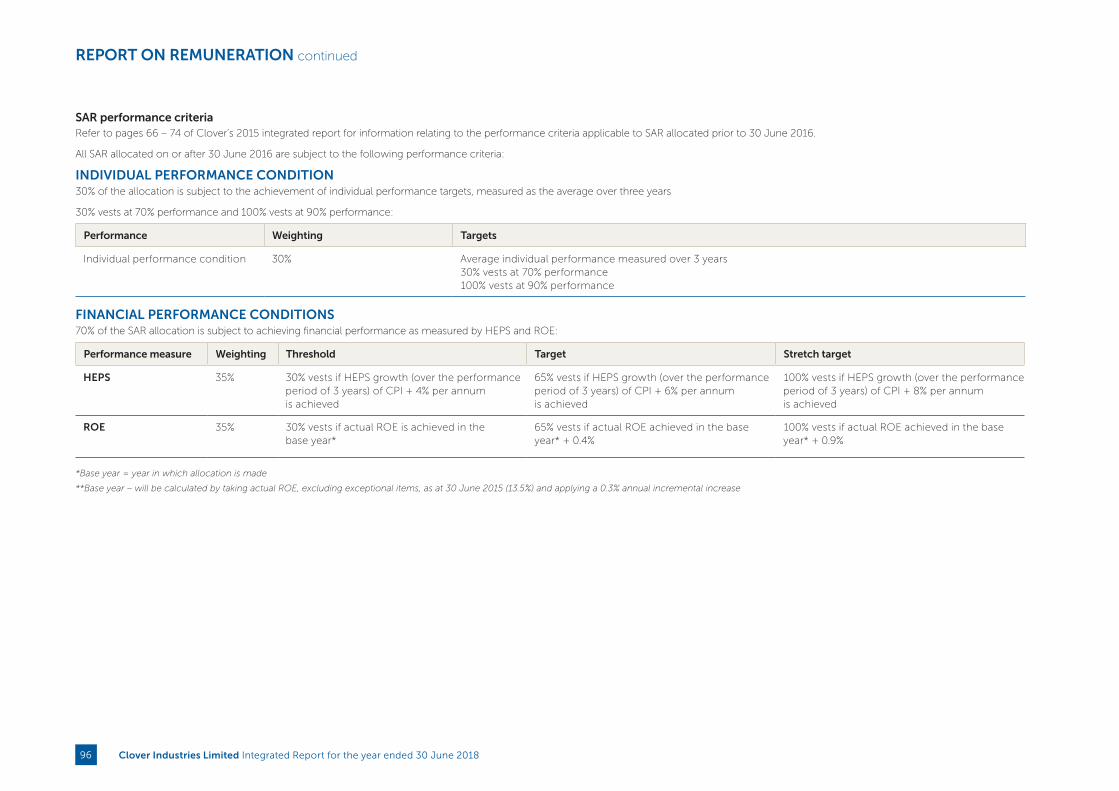
REPORT ON REMUNERATION continued
SAR performance criteriaRefer to pages 66 – 74 of Clover’s 2015 integrated report for information relating to the performance criteria applicable to SAR allocated prior to 30 June 2016.
All SAR allocated on or after 30 June 2016 are subject to the following performance criteria:
INDIVIDUAL PERFORMANCE CONDITION30% of the allocation is subject to the achievement of individual performance targets, measured as the average over three years
30% vests at 70% performance and 100% vests at 90% performance:
Performance Weighting Targets
Individual performance condition 30% Average individual performance measured over 3 years30% vests at 70% performance100% vests at 90% performance
FINANCIAL PERFORMANCE CONDITIONS70% of the SAR allocation is subject to achieving financial performance as measured by HEPS and ROE:
Performance measure Weighting Threshold Target Stretch target
HEPS 35% 30% vests if HEPS growth (over the performance period of 3 years) of CPI + 4% per annum is achieved
65% vests if HEPS growth (over the performance period of 3 years) of CPI + 6% per annum is achieved
100% vests if HEPS growth (over the performance period of 3 years) of CPI + 8% per annum is achieved
ROE 35% 30% vests if actual ROE is achieved in the base year*
65% vests if actual ROE achieved in the base year* + 0.4%
100% vests if actual ROE achieved in the base year* + 0.9%
*Base year = year in which allocation is made
**Base year – will be calculated by taking actual ROE, excluding exceptional items, as at 30 June 2015 (13.5%) and applying a 0.3% annual incremental increase
Clover Industries Limited Integrated Report for the year ended 30 June 201896
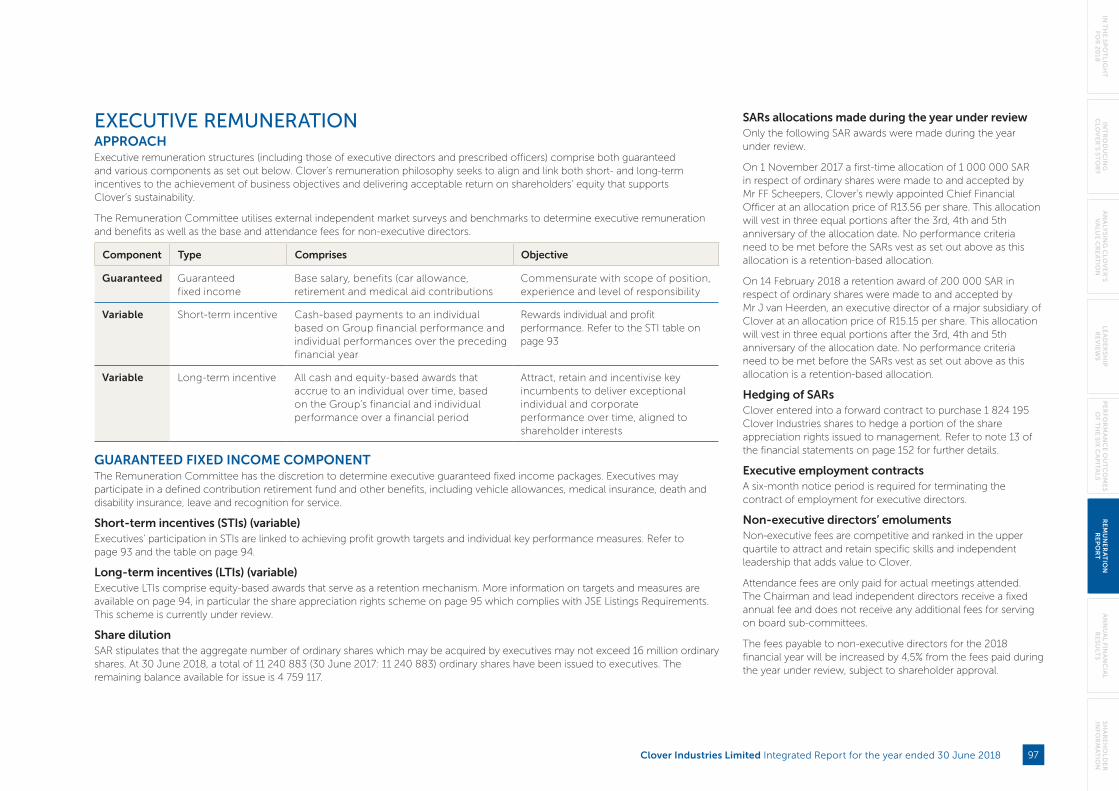
EXECUTIVE REMUNERATIONAPPROACHExecutive remuneration structures (including those of executive directors and prescribed officers) comprise both guaranteed and various components as set out below. Clover’s remuneration philosophy seeks to align and link both short- and long-term incentives to the achievement of business objectives and delivering acceptable return on shareholders’ equity that supports Clover’s sustainability.
The Remuneration Committee utilises external independent market surveys and benchmarks to determine executive remuneration and benefits as well as the base and attendance fees for non-executive directors.
Component Type Comprises Objective
Guaranteed Guaranteed fixed income
Base salary, benefits (car allowance, retirement and medical aid contributions
Commensurate with scope of position, experience and level of responsibility
Variable Short-term incentive Cash-based payments to an individual based on Group financial performance and individual performances over the preceding financial year
Rewards individual and profit performance. Refer to the STI table on page 93
Variable Long-term incentive All cash and equity-based awards that accrue to an individual over time, based on the Group’s financial and individual performance over a financial period
Attract, retain and incentivise key incumbents to deliver exceptional individual and corporate performance over time, aligned to shareholder interests
GUARANTEED FIXED INCOME COMPONENTThe Remuneration Committee has the discretion to determine executive guaranteed fixed income packages. Executives may participate in a defined contribution retirement fund and other benefits, including vehicle allowances, medical insurance, death and disability insurance, leave and recognition for service.
Short-term incentives (STIs) (variable)Executives’ participation in STIs are linked to achieving profit growth targets and individual key performance measures. Refer to page 93 and the table on page 94.
Long-term incentives (LTIs) (variable)Executive LTIs comprise equity-based awards that serve as a retention mechanism. More information on targets and measures are available on page 94, in particular the share appreciation rights scheme on page 95 which complies with JSE Listings Requirements. This scheme is currently under review.
Share dilutionSAR stipulates that the aggregate number of ordinary shares which may be acquired by executives may not exceed 16 million ordinary shares. At 30 June 2018, a total of 11 240 883 (30 June 2017: 11 240 883) ordinary shares have been issued to executives. The remaining balance available for issue is 4 759 117.
SARs allocations made during the year under reviewOnly the following SAR awards were made during the year under review.
On 1 November 2017 a first-time allocation of 1 000 000 SAR in respect of ordinary shares were made to and accepted by Mr FF Scheepers, Clover’s newly appointed Chief Financial Officer at an allocation price of R13.56 per share. This allocation will vest in three equal portions after the 3rd, 4th and 5th anniversary of the allocation date. No performance criteria need to be met before the SARs vest as set out above as this allocation is a retention-based allocation.
On 14 February 2018 a retention award of 200 000 SAR in respect of ordinary shares were made to and accepted by Mr J van Heerden, an executive director of a major subsidiary of Clover at an allocation price of R15.15 per share. This allocation will vest in three equal portions after the 3rd, 4th and 5th anniversary of the allocation date. No performance criteria need to be met before the SARs vest as set out above as this allocation is a retention-based allocation.
Hedging of SARsClover entered into a forward contract to purchase 1 824 195 Clover Industries shares to hedge a portion of the share appreciation rights issued to management. Refer to note 13 of the financial statements on page 152 for further details.
Executive employment contractsA six-month notice period is required for terminating the contract of employment for executive directors.
Non-executive directors’ emolumentsNon-executive fees are competitive and ranked in the upper quartile to attract and retain specific skills and independent leadership that adds value to Clover.
Attendance fees are only paid for actual meetings attended. The Chairman and lead independent directors receive a fixed annual fee and does not receive any additional fees for serving on board sub-committees.
The fees payable to non-executive directors for the 2018 financial year will be increased by 4,5% from the fees paid during the year under review, subject to shareholder approval.
Clover Industries Limited Integrated Report for the year ended 30 June 2018 97
IN T
HE
SP
OT
LIGH
T
FOR
20
18IN
TR
OD
UC
ING
CLO
VE
R’S S
TO
RY
AN
ALY
SIN
G C
LOV
ER
’S V
ALU
E C
RE
AT
ION
LEA
DE
RS
HIP
R
EV
IEW
SP
ER
FOR
MA
NC
E O
UT
CO
ME
S O
F TH
E S
IX C
AP
ITA
LS
RE
MU
NE
RA
TIO
N
RE
PO
RT
AN
NU
AL FIN
AN
CIA
L R
ES
ULT
SS
HA
RE
HO
LDE
R
INFO
RM
AT
ION
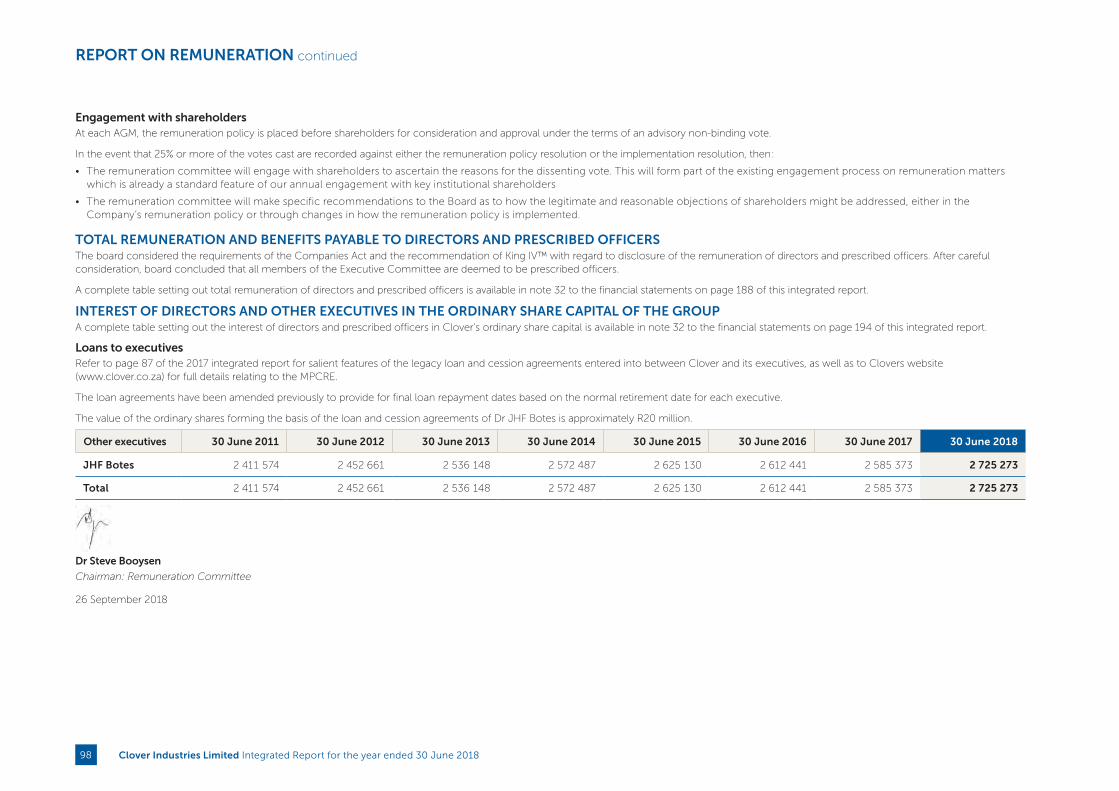
Engagement with shareholdersAt each AGM, the remuneration policy is placed before shareholders for consideration and approval under the terms of an advisory non-binding vote.
In the event that 25% or more of the votes cast are recorded against either the remuneration policy resolution or the implementation resolution, then:
• The remuneration committee will engage with shareholders to ascertain the reasons for the dissenting vote. This will form part of the existing engagement process on remuneration matters which is already a standard feature of our annual engagement with key institutional shareholders
• The remuneration committee will make specific recommendations to the Board as to how the legitimate and reasonable objections of shareholders might be addressed, either in the Company’s remuneration policy or through changes in how the remuneration policy is implemented.
TOTAL REMUNERATION AND BENEFITS PAYABLE TO DIRECTORS AND PRESCRIBED OFFICERSThe board considered the requirements of the Companies Act and the recommendation of King IV™ with regard to disclosure of the remuneration of directors and prescribed officers. After careful consideration, board concluded that all members of the Executive Committee are deemed to be prescribed officers.
A complete table setting out total remuneration of directors and prescribed officers is available in note 32 to the financial statements on page 188 of this integrated report.
INTEREST OF DIRECTORS AND OTHER EXECUTIVES IN THE ORDINARY SHARE CAPITAL OF THE GROUPA complete table setting out the interest of directors and prescribed officers in Clover’s ordinary share capital is available in note 32 to the financial statements on page 194 of this integrated report.
Loans to executivesRefer to page 87 of the 2017 integrated report for salient features of the legacy loan and cession agreements entered into between Clover and its executives, as well as to Clovers website (www.clover.co.za) for full details relating to the MPCRE.
The loan agreements have been amended previously to provide for final loan repayment dates based on the normal retirement date for each executive.
The value of the ordinary shares forming the basis of the loan and cession agreements of Dr JHF Botes is approximately R20 million.
Other executives 30 June 2011 30 June 2012 30 June 2013 30 June 2014 30 June 2015 30 June 2016 30 June 2017 30 June 2018
JHF Botes 2 411 574 2 452 661 2 536 148 2 572 487 2 625 130 2 612 441 2 585 373 2 725 273
Total 2 411 574 2 452 661 2 536 148 2 572 487 2 625 130 2 612 441 2 585 373 2 725 273
Dr Steve Booysen
Chairman: Remuneration Committee
26 September 2018
REPORT ON REMUNERATION continued
Clover Industries Limited Integrated Report for the year ended 30 June 201898

IMPLEMENTATION REPORTThis is Clover’s first implementation report in line with King IV™ requirements. The report details the outcome of the approved remuneration policy in the year under review. There were no deviations from the policy.
2018 GUARANTEED PACKAGE (GP)The following increases to GP were implemented in the reporting period for executive directors and prescribed officers, where the new amounts were applicable from 1 July 2017 to 30 June 2018.
Guaranteed package at
30 June 2018R’000
Guaranteed package at
30 June 2017R’000 % increase
Executive directors
JH Vorster 6 666 6 411 4%
ER Bosch (resigned 31 December 2018) – 3 981 –
F Scheepers (appointed 1 January 2018) 4 080 –
Prescribed officers (other executives)
H Lubbe 4 058 3 864 5%
JHF Botes (Dr) 4 095 3 899 5%
MM Palmeiro 3 996 3 808 5%
J van Heerden 3 415 3 089 10.5%
* Mr ER Bosch resigned as Chief Financial Officer with effect from 01 January 2018. Mr F Scheepers was appointed as Chief Financial Officer with effect from 1 January 2018.
2018 STI ASSESSMENT AND AWARDSThe committee’s assessment of the Chief Executive’s and Chief Financial Officers’ performance against targets set for the various elements of the STI are indicated in the table below:
Group profit component Individual component
Range of final ratings 0% 0% – 100%
Description The Group did not achieve its normalised attributable profit target of R404 million. The profit target is triggered once 100% of the profit target is reached. If profit exceeds target, an additional 3.55% for all executives will be paid for every 1% achieved over the target.
Individual performance measures are based on specific key performance indicators approved annually by the Remuneration Committee. Weighting of individual KPIs will vary from the average reflected below.
Clover Industries Limited Integrated Report for the year ended 30 June 2018 99
IN T
HE
SP
OT
LIGH
T
FOR
20
18IN
TR
OD
UC
ING
CLO
VE
R’S S
TO
RY
AN
ALY
SIN
G C
LOV
ER
’S V
ALU
E C
RE
AT
ION
LEA
DE
RS
HIP
R
EV
IEW
SP
ER
FOR
MA
NC
E O
UT
CO
ME
S O
F TH
E S
IX C
AP
ITA
LS
RE
MU
NE
RA
TIO
N
RE
PO
RT
AN
NU
AL FIN
AN
CIA
L R
ES
ULT
SS
HA
RE
HO
LDE
R
INFO
RM
AT
ION
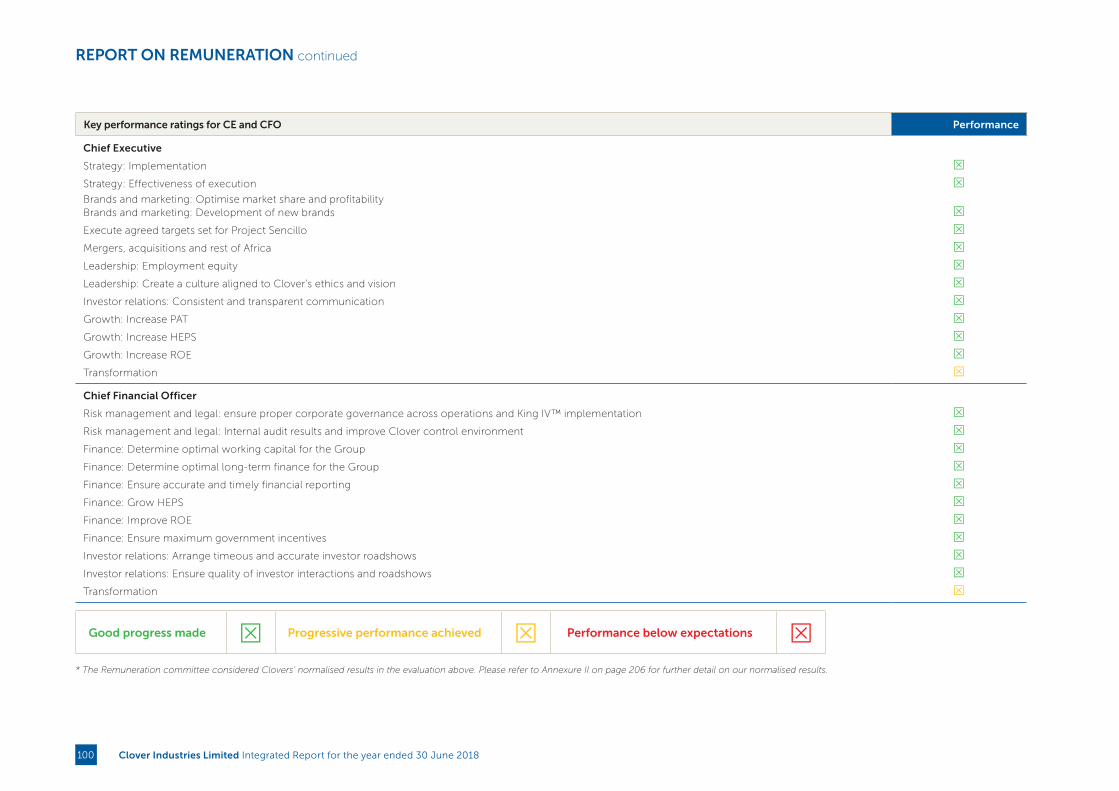
Key performance ratings for CE and CFO Performance
Chief Executive
Strategy: Implementation S
Strategy: Effectiveness of execution SBrands and marketing: Optimise market share and profitabilityBrands and marketing: Development of new brands S
Execute agreed targets set for Project Sencillo S
Mergers, acquisitions and rest of Africa S
Leadership: Employment equity S
Leadership: Create a culture aligned to Clover’s ethics and vision S
Investor relations: Consistent and transparent communication S
Growth: Increase PAT S
Growth: Increase HEPS S
Growth: Increase ROE S
Transformation S
Chief Financial Officer
Risk management and legal: ensure proper corporate governance across operations and King IV™ implementation S
Risk management and legal: Internal audit results and improve Clover control environment S
Finance: Determine optimal working capital for the Group S
Finance: Determine optimal long-term finance for the Group S
Finance: Ensure accurate and timely financial reporting S
Finance: Grow HEPS S
Finance: Improve ROE S
Finance: Ensure maximum government incentives S
Investor relations: Arrange timeous and accurate investor roadshows S
Investor relations: Ensure quality of investor interactions and roadshows S
Transformation S
Good progress made S Progressive performance achieved S Performance below expectations S* The Remuneration committee considered Clovers’ normalised results in the evaluation above. Please refer to Annexure II on page 206 for further detail on our normalised results.
REPORT ON REMUNERATION continued
Clover Industries Limited Integrated Report for the year ended 30 June 2018100
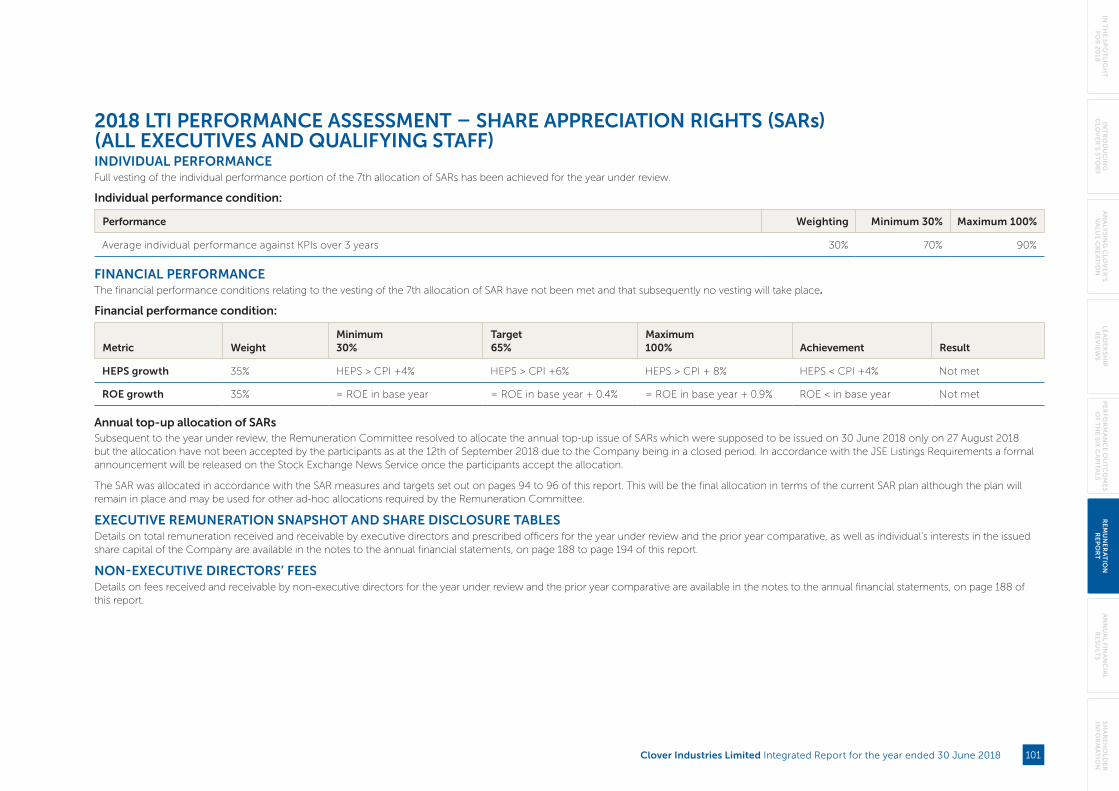
2018 LTI PERFORMANCE ASSESSMENT – SHARE APPRECIATION RIGHTS (SARs) (ALL EXECUTIVES AND QUALIFYING STAFF)INDIVIDUAL PERFORMANCEFull vesting of the individual performance portion of the 7th allocation of SARs has been achieved for the year under review.
Individual performance condition:
Performance Weighting Minimum 30% Maximum 100%
Average individual performance against KPIs over 3 years 30% 70% 90%
FINANCIAL PERFORMANCEThe financial performance conditions relating to the vesting of the 7th allocation of SAR have not been met and that subsequently no vesting will take place.
Financial performance condition:
Metric WeightMinimum30%
Target65%
Maximum 100% Achievement Result
HEPS growth 35% HEPS > CPI +4% HEPS > CPI +6% HEPS > CPI + 8% HEPS < CPI +4% Not met
ROE growth 35% = ROE in base year = ROE in base year + 0.4% = ROE in base year + 0.9% ROE < in base year Not met
Annual top-up allocation of SARsSubsequent to the year under review, the Remuneration Committee resolved to allocate the annual top-up issue of SARs which were supposed to be issued on 30 June 2018 only on 27 August 2018 but the allocation have not been accepted by the participants as at the 12th of September 2018 due to the Company being in a closed period. In accordance with the JSE Listings Requirements a formal announcement will be released on the Stock Exchange News Service once the participants accept the allocation.
The SAR was allocated in accordance with the SAR measures and targets set out on pages 94 to 96 of this report. This will be the final allocation in terms of the current SAR plan although the plan will remain in place and may be used for other ad-hoc allocations required by the Remuneration Committee.
EXECUTIVE REMUNERATION SNAPSHOT AND SHARE DISCLOSURE TABLESDetails on total remuneration received and receivable by executive directors and prescribed officers for the year under review and the prior year comparative, as well as individual’s interests in the issued share capital of the Company are available in the notes to the annual financial statements, on page 188 to page 194 of this report.
NON-EXECUTIVE DIRECTORS’ FEESDetails on fees received and receivable by non-executive directors for the year under review and the prior year comparative are available in the notes to the annual financial statements, on page 188 of this report.
Clover Industries Limited Integrated Report for the year ended 30 June 2018 101
IN T
HE
SP
OT
LIGH
T
FOR
20
18IN
TR
OD
UC
ING
CLO
VE
R’S S
TO
RY
AN
ALY
SIN
G C
LOV
ER
’S V
ALU
E C
RE
AT
ION
LEA
DE
RS
HIP
R
EV
IEW
SP
ER
FOR
MA
NC
E O
UT
CO
ME
S O
F TH
E S
IX C
AP
ITA
LS
RE
MU
NE
RA
TIO
N
RE
PO
RT
AN
NU
AL FIN
AN
CIA
L R
ES
ULT
SS
HA
RE
HO
LDE
R
INFO
RM
AT
ION

CLOVER’S MARKET SHARE IN FLAVOURED MILK AT 30 JUNE 2018
32,1%
CLOVER’S MARKET SHARE IN DAIRY
FRUIT MIX AT 30 JUNE 2018
83,4%
Clover Industries Limited Integrated Report for the year ended 30 June 2018102

ANNUAL FINANCIAL STATEMENTS
CLOVER’S MARKET SHARE IN YOGHURT
AT 30 JUNE 2018
11,9%
The audited financial statements contained in this section were prepared under the supervision of Frantz Scheepers, CA(SA), in his capacity as Chief Financial Officer of the Group.
Clover Industries Limited Integrated Report for the year ended 30 June 2018 103

Audit and Risk Committee report
The Audit and Risk Committee has pleasure in submitting this report
as required by Section 94(7)(f) of the Companies Act. The Audit and
Risk Committee has adopted detailed terms of reference which comply
with the Companies Act, No 71 of 2008 (“Act”), and King IV and have
been approved by the Board of Directors of the Company (“Board”).
Audit and Risk Committee membership and attendance at meetingsThe Audit and Risk Committee comprises only independent
non-executive directors. The Chief Executive, Chief Financial Officer
and other executives attend meetings of the Audit and Risk
Committee by invitation and actively engage in these meetings. Other
non-executive directors may attend if they so wish. The Audit and
Risk Committee was duly appointed by shareholders at the Annual
General Meeting on 28 November 2017. Shareholders will again be
asked to approve the appointment of the members of the Audit and
Risk Committee for the 2017/2018 financial year at the Annual General
Meeting scheduled for 26 November 2018. Details of the members
of the Audit and Risk Committee, their qualifications and the number
of meetings (including the attendance of the members) held for the
financial year are set out on pages 20 to 22.
Function of the Audit and Risk CommitteeThe functions of the Audit and Risk Committee are as follows:
• to perform all of the duties required of it by the Act, in respect of the
Company and all of its subsidiary companies;
• to assist the Board in discharging its duties relating to the safeguarding
of assets, the operation of adequate financial systems, control and
financial reporting procedures, the operating effectiveness of those
procedures, the maintenance of accurate and complete accounting
records and the preparation of financial statements in compliance
with the applicable legal requirements, King IV code of governance
principles and applicable accounting standards;
• to review the Group’s integrated report, including the annual
financial statements, as well as its interim report and any other
public reports or announcements containing financial information;
• to provide management, external auditors and the internal auditors
with access to the chairman or any other member of the Audit and
Risk Committee to discuss any matter within the Audit and Risk
Committee’s scope;
• to meet separately with the external and internal auditors at least
twice a year;
• to provide a forum for discussing business risk and control issues
and developing recommendations for consideration by the Board;
• to monitor enterprise-wide, operational, market, regulatory, safety
and other risks, and to monitor controls designed to minimise risk;
• to consider and recommend to the Board whether external
assurance should be provided on the Report on Six Capitals
and to ensure that the report is consistent with the annual
financial statements;
• to perform the functions required in terms of the JSE
Listings Requirements;
• to perform the matters required by the Companies Act of South
Africa, in respect of the Company and all its subsidiary companies
incorporated in South Africa;
• to oversee the activities of, and ensure co-ordination, between the
activities of internal and external audit; and
• to review the Audit and Risk Committee’s work plan and terms of
reference annually and make recommendations to Board to ensure
its effectiveness.
Key significant issues considered by the committee I. EXTERNAL AUDITDuring the year under review, the Audit and Risk Committee undertook
the following:
• nominated Ernst & Young Inc. as the external auditor, with Derek
Engelbrecht as the designated auditor to the shareholders for
appointment as auditor for the financial year ended 30 June 2018,
and ensured that the appointment complied with all legal and
regulatory requirements for the appointment of an auditor;
• confirmed that the auditor and the designated auditor are
accredited by the JSE;
• approved the external audit engagement letter, the plan and the
budgeted audit fees payable to the external auditor;
• reviewed the audit and evaluated the effectiveness of the auditor;
• obtained a statement from the auditor confirming that its
independence was not impaired;
• determined the nature and extent of all non-audit services
provided by the external auditor and pre-approved all non-audit
services undertaken;
• obtained assurances from the external auditor that adequate
accounting records were being maintained;
• confirmed that no reportable irregularities had been identified or
reported by the auditors under the Auditing Profession Act; and
• nominated the external auditor and the designated independent
auditor for each of the South African subsidiary companies for the
financial year ended 30 June 2018.
II. AUDIT FIRM ROTATION• In June 2017, the Independent Regulatory Board for Auditors (IRBA)
issued a rule prescribing that auditors of public interest entities
(PIEs) in South Africa (SA) must comply with mandatory audit firm
rotation (MAFR) with effect from 1 April 2023.
• The audit and risk committee recognise this principle and views it
in a serious light. However, the actions taken must be done in a
practical manner to avoid minimum disruption to the business.
• As an interim measure, we have resolved to rotate partners, Derek
Engelbrecht as the current designated auditor will be replaced with
Ziningi Khoza but Ernst & Young Inc. as a firm will remain as the
external auditor.
• The board has started the process of rotating Ernst and Young Inc.
III. FINANCIAL STATEMENTSDuring the year under review, the Audit and Risk Committee:
• confirmed, based on managements’ review that the interim
and annual financial statements were drawn up on the
going-concern basis;
• examined the published Interim and annual financial statements
and other financial information, prior to the Board’s approval;
• considered the accounting treatment of significant or unusual
transactions and accounting judgements by management;
• considered whether appropriate financial reporting procedures
have been established and that those procedures are operating;
• considered the appropriateness of accounting policies and any
changes made;
• reviewed the audit report on the annual financial statements;
• reviewed the representation letter relating to the annual financial
statements signed by management;
• considered any problems identified as well as any legal and tax
matters that could materially affect the financial statements;
Clover Industries Limited Integrated Report for the year ended 30 June 2018104
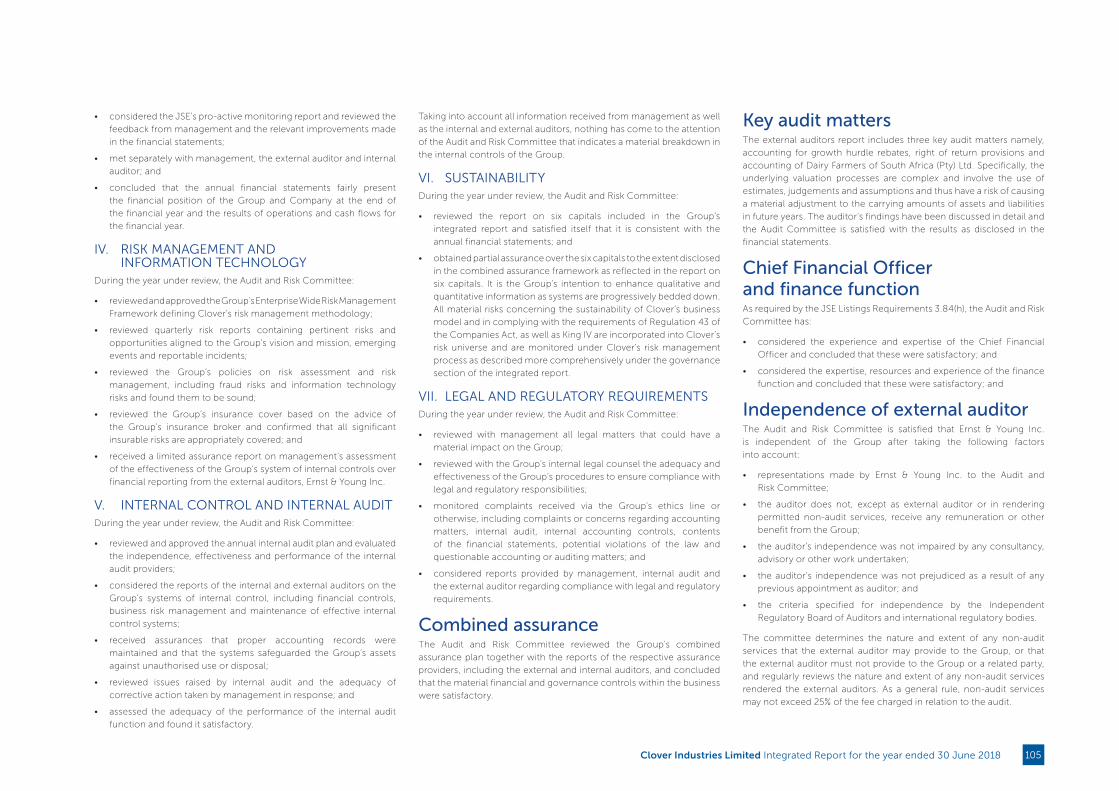
• considered the JSE’s pro-active monitoring report and reviewed the
feedback from management and the relevant improvements made
in the financial statements;
• met separately with management, the external auditor and internal
auditor; and
• concluded that the annual financial statements fairly present
the financial position of the Group and Company at the end of
the financial year and the results of operations and cash flows for
the financial year.
IV. RISK MANAGEMENT AND INFORMATION TECHNOLOGY
During the year under review, the Audit and Risk Committee:
• reviewed and approved the Group’s Enterprise Wide Risk Management
Framework defining Clover’s risk management methodology;
• reviewed quarterly risk reports containing pertinent risks and
opportunities aligned to the Group’s vision and mission, emerging
events and reportable incidents;
• reviewed the Group’s policies on risk assessment and risk
management, including fraud risks and information technology
risks and found them to be sound;
• reviewed the Group’s insurance cover based on the advice of
the Group’s insurance broker and confirmed that all significant
insurable risks are appropriately covered; and
• received a limited assurance report on management’s assessment
of the effectiveness of the Group’s system of internal controls over
financial reporting from the external auditors, Ernst & Young Inc.
V. INTERNAL CONTROL AND INTERNAL AUDITDuring the year under review, the Audit and Risk Committee:
• reviewed and approved the annual internal audit plan and evaluated
the independence, effectiveness and performance of the internal
audit providers;
• considered the reports of the internal and external auditors on the
Group’s systems of internal control, including financial controls,
business risk management and maintenance of effective internal
control systems;
• received assurances that proper accounting records were
maintained and that the systems safeguarded the Group’s assets
against unauthorised use or disposal;
• reviewed issues raised by internal audit and the adequacy of
corrective action taken by management in response; and
• assessed the adequacy of the performance of the internal audit
function and found it satisfactory.
Taking into account all information received from management as well
as the internal and external auditors, nothing has come to the attention
of the Audit and Risk Committee that indicates a material breakdown in
the internal controls of the Group.
VI. SUSTAINABILITYDuring the year under review, the Audit and Risk Committee:
• reviewed the report on six capitals included in the Group’s
integrated report and satisfied itself that it is consistent with the
annual financial statements; and
• obtained partial assurance over the six capitals to the extent disclosed
in the combined assurance framework as reflected in the report on
six capitals. It is the Group’s intention to enhance qualitative and
quantitative information as systems are progressively bedded down.
All material risks concerning the sustainability of Clover’s business
model and in complying with the requirements of Regulation 43 of
the Companies Act, as well as King IV are incorporated into Clover’s
risk universe and are monitored under Clover’s risk management
process as described more comprehensively under the governance
section of the integrated report.
VII. LEGAL AND REGULATORY REQUIREMENTSDuring the year under review, the Audit and Risk Committee:
• reviewed with management all legal matters that could have a
material impact on the Group;
• reviewed with the Group’s internal legal counsel the adequacy and
effectiveness of the Group’s procedures to ensure compliance with
legal and regulatory responsibilities;
• monitored complaints received via the Group’s ethics line or
otherwise, including complaints or concerns regarding accounting
matters, internal audit, internal accounting controls, contents
of the financial statements, potential violations of the law and
questionable accounting or auditing matters; and
• considered reports provided by management, internal audit and
the external auditor regarding compliance with legal and regulatory
requirements.
Combined assuranceThe Audit and Risk Committee reviewed the Group’s combined
assurance plan together with the reports of the respective assurance
providers, including the external and internal auditors, and concluded
that the material financial and governance controls within the business
were satisfactory.
Key audit mattersThe external auditors report includes three key audit matters namely,
accounting for growth hurdle rebates, right of return provisions and
accounting of Dairy Farmers of South Africa (Pty) Ltd. Specifically, the
underlying valuation processes are complex and involve the use of
estimates, judgements and assumptions and thus have a risk of causing
a material adjustment to the carrying amounts of assets and liabilities
in future years. The auditor‘s findings have been discussed in detail and
the Audit Committee is satisfied with the results as disclosed in the
financial statements.
Chief Financial Officer and finance functionAs required by the JSE Listings Requirements 3.84(h), the Audit and Risk
Committee has:
• considered the experience and expertise of the Chief Financial
Officer and concluded that these were satisfactory; and
• considered the expertise, resources and experience of the finance
function and concluded that these were satisfactory; and
Independence of external auditorThe Audit and Risk Committee is satisfied that Ernst & Young Inc.
is independent of the Group after taking the following factors
into account:
• representations made by Ernst & Young Inc. to the Audit and
Risk Committee;
• the auditor does not, except as external auditor or in rendering
permitted non-audit services, receive any remuneration or other
benefit from the Group;
• the auditor’s independence was not impaired by any consultancy,
advisory or other work undertaken;
• the auditor’s independence was not prejudiced as a result of any
previous appointment as auditor; and
• the criteria specified for independence by the Independent
Regulatory Board of Auditors and international regulatory bodies.
The committee determines the nature and extent of any non-audit
services that the external auditor may provide to the Group, or that
the external auditor must not provide to the Group or a related party,
and regularly reviews the nature and extent of any non-audit services
rendered the external auditors. As a general rule, non-audit services
may not exceed 25% of the fee charged in relation to the audit.
Clover Industries Limited Integrated Report for the year ended 30 June 2018 105

In addition to it being a regulatory requirement, the committee
believes that the periodic rotation of the external audit partner is key
to maintaining their independence. The external auditor agreed to
actively rotate the external audit partner well in advance of the required
rotation period to ensure that Clover benefits from a smooth transition.
The committee monitors the external auditor’s performance and
the effectiveness of the audit process as provided for in the terms of
engagement and agreed audit scope and approach. Lastly, as required by
section 3.84(g)(iii) JSE Listings Requirements, the committee monitors
the external auditor and has obtained and reviewed the information
specified in paragraph 22.15(h) of the JSE Listings Requirements.
Annual financial statementsFollowing the review by the Audit and Risk Committee of the
consolidated and company annual financial statements of Clover
Industries Limited for the year ended 30 June 2018 and the opinion
of the external auditor, the Audit and Risk Committee is of the view
that they fairly present, in all material aspects, the financial position
at that date and the results of operations and cash flows for the year
then ended, in accordance with International Financial Reporting
Standards and the requirements of the Companies Act and the JSE
Listing Requirements. The Audit and Risk Committee has satisfied itself
of the integrity of the remainder of the integrated report.
Having achieved its objectives for the financial year, the Audit and
Risk Committee has recommended the annual financial statements
and integrated report for the year ended 30 June 2018 for approval
to the Clover Industries Limited Board. The Board has subsequently
approved the financial statements, which will be open for discussion at
the forthcoming Annual General Meeting.
For and on behalf of the Audit and Risk Committee.
B Ngonyama
Chairperson of the Audit and Risk Committee
26 September 2018
Audit and Risk Committee report (continued)
Clover Industries Limited Integrated Report for the year ended 30 June 2018106
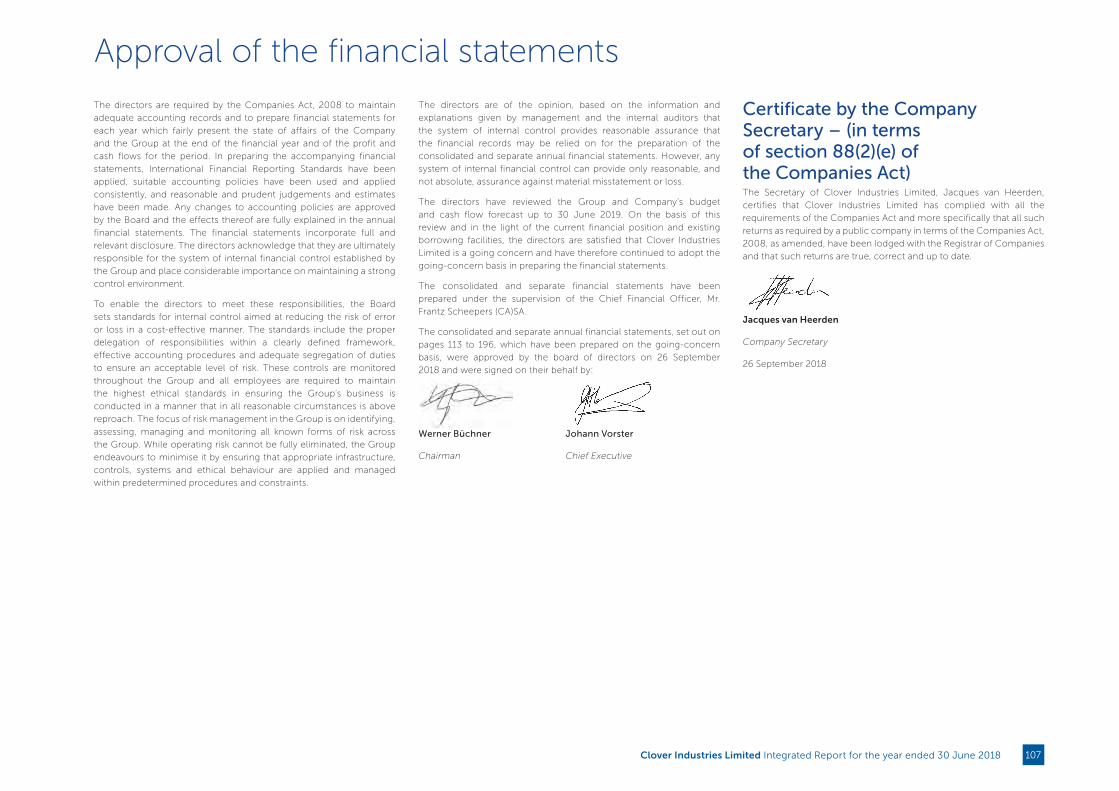
Approval of the financial statements
The directors are required by the Companies Act, 2008 to maintain
adequate accounting records and to prepare financial statements for
each year which fairly present the state of affairs of the Company
and the Group at the end of the financial year and of the profit and
cash flows for the period. In preparing the accompanying financial
statements, International Financial Reporting Standards have been
applied, suitable accounting policies have been used and applied
consistently, and reasonable and prudent judgements and estimates
have been made. Any changes to accounting policies are approved
by the Board and the effects thereof are fully explained in the annual
financial statements. The financial statements incorporate full and
relevant disclosure. The directors acknowledge that they are ultimately
responsible for the system of internal financial control established by
the Group and place considerable importance on maintaining a strong
control environment.
To enable the directors to meet these responsibilities, the Board
sets standards for internal control aimed at reducing the risk of error
or loss in a cost-effective manner. The standards include the proper
delegation of responsibilities within a clearly defined framework,
effective accounting procedures and adequate segregation of duties
to ensure an acceptable level of risk. These controls are monitored
throughout the Group and all employees are required to maintain
the highest ethical standards in ensuring the Group’s business is
conducted in a manner that in all reasonable circumstances is above
reproach. The focus of risk management in the Group is on identifying,
assessing, managing and monitoring all known forms of risk across
the Group. While operating risk cannot be fully eliminated, the Group
endeavours to minimise it by ensuring that appropriate infrastructure,
controls, systems and ethical behaviour are applied and managed
within predetermined procedures and constraints.
The directors are of the opinion, based on the information and
explanations given by management and the internal auditors that
the system of internal control provides reasonable assurance that
the financial records may be relied on for the preparation of the
consolidated and separate annual financial statements. However, any
system of internal financial control can provide only reasonable, and
not absolute, assurance against material misstatement or loss.
The directors have reviewed the Group and Company’s budget
and cash flow forecast up to 30 June 2019. On the basis of this
review and in the light of the current financial position and existing
borrowing facilities, the directors are satisfied that Clover Industries
Limited is a going concern and have therefore continued to adopt the
going-concern basis in preparing the financial statements.
The consolidated and separate financial statements have been
prepared under the supervision of the Chief Financial Officer, Mr.
Frantz Scheepers (CA)SA.
The consolidated and separate annual financial statements, set out on
pages 113 to 196, which have been prepared on the going-concern
basis, were approved by the board of directors on 26 September
2018 and were signed on their behalf by:
Werner Büchner Johann Vorster
Chairman Chief Executive
Certificate by the Company Secretary – (in terms of section 88(2)(e) of the Companies Act)The Secretary of Clover Industries Limited, Jacques van Heerden,
certifies that Clover Industries Limited has complied with all the
requirements of the Companies Act and more specifically that all such
returns as required by a public company in terms of the Companies Act,
2008, as amended, have been lodged with the Registrar of Companies
and that such returns are true, correct and up to date.
Jacques van Heerden
Company Secretary
26 September 2018
Clover Industries Limited Integrated Report for the year ended 30 June 2018 107

Key audit matter How this matter was addressed in our audit
Growth hurdle rebate
The recognition of growth hurdle reduction
in revenue and provision, depends on retailers
achieving growth incentive targets (such as
growth in sales values and/or growth in volumes).
The period to assess whether retailers have
achieved their growth incentive targets does not
align with the Company’s financial year-end.
There are therefore a number of agreements which
are in progress at the financial year end and for
which final settlement will only occur at the end
of the agreement or at a future point. Judgment is
required in assessing whether retailers will achieve
their growth incentive targets when settlement of
the rebate occurs at the end of the calendar year,
based on sales achieved as at the year end of the
company in combination with evidence from prior
year trends and forecasted sales.
Growth hurdle rebate
Our audit procedures in respect of the payable
recognised and the revenue deductions relating to
growth hurdle, included the following:
Our audit procedures included considering the
appropriateness of the Group’s revenue recognition
accounting policies including those relating to
growth hurdle rebates and right of returns.
• On a sample basis we inspected the rebate terms
in the agreement and agreed them to inputs used
in the calculation;
• We agreed the sales volumes recorded in the
stand-alone trade terms system to the sales
data warehouse;
• We agreed the sales volumes in the sales data
warehouse to the sales volumes recorded in the
general ledger;
• We independently recalculated the estimated
rebates due to each retailer based on actual sales
year to date. We then compared this expectation
to actual results. Where our recalculation based
on the contractual terms and estimation based on
sales year to date differed to management’s final
provision, we obtained support for the differences
to vouch their validity;
• We designed an analytic to match rates that
materially changed from last year at an SKU level
and investigated any deviations; and
• On a sample basis we vouched payments and
deductions to supporting documentation.
Report on the audit of the consolidated and separate annual financial statements Opinion We have audited the consolidated and separate financial statements of Clover Industries Limited and its
subsidiaries (the Group), which comprise the consolidated and separate statements of financial position as at
30 June 2018, and the consolidated and separate statements of comprehensive income, consolidated and
separate statements of changes in equity and consolidated and separate statements of cash flows for the
year then ended, and notes to the consolidated and separate financial statements, including a summary of
significant accounting policies.
In our opinion, the accompanying consolidated and separate financial statements present fairly, in all
material respects, the consolidated and separate financial position of the Group as at 30 June 2018, and its
consolidated and separate financial performance and its consolidated and separate cash flows for the year
then ended in accordance with International Financial Reporting Standards (IFRS) and the requirements of
the Companies Act, 2008 and JSE Listing Requirements.
Basis for opinion We conducted our audit in accordance with International Standards on Auditing (ISAs). Our responsibilities
under those standards are further described in the Auditor’s Responsibilities for the Audit of the Consolidated
Financial Statements section of our report. We are independent of the Group in accordance with the
Independent Regulatory Board for Auditors Code of Professional Conduct for Registered Auditors (IRBA
Code) that is consistent with the International Ethics Standards Board for Accountants Code of Ethics for
Professional Accountants (Part A and B) together with other ethical requirements that are relevant to our audit
of the consolidated financial statements in South Africa, and we have fulfilled our other ethical responsibilities
in accordance with these requirements and the IRBA Code. We believe that the audit evidence we have
obtained is sufficient and appropriate to provide a basis for our opinion.
Key audit matters Key audit matters are those matters that, in our professional judgment, were of most significance in our audit
of the financial statements of the current period. These matters were addressed in the context of our audit of
the financial statements as a whole, and in forming our opinion thereon, and we do not provide a separate
opinion on these matters.
Independent auditor’s report TO THE SHAREHOLDERS OF CLOVER INDUSTRIES LIMITED
Clover Industries Limited Integrated Report for the year ended 30 June 2018108

Independent auditor’s report (continued)
Key audit matter How this matter was addressed in our audit
Right of returns provision
There are provisions for returns recorded on
the balance sheet as at year-end 30 June 2018.
Management estimate the expected right of
return trends based on historic actual returns, and
actual right of returns as a percent of revenue.
This requires significant judgement based
on experience.
Right of returns provision
Our audit procedures in respect of the payable
recognised and the revenue deductions relating to
right of returns, included the following:
• We tested the arithmetical accuracy of the
calculation and agreed the amount calculated to
the amount recognised in the accounting records;
• We assessed management’s estimates to accrue
for credit notes at year end;
• We independently recalculated the calculation by
taking into account historic data and return trends
as well as returns in July 2018 compared to the
provisions raised;
• We compared the assumptions to historical credit
notes issued and to current trends; and
• We assessed sales transactions taking place at and
before year end date as well as credit notes issued
after the year-end date to assess whether revenue
was recognised in the correct period.
Accounting of Diary Farmers of SA “DFSA”
As described in note 3.2 within the annual financial
statements, with effect from 1 July 2017 Clover
holds 26% of the shares in DFSA and as a
consequence the results from DFSA are no longer
consolidated into the Group’s results.
We identified the accounting treatment of the
reduction in shares and protective rights held by
Clover as representing a key audit matter due to the
complexity of the judgement required to determine
if the protective rights held by Clover constitutes
control in accordance with IFRS 10 – Consolidated
Financial Statements.
Accounting of Dairy Farmers of SA “DFSA”
Our audit procedures to test the accounting for the
transaction included:
• We assessed whether the 26% shareholding held
by Clover would grant Clover:
• power over DFSA; or
• exposure, or rights to variable returns from its
involvement with DFSA; or
• the ability to use its power over DFSA to affect
the amount of Clover’s returns.
• We reviewed all the transactional agreements
between DFSA and CSA to assess if any conditions
would trigger control;
• We considered whether Clover has existing rights
to participate and control in the direction of DFSA’s
operating activities;
• Considered whether Clover’s representation on
the board of directors and the service contracts
concluded contributes to Clover having significant
influence over DFSA.
Key audit matter How this matter was addressed in our audit
Events after the reporting period
There was a significant event that took place after
the reporting period.
The recoverability of the revolving credit facility
(RCF) extended to DFSA is dependent on its Board
of Directors to execute their business strategy to
create long term sustainability.
The Chairman of the Board of Directors and the
Chief Executive Officer of DFSA resigned after the
reporting period. The unforeseen resignation of the
key leadership team is an indicator of impairment
as it impacts directly on the implementation of
critical strategic initiatives and is considered to be
an adjusting post balance sheet event.
This event led to the impairment of the RCF
balance as at 30 June 2018. The significance of the
balance, the judgement required to determine that
an impairment is required, and the impact on the
financial statements as a whole have resulted in us
considering this event to be a key audit matter.
Events after the reporting period
Our audit procedures included, amongst others:• We reviewed the notice of resignation of the
Chairman of the Board and the Chief Executive Officer of DFSA.
• We understood the process management have followed to make their assessment as to whether the significant event that took place after the reporting period are adjusting or non-adjusting events;
• We challenged management’s judgment by reviewing the critical assumptions with reference to the cyclical nature of the DFSA business;
• We reviewed the operational performance of DFSA in the period subsequent to the reporting date leading up to the date of the approval of the financial statements;
• We challenged the practical implementation of the critical strategic initiatives to restore the profitability and sustainability of DFSA against the backdrop of material changes in the DFSA leadership and management team;
• We evaluated the adequacy of the Group’s disclosures regarding the impairment of the RCF, which is disclosed in note 13.1 of the consolidated financial statements as well as the other information disclosed within the Integrated Annual Report.
Other information The Group’s directors are responsible for the other information. The other information comprises the
information included in Group’s integrated report for the year ended 30 June 2018 that includes the
Directors’ Report, the Audit Committee Report and the Company Secretary’s Certificate as required by the
Companies Act, but does not include the consolidated and separate annual financial statements and our
auditor’s report thereon.
Our opinion on the consolidated and separate financial statements does not cover the other information and
we do not express any form of assurance conclusion thereon.
In connection with our audit of the accompanying consolidated and separate financial statements, our
responsibility is to read the other information and, in doing so, consider whether the other information is
materially inconsistent with the consolidated and separate financial statements or our knowledge obtained
in the audit, or otherwise appears to be materially misstated. If, based on the work we have performed, we
conclude that there is a material misstatement of this other information, we are required to report that fact.
We have nothing to report in this regard.
Clover Industries Limited Integrated Report for the year ended 30 June 2018 109

Independent auditor’s report (continued)
Responsibilities of the directors for the consolidated and separate financial statementsThe company directors are responsible for the preparation and fair presentation of the consolidated and
separate financial statements in accordance with IFRSs and the requirements of the Companies Act, 2008,
and for such internal control as the directors determine is necessary to enable the preparation of consolidated
and separate financial statements that are free from material misstatement, whether due to fraud or error.
In preparing the consolidated and separate financial statements, the directors are responsible for assessing
the Group’s and Company’s ability to continue as a going concern, disclosing, as applicable, matters related
to going concern and using the going concern basis of accounting unless the directors either intend to
liquidate the Group and Company or to cease operations, or have no realistic alternative but to do so.
The directors are responsible for overseeing the Group’s financial reporting process.
Auditor’s responsibilities for the audit of the consolidated and separate financial statements Our objectives are to obtain reasonable assurance about whether the consolidated and separate financial
statements as a whole are free from material misstatement, whether due to fraud or error, and to issue an
auditor’s report that includes our opinion. Reasonable assurance is a high level of assurance, but is not a
guarantee that an audit conducted in accordance with ISAs will always detect a material misstatement when
it exists. Misstatements can arise from fraud or error and are considered material if, individually or in the
aggregate, they could reasonably be expected to influence the economic decisions of users taken on the
basis of these consolidated and separate financial statements.
As part of an audit in accordance with ISAs, we exercise professional judgment and maintain professional
scepticism throughout the audit. We also:
• Identify and assess the risks of material misstatement of the consolidated and separate financial
statements, whether due to fraud or error, design and perform audit procedures responsive to those risks,
and obtain audit evidence that is sufficient and appropriate to provide a basis for our opinion. The risk
of not detecting a material misstatement resulting from fraud is higher than for one resulting from error,
as fraud may involve collusion, forgery, intentional omissions, misrepresentations, or the override of
internal control;
• Obtain an understanding of internal control relevant to the audit in order to design audit procedures
that are appropriate in the circumstances, but not for the purpose of expressing an opinion on the
effectiveness of the Group’s internal control;
• Evaluate the appropriateness of accounting policies used and the reasonableness of accounting estimates
and related disclosures made by management;
• Conclude on the appropriateness of the directors’ use of the going concern basis of accounting and,
based on the audit evidence obtained, whether a material uncertainty exists related to events or conditions
that may cast significant doubt on the Group’s and Company’s ability to continue as a going concern.
If we conclude that a material uncertainty exists, we are required to draw attention in our auditor’s report
to the related disclosures in the consolidated and separate financial statements or, if such disclosures are
inadequate, to modify our opinion. Our conclusions are based on the audit evidence obtained up to the
date of our auditor’s report. However, future events or conditions may cause the Group or Company to
cease to continue as a going concern;
• Evaluate the overall presentation, structure and content of the consolidated and separate financial
statements, including the disclosures, and whether the consolidated and separate financial statements
represent the underlying transactions and events in a manner that achieves fair presentation; and
• Obtain sufficient appropriate audit evidence regarding the financial information of the entities or business
activities within the Group to express an opinion on the consolidated and separate financial statements.
We are responsible for the direction, supervision and performance of the group audit. We remain solely
responsible for our audit opinion.
We communicate with the directors regarding, among other matters, the planned scope and timing of the
audit and significant audit findings, including any significant deficiencies in internal control that we identify
during our audit.
We also provide the directors with a statement that we have complied with relevant ethical requirements
regarding independence, and to communicate with them all relationships and other matters that may
reasonably be thought to bear on our independence, and where applicable, related safeguards.
From the matters communicated to the directors, we determine those matters that were of most significance
in the audit of the consolidated and separate financial statements of the current period and are therefore the
key audit matters. We describe these matters in our auditor’s report unless law or regulation precludes public
disclosure about the matter or when, in extremely rare circumstances, we determine that a matter should
not be communicated in our report because the adverse consequences of doing so would reasonably be
expected to outweigh the public interest benefits of such communication.
Report on other legal and regulatory requirementsIn terms of the IRBA Rule published in Government Gazette Number 39475 dated 04 December 2015, we
report that Ernst & Young Inc. has been the auditor of Clover Industries Limited for 24 years.
Ernst & Young Inc. Director – Derek EngelbrechtRegistered Auditor
Chartered Accountant (SA)
26 September 2018
Clover Industries Limited Integrated Report for the year ended 30 June 2018110

Directors’ Report
The directors present their report on the activities and the financial
statements for Clover Industries Ltd (“CIL”) and the Group in respect of
the year ended 30 June 2018.
Nature of businessThe procurement, production, marketing, sales and distribution of
branded consumer goods to customers on the African continent.
Group resultsThe Group’s results for the year are as follows:
2018 2017
R’m R’m
Revenue 8 312,5 10 058,6
Total comprehensive
(loss)/income attributable to
equity holders of the parent
Company (33,1) 141,3
More detailed financial information can be found in the financial report
which forms part of the integrated report.
Subsidiary companies and interests in joint venturesDetails of subsidiary companies are reflected in note 30.1 to the
financial statements and interests in joint ventures and associate in
notes 3.1 and 3.2 to the financial statements.
During the year under review, there were no business combinations.
Instead the Group focussed its attention on curbing rising fixed
costs and the implementation and realisation of planned supply
chain efficiencies. In line with the Group’s stated strategy to expand
its portfolio of value added and branded consumer products, the
Group continued with the introduction of new value-added products,
focusing on the needs of consumers and increased marketing spend to
support the strategy, including new product launch activities.
In addition, the Group was successful in the exit and transfer of the
cyclical low margin drinking milk business from Clover to Dairy Farmers
of South Africa (“DFSA”). The Group currently holds a strategic share
of 26% in DFSA and will continue to render services to DFSA for the
next 19 years with an option to extend the agreement by another five
years. Due to the resignation of the DFSA CEO and Chairman, the
Board took a conservative approach and fully impaired the revolving
credit facility of R439,0 million as at 30 June 2018. More details can be
found in note 13.1.
These transactions and actions are in line with the Group’s stated
strategy to expand its portfolio of value-added and branded
consumer products.
Share capitalDetails of the authorised and issued share capital are disclosed in
note 18 to the financial statements.
A general authority to repurchase ordinary shares of the Company
was granted to the directors by way of a special resolution adopted on
28 November 2017 and is valid until 25 November 2018. Such authority
is subject to the Companies Act and the Listings Requirements of the
JSE. The Listings Requirements of the JSE limit repurchases during any
one year to a maximum of 20% of the issued ordinary share capital at
the time.
There were no new shares issued during the year under review.
DividendsDividends declared and paid by CIL during the year:
2018 2017
R’000 R’000
Ordinary dividends
Declared and paid 50 686 114 802
The Board declared an interim dividend of R50,7 million (2017:
R46,1 million) or 26,56 cents (2017: 24,21 cents) per ordinary share
during February 2018. The cash paid in relation to the interim dividend
amounted to R50,7 million (2017: R36,9 million cash and R9,2 million
by the issue of 482 617 scrip distribution shares). It further declared
a final dividend of R92,9 million or 48,68000 cents per ordinary
share, bringing the total dividend for the year to R143,6 million (2017:
R46,1 million) or 75,24 cents (2017: 24,21 cents) per ordinary share.
Declaration of dividend number 16Notice is hereby given that the directors have declared a final gross
cash dividend of R92,9 million or 46,68000 cents (38,94400 cents
net of dividend withholding tax) per ordinary share for the year ended
30 June 2018.
The dividend has been declared from income reserves.
A dividend withholding tax of 20% will be applicable to all shareholders
who are not exempt.
The Company income tax number is 9657/002/71/4.
The issued share capital at the declaration date is
190 835 364 ordinary shares. The salient dates are as follows:
Last day to trade to receive a dividend Tuesday, 2 October 2018
Shares commence trading “ex” dividend
Wednesday,
3 October 2018
Record date Friday, 5 October 2018
Payment date Monday, 8 October 2018
Share certificates may not be dematerialised or rematerialised
between Wednesday, 3 October 2018 and Friday, 5 October 2018,
both days inclusive.
Directors and Company Secretary Particulars of the present directors and Company Secretary are listed
on pages 20 to 21 and page 26.
Share-based compensationThere were no new share appreciation rights (SARs) awarded during
the current year.
Details of SARs issued and vested in terms of the plan are provided
in the Remuneration Policy and Remuneration Report contained in the
Integrated Report and note 31.
Insurance and risk managementThe Group follows a policy of reviewing the risks relating to assets and
commitments that might flow from the use thereof with its insurers
on an annual basis. Wherever possible, assets are automatically
included. There is also a continuous asset risk control programme,
which is carried out in conjunction with the Group’s insurance brokers.
For further information on the Group’s risk management process
please refer to the report on governance, risk and compliance on
pages 24 to 32.
Property, plant and equipmentThere was no change in the nature of the property, plant and
equipment of the Group or in the policy regarding their use. Capital
expenditure on tangible assets was R214,7 million (2017: R316,9 million)
and R3,4 million (2017: R5,7 million) on intangible assets.
Clover Industries Limited Integrated Report for the year ended 30 June 2018 111

Events after the reporting periodPlease refer to note 34 and the report on risk which contains a detailed
discussion on DFSA and the subsequent decision to contribute an
additional R90m.
Special resolutionsThe following special resolutions were adopted at the annual general
meeting of Clover Industries Limited held on 28 November 2017:
A general authority was given to the board of directors to repurchase
shares in the Company subject to the Companies Act and the JSE
Listings Requirements;
The remuneration of the non-executive directors with effect from
1 July 2017 was approved.
Acknowledgements We express our thanks and appreciation to:
• our shareholders for their support during the year;
• our staff for their dedication to the Clover brand;
• all our suppliers for their support in reducing the costs in the
supply chain;
• the retail and wholesale trade for their support; and
• the consumers who support the Clover brand.
Werner Büchner Johann Vorster
Chairman Chief Executive Officer
26 September 2018
Directors’ report (continued) Directorate and statutory information
Directors: non-executiveWI Büchner (Chairman)
SF Booysen (Dr)# (Lead Independent)
NV Mokhesi#
B Ngonyama#
NA Smith
JW Basson# (Appointed 1 January 2018)
JFM Morgan#^ (Appointed 1 January 2018)#Independent^British national
Directors: executiveJH Vorster (Chief Executive)
FF Scheepers (Chief Financial Officer) (Appointed 1 January 2018)
ER Bosch (Chief Financial Officer) (Resigned 31 December 2017)
Company SecretaryJ van Heerden
Ordinary share codeJSE: CLR, NSX:CLN
ISIN: ZAE000152377
Bond code
JSE: CLRI
Registered office200 Constantia Drive, Constantia Kloof, 1709
Postal addressPO Box 6161, Weltevredenpark, 1715
Telephone(011) 471 1400
Registration number2003/030429/06
Tax number9657/002/71/4
Transfer secretaryComputershare Investor Services Proprietary Limited
Rosebank Towers, 15 Biermann Avenue, Rosebank, 2196
AuditorsErnst & Young Inc.
BankersThe Absa Group, Rand Merchant Bank, Investec Bank
SponsorRand Merchant Bank (a division of FirstRand Bank Limited) (JSE)
Merchantec Capital Namibia Proprietary Limited (NSX)
Clover Industries Limited Integrated Report for the year ended 30 June 2018112
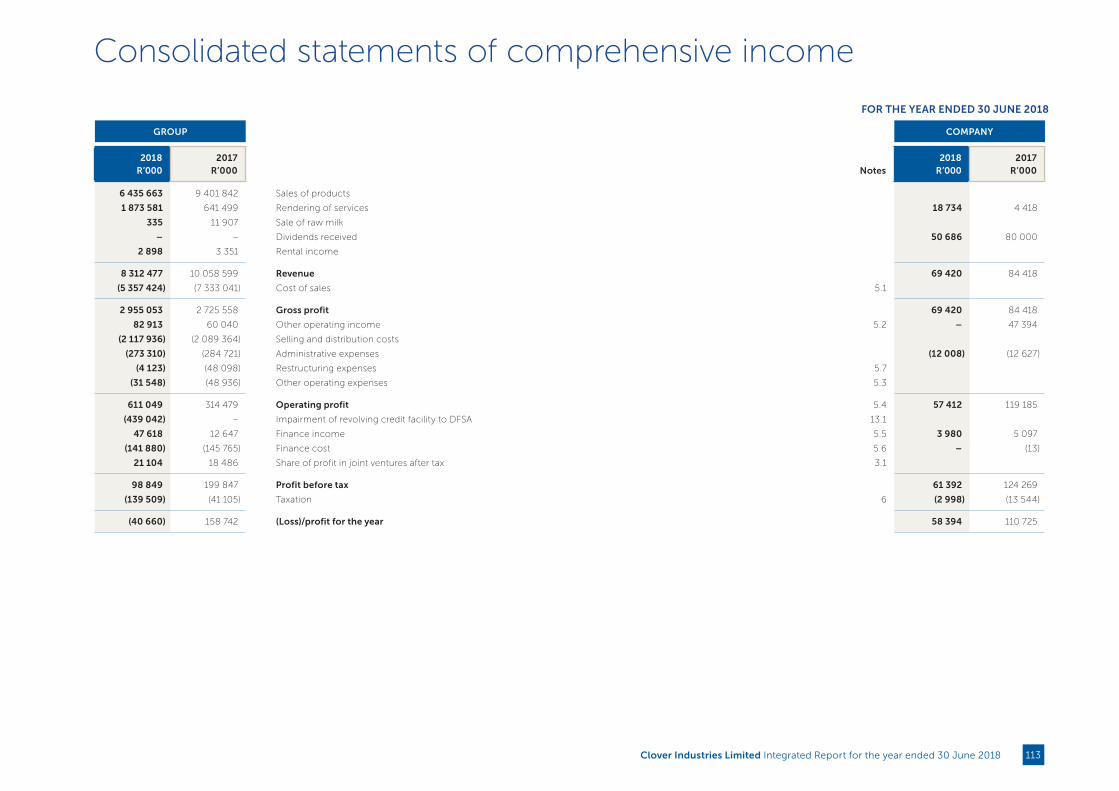
Consolidated statements of comprehensive income
FOR THE YEAR ENDED 30 JUNE 2018
GROUP COMPANY
2018R’000
2017R’000 Notes
2018R’000
2017R’000
6 435 663 9 401 842 Sales of products
1 873 581 641 499 Rendering of services 18 734 4 418
335 11 907 Sale of raw milk
– – Dividends received 50 686 80 000
2 898 3 351 Rental income
8 312 477 10 058 599 Revenue 69 420 84 418
(5 357 424) (7 333 041) Cost of sales 5.1
2 955 053 2 725 558 Gross profit 69 420 84 418
82 913 60 040 Other operating income 5.2 – 47 394
(2 117 936) (2 089 364) Selling and distribution costs
(273 310) (284 721) Administrative expenses (12 008) (12 627)
(4 123) (48 098) Restructuring expenses 5.7
(31 548) (48 936) Other operating expenses 5.3
611 049 314 479 Operating profit 5.4 57 412 119 185
(439 042) – Impairment of revolving credit facility to DFSA 13.1
47 618 12 647 Finance income 5.5 3 980 5 097
(141 880) (145 765) Finance cost 5.6 – (13)
21 104 18 486 Share of profit in joint ventures after tax 3.1
98 849 199 847 Profit before tax 61 392 124 269
(139 509) (41 105) Taxation 6 (2 998) (13 544)
(40 660) 158 742 (Loss)/profit for the year 58 394 110 725
Clover Industries Limited Integrated Report for the year ended 30 June 2018 113

GROUP COMPANY
2018 R’000
2017R’000 Notes
2018R’000
2017R’000
(40 660) 158 742 (Loss)/profit for the year (carried forward from previous page) 58 394 110 725
Other comprehensive income to be reclassified to profit or loss in subsequent periods
7 523 (14 510) Exchange differences on translations of foreign operations, net of tax 20.1
7 523 (14 510) Exchange differences on translations of foreign operations
– – Reclassified to profit or loss
– – Income tax effect
– (2 412) Net gain on cash flow hedges, net of tax
– (9 294) Cash flow hedge fair value adjustment
– 5 944 Reclassified to profit or loss
– 938 Income tax effect
7 523 (16 922) Net other comprehensive income to be reclassified to profit or loss in subsequent periods
(33 137) 141 820 Total comprehensive (loss)/income for the year, net of tax 58 394 110 725
(Loss)/profit attributable to:
(38 021) 158 258 Equity holders of the parent 58 394 110 725
(2 639) 484 Non-controlling interests
(40 660) 158 742 58 394 110 725
Total comprehensive (loss)/income attributed to:
(30 498) 141 336 Equity holders of the parent 58 394 110 725
(2 639) 484 Non-controlling interests
(33 137) 141 820 58 394 110 725
(Loss)/earnings per share (cents)
(19.9) 83.1 Basic (loss)/profit for the year attributable to ordinary equity holders of the parent 7
(19.7) 82.3 Diluted (loss)/profit for the year attributable to ordinary equity holders of the parent 7
Consolidated statements of comprehensive income (continued)
Clover Industries Limited Integrated Report for the year ended 30 June 2018114

Consolidated statements of financial positionAS AT 30 JUNE 2018
GROUP COMPANY
2018R’000
2017 R’000 Notes
2018R’000
2017R’000
Assets Non-current assets
2 417 791 2 427 444 Property, plant and equipment 10 231 232 9 9 Investment properties 11
626 671 650 663 Intangible assets 12 Investment in subsidiaries 30.1 326 735 326 735
46 035 38 946 Investment in joint ventures and associates 30.1 5 781 3 165 Other non-current financial assets 13.1
30 203 45 496 Deferred tax assets 14 77 773 126 490 3 165 723 327 043 327 044
Current assets 869 091 964 630 Inventories 15
1 479 090 1 341 311 Trade and other receivables 16 602 791 563 233 16 829 19 844 Prepayments
3 702 7 165 Income tax receivable 25 760 693 544 863 Cash and short-term deposits 17 29 034 63 241
3 129 405 2 877 813 631 825 626 474 2 719 4 607 Assets classified as held-for-sale 9
6 258 614 6 048 143 Total assets 958 868 953 518 Equity and liabilities Equity
9 542 9 542 Issued share capital 18 9 542 9 542 892 692 892 692 Share premium 18 892 692 892 692 105 689 78 642 Other capital reserves 19 2 169 2 169
17 160 9 637 Foreign currency translation reserve 20.1 1 817 322 1 904 349 Retained earnings 43 471 35 670
2 842 405 2 894 862 Equity attributable to equity holders of the parent 947 874 940 073(17 818) (15 179) Non-controlling interests
2 824 587 2 879 683 Total equity 947 874 940 073 Liabilities Non-current liabilities
665 059 767 621 Interest–bearing loans and borrowings 21
23 226 57 088 Non-controlling interest put options liability 22 75 424 82 595 Employee-related obligations 23
260 309 221 065 Deferred tax liability 14 11 448 25 492 Trade and other payables 24
2 776 9 683 Other non-current financial liabilities 13.2 1 038 242 1 163 544
Current liabilities 1 676 176 1 274 700 Trade and other payables 24 10 638 10 013 685 691 714 304 Interest-bearing loans and borrowings 21
13 639 6 141 Other current financial liabilities 13.2 Income tax payable 25 356 3 432
20 279 9 771 Employee-related obligations 23 2 395 785 2 004 916 10 994 13 4453 434 027 3 168 460 Total liabilities 10 994 13 445
6 258 614 6 048 143 Total equity and liabilities 958 868 953 518
Clover Industries Limited Integrated Report for the year ended 30 June 2018 115
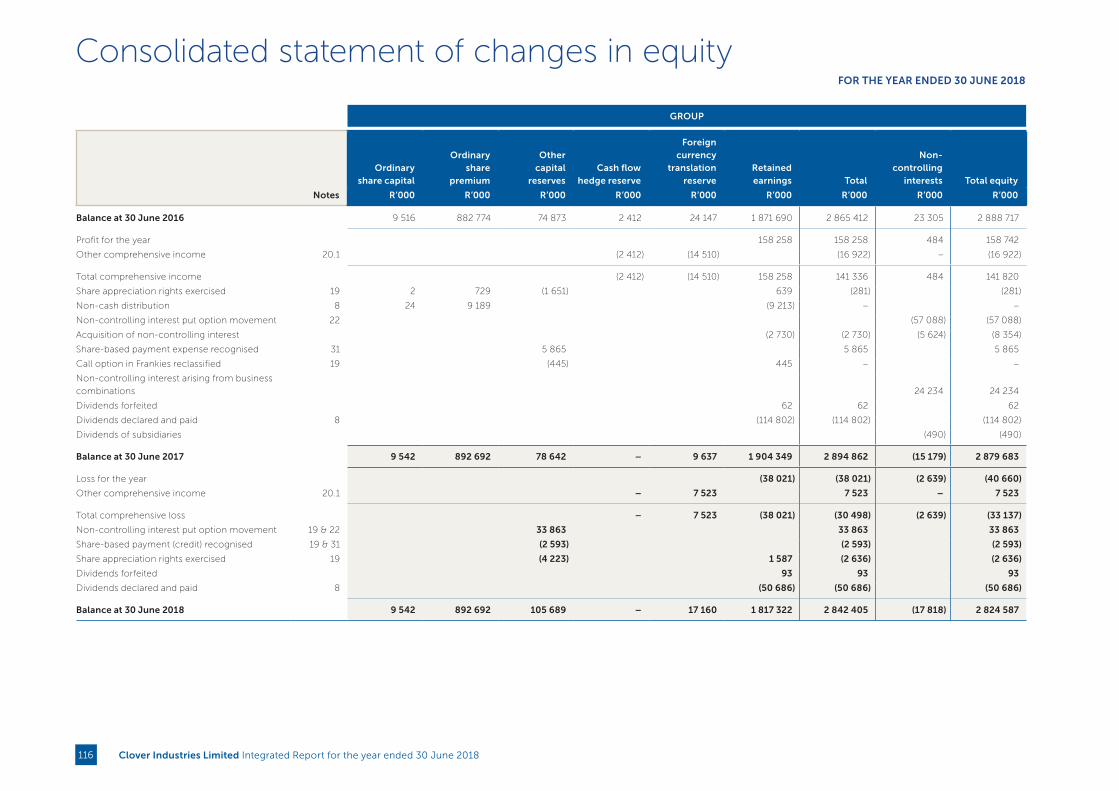
Consolidated statement of changes in equityFOR THE YEAR ENDED 30 JUNE 2018
GROUP
Ordinary
share capital
Ordinary share
premium
Other capital
reservesCash flow
hedge reserve
Foreign currency
translation reserve
Retained earnings Total
Non-controlling
interests Total equity
Notes R’000 R’000 R’000 R’000 R’000 R’000 R’000 R’000 R’000
Balance at 30 June 2016 9 516 882 774 74 873 2 412 24 147 1 871 690 2 865 412 23 305 2 888 717
Profit for the year 158 258 158 258 484 158 742
Other comprehensive income 20.1 (2 412) (14 510) (16 922) – (16 922)
Total comprehensive income (2 412) (14 510) 158 258 141 336 484 141 820
Share appreciation rights exercised 19 2 729 (1 651) 639 (281) (281)
Non-cash distribution 8 24 9 189 (9 213) – –
Non-controlling interest put option movement 22 (57 088) (57 088)
Acquisition of non-controlling interest (2 730) (2 730) (5 624) (8 354)
Share-based payment expense recognised 31 5 865 5 865 5 865
Call option in Frankies reclassified 19 (445) 445 – –
Non-controlling interest arising from business
combinations 24 234 24 234
Dividends forfeited 62 62 62
Dividends declared and paid 8 (114 802) (114 802) (114 802)
Dividends of subsidiaries (490) (490)
Balance at 30 June 2017 9 542 892 692 78 642 – 9 637 1 904 349 2 894 862 (15 179) 2 879 683
Loss for the year (38 021) (38 021) (2 639) (40 660)
Other comprehensive income 20.1 – 7 523 7 523 – 7 523
Total comprehensive loss – 7 523 (38 021) (30 498) (2 639) (33 137)
Non-controlling interest put option movement 19 & 22 33 863 33 863 33 863
Share-based payment (credit) recognised 19 & 31 (2 593) (2 593) (2 593)
Share appreciation rights exercised 19 (4 223) 1 587 (2 636) (2 636)
Dividends forfeited 93 93 93
Dividends declared and paid 8 (50 686) (50 686) (50 686)
Balance at 30 June 2018 9 542 892 692 105 689 – 17 160 1 817 322 2 842 405 (17 818) 2 824 587
Clover Industries Limited Integrated Report for the year ended 30 June 2018116

COMPANY
Ordinary share
capital
Ordinary share
premium
Other capital
reservesRetained earnings Total equity
Notes R’000 R’000 R’000 R’000 R’000
Balance at 1 July 2016 9 516 882 774 2 169 48 898 943 357
Profit for the year 110 725 110 725
Other comprehensive income – –
Total comprehensive income 110 725 110 725
Ordinary shares issued 18 24 9 189 (9213) –
Share appreciation rights exercised 2 729 731
Dividends forfeited 62 62
Dividends declared and paid 8 (114 802) (114 802)
Balance at 30 June 2017 9 542 892 692 2 169 35 670 940 073
Profit for the year 58 394 58 394
Other comprehensive income – –
Total comprehensive income 58 394 58 394
Dividends forfeited 93 93
Dividends declared and paid 8 (50 686) (50 686)
Balance at 30 June 2018 9 542 892 692 2 169 43 471 947 874
Statement of changes in equity FOR THE YEAR ENDED 30 JUNE 2018
Clover Industries Limited Integrated Report for the year ended 30 June 2018 117

Consolidated statements of cash flowsFOR THE YEAR ENDED 30 JUNE 2018
GROUP COMPANY
2018 R’000
2017R’000 Notes
2018 R’000
2017R’000
Operating activities
98 849 199 847 Profit before tax 61 392 124 269
98 849 199 847 Profit before tax 61 392 124 269
Adjustments to reconcile profit before tax to net cash flow
Adjustment for non-cash items:
200 758 183 366 Depreciation of property, plant and equipment 1 1
27 197 22 816 Amortisation of intangible assets
– 6 Depreciation of investment properties
(2 616) (1 422) Fair value adjustments
439 042 – Impairment of revolving credit facility to DFSA
– 4 100 Software licences written off
(200) (9 270) Profit on the sale of Lactolab
– 336 Deconsolidation of Lactolab
(1 272) (33 404) Profit on disposal and scrapping of assets
591 (15 889) Unrealised loss on financial instruments
5 702 (9 321) Unrealised foreign exchange loss/(gain) 5.3
– 11 232 Realised foreign exchange loss/(gain)
(7 089) (7 295) Share of profit of joint venture – net of dividend received 3
3 337 2 213 Movement in provisions
(2 593) 5 865 Share appreciation rights (credit)/expense recognised over vesting period 31
Other adjustments:
141 880 145 765 Finance cost 5.6 – 13
(47 618) (12 647) Finance income 5.5 (3 980) (5 097)
– – Dividends received (50 686) (80 000)
(2 019) – Share appreciation rights paid in cash
(84 424) (47 115) Taxes paid 25 (6 074) (9 184)
Working capital adjustments
95 539 (43 578) Decrease/(Increase) in inventories
(134 764) (36 747) (Increase)/Decrease in trade and other receivables 11 128 (8 835)
387 432 (81 902) Increase/(Decrease) in trade and other payables 625 (79)
1 117 732 276 956 Net cash flows from operating activities 12 406 21 088
Clover Industries Limited Integrated Report for the year ended 30 June 2018118

GROUP COMPANY
2018 R’000
2017R’000 Notes
2018 R’000
2017R’000
1 117 732 276 956 Net cash flows from operating activities 12 406 21 088
Investing activities
32 965 58 941 Proceeds from sale of property, plant and equipment and other assets
– (11 232) Realised foreign exchange loss/(gain)
47 618 12 647 Interest received 5.5 3 980 5 097
(439 042) – Revolving credit facility granted to Dairy Farmers of South Africa Proprietary Limited
(2 020) – Unbundling of Dairy Farmers of South Africa Proprietary Limited
– 10 275 Disposal of controlling interest in Lactolab Proprietary Limited
– (29 639) Acquisition of controlling interest in Clover Pride Proprietary Limited
– 3 854 Cancellation of a finance lease
– – Dividends received – 130 000
(214 743) (316 883) Capital expenditure: tangible assets
(3 425) (5 671) Capital expenditure: intangible assets
(578 647) (277 708) Net cash flows (used in)/from investing activities 3 980 135 097
Financing activities
(112 362) (145 765) Interest paid
5.6 &
25.2 – (13)
(50 593) (115 230) Dividends paid (50 593) (114 802)
– (4 440) Non-controlling interest acquired in Clover Frankies Proprietary Limited
– (3 854) Cancellation of a finance lease
(313 333) (285 668) Repayment of borrowings and finance leases 25.2
150 000 496 975 Proceeds from borrowings 25.2
(326 288) (57 982) Net cash flows (used in)/from financing activities (50 593) (114 815)
212 797 (58 734) Net increase/(decrease) in cash and cash equivalents (34 207) 41 370
3 033 (474) Net foreign exchange difference
544 863 604 071 Cash and cash equivalents at the beginning of the year 63 241 21 871
760 693 544 863 Cash and cash equivalents at the end of the year 17 29 034 63 241
Consolidated statements of cash flows(continued) FOR THE YEAR ENDED 30 JUNE 2018
Clover Industries Limited Integrated Report for the year ended 30 June 2018 119

Annual financial statements NOTES TO THE CONSOLIDATED FINANCIAL STATEMENTS
1. CORPORATE INFORMATIONClover Industries Limited (the “Company”) is a company incorporated and domiciled in South Africa. The consolidated financial statements of the Group for the year ended 30 June 2018 comprise the Company and its subsidiary companies (together referred to as the “Group”) and the Group’s interest in jointly controlled entities. The companies within the Group have coterminous year-ends. The consolidated financial statements of Clover Industries Limited for the year ended 30 June 2018 were authorised for issue in accordance with a resolution of the directors on 26 September 2018. The Group’s operations and principal activities are set out in the Directors’ report.
2. BASIS OF ACCOUNTING2.1 Basis of preparation
a. Statement of complianceThe consolidated and separate financial statements are prepared in compliance with International Financial Reporting Standards (IFRS) and Interpretations of those standards as issued by the International Accounting Standards Board, the SAICA Financial Reporting Guides as issued by the Accounting Practices Committee and Financial Reporting Pronouncements as issued by Financial Reporting Standards Council and the South African Companies Act of 2008.
b. PreparationThe consolidated and separate financial statements are presented in Rands, which is the Company’s functional currency, rounded to the nearest thousand. They are prepared on the historical-cost basis unless otherwise stated.
The preparation of financial statements is in conformity with IFRS and requires management to make judgements, estimates and assumptions that affect the application of policies and reported amounts of assets and liabilities, income and expenses. These estimates and associated assumptions are based on experience and various other factors that are believed to be reasonable under the circumstances, the results of which form the basis of making the judgements about carrying values of assets and liabilities that are not readily apparent from other sources. Actual results may differ significantly from these estimates. The estimates and underlying assumptions are reviewed on an ongoing basis.
Revisions to accounting estimates are recognised in the period in which the estimate is revised if the revision affects only that period, or in the period of the revision and future periods if the revision affects both current and future periods. Judgements made by management that have a significant effect on the financial statements and estimates with a significant risk of material adjustment in the next year are discussed in note 2.4. The accounting policies set out below have been applied consistently to all periods presented in these financial statements unless stated otherwise.
c. Basis of consolidationSubsidiariesSubsidiaries are entities controlled by the Company. Control is achieved when the Group is exposed, or has rights, to variable returns from its involvement with the investee and has the ability to affect those returns through its power over the investee. Specifically, the Group controls an investee if and only if the Group has:
• power over the investee (ie existing rights that give it the current ability to direct the relevant activities of the investee);
• exposure, or rights, to variable returns from its involvement with the investee; and
• the ability to use its power over the investee to affect its returns.
When the Group has less than a majority of the voting or similar rights of an investee, the Group considers all relevant facts and circumstances in assessing whether it has power over an investee, including:
• the contractual arrangement with the other vote holders of the investee;
• rights arising from other contractual arrangements; and
• the Group’s voting rights and potential voting rights.
The Group re-assesses whether or not it controls an investee if facts and circumstances indicate that there are changes to one or more of the three elements of control. Consolidation of a subsidiary begins when the Group obtains control over the subsidiary and ceases when the Group loses control of the subsidiary. Assets, liabilities, income and expenses of a subsidiary acquired or disposed of during the year are included in the consolidated financial statements from the date the Group gains control until the date the Group ceases to control the subsidiary.
Profit or loss and each component of other comprehensive income (“OCI”) are attributed to the equity holders of the parent of the Group and to the non-controlling interests, even if this results in the non-controlling interests having a deficit balance.
When necessary, adjustments are made to the financial statements of subsidiaries to bring their accounting policies into line with the Group’s accounting policies. All intra-group assets and liabilities, equity, income, expenses and cash flows relating to transactions between members of the Group are eliminated in full on consolidation.
A change in the ownership interest of a subsidiary, without a loss of control, is accounted for as an equity transaction.
If the Group loses control over a subsidiary, it:
• derecognises the assets (including goodwill) and liabilities of the subsidiary;
• derecognises the carrying amount of any non-controlling interests;
• recognises the fair value of the consideration received;
• recognises the fair value of any investment retained;
• recognises any surplus or deficit in profit or loss; and
• reclassifies the parent’s share of components previously recognised in OCI to profit or loss or retained earnings, as appropriate, as would be required if the Group had directly disposed of the related assets or liabilities.
• In the stand-alone financial statements of the holding company, the investments in subsidiaries are accounted for at cost less impairment. Cost is adjusted to reflect changes in consideration arising from contingent consideration amendments. Cost also includes direct attributable costs of investments.
Transactions eliminated on consolidation Intra-group balances and unrealised gains and losses or income and expenses arising from intra-group transactions are eliminated in preparing the consolidated financial statements. Unrealised losses are eliminated in the same way as unrealised gains, but only to the extent that there is no evidence of impairment. Impairment losses on transactions are recognised immediately if the loss provides evidence of a reduction in the recoverable amount of related assets.
Non-controlling interestNon-controlling interest represents the portion of profit or loss and the net assets not held by the Group and are presented separately in the statement of comprehensive income and within equity in the consolidated statement of financial position, separately from parent shareholders’ equity.
FOR THE YEAR ENDED 30 JUNE 2018
Clover Industries Limited Integrated Report for the year ended 30 June 2018120
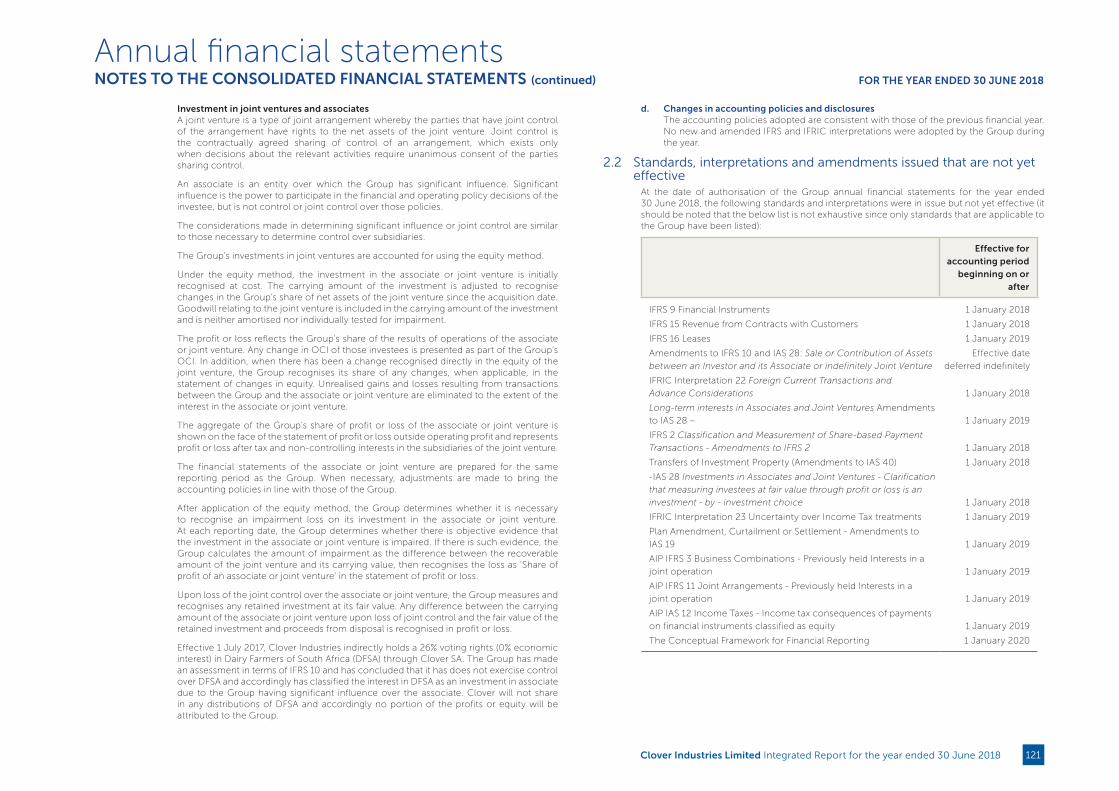
Investment in joint ventures and associatesA joint venture is a type of joint arrangement whereby the parties that have joint control of the arrangement have rights to the net assets of the joint venture. Joint control is the contractually agreed sharing of control of an arrangement, which exists only when decisions about the relevant activities require unanimous consent of the parties sharing control.
An associate is an entity over which the Group has significant influence. Significant influence is the power to participate in the financial and operating policy decisions of the investee, but is not control or joint control over those policies.
The considerations made in determining significant influence or joint control are similar to those necessary to determine control over subsidiaries.
The Group’s investments in joint ventures are accounted for using the equity method.
Under the equity method, the investment in the associate or joint venture is initially recognised at cost. The carrying amount of the investment is adjusted to recognise changes in the Group’s share of net assets of the joint venture since the acquisition date. Goodwill relating to the joint venture is included in the carrying amount of the investment and is neither amortised nor individually tested for impairment.
The profit or loss reflects the Group’s share of the results of operations of the associate or joint venture. Any change in OCI of those investees is presented as part of the Group’s OCI. In addition, when there has been a change recognised directly in the equity of the joint venture, the Group recognises its share of any changes, when applicable, in the statement of changes in equity. Unrealised gains and losses resulting from transactions between the Group and the associate or joint venture are eliminated to the extent of the interest in the associate or joint venture.
The aggregate of the Group’s share of profit or loss of the associate or joint venture is shown on the face of the statement of profit or loss outside operating profit and represents profit or loss after tax and non-controlling interests in the subsidiaries of the joint venture.
The financial statements of the associate or joint venture are prepared for the same reporting period as the Group. When necessary, adjustments are made to bring the accounting policies in line with those of the Group.
After application of the equity method, the Group determines whether it is necessary to recognise an impairment loss on its investment in the associate or joint venture. At each reporting date, the Group determines whether there is objective evidence that the investment in the associate or joint venture is impaired. If there is such evidence, the Group calculates the amount of impairment as the difference between the recoverable amount of the joint venture and its carrying value, then recognises the loss as ‘Share of profit of an associate or joint venture’ in the statement of profit or loss.
Upon loss of the joint control over the associate or joint venture, the Group measures and recognises any retained investment at its fair value. Any difference between the carrying amount of the associate or joint venture upon loss of joint control and the fair value of the retained investment and proceeds from disposal is recognised in profit or loss.
Effective 1 July 2017, Clover Industries indirectly holds a 26% voting rights (0% economic interest) in Dairy Farmers of South Africa (DFSA) through Clover SA. The Group has made an assessment in terms of IFRS 10 and has concluded that it has does not exercise control over DFSA and accordingly has classified the interest in DFSA as an investment in associate due to the Group having significant influence over the associate. Clover will not share in any distributions of DFSA and accordingly no portion of the profits or equity will be attributed to the Group.
d. Changes in accounting policies and disclosuresThe accounting policies adopted are consistent with those of the previous financial year. No new and amended IFRS and IFRIC interpretations were adopted by the Group during the year.
2.2 Standards, interpretations and amendments issued that are not yet effective
At the date of authorisation of the Group annual financial statements for the year ended 30 June 2018, the following standards and interpretations were in issue but not yet effective (it should be noted that the below list is not exhaustive since only standards that are applicable to the Group have been listed):
Effective for accounting period
beginning on or after
IFRS 9 Financial Instruments 1 January 2018
IFRS 15 Revenue from Contracts with Customers 1 January 2018
IFRS 16 Leases 1 January 2019
Amendments to IFRS 10 and IAS 28: Sale or Contribution of Assets
between an Investor and its Associate or indefinitely Joint Venture
Effective date
deferred indefinitely
IFRIC Interpretation 22 Foreign Current Transactions and
Advance Considerations 1 January 2018
Long-term interests in Associates and Joint Ventures Amendments
to IAS 28 – 1 January 2019
IFRS 2 Classification and Measurement of Share-based Payment
Transactions - Amendments to IFRS 2 1 January 2018
Transfers of Investment Property (Amendments to IAS 40) 1 January 2018
-IAS 28 Investments in Associates and Joint Ventures - Clarification
that measuring investees at fair value through profit or loss is an
investment - by - investment choice 1 January 2018
IFRIC Interpretation 23 Uncertainty over Income Tax treatments 1 January 2019
Plan Amendment, Curtailment or Settlement - Amendments to
IAS 19 1 January 2019
AIP IFRS 3 Business Combinations - Previously held Interests in a
joint operation 1 January 2019
AIP IFRS 11 Joint Arrangements - Previously held Interests in a
joint operation 1 January 2019
AIP IAS 12 Income Taxes - Income tax consequences of payments
on financial instruments classified as equity 1 January 2019
The Conceptual Framework for Financial Reporting 1 January 2020
Annual financial statementsNOTES TO THE CONSOLIDATED FINANCIAL STATEMENTS (continued) FOR THE YEAR ENDED 30 JUNE 2018
Clover Industries Limited Integrated Report for the year ended 30 June 2018 121
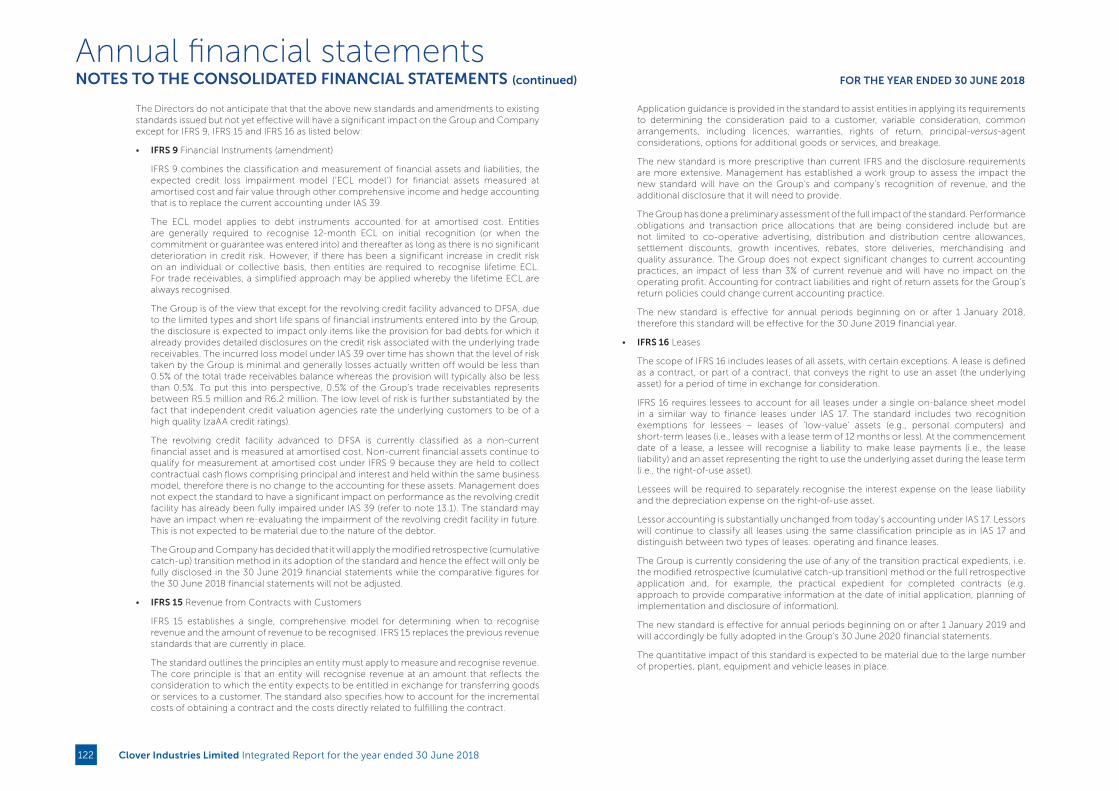
The Directors do not anticipate that that the above new standards and amendments to existing standards issued but not yet effective will have a significant impact on the Group and Company except for IFRS 9, IFRS 15 and IFRS 16 as listed below:
• IFRS 9 Financial Instruments (amendment)
IFRS 9 combines the classification and measurement of financial assets and liabilities, the expected credit loss impairment model (‘ECL model’) for financial assets measured at amortised cost and fair value through other comprehensive income and hedge accounting that is to replace the current accounting under IAS 39.
The ECL model applies to debt instruments accounted for at amortised cost. Entities are generally required to recognise 12-month ECL on initial recognition (or when the commitment or guarantee was entered into) and thereafter as long as there is no significant deterioration in credit risk. However, if there has been a significant increase in credit risk on an individual or collective basis, then entities are required to recognise lifetime ECL. For trade receivables, a simplified approach may be applied whereby the lifetime ECL are always recognised.
The Group is of the view that except for the revolving credit facility advanced to DFSA, due to the limited types and short life spans of financial instruments entered into by the Group, the disclosure is expected to impact only items like the provision for bad debts for which it already provides detailed disclosures on the credit risk associated with the underlying trade receivables. The incurred loss model under IAS 39 over time has shown that the level of risk taken by the Group is minimal and generally losses actually written off would be less than 0.5% of the total trade receivables balance whereas the provision will typically also be less than 0.5%. To put this into perspective, 0.5% of the Group’s trade receivables represents between R5.5 million and R6.2 million. The low level of risk is further substantiated by the fact that independent credit valuation agencies rate the underlying customers to be of a high quality (zaAA credit ratings).
The revolving credit facility advanced to DFSA is currently classified as a non-current financial asset and is measured at amortised cost. Non-current financial assets continue to qualify for measurement at amortised cost under IFRS 9 because they are held to collect contractual cash flows comprising principal and interest and held within the same business model, therefore there is no change to the accounting for these assets. Management does not expect the standard to have a significant impact on performance as the revolving credit facility has already been fully impaired under IAS 39 (refer to note 13.1). The standard may have an impact when re-evaluating the impairment of the revolving credit facility in future. This is not expected to be material due to the nature of the debtor.
The Group and Company has decided that it will apply the modified retrospective (cumulative catch-up) transition method in its adoption of the standard and hence the effect will only be fully disclosed in the 30 June 2019 financial statements while the comparative figures for the 30 June 2018 financial statements will not be adjusted.
• IFRS 15 Revenue from Contracts with Customers
IFRS 15 establishes a single, comprehensive model for determining when to recognise revenue and the amount of revenue to be recognised. IFRS 15 replaces the previous revenue standards that are currently in place.
The standard outlines the principles an entity must apply to measure and recognise revenue. The core principle is that an entity will recognise revenue at an amount that reflects the consideration to which the entity expects to be entitled in exchange for transferring goods or services to a customer. The standard also specifies how to account for the incremental costs of obtaining a contract and the costs directly related to fulfilling the contract.
Application guidance is provided in the standard to assist entities in applying its requirements to determining the consideration paid to a customer, variable consideration, common arrangements, including licences, warranties, rights of return, principal-versus-agent considerations, options for additional goods or services, and breakage.
The new standard is more prescriptive than current IFRS and the disclosure requirements are more extensive. Management has established a work group to assess the impact the new standard will have on the Group’s and company’s recognition of revenue, and the additional disclosure that it will need to provide.
The Group has done a preliminary assessment of the full impact of the standard. Performance obligations and transaction price allocations that are being considered include but are not limited to co-operative advertising, distribution and distribution centre allowances, settlement discounts, growth incentives, rebates, store deliveries, merchandising and quality assurance. The Group does not expect significant changes to current accounting practices, an impact of less than 3% of current revenue and will have no impact on the operating profit. Accounting for contract liabilities and right of return assets for the Group’s return policies could change current accounting practice.
The new standard is effective for annual periods beginning on or after 1 January 2018, therefore this standard will be effective for the 30 June 2019 financial year.
• IFRS 16 Leases
The scope of IFRS 16 includes leases of all assets, with certain exceptions. A lease is defined as a contract, or part of a contract, that conveys the right to use an asset (the underlying asset) for a period of time in exchange for consideration.
IFRS 16 requires lessees to account for all leases under a single on-balance sheet model in a similar way to finance leases under IAS 17. The standard includes two recognition exemptions for lessees – leases of ’low-value’ assets (e.g., personal computers) and short-term leases (i.e., leases with a lease term of 12 months or less). At the commencement date of a lease, a lessee will recognise a liability to make lease payments (i.e., the lease liability) and an asset representing the right to use the underlying asset during the lease term (i.e., the right-of-use asset).
Lessees will be required to separately recognise the interest expense on the lease liability and the depreciation expense on the right-of-use asset.
Lessor accounting is substantially unchanged from today’s accounting under IAS 17. Lessors will continue to classify all leases using the same classification principle as in IAS 17 and distinguish between two types of leases: operating and finance leases.
The Group is currently considering the use of any of the transition practical expedients, i.e. the modified retrospective (cumulative catch-up transition) method or the full retrospective application and, for example, the practical expedient for completed contracts (e.g. approach to provide comparative information at the date of initial application, planning of implementation and disclosure of information).
The new standard is effective for annual periods beginning on or after 1 January 2019 and will accordingly be fully adopted in the Group’s 30 June 2020 financial statements.
The quantitative impact of this standard is expected to be material due to the large number of properties, plant, equipment and vehicle leases in place.
Annual financial statementsNOTES TO THE CONSOLIDATED FINANCIAL STATEMENTS (continued) FOR THE YEAR ENDED 30 JUNE 2018
Clover Industries Limited Integrated Report for the year ended 30 June 2018122
2.3 New standards, new interpretations and amendments to standards adopted in the current period
On 1 July 2017, the Group adopted the following new standards, new interpretations and amendments to standards.
Effective for accounting period
beginning on or after
IAS 7 Disclosure Initiative - Amendments to IAS 7 1 January 2017
IAS 12 Recognition of Deferred Tax Assets for Unrealised Losses -
Amendments to IAS 12 1 January 2017
AIP IFRS 12 Disclosure of Interests in Other Entities Clarification of
the scope of the disclosure requirements in IFRS 12 1 January 2017
The above standards, with the exception of IAS 7, did not have a material impact on the Group. For more details about the effect of IAS 7 please refer to note 25.2.
2.4 Significant accounting judgements and estimates and assumptionsThe preparation of the Group’s consolidated financial statements requires management to make judgements, estimates and assumptions that affect the reported amounts of revenues, expenses, assets and liabilities, and the disclosure of contingent liabilities, at the reporting date. However, uncertainty about these assumptions and estimates could result in outcomes that might require a material adjustment to the carrying amount of the asset or liability affected in the future.
2.4.1 JudgementsIn the process of applying the Group’s consolidated accounting policies, management
has made judgements, which may have significant effects on the amounts recognised
in the financial statements. Such judgements are disclosed in the relevant notes to the
consolidated financial statements.
Cash flow hedgeThe Group purchases diesel on an ongoing basis as its operating activities in the
distribution division require a continuous supply of diesel for the transport of its own
products and those of its principals. The Group’s diesel usage amounts are based on
highly probable factors. The long-futures contracts do not result in the physical delivery
of diesel, but are designated as cash flow hedges to offset the effect of the prices
volatility in diesel. Refer to note 13.
Joint venturesClover Industries indirectly holds a 51% interest in Clover Fonterra and 50,1% of Clover
Futurelife respectively through Clover SA. The Group has classified the interests in
Clover Fonterra and Clover Futurelife as joint ventures despite the fact that the Group
owns more than 50% of the issued share capital. Refer to note 3.
Cell captiveThe cell captive is considered to be a financial asset at fair value through profit or loss
and is not consolidated as there is no control due to the fact that the assets and liabilities
in the cell captive cannot be ring-fenced as required for consolidation.
Operating lease commitments – Group as lesseeLeases of assets under which substantially all the risks and benefits of ownership are
effectively retained by the lessor are classified as operating leases.
Lease payments, net of any incentives received from the lessor under an operating
lease, are recognised in profit or loss over the lease term on a straight-line basis and the
leased assets are not recognised on the Group’s statement of financial position.
2.4.2 Estimates and assumptionsThe key assumptions concerning the future and other key sources of estimation
uncertainty at the reporting date that have a risk of causing an adjustment to the carrying
amounts of assets and liabilities within the next financial year are discussed below:
Property, plant and equipmentThe carrying values of property, plant and equipment are based on management’s
estimates of the useful lives and residual values. These estimates are based on product
life cycles and assessments by engineering and other specialist staff. Refer to note 10.
RebatesThe Group enters into agreements with many of its customers providing for rebates
based upon achievement of specified volumes of sales. For certain agreements, the
rebates increase as a proportion of sales as higher quantities or values of sales are made
relative to the prior period. Customer rebates affect the recorded value of revenue and
trade receivables.
A number of agreements are non-coterminous with the Group's financial year, requiring
judgment over the level of future sales. At the balance sheet date the Directors make
judgments on the amount of rebate that will become payable by the Group under these
agreements based upon prices, volumes and product mix.
Impairment of non-financial assetsThe Group assesses whether there are any indicators of impairment for all non-financial
assets at each reporting date. Goodwill and other indefinite life intangibles are tested for
impairment annually and at other times when such indicators exist. Other non-financial
assets are tested for impairment when there are indicators that the carrying amounts
may not be recoverable.
When value-in-use calculations are undertaken, management must estimate the
expected future cash flows from the asset or cash-generating unit and choose a suitable
discount rate in order to calculate the present value of those cash flows. Refer to note 12.
Share-based payments – equityThe Group measures the cost of equity-settled transactions with employees by
reference to the fair value of the equity instruments at the date at which they are granted.
Estimating fair value requires determining the most appropriate valuation model for a
grant of equity instruments, which is dependent on the terms and conditions of the
grant. The Group is currently using the Hull-White Trinominal Lattice model. This also
requires determining the most appropriate inputs to the valuation model and making
assumptions about them. Refer to note 31.
Deferred tax assetsDeferred tax assets are recognised for all unused tax losses to the extent that it is
probable that taxable profit will be available against which the losses can be utilised.
Significant management judgement is required to determine the amount of deferred
tax assets that can be recognised, based on the likely timing and level of future taxable
profits together with future tax planning strategies.
Annual financial statementsNOTES TO THE CONSOLIDATED FINANCIAL STATEMENTS (continued) FOR THE YEAR ENDED 30 JUNE 2018
Clover Industries Limited Integrated Report for the year ended 30 June 2018 123
Income tax expenseTaxes are a matter of interpretation and subject to changes. The Group makes use of tax
experts to advise on all tax matters. Estimations of normal company tax and capital gains
tax (“CGT”) are based on the advice and management’s interpretation thereof.
Fair value measurement of financial instrumentsWhen the fair values of financial assets and financial liabilities recorded in the statement
of financial position cannot be measured based on quoted prices in active markets, their
fair value is measured using valuation techniques including the discounted cash flow
(“DCF”) model. The inputs to these models are taken from observable markets where
possible, but where this is not feasible, a degree of judgement is required in establishing
fair values. Judgements include considerations of inputs such as liquidity risk, credit risk
and volatility. Changes in assumptions about these factors could affect the reported fair
value of financial instruments. See note 29 for further disclosures.
Cell captiveThe cell captive was entered into to provide insurance to the farmers (the legal structure
of a cell is simply required due to FSB regulation) the investment in the cell is managed
on a fair value basis by Clover. The value of the cell is determined every year-end by
Guardrisk, taking into account the fair value of the instruments invested in at year-end
and the liability for future claims as determined through actuarial assessment. Refer to
note 13.
Put and Call optionsThe value of the call option was calculated by comparing the expected price as per the
contract to a price calculated by using a discounted cash flow model. Estimates and
assumptions were made relating to the future cash flows and the discount rate being
used. Refer to note 13.
Non-controlling interest put options are put options over non-controlling interests
accounted for using the present access method. Written put options in respect of
which the Group does not have an unconditional right to avoid the delivery of cash, are
recognised as financial liabilities.
Under this method, the non-controlling interest is not derecognised when the financial
liability in respect of the put option is recognised, as the non-controlling interest still
has present access to the economic benefits associated with the underlying ownership
interest.
Non-controlling interest put options are initially recognised at the present value of
expected future cash flows and subsequently re-measured at the present value of
expected future cash flows with any changes in value (accretion and interest) through
equity. Refer to note 22.
2.5 Summary of significant accounting policiesa. Financial instruments
A financial instrument is any contract that gives rise to a financial asset of one entity and a financial liability or equity instrument of another entity. Financial assets include, in particular, cash and cash equivalents, trade receivables and other originated loans and receivables as well as derivative and non-derivative financial assets held for trading. Financial liabilities generally substantiate claims for repayment in cash or another financial assets. In particular, this includes interest-bearing loans and borrowings, trade payables, liabilities to banks, finance lease payables and derivative financial liabilities.
Initial recognition and off-settingFinancial instruments are generally recognised as soon as the Group becomes a party under the contractual regulations of the financial instruments. In general, financial assets and financial liabilities are offset and the net amount presented in the statement of financial position, when and only when, the entity currently has a legally enforceable right to set-off the recognised amounts and intends to settle on a net basis or to realise the asset and settle the liability simultaneously. No set-off has occurred during the current and previous financial year.
DerecognitionA financial asset (or, where applicable a part of financial asset or part of a group of similar financial assets) is derecognised when:
• The rights to receive cash flows from the asset have expired;
• The Group retains the right to receive cash flows from the asset, but has assumed an obligation to pay them in full without material delay to a third party under a “pass through” arrangement; or
• The Group has transferred its right to receive cash flows from the asset and either:
• has transferred substantially all the risks and rewards of the asset; or
• has neither transferred nor retained substantially all the risks and rewards of the asset, but has transferred control of the asset.
When the Group has transferred its rights to receive cash flows from an asset and has neither transferred nor retained substantially all the risks and rewards of the asset nor transferred control of the asset, the asset is recognised to the extent of the Group’s continuing involvement with the asset. Continuing involvement that takes a form of a guarantee over the transferred asset is measured at the lower of the original carrying amount of the asset and the maximum amount of consideration that the Group could be required to repay. A financial liability is derecognised when the obligation under the liability is discharged, cancelled or expires. When an existing financial liability is replaced by another from the same lender on substantially different terms, or the terms of the existing liability are substantially modified, such an exchange or modification is treated as a derecognition of the original liability and the recognition of a new liability and the difference in the respective carrying amounts is recognised in profit or loss.
Impairment of financial assetsThe Group assesses, at each reporting date, whether there is objective evidence that a financial asset or a group of financial assets is impaired. An impairment exists if one or more events that has occurred since the initial recognition of the asset (an incurred “loss event”), has an impact on the estimated future cash flows of the financial asset or the group of financial assets that can be reliably estimated. Evidence of impairment may include indications that the debtors or a group of debtors is experiencing significant financial difficulty, default or delinquency in interest or principal payments, the probability that they will enter bankruptcy or other financial re-organisation and observable data indicating that there is a measurable decrease in the estimated future cash flows, such as changes in arrears or economic conditions that correlate with defaults.
Assets carried at amortised cost If there is objective evidence that an impairment loss on assets carried at amortised cost has been incurred, the amount of the loss is measured as the difference between the asset’s carrying amount and the present value of estimated future cash flows (excluding future expected credit losses that have not been incurred) discounted at the financial asset’s original effective interest rate. The carrying amount of the asset is reduced through use of an allowance account. The amount of the loss is recognised in profit or loss.
Annual financial statementsNOTES TO THE CONSOLIDATED FINANCIAL STATEMENTS (continued) FOR THE YEAR ENDED 30 JUNE 2018
Clover Industries Limited Integrated Report for the year ended 30 June 2018124
If, in a subsequent period, the amount of the impairment loss decreases and the decrease can be related objectively to an event occurring after the impairment was recognised, the previously recognised impairment loss is reversed, to the extent that the carrying value of the asset does not exceed the amortised cost that would have been recognised had no impairment been recognised in the past. Any subsequent reversal of an impairment loss is recognised in profit or loss. In relation to trade receivables, a provision for impairment is made when there is objective evidence (such as the probability of insolvency or significant financial difficulties of the debtor) that the Group will not be able to collect all of the amounts due under the original terms of the invoice. The carrying amount of the receivable is reduced through use of an allowance account. Impaired debts are derecognised when they are assessed as uncollectable.
a (i) Financial assets Initial recognition
When financial assets are recognised initially, they are measured at fair value plus, in the case of investments not at fair value through profit or loss, directly attributable transaction costs. The Group determines the classification of its financial assets after initial recognition and, where allowed and appropriate, re-evaluates this designation at each financial year-end. All regular-way purchases and sales of financial assets are recognised on the trade date, i.e. the date that the Group becomes a party to the transaction. Regular-way purchases or sales are purchases or sales of financial assets that require delivery of assets within the period generally established by regulation or convention within the marketplace.
Financial assets at fair value through profit or loss
Financial assets at fair value through profit or loss includes financial assets held for trading, cell captives, call option and financial assets designated upon initial recognition as at fair value through profit or loss.
Financial assets are classified as held-for-trading if they are acquired for the purpose of selling in the near-term. Derivatives are also classified as held-for-trading unless they are designated as effective hedging instruments or a financial guarantee contract. Gains and losses on investments held-for-trading are recognised in profit or loss.
Loans and accounts receivables
Loans and accounts receivables are non-derivative financial assets with fixed determinable payments that are not quoted in an active market. After initial measurement loans and receivables are subsequently carried at amortised cost using the effective interest method less any allowance for impairment. Amortised cost is calculated taking into account any discount or premium on acquisition and includes fees and transaction costs that are an integral part of the effective interest rate. Gains and losses are recognised in profit or loss when the loans and receivables are derecognised or impaired, as well as through the amortisation process.
Cash and cash equivalents
Cash and short-term deposits in the statement of financial position comprise cash at banks and on hand and short-term deposits with a maturity of three months or less and which are subject to an insignificant risk of changes in value.
For the purpose of the consolidated statement of cash flows, cash and cash equivalents consist of cash and short-term deposits, as defined above, net of outstanding bank overdrafts.
a (ii) Financial liabilities Trade and other payables
Short-term trade payables are non-interest-bearing and carried at the original invoice amount.
Financial liabilities at fair value through profit or loss
Financial liabilities at fair value through profit or loss includes derivatives not designated as hedging instruments, put option and financial liabilities designated upon initial recognition as at fair value through profit or loss.
Interest-bearing loans and borrowings
All loans, borrowings and financial liabilities are initially recognised at fair value plus directly attributable transaction costs. After initial recognition, interest bearing loans and borrowings are subsequently measured at amortised cost using the effective interest method. Gains and losses are recognised in profit or loss when the liabilities are derecognised, as well as through the amortisation process. Finance cost are expensed through profit or loss as incurred.
b Financial statements of foreign operations
The assets and liabilities of foreign operations, including goodwill and fair value adjustments arising on consolidation, are translated to Rand at foreign exchange rates ruling at the reporting date. The income and expenses of foreign operations are translated to Rand at rates approximating the foreign exchange rates ruling at the date of the transaction. The exchange differences arising on translation for consolidation are recognised in OCI. On disposal of a foreign operation, the component of OCI relating to that particular foreign operation is recognised in profit or loss.
c Foreign currency transactions
Transactions in foreign currencies are translated at the foreign exchange rate ruling at the date of the transaction. Monetary assets and liabilities denominated in foreign currencies at the reporting date are translated to Rand at the foreign exchange rate ruling at that date. Foreign exchange differences arising on translation are recognised in the profit or loss. Non-monetary assets and liabilities that are measured in terms of historical cost in a foreign currency are translated using the exchange rate at the date of the transaction. Exchange differences arising on translation of foreign subsidiaries during consolidation are recognised in OCI.
d Derivative financial instruments
The Group uses derivative financial instruments to hedge its exposure to foreign exchange and interest rate risks arising from operational, financing and investment activities. In accordance with its treasury policy, the Group does not hold or issue derivative financial instruments for trading purposes. Derivative financial instruments are recognised initially at fair value. Subsequent to initial recognition, derivative financial instruments are re-measured at fair value. The gain or loss on re-measurement to fair value is recognised immediately in profit or loss. The fair value of forward-exchange contracts is their quoted market price at the reporting date, being the present value of the quoted forward price for contracts with similar maturity profiles. The change in the fair value of the hedging derivative is recognised in profit or loss.
e Cash flow hedges
The effective portion of the gain or loss on the hedging instrument is recognised in OCI in the cash flow hedge reserve, while any ineffective portion is recognised immediately in the statement of profit or loss. The ineffective portion relating to foreign currency contracts is recognised in finance costs and the ineffective portion relating to commodity contracts is recognised in other operating income or expenses.
Annual financial statementsNOTES TO THE CONSOLIDATED FINANCIAL STATEMENTS (continued) FOR THE YEAR ENDED 30 JUNE 2018
Clover Industries Limited Integrated Report for the year ended 30 June 2018 125

Amounts recognised as OCI are transferred to profit or loss when the hedged transaction affects profit or loss, such as when the hedged financial income or financial expense is recognised or when a forecast sale occurs.
When the hedged item is the cost of a non-financial asset or non-financial liability, the amounts recognised as OCI are transferred to the initial carrying amount of the non-financial asset or liability.
If the hedging instrument expires or is sold, terminated or exercised without replacement or rollover (as part of the hedging strategy), or if its designation as a hedge is revoked, or when the hedge no longer meets the criteria for hedge accounting, any cumulative gain or loss previously recognised in OCI remains separately in equity until the forecast transaction occurs or the foreign currency firm commitment is met.
f Property, plant and equipment Owned assets
Property, plant and equipment are stated at cost, excluding the costs of day-to-day servicing, less accumulated depreciation and accumulated impairment losses. Such cost includes the cost of replacing significant parts of such plant and equipment when that cost is incurred if the recognition criteria are met. When each major service and/or inspection is performed, its cost is recognised in the carrying amount of the plant and equipment as a replacement if the recognition criteria are satisfied. The carrying amount of the replaced part or service is derecognised. All property, plant and equipment are subsequently measured at cost less accumulated depreciation and accumulated impairment losses. The carrying values of property, plant and equipment are reviewed for impairment when events or changes in circumstances indicate that the carrying value may not be recoverable. An impairment loss is recognised in profit or loss whenever the carrying amount of an asset exceeds its recoverable amount. An item of property, plant and equipment is derecognised upon disposal or when no future economic benefits are expected from its use or disposal. Any gain or loss arising on de-recognition of the asset (calculated as the difference between the net disposal proceeds and the carrying amount of the asset) is included in profit or loss in the year in which the asset is derecognised. The assets’ residual values, useful lives and depreciation methods are reviewed, and adjusted prospectively, if appropriate, at each financial year-end.
Depreciation
Depreciation is recognised in profit or loss on a straight-line basis over the estimated useful lives of the item of property, plant and equipment. Significant parts and inspections are separately depreciated. Land is not depreciated. The estimated useful lives are as follows:
Buildings: 10 to 50 years
Plant: 3 to 30 years
Furniture and equipment: 3 to 20 years
Vehicles: 5 to 10 years
g Non-current assets held for sale
Non-current assets are classified as held for sale if their carrying amount will be recovered principally through a sale transaction rather than through continuing use. This condition is regarded as met, only when the sale is highly probable and the asset is available for immediate sale in its present condition, subject only to terms that are usual and customary for sales of such asset. Management must be committed to the sale, which should be expected to qualify for recognition as a completed sale within one year from the date of classification.
Non-current assets classified as held for sale are measured at the lower of the assets’ previous carrying amount and fair value less costs to sell, other than financial assets and deferred tax assets which continue to be measured in accordance with their relevant accounting standards.
When the Group is committed to a sale plan involving loss of control of a subsidiary, all of the assets and liabilities of that subsidiary are classified as held for sale when the criteria described above are met, regardless of whether the Group will retain a non-controlling interest in its former subsidiary after the sale.
Property, plant and equipment and intangible assets are not depreciated or amortised once classified as held for sale.
h Impairment of non-financial assets
The Group assesses at each reporting date whether there is an indication that an asset may be impaired. If any such indication exists, or when annual impairment testing for an asset is required, the Group makes an estimate of the asset’s recoverable value. An asset’s recoverable value is the higher of an asset’s or cash-generating unit’s fair value less cost of disposal and its value-in-use, and is determined for an individual asset, unless the asset does not generate cash inflows that are largely independent of those from other assets or a group of assets. Where the carrying amount of an asset exceeds its recoverable amount, the asset is considered impaired and is written down to its recoverable amount. In assessing value-in-use, the estimated future cash flows are discounted to their present value using a pre-tax discount rate that reflects current market assessments of the time value of money and the risks specific to the asset. Impairment losses of continuing operations are recognised in profit or loss in those expense categories consistent with the function of the impaired asset.
For assets excluding goodwill, an assessment is made at each reporting date as to whether there is any indication that previously recognised impairment losses may no longer exist or may have decreased. If such indication exists, the recoverable amount is estimated. A previously recognised impairment loss is reversed only if there has been a change in the estimates used to determine the asset’s recoverable amount since the last impairment loss was recognised. If that is the case, the carrying amount of the asset is increased to its recoverable amount. The increased amount cannot exceed the carrying amount that would have been determined, net of depreciation, had no impairment loss been recognised for the asset in previous years. Such a reversal is recognised in profit or loss. After such a reversal, the depreciation charge is adjusted in future periods to allocate the asset’s revised carrying amount, less any residual value, on a systematic basis over its remaining useful life.
i Leases
The determination of whether an arrangement is or contains a lease is based on the substance of the arrangement at inception date and requires an assessment of whether the fulfilment of the arrangement is dependent on the use of a specific asset or assets and whether the arrangement conveys a right to use the asset.
Annual financial statementsNOTES TO THE CONSOLIDATED FINANCIAL STATEMENTS (continued) FOR THE YEAR ENDED 30 JUNE 2018
Clover Industries Limited Integrated Report for the year ended 30 June 2018126

Group as a lessee
Finance leases, which transfer to the Group substantially all the risks and benefits incidental to ownership of the leased item are capitalised at the inception of the lease at the fair value of the leased asset or, if lower, at the present value of the minimum lease payments. Lease payments are apportioned between the finance charges and reduction of the lease liability so as to achieve a constant rate of interest on the remaining balance of the liability. Finance charges are charged directly against income. Capitalised leased assets are depreciated over the shorter of the estimated useful life of the asset and the lease term if there is no reasonable certainty that the Group will obtain ownership by the end of the lease term. Operating lease (those leases that do not transfer substantially all the risks and rewards) payments are recognised as an expense in profit or loss on a straight-line basis over the lease term.
Group as a lessor
Leases where the Group retains substantially all the risks and benefits incidental to ownership of the asset are classified as operating leases.
Initial direct costs incurred in negotiating operating leases are added to the carrying amount of the leased asset and recognised over the lease term on the same basis as rental income.
j Investment properties
Investment properties are properties which are held either to earn rental income or capital appreciation or both. Investment properties are initially measured at cost, including transaction costs. Investment properties are subsequently measured at cost less accumulated depreciation and accumulated impairment. They are tested for impairment if there is an indication of impairment. The estimated useful lives of investment properties are 10 to 50 years and are depreciated using the straight-line basis. The carrying amount includes the cost of replacing part of an existing investment property at the time that cost is incurred if the recognition criteria are met and excludes the costs of day-to-day servicing of an investment property. The carrying amount of the replaced part or service is derecognised. Investment properties are derecognised either when they have been disposed of or when the investment property is permanently withdrawn from use and no future economic benefit is expected from its disposal.
Any gains or losses on the retirement or disposal of an investment property are recognised in profit or loss in the year of retirement or disposal. Transfers are made to investment property when, and only when, there is a change in use, evidenced by the ending of owner-occupation, commencement of an operating lease to another party or construction or development. Transfers are made from investment property when, and only when, there is a change in use, evidenced by commencement of owner-occupation or commencement of development with a view to sale.
k Intangible assets
Intangible assets acquired separately are measured on initial recognition at cost. The cost of intangible assets acquired in a business combination is its fair value as at the date of acquisition. Following initial recognition, intangible assets are carried at cost less any accumulated amortisation and accumulated impairment losses.
Internally generated intangible assets are not capitalised and expenditure is charged in profit or loss in the year in which the expenditure is incurred. The useful lives of intangible assets are assessed to be either finite or indefinite. Intangible assets with finite lives are amortised over their useful economic life and assessed for impairment whenever there is an indication that the intangible asset may be impaired. The amortisation period and the amortisation method for an intangible asset with a finite useful life is reviewed at least at each financial year-end.
Changes in the expected useful life or the expected pattern of consumption of future economic benefits embodied in the asset are accounted for by changing the amortisation period or method, as appropriate, and treated as changes in accounting estimates. The amortisation expense on intangible assets with finite lives is recognised in profit or loss in the expense category consistent with the function of the intangible asset. Intangible assets with indefinite useful lives are tested for impairment annually, either individually or at the cash-generating unit level. Such intangibles are not amortised. The useful life of an intangible asset with an indefinite life is reviewed annually to determine whether indefinite life assessment continues to be supportable. If not, the change in the useful life assessment from indefinite to finite is made on a prospective basis.
Trademarks, customer lists and software licences
Trademarks, patents, customer lists and software licences are measured on initial recognition at cost. Impairment testing is done annually or more frequently when an indication of impairment exists. Gains or losses arising from the de-recognition of an intangible asset are measured as the difference between the net disposal proceeds and the carrying amount of the asset and are recognised in the profit or loss when the asset is derecognised.
Following initial recognition they are amortised on a straight-line basis over a period:
Right of use assets: 5 years
Trademarks and customer lists: 10 to 15 years
Software: 5 to 10 years
Research expenses Research expenses are recognised in profit or loss as incurred.
l Inventories
Inventories are valued at the lower of cost and net realisable value. Costs incurred in bringing each product to its present location and condition are accounted for as follows:
Raw materials: purchase cost on a first-in, first-out basis. Finished goods and work in progress: cost of direct materials and labour and a portion of manufacturing overheads, based on normal operating capacity but excluding finance cost.
Net realisable value is the estimated selling price in the ordinary course of business, less estimated costs of completion and the estimated costs necessary to make the sale.
m Employee-related obligations
It is the policy of the Group to provide for pension liabilities by payments to separate funds, independent of the Group, and contributions are recognised in profit or loss. Surpluses are not accounted for if they accrue to members of the fund.
Defined contribution funds
Obligations for contributions to defined contribution pension and provident plans are recognised as an expense in profit or loss as incurred. A corresponding liability is included in trade payables for unpaid contributions at year-end.
Leave pay
Employees' entitlement to annual leave is recognised when the service is rendered and the obligation accrues. A provision is made on the estimated liability for annual leave as a result of services rendered by employees up to the amount of the accumulated leave obligation.
Annual financial statementsNOTES TO THE CONSOLIDATED FINANCIAL STATEMENTS (continued) FOR THE YEAR ENDED 30 JUNE 2018
Clover Industries Limited Integrated Report for the year ended 30 June 2018 127

Long-service award bonus
The Group reward employees with long service by remunerating them with a lump sum after a specific number of years of services. Refer to note 33 for further detail on valuation method and results.
n Revenue recognition
Revenue is recognised to the extent that it is probable that the economic benefits will flow to the Group and the revenue can be reliably measured. Revenue is measured at the fair value of the consideration received or receivable, taking into account discounts or rebates. With effect from 1 April 2018 the Health Promotion Levy (“sugar tax”), which is administered by the Customs and Excise Act of 1964, was introduced in South Africa. Sugar tax is not directly related to sales, unlike value-added tax (VAT). It is not recognised as a separate item on invoices. Sugar tax is not always directly passed on to customers and the Group cannot reclaim sugar tax (unlike VAT) where customers do not pay for products received. The Group considers sugar tax as a cost to the Group and reflects it in cost of sales and consequently any sugar tax that is recovered in the sales price is included in revenue.
Revenue consists of distribution, sales and merchandising services rendered; contract manufacturing; and rental income. The following specific recognition criteria must also be met before revenue is recognised:
Sales of products
Invoiced product sales are recognised as revenue, excluding value-added taxation but inclusive of sugar tax. Revenue is recognised when the significant risks and rewards of ownership of the goods have passed to the buyer. Revenue comprises invoiced gross sales of products, less discounts, rebates and provisions for product claims.
Services rendered
Revenue from the rendering of services is recognised based on the stage of completion of the service. Services are recognized once the delivery has been made and the performance obligations have been met.
Finance income
Revenue is recognised as interest accrues (using the effective interest rate – i.e. the rate that exactly discounts estimated future cash receipts through the expected life of the financial instrument to the net carrying amount of the financial asset). The Group deposits surplus funds at financial institutions and does not act as a supplier of finance to third parties. Interest received is recognised as finance income.
Dividends received Dividends are recognised when the right to receive payment is established.
Rental income
Rental income from investment property is recognised in profit or loss on a straight-line basis over the term of the lease. Lease incentives granted are recognised as an integral part of the rental income. To optimise the Group’s return on the vast number of non-investment properties it owns, the Group enters into rental agreements from time to time. Income in this regard is recognised as revenue.
o Cost of sales Cost of sales consists of the following:
• Cost of raw milk, ingredients and packaging and sugar tax;
• Milk collection cost;
• Manufacturing direct and indirect costs;
• Primary distribution costs; and
• Charges against sales (i.e. co-op advertising, agent commission, border levies, etc.).
p Finance costs
For all financial instruments measured at amortised cost and interest-bearing financial assets classified as available-for-sale, interest income is recorded using the effective interest rate (EIR). EIR is the rate that exactly discounts the estimated future cash payments or receipts over the expected life of the financial instrument or a shorter period, where appropriate, to the net carrying amount of the financial asset or liability. Interest income is included in finance income in the statement of profit or loss.
q Taxes Current taxation
Current taxation assets and liabilities for the current and previous periods are measured at the amount expected to be recovered from or paid to the taxation authorities. The taxation rates and taxation laws used to compute the amount are those that are enacted or substantively enacted by the reporting date. Current income tax relating to items recognised directly in equity is recognised in equity and not in the statement of comprehensive income. Management periodically evaluates positions taken in the tax returns with respect to situations in which applicable tax regulations are subject to interpretation and establishes provisions where appropriate.
Deferred taxation
Deferred tax is provided using the statement of financial position method on temporary differences between the tax bases of assets and liabilities and their carrying amounts for financial reporting purposes at the reporting date. Deferred tax liabilities are recognised for all taxable temporary differences, except:
• When the deferred tax liability arises from the initial recognition of goodwill or
an asset or liability in a transaction that is not a business combination and, at the
time of the transaction, affects neither the accounting profit nor taxable profit or
loss; and
• In respect of taxable temporary differences associated with investments in
subsidiaries, associates and interests in joint ventures, when the timing of the
reversal of the temporary differences can be controlled and it is probable that
the temporary differences will not reverse in the foreseeable future.
Deferred tax assets are recognised for all deductible temporary differences, the carry forward of unused tax credits and any unused tax losses. Deferred tax assets are recognised to the extent that it is probable that taxable profit will be available against which the deductible temporary differences, and the carry forward of unused tax credits and unused tax losses can be utilised, except:
• When the deferred tax asset relating to the deductible temporary difference arises
from the initial recognition of an asset or liability in a transaction that is not a
business combination and, at the time of the transaction, affects neither the
accounting profit nor taxable profit or loss; and
Annual financial statementsNOTES TO THE CONSOLIDATED FINANCIAL STATEMENTS (continued) FOR THE YEAR ENDED 30 JUNE 2018
Clover Industries Limited Integrated Report for the year ended 30 June 2018128

• In respect of deductible temporary differences associated with investments in
subsidiaries, associates and interests in joint ventures, deferred tax assets are
recognised only to the extent that it is probable that the temporary differences will
reverse in the foreseeable future and taxable profit will be available against which
the temporary differences can be utilised.
Tax benefits acquired as part of a business combination, but not satisfying the criteria for separate recognition at that date, would be recognised subsequently if new information about facts and circumstances changed. The adjustment would either be treated as a reduction to goodwill (as long as it does not exceed goodwill) if it was incurred during the measurement period or in profit or loss.
The carrying amount of deferred tax assets is reviewed at each reporting date and reduced to the extent that it is no longer probable that sufficient taxable profit will be available to allow all or part of the deferred tax asset to be utilised. Unrecognised deferred tax assets are re-assessed at each reporting date and are recognised to the extent that it has become probable that future taxable profit will allow the deferred tax asset to be recovered.
Deferred tax assets and deferred tax liabilities are offset if a legally enforceable right exists to set-of current tax assets against current tax liabilities and the deferred taxes relate to the same taxable entity and the same taxation authority.
Deferred tax assets and liabilities are measured at the tax rates that are expected to apply in the year when the asset is realised or the liability is settled, based on tax rates (and tax laws) that have been enacted or substantively enacted at the reporting date.
Value-added taxation (VAT)
Revenues, expenses, assets and liabilities are recognised net of the amount of VAT, except where the VAT incurred on a purchase of assets or services is not recoverable from the taxation authority, in which case the VAT is recognised as part of the cost of acquisition of the asset or as part of the expense item as applicable. Receivables and payables are stated with the amount of VAT included. The net amount of VAT recoverable from or payable to the taxation authority is included as part of receivables or payables in the statement of financial position.
r Segment reporting
The operating segments are based on the Group’s management and internal reporting structure. The Group’s manufacturing, distribution, other assets and liabilities are totally integrated between the different product groups. The executive directors (the chief operating decision maker) are of the opinion that the operations for individual manufacturing, distribution and product groups are substantially similar and that the risks and returns are likewise similar. As a result, the business of the Group is considered to be a single segment, namely Clover Industries Limited (“CIL”). Refer to note 4 for the detail disclosures.
s Share-based compensation
The Group operates an equity-settled, as well as a cash-settled share-based compensation plan.
Equity-settled share-based compensation plan
The cost of equity-settled transactions is recognised, together with a corresponding increase in other capital reserves in equity, over the period in which the performance and/or service conditions are fulfilled. The cumulative expense recognised for equity-settled transactions at each reporting date until the vesting date reflects the extent to which the vesting period has expired and the Group’s best estimate of the number of equity instruments that will ultimately vest. The profit or loss expense or credit for a period represents the movement in cumulative expense recognised as at the beginning and end of that period, and that do not ultimately vest, except for equity-settled transactions for which vesting is conditional upon a market or non-vesting condition. These are treated as vesting irrespective of whether or not the market or non-vesting condition is satisfied, provided that all other performance and/or service conditions are satisfied. When the terms of an equity-settled transaction award are modified, the minimum expense recognised is the expense as if the terms had not been modified, if the original terms of the award are met. An additional expense is recognised for any modification that increases the total fair value of the share-based payment transaction, or is otherwise beneficial to the employee as measured at the date of modification. When an equity-settled award is cancelled, it is treated as if it vested on the date of cancellation, and any expense not yet recognised for the award is recognised immediately. This includes any award where non-vesting conditions within the control of either the entity or the employee are not met. However, if a new award is substituted for the cancelled award, and designated as a replacement award on the date that it is granted, the cancelled and new awards are treated as if they were a modification of the original award, as described in the previous paragraph. The dilutive effect of outstanding options is reflected as additional share dilution in the computation of diluted earnings per share.
Cash-settled share-based compensation plan
The cost of a cash-settled transaction is measured initially at fair value at the grant date using a modified version of the Hull-White Trinominal Lattice model taking into account the terms and conditions upon which the instruments were granted. This fair value is expensed over the period until vesting with recognition of a corresponding liability. The liability is re-measured at each reporting date up to and including the settlement date with changes in fair value recognised in profit or loss.
t Fair value measurement
The Group measures financial instruments such as derivatives at fair value at each reporting date. Fair values of financial instruments measured at amortised cost are disclosed in note 29. Non-financial assets such as investment properties are measured at cost less accumulated depreciation and accumulated impairment. Its fair values are disclosed in note 11. Fair value is the price that would be received to sell an asset or paid to transfer a liability in an orderly transaction between market participants at the measurement date. The fair value measurement is based on the presumption that the transaction to sell the asset or transfer the liability takes place either:
In the principal market; or in the absence of a principal market, in the most advantageous market for the asset or liability.
The principal or the most advantageous market must be accessible to the Group. The fair value of an asset or a liability is measured using the assumptions that market participants would use when pricing the asset or liability, assuming that market participants act in their economic best interest.
Annual financial statementsNOTES TO THE CONSOLIDATED FINANCIAL STATEMENTS (continued) FOR THE YEAR ENDED 30 JUNE 2018
Clover Industries Limited Integrated Report for the year ended 30 June 2018 129

A fair value measurement of a non-financial asset takes into account a market participant’s ability to generate economic benefits by using the asset in its highest and best use or by selling it to another market participant that would use the asset in its highest and best use.
The Group uses valuation techniques that are appropriate in the circumstances and for which sufficient data are available to measure fair value, maximising the use of relevant observable inputs and minimising the use of unobservable inputs.
All assets and liabilities for which fair value is measured or disclosed in the financial statements are categorised within the fair value hierarchy, described as follows, based on the lowest level input that is significant to the fair value measurement as a whole:
Level 1 — Quoted (unadjusted) market prices in active markets for identical assets or liabilities.
Level 2 — Valuation techniques for which the lowest level input that is significant to the fair value measurement is directly or indirectly observable.
Level 3 — Valuation techniques for which the lowest level input that is significant to the fair value measurement is unobservable
For assets and liabilities that are recognised in the financial statements on a recurring basis, the Group determines whether transfers have occurred between levels in the hierarchy by re-assessing categorisation (based on the lowest level input that is significant to the fair value measurement as a whole) at the end of each reporting period.
External valuers are involved for valuation of significant assets, such as properties. Involvement of external valuers is decided upon by management after discussion with and approval by the Company’s Audit Committee. Selection criteria include market knowledge, reputation, independence and whether professional standards are maintained. Management decides, after discussions with the Group’s external valuers, which valuation techniques and inputs to use for each case.
At each reporting date, management analyses the movements in the values of assets and liabilities which are required to be re-measured or re-assessed as per the Group’s accounting policies. For this analysis, management verifies the major inputs applied in the latest valuation by agreeing the information in the valuation computation to contracts and other relevant documents.
Management, in conjunction with the Group’s external valuers, also compares each change in the fair value of each asset and liability with relevant external sources to determine whether the change is reasonable.
For the purpose of fair value disclosures, the Group has determined classes of assets and liabilities on the basis of the nature, characteristics and risks of the asset or liability and the level of the fair value hierarchy as explained above.
u Government grants
Government grants are recognised where there is reasonable assurance that the grant will be received and all attached conditions will be complied with. When the grant relates to an expense item, it is recognised as income on a systematic basis over the periods that the related costs, for which it is intended to compensate, are expensed. When the grant relates to an asset, it is used to reduce the cost of the asset.
v Current versus non-current classification
The Group presents assets and liabilities in statement of financial position based on current/non-current classification. An asset is current when it is:
• Expected to be realised or intended to be sold or consumed in normal
operating cycle;
• Held primarily for the purpose of trading;
• Expected to be realised within 12 months after the reporting period; or
• Cash or cash equivalent unless restricted from being exchanged or used to settle
a liability for at least 12 months after the reporting period.
All other assets are classified as non-current.
A liability is current when:
• It is expected to be settled in normal operating cycle;
• It is held primarily for the purpose of trading;
• It is due to be settled within 12 months after the reporting period; or
• There is no unconditional right to defer the settlement of the liability for at least
12 months after the reporting period.
The Group classifies all other liabilities as non-current.
Deferred tax assets and liabilities are classified as non-current assets and liabilities.
w Goodwill
Goodwill is initially measured at cost, being the excess of the aggregate of the consideration transferred and the amount recognised for non-controlling interests, and any previous interest held, over the net identifiable assets acquired and liabilities assumed. If the fair value of the net assets acquired is in excess of the aggregate consideration transferred, the Group re-assesses whether it has correctly identified all of the assets acquired and all of the liabilities assumed and reviews the procedures used to measure the amounts to be recognised at the acquisition date. If the re-assessment still results in an excess of the fair value of net assets acquired over the aggregate consideration transferred, then the gain is recognised in profit or loss.
After initial recognition, goodwill is measured at cost less any accumulated impairment losses. For the purpose of impairment testing, goodwill acquired in a business combination is, from the acquisition date, allocated to each of the Group’s cash-generating units that are expected to benefit from the combination, irrespective of whether other assets or liabilities of the acquiree are assigned to those units.
Where goodwill has been allocated to a cash-generating unit and part of the operation within that unit is disposed of, the goodwill associated with the disposed operation is included in the carrying amount of the operation when determining measured based on the relative values of the disposed operation and the portion of the cash-generating unit retained.
Annual financial statementsNOTES TO THE CONSOLIDATED FINANCIAL STATEMENTS (continued) FOR THE YEAR ENDED 30 JUNE 2018
Clover Industries Limited Integrated Report for the year ended 30 June 2018130

3.1 INTEREST IN JOINT VENTURES Clover Industries indirectly holds a 51% interest in Clover Fonterra through Clover SA. Clover Fonterra is involved in the marketing and distribution of dairy-related products. The Group has classified the interest in Clover
Fonterra as a joint venture despite the fact that the Group owns more than 50% of the issued share capital. The shareholder’s agreement is set out in such a way that unanimous consent between the two shareholders is
required for any decisions regarding the relevant activities of the investee. Therefore the Group concluded that they have joint control over the investee. Summarised financial information of the joint venture, based on its
IFRS Financial Statements, and reconciliation with the carrying amount of the investment in consolidated financial statements are set out below:
GROUP COMPANY
2018R’000
2017R’000
2018R’000
2017R’000
Clover Fonterra
Joint venture’s statement of financial position
279 276 136 103 Current assets including cash and cash equivalents of R9,9 million (2017: Rnil million) and inventory R196,6 million (2017: R96,3 million)
2 250 1 840 Non-current assets including deferred tax of R2,3 million (2017: R1,8 million)
(191 262) (61 579) Current liabilities including trade and other payables of R190,2 million (2017: R61,5 million)
90 264 76 364 Equity
51% 51% Portion of the Group’s ownership
46 035 38 946 Carrying amount of the investment
Joint venture’s revenue and profit
610 927 515 117 Revenue
(515 291) (432 673) Cost of sales
(34 286) (32 125) Sales, marketing, distribution and administrative expenses
(866) 140 Other operating (costs)/income
712 285 Finance income
(3 707) (401) Finance cost
57 489 50 343 Profit before taxation
(16 109) (14 096) Income tax expense
41 380 36 247 Profit for the year
51% 51% Portion of the Group’s ownership
21 104 18 486 Group’s share of profit for the year after tax
(14 015) (11 191) Dividend received
7 089 7 295 Net movement
Annual financial statementsNOTES TO THE CONSOLIDATED FINANCIAL STATEMENTS (continued) FOR THE YEAR ENDED 30 JUNE 2018
Clover Industries Limited Integrated Report for the year ended 30 June 2018 131

Clover Industries indirectly holds a 50.1% interest in Clover Futurelife through Clover SA. Clover Futurelife is involved in the manufacturing, distribution, selling and marketing of a range of functional food products using
trademarks under licence from Clover and Futurelife Health Products Proprietary Limited ("Futurelife"). The Group has classified the interest in Clover Futurelife as a joint venture despite the fact that the Group owns more
than 50% of the issued share capital. The shareholder’s agreement is set out in such a way that unanimous consent between the two shareholders is required for any decisions regarding the relevant activities of the investee.
Therefore the Group concluded that they have joint control over the investee. Summarised financial information of the joint venture, based on its IFRS Financial Statements, and reconciliation with the carrying amount of the
investment in consolidated financial statements are set out below:
GROUP COMPANY
2018 R’000
2017R’000
2018 R’000
2017R’000
Clover Futurelife
Joint venture’s statement of financial position
3 310 5 237
Current assets including cash and cash equivalents of R0,8 million (2017:R0,5 million), trade and other receivables of R1,8m (2017: R3,9 million)
and inventory of R0,5 million (2017: R0,8 million)
– 18 Non-current assets
(4 732) (5 268) Current liabilities including trade and other payables of R4,7 million (2017: R5,3 million)
(1 422) (13) Equity
50.1% 50.1% Portion of Group's ownership
– – Carrying amount of investment (Limited to R0)
Joint venture’s revenue and profit
16 970 9 994 Revenue
(9 559) (5017) Cost of sales
(8 859) (5 052) Sales, marketing, distribution and administrative expenses
56 57 Finance income
(1 392) (18) Loss before tax
(18) 5 Income tax expense
(1 410) (13) Loss for the period
50.1% 50.1% Portion of the Group’s ownership
– – Group’s share of loss for the year (Limited to R0)
Total interest in profits from joint ventures
21 104 18 486
Total Group share of profit after tax
46 035 38 946 Total investments in joint ventures
3.1 INTEREST IN JOINT VENTURES (continued)
Annual financial statementsNOTES TO THE CONSOLIDATED FINANCIAL STATEMENTS (continued) FOR THE YEAR ENDED 30 JUNE 2018
Clover Industries Limited Integrated Report for the year ended 30 June 2018132
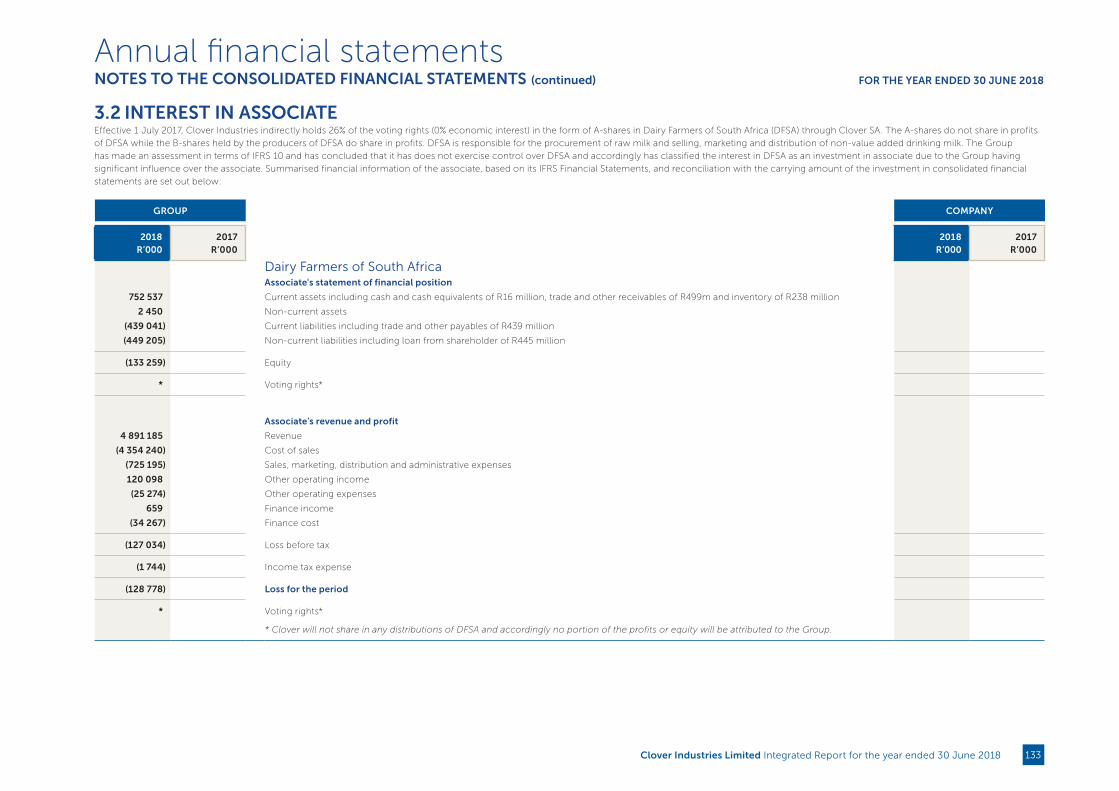
3.2 INTEREST IN ASSOCIATE Effective 1 July 2017, Clover Industries indirectly holds 26% of the voting rights (0% economic interest) in the form of A-shares in Dairy Farmers of South Africa (DFSA) through Clover SA. The A-shares do not share in profits
of DFSA while the B-shares held by the producers of DFSA do share in profits. DFSA is responsible for the procurement of raw milk and selling, marketing and distribution of non-value added drinking milk. The Group
has made an assessment in terms of IFRS 10 and has concluded that it has does not exercise control over DFSA and accordingly has classified the interest in DFSA as an investment in associate due to the Group having
significant influence over the associate. Summarised financial information of the associate, based on its IFRS Financial Statements, and reconciliation with the carrying amount of the investment in consolidated financial
statements are set out below:
GROUP COMPANY
2018R’000
2017R’000
2018R’000
2017R’000
Dairy Farmers of South Africa
Associate's statement of financial position
752 537 Current assets including cash and cash equivalents of R16 million, trade and other receivables of R499m and inventory of R238 million
2 450 Non-current assets
(439 041) Current liabilities including trade and other payables of R439 million
(449 205) Non-current liabilities including loan from shareholder of R445 million
(133 259) Equity
* Voting rights*
Associate’s revenue and profit
4 891 185 Revenue
(4 354 240) Cost of sales
(725 195) Sales, marketing, distribution and administrative expenses
120 098 Other operating income
(25 274) Other operating expenses
659 Finance income
(34 267) Finance cost
(127 034) Loss before tax
(1 744) Income tax expense
(128 778) Loss for the period
* Voting rights*
* Clover will not share in any distributions of DFSA and accordingly no portion of the profits or equity will be attributed to the Group.
Annual financial statementsNOTES TO THE CONSOLIDATED FINANCIAL STATEMENTS (continued) FOR THE YEAR ENDED 30 JUNE 2018
Clover Industries Limited Integrated Report for the year ended 30 June 2018 133

4 SEGMENT REPORTING The Group’s manufacturing, distribution, other assets and liabilities are totally integrated between the different product groups. The executive directors (the chief operating decision maker) are of the opinion that the
operations for individual manufacturing, distribution and product groups are substantially similar and that the risks and returns are likewise similar. As a result, the business of the Group is considered to be a single
segment, namely Clover Industries Limited (“CIL”).
The following information regarding the Group’s product groups, for which no discrete financial information is available, are presented on a voluntary basis. The Group comprises the following main product groups:
• The dairy fluid products is focused on providing the market with quality dairy fluid products and other dairy fluid replacement products;
• The dairy concentrated products consist of cheese, butter, condensed milk and retail milk powders;
• The ingredient products consist of bulk milk powders, bulk butter, bulk condensed milk, bulk creamers, calf feed substitutes, whey powder and buttermilk powder;
• The non-alcoholic beverage products focus on the development and marketing of non-alcoholic, value-added branded beverage products;
• The fermented products and desserts consist of yoghurt, maas and desserts;
• The soya and oil products consist of soya, olive oil and olives; and
• The services rendered product group consists of sales, merchandising, warehousing and distribution services rendered to principals.
30 June 2018Value-added
dairy fluids
Dairy concentrated
products IngredientsNon-alcoholic
beverages
Fermented products and
dessertsOlive oil &
soyaServices
rendered CIL Group
SEGMENT REPORT BY PRODUCT GROUP R'000 R'000 R'000 R'000 R'000 R'000 R'000 R'000
External revenue
Sale of products 1 230 831 1 492 849 176 484 2 409 724 998 847 126 928 6 435 663
Revenue from rendering of services 1 873 581 1 873 581
Sale of raw milk 335 – – – – 335
Charges against sales (19 791) (40 423) (6 830) (68 069) (41 320) (6 323) (182 756)
Cost of material and packaging (714 154) (905 074) (104 269) (976 493) (600 229) (81 997) (3 382 216)
Milk collection cost (9 221) (2 200) (469) (345) (363) – (12 598)
Margin on material and services rendered 488 000 545 152 64 916 1 364 817 356 935 38 608 1 873 581 4 732 009
Reconciliation of margin on material to operating profit
Margin on material and services rendered 4 732 009
Rental income 2 898
Direct and indirect manufacturing cost (1 273 852)
Primary distribution cost (506 002)
Gross profit 2 955 053
Net other costs* (2 339 881)
Restructuring cost (4 123)
Operating profit 611 049
Net financing cost (94 262)
Tax expense (139 509)
Depreciation and amortisation (228 534)
Assets and liabilities
Assets 6 697 656
Liabilities 3 434 027
* Net other costs consists of selling, distribution, administrative and other operating expenses as well as other operating income.
4 SEGMENT REPORTING (continued)
Annual financial statementsNOTES TO THE CONSOLIDATED FINANCIAL STATEMENTS (continued) FOR THE YEAR ENDED 30 JUNE 2018
Clover Industries Limited Integrated Report for the year ended 30 June 2018134

30 June 2017 Dairy fluids
Dairy concentrated
products IngredientsNon-alcoholic
beverages
Fermented products and
desserts Olive oil & soyaServices
rendered CIL GroupSEGMENT REPORT BY PRODUCT GROUP R'000 R'000 R'000 R'000 R'000 R'000 R'000 R'000
External revenue
Sale of products 4 643 600 1 312 575 216 424 2 369 071 794 403 65 769 9 401 842
Revenue from rendering of services 641 499 641 499
Sale of raw milk 11 907 – – – – – 11 907
Charges against sales (97 683) (41 381) (7 363) (41 967) (22 438) (1 260) (212 092)
Cost of material and packaging (2 540 697) (837 497) (129 164) (1 032 004) (545 007) (34 795) (5 119 164)
Milk collection cost (252 269) (40 517) (8 632) (6 358) (6 684) – (314 460)
Margin on material and services rendered 1 764 858 393 180 71 265 1 288 742 220 274 29 714 641 499 4 409 532
Reconciliation of margin on material to operating profit
Margin on material and services rendered 4 409 532
Rental income 3 351
Direct and indirect manufacturing cost (1 250 415)
Primary distribution cost (436 910)
Gross profit 2 725 558
Net other costs* (2 362 981)
Restructuring cost (48 098)
Operating profit 314 479
Net financing cost (133 118)
Tax expense (41 105)
Depreciation and amortisation (206 264)
Assets and liabilities
Assets 6 048 143
Liabilities 3 168 460
* Net other costs consists of selling, distribution, administrative and other operating expenses as well as other operating income.
Group operations outside of South Africa are not material. However, one of the regions is close to becoming material and has been disclosed separately up to margin on material level as part of the segment report by
geographical region on a voluntary basis.
4 SEGMENT REPORTING (continued)
Annual financial statementsNOTES TO THE CONSOLIDATED FINANCIAL STATEMENTS (continued) FOR THE YEAR ENDED 30 JUNE 2018
Clover Industries Limited Integrated Report for the year ended 30 June 2018 135

30 June 2018 South Africa Botswana Other CIL Group
SEGMENT REPORT BY GEOGRAPHICAL REGION R'000 R'000 R'000 R'000
External revenue
Sale of products 5 642 283 560 389 232 991 6 435 663
Revenue from rendering of services 1 873 581 – – 1 873 581
Sale of raw milk 335 – – 335
Charges against sales (165 963) (11 098) (5 695) (182 756)
Cost of material and packaging (2 850 607) (351 647) (179 962) (3 382 216)
Milk collection cost (12 598) – – (12 598)
Margin on material and services rendered 4 487 031 197 644 47 334 4 732 009
30 June 2017 South Africa Botswana Other CIL GroupSEGMENT REPORT BY GEOGRAPHICAL REGION R'000 R'000 R'000 R'000
External revenue
Sale of products 8 703 640 505 944 192 258 9 401 842
Revenue from rendering of services 641 499 – – 641 499
Sale of raw milk 11 907 – – 11 907
Charges against sales (197 839) (8 896) (5 357) (212 092)
Cost of material and packaging (4 664 983) (302 663) (151 518) (5 119 164)
Milk collection cost (314 217) (243) – (314 460)
Margin on material and services rendered 4 180 007 194 142 35 383 4 409 532
2018
R’000 2017^R’000
Sales and services to major customers
Customer 1* 1 395 675 2 135 975
Customer 2* 996 964 2 095 287
Customer 3# 1 169 404 –
Customer 4* 773 875 1 194 880
* Revenue is generated by the Group from these customers within all of the different product segments as listed in the Table: Segment report per product group above.
# Revenue is generated by the Group from this customer only within the services rendered segment as listed in the Table:Segment report per product group above.
^ The 2017 revenue includes revenue from sale of products relating to DFSA. The current year does not include DFSA sales, and therefore a significant decrease.
4 SEGMENT REPORTING (continued)
Annual financial statementsNOTES TO THE CONSOLIDATED FINANCIAL STATEMENTS (continued) FOR THE YEAR ENDED 30 JUNE 2018
Clover Industries Limited Integrated Report for the year ended 30 June 2018136
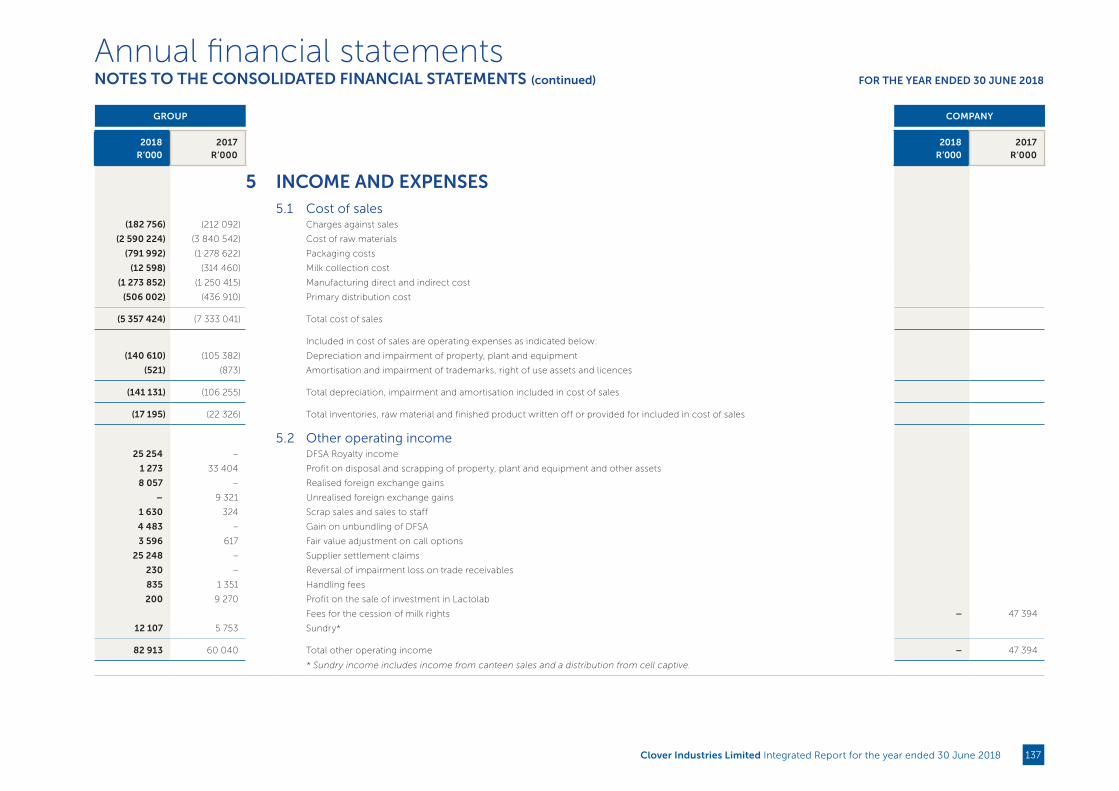
GROUP COMPANY
2018 R’000
2017R’000
2018R’000
2017R’000
5 INCOME AND EXPENSES
5.1 Cost of sales
(182 756) (212 092) Charges against sales
(2 590 224) (3 840 542) Cost of raw materials
(791 992) (1 278 622) Packaging costs
(12 598) (314 460) Milk collection cost
(1 273 852) (1 250 415) Manufacturing direct and indirect cost
(506 002) (436 910) Primary distribution cost
(5 357 424) (7 333 041) Total cost of sales
Included in cost of sales are operating expenses as indicated below:
(140 610) (105 382) Depreciation and impairment of property, plant and equipment
(521) (873) Amortisation and impairment of trademarks, right of use assets and licences
(141 131) (106 255) Total depreciation, impairment and amortisation included in cost of sales
(17 195) (22 326) Total inventories, raw material and finished product written off or provided for included in cost of sales
5.2 Other operating income
25 254 – DFSA Royalty income
1 273 33 404 Profit on disposal and scrapping of property, plant and equipment and other assets
8 057 – Realised foreign exchange gains
– 9 321 Unrealised foreign exchange gains
1 630 324 Scrap sales and sales to staff
4 483 – Gain on unbundling of DFSA
3 596 617 Fair value adjustment on call options
25 248 – Supplier settlement claims
230 – Reversal of impairment loss on trade receivables
835 1 351 Handling fees
200 9 270 Profit on the sale of investment in Lactolab
Fees for the cession of milk rights – 47 394
12 107 5 753 Sundry*
82 913 60 040 Total other operating income – 47 394
* Sundry income includes income from canteen sales and a distribution from cell captive.
Annual financial statementsNOTES TO THE CONSOLIDATED FINANCIAL STATEMENTS (continued) FOR THE YEAR ENDED 30 JUNE 2018
Clover Industries Limited Integrated Report for the year ended 30 June 2018 137

GROUP COMPANY
2018 R’000
2017R’000
2018 R’000
2017R’000
5.3 Other operating expenses
(13 830) (10 466) Write down to net realisable value of consumable stock (engineering spares)
(3 750) (7 991) Loss on hedge for share appreciation rights forward purchases
– (552) Loss on hedge for diesel purchases
– (11 485) Movement in provision on impairment of trade receivables
(980) – Fair value adjustment on cell captive
– (11 232) Realised foreign exchange loss
(5 702) – Unrealised foreign exchange loss
(7 009) (6 750) Royalties
(277) (460) Sundry*
(31 548) (48 936) Total other operating expenses
5.4 Operating profit
Operating profit before finance income/(cost) has been determined after taking into account the following expenses:
Other expenses
(66 673) (49 621) Research expenses
(237 814) (313 801) Distribution and transport cost
Rentals
(50 205) (41 579) • land and buildings
(42 122) (45 221) • equipment
(5 991) (7 449) • vehicles
(1 267) (763) • machines
(4 962) (4 445) • other
Direct operating expenses of investment properties earning rental income
(100) (188) • maintenance
(409 134) (463 067) Total other expenses
Personnel expenses
(1 580 679) (1 630 170) Wages, salaries, bonuses and car allowances
(23 442) (23 115) Company contributions
(104 386) (109 706) Pension and provident fund contributions
(36 080) (36 974) Medical aid fund contributions
(47 921) (64 059) Other personnel expenses
(2 007) (46 779) Retrenchment cost
(1 794 515) (1 910 803) Total personnel expenses
* Sundry operating expenses consist of a number of immaterial items.
5 INCOME AND EXPENSES (continued)
Annual financial statementsNOTES TO THE CONSOLIDATED FINANCIAL STATEMENTS (continued) FOR THE YEAR ENDED 30 JUNE 2018
Clover Industries Limited Integrated Report for the year ended 30 June 2018138

GROUP COMPANY
2018R’000
2017R’000
2018 R’000
2017R’000
Auditors’ remuneration
(9 282) (11 071) Audit fees current year (1 689) (1 842)
– (224) Prior year (under)/over provision
(941) (403) Other fees
(10 223) (11 698) Total auditors’ remuneration (1 689) (1 842)
Depreciation, amortisation and impairment
(60 727) (79 055) Depreciation of property, plant and equipment (1) (1)
– (6) Depreciation of investment properties
(26 676) (21 944) Amortisation of trademarks, right of use assets and licences
(87 403) (101 005) Total depreciation and amortisation included in selling, distribution, restructuring and administrative expenses (1) (1)
5.5 Finance income
11 141 10 601 Bank interest 3 734 4 852
1 551 948 Interest received on call deposits
34 267 – Interest on revolving credit facility advanced
659 1 098 Other 246 245
47 618 12 647 Total finance income 3 980 5 097
5.6 Finance cost
(16 199) (26 366) Bank loans and overdrafts
(85 515) (89 117) Debtors’ securitisation
(33 543) (25 520) Debentures
(6 623) (4 762) Other – (13)
(141 880) (145 765) Total finance cost – (13)
5.7 Restructuring expenses
Restructuring expenses has been determined after taking into account the following expenses:
(2 007) (46 779) Retrenchment expenses
(2 116) – Reallocation cost of existing assets as part Project Sencillo
– (1 319) Other
(4 123) (48 098) Total restructuring expenses
5 INCOME AND EXPENSES (continued)
Annual financial statementsNOTES TO THE CONSOLIDATED FINANCIAL STATEMENTS (continued) FOR THE YEAR ENDED 30 JUNE 2018
Clover Industries Limited Integrated Report for the year ended 30 June 2018 139
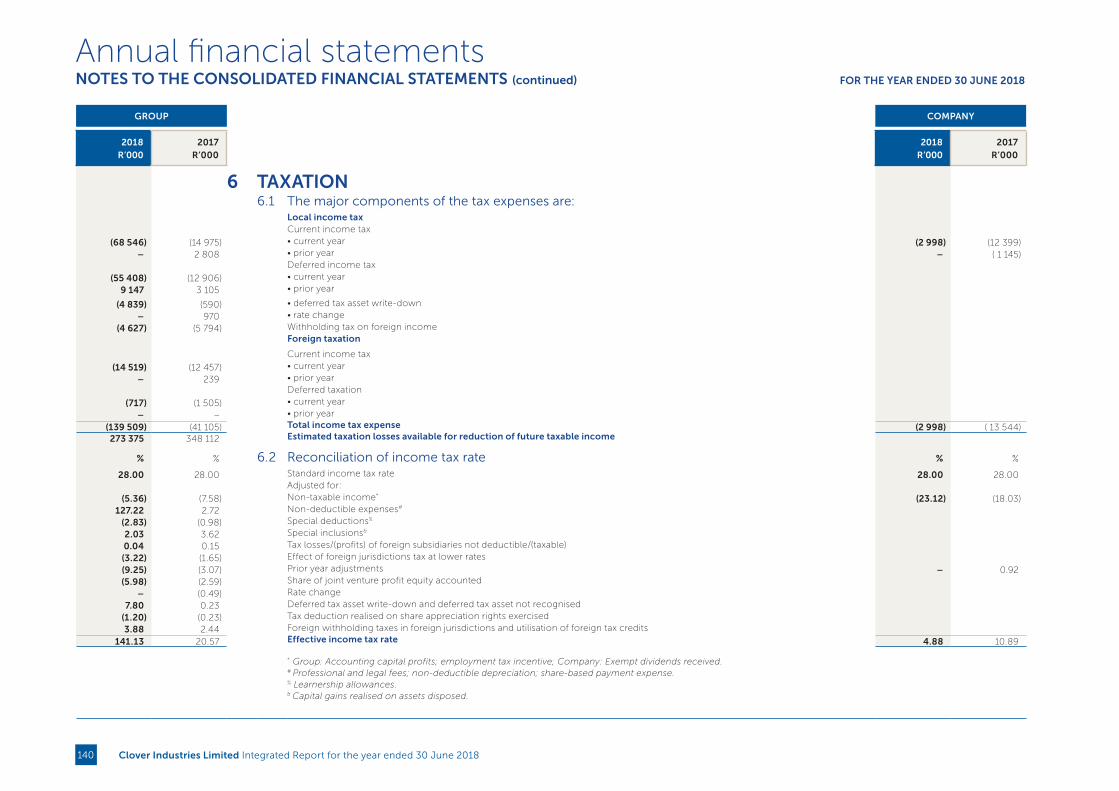
GROUP COMPANY
2018 R’000
2017R’000
2018 R’000
2017R’000
6 TAXATION
6.1 The major components of the tax expenses are:
Local income tax Current income tax
(68 546) (14 975) • current year (2 998) (12 399)– 2 808 • prior year – ( 1 145) Deferred income tax
(55 408) (12 906) • current year 9 147 3 105 • prior year
(4 839) (590) • deferred tax asset write-down – 970 • rate change
(4 627) (5 794) Withholding tax on foreign income Foreign taxation
Current income tax (14 519) (12 457) • current year
– 239 • prior year Deferred taxation
(717) (1 505) • current year – – • prior year
(139 509) (41 105) Total income tax expense (2 998) ( 13 544)273 375 348 112 Estimated taxation losses available for reduction of future taxable income
% % 6.2 Reconciliation of income tax rate % %
28.00 28.00 Standard income tax rate 28.00 28.00 Adjusted for:
(5.36) (7.58) Non-taxable income* (23.12) (18.03)127.22 2.72 Non-deductible expenses#
(2.83) (0.98) Special deductions% 2.03 3.62 Special inclusions& 0.04 0.15 Tax losses/(profits) of foreign subsidiaries not deductible/(taxable) (3.22) (1.65) Effect of foreign jurisdictions tax at lower rates (9.25) (3.07) Prior year adjustments – 0.92(5.98) (2.59) Share of joint venture profit equity accounted
– (0.49) Rate change 7.80 0.23 Deferred tax asset write-down and deferred tax asset not recognised
(1.20) (0.23) Tax deduction realised on share appreciation rights exercised 3.88 2.44 Foreign withholding taxes in foreign jurisdictions and utilisation of foreign tax credits
141.13 20.57 Effective income tax rate 4.88 10.89
* Group: Accounting capital profits; employment tax incentive; Company: Exempt dividends received.
# Professional and legal fees; non-deductible depreciation; share-based payment expense. % Learnership allowances. & Capital gains realised on assets disposed.
Annual financial statementsNOTES TO THE CONSOLIDATED FINANCIAL STATEMENTS (continued) FOR THE YEAR ENDED 30 JUNE 2018
Clover Industries Limited Integrated Report for the year ended 30 June 2018140
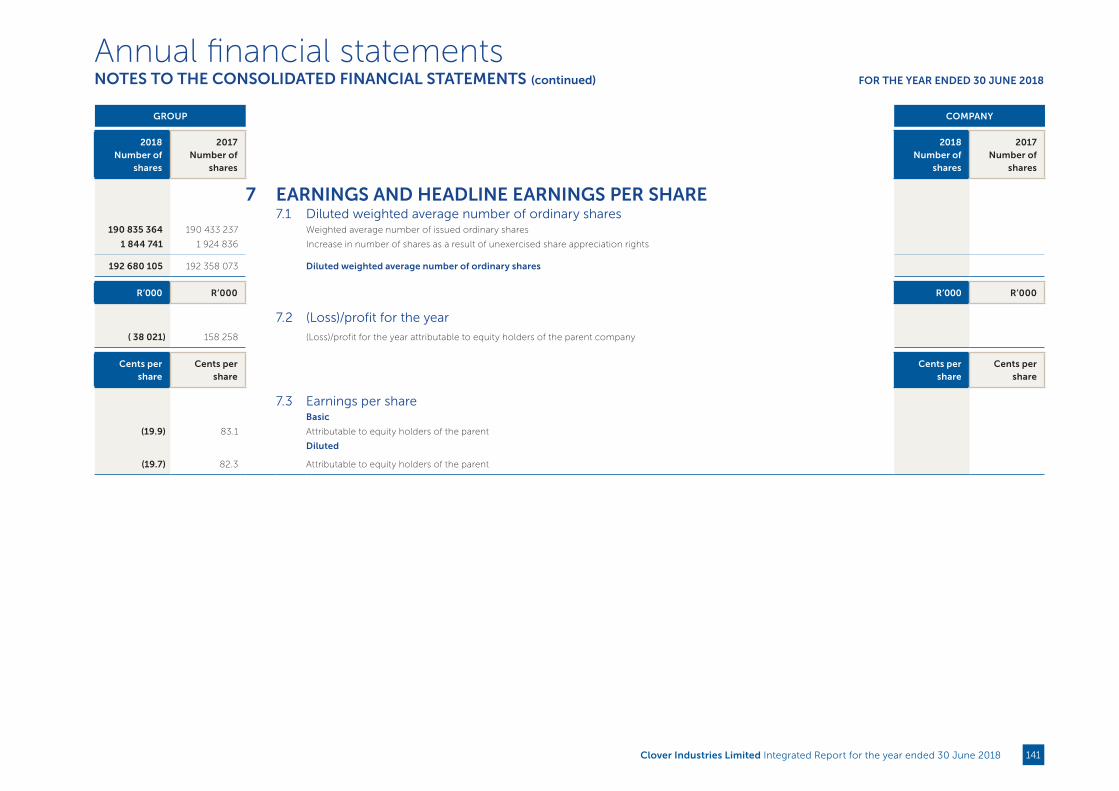
GROUP COMPANY
2018 Number of
shares
2017Number of
shares
2018Number of
shares
2017Number of
shares
7 EARNINGS AND HEADLINE EARNINGS PER SHARE
7.1 Diluted weighted average number of ordinary shares
190 835 364 190 433 237 Weighted average number of issued ordinary shares
1 844 741 1 924 836 Increase in number of shares as a result of unexercised share appreciation rights
192 680 105 192 358 073 Diluted weighted average number of ordinary shares
R’000 R’000 R’000 R’000
7.2 (Loss)/profit for the year
( 38 021) 158 258 (Loss)/profit for the year attributable to equity holders of the parent company
Cents per share
Cents per share
Cents per share
Cents per share
7.3 Earnings per share
Basic
(19.9) 83.1 Attributable to equity holders of the parent
Diluted
(19.7) 82.3 Attributable to equity holders of the parent
Annual financial statementsNOTES TO THE CONSOLIDATED FINANCIAL STATEMENTS (continued) FOR THE YEAR ENDED 30 JUNE 2018
Clover Industries Limited Integrated Report for the year ended 30 June 2018 141
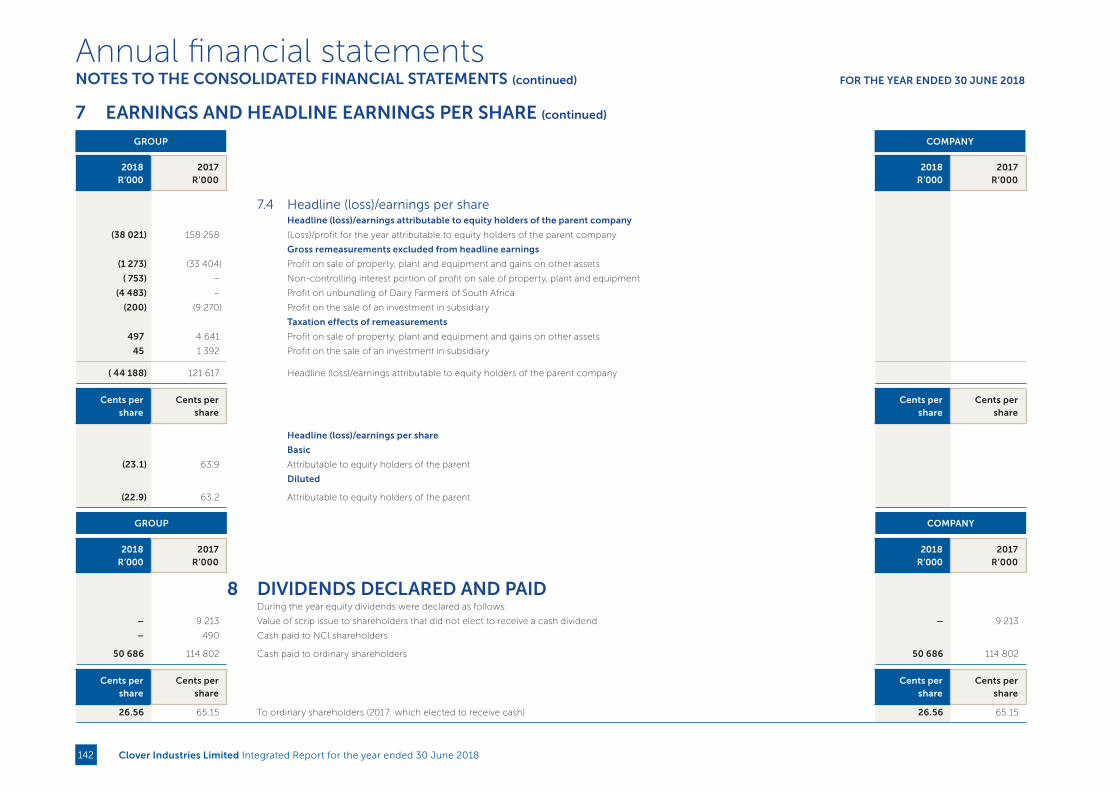
7 EARNINGS AND HEADLINE EARNINGS PER SHARE (continued)
GROUP COMPANY
2018R’000
2017R’000
2018 R’000
2017R’000
7.4 Headline (loss)/earnings per share
Headline (loss)/earnings attributable to equity holders of the parent company
(38 021) 158 258 (Loss)/profit for the year attributable to equity holders of the parent company
Gross remeasurements excluded from headline earnings
(1 273) (33 404) Profit on sale of property, plant and equipment and gains on other assets
( 753) – Non-controlling interest portion of profit on sale of property, plant and equipment
(4 483) – Profit on unbundling of Dairy Farmers of South Africa
(200) (9 270) Profit on the sale of an investment in subsidiary
Taxation effects of remeasurements
497 4 641 Profit on sale of property, plant and equipment and gains on other assets
45 1 392 Profit on the sale of an investment in subsidiary
( 44 188) 121 617 Headline (loss)/earnings attributable to equity holders of the parent company
Cents per share
Cents per share
Cents per share
Cents per share
Headline (loss)/earnings per share
Basic
(23.1) 63.9 Attributable to equity holders of the parent
Diluted
(22.9) 63.2 Attributable to equity holders of the parent
GROUP COMPANY
2018 R’000
2017R’000
2018 R’000
2017R’000
8 DIVIDENDS DECLARED AND PAID
During the year equity dividends were declared as follows:
– 9 213 Value of scrip issue to shareholders that did not elect to receive a cash dividend – 9 213
– 490 Cash paid to NCI shareholders
50 686 114 802 Cash paid to ordinary shareholders 50 686 114 802
Cents per share
Cents per share
Cents per share
Cents per share
26.56 65.15 To ordinary shareholders (2017: which elected to receive cash) 26.56 65.15
Annual financial statementsNOTES TO THE CONSOLIDATED FINANCIAL STATEMENTS (continued) FOR THE YEAR ENDED 30 JUNE 2018
Clover Industries Limited Integrated Report for the year ended 30 June 2018142

GROUP COMPANY
2018 R’000
2017R’000
2018 R’000
2017R’000
9 ASSETS CLASSIFIED AS HELD-FOR-SALE
4 607 10 907 Net book value at the beginning of the year made up as follows:
264 2 225 – Plant and equipment
4 343 8 682 – Freehold land and buildings
2 719 10 506 Transfers from Property, plant and equipment
(4 607) (15 114) Disposals
– (1 692) Disposal of subsidiary
2 719 4 607 Net book value at the end of the year made up as follows:
– 264 – Plant and equipment
2 719 4 343 – Freehold land and buildings
Certain properties are classified as assets held-for-sale following the decision of the Group’s management to sell certain properties no longer
required for Group operations. The fair value of the disposal group exceeds the carrying value.
Sales are expected to be realised within the next six months.
The Group was successful in selling one the properties held by RBC situated in Stikland, Cape Town during the year. An offer to purchase was
received by CSA for the property (land and buildings) situated at Bethlehem but the transfer was not yet finalised as at 30 June 2018. Transfer
took place after year end. The balance at year end represents only the Bethlehem property.
Annual financial statementsNOTES TO THE CONSOLIDATED FINANCIAL STATEMENTS (continued) FOR THE YEAR ENDED 30 JUNE 2018
Clover Industries Limited Integrated Report for the year ended 30 June 2018 143

10 PROPERTY, PLANT AND EQUIPMENT GROUP COMPANY
2018 2018
Freehold land and buildings
Leasehold properties
Plant and equipment Vehicles
Capital work-in-progress Total
Freehold land and buildings
R'000 R'000 R'000 R'000 R'000 R'000 R'000
Cost
Balance at 1 July 2017 1 027 009 53 226 2 339 556 4 865 248 031 3 672 687 250
Capitalised 19 529 5 735 292 175 262 (317 701) – –
Capital expenditure – – – – 217 383 217 383 –
Transfer to assets classified as held-for-sale (4 452) – – – – (4 452) –
Disposals and scrappings (287) – (89 613) (357) – (90 257) –
Unbundling of Dairy Farmers of South Africa (Pty) Ltd – – (41) – (344) (385) –
Foreign exchange translations – 1 433 2 825 52 54 4 364 –
Balance at 30 June 2018 1 041 799 60 394 2 544 902 4 822 147 423 3 799 340 250
Accumulated depreciation and impairment
Balance at 1 July 2017 (247 407) (14 151) (980 952) (2 733) – (1 245 243) (18)
Depreciation for the year (29 262) (3 013) (168 323) (360) – (200 958) (1)
Disposals and scrappings 287 – 63 428 355 – 64 070 –
Transfer to assets classified as held-for-sale 1 733 – – – – 1 733 –
Unbundling of Dairy Farmers of South Africa (Pty) Ltd – – 2 – – 2 –
Foreign exchange translations – (215) (903) (35) – (1 153)
Balance at 30 June 2018 (274 649) (17 379) (1 086 748) (2 773) – (1 381 549) (19)
Net book value as at 30 June 2018 767 150 43 015 1 458 154 2 049 147 423 2 417 791 231
Registers containing details of land are available for inspection at the registered office. The carrying value of plant and equipment held under finance leases and hire purchase contracts at 30 June 2018 was R20,5 million (2017: R19,9 million). Additions during the year were R 2,64 million (2017: R Nil) of plant, equipment and vehicles held under finance lease and hire purchase agreements. Leased assets and assets bought under hire purchase contracts are pledged as security for the related finance lease and hire purchase liabilities.
Assets with an original cost price of R56 million (2017: R76,8 million) are still in use, although it has been fully depreciated.
Annual financial statementsNOTES TO THE CONSOLIDATED FINANCIAL STATEMENTS (continued) FOR THE YEAR ENDED 30 JUNE 2018
Clover Industries Limited Integrated Report for the year ended 30 June 2018144
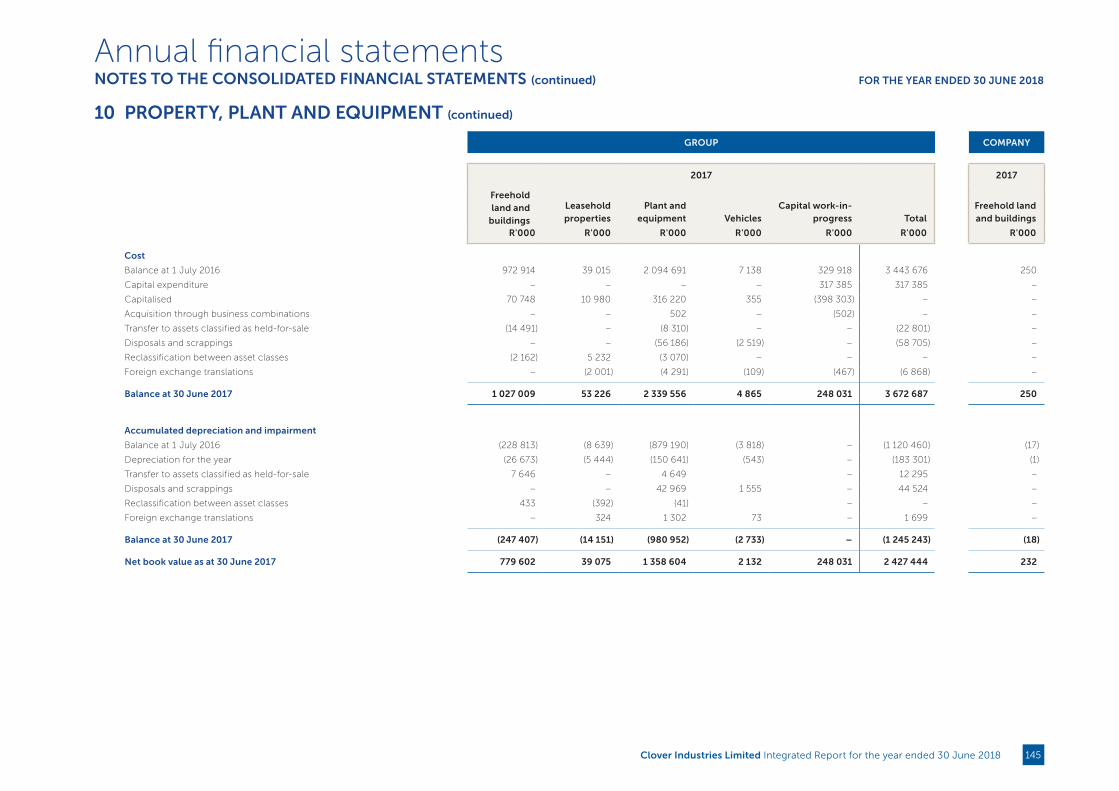
GROUP COMPANY
2017 2017
Freehold land and
buildings
Leasehold properties
Plant and equipment Vehicles
Capital work-in-progress Total
Freehold land and buildings
R'000 R'000 R'000 R'000 R'000 R'000 R'000
Cost
Balance at 1 July 2016 972 914 39 015 2 094 691 7 138 329 918 3 443 676 250
Capital expenditure – – – – 317 385 317 385 –
Capitalised 70 748 10 980 316 220 355 (398 303) – –
Acquisition through business combinations – – 502 – (502) – –
Transfer to assets classified as held-for-sale (14 491) – (8 310) – – (22 801) –
Disposals and scrappings – – (56 186) (2 519) – (58 705) –
Reclassification between asset classes (2 162) 5 232 (3 070) – – – –
Foreign exchange translations – (2 001) (4 291) (109) (467) (6 868) –
Balance at 30 June 2017 1 027 009 53 226 2 339 556 4 865 248 031 3 672 687 250
Accumulated depreciation and impairment
Balance at 1 July 2016 (228 813) (8 639) (879 190) (3 818) – (1 120 460) (17)
Depreciation for the year (26 673) (5 444) (150 641) (543) – (183 301) (1)
Transfer to assets classified as held-for-sale 7 646 – 4 649 – 12 295 –
Disposals and scrappings – – 42 969 1 555 – 44 524 –
Reclassification between asset classes 433 (392) (41) – – –
Foreign exchange translations – 324 1 302 73 – 1 699 –
Balance at 30 June 2017 (247 407) (14 151) (980 952) (2 733) – (1 245 243) (18)
Net book value as at 30 June 2017 779 602 39 075 1 358 604 2 132 248 031 2 427 444 232
10 PROPERTY, PLANT AND EQUIPMENT (continued)
Annual financial statementsNOTES TO THE CONSOLIDATED FINANCIAL STATEMENTS (continued) FOR THE YEAR ENDED 30 JUNE 2018
Clover Industries Limited Integrated Report for the year ended 30 June 2018 145
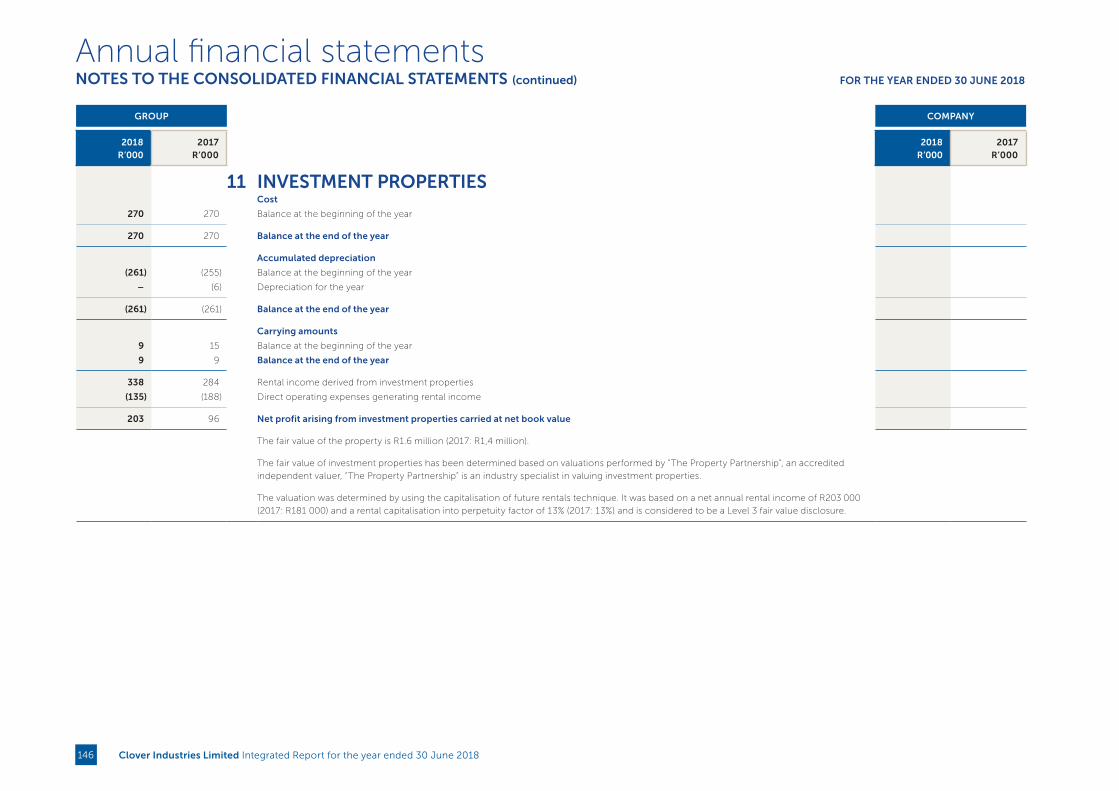
GROUP COMPANY
2018 R’000
2017R’000
2018 R’000
2017R’000
11 INVESTMENT PROPERTIES
Cost
270 270 Balance at the beginning of the year
270 270 Balance at the end of the year
Accumulated depreciation
(261) (255) Balance at the beginning of the year
– (6) Depreciation for the year
(261) (261) Balance at the end of the year
Carrying amounts
9 15 Balance at the beginning of the year
9 9 Balance at the end of the year
338 284 Rental income derived from investment properties
(135) (188) Direct operating expenses generating rental income
203 96 Net profit arising from investment properties carried at net book value
The fair value of the property is R1.6 million (2017: R1,4 million).
The fair value of investment properties has been determined based on valuations performed by “The Property Partnership”, an accredited
independent valuer, “The Property Partnership” is an industry specialist in valuing investment properties.
The valuation was determined by using the capitalisation of future rentals technique. It was based on a net annual rental income of R203 000
(2017: R181 000) and a rental capitalisation into perpetuity factor of 13% (2017: 13%) and is considered to be a Level 3 fair value disclosure.
Annual financial statementsNOTES TO THE CONSOLIDATED FINANCIAL STATEMENTS (continued) FOR THE YEAR ENDED 30 JUNE 2018
Clover Industries Limited Integrated Report for the year ended 30 June 2018146

12 INTANGIBLE ASSETS GROUP
2018
Goodwill
Trademarks and customer
listsSoftware licences Right-of-use
Capital work-in-progress –
software Total
R'000 R'000 R'000 R'000 R'000 R'000
Cost
Balance at 1 July 2017 402 324 180 721 125 323 9 579 48 685 766 632
Capital Expenditure – – – – 3 425 3 425
Capitalised – – 25 079 – (25 079) –
Disposals and scrappings – – (5 536) – – (5 536)
Balance at 30 June 2018 402 324 180 721 144 866 9 579 27 031 764 521
–
Accumulated amortisation and impairment –
Balance at 1 July 2017 (1 311) (36 876) (72 927) (4 855) – (115 969)
Amortisation for the year – (12 684) (11 672) (2 841) – (27 197)
Disposals and scrappings – – 5 316 – – 5 316
Balance at 30 June 2018 (1 311) (49 560) (79 283) (7 696) – (137 850)
Net book value as at 30 June 2018 401 013 131 161 65 583 1 883 27 031 626 671
Annual financial statementsNOTES TO THE CONSOLIDATED FINANCIAL STATEMENTS (continued) FOR THE YEAR ENDED 30 JUNE 2018
Clover Industries Limited Integrated Report for the year ended 30 June 2018 147
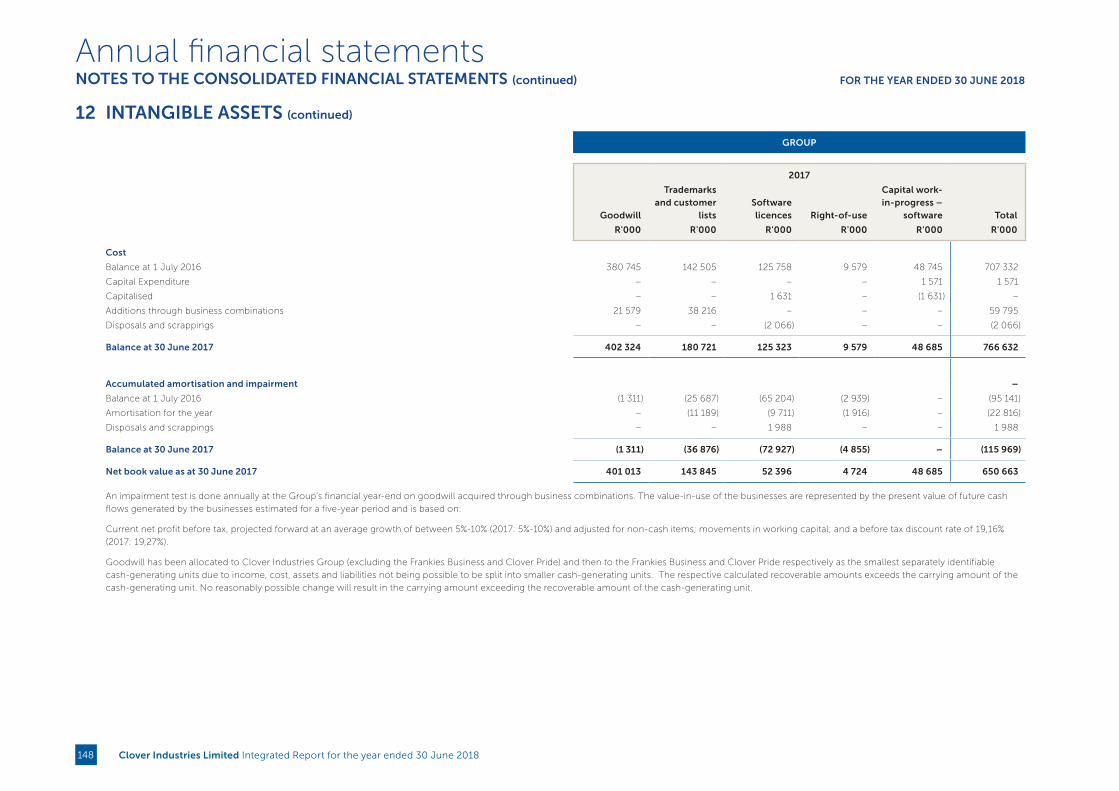
GROUP
2017
Goodwill
Trademarks and customer
listsSoftware licences Right-of-use
Capital work-in-progress –
software Total
R'000 R'000 R'000 R'000 R'000 R'000
Cost
Balance at 1 July 2016 380 745 142 505 125 758 9 579 48 745 707 332
Capital Expenditure – – – – 1 571 1 571
Capitalised – – 1 631 – (1 631) –
Additions through business combinations 21 579 38 216 – – – 59 795
Disposals and scrappings – – (2 066) – – (2 066)
Balance at 30 June 2017 402 324 180 721 125 323 9 579 48 685 766 632
Accumulated amortisation and impairment –
Balance at 1 July 2016 (1 311) (25 687) (65 204) (2 939) – (95 141)
Amortisation for the year – (11 189) (9 711) (1 916) – (22 816)
Disposals and scrappings – – 1 988 – – 1 988
Balance at 30 June 2017 (1 311) (36 876) (72 927) (4 855) – (115 969)
Net book value as at 30 June 2017 401 013 143 845 52 396 4 724 48 685 650 663
An impairment test is done annually at the Group’s financial year-end on goodwill acquired through business combinations. The value-in-use of the businesses are represented by the present value of future cash
flows generated by the businesses estimated for a five-year period and is based on:
Current net profit before tax, projected forward at an average growth of between 5%-10% (2017: 5%-10%) and adjusted for non-cash items; movements in working capital; and a before tax discount rate of 19,16%
(2017: 19,27%).
Goodwill has been allocated to Clover Industries Group (excluding the Frankies Business and Clover Pride) and then to the Frankies Business and Clover Pride respectively as the smallest separately identifiable
cash-generating units due to income, cost, assets and liabilities not being possible to be split into smaller cash-generating units. The respective calculated recoverable amounts exceeds the carrying amount of the
cash-generating unit. No reasonably possible change will result in the carrying amount exceeding the recoverable amount of the cash-generating unit.
12 INTANGIBLE ASSETS (continued)
Annual financial statementsNOTES TO THE CONSOLIDATED FINANCIAL STATEMENTS (continued) FOR THE YEAR ENDED 30 JUNE 2018
Clover Industries Limited Integrated Report for the year ended 30 June 2018148

GROUP
2018 2017
Goodwill has been allocated to the following cash-generating units for purposes of the impairment review: R'000 R'000
Clover Industries* 373 894 373 894
Frankies CGU 5 540 5 540
Clover Pride 21 579 21 579
Clover Industries Group 401 013 401 013
*Clover Industries Limited does not hold any goodwill at a company level.
12 INTANGIBLE ASSETS (continued)
Annual financial statementsNOTES TO THE CONSOLIDATED FINANCIAL STATEMENTS (continued) FOR THE YEAR ENDED 30 JUNE 2018
Clover Industries Limited Integrated Report for the year ended 30 June 2018 149
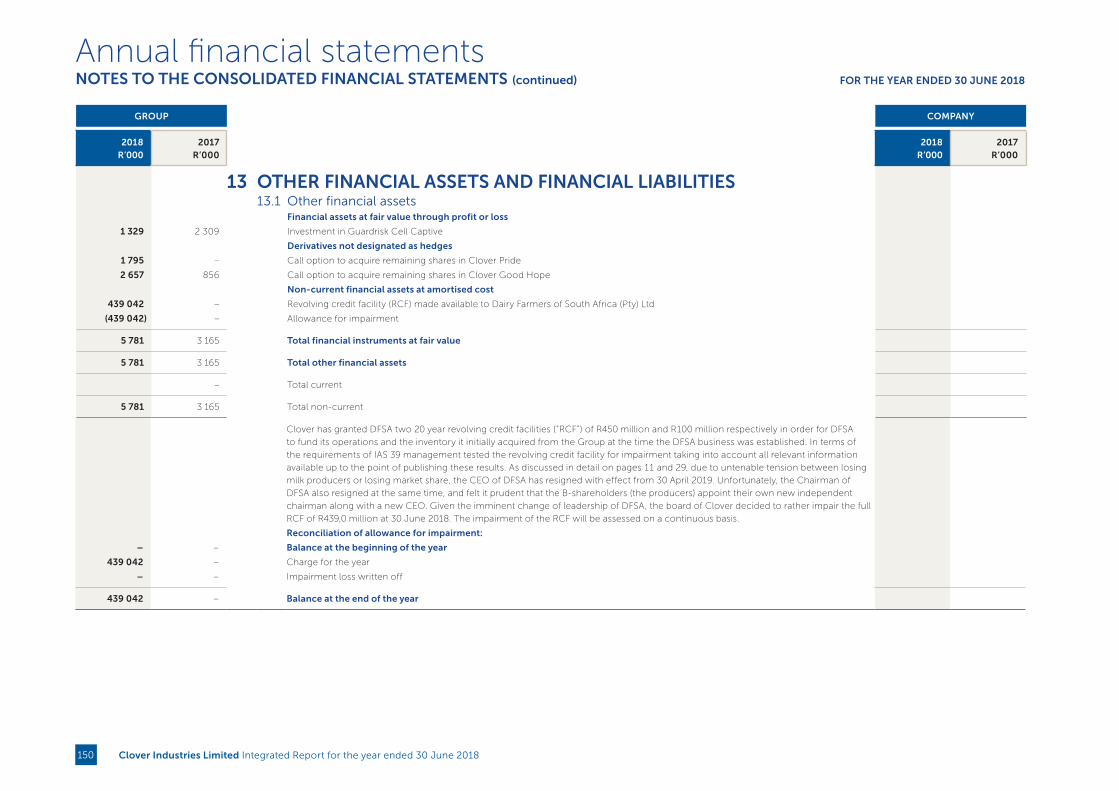
GROUP COMPANY
2018 R’000
2017R’000
2018 R’000
2017R’000
13 OTHER FINANCIAL ASSETS AND FINANCIAL LIABILITIES
13.1 Other financial assets
Financial assets at fair value through profit or loss
1 329 2 309 Investment in Guardrisk Cell Captive
Derivatives not designated as hedges
1 795 – Call option to acquire remaining shares in Clover Pride
2 657 856 Call option to acquire remaining shares in Clover Good Hope
Non-current financial assets at amortised cost
439 042 – Revolving credit facility (RCF) made available to Dairy Farmers of South Africa (Pty) Ltd
(439 042) – Allowance for impairment
5 781 3 165 Total financial instruments at fair value
5 781 3 165 Total other financial assets
– Total current
5 781 3 165 Total non-current
Clover has granted DFSA two 20 year revolving credit facilities (“RCF”) of R450 million and R100 million respectively in order for DFSA
to fund its operations and the inventory it initially acquired from the Group at the time the DFSA business was established. In terms of
the requirements of IAS 39 management tested the revolving credit facility for impairment taking into account all relevant information
available up to the point of publishing these results. As discussed in detail on pages 11 and 29, due to untenable tension between losing
milk producers or losing market share, the CEO of DFSA has resigned with effect from 30 April 2019. Unfortunately, the Chairman of
DFSA also resigned at the same time, and felt it prudent that the B-shareholders (the producers) appoint their own new independent
chairman along with a new CEO. Given the imminent change of leadership of DFSA, the board of Clover decided to rather impair the full
RCF of R439,0 million at 30 June 2018. The impairment of the RCF will be assessed on a continuous basis.
Reconciliation of allowance for impairment:
– – Balance at the beginning of the year
439 042 – Charge for the year
– – Impairment loss written off
439 042 – Balance at the end of the year
Annual financial statementsNOTES TO THE CONSOLIDATED FINANCIAL STATEMENTS (continued) FOR THE YEAR ENDED 30 JUNE 2018
Clover Industries Limited Integrated Report for the year ended 30 June 2018150

13 OTHER FINANCIAL ASSETS AND FINANCIAL LIABILITIES (continued)
Call option to acquire remaining shares in Clover Good HopeGood Hope granted Clover the irrevocable right to purchase Good Hope’s 49% of the issued share capital in Clover Good Hope (“Call shares”). The call option may be exercised by Clover within three months after each 12 month period from the fifth anniversary of the effective date. The purchase price of the call shares will be determined by way of an earnings before interest tax depreciation and amortisation (EBITDA) multiple formula.((A - C) x B) x 49%A – Average annual EBITDA of Clover Good Hope for the two financial years preceding the call option B – EBITDA multiple. If Clover’s EBITDA multiple is 7 or lower the EBITDA multiple will be 6. If Clover’s EBITDA multiple is above 7 then the EBITDA multiple will be 7C – Actual average net financing cost of Clover Good Hope for the two financial years preceding the call optionThe value of the call option was calculated by comparing the expected price as per the contract to a price calculated by using a discounted cash flow model. The discounted cash flow valuation of the call option was based on the following inputs; estimated annual free cash flow of R2,4 million; free cash flow growth per annum of between 5% to 10% and a discount rate of 17,98%
Call option to acquire remaining shares in Clover Pride AECI granted Clover the irrevocable right to purchase AECI’s 49% of the issued share capital in Clover Pride (“Call shares”). The call option may be exercised by Clover within three months after each 12 month period from the third anniversary of the effective date. The purchase price of the call shares will be determined by way of an earnings before interest tax depreciation and amortisation (EBITDA) multiple formula.(A x B - C + D -E) x 49%A – 6.21 (EBITDA multiple) B – Average normalised EBITDAC – Clover Pride's debts D – Working capital on hand E – Normal working capitalThe value of the call option was calculated by comparing the expected price as per the contract to a price calculated by using a discounted cash flow model. The value of the call option was calculated by comparing the expected price as per the contract to a price calculated by using a discounted cash flow model. The discounted cash flow valuation of the call option was based on the following inputs; estimated annual free cash flow of R9,8 million; free cash flow growth per annum of between 5% to 6% and a discount rate of 18.54%
GROUP COMPANY
2018 2017 2018 2017
13.2 Other financial liabilities
Financial liabilities at fair value through profit or loss
Derivatives not designated as hedging instruments:
– 638 Foreign exchange contracts
16 415 13 521 Clover Industries shares forward purchases
Financial liabilities designated as hedging instruments:
Derivatives designated as hedging instruments:
– 1 665 Cash flow hedge – Diesel hedge
16 415 15 824 Total financial instruments at fair value
16 415 15 824 Total other financial liabilities
13 639 6 141 Total current
2 776 9 683 Total non-current
Annual financial statementsNOTES TO THE CONSOLIDATED FINANCIAL STATEMENTS (continued) FOR THE YEAR ENDED 30 JUNE 2018
Clover Industries Limited Integrated Report for the year ended 30 June 2018 151

13 OTHER FINANCIAL ASSETS AND FINANCIAL LIABILITIES (continued)
Foreign exchange contractsForeign exchange contracts through profit or loss are those foreign exchange forward contracts that are not designated in hedge relationship as they are intended to reduce the level of foreign currency risk for expected sales and purchases.
Clover Industries shares forward purchaseThe Group had entered into a forward contract to purchase 1 824 195 (2017: 2 132 695) Clover Industries shares, this transaction was entered into to hedge a portion of the share appreciation rights issued to management.
The fair value of the shares forward purchases was determined by Investec Bank Limited. The fair value was determined by calculating the future settlement price after the following inputs were taken into consideration, a dividend of 1,61% (2017: 3,92%), a credit spread of 2,80% (2017: 2,75%), a spot rate of R16,40 (2017: R16,55) and a swap interest rate reflecting the term of each tranche of the hedge.
2018 2017
Expiry dateNumber of
forwards
Forward price per share
(Rand)Number of
forwards
Forward price per share
(Rand)
2 October 2017 308 500 23.20
29 June 2018 308 500 23.97
31 July 2018 519 442 24.29 519 442 24.29
3 June 2019 476 810 26.48 476 810 26.48
28 June 2019 519 443 25.72 519 443 25.72
1 July 2019 308 500 25.60
Total 1 824 195 2 132 695
13.3 Fair value hierarchy
The Group uses the following hierarchy for determining and disclosing the fair value of financial instruments by valuation technique;Level 1: quoted prices in active market for identical assets or liabilities.Level 2: other techniques for which all inputs that have a significant effect on the recorded fair value are observable, either directly or indirectly. Level 3: techniques that use inputs that have a significant effect on the recorded fair value that are not based on observable market data.
As at 30 June 2018, the Group held the following financial instruments carried at fair value in the Statement of financial position:
GROUP
30 June 2018 Level 1 Level 2 Level 3
R’000 R’000 R’000 R’000
Assets measured at fair value
Derivatives not designated as hedging instruments:
Call option to acquire remaining shares in Clover Good Hope (Pty) Ltd 2 657 – – 2 657
Call option to acquire remaining shares in Clover Pride (Pty) Ltd 1 795 – – 1 795
Investment in cell captive 1 329 – 1 329 –
Liabilities measured at fair value
Derivatives not designated as hedging instruments:
Clover Industries shares forward purchases 16 415 – 16 415 –
During the reporting period ended 30 June 2018, there were no transfers between Level 1 and Level 2 fair value measurements.
Annual financial statementsNOTES TO THE CONSOLIDATED FINANCIAL STATEMENTS (continued) FOR THE YEAR ENDED 30 JUNE 2018
Clover Industries Limited Integrated Report for the year ended 30 June 2018152
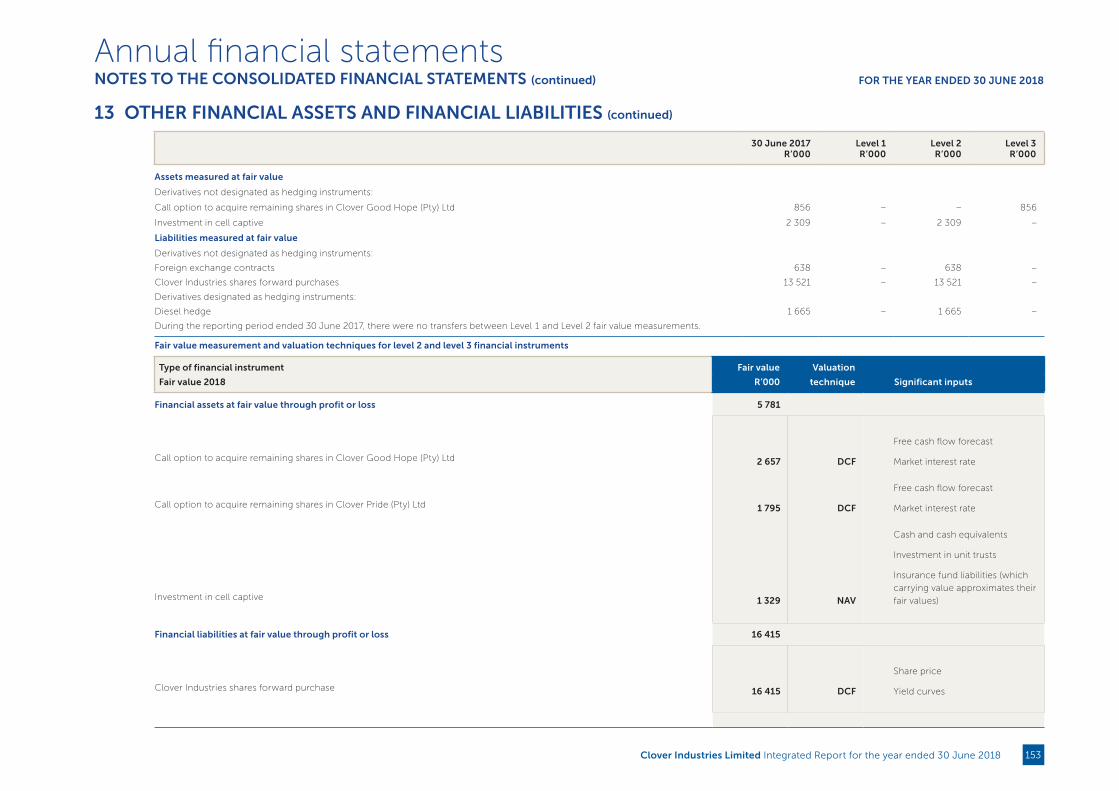
13 OTHER FINANCIAL ASSETS AND FINANCIAL LIABILITIES (continued)
30 June 2017 Level 1 Level 2 Level 3 R’000 R’000 R’000 R’000
Assets measured at fair value
Derivatives not designated as hedging instruments:
Call option to acquire remaining shares in Clover Good Hope (Pty) Ltd 856 – – 856
Investment in cell captive 2 309 – 2 309 –
Liabilities measured at fair value
Derivatives not designated as hedging instruments:
Foreign exchange contracts 638 – 638 –
Clover Industries shares forward purchases 13 521 – 13 521 –
Derivatives designated as hedging instruments:
Diesel hedge 1 665 – 1 665 –
During the reporting period ended 30 June 2017, there were no transfers between Level 1 and Level 2 fair value measurements.
Fair value measurement and valuation techniques for level 2 and level 3 financial instruments
Type of financial instrument Fair value Valuation
Fair value 2018 R’000 technique Significant inputs
Financial assets at fair value through profit or loss 5 781
Call option to acquire remaining shares in Clover Good Hope (Pty) Ltd 2 657 DCF
Free cash flow forecast
Market interest rate
Call option to acquire remaining shares in Clover Pride (Pty) Ltd 1 795 DCF
Free cash flow forecast
Market interest rate
Investment in cell captive 1 329 NAV
Cash and cash equivalents
Investment in unit trusts
Insurance fund liabilities (which
carrying value approximates their
fair values)
Financial liabilities at fair value through profit or loss 16 415
Clover Industries shares forward purchase 16 415 DCF
Share price
Yield curves
Annual financial statementsNOTES TO THE CONSOLIDATED FINANCIAL STATEMENTS (continued) FOR THE YEAR ENDED 30 JUNE 2018
Clover Industries Limited Integrated Report for the year ended 30 June 2018 153

13 OTHER FINANCIAL ASSETS AND FINANCIAL LIABILITIES (continued)
Fair value Valuation Fair value 2017 R’000 technique Significant inputs
Financial assets at fair value through profit or loss 3 165
Call option to acquire remaining shares in Clover Good Hope (Pty) Ltd 856 DCF
Free cash flow forecast
Market interest rate
Investment in cell captive 2 309 NAV
Cash and cash equivalents
Investment in unit trusts
Insurance fund liabilities (which
carrying values approximates their
fair values)
Financial liabilities at fair value through profit or loss 14 159
Foreign exchange contracts 638 DCF
Yield curves
Market interest rate
Market foreign exchange rate
Clover Industries shares forward purchase 13 521 DCF
Share price
Yield curves
Financial liabilities at fair value through OCI 1 665
Diesel hedges 1 665 DCF
Market forward ICE gasoil price
Yield curves
Market foreign exchange rate
Annual financial statementsNOTES TO THE CONSOLIDATED FINANCIAL STATEMENTS (continued) FOR THE YEAR ENDED 30 JUNE 2018
Clover Industries Limited Integrated Report for the year ended 30 June 2018154
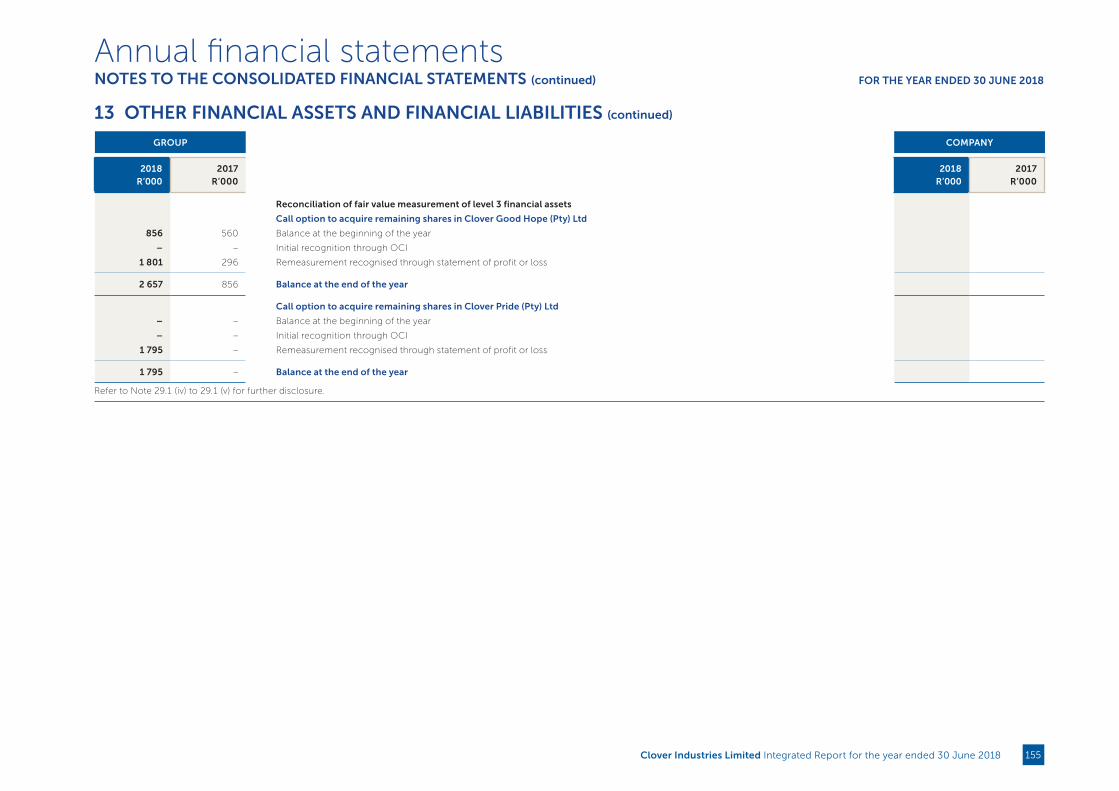
13 OTHER FINANCIAL ASSETS AND FINANCIAL LIABILITIES (continued)
GROUP COMPANY
2018 R’000
2017R’000
2018 R’000
2017R’000
Reconciliation of fair value measurement of level 3 financial assets
Call option to acquire remaining shares in Clover Good Hope (Pty) Ltd
856 560 Balance at the beginning of the year
– – Initial recognition through OCI
1 801 296 Remeasurement recognised through statement of profit or loss
2 657 856 Balance at the end of the year
Call option to acquire remaining shares in Clover Pride (Pty) Ltd
– – Balance at the beginning of the year
– – Initial recognition through OCI
1 795 – Remeasurement recognised through statement of profit or loss
1 795 – Balance at the end of the year
Refer to Note 29.1 (iv) to 29.1 (v) for further disclosure.
Annual financial statementsNOTES TO THE CONSOLIDATED FINANCIAL STATEMENTS (continued) FOR THE YEAR ENDED 30 JUNE 2018
Clover Industries Limited Integrated Report for the year ended 30 June 2018 155

GROUP COMPANY
2018 R’000
2017R’000
2018 R’000
2017R’000
14 DEFERRED TAXATION
(175 569) (155 339) Balance at the beginning of the year 77 77
(54 537) (20 230) Movements during the year:
(56 125) (14 411) Charge to profit or loss
(4 839) (590) Deferred tax write down
9 147 3 105 Prior year over provision
– 970 Change in rate
(359) 520 Foreign currency translation effect
– 938 Charge from/(to) other comprehensive income
(617) 79 (Charge)/Credit to the statement of changes in equity
(1 744) (10 841) Unbundling of Dairy Farmers of South Africa (Pty) Ltd / Acquisition of subsidiaries
(230 106) (175 569) Balance at the end of the year 77 77
The balance is constituted as follows:
Deferred tax assets
1 615 1 668 Doubtful debts provision 77 77
4 236 3 356 Credit note accrual
534 1 138 Leases straight-lined
45 960 47 205 Employee related expenses that are only deductible when paid
4 149 5 400 Income received in advance
19 599 21 138 Other accruals
68 836 96 882 Assessed loss carried forward
2 371 1 636 Foreign tax credits
4 351 4 578 Other financial liabilities
151 651 183 001 Total deferred tax assets 77 77
Deferred tax liabilities
(373 776) (351 872) Property, plant and equipment
(2 687) (2 069) Prepayments
(3 614) (3 150) Consumable stores
(1 540) (1 358) Pension fund asset
(140) (121) Other
(381 757) (358 570) Total deferred tax liabilities
(230 106) (175 569) Net deferred tax (liability)/asset 77 77
Annual financial statementsNOTES TO THE CONSOLIDATED FINANCIAL STATEMENTS (continued) FOR THE YEAR ENDED 30 JUNE 2018
Clover Industries Limited Integrated Report for the year ended 30 June 2018156

GROUP COMPANY
2018 R’000
2017R’000
2018 R’000
2017R’000
The Statement of financial position disclosure for deferred tax assets is the total amount for all Group companies with net deferred tax assets.
Likewise the deferred tax liability represents the total of all companies with net deferred tax liabilities. Note 14, however, groups all deferred tax
assets and liabilities in the Group, irrespective of the net position of individual Group companies.
Reflected in the Statement of financial position as follows:
30 203 45 496 Deferred tax assets 77 77
(260 309) (221 065) Deferred tax liabilities
(230 106) (175 569) Net deferred tax (liability)/asset 77 77
In assessing the availability of sufficient future taxable profit for utilisation against unused tax losses, cognisance was taken of the Group’s
vision, goals and strategies. The board is of the opinion that future taxable profits would be adequate to utilise the unused tax losses.
GROUP COMPANY
2018R’000
2017R’000
2018R’000
2017R’000
15 INVENTORIES
154 165 170 659 Raw materials
128 317 99 221 Work-in-progress
125 201 115 403 Consumable stores
461 408 579 347 Finished goods
869 091 964 630 Total inventories
The amount of the write-down of inventories recognised as an expense is R17.2 million (2017: R22,4 million). This expense is included in the
cost of sales line item as a cost of inventories.
14 DEFERRED TAXATION (continued)
Annual financial statementsNOTES TO THE CONSOLIDATED FINANCIAL STATEMENTS (continued) FOR THE YEAR ENDED 30 JUNE 2018
Clover Industries Limited Integrated Report for the year ended 30 June 2018 157

GROUP COMPANY
2018R’000
2017R’000
2018R’000
2017R’000
16 TRADE AND OTHER RECEIVABLES
1 181 770 1 182 775 Trade receivables – 13 061
42 676 36 515 Trade receivables from principals
186 870 11 640 Trade receivables from JV's and associates
88 122 127 622 Other receivables and deposits 50 969 275
2 725 2 585 Loans to executive directors and other executives 2 725 2 585
Inter-company loan: Clover SA 549 363 547 578
Loan: CIL Share Purchase Plan Trust 9 9
(5 856) (6 517) Allowance for impairment (275) (275)
(17 217) (13 309) Credit note accrual
1 479 090 1 341 311 Total trade and other receivables 602 791 563 233
Clover SA securitised its trade debtors, excluding debtors generated from export sales, through a special-purpose entity, Clover Capital. Clover
Capital is consolidated into the results of the Group.
The loans to directors and other executives were made to finance ordinary shares in CIL issued to them on 31 May 2010. The terms of the
loans are as follows: they will bear interest at 90% of the prime rate of Absa Bank, interest will be capitalised on a monthly basis, repayable by
management on the sale of the ordinary shares or within two months of leaving the employment of Clover or within six months in the case
of death. All proceeds of the ordinary shares are ceded to CIL as security for the loans. The loan agreements have been amended to make
provision for a final repayment date of the respective loans linked to the normal retirement date for each of the executives. See note 28.2 for
further details.
See note 29.5 for age analysis on trade receivables and on credit risk of trade receivables to understand how the Group manages and measures
credit quality of trade receivables that are neither past due nor impaired.
Trade receivables are non-interest-bearing and the payment terms are 30 days after the end of the month in which the goods were delivered.
As at 30 June 2018, trade receivables with an initial value of R5,9 million (2017: R6,5 million) were impaired and fully provided for. See below for
the movement in the provision for impairment of receivables.
6 517 3 847 Balance at the beginning of the year 275 275
(230) 4 978 (Credit)/charge for the year
(431) (2 308) Impairment loss written off
5 856 6 517 Balance at the end of the year 275 275
Annual financial statementsNOTES TO THE CONSOLIDATED FINANCIAL STATEMENTS (continued) FOR THE YEAR ENDED 30 JUNE 2018
Clover Industries Limited Integrated Report for the year ended 30 June 2018158

GROUP COMPANY
2018R’000
2017R’000
2018R’000
2017R’000
17 CASH AND SHORT-TERM DEPOSITS
Cash at bank earns interest at floating rates based on daily deposit rates. Short-term deposits are made for periods varying between one day
and three months, depending on the immediate cash requirements of the Group, and earn interest at the respective short-term deposit rates.
At 30 June 2018, the Group had available R318 million (2017: R14 million) of unutilised committed borrowing facilities in respect of which all
conditions precedent had been met.
For the purpose of the consolidated cash flow statements, cash and short-term deposits comprise the following:
Cash at bank and on hand
234 335 On hand
178 602 73 584 Outstanding deposits
173 843 54 829 Call deposits 16 335 53 592
408 014 416 115 Cash in banks 12 699 9 649
760 693 544 863 Total cash and short-term deposits 29 034 63 241
Annual financial statementsNOTES TO THE CONSOLIDATED FINANCIAL STATEMENTS (continued) FOR THE YEAR ENDED 30 JUNE 2018
Clover Industries Limited Integrated Report for the year ended 30 June 2018 159

GROUP COMPANY
2018 2017 2018 2017
Number of shares
Number of shares
Number of shares
Number of shares
18 SHARE CAPITAL AND SHARE PREMIUM
Ordinary shares
Authorised
2 billion (2017: 2 billion) ordinary shares with a par value of 5 cents (2017: 5 cents) each
Shares issued
190 835 364 190 314 350 Ordinary shares in issue at the beginning of the year 190 835 364 190 314 350
Share appreciation rights exercised:
– 38 397 Issued on 15 September 2016 – 38 397
– 482 617 Issued on 24 April 2017 – 482 617
190 835 364 190 835 364 Ordinary shares in issue at the end of the year 190 835 364 190 835 364
2018 R’000
2017 R’000
2018R’000
2017 R’000
Ordinary share capital
9 542 9 542 190,8 million (2017: 190,8 million) ordinary shares of 5 cents (2017: 5 cents) each 9 542 9 542
Ordinary share premium
892 692 892 692 Ordinary share premium on 190,8 million (2017: 190,8 million) ordinary shares 892 692 892 692
902 234 902 234 Total ordinary share capital and ordinary share premium 902 234 902 234
Shares were issued as follows during the year
Ordinary shares:
– 26 Ordinary shares of 0,5 cents (2016: 0,5 cents) each – 26
– 9 918 Ordinary share premium of R19,04 (2016: R17,19) per share – 9 918
– 9 944 Total ordinary share capital raised during the year – 9 944
Annual financial statementsNOTES TO THE CONSOLIDATED FINANCIAL STATEMENTS (continued) FOR THE YEAR ENDED 30 JUNE 2018
Clover Industries Limited Integrated Report for the year ended 30 June 2018160

GROUP COMPANY
2018 R’000
2017R’000
2018 R’000
2017R'000
19 OTHER CAPITAL RESERVES
Share-based payments reserve
78 082 73 868 Balance at the beginning of the year 2 169 2 169
(2 593) 5 865 Share based (credit)/expense
(4 223) (1 651) Share appreciation rights exercised
71 266 78 082 Balance at the end of the year 2 169 2 169
Call options
560 1 005 Balance at the beginning of the year
– – Initial recognition of call options
– (445) Transfer to retained earnings
560 560 Balance at the end of the year
Put liability
– – Balance at the beginning of the year
33 863 – Remeasurement of put liability
33 863 – Balance at the end of the year
105 689 78 642 Total other capital reserves at the end of the year 2 169 2 169
20 OTHER COMPONENTS OF EQUITY
20.1 Foreign currency translation reserve
9 637 24 147 Balance at the beginning of the year
Movements:
7 523 (14 510) Foreign exchange translation differences
7 523 (14 510) Net foreign exchange translation movement
17 160 9 637 Balance at the end of the year
Annual financial statementsNOTES TO THE CONSOLIDATED FINANCIAL STATEMENTS (continued) FOR THE YEAR ENDED 30 JUNE 2018
Clover Industries Limited Integrated Report for the year ended 30 June 2018 161

GROUP COMPANY
2018 R’000
2017R’000
2018 R’000
2017R’000
21 INTEREST-BEARINGS LOANS AND BORROWINGS
21.1 Secured liabilities
920 135 900 000
(a) Secured by securitisation of trade debtors (refer to note 16).The first tranche of R 400 million is repayable 30 June 2018 (which
was settled on 2 July 2018), and is charged a fixed interest rate of 9,28% (2017: 9,28%). The second tranche of R 250 million
is repayable on 30 September 2019, and is charged a floating rate of 220 bps above 3 month JIBAR. The third tranche of
R 250 million is repayable 30 June 2020, and is charged a floating interest rate of 185 basis points above 3 month JIBAR.
The funding is raised in the form of debentures issued to financial institutions and investment funds with specific redemption
dates.
21 232 23 170
(b) Secured by plant and equipment with a book value of R20,5 million (2017: R19,9 million). Repayable in monthly instalments.
Payments due within the next year are R5,8 million (2017: R5,9 million). Variable interest rate portion: 8,5% – 10,5% (2017: 8,5% –
10,5%). Maturity: between July 2016 and March 2022. Fixed interest rate portion 9.0% and 10,5% (2017: 9,0% and 10,5%).
941 367 923 170 Total secured liabilities
21.2 Unsecured liabilities
– 4 889
(a) Credit financing agreements entered into with IBM Global Financing to fund the acquisition of certain software and consulting
costs. Interest is charged at 3% with the final instalment due on 1 September 2017.
– 1 763
(b) Bank overdraft
Repayable on demand. The full outstanding amount is repayable within one year. Variable interest rate:10.25% - 10,5% (2017: 10.5%)
– 302 033
(c) Call loans
Variable interest rate: 8,1% – 9,0% (2017: 8,6% – 9,0%)
255 894 250 070
(d) Debentures issued to financial institutions and investment funds with fixed redemption date, interest is charged at JIBAR plus
2.85% and is repayable on 1 October 2018.
153 489 – (e)
Debentures issued to financial institutions and investment funds with fixed redemption date, interest is charged at JIBAR plus
2.55% and is repayable on 1 April 2021.
409 383 558 755 Total unsecured liabilities
1 350 750 1 481 925 Total secured and unsecured liabilities
Current portion transferred to current liabilities:
426 308 405 899 • Secured liabilities
259 383 308 405 • Unsecured liabilities
685 691 714 304 Total current portion transferred to current liabilities
665 059 767 621 Total non-current interest-bearing borrowings
1 350 750 1 481 925 Total current and non-current interest-bearing loans and borrowings
Annual financial statementsNOTES TO THE CONSOLIDATED FINANCIAL STATEMENTS (continued) FOR THE YEAR ENDED 30 JUNE 2018
Clover Industries Limited Integrated Report for the year ended 30 June 2018162

GROUP COMPANY
2018 R’000
2017R’000
2018 R’000
2017R’000
22 NON-CONTROLLING INTEREST PUT OPTIONS LIABILITIES
The Group has entered into transactions with non-controlling interest equity holders whereby they are able to put their shareholding to the
Group for a limited time period. Remeasurements of the liability are recorded in equity (refer to note 19 for more details).
23 226 57 088 Non-controlling interest put options
23 226 57 088 Total non-controlling interest put options
– – Current portion reflected under current liabilities
23 226 57 088 Non-current portion reflected under non-current liabilities
Put option to acquire remaining shares in Clover Good HopeClover granted Good Hope the irrevocable right to sell Good Hope’s 49% of the issued share capital in Clover Good Hope (“Put shares”).
The put option may be exercised by Good Hope within three months after each 12-month period from the third anniversary of the effective
date. The purchase price of the put shares will be determined by way of an earnings before interest tax depreciation and amortisation (EBITDA)
multiple formula.
((A - C) x B ) x 49%
A – Average annual EBITDA of Clover Good Hope for the financial years preceding the put option
B – EBITDA multiple. If Clover’s EBITDA multiple is 7 or lower the EBITDA multiple will be 6. If Clover’s EBITDA multiple is above 7 then the
EBITDA multiple will be 7
C – Actual average net financing cost of Clover Good Hope for the two financial years preceding the put option
The value of the put option was calculated by estimating the future EBITDA as per the contract and discounted given the remaining time period
until the option becomes exercisable. The EBITDA estimates for purposes of the valuation of the put option was based on the following inputs;
estimated annual free cash flow of R2,4 million; free cash flow growth per annum of between 5% to 10% and a discount rate of 17,98%. The fair
value of the put was calculated by comparing the expected price as per the contract to a price calculated by using a discounted cash flow
model. The resultant fair value based on this calculation is Rnil. This value is considered a level 3 valuation. Refer to note 29.1 for more details
regarding the sensitivity of the valuation inputs.
Put option to acquire remaining shares in Clover Pride Clover granted AECI the irrevocable right to sell AECI’s 49% of the issued share capital in Clover Pride (“Call shares”). The put option may be
exercised by AECI within three months after each 12 month period from the third anniversary of the effective date. The purchase price of the
put shares will be determined by way of an earnings before interest tax depreciation and amortisation (EBITDA) multiple formula.
(A x B - C + D -E) x 49%
A – 5.5 (EBITDA multiple)
B – Average normalised EBITDA
C – Clover Pride's debts
D – Working capital on hand
E – Normal working capital
The value of the put option was calculated by estimating the future EBITDA as per the contract and discounted given the remaining time period
until the option becomes exercisable. The EBITDA estimates for purposes of the valuation of the put option was based on the following inputs:
estimated annual free cash flow of R9,8 million; free cash flow growth per annum of between 5% to 6% and a discount rate of 18.54%. The fair
value of the put was calculated by comparing the expected price as per the contract to a price calculated by using a discounted cash flow
model. The resultant fair value based on this calculation is Rnil. This value is considered a level 3 valuation. Refer to note 29.1 for more details
regarding the sensitivity of the valuation inputs.
Annual financial statementsNOTES TO THE CONSOLIDATED FINANCIAL STATEMENTS (continued) FOR THE YEAR ENDED 30 JUNE 2018
Clover Industries Limited Integrated Report for the year ended 30 June 2018 163

GROUP COMPANY
2018 R’000
2017R’000
2018 R’000
2017R’000
23 EMPLOYEE-RELATED OBLIGATIONS
23.1 Long-service bonus
The projected-credit method is used for the calculation of the long-service bonus provision.
Payments are recognised as utilisations.
The determination of the long-service bonus is based on the following assumptions:
7 202 7 754 Active members
6.4% 6.3% Salary escalation ratio
7.7% 8.1% Discounting rate
65 65 Normal retirement age
21 425 21 846 Balance at the beginning of the year
8 340 5 086 Amounts provided
(6 046) (5 507) Amounts utilised
23 719 21 425 Total long-service bonus provision
Refer to note 33 for further detail on the long-service bonus provision.
23.2 Leave pay
A provision for leave pay is recognised for the number of days leave due to employees at 30 June valued at a rate per day based on the
basic salary of each employee at 30 June. Leave payments and leave days taken are recognised as utilisations.
70 941 68 305 Balance at the beginning of the year
12 261 11 714 Amounts provided
(11 218) (9 078) Amounts utilised
71 984 70 941 Total leave pay provision
23.3 Total employee-related obligations
75 424 82 595 Non-current portion
20 279 9 771 Current portion transferred to current liabilities
95 703 92 366 Total non-current and current employee-related obligations
Annual financial statementsNOTES TO THE CONSOLIDATED FINANCIAL STATEMENTS (continued) FOR THE YEAR ENDED 30 JUNE 2018
Clover Industries Limited Integrated Report for the year ended 30 June 2018164

GROUP COMPANY
2018 R’000
2017R’000
2018R’000
2017R’000
24 TRADE AND OTHER PAYABLES
988 637 1 056 019 Trade payables 8 988 8 240
45 410 30 692 Other payables 1 650 1 773
95 024 126 322 Accrual for variable remuneration and other personnel related creditors
8 239 13 556 VAT creditor
1 908 4 065 Leases straight-lined
493 214 41 484 Payable to joint ventures and associates
55 192 28 054 Payable to NCI shareholders
1 687 624 1 300 192 Total trade and other payables 10 638 10 013
11 448 25 492 Non-current portion included in other payables transferred to non-current liabilities
1 676 176 1 274 700 Current portion 10 638 10 013
1 687 624 1 300 192 Total trade and other payables 10 638 10 013
The terms for trade payables and other short-term payables range from seven days after date of invoice to 45 days after month-end. Interest is
payable on a monthly basis. Payables to joint ventures range from 30 days to 45 days after the end of the month in which the transaction took
place.
Non-current payables range from one to three years after the date of accrual
25 NOTES TO THE STATEMENT OF CASH FLOWS
25.1 Tax paid
7 165 (9 893) Amount receivable/(due) at the beginning of the year (3 432) 928
(87 887) (30 057) Taxation charged in statement of comprehensive income and other adjustments, excluding deferred taxation (2 998) (13 544)
(3 702) (7 165) Amount (receivable)/due at the end of the year 356 3 432
(84 424) (47 115) Total tax paid (6 074) (9 184)
Annual financial statementsNOTES TO THE CONSOLIDATED FINANCIAL STATEMENTS (continued) FOR THE YEAR ENDED 30 JUNE 2018
Clover Industries Limited Integrated Report for the year ended 30 June 2018 165

GROUP COMPANY
2018R’000
2017R’000
2018R’000
2017R’000
25 NOTES TO THE STATEMENT OF CASH FLOWS (continued)
25.2 Movement in borrowings reconciliation
1 481 925 1 274 470 Opening balance
1 458 755 1 242 680 - Borrowings (secured and unsecured)
23 170 31 790 - Finance lease liabilities
(158 755) 216 073 Cash flow movements related to borrowings during the period:
(308 755) (280 902) - Repayment of borrowings
150 000 496 975 - Proceeds from borrowings
Non-cash flow movements related to borrowings during the period:
29 518 – - Accrued finance charges included in the closing balance
(1 938) (8 618) Movement in finance lease liabilities during the period:
(4 578) (4 764) - Payments made during the year
2 640 – - New finance leases entered into - non-cash flow item
– ( 3 854) - Cancellation of finance lease
– – - Finance charges included in the closing balance - non-cash flow item
1 350 750 1 481 925 Closing balance
1 329 518 1 458 755 - Borrowings (secured and unsecured)
21 232 23 170 - Finance lease liabilities
Annual financial statementsNOTES TO THE CONSOLIDATED FINANCIAL STATEMENTS (continued) FOR THE YEAR ENDED 30 JUNE 2018
Clover Industries Limited Integrated Report for the year ended 30 June 2018166
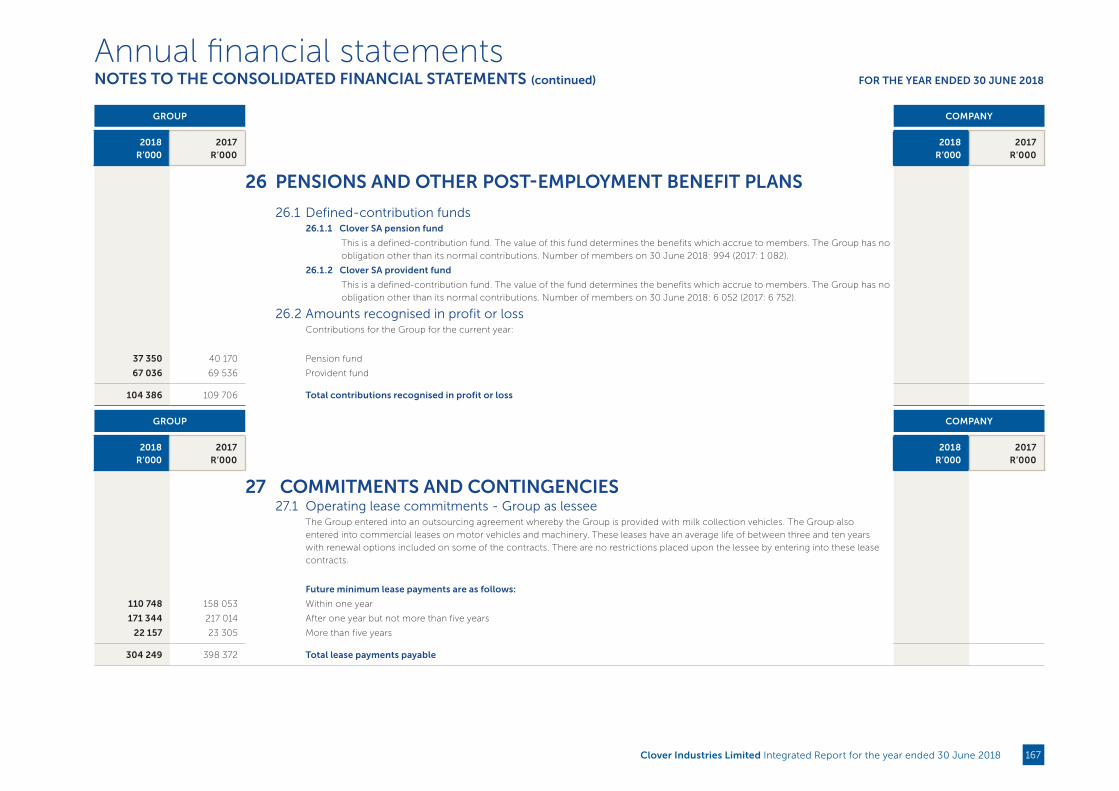
GROUP COMPANY
2018 R’000
2017R’000
2018 R’000
2017R’000
26 PENSIONS AND OTHER POST-EMPLOYMENT BENEFIT PLANS
26.1 Defined-contribution funds
26.1.1 Clover SA pension fund
This is a defined-contribution fund. The value of this fund determines the benefits which accrue to members. The Group has no
obligation other than its normal contributions. Number of members on 30 June 2018: 994 (2017: 1 082).
26.1.2 Clover SA provident fund
This is a defined-contribution fund. The value of the fund determines the benefits which accrue to members. The Group has no
obligation other than its normal contributions. Number of members on 30 June 2018: 6 052 (2017: 6 752).
26.2 Amounts recognised in profit or loss
Contributions for the Group for the current year:
37 350 40 170 Pension fund
67 036 69 536 Provident fund
104 386 109 706 Total contributions recognised in profit or loss
GROUP COMPANY
2018 R’000
2017R’000
2018 R’000
2017R’000
27 COMMITMENTS AND CONTINGENCIES
27.1 Operating lease commitments - Group as lessee
The Group entered into an outsourcing agreement whereby the Group is provided with milk collection vehicles. The Group also
entered into commercial leases on motor vehicles and machinery. These leases have an average life of between three and ten years
with renewal options included on some of the contracts. There are no restrictions placed upon the lessee by entering into these lease
contracts.
Future minimum lease payments are as follows:
110 748 158 053 Within one year
171 344 217 014 After one year but not more than five years
22 157 23 305 More than five years
304 249 398 372 Total lease payments payable
Annual financial statementsNOTES TO THE CONSOLIDATED FINANCIAL STATEMENTS (continued) FOR THE YEAR ENDED 30 JUNE 2018
Clover Industries Limited Integrated Report for the year ended 30 June 2018 167
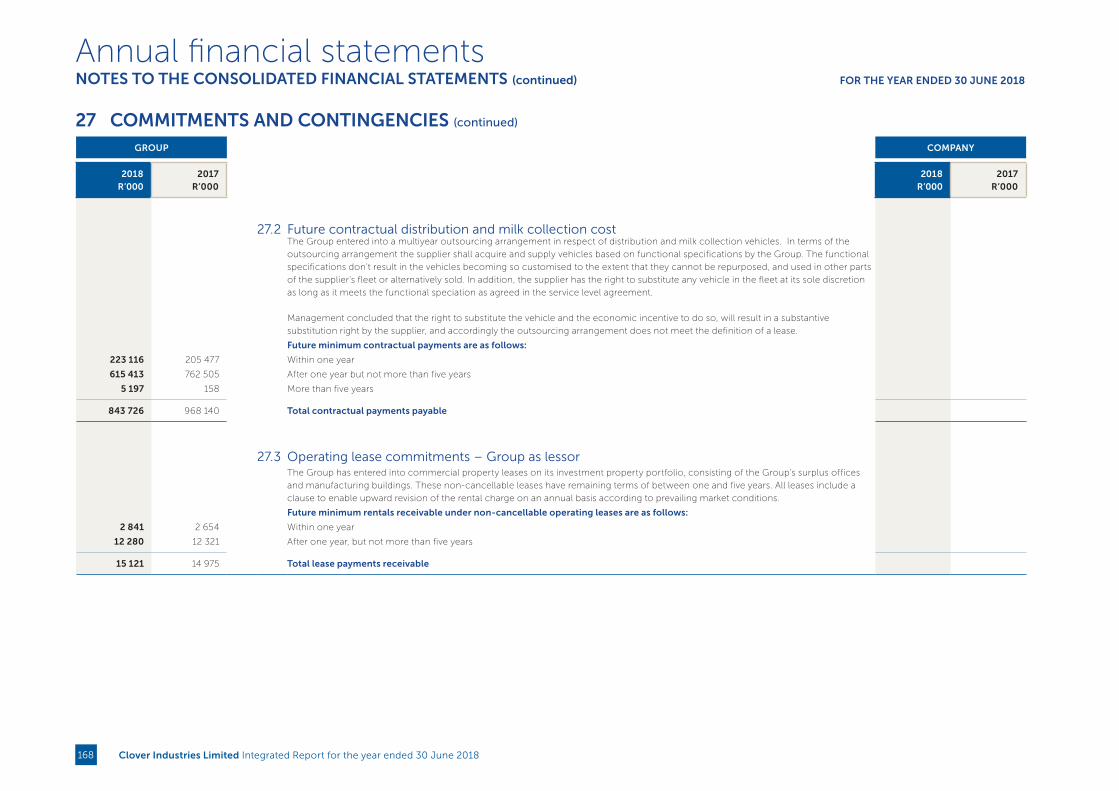
GROUP COMPANY
2018 R’000
2017R’000
2018 R’000
2017R’000
27.2 Future contractual distribution and milk collection cost
The Group entered into a multiyear outsourcing arrangement in respect of distribution and milk collection vehicles. In terms of the
outsourcing arrangement the supplier shall acquire and supply vehicles based on functional specifications by the Group. The functional
specifications don’t result in the vehicles becoming so customised to the extent that they cannot be repurposed, and used in other parts
of the supplier’s fleet or alternatively sold. In addition, the supplier has the right to substitute any vehicle in the fleet at its sole discretion
as long as it meets the functional speciation as agreed in the service level agreement.
Management concluded that the right to substitute the vehicle and the economic incentive to do so, will result in a substantive
substitution right by the supplier, and accordingly the outsourcing arrangement does not meet the definition of a lease.
Future minimum contractual payments are as follows:
223 116 205 477 Within one year
615 413 762 505 After one year but not more than five years
5 197 158 More than five years
843 726 968 140 Total contractual payments payable
27.3 Operating lease commitments – Group as lessor
The Group has entered into commercial property leases on its investment property portfolio, consisting of the Group’s surplus offices
and manufacturing buildings. These non-cancellable leases have remaining terms of between one and five years. All leases include a
clause to enable upward revision of the rental charge on an annual basis according to prevailing market conditions.
Future minimum rentals receivable under non-cancellable operating leases are as follows:
2 841 2 654 Within one year
12 280 12 321 After one year, but not more than five years
15 121 14 975 Total lease payments receivable
27 COMMITMENTS AND CONTINGENCIES (continued)
Annual financial statementsNOTES TO THE CONSOLIDATED FINANCIAL STATEMENTS (continued) FOR THE YEAR ENDED 30 JUNE 2018
Clover Industries Limited Integrated Report for the year ended 30 June 2018168

GROUP 2018
GROUP 2017
Minimum payments
Present value of payments
Minimum payments
Present value of payments
R’000 R’000 R’000 R’000
27.4 Finance leases and hire purchase agreements
The Group has finance leases and hire purchase contracts for various items of plant, machinery and vehicles. These leases have no
terms of renewal, purchase options or escalation clauses.
Future minimum lease payments with the present value of the net minimum lease payments are as follows:
7 699 5 843 Within one year 11 974 9 755
19 124 15 389 After one year but not more than five years 23 321 18 304
26 823 21 232 Total minimum lease payments 35 295 28 059
(5 591) – Less: Amounts representing finance charges (7 236) –
21 232 21 232 Present value of minimum lease payments 28 059 28 059
GROUP COMPANY
2018R’000
2017R’000
2018R’000
2017R’000
27.5 Capital commitments
21 685 40 908 Capital expenditure authorised and contracted for
72 626 43 424 Capital expenditure authorised but not contracted for
94 311 84 332 Total capital commitments
Commitments will be spent within the next three to four years.
27 COMMITMENTS AND CONTINGENCIES (continued)
Annual financial statementsNOTES TO THE CONSOLIDATED FINANCIAL STATEMENTS (continued) FOR THE YEAR ENDED 30 JUNE 2018
Clover Industries Limited Integrated Report for the year ended 30 June 2018 169

GROUP COMPANY
2018 R’000
2017R’000
2018 R’000
2017R’000
28 RELATED PARTY DISCLOSURE
Transactions with related parties are made at market-related prices. Outstanding balances at the year-end are unsecured. No interest is paid
on current accounts. There have been no guarantees provided or received for any related party receivables or payables. This assessment is
undertaken each financial year through examining the financial position of the related party and the market in which the related party operates.
28.1 With regard to operating activities with subsidiaries and joint ventures, the following transactions
took place during the year:
(a) Fees earned by CIL for services rendered to Group Companies
Clover SA – Subsidiary 18 734 51 812
Total fees earned by CIL for services rendered to Group Companies 18 734 51 812
(b) Income earned by Clover SA for services rendered, royalties and interest to joint ventures and associate
1 228 925 – DFSA – Associate
4 991 4 821 Clover Fonterra – Joint Venture
5 873 3 190 Clover Futurelife – Joint Venture
1 239 789 8 011 Total income earned by Clover SA for services rendered, royalties and interest to joint ventures and associate
(c) Amounts due to CIL from Group Companies
Clover SA – Subsidiary 549 363 547 578
Total amounts due to CIL from Group Companies 549 363 547 578
(d) Amounts due to Clover SA from joint ventures and associate
179 939 – DFSA – Associate (trade receivable)
3 233 1 274 Clover Fonterra – Joint Venture
3 698 4 840 Clover Futurelife – Joint Venture
186 870 6 114 Total amounts due to Clover SA from joint ventures and associate
(d) Amounts owing by Clover SA to joint ventures and associate
426 886 – DFSA – Associate
64 783 37 934 Clover Fonterra – Joint Venture
1 545 3 550 Clover Futurelife – Joint Venture
493 214 41 484 Total amounts owing by Clover SA to joint ventures and associate
(e) CIL received the following dividends during the year from Group Companies
Clover SA – Subsidiary 50 686 80 000
Total dividends received by CIL from Group Companies 50 686 80 000
Annual financial statementsNOTES TO THE CONSOLIDATED FINANCIAL STATEMENTS (continued) FOR THE YEAR ENDED 30 JUNE 2018
Clover Industries Limited Integrated Report for the year ended 30 June 2018170
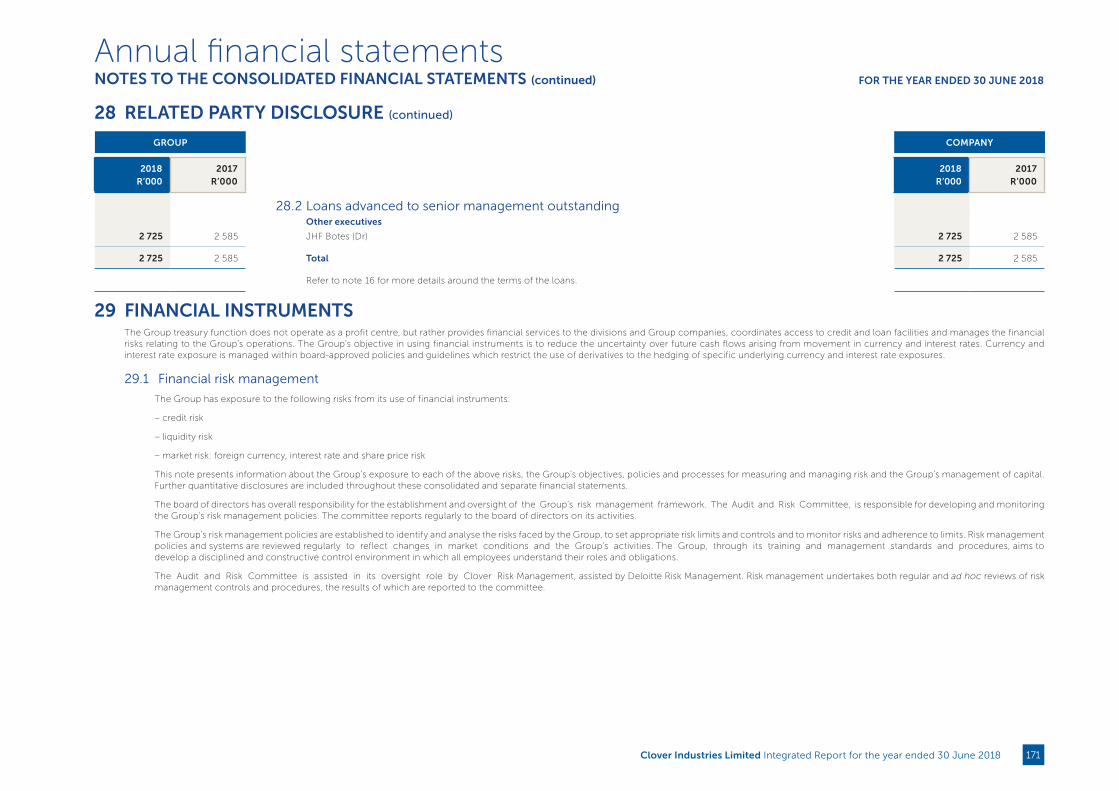
GROUP COMPANY
2018R’000
2017R’000
2018R’000
2017R’000
28.2 Loans advanced to senior management outstanding
Other executives
2 725 2 585 JHF Botes (Dr) 2 725 2 585
2 725 2 585 Total 2 725 2 585
Refer to note 16 for more details around the terms of the loans.
29 FINANCIAL INSTRUMENTS The Group treasury function does not operate as a profit centre, but rather provides financial services to the divisions and Group companies, coordinates access to credit and loan facilities and manages the financial risks relating to the Group’s operations. The Group’s objective in using financial instruments is to reduce the uncertainty over future cash flows arising from movement in currency and interest rates. Currency and interest rate exposure is managed within board-approved policies and guidelines which restrict the use of derivatives to the hedging of specific underlying currency and interest rate exposures.
29.1 Financial risk management
The Group has exposure to the following risks from its use of financial instruments:
– credit risk
– liquidity risk
– market risk: foreign currency, interest rate and share price risk
This note presents information about the Group’s exposure to each of the above risks, the Group’s objectives, policies and processes for measuring and managing risk and the Group’s management of capital. Further quantitative disclosures are included throughout these consolidated and separate financial statements.
The board of directors has overall responsibility for the establishment and oversight of the Group’s risk management framework. The Audit and Risk Committee, is responsible for developing and monitoring the Group’s risk management policies. The committee reports regularly to the board of directors on its activities.
The Group’s risk management policies are established to identify and analyse the risks faced by the Group, to set appropriate risk limits and controls and to monitor risks and adherence to limits. Risk management policies and systems are reviewed regularly to reflect changes in market conditions and the Group’s activities. The Group, through its training and management standards and procedures, aims to develop a disciplined and constructive control environment in which all employees understand their roles and obligations.
The Audit and Risk Committee is assisted in its oversight role by Clover Risk Management, assisted by Deloitte Risk Management. Risk management undertakes both regular and ad hoc reviews of risk management controls and procedures, the results of which are reported to the committee.
28 RELATED PARTY DISCLOSURE (continued)
Annual financial statementsNOTES TO THE CONSOLIDATED FINANCIAL STATEMENTS (continued) FOR THE YEAR ENDED 30 JUNE 2018
Clover Industries Limited Integrated Report for the year ended 30 June 2018 171
29 FINANCIAL INSTRUMENTS (continued)
a. Credit risk management
Credit risk is the risk of financial loss to the Group if a customer or counterparty to a
financial instrument fails to meet its contractual obligations and arises principally from
the Group’s receivables from customers and investment securities.
Credit risk primarily relates to potential exposure on bank and cash balances,
investments, derivatives and trade receivables. The Group limits its exposure arising
from money market and derivative instruments by only dealing with well-established
financial institutions of high credit standing. The Group is exposed to credit risk
in the form of trade receivables. The maximum exposure is the carrying amount
as disclosed in note 29.5. Historically, Group bad debts have been negligible
and the management of debtors payment terms have been very successful. Trade
receivables comprise a large number of debtors, but with significant concentration in
value on the country’s major retail and wholesale chains, credit is extended in terms
of the Group’s credit policies. In the opinion of the Board there was no significant
credit risk at year-end which had not been adequately provided for.
The Group limits its exposure to credit risk by only investing in reputable institutions
with high credit ratings.
The Group’s exposure to credit risk is influenced mainly by the individual
characteristics of each customer. The demographics of the Group’s customer
base, including the default risk of the industry and country in which customers
operate, has less of an influence on credit risk. Approximately 76,0% (2017: 76,7%) of
the Group’s credit sales is attributable to sales transactions with the major
national chain stores of good credit standing. However, geographically there is no
concentration of credit risk.
The responsibility for effective credit management rests with the chief financial officer.
The granting of credit is governed by a policy for the approval and authorisation
levels for new credit applications and revision of credit limits.
The credit policy requires that each new customer is analysed individually for
creditworthiness before the Group’s standard payment and delivery terms and
conditions are offered. Any variations in authorisation levels must be approved
in terms of the credit policy. The review includes obtaining and evaluating trade
references, bank codes, financial statements and trade history. Depending on the
customer profile and credit limit required, further information on directors and
a credit bureau report will be obtained. With the exception of the major national chain
stores, where credit risks are assessed as low, credit limits are established for each
customer, which represents the maximum open amounts.
Most of the Group’s customers have been transacting with the Group for many years
and the Group has had a steady customer base. In monitoring customer credit
risk, customers are grouped according to their credit characteristics, including
whether they are chain stores, general trade or wholesalers.
Additional credit is withheld from customers, excluding the major national chain
stores, that have defaulted on their payments, until the situation has been resolved.
The Group establishes an allowance for impairment that represents its estimate of
expected losses in respect of trade and other receivables and investments.
The main component of this allowance is a specific loss component that relates to
individually significant exposures.
As a general rule, sureties must be obtained for all new accounts, unless the Group
waives its rights in this regard, backed by a low credit risk assessment.
In the current year the Group rendered services to DFSA in the ordinary course of
business which is payable 30 days from statement. The Group also made available
a revolving credit facility ("RCF"), as disclosed in note 13.1, in order for DFSA to fund
its operations and the stock it initially acquired from the Group at the time the DFSA
business was established. The facility has been made available to DFSA for an initial
period of 20 years and the value of the facility will increase annually with CPI. The Group
will not be able to call this facility unless certain default events occur. The maximum
amount of the RCF was capped at R550 million for the current year however DFSA
had at the end of the financial year only utilised R439 million of this facility The RCF
was however fully impaired at year-end for reasons set out in note 13.1. As part of the
Group's actions taken to mitigate credit risk a general notarial bond has been registered
over the stock of DFSA. In addition, DFSA relies on the Group to collect its debtors on
its behalf and in terms of the agreement between the parties, the Group may also set
off the recovery of these debtors against any outstanding monies owing to the Group
in the event of default. Due to the infant stage of DFSA, the Group has subordinated
R100 million of the RCF to DFSA in favour of other creditors (which are mainly the milk
producers supplying to DFSA). DFSA has successfully settled the trade debt account on
a monthly basis and serviced the interest charges owing to the Group during the current
financial year. As at year end the ageing of the trade account is in a healthy state and all
amounts are neither past due nor impaired.
b. Liquidity risk management
Liquidity risk is the risk that the Group will not be able to meet its financial
obligations as they fall due. The Group’s approach to managing liquidity is
to ensure that it will always have sufficient liquidity to meet its liabilities when due,
under both normal and stressed conditions. Refer to note 29.4 for detailed analysis of
liquidity exposure.
The Group manages liquidity risk by monitoring actual and budgeted cash flows and
ensuring that adequate borrowing facilities are maintained.
Annual financial statementsNOTES TO THE CONSOLIDATED FINANCIAL STATEMENTS (continued) FOR THE YEAR ENDED 30 JUNE 2018
Clover Industries Limited Integrated Report for the year ended 30 June 2018172
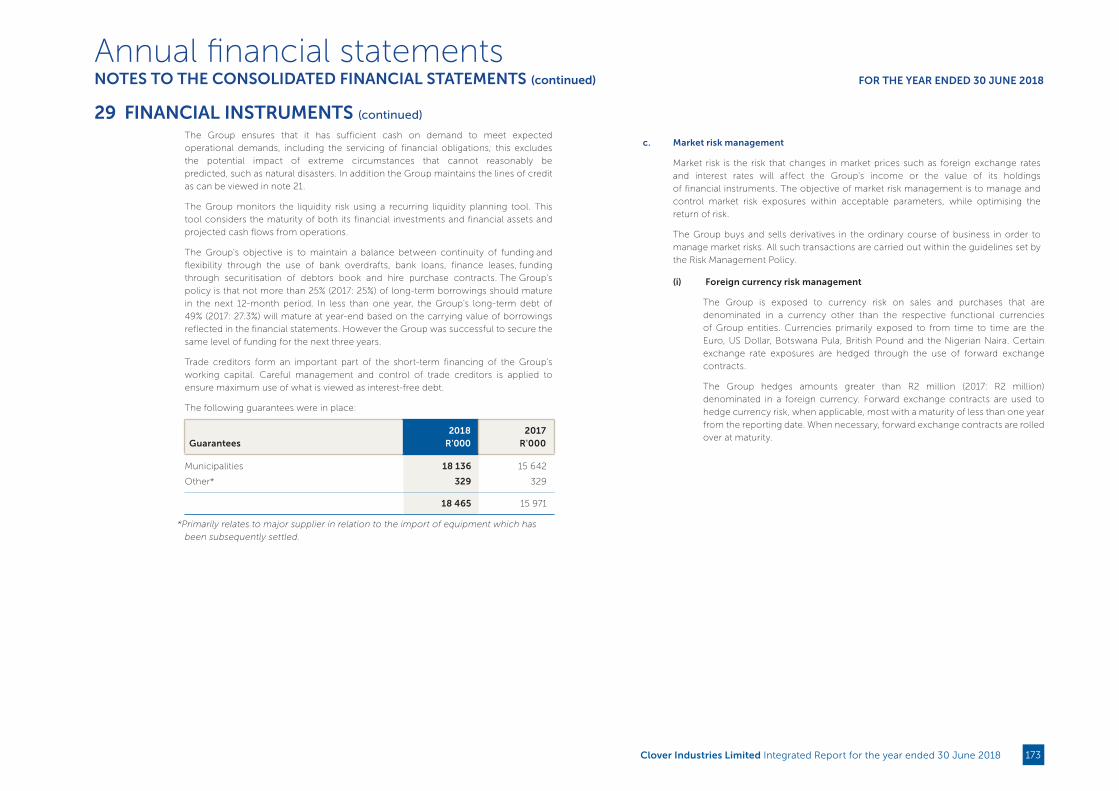
29 FINANCIAL INSTRUMENTS (continued)
The Group ensures that it has sufficient cash on demand to meet expected
operational demands, including the servicing of financial obligations; this excludes
the potential impact of extreme circumstances that cannot reasonably be
predicted, such as natural disasters. In addition the Group maintains the lines of credit
as can be viewed in note 21.
The Group monitors the liquidity risk using a recurring liquidity planning tool. This
tool considers the maturity of both its financial investments and financial assets and
projected cash flows from operations.
The Group’s objective is to maintain a balance between continuity of funding and
flexibility through the use of bank overdrafts, bank loans, finance leases, funding
through securitisation of debtors book and hire purchase contracts. The Group’s
policy is that not more than 25% (2017: 25%) of long-term borrowings should mature
in the next 12-month period. In less than one year, the Group’s long-term debt of
49% (2017: 27.3%) will mature at year-end based on the carrying value of borrowings
reflected in the financial statements. However the Group was successful to secure the
same level of funding for the next three years.
Trade creditors form an important part of the short-term financing of the Group’s
working capital. Careful management and control of trade creditors is applied to
ensure maximum use of what is viewed as interest-free debt.
The following guarantees were in place:
Guarantees2018
R'0002017
R'000
Municipalities 18 136 15 642
Other* 329 329
18 465 15 971
*Primarily relates to major supplier in relation to the import of equipment which has
been subsequently settled.
c. Market risk management
Market risk is the risk that changes in market prices such as foreign exchange rates
and interest rates will affect the Group’s income or the value of its holdings
of financial instruments. The objective of market risk management is to manage and
control market risk exposures within acceptable parameters, while optimising the
return of risk.
The Group buys and sells derivatives in the ordinary course of business in order to
manage market risks. All such transactions are carried out within the guidelines set by
the Risk Management Policy.
(i) Foreign currency risk management
The Group is exposed to currency risk on sales and purchases that are
denominated in a currency other than the respective functional currencies
of Group entities. Currencies primarily exposed to from time to time are the
Euro, US Dollar, Botswana Pula, British Pound and the Nigerian Naira. Certain
exchange rate exposures are hedged through the use of forward exchange
contracts.
The Group hedges amounts greater than R2 million (2017: R2 million)
denominated in a foreign currency. Forward exchange contracts are used to
hedge currency risk, when applicable, most with a maturity of less than one year
from the reporting date. When necessary, forward exchange contracts are rolled
over at maturity.
Annual financial statementsNOTES TO THE CONSOLIDATED FINANCIAL STATEMENTS (continued) FOR THE YEAR ENDED 30 JUNE 2018
Clover Industries Limited Integrated Report for the year ended 30 June 2018 173
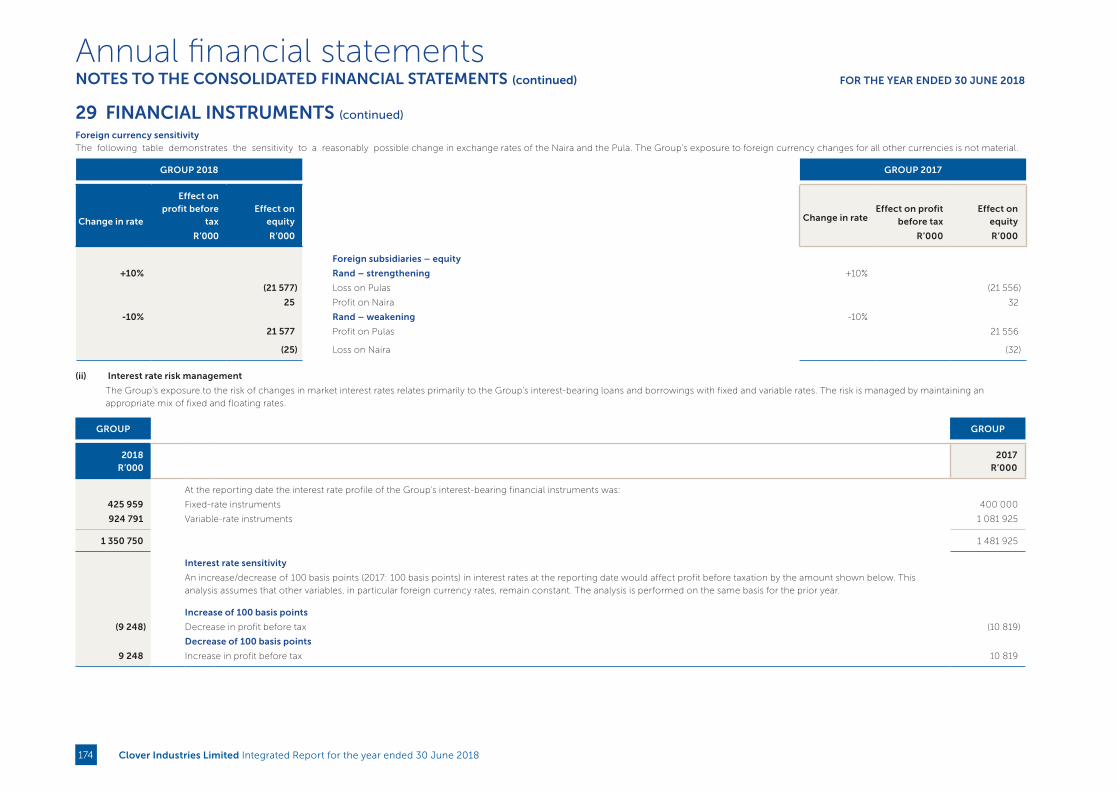
29 FINANCIAL INSTRUMENTS (continued)
Foreign currency sensitivity The following table demonstrates the sensitivity to a reasonably possible change in exchange rates of the Naira and the Pula. The Group’s exposure to foreign currency changes for all other currencies is not material.
GROUP 2018 GROUP 2017
Change in rate
Effect on profit before
taxEffect on
equity Change in rateEffect on profit
before taxEffect on
equity
R’000 R’000 R’000 R’000
Foreign subsidiaries – equity
+10% Rand – strengthening +10%
(21 577) Loss on Pulas (21 556)
25 Profit on Naira 32
-10% Rand – weakening -10%
21 577 Profit on Pulas 21 556
(25) Loss on Naira (32)
(ii) Interest rate risk management
The Group’s exposure to the risk of changes in market interest rates relates primarily to the Group’s interest-bearing loans and borrowings with fixed and variable rates. The risk is managed by maintaining an
appropriate mix of fixed and floating rates.
GROUP GROUP
2018R’000
2017R’000
At the reporting date the interest rate profile of the Group's interest-bearing financial instruments was:
425 959 Fixed-rate instruments 400 000
924 791 Variable-rate instruments 1 081 925
1 350 750 1 481 925
Interest rate sensitivity
An increase/decrease of 100 basis points (2017: 100 basis points) in interest rates at the reporting date would affect profit before taxation by the amount shown below. This
analysis assumes that other variables, in particular foreign currency rates, remain constant. The analysis is performed on the same basis for the prior year.
Increase of 100 basis points
(9 248) Decrease in profit before tax (10 819)
Decrease of 100 basis points
9 248 Increase in profit before tax 10 819
Annual financial statementsNOTES TO THE CONSOLIDATED FINANCIAL STATEMENTS (continued) FOR THE YEAR ENDED 30 JUNE 2018
Clover Industries Limited Integrated Report for the year ended 30 June 2018174

29 FINANCIAL INSTRUMENTS (continued)
GROUP GROUP
2018R’000
2017R’000
(iii) Share price risk management
The Group is affected by the movement in its share price due to the share appreciation rights issued to management. The Group entered into forward share purchases to
hedge 1 824 195 (2017: 2 132 695) of the share appreciation right issued to management. Refer to note 13 for more details.
Forward share purchases sensitivity
An increase/decrease of 10% (2017: 10%) in the share price at the reporting date would have affected profit before taxation by the amounts shown below. This analysis
assumes that all other variables remain constant.
Increase of 10% in share price
3 016 Increase in profit before tax 3 484
Decrease of 10 % in share price
(3 016) Decrease in profit before tax (3 464)
(iv) Clover Good Hope - call and put options
Call option Clover Good Hope
Good Hope granted Clover the irrevocable right to purchase Good Hope’s 49% of the issued share capital in Clover Good Hope (“Call shares”). The call option may be
exercised by Clover within three months after each 12 month period from the fifth anniversary of the effective date. Refer to note 13 for more information regarding the
call option.
Call option sensitivity
An increase/decrease of 10 % in the terminal growth rate at the reporting date would have effected profit before taxation, by the amounts shown below. This analysis
assumes that all other variables remain constant.
Increase of 10% in terminal growth rate
(20) decrease in profit before tax 1 195
Decrease of 10% in terminal growth rate
20 Increase in profit before tax (limited to current option value) (856)
An increase/decrease of 10 % in the discount rate at the reporting date would have effected profit before taxation, by the amounts shown below. This analysis assumes
that all other variables remain constant.
Increase of 10 % in discount rate
(747) Decrease in profit before tax (limited to current option value) (856)
Decrease of 10 % in the discount rate
1 036 Increase in profit before tax 4 547
Put option Clover Good Hope
Clover granted Good Hope the irrevocable right to sell Good Hope’s 49% of the issued share capital in Clover Good Hope (“Put shares”). The put option may be exercised
by Good Hope within three months after each 12 month period from the third anniversary of the effective date. Refer to note 22 for more information regarding the put
option.
Put option sensitivity
The sensitivity analysis indicates that there is no effect on profit before tax when the terminal growth rate is adjusted by 10% upwards or downwards.
An increase/decrease of 10% in the discount rate at the reporting date would have effected profit before taxation, by the amounts shown below. This analysis assumes
that all other variables remain constant.
Increase of 10 % in discount rate
– No effect (2 480)
Decrease of 10 % in the discount rate
– No effect
Annual financial statementsNOTES TO THE CONSOLIDATED FINANCIAL STATEMENTS (continued) FOR THE YEAR ENDED 30 JUNE 2018
Clover Industries Limited Integrated Report for the year ended 30 June 2018 175
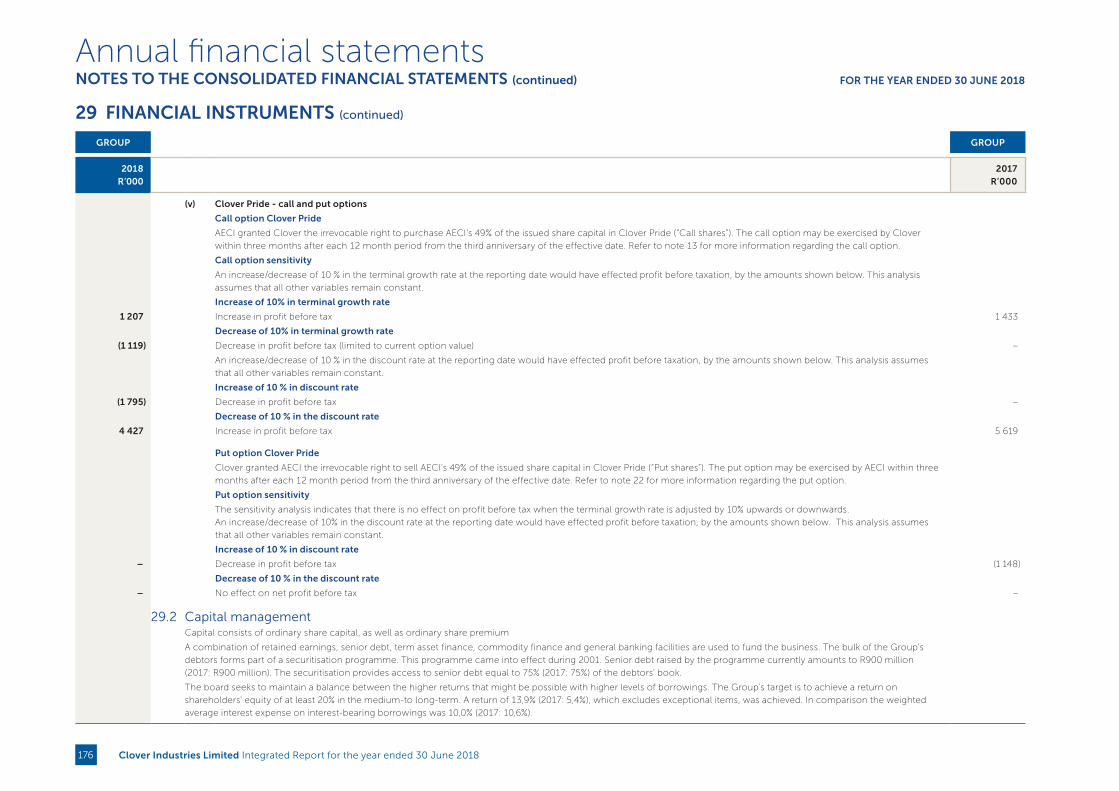
29 FINANCIAL INSTRUMENTS (continued)
GROUP GROUP
2018R’000
2017R’000
(v) Clover Pride - call and put options
Call option Clover Pride
AECI granted Clover the irrevocable right to purchase AECI’s 49% of the issued share capital in Clover Pride (“Call shares”). The call option may be exercised by Clover
within three months after each 12 month period from the third anniversary of the effective date. Refer to note 13 for more information regarding the call option.
Call option sensitivity
An increase/decrease of 10 % in the terminal growth rate at the reporting date would have effected profit before taxation, by the amounts shown below. This analysis
assumes that all other variables remain constant.
Increase of 10% in terminal growth rate
1 207 Increase in profit before tax 1 433
Decrease of 10% in terminal growth rate
(1 119) Decrease in profit before tax (limited to current option value) –
An increase/decrease of 10 % in the discount rate at the reporting date would have effected profit before taxation, by the amounts shown below. This analysis assumes
that all other variables remain constant.
Increase of 10 % in discount rate
(1 795) Decrease in profit before tax –
Decrease of 10 % in the discount rate
4 427 Increase in profit before tax 5 619
Put option Clover Pride
Clover granted AECI the irrevocable right to sell AECI’s 49% of the issued share capital in Clover Pride (“Put shares”). The put option may be exercised by AECI within three
months after each 12 month period from the third anniversary of the effective date. Refer to note 22 for more information regarding the put option.
Put option sensitivity
The sensitivity analysis indicates that there is no effect on profit before tax when the terminal growth rate is adjusted by 10% upwards or downwards.
An increase/decrease of 10% in the discount rate at the reporting date would have effected profit before taxation, by the amounts shown below. This analysis assumes
that all other variables remain constant.
Increase of 10 % in discount rate
– Decrease in profit before tax (1 148)
Decrease of 10 % in the discount rate
– No effect on net profit before tax –
29.2 Capital management
Capital consists of ordinary share capital, as well as ordinary share premium
A combination of retained earnings, senior debt, term asset finance, commodity finance and general banking facilities are used to fund the business. The bulk of the Group's
debtors forms part of a securitisation programme. This programme came into effect during 2001. Senior debt raised by the programme currently amounts to R900 million
(2017: R900 million). The securitisation provides access to senior debt equal to 75% (2017: 75%) of the debtors' book.
The board seeks to maintain a balance between the higher returns that might be possible with higher levels of borrowings. The Group's target is to achieve a return on
shareholders' equity of at least 20% in the medium-to long-term. A return of 13,9% (2017: 5,4%), which excludes exceptional items, was achieved. In comparison the weighted
average interest expense on interest-bearing borrowings was 10,0% (2017: 10,6%).
Annual financial statementsNOTES TO THE CONSOLIDATED FINANCIAL STATEMENTS (continued) FOR THE YEAR ENDED 30 JUNE 2018
Clover Industries Limited Integrated Report for the year ended 30 June 2018176
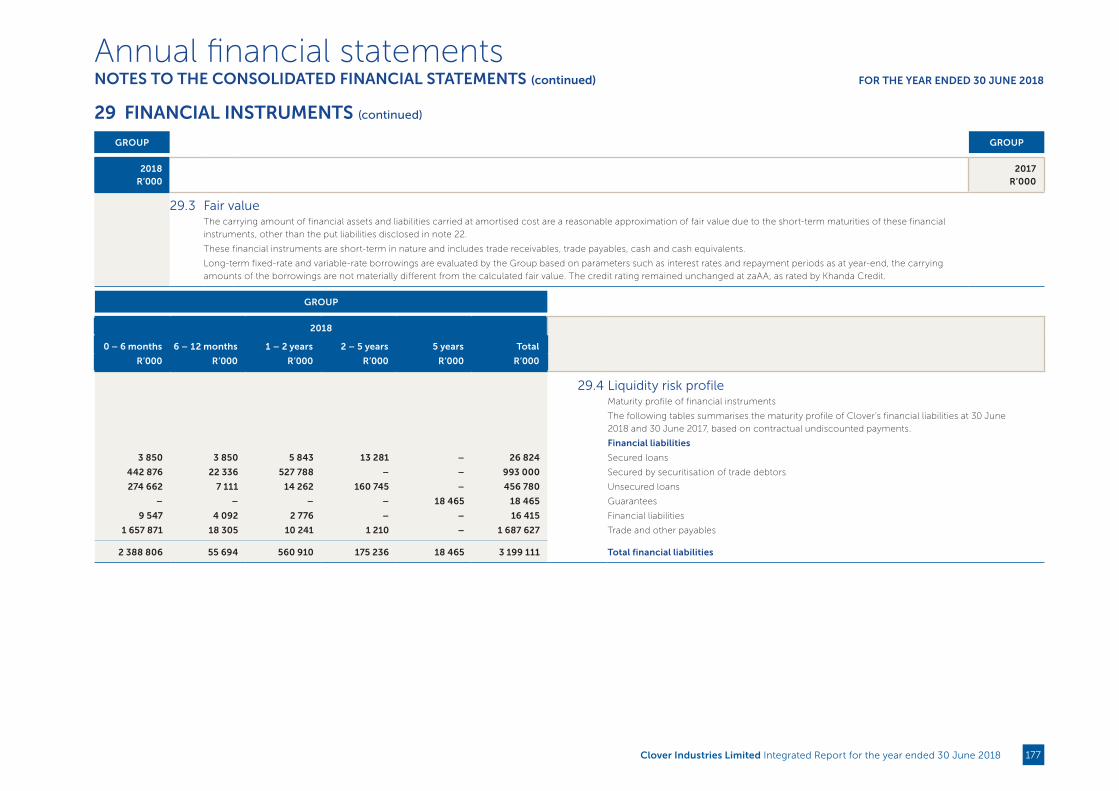
29 FINANCIAL INSTRUMENTS (continued)
GROUP GROUP
2018R’000
2017R’000
29.3 Fair value
The carrying amount of financial assets and liabilities carried at amortised cost are a reasonable approximation of fair value due to the short-term maturities of these financial
instruments, other than the put liabilities disclosed in note 22.
These financial instruments are short-term in nature and includes trade receivables, trade payables, cash and cash equivalents.
Long-term fixed-rate and variable-rate borrowings are evaluated by the Group based on parameters such as interest rates and repayment periods as at year-end, the carrying
amounts of the borrowings are not materially different from the calculated fair value. The credit rating remained unchanged at zaAA, as rated by Khanda Credit.
GROUP
2018
0 – 6 months 6 – 12 months 1 – 2 years 2 – 5 years 5 years Total
R’000 R’000 R’000 R’000 R’000 R’000
29.4 Liquidity risk profile Maturity profile of financial instruments
The following tables summarises the maturity profile of Clover’s financial liabilities at 30 June
2018 and 30 June 2017, based on contractual undiscounted payments.
Financial liabilities
3 850 3 850 5 843 13 281 – 26 824 Secured loans
442 876 22 336 527 788 – – 993 000 Secured by securitisation of trade debtors
274 662 7 111 14 262 160 745 – 456 780 Unsecured loans
– – – – 18 465 18 465 Guarantees
9 547 4 092 2 776 – – 16 415 Financial liabilities
1 657 871 18 305 10 241 1 210 – 1 687 627 Trade and other payables
2 388 806 55 694 560 910 175 236 18 465 3 199 111 Total financial liabilities
Annual financial statementsNOTES TO THE CONSOLIDATED FINANCIAL STATEMENTS (continued) FOR THE YEAR ENDED 30 JUNE 2018
Clover Industries Limited Integrated Report for the year ended 30 June 2018 177
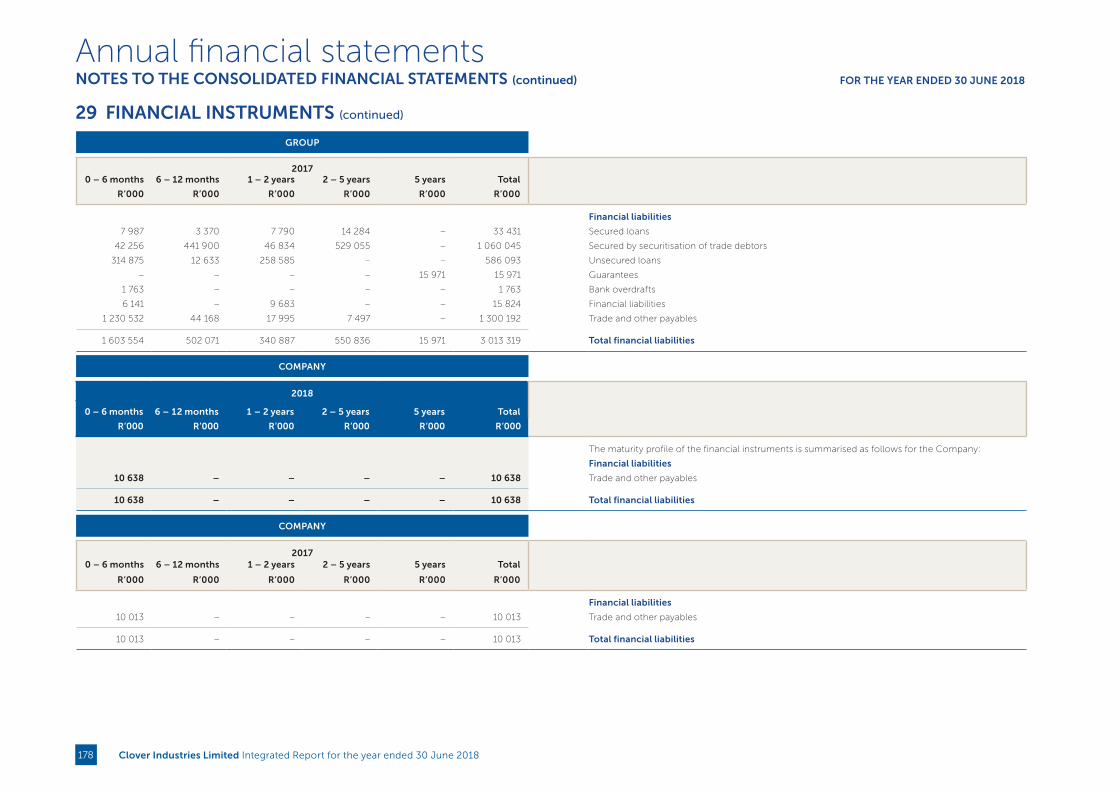
29 FINANCIAL INSTRUMENTS (continued)
GROUP
2017
0 – 6 months 6 – 12 months 1 – 2 years 2 – 5 years 5 years Total
R’000 R’000 R’000 R’000 R’000 R’000
Financial liabilities
7 987 3 370 7 790 14 284 – 33 431 Secured loans
42 256 441 900 46 834 529 055 – 1 060 045 Secured by securitisation of trade debtors
314 875 12 633 258 585 – – 586 093 Unsecured loans
– – – – 15 971 15 971 Guarantees
1 763 – – – – 1 763 Bank overdrafts
6 141 – 9 683 – – 15 824 Financial liabilities
1 230 532 44 168 17 995 7 497 – 1 300 192 Trade and other payables
1 603 554 502 071 340 887 550 836 15 971 3 013 319 Total financial liabilities
COMPANY
2018
0 – 6 months 6 – 12 months 1 – 2 years 2 – 5 years 5 years Total
R’000 R’000 R’000 R’000 R’000 R’000
The maturity profile of the financial instruments is summarised as follows for the Company:
Financial liabilities
10 638 – – – – 10 638 Trade and other payables
10 638 – – – – 10 638 Total financial liabilities
COMPANY
2017 0 – 6 months 6 – 12 months 1 – 2 years 2 – 5 years 5 years Total
R’000 R’000 R’000 R’000 R’000 R’000
Financial liabilities
10 013 – – – – 10 013 Trade and other payables
10 013 – – – – 10 013 Total financial liabilities
Annual financial statementsNOTES TO THE CONSOLIDATED FINANCIAL STATEMENTS (continued) FOR THE YEAR ENDED 30 JUNE 2018
Clover Industries Limited Integrated Report for the year ended 30 June 2018178
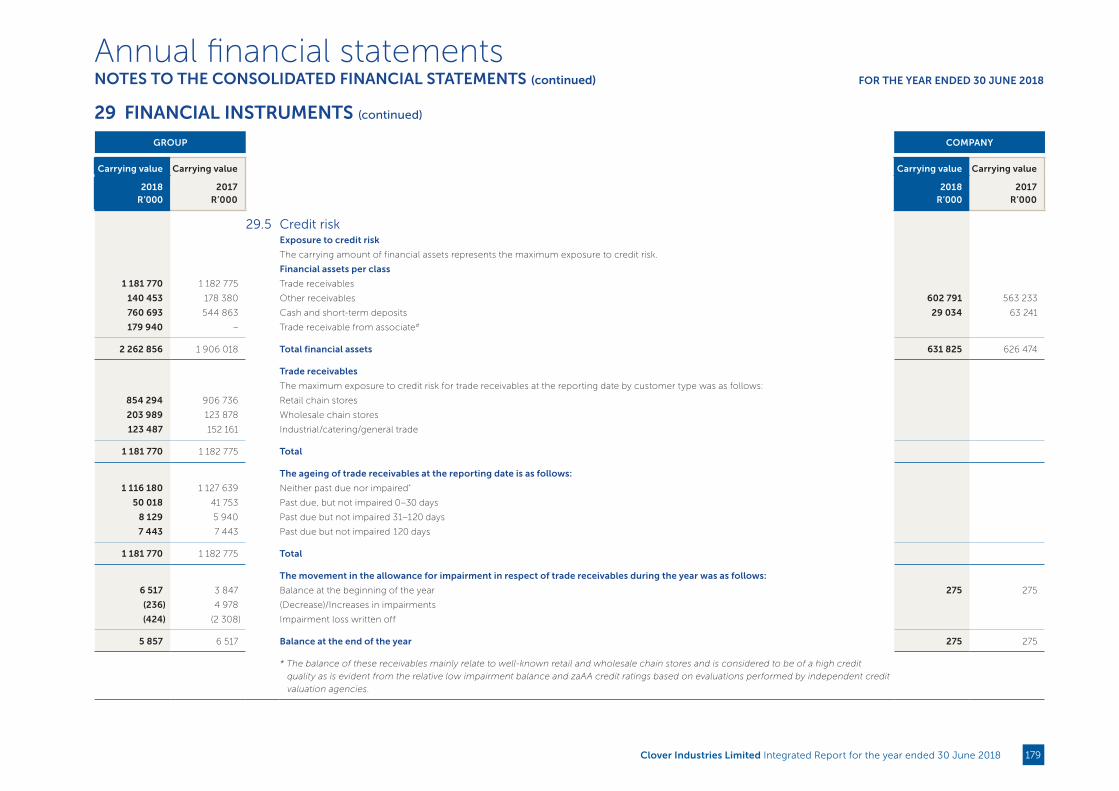
29 FINANCIAL INSTRUMENTS (continued)
GROUP COMPANY
Carrying value Carrying value Carrying value Carrying value
2018 R’000
2017 R’000
2018 R’000
2017 R’000
29.5 Credit risk
Exposure to credit risk
The carrying amount of financial assets represents the maximum exposure to credit risk.
Financial assets per class
1 181 770 1 182 775 Trade receivables
140 453 178 380 Other receivables 602 791 563 233
760 693 544 863 Cash and short-term deposits 29 034 63 241
179 940 – Trade receivable from associate#
2 262 856 1 906 018 Total financial assets 631 825 626 474
Trade receivables
The maximum exposure to credit risk for trade receivables at the reporting date by customer type was as follows:
854 294 906 736 Retail chain stores
203 989 123 878 Wholesale chain stores
123 487 152 161 Industrial/catering/general trade
1 181 770 1 182 775 Total
The ageing of trade receivables at the reporting date is as follows:
1 116 180 1 127 639 Neither past due nor impaired*
50 018 41 753 Past due, but not impaired 0–30 days
8 129 5 940 Past due but not impaired 31–120 days
7 443 7 443 Past due but not impaired 120 days
1 181 770 1 182 775 Total
The movement in the allowance for impairment in respect of trade receivables during the year was as follows:
6 517 3 847 Balance at the beginning of the year 275 275
(236) 4 978 (Decrease)/Increases in impairments
(424) (2 308) Impairment loss written off
5 857 6 517 Balance at the end of the year 275 275
* The balance of these receivables mainly relate to well-known retail and wholesale chain stores and is considered to be of a high credit
quality as is evident from the relative low impairment balance and zaAA credit ratings based on evaluations performed by independent credit
valuation agencies.
Annual financial statementsNOTES TO THE CONSOLIDATED FINANCIAL STATEMENTS (continued) FOR THE YEAR ENDED 30 JUNE 2018
Clover Industries Limited Integrated Report for the year ended 30 June 2018 179

29 FINANCIAL INSTRUMENTS (continued)
GROUP COMPANY
Carrying value Carrying value Carrying value Carrying value
2018 R’000
2017 R’000
2018 R’000
2017 R’000
29.5 Credit risk (continued)
# The balance of this receivable relates to DFSA and is owing to the Group for services rendered during the ordinary course of business. DFSA
is still in its infant stage and is funding its working capital requirements via a revolving credit facility made available to it from the Group.
The ageing of the trade account is in a healthy state and all amounts are neither past due or nor impaired. Refer to note 29.1 para (a) for more
details about credit risk management.
The allowance for impairment accounts in respect of trade receivables are used to record impairment losses unless the Group is satisfied
that no recovery of the amount owing is possible; at that point the amount considered irrecoverable is written off against the financial asset
directly.
The impairment loss written off relates to customers defaulting on payments and being handed over to lawyers for recovery.
GROUP COMPANY
2018R’000
2017 R’000
2018 R’000
2017 R’000
30.1 INVESTMENT IN SUBSIDIARY, JOINT VENTURES AND ASSOCIATE
Investment in subsidiary company
Clover SA 326 735 326 735
Total investment in subsidiary 326 735 326 735
Share of investment in joint ventures
– – Clover Futurelife
46 035 38 946 Clover Fonterra
46 035 38 946 Total of investment in joint ventures
Share of investment in an associate
– – DFSA
– – Total of investment in a associate
Annual financial statementsNOTES TO THE CONSOLIDATED FINANCIAL STATEMENTS (continued) FOR THE YEAR ENDED 30 JUNE 2018
Clover Industries Limited Integrated Report for the year ended 30 June 2018180
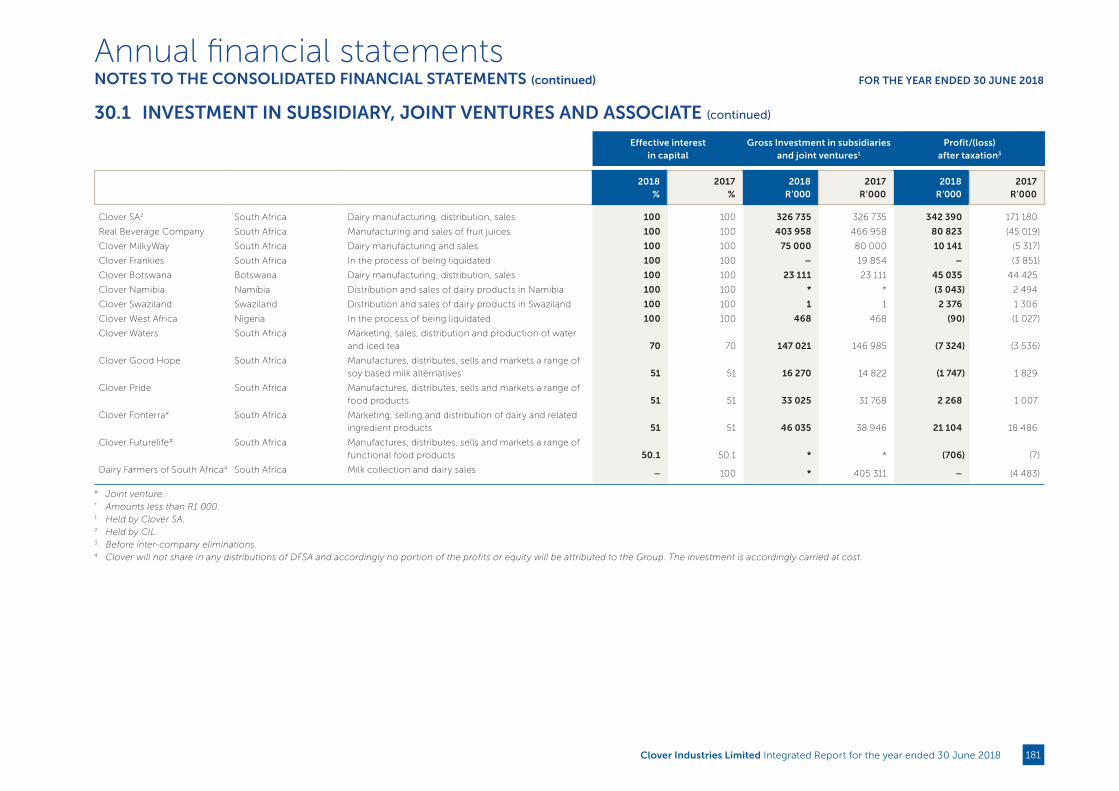
Effective interest in capital
Gross Investment in subsidiaries and joint ventures1
Profit/(loss) after taxation3
Subsidiary and joint ventureName of company
Country of incorporation Nature of business
2018%
2017%
2018R’000
2017R’000
2018R’000
2017R’000
Clover SA2 South Africa Dairy manufacturing, distribution, sales 100 100 326 735 326 735 342 390 171 180
Real Beverage Company South Africa Manufacturing and sales of fruit juices 100 100 403 958 466 958 80 823 (45 019)
Clover MilkyWay South Africa Dairy manufacturing and sales 100 100 75 000 80 000 10 141 (5 317)
Clover Frankies South Africa In the process of being liquidated 100 100 – 19 854 – (3 851)
Clover Botswana Botswana Dairy manufacturing, distribution, sales 100 100 23 111 23 111 45 035 44 425
Clover Namibia Namibia Distribution and sales of dairy products in Namibia 100 100 * * (3 043) 2 494
Clover Swaziland Swaziland Distribution and sales of dairy products in Swaziland 100 100 1 1 2 376 1 306
Clover West Africa Nigeria In the process of being liquidated 100 100 468 468 (90) (1 027)
Clover Waters South Africa Marketing, sales, distribution and production of water
and iced tea 70 70 147 021 146 985 (7 324) (3 536)
Clover Good Hope South Africa Manufactures, distributes, sells and markets a range of
soy based milk alternatives 51 51 16 270 14 822 (1 747) 1 829
Clover Pride South Africa Manufactures, distributes, sells and markets a range of
food products 51 51 33 025 31 768 2 268 1 007
Clover Fonterra# South Africa Marketing, selling and distribution of dairy and related
ingredient products 51 51 46 035 38 946 21 104 18 486
Clover Futurelife# South Africa Manufactures, distributes, sells and markets a range of
functional food products 50.1 50.1 * * (706) (7)
Dairy Farmers of South Africa4 South Africa Milk collection and dairy sales – 100 * 405 311 – (4 483)
# Joint venture.* Amounts less than R1 000.1 Held by Clover SA.2 Held by CIL.3 Before inter-company eliminations.4 Clover will not share in any distributions of DFSA and accordingly no portion of the profits or equity will be attributed to the Group. The investment is accordingly carried at cost.
30.1 INVESTMENT IN SUBSIDIARY, JOINT VENTURES AND ASSOCIATE (continued)
Annual financial statementsNOTES TO THE CONSOLIDATED FINANCIAL STATEMENTS (continued) FOR THE YEAR ENDED 30 JUNE 2018
Clover Industries Limited Integrated Report for the year ended 30 June 2018 181

30.2 FINANCIAL STATEMENTS DETAILS OF SUBSIDIARIES WITH NCI GROUP COMPANY
2018R’000
2017 R’000
2018R’000
2017R’000
Clover Good Hope
Subsidiary’s statement of financial position
18 737 29 878 Current assets including cash and cash equivalents of R1,8 million (2017: R9,7 million) and inventory of R5,8 million (2017: R7,7 million)
7 413 6 959 Non-current assets including property, plant and equipment of Rnil million (2017: Rnil million) and intangibles of R6,6 million (2017: R7 million)
– (508) Non-current liabilities including deferred tax R0 million (2017: R0.5 million)
(18 280) (25 034) Current liabilities including trade and other payables of R18 million (2017: R25 million)
(7 870) (11 295) Equity (net asset value)
51% 51% Portion of the Group’s ownership
4 014 5 760 Net asset value of the investment
Subsidiary’s revenue and (loss)/profit
74 891 90 405 Revenue
(70 038) (73 663) Cost of sales
(8 499) (10 372) Sales, marketing, distribution and administrative expenses
– (283) Other operating (expenses)/income
(1 111) (1 090) Net finance cost
(4 757) 4 997 Profit before taxation
1 332 (1 411) Income tax expense
(3 425) 3 586 (Loss)/profit for the year
51% 51% Portion of the Group’s ownership
(1 747) 1 829 Group’s share of (loss)/profit for the year
– – Dividend received
Annual financial statementsNOTES TO THE CONSOLIDATED FINANCIAL STATEMENTS (continued) FOR THE YEAR ENDED 30 JUNE 2018
Clover Industries Limited Integrated Report for the year ended 30 June 2018182

GROUP COMPANY
2018 R’000
2017 R’000
2018R’000
2017R’000
Clover Waters
Subsidiary’s statement of financial position
96 686 53 894 Current assets including cash and cash equivalents R28,6m million (2017: R2,6 million) and inventory R24,3 million (2017: R24,5 million)
128 585 150 236 Non-current assets including property, plant and equipment R97 million (2017: R112 million) and deferred tax asset of Rnil (2017:R4,9 million)
(198 643) (166 916) Current liabilities including trade and other payables of R198 million (2017: R138,2 million)
(26 628) (37 214) Equity (net asset value)
70% 70% Portion of the Group’s ownership
18 640 26 050 Net asset value of the investment
Subsidiary’s revenue and (loss)/profit
233 045 252 564 Revenue
(158 435) (163 763) Cost of sales
(61 476) (74 626) Sales, marketing, distribution and administrative expenses
(4 032) (14 140) Other operating expenses
(14 710) (12 605) Net finance cost
(5 608) (12 570) Loss before taxation
(4 855) 7 518 Income tax
(10 463) (5 052) (Loss) for the year
70% 70% Portion of the Group’s ownership
(7 324) (3 536) Group’s share of loss for the year
– – Dividend received
30.2 FINANCIAL STATEMENTS DETAILS OF SUBSIDIARIES WITH NCI (continued)
Annual financial statementsNOTES TO THE CONSOLIDATED FINANCIAL STATEMENTS (continued) FOR THE YEAR ENDED 30 JUNE 2018
Clover Industries Limited Integrated Report for the year ended 30 June 2018 183

30.2 FINANCIAL STATEMENTS DETAILS OF SUBSIDIARIES WITH NCI (continued)
GROUP COMPANY
2018R’000
2017 R’000
2018R’000
2017R’000
Clover Pride
Subsidiary’s statement of financial position
29 953 23 096 Current assets including cash and cash equivalents of R0,4 million (2017: R0,4 million) and inventory R22,9 million (2017:R13,9 million)
56 915 59 493 Non-current assets including property, plant and equipment of R0,5 million (2017: 0.5 million( and intangibles R59,0 million (2017: 59,0 million)
(62) (117) Non-current liabilities including deferred tax R0,1 million (2017: 0,1 million)
(21 203) (20 563) Current liabilities including trade and other payables of R21.2 million (2017: R20,4 million)
(65 603) (61 909) Equity (net asset value)
51% 51% Portion of the Group’s ownership
33 458 31 574 Net asset value of the investment
Subsidiary’s revenue and profit
87 408 22 358 Revenue
(64 951) (15 016) Cost of sales
(15 069) (3 562) Sales, marketing, distribution and administrative expenses
– (797) Other operating (expense)/income
(1 226) (241) Net finance cost
6 162 2 742 Profit before taxation
(1 714) (767) Income tax expense
4 448 1 975 Profit for the year
51% 51% Portion of the Group’s ownership
2 268 1 007 Group’s share of profit for the year
– – Dividend received
Refer to note 3.1 for the joint ventures namely Clover Fonterra Ingredients and Clover Futurelife and 3.2 for Dairy Farmers of South Africa
Annual financial statementsNOTES TO THE CONSOLIDATED FINANCIAL STATEMENTS (continued) FOR THE YEAR ENDED 30 JUNE 2018
Clover Industries Limited Integrated Report for the year ended 30 June 2018184

31 SHARE-BASED PAYMENTS 31.1 Equity-settled share appreciation rights scheme
– Clover Share Appreciation Rights Plan (2010) (ordinary shares in CIL)
On 31 May 2010 the ordinary and preference shareholders approved the Clover Share Appreciation Rights (SAR) Plan as well as the placement of 16 million unissued ordinary shares under the control of the Directors to fulfil the Group’s potential future obligations in terms of the plan. The main rules of the plan are as follows:
The Group’s obligations in terms of this plan can at the election of the Group be settled in cash or by the issue of ordinary shares.
New SAR may be exercised at the election of the participants, at any time after they have vested, provided that the participant concerned is still in the employment of Clover. On exercise employees will be awarded shares to the value equal to the difference between the fair market value of ordinary shares on the date of issue of the new SAR in question and the fair market value of the ordinary shares on the date of exercise.
Further details on the scheme are available in the detailed circular issued to shareholders on 7 May 2010 and the report on remuneration on page 87 to 101.
The SAR granted are expensed over their vesting period in terms of IFRS 2. The estimated fair value of these SAR was calculated using the Hull-White Trinomial Lattice valuation model.
The following inputs were used for the calculation of the fair value:
Initial allocation – expected volatility of 30,3%, risk free rate of 8,90% and a dividend yield of 2,34%.
Third allocation – expected volatility of 19,9%, risk free rate of 8,55% and a dividend yield of 3,33%.
Allocation to new executive Committee member – Expected volatility of 17,4%, risk free rate of 7,94% and a dividend yield of 2,00%.
Fourth allocation – expected volatility of 17,4%, risk free rate of 7,94% and a dividend yield of 2,00%
Fifth allocation – expected volatility of 24,3%, risk free rate of 6,67% and dividend yield of 1,74%.
Sixth allocation – expected volatility of 21,4%, risk free rate of 7,01% and dividend yield of 1,80%.
Allocation to new executive committee member – expected volatility of 22,7%, risk free rate of 7,45% and a dividend yield of 2,14%.
Seventh allocation – expected volatility of 26,9%, risk free rate of 7,37% and dividend yield of 1,92%.
Expected volatility is calculated based on the average share price per day and the intra-day share price movements since listing.
Eighth allocation – expected volatility of 33,0%, risk free rate of 8,19% and a dividend yield of 2,95%.
Ninth allocation - expected volatility of 26,7%, risk free rate of 7,98% and a dividend yield of 3,48%.
Allocation to new executive director - expected volatility of 28,9%, risk free rate of 7,90% and a dividend yield of 3,05%.
Allocation to existing executive committee member - expected volatility of 29,1%, risk free rate of 8,01% and a dividend yield of 3,35%.
Annual financial statementsNOTES TO THE CONSOLIDATED FINANCIAL STATEMENTS (continued) FOR THE YEAR ENDED 30 JUNE 2018
Clover Industries Limited Integrated Report for the year ended 30 June 2018 185

Share appreciation rights
Description Grant dateWeighted average remaining contractual life (years)
Exercise price
SAR granted not yet exercised
Estimated weighted average fair value per right at grant date (Adjusted for 2 for 1 share split) Vesting period
Clover’s Share Appreciation Rights Plan (2010)
– Initial allocation 31 May 2010 Till employment terminates R4,67
1 808 459
(2017: 1 808 459) R2,11
One-third on 31 May 2013, a further third on 31 May
2014 and a final third on 31 May 2015
Clover’s Share Appreciation Rights Plan (2010)
– Third allocation 1 July 2011 All rights have been exercised R11,00
-
(2017: 57 778) R3,11 Full allocation vested on 1 July 2014
Clover’s Share Appreciation Rights Plan (2010)
– Allocation to executive committee member
ER Bosch 1 June 2012
The employee has left the
service of the Group R13,50
-
(2017: 953 620) R4,03
One-third on 1 June 2015, one-third on
1 June 2016 and a final third on 1 June 2017
Clover’s Share Appreciation Rights Plan (2010)
– Fourth allocation 1 July 2012 Two years R13,73
1 474 962
(2016: 1 474 962) R3,70 Full allocation vested on 1 July 2015
Clover’s Share Appreciation Rights Plan (2010)
– Allocation to executive committee member
MM Palmeiro 1 October 2012 Two years R14,15
925 500
(2016: 925 500) R3,95
One-third on 1 October 2015, a third on 1 October
2016 and a final third on 1 October 2017
Clover’s Share Appreciation Rights Plan (2010)
– Fifth allocation 1 July 2013 Three years R16,83
1 924 018
(2017: 2 256 153) R4,97 Full allocation vests on 1 July 2016
Clover’s Share Appreciation Rights Plan (2010)
– Sixth allocation 20 June 2014 Four years R17,31
594 872
(2017: 697 562) R4,83 Full allocation vests on 30 June 2017
Clover’s Share Appreciation Rights Plan (2010)
– Allocation to executive committee member
J van Heerden 26 September 2014 Two years R17,55
501 425
(2016: 501 425) R5,25
One third on 26 September 2017, one third
on 26 September 2018 and a final third on
26 September 2019
Clover’s Share Appreciation Rights Plan (2010)
– Seventh allocation 30 June 2015 Four years R17,34
722 334
(2017: 2 779 769) R5,38 Full allocation vests on 30 June 2018
Clover’s Share Appreciation Rights Plan (2010)
– Eighth allocation 30 June 2016 Three years R18,44
2 679 262
(2017: 2 679 262) R5,58 Full allocation vests on 30 June 2019
Clovers Share Appreciation Rights Plan (2010) -
Ninth allocation 30 June 2017 Four years R16,75
3 108 839
(2017: 3 108 839) R 4.40 Full allocation vest on 30 June 2020
Clovers Share Appreciation Rights Plan
(2010) - Allocation to new executive director
FF Scheepers 01 November 2017 Six years R13,56
1 000 000
(2017: 0) R 4.53
One third on 1 November 2020, a third
on 1 November 2021 and final third on
1 November 2022
Clover’s Share Appreciation Rights Plan (2010)
– Second allocation to executive committee
member J van Heerden 14 February 2018 Seven years R15,15
200 000
(2017: 0) R 4.87
One third on 14 February 2021, a third
on 14 February 2022 and final third on
14 February 2023
31 SHARE-BASED PAYMENTS (continued)
Annual financial statementsNOTES TO THE CONSOLIDATED FINANCIAL STATEMENTS (continued) FOR THE YEAR ENDED 30 JUNE 2018
Clover Industries Limited Integrated Report for the year ended 30 June 2018186

31 SHARE-BASED PAYMENTS (continued)
GROUP COMPANY
2018 R’000
2017R’000
2018 R’000
2017R’000
Provision against income
(2 593) 5 865 Share-based payment (credit)/expense
There were no changes made to the share appreciation rights or the executives' interests therein after 30 June 2018 up to the approval of the annual financial statements.
Annual financial statementsNOTES TO THE CONSOLIDATED FINANCIAL STATEMENTS (continued) FOR THE YEAR ENDED 30 JUNE 2018
Clover Industries Limited Integrated Report for the year ended 30 June 2018 187

32 DIRECTORS' REMUNERATION AND INTERESTS32.1 Directors’ remuneration
2018
Basic salary
Fees for services as
director
Individual performance
bonusProfit share
bonus
Retirement and medical
contributionsRe-imbursive
expensesOther
benefits* Total
R'000 R'000 R'000 R'000 R'000 R' 000 R'000 R'000
Executive Directors
JH Vorster 5 823 – 1 727 – 820 27 249 8 646
FF Scheepers (appointed 1 January 2018) 2 313 – 587 – 339 10 97 3 346
ER Bosch (resigned 31 December 2017) 1 784 – – – 237 17 70 2 108
Total remuneration of executive directors 9 920 – 2 314 – 1 396 54 416 14 100
Non-executive directors
WI Büchner – 1 341 – – – – – 1 341
JW Basson (Dr) (appointed 1 January 2018) – 178 – – – – – 178
SF Booysen (Dr) – 1 010 – – – – – 1 010
JFM Morgan (appointed 1 January 2018) – 178 – – – – – 178
NA Smith – 536 – – – – – 536
N Mokhesi – 835 – – – – – 835
B Ngonyama – 665 – – – – – 665
Total remuneration of non-executive directors – 4 743 – – – – – 4 743
Total directors’ remuneration 9 920 4 743 2 314 – 1 396 54 416 18 843
Other executives (prescribed officers)
H Lubbe 3 449 – 876 – 523 65 180 5 093
JHF Botes (Dr) 3 464 – 884 – 545 63 179 5 135
MM Palmeiro 2 844 – 1 507 – 429 25 794 5 599
J van Heerden 2 899 – 737 – 430 86 254 4 406
Total remuneration of other executives 12 656 – 4 004 – 1 927 239 1 407 20 233
* Other benefits include long-service award payouts, leave payouts on retirement, housing allowances for expatriates, travel and accommodation expenses.
Annual financial statementsNOTES TO THE CONSOLIDATED FINANCIAL STATEMENTS (continued) FOR THE YEAR ENDED 30 JUNE 2018
Clover Industries Limited Integrated Report for the year ended 30 June 2018188

32 DIRECTORS’ REMUNERATION AND INTERESTS (continued)
2017
Basic salary
Fees for services as
director
Individual performance
bonusProfit share
bonus
Retirement and medical
contributionsRe-imbursive
expenses
Other benefits* Total
R'000 R'000 R'000 R'000 R'000 R' 000 R'000 R'000
Executive directors
JH Vorster 5 500 – – – 628 – 283 6 411
ER Bosch 3 397 – – – 452 – 132 3 981
Total remuneration of executive directors 8 897 – – – 1 080 – 415 10 392
Non-executive directors
WI Büchner – 1 191 – – – – – 1 191
TA Wixley (resigned 28 November 2016) – 374 – – – – – 374
SF Booysen (Dr) – 840 – – – – – 840
JNS Du Plessis (resigned 11 January 2017) – 249 – – – 8 – 257
NA Smith – 414 – – – – – 414
N Mokhesi – 637 – – – – – 637
B Ngonyama – 539 – – – – – 539
PR Griffin (resigned 28 November 2016) – 134 – – – 18 – 152
Total remuneration of non-executive directors – 4 378 – – – 26 – 4 404
Total directors’ remuneration 8 897 4 378 – – 1 080 26 415 14 796
Other executives (prescribed officers)
H Lubbe 3 285 – – – 409 – 170 3 864
JHF Botes (Dr) 3 300 – – – 430 – 169 3 899
MM Palmeiro 2 708 – – – 340 – 760 3 808
J van Heerden 2 635 – – – 324 – 241 3 200
Total remuneration of other executives 11 928 – – – 1 503 – 1 340 14 771
* Other benefits include long-service award payouts, leave payouts on retirement, housing allowances for expatriates, travel and accommodation expenses.
Annual financial statementsNOTES TO THE CONSOLIDATED FINANCIAL STATEMENTS (continued) FOR THE YEAR ENDED 30 JUNE 2018
Clover Industries Limited Integrated Report for the year ended 30 June 2018 189
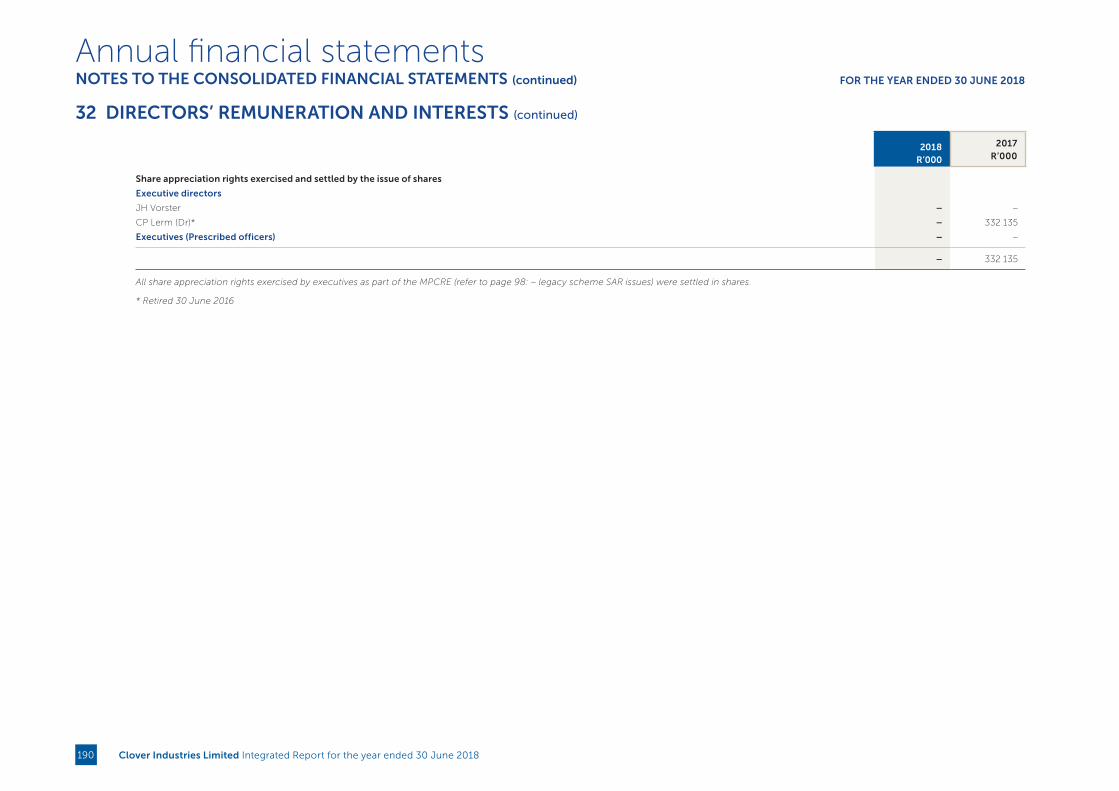
32 DIRECTORS’ REMUNERATION AND INTERESTS (continued)
2018
R’000
2017R’000
Share appreciation rights exercised and settled by the issue of shares
Executive directors
JH Vorster – –
CP Lerm (Dr)* – 332 135
Executives (Prescribed officers) – –
– 332 135
All share appreciation rights exercised by executives as part of the MPCRE (refer to page 98: – legacy scheme SAR issues) were settled in shares.
* Retired 30 June 2016
Annual financial statementsNOTES TO THE CONSOLIDATED FINANCIAL STATEMENTS (continued) FOR THE YEAR ENDED 30 JUNE 2018
Clover Industries Limited Integrated Report for the year ended 30 June 2018190

32 DIRECTORS’ REMUNERATION AND INTERESTS (continued)
32.2 Interest of directors and other executives in share appreciation rights
The interest of executive and non-executive directors in the shares of the Company provided for in the form of share appreciation rights are set out in the table below:
Allocation of
rights
Number of rights
at allocation date
Number of rights as at
30 June 2017
Share appreciation
rights granted
during the year
Number of rights
exercised*/ cancelled^ during the
year
Number of rights as at
30 June 2018
Number of rights that
have vested as at
30 June 2018
Share price on date
exercisedGrant price Date from which exercisable
JH Vorster Fourth 1 036 716 696 716 696 716 696 716 13.73 All on 1 July 2015.
Fifth 879 589 879 589 879 589 879 589 16.83 All on 1 July 2016.
Sixth 906 510 271 953 271 953 271 953 17.31 All on 30 June 2017.
Seventh 975 927 975 927 683 149^ 292 778 292 778 17.34 All on 30 June 2018.
Eighth 919 753 919 753 919 753 18.44 All on 30 June 2019.
Ninth 1 087 427 1 087 427 1 087 427 16.75 All on 30 June 2020.
FF Scheepers
(appointed 1 January
2018)
Allocation of
newly appointed 1 000 000 – 1 000 000 1 000 000 13.56
One third on 1 November 2020, a
third on 1 November 2021 and final
third on 1 November 2022
ER Bosch (resigned
31 December 2017)
Allocation of
newly appointed
953 620 953 620 953 620* – 15.26 13.50 One-third on 1 June 2015, a third
on 1 June 2016 and final third on
1 June 2017.
Fifth 332 135 332 135 332 135^ – 16.83 All on 1 July 2016.
Sixth 342 301 102 690 102 690^ – 17.31 All on 30 June 2017.
Seventh 371 988 371 988 371 988^ – 17.34 All on 30 June 2018.
Eighth 362 256 362 256 362 256^ – 18.44 All on 30 June 2019.
Ninth 426 302 426 302 426 302^ – 16.75 All on 30 June 2020.
Total executive directors 9 594 524 7 380 356 1 000 000 3 232 140 5 148 216 2 141 036
Annual financial statementsNOTES TO THE CONSOLIDATED FINANCIAL STATEMENTS (continued) FOR THE YEAR ENDED 30 JUNE 2018
Clover Industries Limited Integrated Report for the year ended 30 June 2018 191

32 DIRECTORS’ REMUNERATION AND INTERESTS (continued)
Allocation of
rights
Number of rights
at allocation date
Number of rights as at
30 June 2017
Share appreciation
rights granted
during the year
Number of rights
exercised*/ cancelled^ during the
year
Number of rights as at
30 June 2018
Number of rights that
have vested as at
30 June 2018
Share price on date
exercisedGrant price Date from which exercisable
Other executives (prescribed officers)
H Lubbe First 2 027 236 1 351 491 1 351 491 1 351 491 4.67 One-third on 31 May 2013, a further
third on 31 May 2014 and a final third
on 31 May 2015.
Third 57 778 57 778 57 778* – – 16.90 11.00 All on 1 July 2014.
Fourth 389 123 389 123 389 123 389 123 13.73 All on 1 July 2015.
Fifth 332 135 332 135 332 135 332 135 16.83 All on 1 July 2016.
Sixth 342 301 102 690 102 690 102 690 17.31 All on 30 June 2017.
Seventh 370 992 370 992 259 694^ 111 298 111 298 17.34 All on 30 June 2018.
Eighth 349 625 349 625 349 625 18.44 All on 30 June 2019.
Ninth 413 886 413 886 413 886 16.75 All on 30 June 2020.
JHF Botes (Dr) First 1 370 904 456 968 456 968 456 968 4.67 One-third on 31 May 2013, a further
third on 31 May 2014 and a final third
on 31 May 2015.
Fourth 389 123 389 123 389 123 389 123 13.73 All on 1 July 2015.
Fifth 332 135 332 135 332 135 332 135 16.83 All on 1 July 2016.
Sixth 342 301 102 690 102 690 102 690 17.31 All on 30 June 2017.
Seventh 372 023 372 023 260 416^ 111 607 111 607 17.34 All on 30 June 2018.
Eighth 350 598 350 598 350 598 18.44 All on 30 June 2019.
Ninth 417 645 417 645 417 645 16.75 All on 30 June 2020.
Annual financial statementsNOTES TO THE CONSOLIDATED FINANCIAL STATEMENTS (continued) FOR THE YEAR ENDED 30 JUNE 2018
Clover Industries Limited Integrated Report for the year ended 30 June 2018192

32 DIRECTORS’ REMUNERATION AND INTERESTS (continued)
Allocation of
rights
Number of rights
at allocation date
Number of rights as at
30 June 2017
Share appreciation
rights granted
during the year
Number of rights
exercised*/ cancelled^ during the
year
Number of rights as at
30 June 2018
Number of rights that
have vested as at
30 June 2018
Share price on date
exercisedGrant price Date from which exercisable
MM Palmeiro Allocation of
newly appointed
925 500 925 500 925 500 925 500 14.15 One-third on 1 October 2015, a third
on 1 October 2016 and final third on
1 October 2017.
Fifth 380 159 380 159 380 159 380 159 16.83 All on 1 July 2016.
Sixth 391 795 117 538 117 538 117 538 17.31 All on 30 June 2017.
Seventh 417 246 417 246 292 072^ 125 174 125 174 17.34 All on 30 June 2018.
Eighth 415 808 415 808 415 808 18.44 All on 30 June 2019.
Ninth 423 249 423 249 423 249 16.75 All on 30 June 2020.
J van Heerden Allocation of
newly appointed
501 425 501 425 501 425 167 142 17.55 One third on 26 September 2017, a
third on 26 September 2018 and final
third on 26 September 2019.
Seventh 271 593 271 593 190 115^ 81 478 81 478 17.34 All on 30 June 2018.
Eighth 281 222 281 222 281 222 18.44 All on 30 June 2019.
Ninth 340 330 340 330 340 330 16.75 All on 30 June 2020.
Top-up
allocation 200 000 – 200 000 200 000 15.15
One third on 14 February 2021, a third
on 14 February 2022 and final third on
14 February 2023.
Total other executives 12 406 132 9 862 973 200 000 1 060 075 9 002 897 5 476 251
Total 22 000 656 17 243 329 1 200 000 4 292 215 14 151 113 7 617 287
Under the SAR scheme, the aggregate number of ordinary shares which may be acquired by the executives may not exceed 16 million ordinary shares. At 30 June 2018, a total of 11 240 883 (30 June 2017:
11 202 483 ordinary shares) have been issued to executives, with the balance of 4 759 117 ordinary shares remaining available for issue.
* Exercised
^ Cancelled
Annual financial statementsNOTES TO THE CONSOLIDATED FINANCIAL STATEMENTS (continued) FOR THE YEAR ENDED 30 JUNE 2018
Clover Industries Limited Integrated Report for the year ended 30 June 2018 193

32 DIRECTORS’ REMUNERATION AND INTERESTS (continued)
Number of shares at 30 June 2018 Number of shares at 30 June 2017
Direct Indirect Associates Direct Indirect Associates
32.3 Interest of directors and other executives of the Company in ordinary share capital
Executive directors
4 088 925 4 500 000 403 364 JH Vorster 4 583 334 4 500 000 403 364
4 088 925 4 500 000 403 364 4 583 334 4 500 000 403 364
Non-executive directors
– 486 492 – WI Büchner* – 591 492 –
– 900 085 – NA Smith – 900 085 –
– – – TA Wixley^ 48 222 – –
– – – PR Griffin^ 15 245 – –
– 1 386 577 – 63 467 1 491 577 –
4 088 925 5 886 577 403 364 Total directors’ interests in ordinary share capital 4 646 801 5 991 577 403 364
Other executives (prescribed officers)
242 222 – – H Lubbe 242 222 – –
951 998 – – JHF Botes (Dr) 951 998 – –
1 194 220 – – Total interest of other executives in ordinary share capital 1 194 220 – –
There have been no changes in directors’ interests in the share capital of the Company between the end of the financial year and the date of the approval of the annual financial statements.
* This director is a trustee of the Clover Milk Producer Trust that holds 23 714 200 (2017: 23 700 000) ordinary shares in the Company.
^ Resigned 28 November 2016
Annual financial statementsNOTES TO THE CONSOLIDATED FINANCIAL STATEMENTS (continued) FOR THE YEAR ENDED 30 JUNE 2018
Clover Industries Limited Integrated Report for the year ended 30 June 2018194

GROUP COMPANY
2018 R’000
2017R’000
2018R’000
2017R’000
33 LONG-SERVICE BONUS
33.1 Introduction
The Group rewards employees with long service by remunerating them with a lump sum after a specific number of service years.
Assumptions and valuation methods are as follows:
33.2 Background
The long-service bonuses which employees receive differ between employees whose employment date were before 1 January
2001 and employees whose employment date was after 1 January 2001. The benefit is as follows: Employees with an employment date before 1 January 2001
Employees receive a bonus of three times their monthly basic salary after 15 years service and one time their monthly basic salary
every five years thereafter. In addition, employees with more than 30 years service will receive a gift to the value of R7 600. Employees with an employment date after 1 January 2001
Employees receive a bonus of 10% of their monthly basic salary after 10 years’ service, 15% after 15 years’ service, 20% after 20 years’
service, 25% after 25 years’ service, etc.
33.3 Valuation method
The projected unit credit method is used in the calculations. The values of the past service liabilities and the future service liabilities are
given separately. The past service liability is the value of the accumulated liability as at the calculation date in respect of service already
rendered. The future service liability is the value of the liability from service after the calculation date until the next date the employee
is entitled to receive a bonus payment. The total liability is evenly distributed over the period since service inception until the date when
the benefit is payable.
33.4 Valuation results Past service liability The total past service liability in respect of long-service bonuses is set out as follows:
18 067 18 497 Employees with employment date before 01/01/2001 5 652 2 928 Employees with employment date after 01/01/2001
23 719 21 425 Total past service liability
The valuation results as at 30 June 2018 are based on best estimate assumptions. The valuation is very sensitive to the real return rate
assumed. For every 1% variance in the assumed rate of return, the liability varies by approximately R560 000. The results as at 30 June
2017 are based on the previous best estimates.
Annual financial statementsNOTES TO THE CONSOLIDATED FINANCIAL STATEMENTS (continued) FOR THE YEAR ENDED 30 JUNE 2018
Clover Industries Limited Integrated Report for the year ended 30 June 2018 195

GROUP COMPANY
2018 2017 2018 2017
% % % %
33.5 Past service liability build-up
The build-up of the total past service liability for the past year, using the best estimate assumptions are as follows:
7.70 7.50 a) The following discount rate per annum was used for the calculation of interest cost
6.40 6.30 b) The following salary escalation rate per annum and merit increases were used
c) For current service cost an assumption is made that there are no withdrawals during the financial year
d) For benefits paid it is assumed that all benefits were paid as estimated by Clover
R'000 R'000 R'000 R'000
The increase in the past service liability is summarised as follows:
Past services liability build-up
21 426 21 847 Opening balance
1 545 1 870 Plus: Interest cost
938 1 083 Current service cost
(6 046) (5 032) Less: Benefits paid
5 856 1 658 Actuarial loss
23 719 21 426 Closing balance
34 EVENTS AFTER THE REPORTING PERIOD
Except for the events noted below, no significant events occurred subsequent to the year-end that would require disclosure or amendment to these financial statements.
Clover made a R90 million cash injection in September 2018 in DFSA that will be capitalised once shareholder approval is obtained as required by DFSA’s Memorandum of Incorporation. This will not increase Clover’s
voting rights or shareholding and underpins Clover’s ongoing commitment to support its milk source, service fees and the sustainability of DFSA.
DFSA has in turn committed to also build up a reserve of R90 million through the reduction of milk prices paid to its producers. Clover’s capitalisation of DFSA and the build-up of the aforementioned reserve will add
stability to DFSA to navigate through future cycles. Refer to the report on governance, risk and compliances on pages 24 - 32 for further information regarding the DFSA.
Subsequent to year-end, the board has approved a final gross cash dividend of R92,9 million (2017: Rnil) or 48,68 cents (2017: nil cents) per ordinary share for the year ended 30 June 2018 which will be paid Monday,
8 October 2018.
33 LONG-SERVICE BONUS (continued)
Annual financial statementsNOTES TO THE CONSOLIDATED FINANCIAL STATEMENTS (continued) FOR THE YEAR ENDED 30 JUNE 2018
Clover Industries Limited Integrated Report for the year ended 30 June 2018196

Abbreviations
The following abbreviations are used in the financial statements
Company names Clover Botswana (Pty) Limited (incorporated in Botswana): Clover Botswana
Clover Capital (Pty) Limited: Clover Capital
Clover Fonterra Ingredients (Pty) Limited: CFI/Clover Fonterra
Clover Industries Limited: CIL
Clover Industries Limited and subsidiaries: The Group/Clover
Clover S.A. (Pty) Limited: Clover SA
Clover Swaziland (Pty) Limited (incorporated in Swaziland): Clover Swaziland
Fonterra Limited: Fonterra
The Real Beverage Company (Pty) Limited: RBC
Clover West Africa Limited: Clover West Africa
Clover Dairy (Namibia) (Pty) Limited: Clover Namibia
Clover Waters (Pty) Limited: Clover Waters
Clover MilkyWay (Pty) Limited: Clover Milkyway
Clover Futurelife (Pty) Limited: Clover Futurelife
Clover Frankies (Pty) Limited: Clover Frankies
Clover Good Hope (Pty) Limited: Clover Good Hope
Clover Pride (Pty) Limited Clover Pride
Dairy Farmers of South Africa (Pty) Limited DFSA
The following abbreviations are used in the financial statements
Other
Branded Consumer Goods: BCG
Broad-based Black Economic Empowerment: B-BBEE
Capital Gains Tax: CGT
Department of Trade and Industry: DTI
Depreciated Replacement Cost: DRC
Discounted cash flow: DCF
Essentials of Management and Leadership: EML
Further Education and Training: FET
Further Education and Training Certificate: FETC
Good Manufacturing Practices: GMP
Hazard Analysis Critical Control Points: HACCP
International Accounting Standards: IAS
International Organisation for Standardisation: ISO
International Financial Reporting Standards: IFRS
Johannesburg Stock Exchange: JSE
Margin on Material: MOM
Net asset value: NAV
Net Current Replacement Cost: NCRC
Nomination Committee: Nomco
Property, plant and equipment: PP&E
Quality Council for Trade and Occupations: QCTO
Rand Merchant Bank: RMB
Remuneration Committee: Remco
Share appreciation rights: SAR
Supplier Ethical Data Exchange: SEDEX
Clover Industries Limited Integrated Report for the year ended 30 June 2018 197
Definitions
Dividend per ordinary share
Dividend paid to ordinary shareholders is the actual dividend per
share declared and paid.
Earnings and diluted earnings per ordinary share
Earnings per ordinary share
Profit attributable to ordinary shareholders, divided by the weighted
average number of ordinary shares net of the weighted average
number of treasury shares in issue at the end of the year.
Diluted earnings per ordinary share
Profit attributable to ordinary shareholders, divided by the weighted
average number of ordinary shares, adjusted for share appreciation
rights issued, net of the weighted average number of treasury shares
at the end of the year.
Net assets
Total assets less total liabilities.
Cash flow
Cash flow from operating activities.
Cash flow per ordinary share
Cash flow divided by the weighted average number of ordinary
shares in issue at the end of the year.
Net asset turnover
Turnover divided by average net assets less average cash on hand.
Return on net assets
Operating profit as a percentage of average assets less average current
liabilities excluding current interest-bearing loans and borrowings.
Return on equity holders’ funds
Profit attributable to shareholders as a percentage of average
shareholders’ funds, before minority interest.
Gearing percentage
Interest-bearing loans and borrowings reduced by cash funds, as a
percentage of total shareholders’ interest, including minority interest.
Current ratio
Current assets divided by current liabilities.
Activities pertaining to cash flow
Operating activities
All transactions and other events that are not investing or
financing activities.
Financing activities
Activities that result in changes in the size and composition of the
capital structures of the Group. This includes both the equity and
debt not falling within the definition of cash and cash equivalents.
Investing activities
Activities relating to the acquisition, holding and disposal of
long-term assets.
Cash and cash equivalents
Cash on hand and in current bank accounts.
Restructuring cost
Restructuring cost consists of costs incurred in order to streamline
operations of the Group.
Normalised earnings
Normalised earnings consists of earnings for the period adjusted for
the after tax effect of capital profits/losses from the sale/acquisition
of property, plant and equipment or businesses, restructuring cost
and costs relating to the capital structure of the company.
Clover Industries Limited Integrated Report for the year ended 30 June 2018198

Shareholder analysis
Shareholder spreadNo of
Shareholdings % No of Shares %
1 - 1,000 shares 1 403 50.72 318 021 0.171,001 - 5,000 shares 634 22.92 1 507 557 0.795,001 - 10,000 shares 161 5.82 1 169 061 0.6110,001 - 50,000 shares 251 9.07 5 778 917 3.0350,001 - 100,000 shares 93 3.36 6 912 049 3.62100,001 shares and over 224 8.10 175 149 759 91.78
Totals 2766 100 190 835 364 100
Distribution of shareholdersNo of
Shareholdings % No of Shares %
Banks/Brokers 71 2.57 23 700 000 11.05Close Corporations 22 0.80 46 000 0.02Endowment Funds 23 0.83 172 013 0.08Individuals 2 058 74.40 42 488 608 19.80Insurance Companies 39 1.41 3 007 122 1.40Investment Companies 4 0.14 4 861 396 2.27Medical Schemes 4 0.14 494 444 0.23Milk Producers Trust 2 0.07 23 700 000 11.05Mutual Funds 113 4.09 45 564 402 21.24Other Corporations 14 0.51 443 654 0.21Private Companies 34 1.23 10 166 774 4.74Producers 66 2.39 5 700 474 2.66Public Companies 1 0.04 466 236 0.22Retirement Funds 182 6.58 37 111 760 17.30Trusts 133 4.81 16 469 337 7.68
Totals 2766 100 214 392 220 99.93
Public/non - public shareholdersNo of
Shareholdings % No of Shares %
Non - Public Shareholders 17 0.61 35416086 18.56Directors of the company 13 0.47 10521866 5.51Executives Management of the company 2 0.07 1194220 0.63Strategic Holdings (more than 10%) 2 0.07 23700000 12.42Public Shareholders 2749 99.39 178976134 81.37
Totals 2766 100 214 392 220 99.93
Beneficial shareholders holding 3% or more No of Shares %
Clover Milk Producers Trust 23 700 000 12.42Allan Gray 15 016 816 7.87Government Employees Pension Fund 11 530 526 6.04Letko Brosseau 11 058 505 5.79Vorster, JH 8 588 925 4.50HSBC 7 797 605 4.09Eskom Pension & Provident Fund 5 563 532 2.92
Totals 83 255 909 43.63
Company: Clover Industries Limited
Register date: 29 June 2018
Issued Share Capital: 190 835 364
Shareholder spreadNumber of shareholders (percentage)
1 – 1 000 shares
1 001 – 5 000 shares
5 001 – 10 000 shares
10 001 – 50 000 shares
50 001 – 100 000 shares
100 001 shares and over
Distribution of shareholdersNumber of shareholders (percentage)
Banks
Close corporations
Endowment funds
Individuals
Insurance companies
Investment companies
Medical Schemes
Milk Producers Trust
Mutual funds
Other corporations
Private companies
Producers
Public Companies
Retirement Funds
Trusts
Clover Industries Limited Integrated Report for the year ended 30 June 2018 199
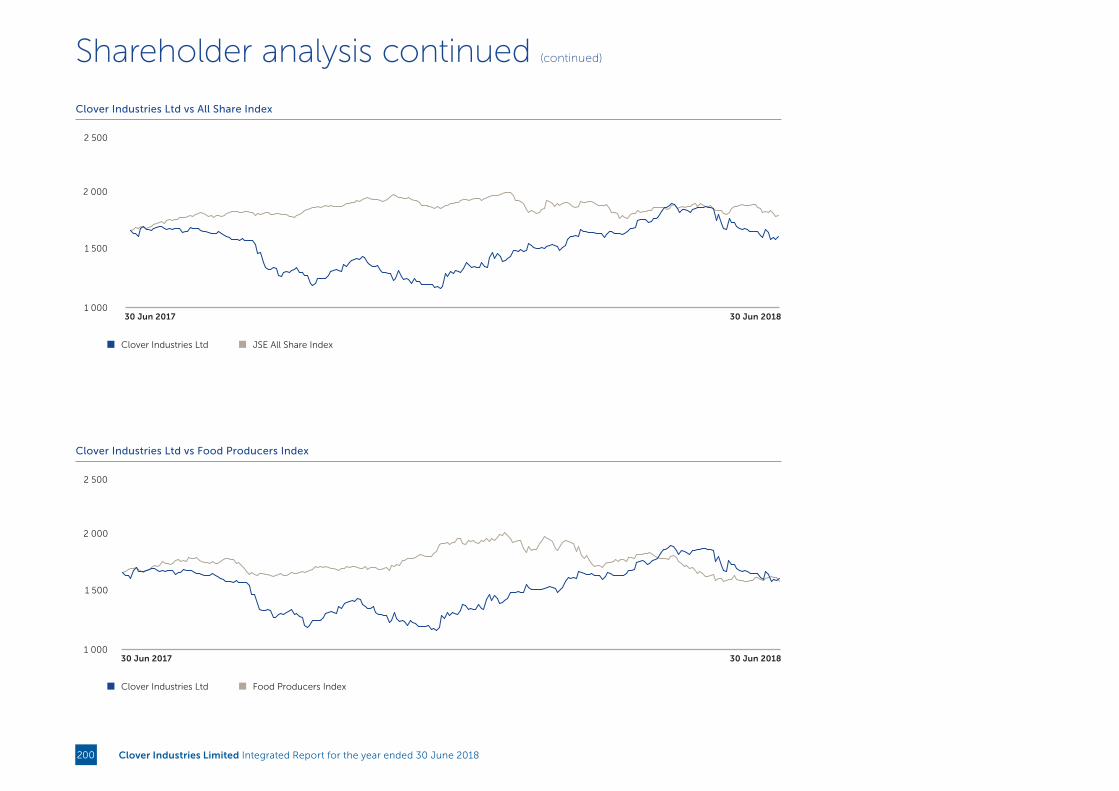
Clover Industries Ltd JSE All Share Index
30 Jun 2017 30 Jun 2018
Clover Industries Ltd vs All Share Index
1 000
1 500
2 000
2 500
Clover Industries Ltd Food Producers Index
30 Jun 2017 30 Jun 2018
Clover Industries Ltd vs Food Producers Index
1 000
1 500
2 000
2 500
Shareholder analysis continued (continued)
Clover Industries Limited Integrated Report for the year ended 30 June 2018200

ANNEXURE I TO THE RESULTS ANNOUNCEMENT FOR THE YEAR ENDED 30 JUNE 2018PRO FORMA REGARDING THE EFFECT OF THE OPERATIONAL RESTRUCTURING OF DFSA ON THE CONSOLIDATED RESULTS OF CLOVER INDUSTRIES LIMITED (“Clover”)IntroductionOn the 1st of July 2017 Clover concluded a corporate action that would have an impact on the 2018 financial year.
As communicated on the Stock Exchange News Service on 6 July 2017 and earlier, Clover has formed a wholly owned subsidiary (called Dairy Farmers of South Africa (Pty) Ltd (‘DFSA’)). Clover transferred the non-value added
dairy business and sold the related finished goods, packaging material and ingredients inventory, to DFSA with effect from 1 April 2017. In exchange for the transfer of the non-value added dairy business as aforementioned,
DFSA allotted and issued to Clover A- shares (which constituted the entire issued share capital of DFSA at the time) for a nominal amount, and a loan account for the inventory.
With effect from 1 July 2017, DFSA issued and allotted B-shares in to the milk producers for a nominal amount and accordingly, the milk producers now hold all the B shares which constitute 74% of the voting rights of DFSA.
Clover holds all the A-shares which constitute 26% of the voting rights of DFSA.
With effect from 1 July 2017 Clover relinquished its control of DFSA, assessed in terms of IFRS 10, and will for accounting purposes treat it as an investment in an associate going forward.
DFSA houses the non-value added drinking milk business and is responsible for the procurement of raw milk as well as the selling, marketing and distribution of the non-value-added drinking milk referred to above.
DFSA is currently Clover’s largest principal, where all its related requirements such as distribution, production, administration (invoicing, debt collection, marketing), IT services, payroll administration, central services, sales
and merchandising are outsourced to Clover for an initial period of 20 years. In exchange for these services, Clover will earn service income.
This Annexure to the results announcement includes the 30 June 2017 audited results which have been adjusted to reflect the loss of control of DFSA (“Pro Forma Adjustments”) as if the loss of control of DFSA had occurred
(a) on 1 July 2016 for purposes of the Pro Forma Adjustments made to the pro forma consolidated statement of comprehensive income and (b) as at 30 June 2017 for purposes of the Pro Forma Adjustments made to the pro
forma consolidated statement of financial position.
It is important to note that in the 2017 pro forma financial information of the Group, released on SENS on 12 September 2017 as an annexure to the financial results for the year ended 30 June 2017 (“2017 Pro Forma Financial
Information”), it was anticipated that Clover would procure packaging material from third party suppliers and on-sell the packaging material to DFSA at no margin. The 2017 pro forma financial information was compiled as if
Clover acted as the principal. Post the implementation of the unbundling on 1 July 2017, the legal agreement was clarified to infer that Clover is acting as an agent for packaging material procured on behalf of DFSA. In terms
of this clarification the Revenue and Cost of Sales pertaining to the procurement of the packaging material does not form part of the 2018 audited results of the Group. Accordingly, the directors are of the view that the Pro
Forma adjustment (refer note 4) as disclosed in the 2017 Pro Forma Financial Information needs to be amended by excluding the sale of packaging material procured and sold to DFSA in order to do a like for like comparison.
The pro forma financial information, as presented in the 2018 Group Results, have been prepared for illustrative purposes only, to provide information about how the Pro Forma Adjustments might have affected the financial
information presented by Clover had the unbundling of DFSA occurred on 1 July 2016 for statement of comprehensive income purposes and as at 30 June 2017 for statement of financial position purposes. Because of its pro
forma nature, the pro forma financial information may not fairly present Clover’s financial position, changes in equity, results of operation or cash flows. It does not purport to be indicative of what the financial results would
have been, had the loss of control of DFSA been implemented on a different date.
The Clover directors are responsible for the preparation of the pro forma financial information. The pro forma financial information has been prepared using accounting policies that are consistent with IFRS and with the basis
on which the historical financial information has been prepared in terms of the accounting policies of Clover. The pro forma financial information has been prepared in accordance with the JSE Listings Requirements and the
revised Guide on Pro Forma Financial Information issued by the South African Institute of Chartered Accountants.
These pro forma financial effects have been prepared to assist Clover’s shareholders in assessing the impact of the loss of control of DFSA on the Clover consolidated statement of comprehensive income and statement of
financial position.
This pro forma financial information has been reported on by the independent external auditors, Ernst & Young Inc., in terms of International Standards on Assurance Engagements (ISAE) 3420, Assurance Engagements to
Report on the Compilation of Pro forma Financial Information Included in a Prospectus. Their unmodified limited assurance report dated 11 September 2017 is available for inspection at the Company's registered office.
Clover Industries Limited Integrated Report for the year ended 30 June 2018 201
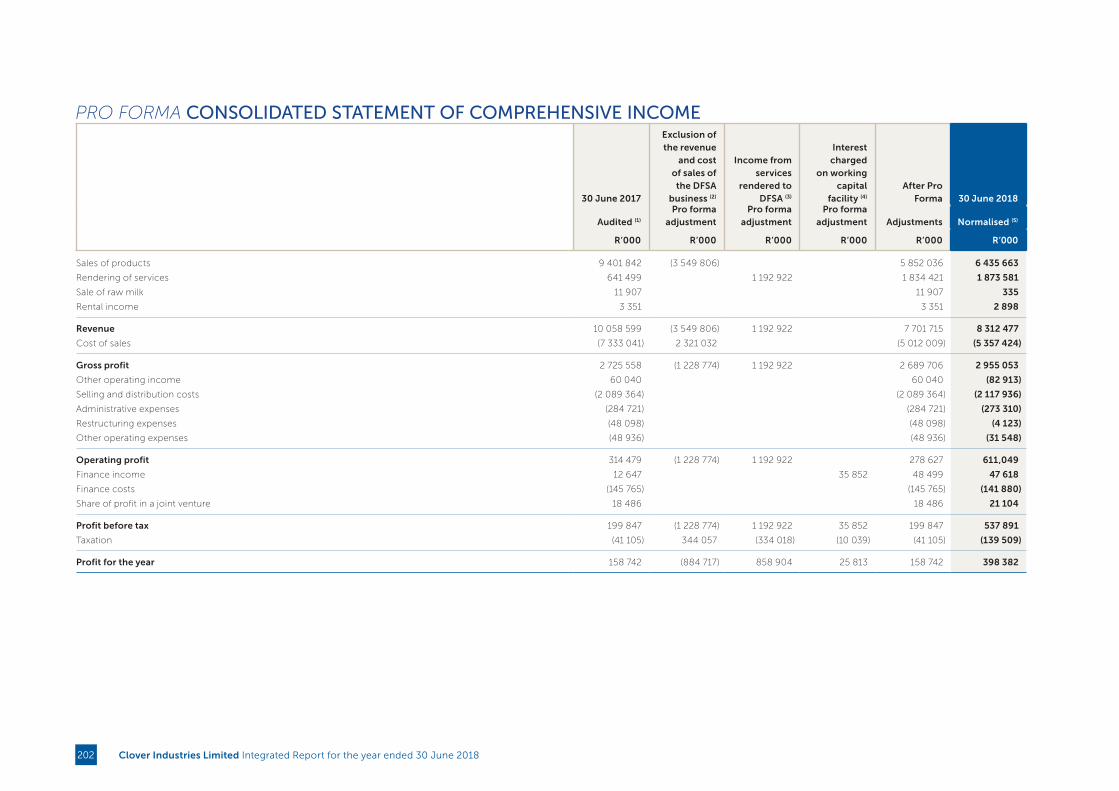
PRO FORMA CONSOLIDATED STATEMENT OF COMPREHENSIVE INCOME
30 June 2017
Exclusion of the revenue
and cost of sales of the DFSA
business (2)
Income from services
rendered to DFSA (3)
Interest charged
on working capital
facility (4)
After Pro Forma 30 June 2018
Audited (1)
Pro forma adjustment
Pro forma adjustment
Pro forma adjustment Adjustments Normalised (5)
R’000 R’000 R’000 R’000 R’000 R’000
Sales of products 9 401 842 (3 549 806) 5 852 036 6 435 663
Rendering of services 641 499 1 192 922 1 834 421 1 873 581
Sale of raw milk 11 907 11 907 335
Rental income 3 351 3 351 2 898
Revenue 10 058 599 (3 549 806) 1 192 922 7 701 715 8 312 477
Cost of sales (7 333 041) 2 321 032 (5 012 009) (5 357 424)
Gross profit 2 725 558 (1 228 774) 1 192 922 2 689 706 2 955 053
Other operating income 60 040 60 040 (82 913)
Selling and distribution costs (2 089 364) (2 089 364) (2 117 936)
Administrative expenses (284 721) (284 721) (273 310)
Restructuring expenses (48 098) (48 098) (4 123)
Other operating expenses (48 936) (48 936) (31 548)
Operating profit 314 479 (1 228 774) 1 192 922 278 627 611,049
Finance income 12 647 35 852 48 499 47 618
Finance costs (145 765) (145 765) (141 880)
Share of profit in a joint venture 18 486 18 486 21 104
Profit before tax 199 847 (1 228 774) 1 192 922 35 852 199 847 537 891
Taxation (41 105) 344 057 (334 018) (10 039) (41 105) (139 509)
Profit for the year 158 742 (884 717) 858 904 25 813 158 742 398 382
Clover Industries Limited Integrated Report for the year ended 30 June 2018202
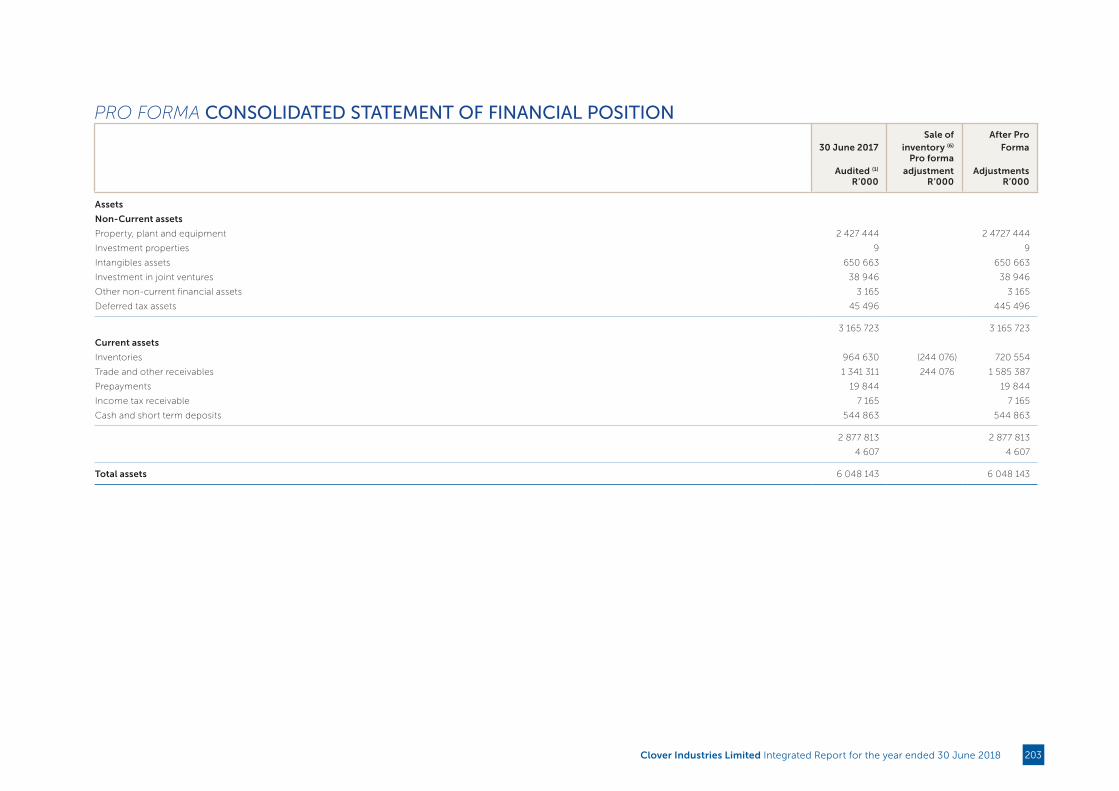
PRO FORMA CONSOLIDATED STATEMENT OF FINANCIAL POSITION
30 June 2017Sale of
inventory (6)
After Pro Forma
Audited (1)
Pro forma adjustment Adjustments
R’000 R’000 R’000
Assets
Non-Current assets
Property, plant and equipment 2 427 444 2 4727 444
Investment properties 9 9
Intangibles assets 650 663 650 663
Investment in joint ventures 38 946 38 946
Other non-current financial assets 3 165 3 165
Deferred tax assets 45 496 445 496
3 165 723 3 165 723
Current assets
Inventories 964 630 (244 076) 720 554
Trade and other receivables 1 341 311 244 076 1 585 387
Prepayments 19 844 19 844
Income tax receivable 7 165 7 165
Cash and short term deposits 544 863 544 863
2 877 813 2 877 813
4 607 4 607
Total assets 6 048 143 6 048 143
Clover Industries Limited Integrated Report for the year ended 30 June 2018 203
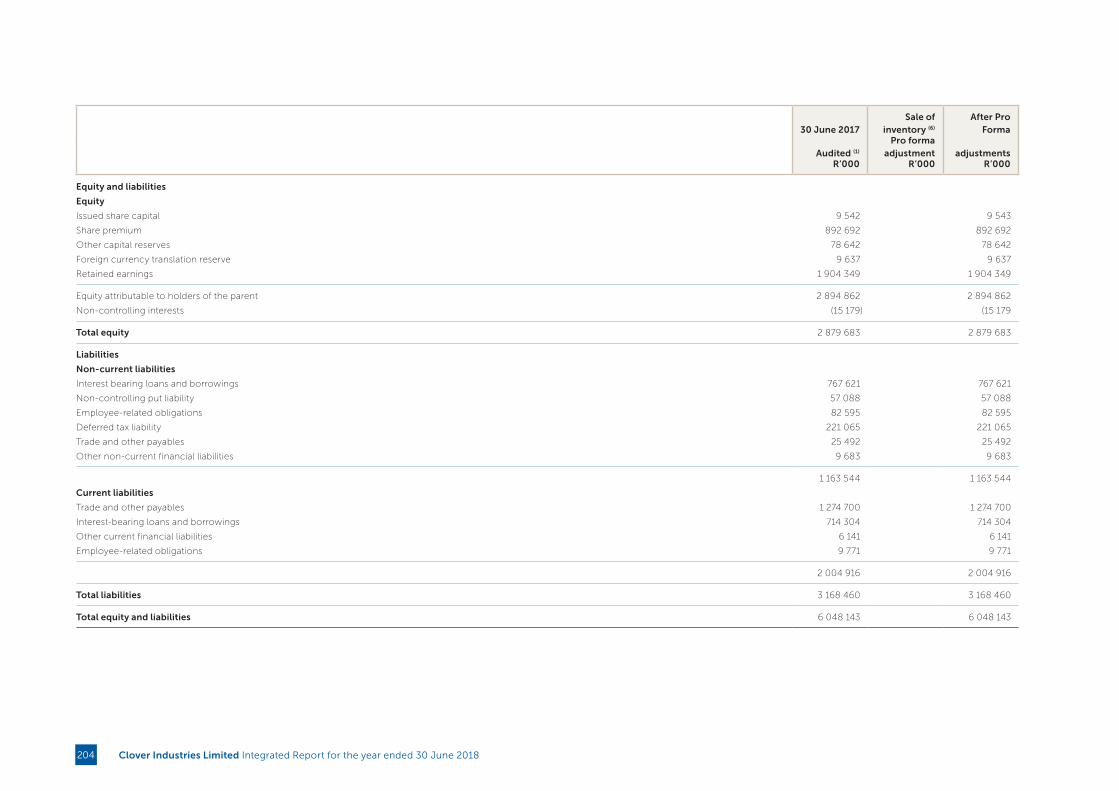
30 June 2017Sale of
inventory (6)
After Pro Forma
Audited (1)
Pro forma adjustment adjustments
R’000 R’000 R’000
Equity and liabilities
Equity
Issued share capital 9 542 9 543
Share premium 892 692 892 692
Other capital reserves 78 642 78 642
Foreign currency translation reserve 9 637 9 637
Retained earnings 1 904 349 1 904 349
Equity attributable to holders of the parent 2 894 862 2 894 862
Non-controlling interests (15 179) (15 179
Total equity 2 879 683 2 879 683
Liabilities
Non-current liabilities
Interest bearing loans and borrowings 767 621 767 621
Non-controlling put liability 57 088 57 088
Employee-related obligations 82 595 82 595
Deferred tax liability 221 065 221 065
Trade and other payables 25 492 25 492
Other non-current financial liabilities 9 683 9 683
1 163 544 1 163 544
Current liabilities
Trade and other payables 1 274 700 1 274 700
Interest-bearing loans and borrowings 714 304 714 304
Other current financial liabilities 6 141 6 141
Employee-related obligations 9 771 9 771
2 004 916 2 004 916
Total liabilities 3 168 460 3 168 460
Total equity and liabilities 6 048 143 6 048 143
Clover Industries Limited Integrated Report for the year ended 30 June 2018204
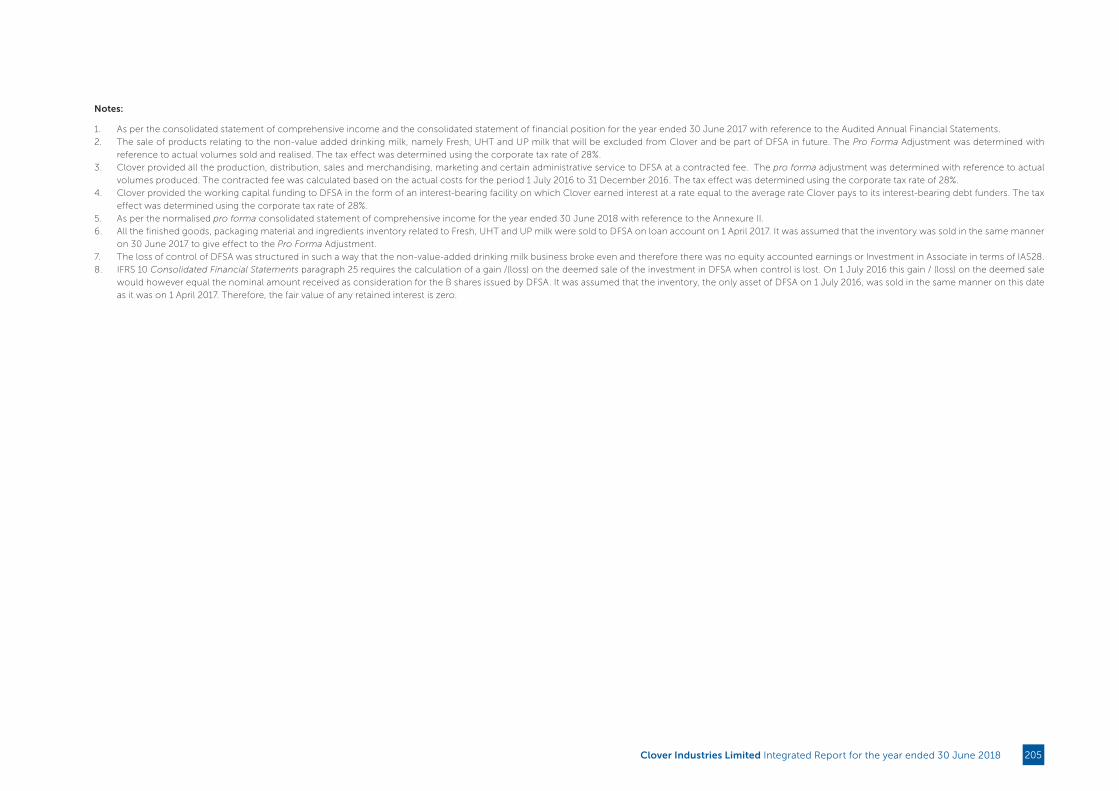
Notes:
1. As per the consolidated statement of comprehensive income and the consolidated statement of financial position for the year ended 30 June 2017 with reference to the Audited Annual Financial Statements.
2. The sale of products relating to the non-value added drinking milk, namely Fresh, UHT and UP milk that will be excluded from Clover and be part of DFSA in future. The Pro Forma Adjustment was determined with
reference to actual volumes sold and realised. The tax effect was determined using the corporate tax rate of 28%.
3. Clover provided all the production, distribution, sales and merchandising, marketing and certain administrative service to DFSA at a contracted fee. The pro forma adjustment was determined with reference to actual
volumes produced. The contracted fee was calculated based on the actual costs for the period 1 July 2016 to 31 December 2016. The tax effect was determined using the corporate tax rate of 28%.
4. Clover provided the working capital funding to DFSA in the form of an interest-bearing facility on which Clover earned interest at a rate equal to the average rate Clover pays to its interest-bearing debt funders. The tax
effect was determined using the corporate tax rate of 28%.
5. As per the normalised pro forma consolidated statement of comprehensive income for the year ended 30 June 2018 with reference to the Annexure II.
6. All the finished goods, packaging material and ingredients inventory related to Fresh, UHT and UP milk were sold to DFSA on loan account on 1 April 2017. It was assumed that the inventory was sold in the same manner
on 30 June 2017 to give effect to the Pro Forma Adjustment.
7. The loss of control of DFSA was structured in such a way that the non-value-added drinking milk business broke even and therefore there was no equity accounted earnings or Investment in Associate in terms of IAS28.
8. IFRS 10 Consolidated Financial Statements paragraph 25 requires the calculation of a gain /(loss) on the deemed sale of the investment in DFSA when control is lost. On 1 July 2016 this gain / (loss) on the deemed sale
would however equal the nominal amount received as consideration for the B shares issued by DFSA. It was assumed that the inventory, the only asset of DFSA on 1 July 2016, was sold in the same manner on this date
as it was on 1 April 2017. Therefore, the fair value of any retained interest is zero.
Clover Industries Limited Integrated Report for the year ended 30 June 2018 205

ANNEXURE II TO THE RESULTS ANNOUNCEMENT FOR THE YEAR ENDED 30 JUNE 2018PRO FORMA REGARDING THE EFFECT OF THE IMPAIRMENT ON THE RCF TO DFSA ON THE CONSOLIDATED RESULTS OF CLOVER INDUSTRIES LIMITED (“Clover”)
Background
The board of Clover Industries Limited (“Clover” or “the Group”) received unforeseen notice of the resignation of the DFSA CEO on 11 September 2018. His decision to resign is understood to be as result of the enormous
conflict between losing milk producers or losing market share during what has been a very challenging time for the dairy industry generally.
The Chairman of DFSA also took the decision to resign and to give the opportunity to the producer shareholders to appoint their own independent chairman and CEO to take DFSA forward. The DFSA board will begin the
process to identify replacements and the current CEO will stay on until 30 April 2019 to assist with identifying a suitable replacement and to ensure a seamless handover.
Whilst the Clover board had received no indications of the resignations at the time it published its trading statement on 07 August 2018, following the resignation of the DFSA Chairman and CEO, it believed it prudent to adopt
a conservative approach and provide for the full impairment of the R439 million revolving credit facility it extended to DFSA as at year-end.
This Annexure (“Annexure II”) to the results announcement includes the 30 June 2018 audited results which have been adjusted to reflect the reversal of the impairment (a) on 30 June 2018 for purposes of the pro forma
adjustments made to the pro forma consolidated statement of comprehensive income and (b) as at 30 June 2018 for purposes of the pro forma adjustments made to the pro forma consolidated statement of financial position.
The pro forma financial information, as presented in the 2018 Group results, have been prepared for illustrative purposes only, to provide information on how the normalised earnings and headline earnings have been
calculated had no impairment taken place.
Because of its nature, the pro forma financial information may not be a fair reflection of the Group’s results of operations, financial position, changes in equity or cash flows. No other adjustments have been made to the pro
forma financial information.
The Clover directors are responsible for the preparation of the pro forma financial information. The pro forma financial information has been prepared using accounting policies that are consistent with IFRS and with the basis
on which the historical financial information has been prepared in terms of the accounting policies of Clover. The pro forma financial information has been prepared in accordance with the JSE Listings Requirements and the
revised Guide on Pro Forma Financial Information issued by the South African Institute of Chartered Accountants.
This pro forma financial information was reported on by the independent external auditors, Ernst & Young Inc., in terms of International Standards on Assurance Engagements (ISAE) 3420, Assurance Engagements to Report
on the Compilation of Pro forma Financial Information Included in a Prospectus. Their unmodified limited assurance report is available for inspection at the Company’s registered office.
These latest developments should not deter from the exceptional performance delivered by Clover as highlighted in the normalised results discussed earlier in this report.
Clover Industries Limited Integrated Report for the year ended 30 June 2018206

PRO FORMA CONSOLIDATED STATEMENT OF COMPREHENSIVE INCOME30 June 2018 Reversal of impairment After Pro Forma 30 June 2017
Audited (1) Pro forma adjustment (2) Normalised Adjusted (3)
R’000 R’000 R’000 R’000
Sales of products 6 435 663 6 435 663 5 852 036
Rendering of services 1 873 581 1 873 581 1 834 421
Sale of raw milk 335 335 11 907
Rental income 2 898 2 898 3 351
Revenue 8 312 477 8 312 477 7 701 715
Cost of sales (5 357 424) (5 357 424) (5 012 009)
Gross profit 2 955 053 2 955 053 2 689 706
Other operating income 82 913 82 913 60 040
Selling and distribution costs (2 117 936) (2 117 936) (2 089 364)
Administrative expenses (273 310) (273 310) (284 721)
Restructuring expenses (4 123) (4 123) (48 098)
Other operating expenses (31 548) (31 548) (48 936)
Operating profit 611 049 611 049 278 627
Impairment of revolving credit facility to DFSA (439 042) 439 042 – –
Finance income 47 618 47 618 48 499
Finance costs (141 880) (141 880) (145 765)
Share of profit in a joint venture 21 104 21 104 18 486
Profit before tax 98 849 439 042 537 891 199 847
Taxation (139 509) (139 509) (41 105)
(Loss)/Profit for the year (40 660) 439 042 398 382 158 742
Profit for the year attributable to equity holders of the parent company (38 021) 439 042 401 021 158 258
Headline earnings attributable to shareholders of the parent company (44 180) 439 042 394 854 121 617
Earnings per share attributable to ordinary equity holders of the parent
(Loss)/Earnings per share (cents) (19,9) 230,0 210,1 83,1
Diluted (loss)/earnings per share (cents) (19,7) 227,8 208,1 82,3
Headline (loss)/earnings per share (cents) (23,1) 230,0 206,9 63,9
Diluted headline (loss)/earnings per share (cents) (22,9) 227,8 204,9 63,2
Clover Industries Limited Integrated Report for the year ended 30 June 2018 207
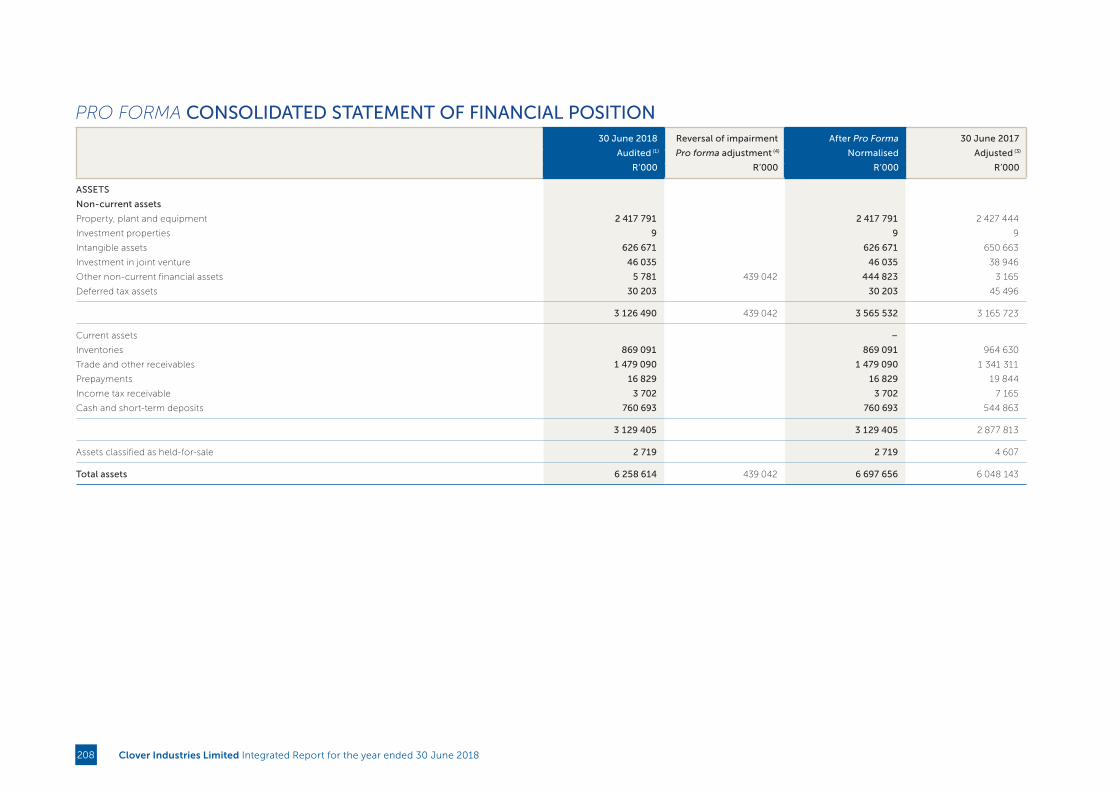
PRO FORMA CONSOLIDATED STATEMENT OF FINANCIAL POSITION30 June 2018 Reversal of impairment After Pro Forma 30 June 2017
Audited (1) Pro forma adjustment (4) Normalised Adjusted (3)
R’000 R’000 R’000 R’000
ASSETS
Non-current assets
Property, plant and equipment 2 417 791 2 417 791 2 427 444
Investment properties 9 9 9
Intangible assets 626 671 626 671 650 663
Investment in joint venture 46 035 46 035 38 946
Other non-current financial assets 5 781 439 042 444 823 3 165
Deferred tax assets 30 203 30 203 45 496
3 126 490 439 042 3 565 532 3 165 723
Current assets –
Inventories 869 091 869 091 964 630
Trade and other receivables 1 479 090 1 479 090 1 341 311
Prepayments 16 829 16 829 19 844
Income tax receivable 3 702 3 702 7 165
Cash and short-term deposits 760 693 760 693 544 863
3 129 405 3 129 405 2 877 813
Assets classified as held-for-sale 2 719 2 719 4 607
Total assets 6 258 614 439 042 6 697 656 6 048 143
Clover Industries Limited Integrated Report for the year ended 30 June 2018208
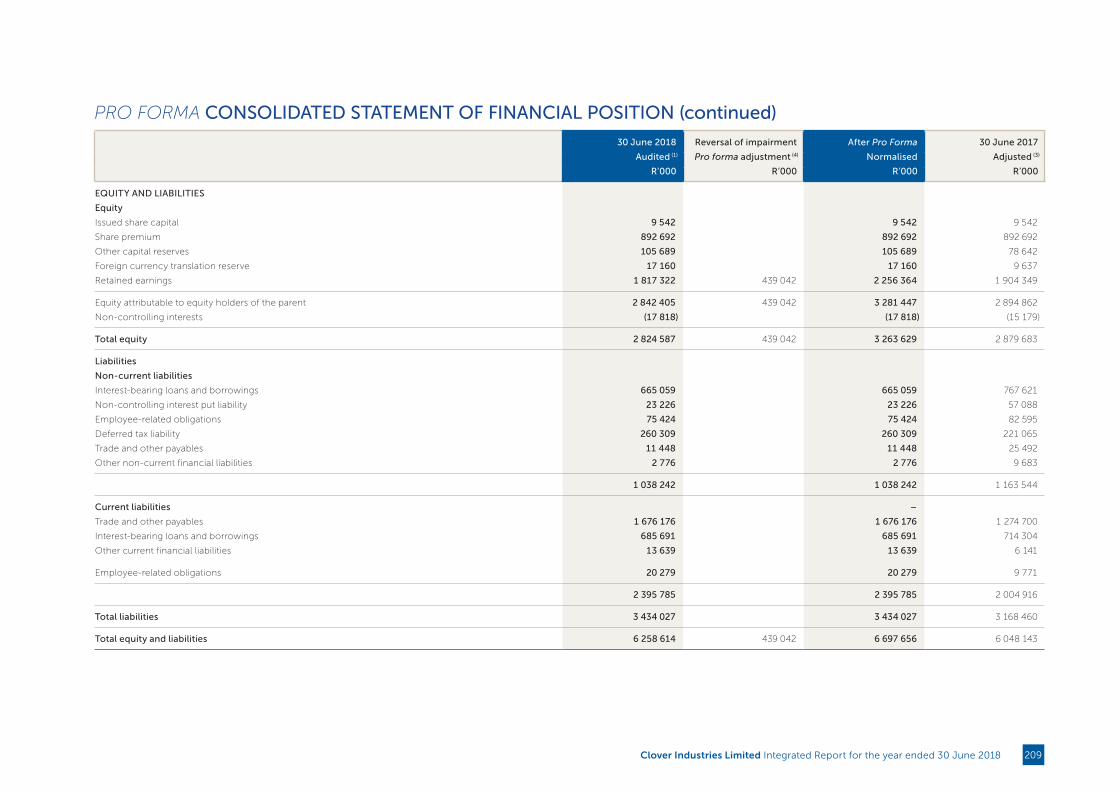
PRO FORMA CONSOLIDATED STATEMENT OF FINANCIAL POSITION (continued)
30 June 2018 Reversal of impairment After Pro Forma 30 June 2017
Audited (1) Pro forma adjustment (4) Normalised Adjusted (3)
R’000 R’000 R’000 R’000
EQUITY AND LIABILITIES
Equity
Issued share capital 9 542 9 542 9 542
Share premium 892 692 892 692 892 692
Other capital reserves 105 689 105 689 78 642
Foreign currency translation reserve 17 160 17 160 9 637
Retained earnings 1 817 322 439 042 2 256 364 1 904 349
Equity attributable to equity holders of the parent 2 842 405 439 042 3 281 447 2 894 862
Non-controlling interests (17 818) (17 818) (15 179)
Total equity 2 824 587 439 042 3 263 629 2 879 683
Liabilities
Non-current liabilities
Interest-bearing loans and borrowings 665 059 665 059 767 621
Non-controlling interest put liability 23 226 23 226 57 088
Employee-related obligations 75 424 75 424 82 595
Deferred tax liability 260 309 260 309 221 065
Trade and other payables 11 448 11 448 25 492
Other non-current financial liabilities 2 776 2 776 9 683
1 038 242 1 038 242 1 163 544
Current liabilities –
Trade and other payables 1 676 176 1 676 176 1 274 700
Interest-bearing loans and borrowings 685 691 685 691 714 304
Other current financial liabilities 13 639 13 639 6 141
Employee-related obligations 20 279 20 279 9 771
2 395 785 2 395 785 2 004 916
Total liabilities 3 434 027 3 434 027 3 168 460
Total equity and liabilities 6 258 614 439 042 6 697 656 6 048 143
Clover Industries Limited Integrated Report for the year ended 30 June 2018 209

Notes
1 As per the consolidated statement of comprehensive income and the consolidated statement of financial position for the year ended 30 June 2018 with reference to the audited annual financial statements.
2 The pro forma was determined with reference to the impairment of the entire revolving credit facility advanced to DFSA as at 30 June 2018. There is no tax effect due to this adjustment. The adjustment is not excluded for
purposes of determining headline earnings.
3 As per the pro forma consolidated statement of comprehensive income and the pro forma consolidated statement of financial position for the year ended 30 June 2017 with reference to Annexure I.
4 The pro forma was determined with reference to the impairment of the entire revolving credit facility advanced to DFSA as at 30 June 2018. The facility is designated as a financial asset at amortised cost. The carrying value
of the revolving credit facility approximates the fair value due to the rolling nature of the facility and interest being charged.
Clover Industries Limited Integrated Report for the year ended 30 June 2018210
Notes
Clover Industries Limited Integrated Report for the year ended 30 June 2018 211

Notes
Clover Industries Limited Integrated Report for the year ended 30 June 2018212
Clover Industries Limited Integrated Report for the year ended 30 June 2018 213

www.clover.co.za