Embed Size (px)
Citation preview

Procedia Computer Science 68 ( 2015 ) 78 – 88
1877-0509 © 2015 Published by Elsevier B.V. This is an open access article under the CC BY-NC-ND license (http://creativecommons.org/licenses/by-nc-nd/4.0/).Peer-review under responsibility of Institute of Communication and Computer Systems.doi: 10.1016/j.procs.2015.09.225
ScienceDirectAvailable online at www.sciencedirect.com
HOLACONF - Cloud Forward: From Distributed to Complete Computing
CloudStore - towards scalability benchmarking in Cloud computing
Richard Sandersa*, Gunnar Brataasa, Mariano Cecowskib, Kjetil Hasluma, Simon Ivanšekb, Jure Polutnikb, Brynjar Vikena
aSINTEF, Strindvegen 4, 7043 Trondheim, Norway bXLAB, Pot za Brdom 100, 1000 Ljubljana, Slovenia
Abstract
This paper describes CloudStore, an open source application that lends itself to analyzing key characteristics of Cloud computing platforms. Based on an earlier standard from transaction processing, it represents a simplified version of a typical e-commerce application – an electronic book store. We detail how a deployment on a popular public cloud offering can be instrumented to gain insight into system characteristics such as capacity, scalability, elasticity and efficiency. © 2015 The Authors. Published by Elsevier B.V. Peer-review under responsibility of Institute of Communication and Computer Systems.
Keywords: Cloud computing, Measurements, Scalability, Performance, Capacity, Elasticity, Efficiency, Amazon Web Services, AMS, TCP-W
1. Introduction
Cloud Computing has and is gaining traction in the ICT industry since the turn of the millennium1. Hybrid, private and public clouds promise a number of benefits for enterprises. However, there does not seem to be a range of standardized applications which can be used to compare the performance of different cloud deployments. In particular, there is a lack of standard open sourced applications to express and compare metrics.
To this end the CloudScale project2 has developed an application we call CloudStore3. CloudStore is a free and open implementation of a typical web application, with some inherent scalability and performance issues related to the relational database. The goal of CloudStore is to serve as a relevant and standardized baseline to measure and compare different cloud providers, architectures and deployment in terms of capacity, scalability, elasticity and
* Corresponding author. Tel.: +47 930 58 954; fax: +47 73594302.
E-mail address: [email protected]
© 2015 Published by Elsevier B.V. This is an open access article under the CC BY-NC-ND license (http://creativecommons.org/licenses/by-nc-nd/4.0/).Peer-review under responsibility of Institute of Communication and Computer Systems.
79 Richard Sanders et al. / Procedia Computer Science 68 ( 2015 ) 78 – 88
efficiency. CloudStore embodies functionality for an online book store, and is based on the transactional web e-Commerce benchmark (TPC-W), a web server and database performance benchmark originally proposed by the Transaction Processing Performance Council4. Although now obsolete, TCP-W has functional and non-functional characteristics that can be used to achieve our aims.
CloudStore and the measurements methodology helps answer questions such as “which architecture makes more efficient use of our resources?”, “which cloud provider is cheaper for an expected usage fluctuation?”, “which implementation/deployment is more scalable within our expected range?”
Although our motivation for creating CloudStore was the need for an open application to demonstrate the scalability tools of the CloudScale project2, CloudStore can equally well be used for comparing (benchmarking) different cloud and platform providers (Amazon, Google, Microsoft, and private clouds). Benchmarking is generally costly. A standardized service like CloudStore may reduce such costs.
2. CloudStore – a generic e-commerce application for Cloud computing
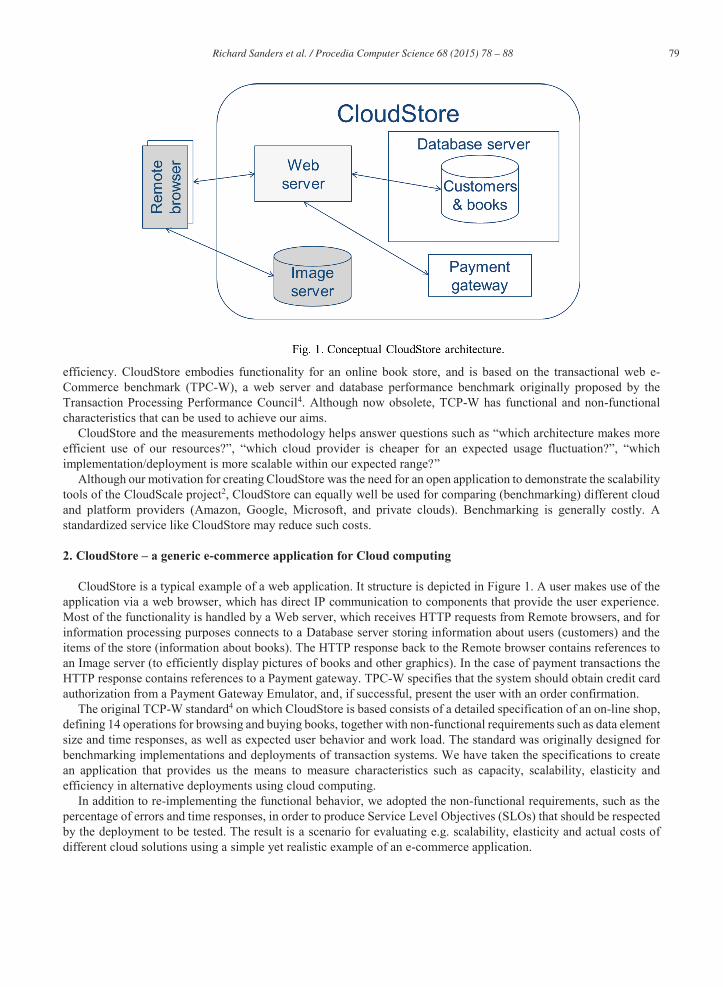
CloudStore is a typical example of a web application. It structure is depicted in Figure 1. A user makes use of the application via a web browser, which has direct IP communication to components that provide the user experience. Most of the functionality is handled by a Web server, which receives HTTP requests from Remote browsers, and for information processing purposes connects to a Database server storing information about users (customers) and the items of the store (information about books). The HTTP response back to the Remote browser contains references to an Image server (to efficiently display pictures of books and other graphics). In the case of payment transactions the HTTP response contains references to a Payment gateway. TPC-W specifies that the system should obtain credit card authorization from a Payment Gateway Emulator, and, if successful, present the user with an order confirmation.
The original TCP-W standard4 on which CloudStore is based consists of a detailed specification of an on-line shop, defining 14 operations for browsing and buying books, together with non-functional requirements such as data element size and time responses, as well as expected user behavior and work load. The standard was originally designed for benchmarking implementations and deployments of transaction systems. We have taken the specifications to create an application that provides us the means to measure characteristics such as capacity, scalability, elasticity and efficiency in alternative deployments using cloud computing.
In addition to re-implementing the functional behavior, we adopted the non-functional requirements, such as the percentage of errors and time responses, in order to produce Service Level Objectives (SLOs) that should be respected by the deployment to be tested. The result is a scenario for evaluating e.g. scalability, elasticity and actual costs of different cloud solutions using a simple yet realistic example of an e-commerce application.

80 Richard Sanders et al. / Procedia Computer Science 68 ( 2015 ) 78 – 88
TPC-W defines three different Usage Profiles: a shopping mix, browsing mix and ordering mix. For each usage profile a different probability rate is defined for each of the 14 operations. As we shall see in the next chapter, the Usage Profiles can be exploited during the generation of synthetic user traffic used to analyze a deployment.
3. CloudStore deployed on Amazon Web Services
To exemplify how CloudStore can be used, we show how we have deployed and instrumented it using a public cloud provider, in this case the widely popular Amazon Web Services (AWS)5. Embarking on this, we made some design choices, both regarding how the functional components were deployed, how to generate synthetic user traffic and how to measure key characteristics such as resource utilization, response times (including violations) and cost.
3.1. The deployment architecture
Figure 2 shows one deployment of CloudStore with the load generator (Distributed JMeter), the functional components of CloudStore (Web server, Database server, Image server and Payment gateway) and their deployment on the Amazon cloud computing platform. The following is a brief account of the deployment and what it entails.
The workload generator Distributed JMeter6 is used to create the synthetic user load on the CloudStore application server. Distributed JMeter is run in a Linux environment in Amazon Elastic Compute Cloud (EC2) in AWS. It sends HTTP requests to the Elastic Load Balancer. Emulating the remote browsers, JMeter also makes the HTTP requests for images from the Image server. JMeter logs data for all HTTP requests and responses, enabling the measurement of system behavior characteristics such as violations of service level agreements (SLO Violations), i.e. how many requests time out or fail.
The Elastic load balancer is a part of AWS, and is used to automatically distribute incoming application traffic across multiple EC2 instances.
The CloudStore Web server is deployed on one or several EC2 instances running the Linux operating system, and consists of two components: 1. A Web proxy based on the open source proxy server Nginx8. The web proxy forwards HTTP requests to the
CloudStore application. 2. The CloudStore application, which is implemented as a Model-View-Controller (MVC) pattern web
application using the open source java application framework called Spring Framework9. The CloudStore application communicates with the Database server via Hibernate ORM10, using the JDBC driver. It also
81 Richard Sanders et al. / Procedia Computer Science 68 ( 2015 ) 78 – 88
makes the HTTP requests for payment via the Payment gateway. The application was modified to be able to handle a multi-instance database, in order to make use of an Amazon database cluster.
Note that EC2 can be set to enable Auto Scaling, implying that AWS will automatically select a suitable number of instances of the specified instance type and size. Depending on the purpose of a measurement, Auto Scaling is intentionally enabled or disabled. This in particular applies to the EC2 instances where the CloudScale application is deployed.
The Database server is realized by Amazon Relational Database Services (RDS) running a MySQL cluster in EC2. Based on the selected RDS instance type and size, the RDS database server can be configured to have one master and several replicas.
The Image server is realized using Amazon CloudFront and the S3 service in AWS. For the Payment gateway a simple response time generator is introduced instead of an actual interface to a real
external payment service. In order to mimic a real service that is independent from our system, the synthetic code introduces a response delay with a defined statistical distribution. In order to have the response time generator on a completely independent external platform, it was deployed on the PaaS Heroku11. In order to effectively act as an external service, as it is deployed in a different AWS region.
3.2. Generating load with JMeter
In order to test different deployments we prepared JMeter7 scenario scripts adhering to the TPC-W specifications4. By developing a distributed version of the workload generator JMeter (Distributed JMeter6), we have made it possible to create more traffic than what is possible with a single JMeter instance, which would otherwise impose a limitation of around 2000 simultaneous virtual clients (users).
In order to measure metrics related to the scalability and elasticity of a specific implementation/deployment, we need to define load variations. To that end, we created well-defined Usage Profiles that we call Usage Evolutions, from which JMeter scripts for load generation can be created and used in different systems to be able to compare them systematically and reproducibly.
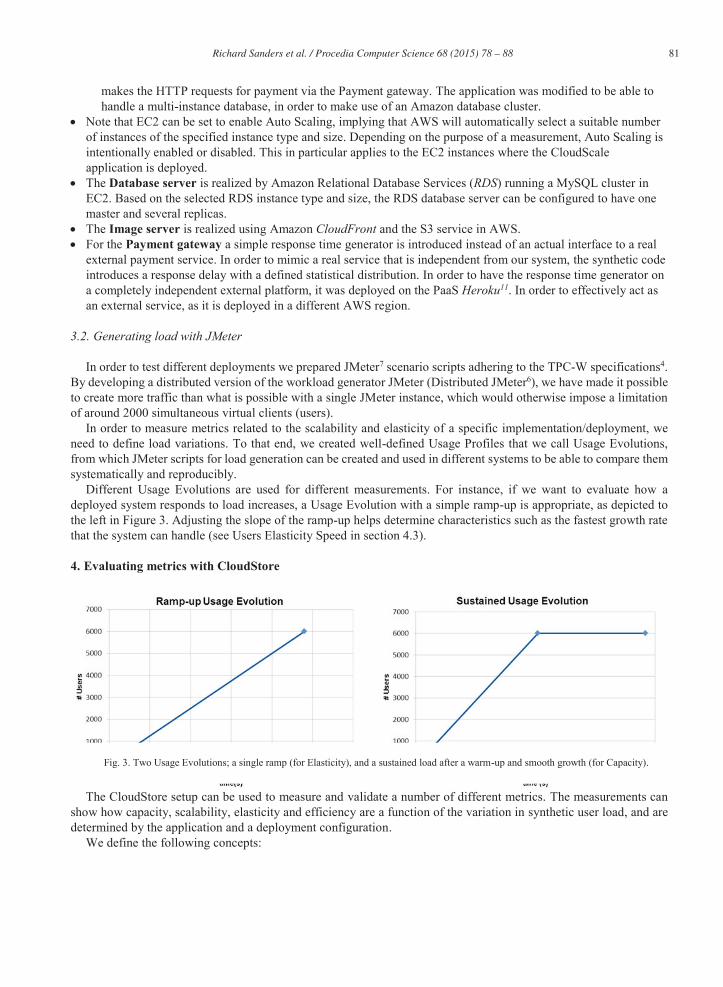
Different Usage Evolutions are used for different measurements. For instance, if we want to evaluate how a deployed system responds to load increases, a Usage Evolution with a simple ramp-up is appropriate, as depicted to the left in Figure 3. Adjusting the slope of the ramp-up helps determine characteristics such as the fastest growth rate that the system can handle (see Users Elasticity Speed in section 4.3).
4. Evaluating metrics with CloudStore
The CloudStore setup can be used to measure and validate a number of different metrics. The measurements can show how capacity, scalability, elasticity and efficiency are a function of the variation in synthetic user load, and are determined by the application and a deployment configuration.
We define the following concepts:
Fig. 3. Two Usage Evolutions; a single ramp (for Elasticity), and a sustained load after a warm-up and smooth growth (for Capacity).

82 Richard Sanders et al. / Procedia Computer Science 68 ( 2015 ) 78 – 88
Virtual User is an abstract entity that represents a user in real life. Usage Profiles: define the succession of actions that a user is expected to perform; a short interaction story with
different calls and waiting times between them (TCP-W4 defines different Usage Profiles for Browsing, Ordering and Shopping).
Usage Evolution is a function over time of the load that the system is expected to handle, defined as number of virtual users over time, or their arrival rate over time. The usage profile is designed to represent the kind of load that reflects the real-life situation one wishes to evaluate.
Minimum Deployment is the smallest (cheapest) possible deployment which is powerful enough to run the application (regardless of its capacity). For CloudStore running on AWS it consists of one instance of the virtual machine type t2.small EC2 for the Web server and one instance of type db.t2.small for the Database server. However, note that we have used the type db.m3.large for the database server in the example measurements in this article, as db.t2.small only supports a very small number of users. We disregard the Payment gateway, since this is a dummy service.
SLO Violations: TPC-W4 defines the share of requests that are allowed to fail or time-out (i.e. exceed response time requirements); observing a higher rate constitutes a breach (violation) of the Service Level Objectives (SLOs). Time limits are defined for each of the 14 operations, e.g. 3 seconds for the operation "Buy Request". At least 90% of all response times for each operation must be under the value specified for the operations. When we in the following say the SLOs are violated, we mean that the violation rate has exceeded the threshold for one of more of the operations.
Below we provide examples of metrics along with examples of what measurements should be taken in each case.
4.1. Capacity Metrics
Capacity metrics are typically a scalar that represents the amount of work a system can respond to sustainably without resulting in SLO Violations.
Capacity (#U): The number of simultaneous virtual users that a fixed amount of Cloud resources can handle without SLO Violations, given a Usage Profile. Example from Table 1: The three last measurements show a Capacity of 6471 users with a Browsing usage profile.
Arrival Rate Capacity (#U/s): the maximum rate of users' arrivals for which a non-elastic system can cope without SLO Violations, for a given usage profile. Example: “3 new Shopping users per second”.
With the CloudStore deployed in AWS we can measure the number of virtual users that the system can handle by making several runs with different sustained Usage Evolutions, in order to find the highest number for which the system does not violate the SLOs. This highest number is the Capacity.

83 Richard Sanders et al. / Procedia Computer Science 68 ( 2015 ) 78 – 88
Table 1. Cost and capacities of different configurations
Web proxy and CloudStore application server Database server Capacity Cost/h #EC2
instances EC2 Size CPU use (%) # RDS size # RDS Database use (%)
1 t2.small 100 db.m3.large 1 17 1250 0.21 €
2 t2.small 100 db.m3.large 1 37 3529 0.24 € 3 t2.small 100 db.m3.large 1 55 5625 0.26 € 4 t2.small 100 db.m3.large 1 75 6471 0.29 €
5 t2.small 90 db.m3.large 1 90 6471 0.32 € 6 t2.small 100 db.m3.large 1 90 6471 0.34 €
While measuring the behavior of a particular configuration, one can gather important information that will help us save time and obtain reliable results. In the case of the CloudStore, the number and type of the virtual machines used for both the Web server (EC2) and Database server (RDS) can and will affect the final Capacity, and/or the associated cost. Monitoring the percentage utilization of each of these components can help to avoid measuring combinations that make no sense. For instance, if the Web server utilization is close to 100% and the database utilization is far below 100%, increasing the database size will probably yield no benefit in terms of Capacity, and will certainly cost more; hence one can consider skipping running configurations with a larger or duplicated database.
4.2. Scalability Metrics
Scalability metrics characterize how much more load a system can handle once resources have been allocated. For scalable systems the slope of the load increase grows linearly with the increase in amount of resources, while in systems that don't scale well this line curve flattens out (and might even start dropping).
Scalability Range ([#U, #U]): segment between the number of users that the Minimum Deployment can handle, and the maximum achievable Capacity (the point where adding resources doesn't increase Capacity).
Scalability Rate (#U / Δ Resource): function of the increase in Capacity given an increase in resources (e.g. Database server Scalability Rate, Web server instances Scalability Rate...), see example in Figure 4 below. This metric will usually be a function rather than a scalar (though it can be a scalar in a particular load range).
Cost scalability: describes how the Capacity increases depending on the (minimum) cost of the configuration.
Measuring the Scalability Range consists of measuring the Capacity of the Minimum deployment, and the Capacity of deployments with increased resources until the Capacity flattens out.
To calculate the Scalability Rate, we measure the Capacity at different resource configurations and plot them against the number of resources until a maximum range is reached. In the graph of Figure 4, the Capacity measurements from Table 1 have been plotted (the points in the diagram). Based on the same data, we observe that the Scalability range is from 1250 to 6471 simultaneous virtual users, and is indicated to the right in Figure 4. The Scalability rate at each point is indicated by the continuous line between the points, while the capacity function is a step function between the points.

84 Richard Sanders et al. / Procedia Computer Science 68 ( 2015 ) 78 – 88
Fig. 4. Scalability metrics graph from example data.
4.3. Elasticity Metrics
By the term Elasticity we mean the ability of a system to increase (and decrease) its provisioned resources automatically in order to cope with the fluctuations in workload. There are several different methods available12. A useful approach is counting the number of SLO Violations that occur during a realistic Usage Evolution scenario, giving us a relevant figure and comparison tool (Usage Evolution Elasticity). Another approach is to find the steepest load growth ramp within which our system is able to keep violations under the defined SLO threshold (Users Elasticity Speed). In cases where the usage profile in real life is unpredictable, it may be more useful to know how long it takes the system to get response times back below the allowed SLO Violation rates after a sudden increase in workload (Mean Time to Quality Repair).
Usage Evolution Elasticity (#violations): #SLO Violations for the duration of the scenario. Users Elasticity Speed (#U/t): rate of additional users that the system can handle without violating the SLOs
(e.g. we can add 1000 users / hour). Mean Time To Quality Repair (t): time needed for the elastic system to return to normal (not violating the
SLOs) after a sudden (predefined) increase in usage.
To measure the Usage Evolution Elasticity, we define a Usage Evolution of interest, and run it on a system configuration with Auto-scaling enabled, counting the number of SLO Violations in which it incurs. This simple metric can be used to compare different configurations directly, since a system with poor elasticity is expected to produce more SLO Violations than a system that can quickly react to the increases of demand. Nevertheless, the comparison can only be understood as an order and not quantitatively since, for instance, twice as many violations does not mean twice as elastic.
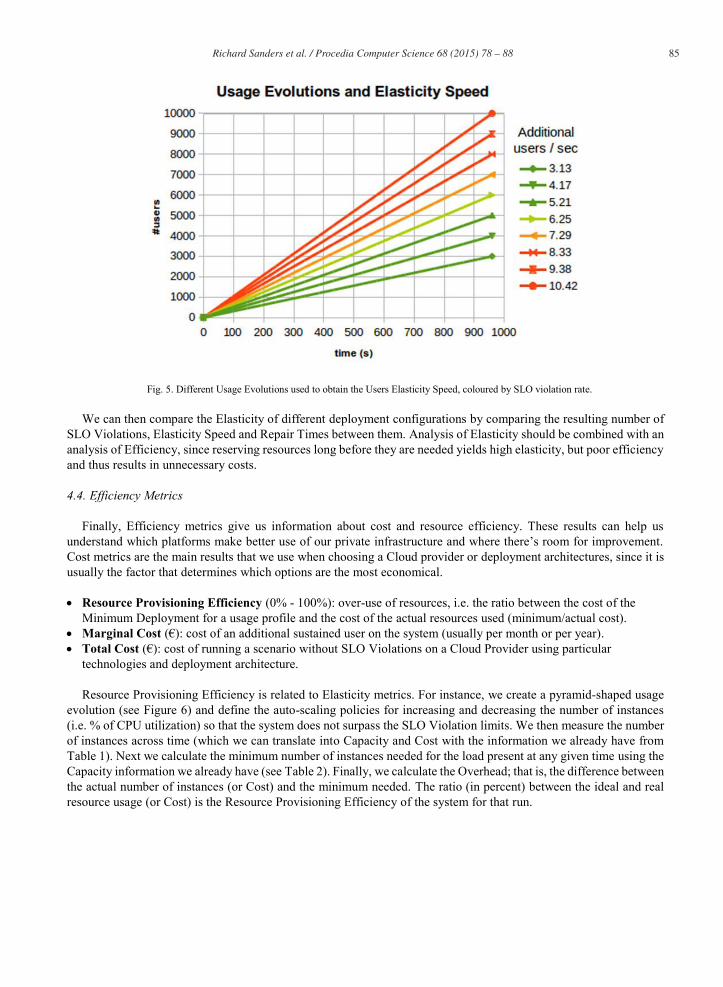
To find Users Elasticity Speed for a system one defines Usage Evolutions with the same Usage profile but with different ramps-up in usage, and search for the steepest ramp-up for which the system doesn’t exceed the SLO Violation threshold. This is exemplified in Figure 5. Here the Usage Evolutions (ramp-ups) that exceed the SLO Violation threshold are coloured in orange/red, and the ones that don't in green. The fastest growth the system can handle is thus approximately 6.25 additional users per second.
For Mean Time to Quality Repair we define a Usage Evolution with a work-load increase step (the amount being relevant to what can be expected in a real-life situation), turn on Auto Scaling, and measure the time it takes, on average, to return to a normal state without SLO Violations.
85 Richard Sanders et al. / Procedia Computer Science 68 ( 2015 ) 78 – 88
We can then compare the Elasticity of different deployment configurations by comparing the resulting number of SLO Violations, Elasticity Speed and Repair Times between them. Analysis of Elasticity should be combined with an analysis of Efficiency, since reserving resources long before they are needed yields high elasticity, but poor efficiency and thus results in unnecessary costs.
4.4. Efficiency Metrics
Finally, Efficiency metrics give us information about cost and resource efficiency. These results can help us understand which platforms make better use of our private infrastructure and where there’s room for improvement. Cost metrics are the main results that we use when choosing a Cloud provider or deployment architectures, since it is usually the factor that determines which options are the most economical.
Resource Provisioning Efficiency (0% - 100%): over-use of resources, i.e. the ratio between the cost of the Minimum Deployment for a usage profile and the cost of the actual resources used (minimum/actual cost).
Marginal Cost (€): cost of an additional sustained user on the system (usually per month or per year). Total Cost (€): cost of running a scenario without SLO Violations on a Cloud Provider using particular
technologies and deployment architecture.
Resource Provisioning Efficiency is related to Elasticity metrics. For instance, we create a pyramid-shaped usage evolution (see Figure 6) and define the auto-scaling policies for increasing and decreasing the number of instances (i.e. % of CPU utilization) so that the system does not surpass the SLO Violation limits. We then measure the number of instances across time (which we can translate into Capacity and Cost with the information we already have from Table 1). Next we calculate the minimum number of instances needed for the load present at any given time using the Capacity information we already have (see Table 2). Finally, we calculate the Overhead; that is, the difference between the actual number of instances (or Cost) and the minimum needed. The ratio (in percent) between the ideal and real resource usage (or Cost) is the Resource Provisioning Efficiency of the system for that run.
Fig. 5. Different Usage Evolutions used to obtain the Users Elasticity Speed, coloured by SLO violation rate.

86 Richard Sanders et al. / Procedia Computer Science 68 ( 2015 ) 78 – 88
The numbers are given in Table 2. In our example, Resource Provisioning Efficiency is 45/54 = 83.33%, while Cost Efficiency is €5.06 / € 5.29 = 95.65%. In this case cost efficiency is higher than resource efficiency, since the cost includes the relatively expensive database cluster, which is invariant in the configuration throughout the run.
Table 2. Actual and minimal values for the number of EC2 instances, their capacity and cost.
Marginal Costs per user is a discontinuous function. It makes more sense to plot the costs per users with slopes covering those steps. Thus the Marginal Cost per user (which will depend on which part of the curve we are analyzing)
Fig. 6. Actual versus minimal usage of resources.

87 Richard Sanders et al. / Procedia Computer Science 68 ( 2015 ) 78 – 88
can be considered to be the slope between a pair of points. We can also calculate the average Marginal Costs by dividing the cost for the maximum number of users by the number of users.
Consider the example in Fig. 7. Here Capacity points for different configurations are plotted; they include the values in Table 1 plus more points where the database configurations have been changed. The leftmost points in such a graph have the best capacity/cost ratio, while the points further to the right have a worse ratio. A continuous line between the "best" points indicates the Marginal Costs at each point, while an approximation of the Minimum Cost is the step function between these points. In this case we calculate the Average Marginal Cost to be 0.474€/h divided by 7059 users = 6.71483E-05 €/hour, or roughly 0.59€ per year per additional user.
The Marginal Cost for an additional user in the range between the 3529th and 5625th user (these values are found in Table 1) would be [(0.263€/h – 0.237€/h) / (5625-3529)] = 1.24E-05 €/hour, that is around 0.11€ per year per additional user. This is a good example of economy of scale. We also see that catering for more than 6500 simultaneous users comes at a much higher price; a systems manager would find it beneficial to avoid such situations, or, better still, investigate why the system does not scale, and redesign the system or the deployment architecture so that it does.
Lastly, the Total Cost tells us how much it would cost to handle a particular usage, defined according to expected work-loads. We achieve this by finding the cheapest configuration and elasticity parameters that can handle the usage of interest without violating the SLO threshold. The costs of each run can be calculated by adding up the usage of resources. Most cloud providers make this accumulated cost information available (see Table 2).
5. Discussion and conclusions
CloudStore allows one to measure and compare different deployment configurations in terms of capacity, elasticity and costs. A set of methods and tools to perform measurements of a number of metrics have been created for Amazon Web Services, including a load generation that is distributed in order to produce load. Tools and measurement methods for other cloud providers can be created for CloudStore.
A common problem with benchmarks is that they have to be representative12, i.e. the results should have some general interest also for other services. TPC-W4 was originally made as a benchmark, and much care was taken into making it a general e-commerce application. However, since TPC-W as a benchmark is deprecated, it may no longer be so representative. CloudStore represents a cloud-enabled modernized implementation of the functional and non-functional requirements defined in TPC-W that uses current technologies such as the Spring framework, and the more scalable MVC architecture, representing a much better the behaviour of a modern application.
Fig. 7. Cost and Capacity plots for different configurations, with curves drawn for Minimum Cost and Marginal Cost rates.

88 Richard Sanders et al. / Procedia Computer Science 68 ( 2015 ) 78 – 88
Other efforts have been made to produce standards for the measurement comparison cloud services, such as the work performed within FP7 project ‘Artist’14, but these efforts were in general focused in benchmarking performance and evaluating the benefits of the migration of legacy systems to the cloud, rather than effectively analyzing the scalability or elasticity capabilities of cloud services.
Although TCP-W has been deprecated as in industry benchmark, it is often used in academic projects. A publicly available implementation like CloudStore can play a similar role, making it easier to compare results of measurements, e.g. in academic publications. Although we have so far only deployed CloudStore on two cloud computing platforms, Amazon Web Services and OpenStack15, by extending the provided deployment scripts16, the CloudStore can be deployed on any IaaS to measure and compare any number of cloud providers and deployment architectures. What’s more, since CloudStore can be set-up to make use of Platform services such as Amazon’s S3 or RDS, it can be deployed to a PaaS such as Heroku11 or Google App Engine, allowing it to decide on the cost/benefit between different IaaS and PaaS
CloudStore and the CloudScale tools are made available through the project’s GitHub repository17, which includes instructions of how to make use of them.
Acknowledgements
The research leading to these results has received funding from the European Union Seventh Framework Programme (FP7/2007-2013) under grant no 317704 (CloudScale).
References
1. Thomas Erl, Zaigham Mahmood, and Richardo Puttini. Cloud Computing: Concepts, Technology & Architecture. Prentice Hall, 2013 2. CloudScale. CloudScale Project. www.cloudscale-project.eu. Last visited: 13th July 2015. 3. CloudScale. CloudStore, github.com/CloudScale-Project/CloudStore. Last visited: 13th July 2015. 4. Transaction Processing Performance Council. TPC-W benchmark, www.tpc.org/tpcw. Last visited: 13th July 2015. 5. Amazon. Amazon Web Services, aws.amazon.com. Last visited: 13th July 2015. 6. CloudScale. Distributed JMeter. github.com/CloudScale-Project/Distributed-Jmeter. Last visited: 13th July 2015 7. The Apache Software Foundation. Apache JMeter. jmeter.apache.org, 2014. Last visited: 13th July 2015 8. Nginx. Nginx. nginx.org/en/. Last visited: 13th July 2015 9. Spring. Spring Framework. projects.spring.io/spring-framework/. Last visited: 13th July 2015 10. Hibernate. Hibernate ORM hibernate.org/orm/. Last visited: 13th July 2015 11. Heroku. Heroku. www.heroku.com/. Last visited: 13th July 2015 12. Matthias Becker, Sebastian Lehrig, and Steffen Becker. Systematically deriving quality metrics for cloud computing systems. In
International Conference on Performance Engineering. ACM, 2015 13. David A. Lilja, Measuring Computer Performance, Cambridge University Press, 2000 14. Artist. Artist publications. www.artist-project.eu/publications Last visited: 13th August 2015 15. Openstack, OpenStack, www.openstack.org,. Last visited: 13th July 2015 16. CloudScale. CloudScale GitHub. github.com/CloudScale-Project/Deployment-Scripts. Last visited: 13th July 2015 17. CloudScale. CloudScale GitHub. github.com/CloudScale-Project. Last visited: 13th July 2015