Embed Size (px)
Citation preview
Cloudsourced Network Analytics
GT HILLDirector Technical Marketing

o Silicon Valley startupo Founded September, 2013o MIT, Meraki, Aruba Networks, Googleo Revenue generatingo Deployed in 50+ customers
We are Nyansa
CloudSourced Network Analytics|2
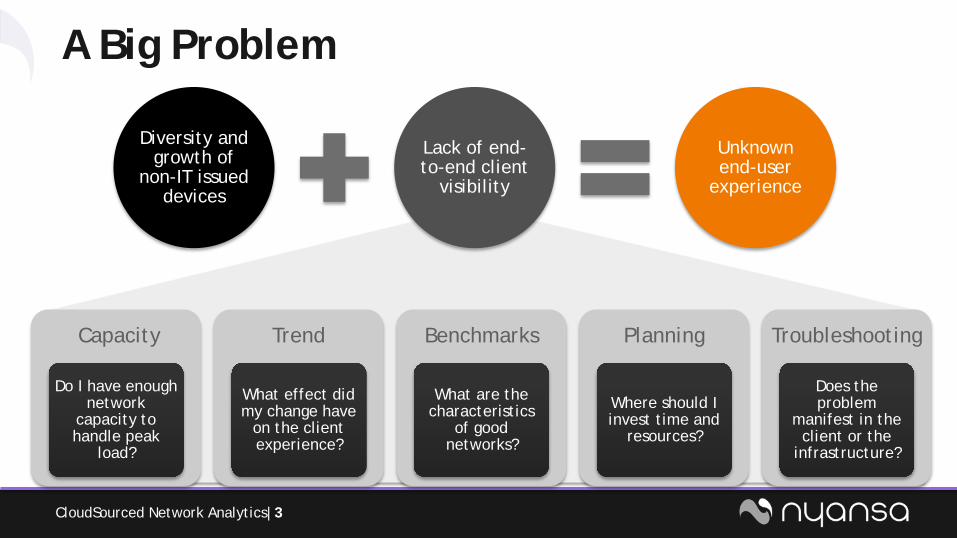
A Big Problem
CloudSourced Network Analytics|3
Diversity and growth of
non-IT issued devices
Lack of end-to-end client
visibility
Unknownend-user
experience
Capacity
Do I have enough network
capacity to handle peak
load?
Trend
What effect did my change have
on the client experience?
Benchmarks
What are the characteristics
of good networks?
Planning
Where should I invest time and
resources?
Troubleshooting
Does the problem
manifest in the client or the
infrastructure?
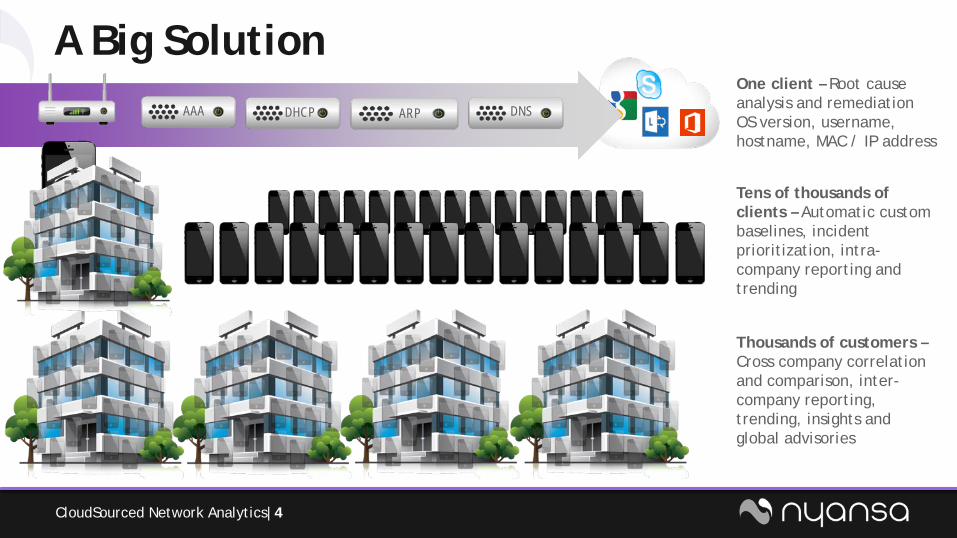
A Big Solution
CloudSourced Network Analytics|4
DHCP DNSARPAAA
One client – Root cause analysis and remediationOS version, username, hostname, MAC / IP address
Tens of thousands of clients – Automatic custom baselines, incident prioritization, intra-company reporting and trending
Thousands of customers –Cross company correlation and comparison, inter-company reporting, trending, insights and global advisories
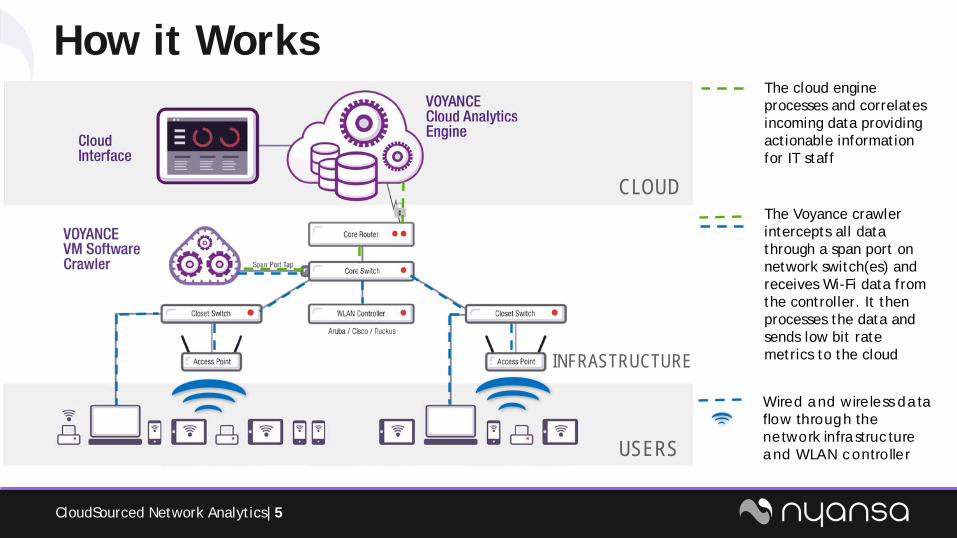
How it Works
CloudSourced Network Analytics|5
CLOUD
INFRASTRUCTURE
USERS
Wired and wireless data flow through the network infrastructure and WLAN controller
The Voyance crawler intercepts all data through a span port on network switch(es) and receives Wi-Fi data from the controller. It then processes the data and sends low bit rate metrics to the cloud
The cloud engine processes and correlates incoming data providing actionable information for IT staff
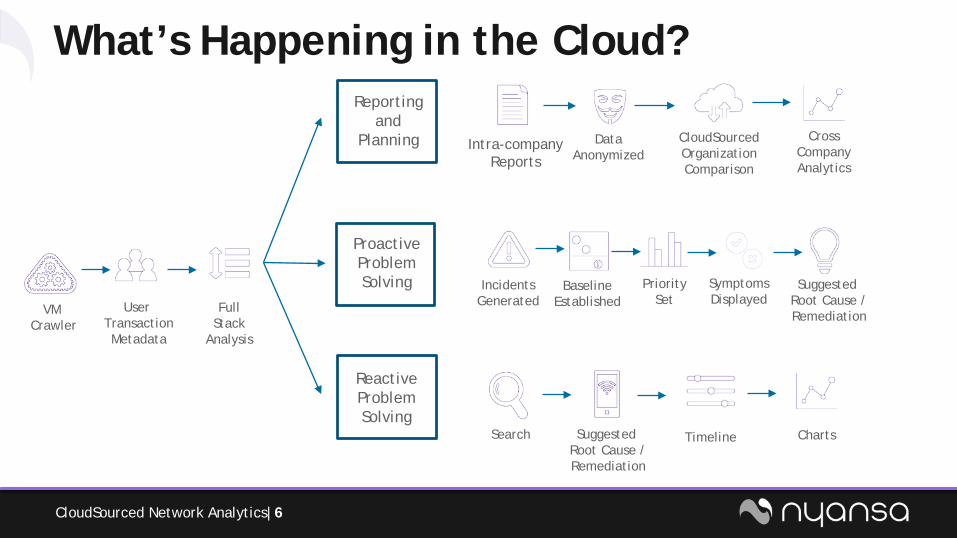
What’s Happening in the Cloud?
CloudSourced Network Analytics|6
FullStack
Analysis
IncidentsGenerated
Intra-companyReports
DataAnonymized
CloudSourcedOrganizationComparison
CrossCompanyAnalytics
BaselineEstablished
PrioritySet
Suggested Root Cause /Remediation
SymptomsDisplayed
Suggested Root Cause /Remediation
Timeline Charts
Reactive Problem Solving
Proactive Problem Solving
Reporting and
Planning
Search
User TransactionMetadata
VM Crawler

BIG DATA MEETS IT NETWORK OPERATIONS |7
√ APP ID√ Protocol stats√ Flow stats√ Device stats√ Network stats√ WLAN metrics√ User Info
What Data are we Inspecting?
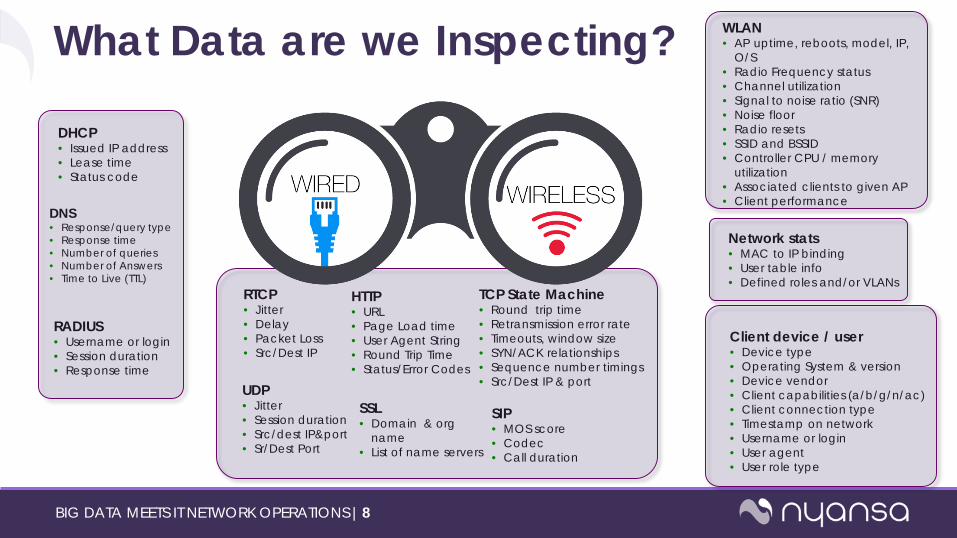
What Data are we Inspecting? WLAN• AP uptime, reboots, model, IP,
O/S • Radio Frequency status • Channel utilization• Signal to noise ratio (SNR)• Noise floor• Radio resets• SSID and BSSID• Controller CPU / memory
utilization• Associated clients to given AP• Client performance
Client device / user • Device type • Operating System & version• Device vendor • Client capabilities (a/b/g/n/ac) • Client connection type• Timestamp on network • Username or login • User agent • User role type
Network stats • MAC to IP binding • User table info • Defined roles and/or VLANs
DNS• Response/query type • Response time • Number of queries • Number of Answers • Time to Live (TTL)
DHCP• Issued IP address • Lease time • Status code
RADIUS• Username or login • Session duration • Response time
UDP• Jitter • Session duration • Src/dest IP&port• Sr/Dest Port
SIP• MOS score• Codec• Call duration
RTCP• Jitter• Delay • Packet Loss • Src/Dest IP
HTTP• URL • Page Load time • User Agent String • Round Trip Time • Status/Error Codes
TCP State Machine• Round trip time • Retransmission error rate • Timeouts, window size • SYN/ACK relationships • Sequence number timings • Src/Dest IP & port
SSL• Domain & org
name • List of name servers
BIG DATA MEETS IT NETWORK OPERATIONS |8

• 1. Search• 2. Root Cause• 3. Network Performance• 4. Application Analytics
Analytics at Work – User Troubleshooting
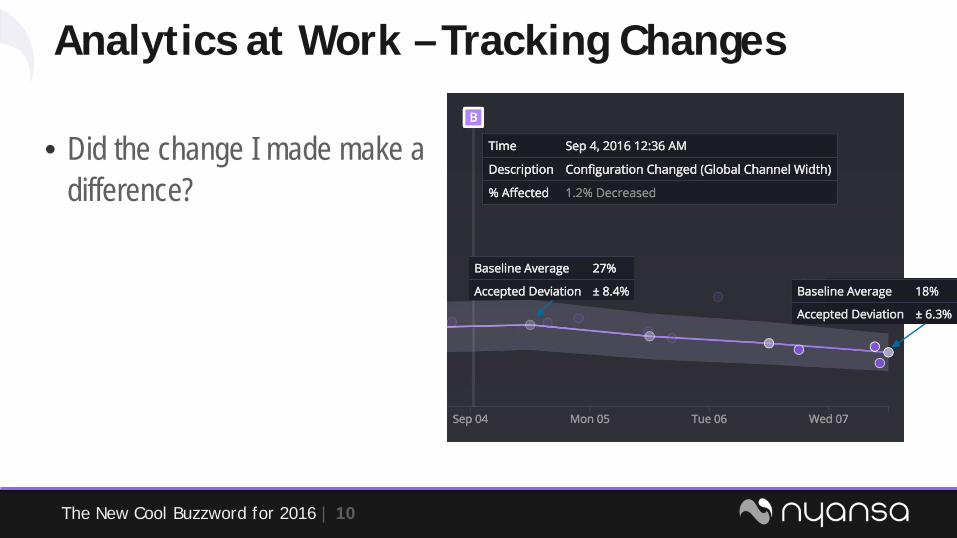
• Did the change I made make a difference?
The New Cool Buzzword for 2016 | 10
Analytics at Work – Tracking Changes
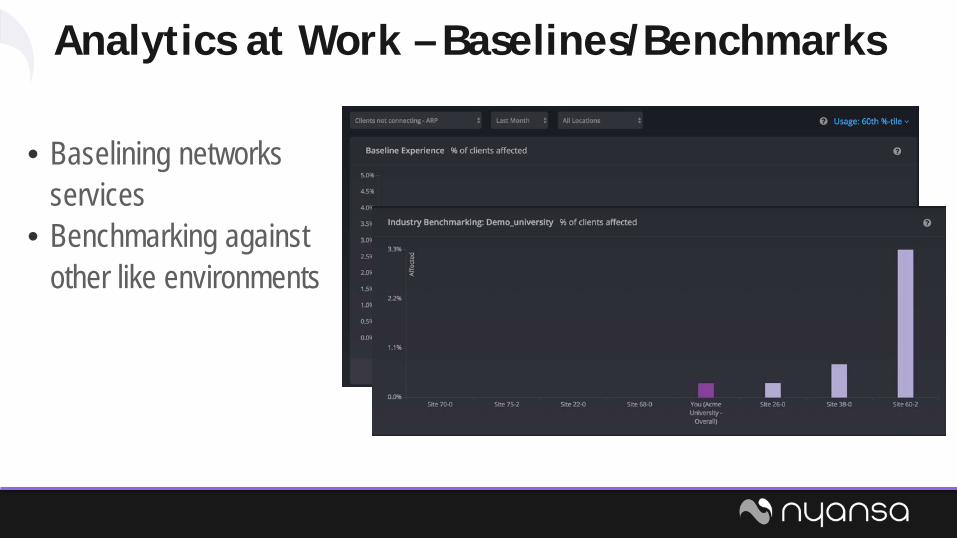
• Baselining networks services
• Benchmarking against other like environments
Analytics at Work – Baselines/Benchmarks

THANK YOU