Embed Size (px)
Citation preview
Slide 1
DTC Workshop -- Boulder, Aug. 2009 Slide 1
Cloud verification: a review of methodologies and recent developments
Anna Ghelli ECMWF
Thanks to: Maike Ahlgrimm Martin Kohler, Richard Forbes
Slide 2
DTC Workshop -- Boulder, Aug. 2009 Slide 2
Outline
Cloud properties Data availability NWP model fields and observation: the matching
game Standard scores and new ideas Example plots Active satellite profiling: new challenges Conclusions
Slide 3
DTC Workshop -- Boulder, Aug. 2009 Slide 3
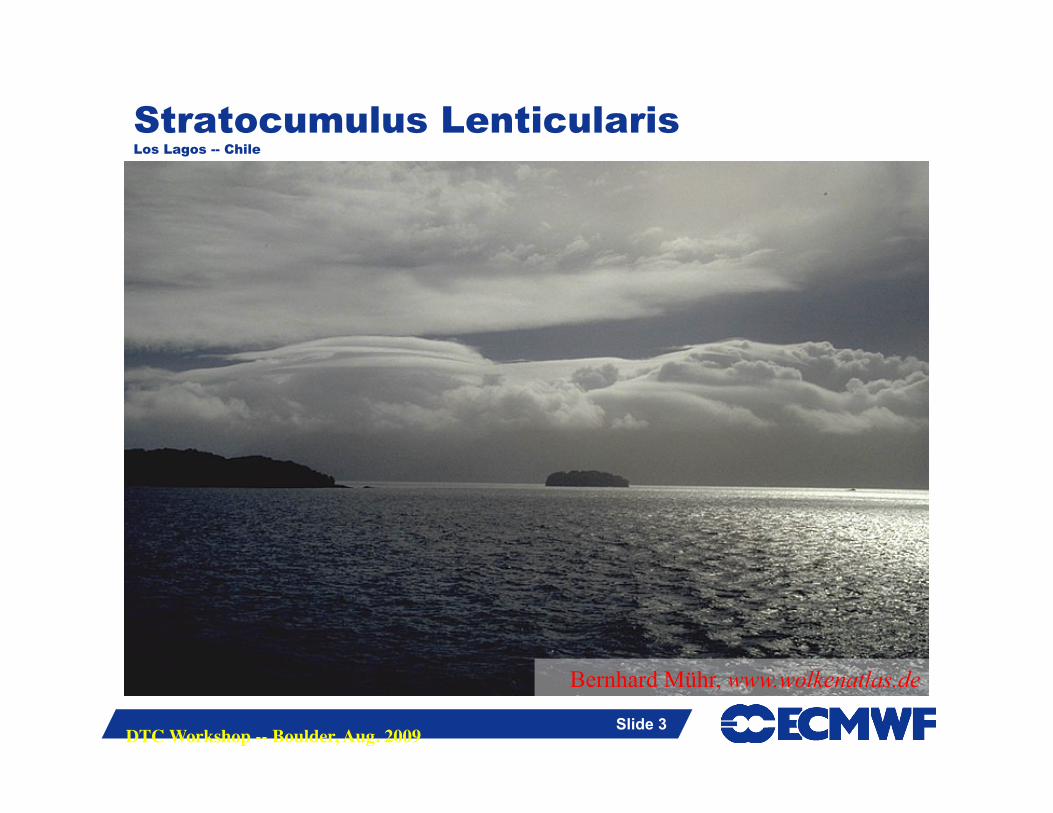
Stratocumulus Lenticularis Los Lagos -- Chile
Bernhard Mühr, www.wolkenatlas.de
Slide 4
DTC Workshop -- Boulder, Aug. 2009 Slide 4
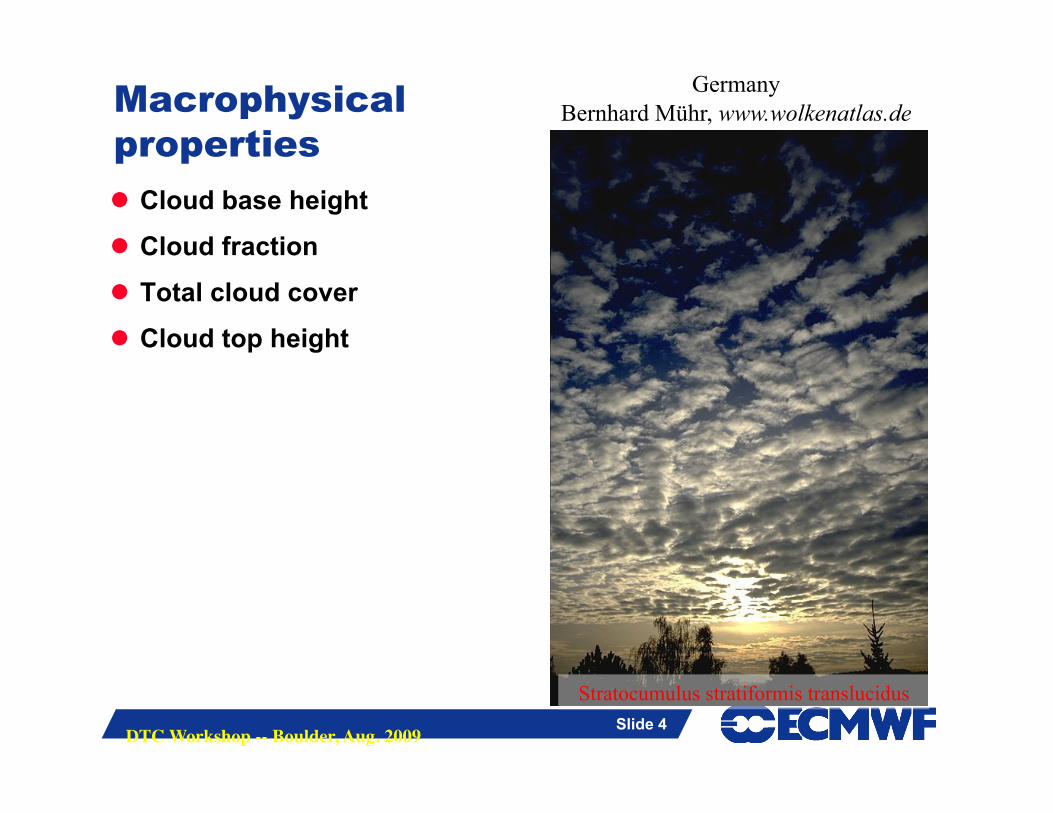
Macrophysical properties Cloud base height
Cloud fraction
Total cloud cover
Cloud top height
Stratocumulus stratiformis translucidus
Germany Bernhard Mühr, www.wolkenatlas.de
Slide 5
DTC Workshop -- Boulder, Aug. 2009 Slide 5
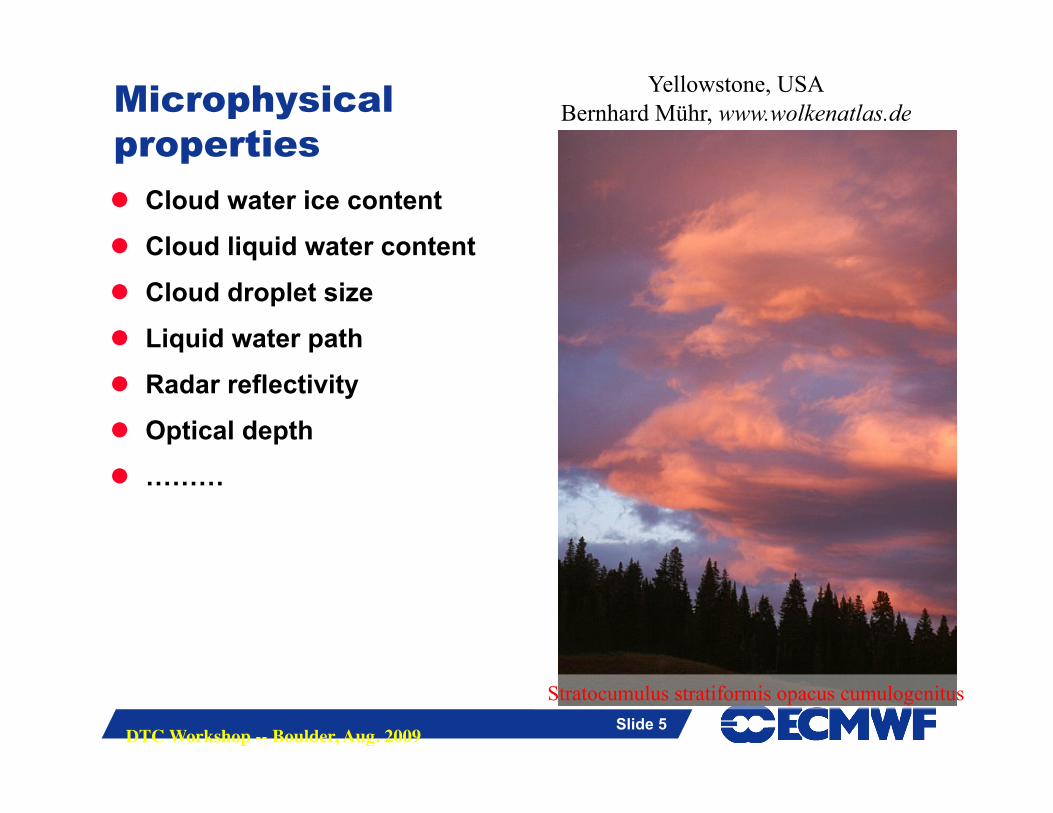
Microphysical properties Cloud water ice content
Cloud liquid water content
Cloud droplet size
Liquid water path
Radar reflectivity
Optical depth
………
Stratocumulus stratiformis opacus cumulogenitus
Yellowstone, USA Bernhard Mühr, www.wolkenatlas.de
Slide 6
DTC Workshop -- Boulder, Aug. 2009 Slide 6
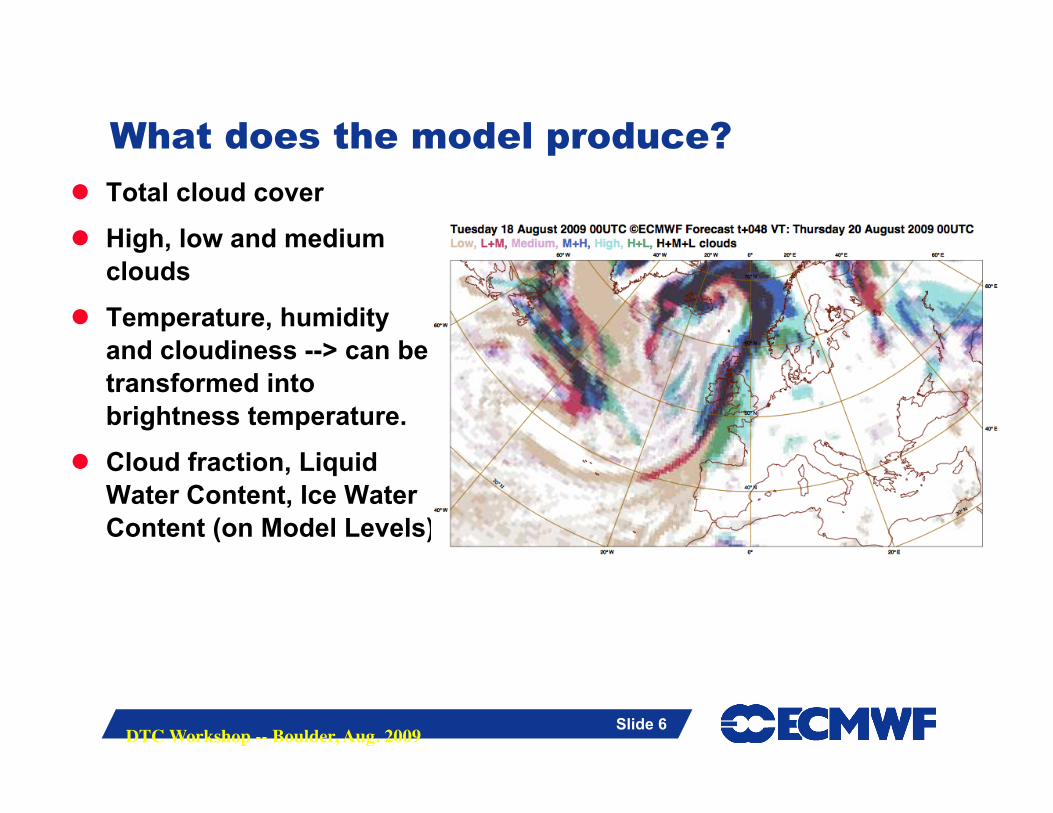
What does the model produce? Total cloud cover
High, low and medium clouds
Temperature, humidity and cloudiness --> can be transformed into brightness temperature.
Cloud fraction, Liquid Water Content, Ice Water Content (on Model Levels)
Slide 7
DTC Workshop -- Boulder, Aug. 2009 Slide 7
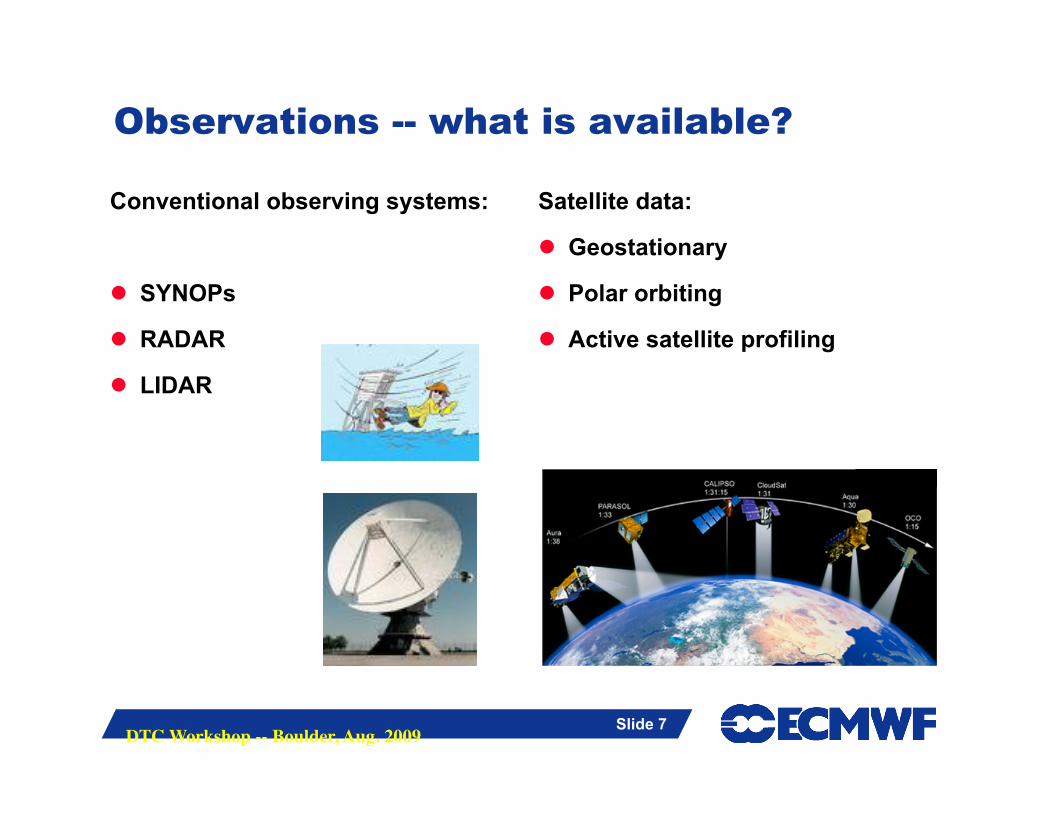
Observations -- what is available?
Conventional observing systems:
SYNOPs
RADAR
LIDAR
Satellite data:
Geostationary
Polar orbiting
Active satellite profiling
Slide 8
DTC Workshop -- Boulder, Aug. 2009 Slide 8
Observations
Conventional observing systems:
Sparse and inhomogeneous coverage
Decreasing in number
Differences between manual and automated
But:
The data volumes are manageable
Available at synoptic times
Available in real time
They measure the weather
Satellite data:
Large data volumes
Need location and time matching
Thinning algorithms are needed
May not be available in real time
But:
Wide spatial coverage
High spatial and temporal resolution
Weather phenomena like fog can be assessed, not possible with conventional data
Slide 9
DTC Workshop -- Boulder, Aug. 2009 Slide 9
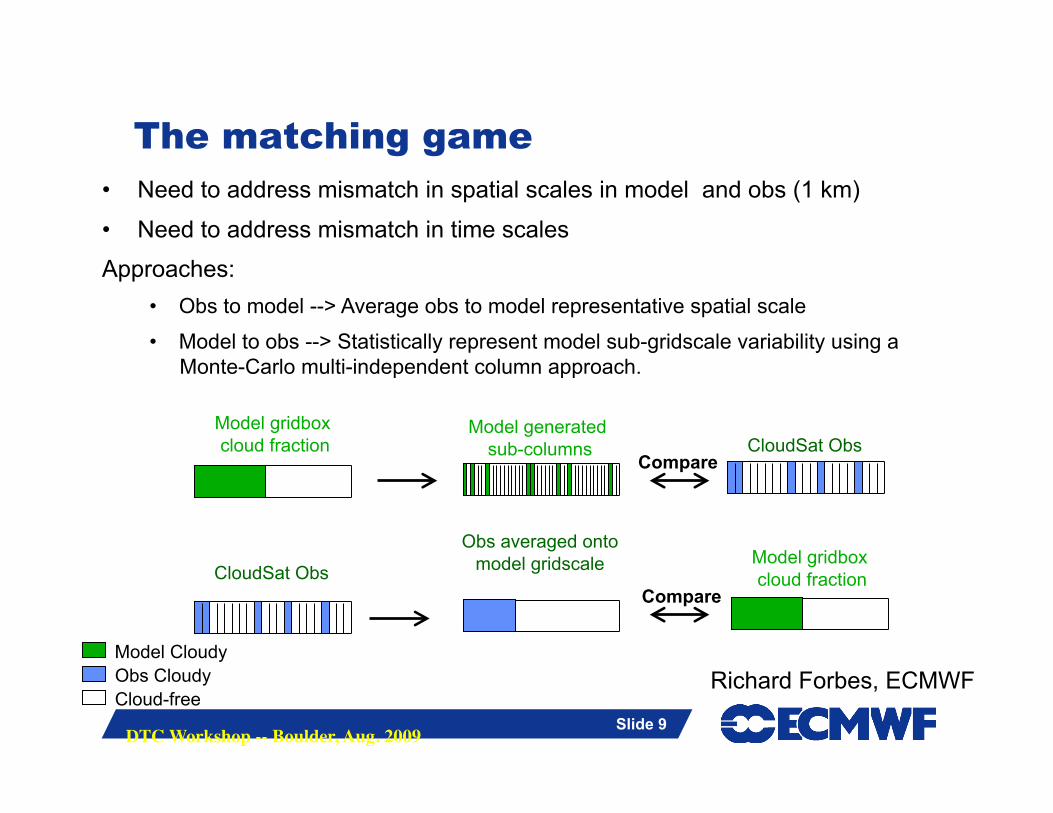
• Need to address mismatch in spatial scales in model and obs (1 km)
• Need to address mismatch in time scales
Approaches: • Obs to model --> Average obs to model representative spatial scale
• Model to obs --> Statistically represent model sub-gridscale variability using a Monte-Carlo multi-independent column approach.
Obs Cloudy Cloud-free
Model gridbox cloud fraction
The matching game
Model generated sub-columns
CloudSat Obs
Obs averaged onto model gridscale
Model gridbox cloud fraction CloudSat Obs
Compare
Compare
Model Cloudy Richard Forbes, ECMWF
Slide 10
DTC Workshop -- Boulder, Aug. 2009 Slide 10
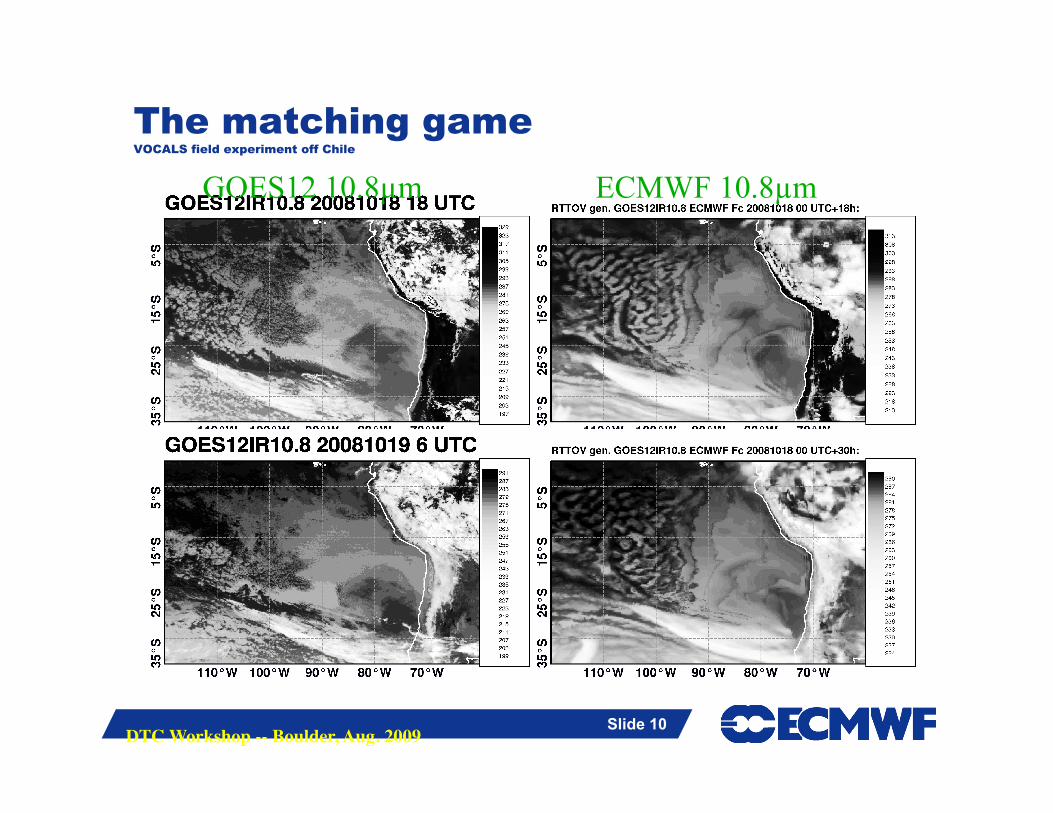
The matching game VOCALS field experiment off Chile
GOES12 10.8µm ECMWF 10.8µm
Slide 11
DTC Workshop -- Boulder, Aug. 2009 Slide 11
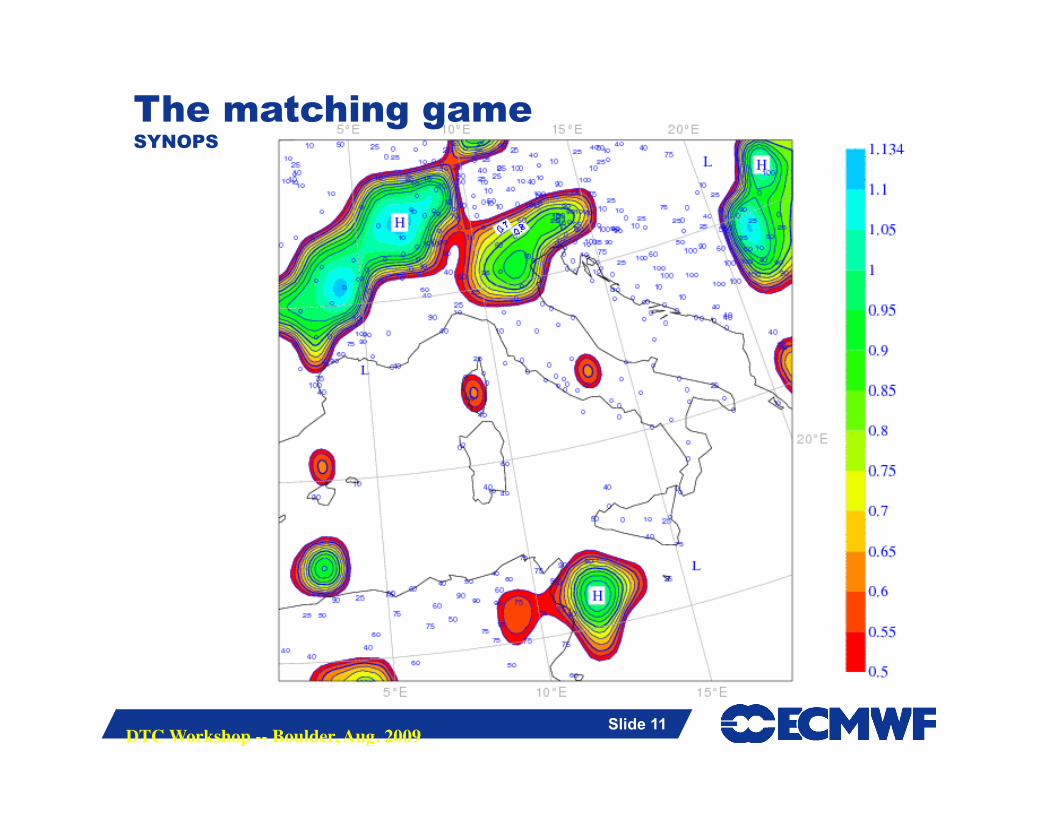
The matching game SYNOPS
Slide 12
DTC Workshop -- Boulder, Aug. 2009 Slide 12
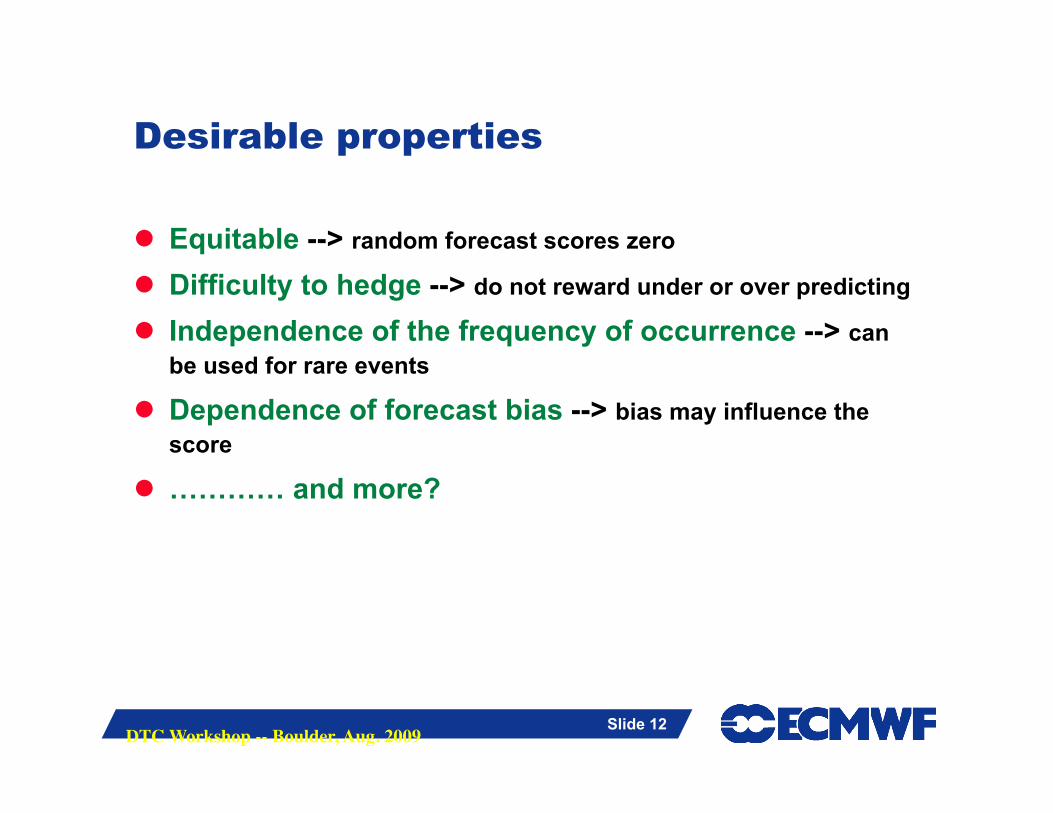
Desirable properties
Equitable --> random forecast scores zero Difficulty to hedge --> do not reward under or over predicting
Independence of the frequency of occurrence --> can be used for rare events
Dependence of forecast bias --> bias may influence the score
………… and more?
Slide 13
DTC Workshop -- Boulder, Aug. 2009 Slide 13
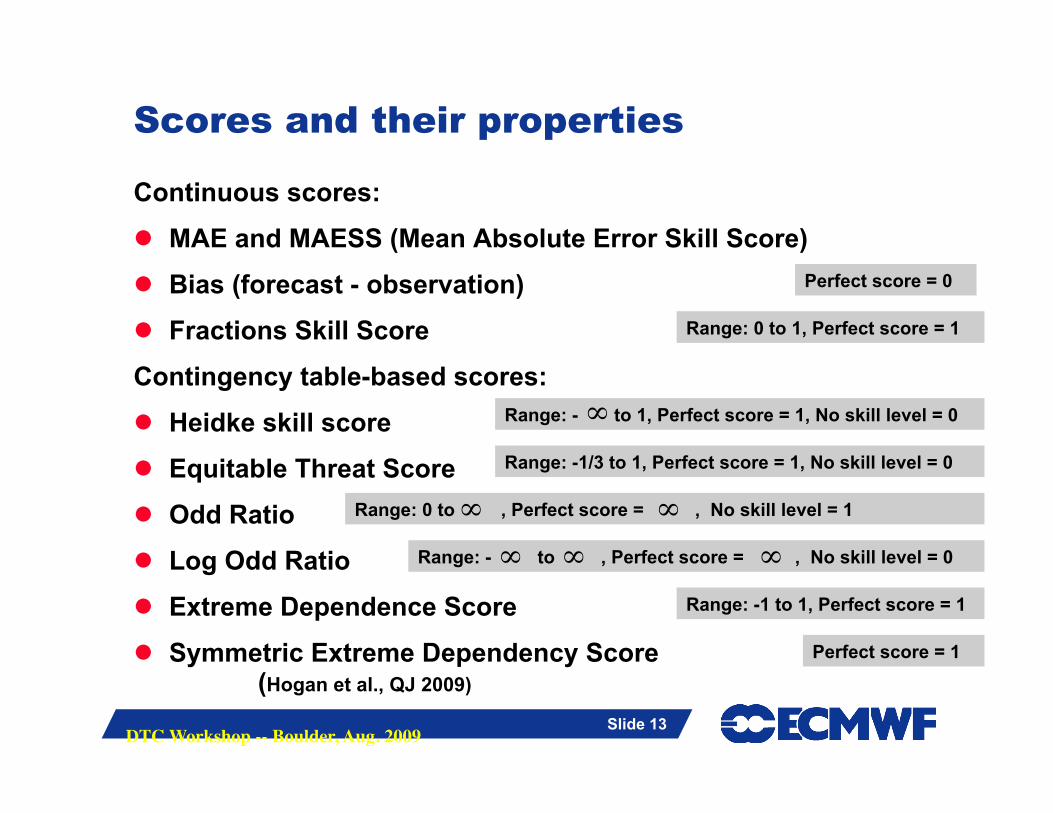
Range: -1/3 to 1, Perfect score = 1, No skill level = 0
Scores and their properties
Continuous scores:
MAE and MAESS (Mean Absolute Error Skill Score)
Bias (forecast - observation)
Fractions Skill Score
Contingency table-based scores:
Heidke skill score
Equitable Threat Score
Odd Ratio
Log Odd Ratio
Extreme Dependence Score
Symmetric Extreme Dependency Score (Hogan et al., QJ 2009)
Range: 0 to , Perfect score = , No skill level = 1
Range: - to 1, Perfect score = 1, No skill level = 0
Range: -1 to 1, Perfect score = 1
Range: - to , Perfect score = , No skill level = 0
Perfect score = 1
Range: 0 to 1, Perfect score = 1
Perfect score = 0
Slide 14
DTC Workshop -- Boulder, Aug. 2009 Slide 14
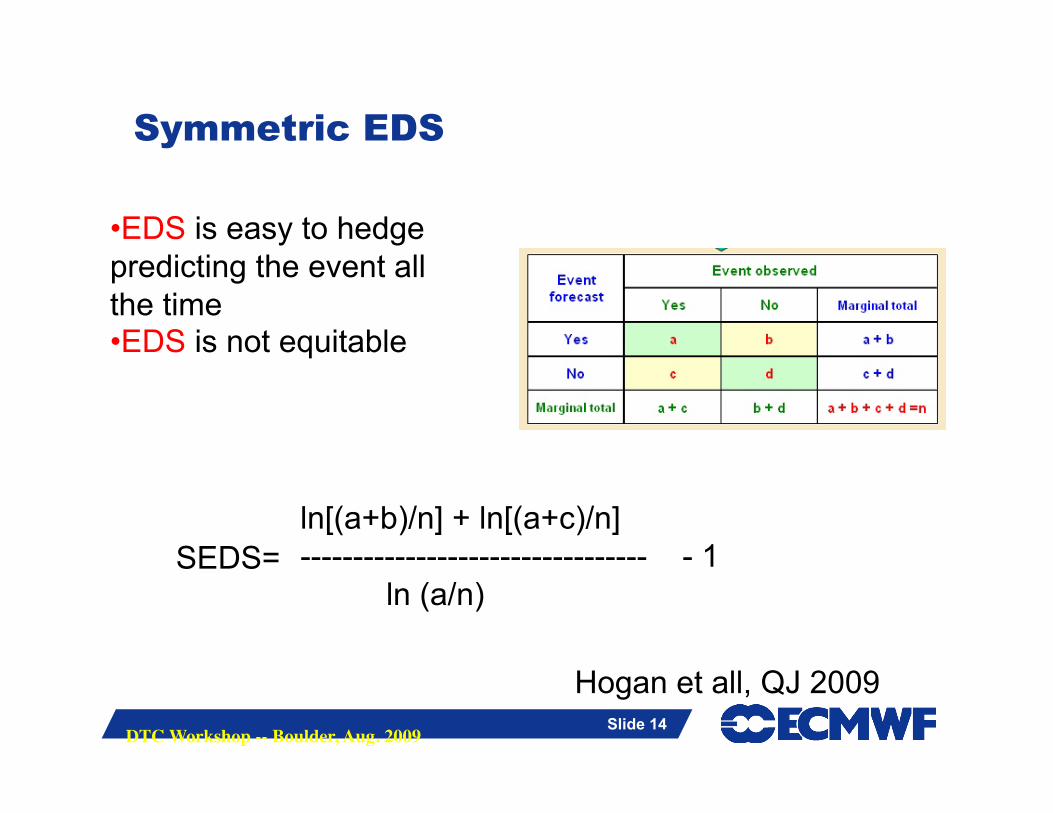
Symmetric EDS
• EDS is easy to hedge predicting the event all the time • EDS is not equitable
ln[(a+b)/n] + ln[(a+c)/n] --------------------------------- - 1
ln (a/n) SEDS=
Hogan et all, QJ 2009
Slide 15
DTC Workshop -- Boulder, Aug. 2009 Slide 15
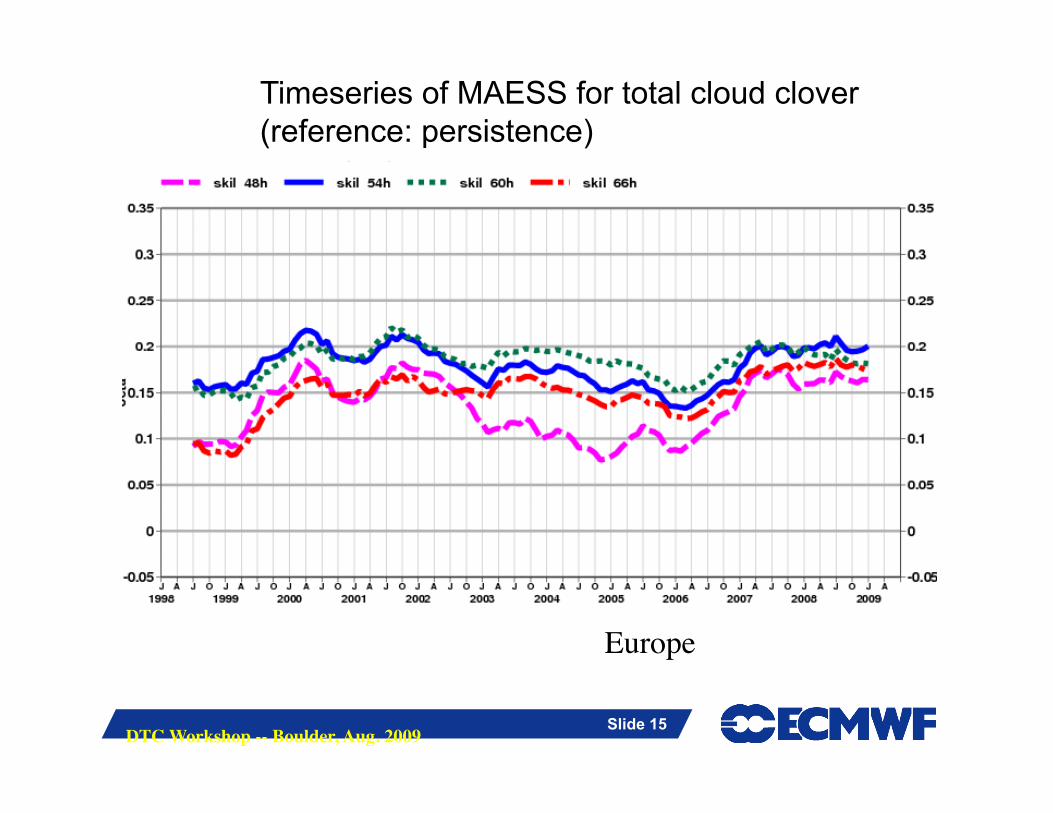
Timeseries of MAESS for total cloud clover (reference: persistence)
Europe
Slide 16
DTC Workshop -- Boulder, Aug. 2009 Slide 16
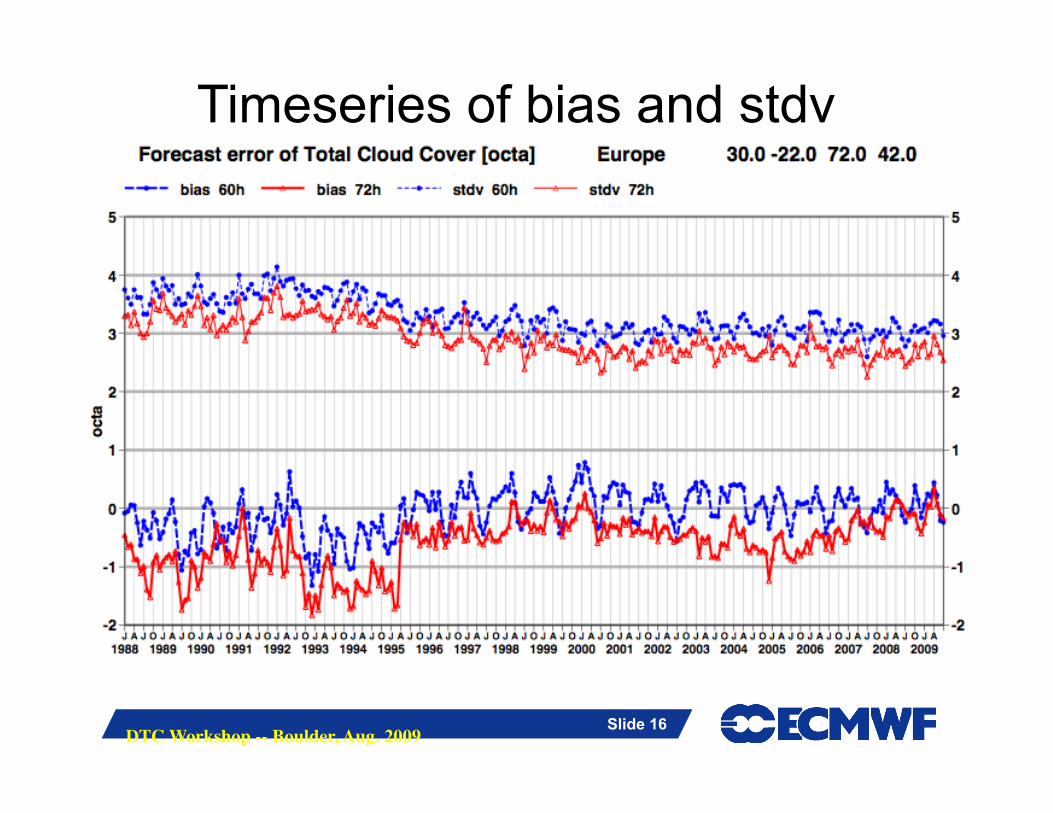
Timeseries of bias and stdv
Slide 17
DTC Workshop -- Boulder, Aug. 2009 Slide 17
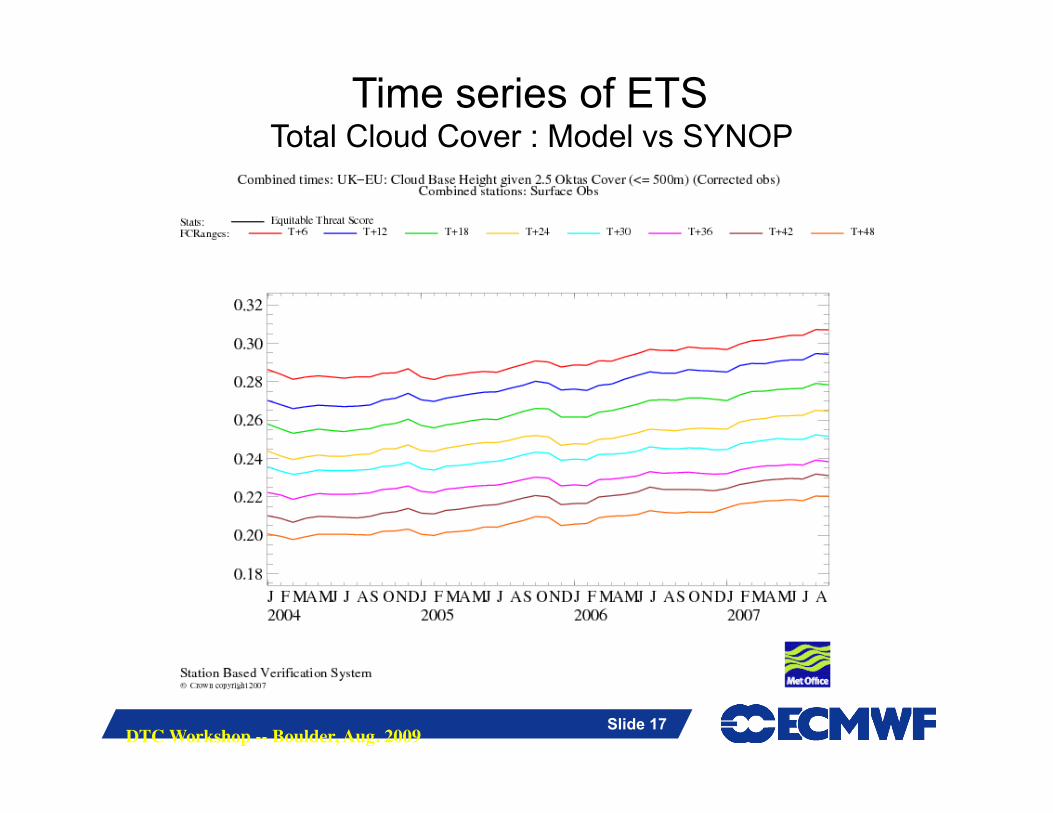
Time series of ETS Total Cloud Cover : Model vs SYNOP
Slide 18
DTC Workshop -- Boulder, Aug. 2009 Slide 18
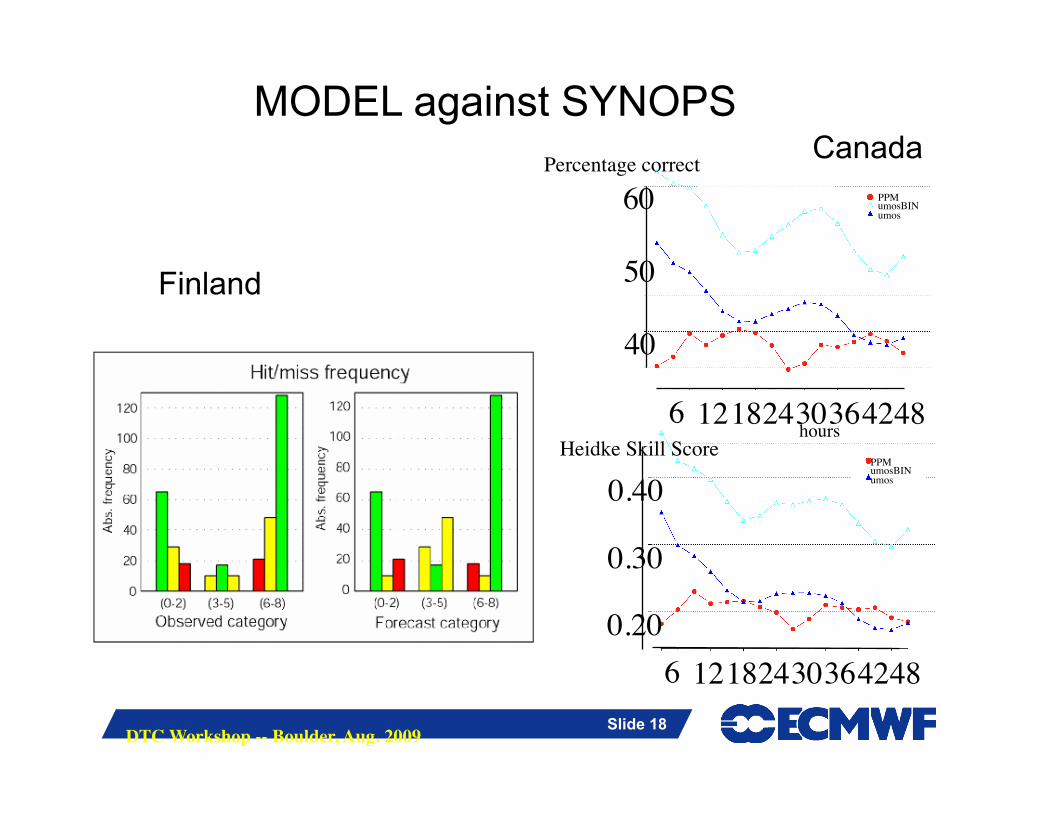
MODEL against SYNOPS
Finland
Canada
6 12 18 24 30 36 42 48
60
50
40
PPM umosBIN umos
6 12 18 24 30 36 42 48
0.40 PPM umosBIN umos
0.30
0.20
Percentage correct
Heidke Skill Score hours
Slide 19
DTC Workshop -- Boulder, Aug. 2009 Slide 19
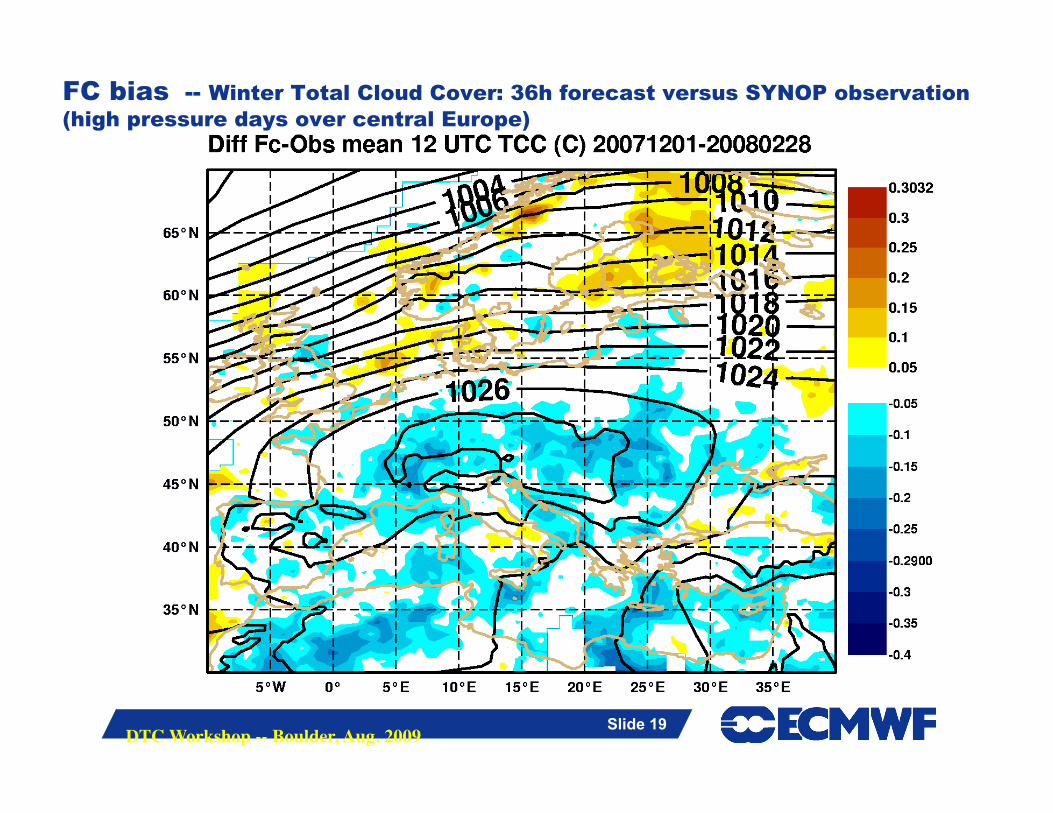
FC bias -- Winter Total Cloud Cover: 36h forecast versus SYNOP observation (high pressure days over central Europe)
Slide 20
DTC Workshop -- Boulder, Aug. 2009 Slide 20
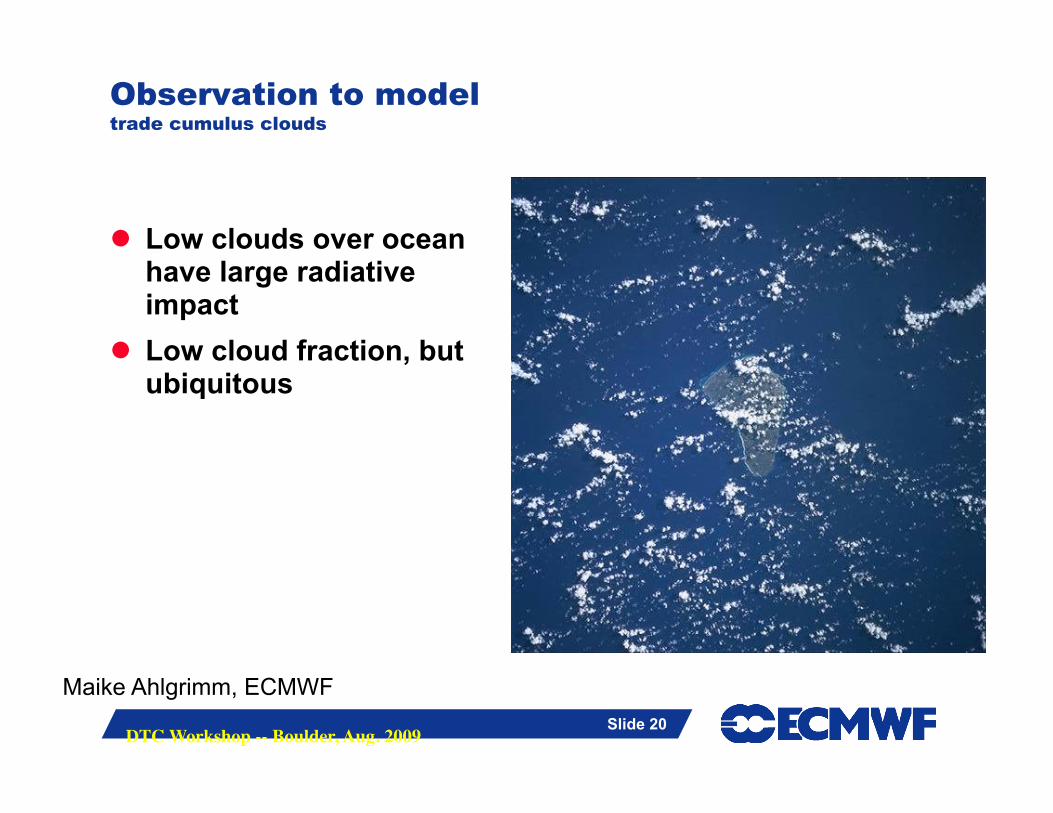
Observation to model trade cumulus clouds
Low clouds over ocean have large radiative impact
Low cloud fraction, but ubiquitous
Maike Ahlgrimm, ECMWF
Slide 21
DTC Workshop -- Boulder, Aug. 2009 Slide 21
Observation to model
Can the model predict accurately this type of clouds? Probably not!
Cloud characteristics: • Ubiquitous • Relatively small scale
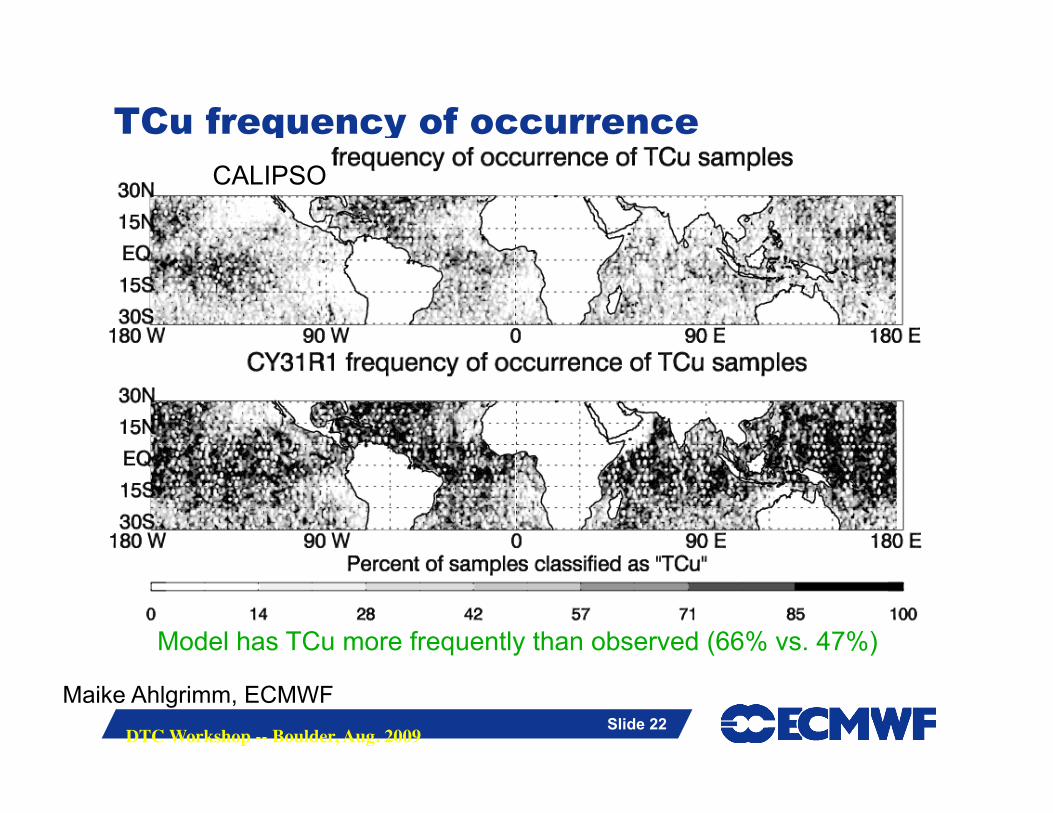
Verification strategy: Relax time and space constraints, i.e. I am not asking the model to forecast my cloud at the exact location and time. The new verification question is: Given an area and period of time, what is the frequency of occurrence of my event in the forecast and in the observation?
Slide 22
DTC Workshop -- Boulder, Aug. 2009 Slide 22
TCu frequency of occurrence CALIPSO
Model has TCu more frequently than observed (66% vs. 47%)
Maike Ahlgrimm, ECMWF
Slide 23
DTC Workshop -- Boulder, Aug. 2009 Slide 23
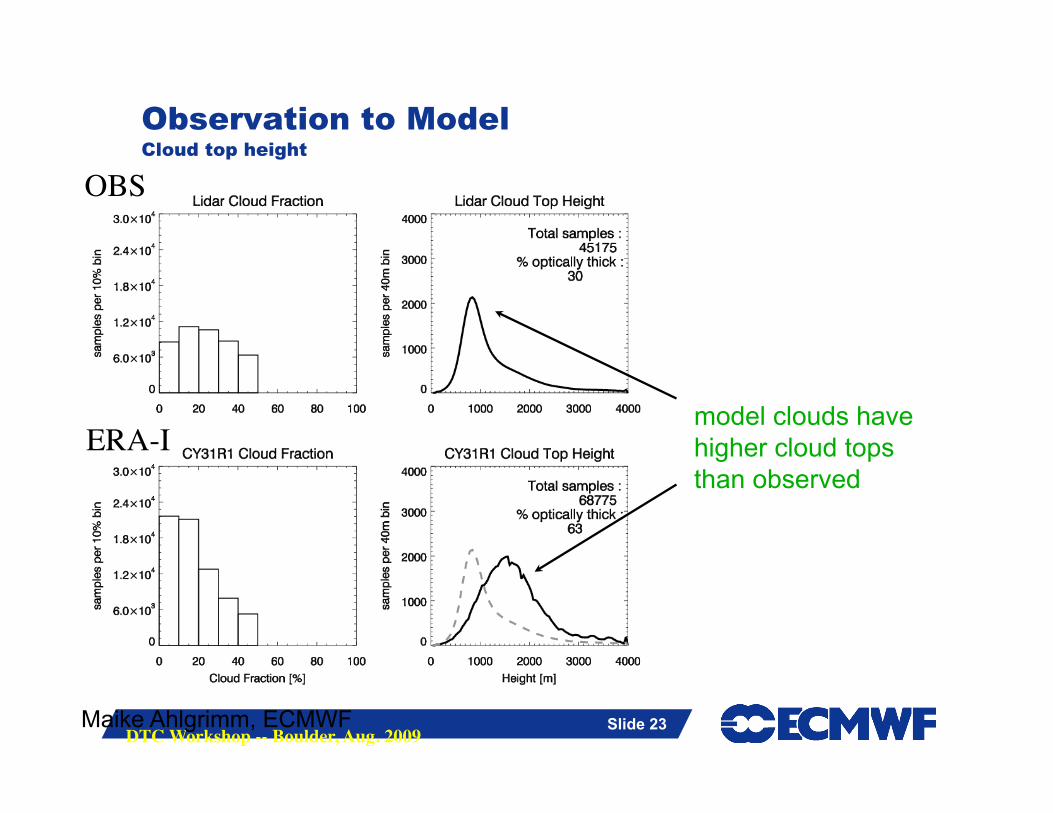
Observation to Model Cloud top height
OBS
ERA-I model clouds have higher cloud tops than observed
Maike Ahlgrimm, ECMWF
Slide 24
DTC Workshop -- Boulder, Aug. 2009 Slide 24
Eq Eq Eq Greenland Antarctica
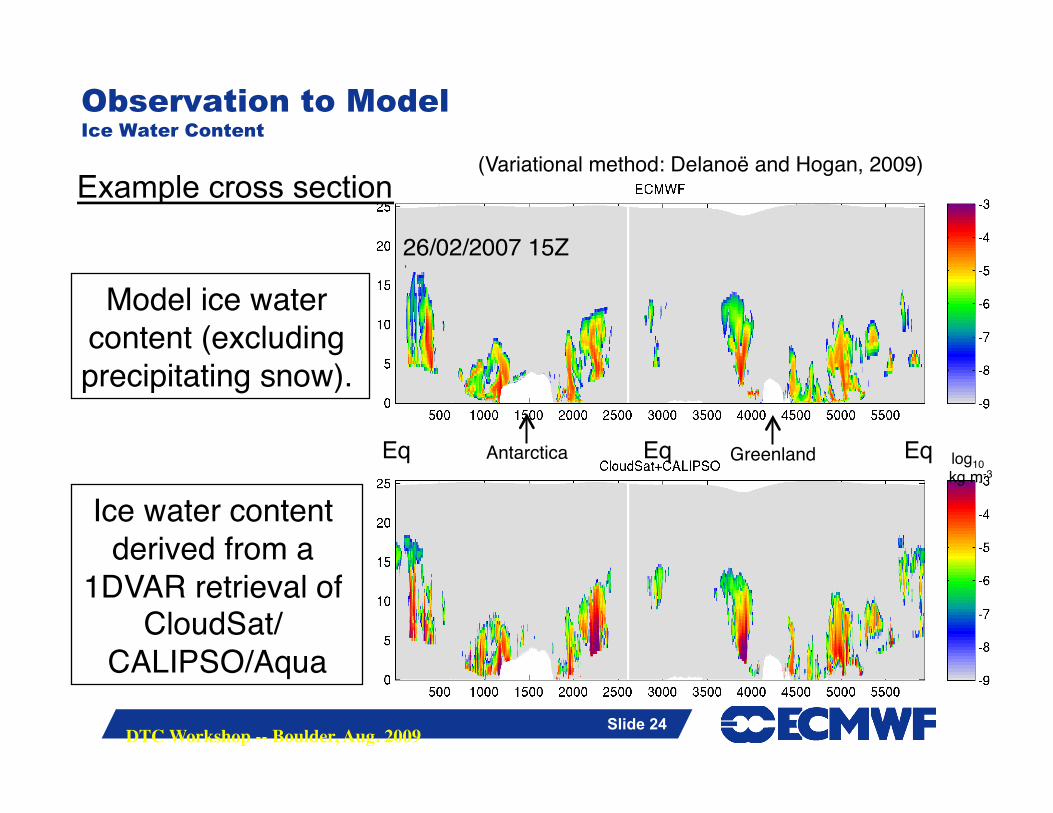
Observation to Model Ice Water Content
Model ice water content (excluding precipitating snow).
Ice water content derived from a
1DVAR retrieval of CloudSat/
CALIPSO/Aqua
log10 kg m-3
(Variational method: Delanoë and Hogan, 2009)
26/02/2007 15Z
Example cross section
Slide 25
DTC Workshop -- Boulder, Aug. 2009 Slide 25
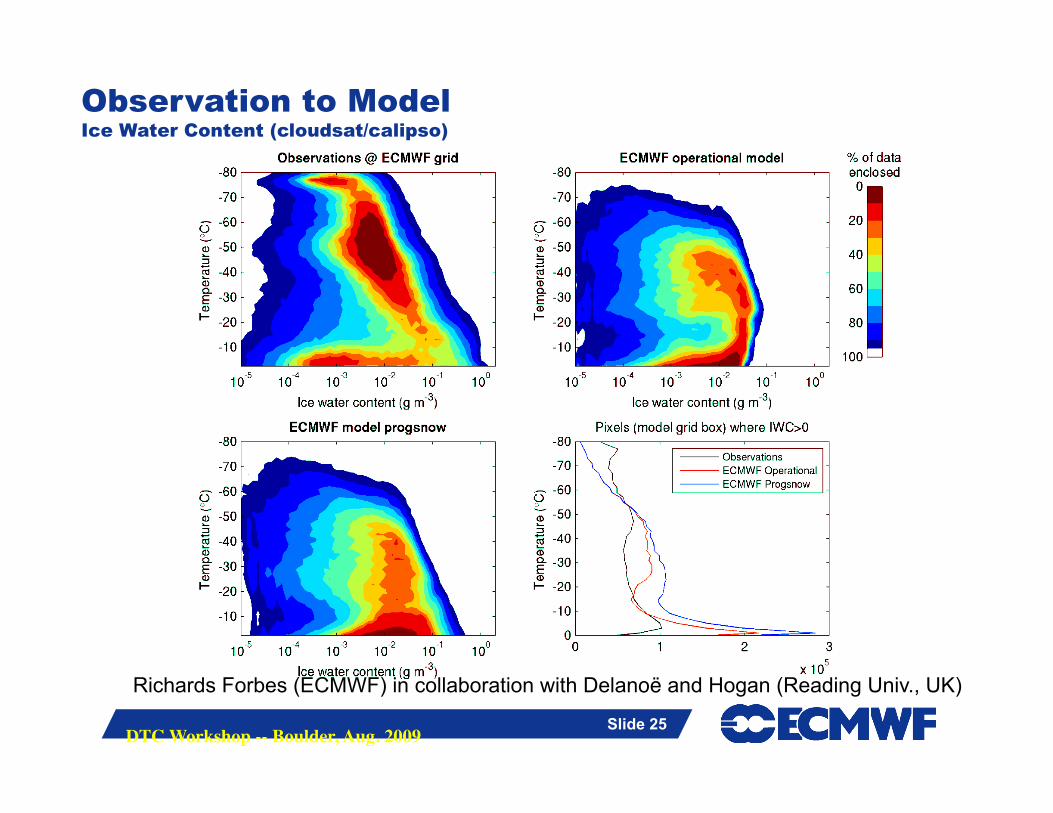
Richards Forbes (ECMWF) in collaboration with Delanoë and Hogan (Reading Univ., UK)
Observation to Model Ice Water Content (cloudsat/calipso)
Slide 26
DTC Workshop -- Boulder, Aug. 2009 Slide 26
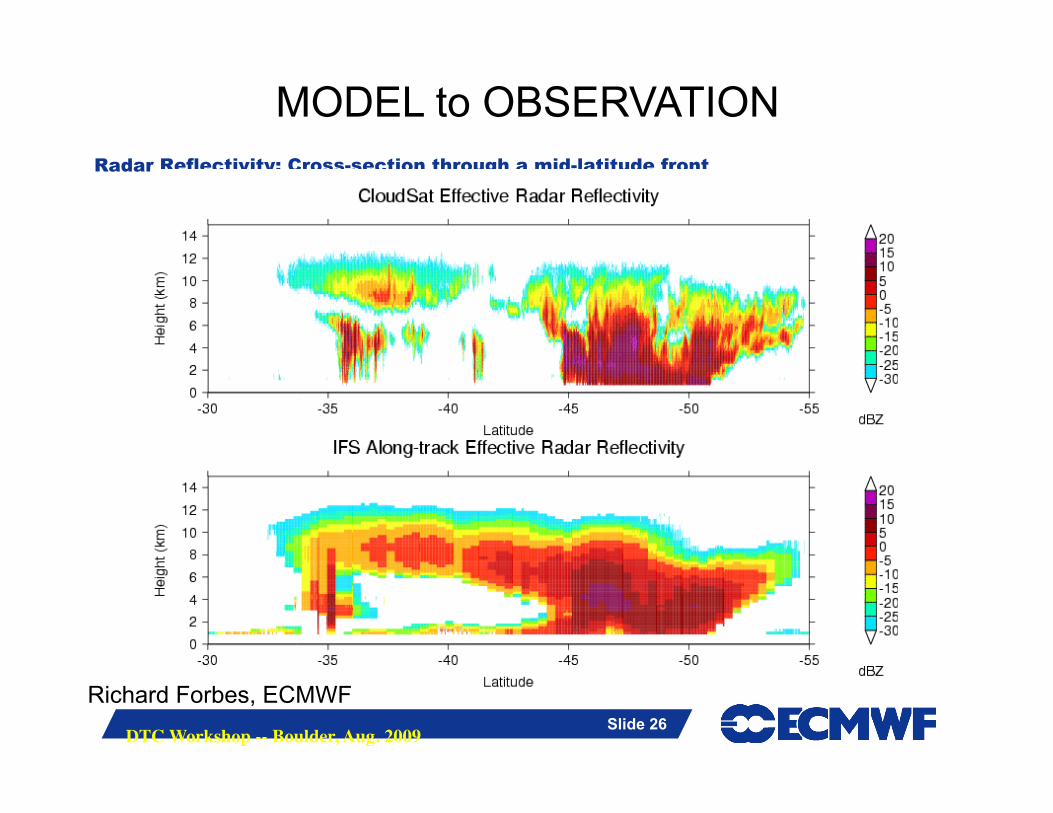
Radar Reflectivity: Cross-section through a mid-latitude front
Richard Forbes, ECMWF
MODEL to OBSERVATION
Slide 27
DTC Workshop -- Boulder, Aug. 2009 Slide 27
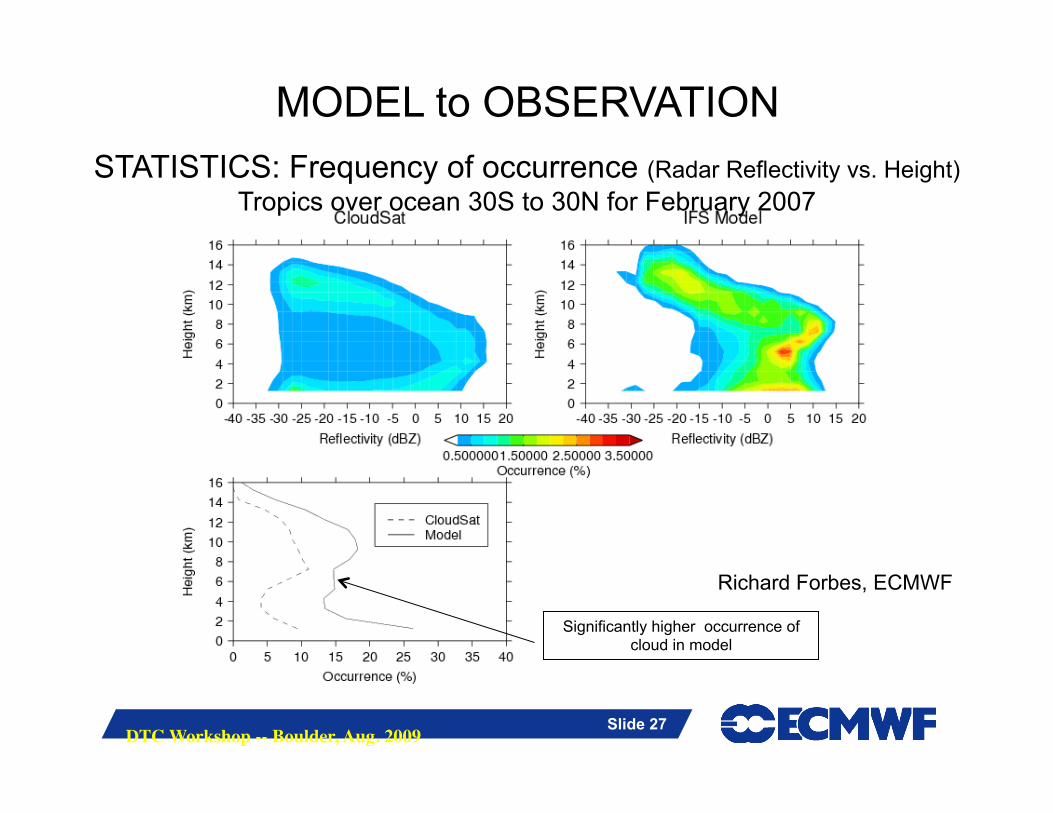
STATISTICS: Frequency of occurrence (Radar Reflectivity vs. Height) Tropics over ocean 30S to 30N for February 2007
Significantly higher occurrence of cloud in model
MODEL to OBSERVATION
Richard Forbes, ECMWF
Slide 28
DTC Workshop -- Boulder, Aug. 2009 Slide 28
Conclusions …….. or our challenges Observing systems. Data management issues. Model and observations: the matching game. 2D verification of clouds are well established, 3D
evaluation of cloud properties is now possible with active satellite profiling.
……… users --> involve them in any verification process.