Embed Size (px)
Citation preview
Cloud Flash Evaluation Issues and Progress Report
Don MacGorman, NOAA/NSSL
Al Nierow, FAA
Dennis Boccippio, NASA/MSFC
Evaluation of NLDN Cloud Flashes
• Compare times and reliability of first storm detection (various definitions of detection)
• Compare with higher cloud flash detection efficiency
• Determine whether NLDN cloud flash detection is biased
• Develop prototype cloud flash products for AWIPS and WDSSII
PROGRESS
• Improved OK-LMA network- added station and real-time link to old station
- improved real-time data retrieval
• Collected LMA data and NLDN cloud flash data for May – data collection continuing
• Set up real-time OK-LMA data feed to NSSL and to Norman NWSFO (AWIPS and WDSSII)
• Generation of real-time LMA products for WDSSII and AWIPS ready to begin
• FSL’s development of prototype AWIPS NLDN cloud flash products to begin in June
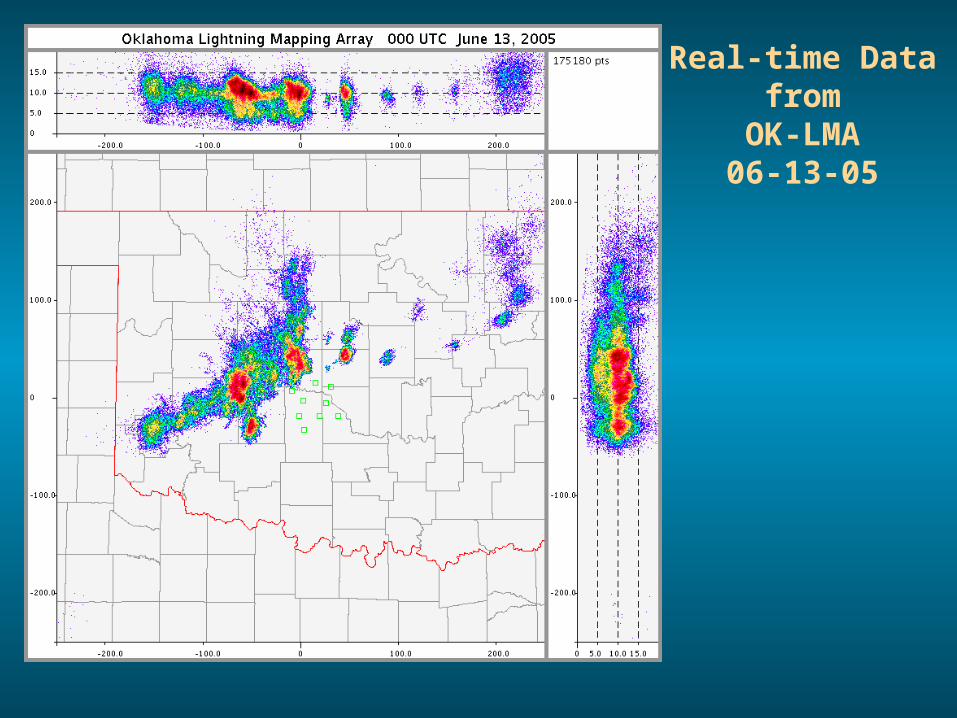
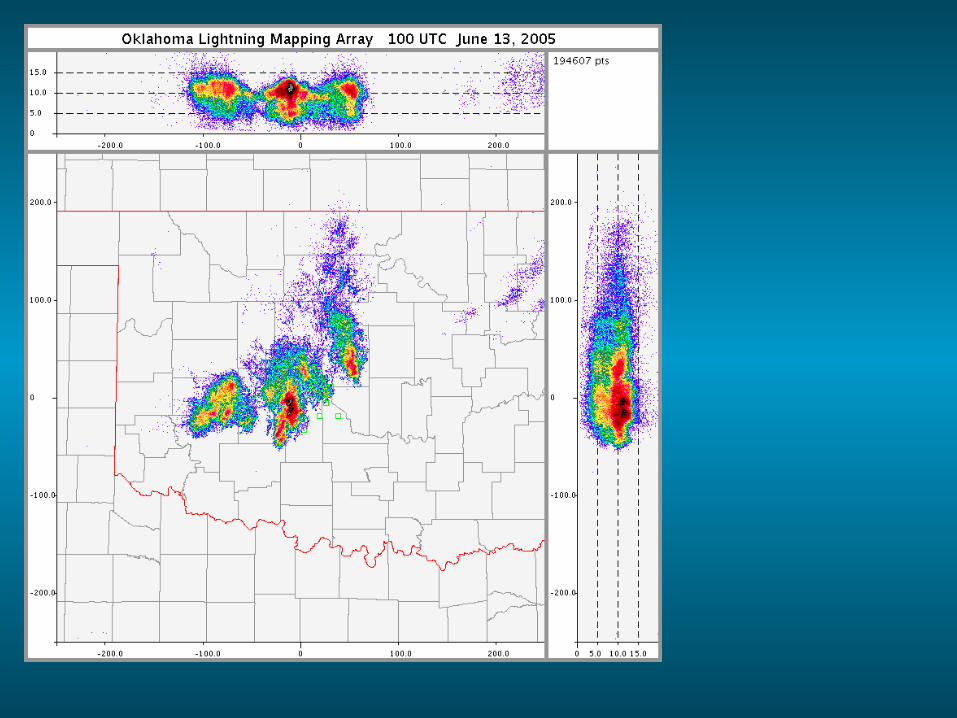
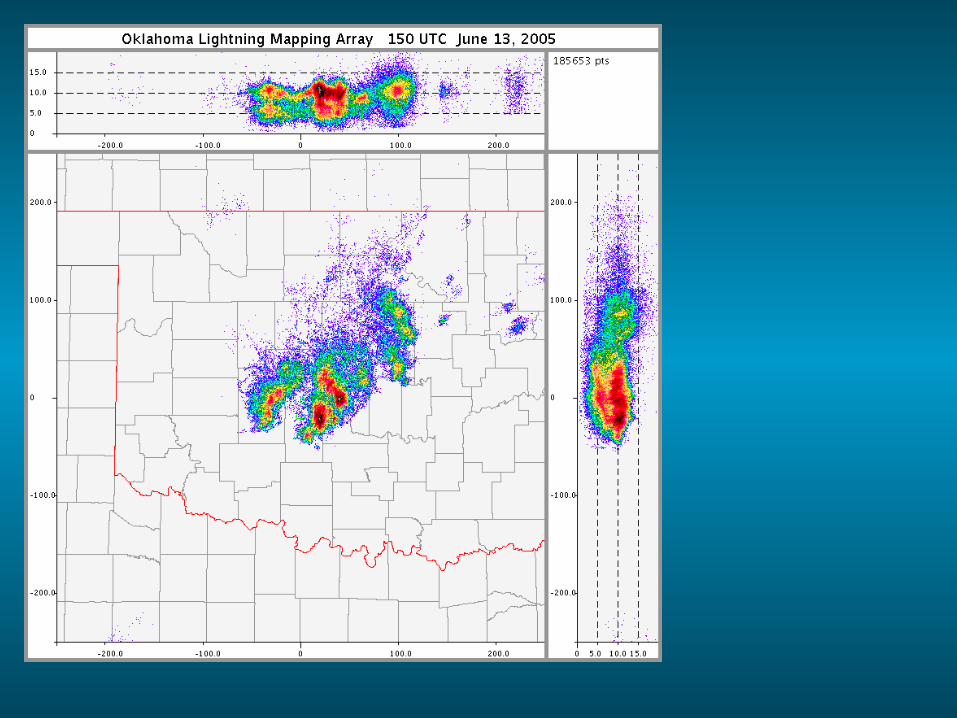
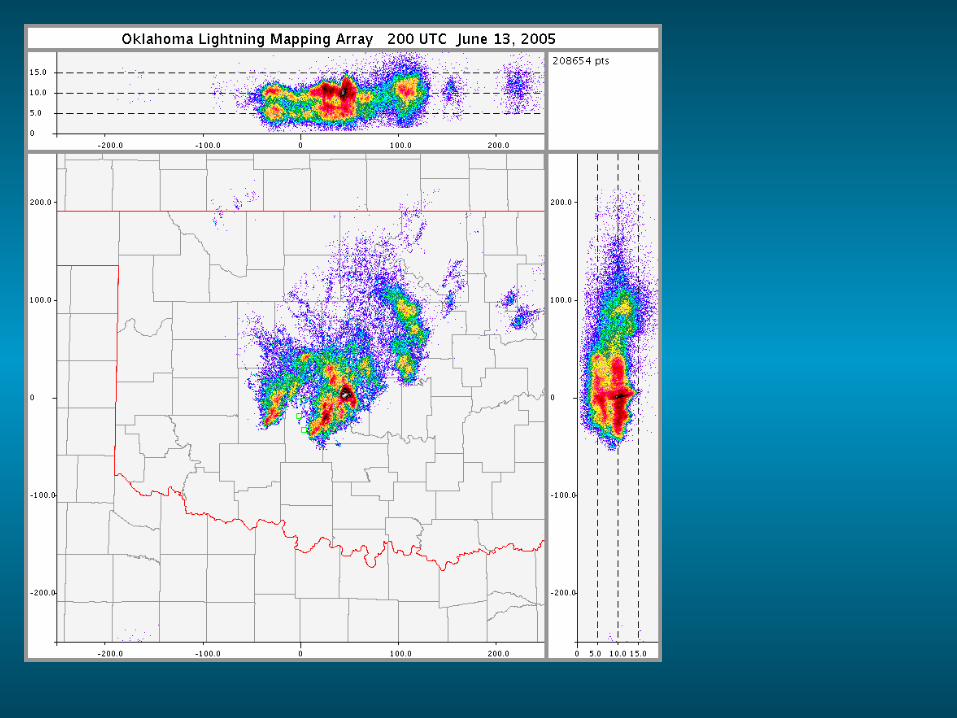
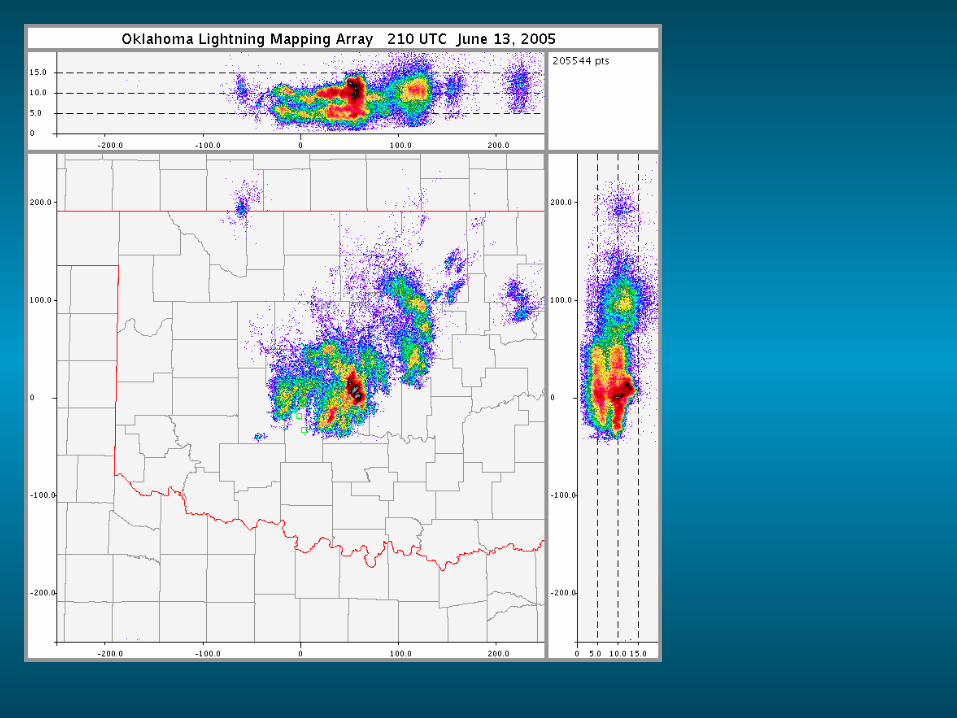
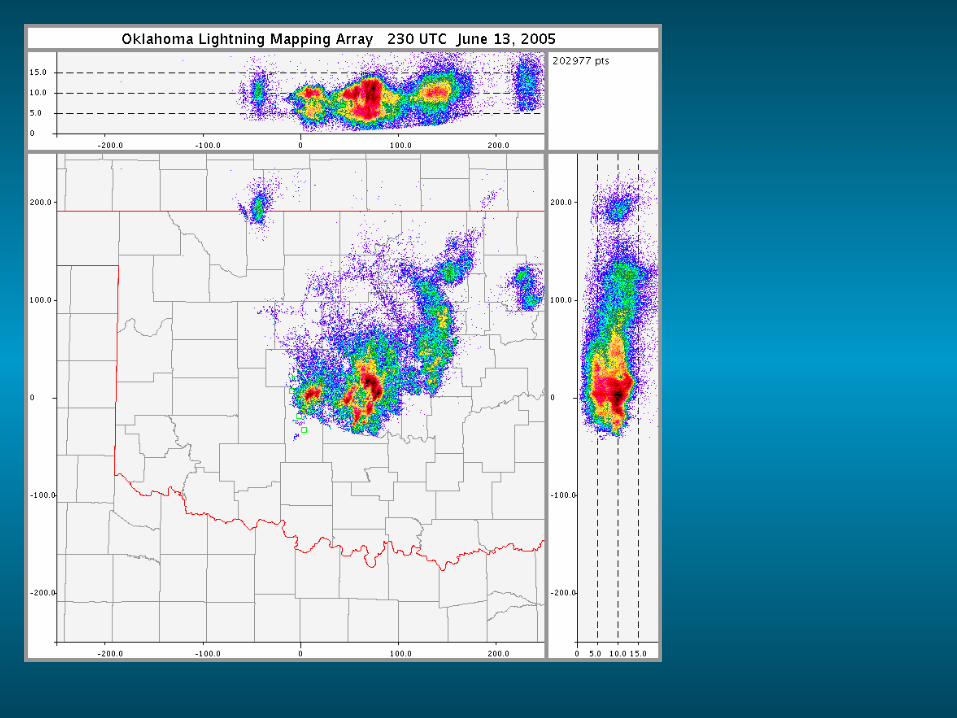
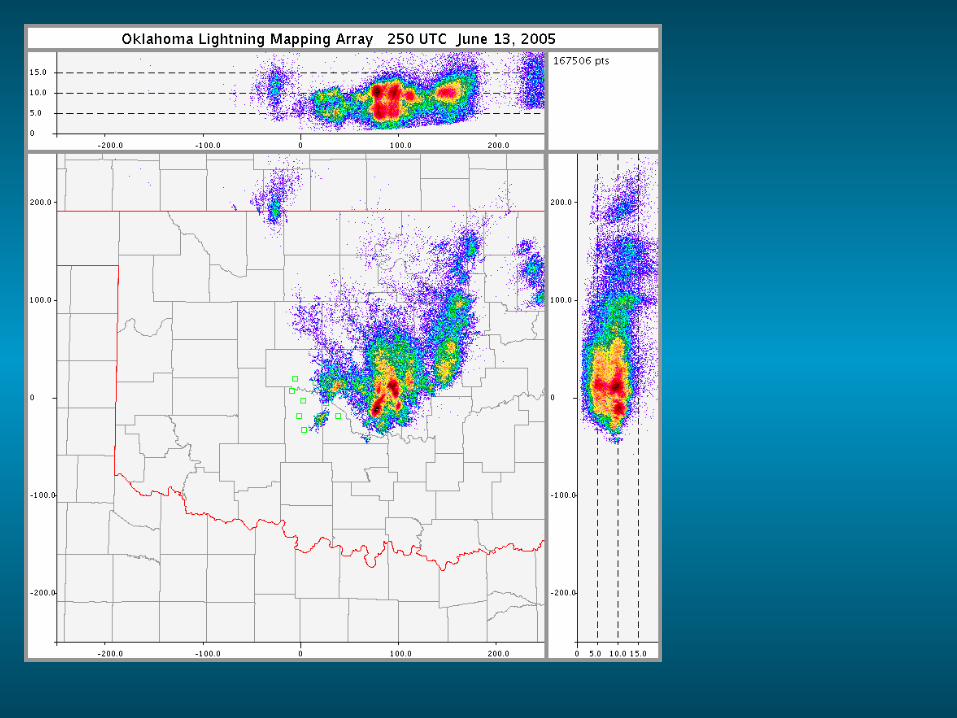
Real-time Datafrom
OK-LMA06-13-05
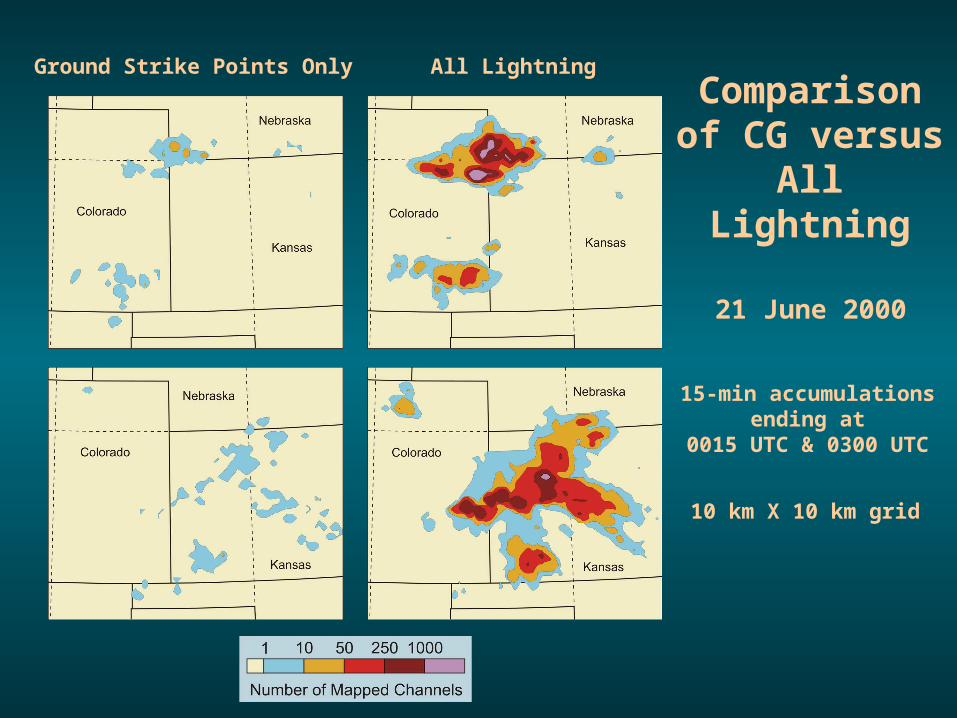
Comparisonof CG versusAll Lightning
21 June 2000
15-min accumulationsending at
0015 UTC & 0300 UTC
10 km X 10 km grid
Ground Strike Points Only All Lightning
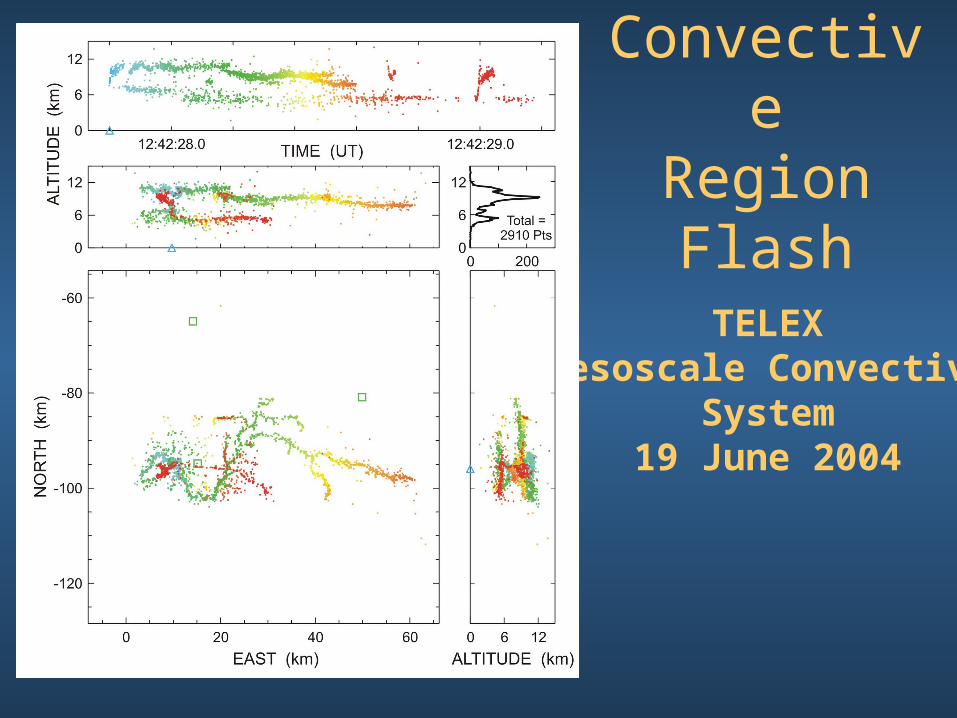
ConvectiveRegionFlash
TELEXMesoscale Convective
System19 June 2004
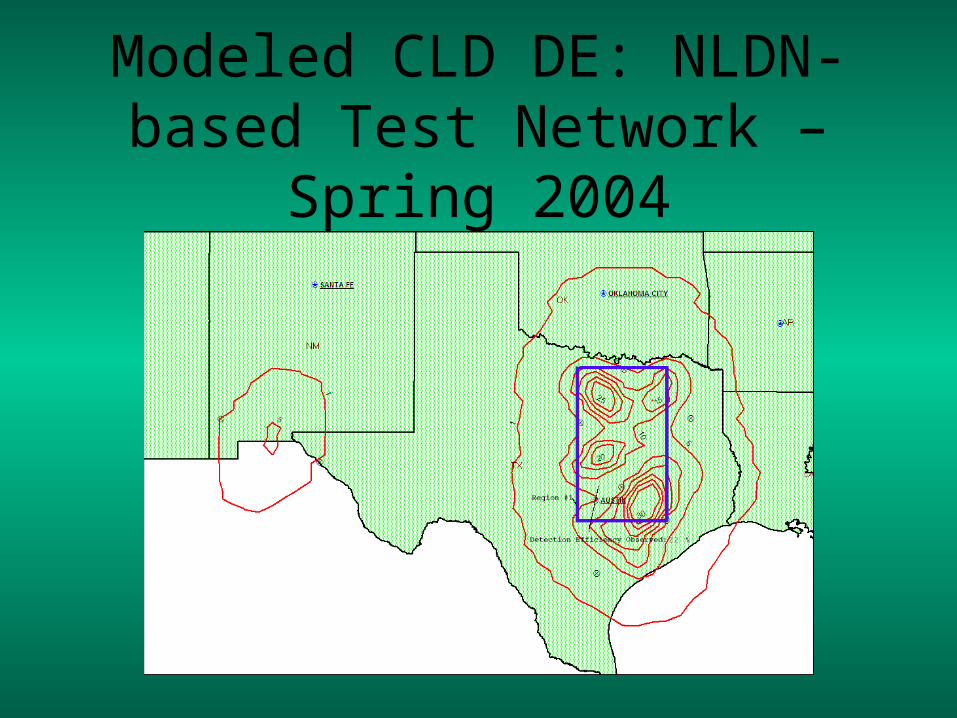
Modeled CLD DE: NLDN-based Test Network – Spring 2004
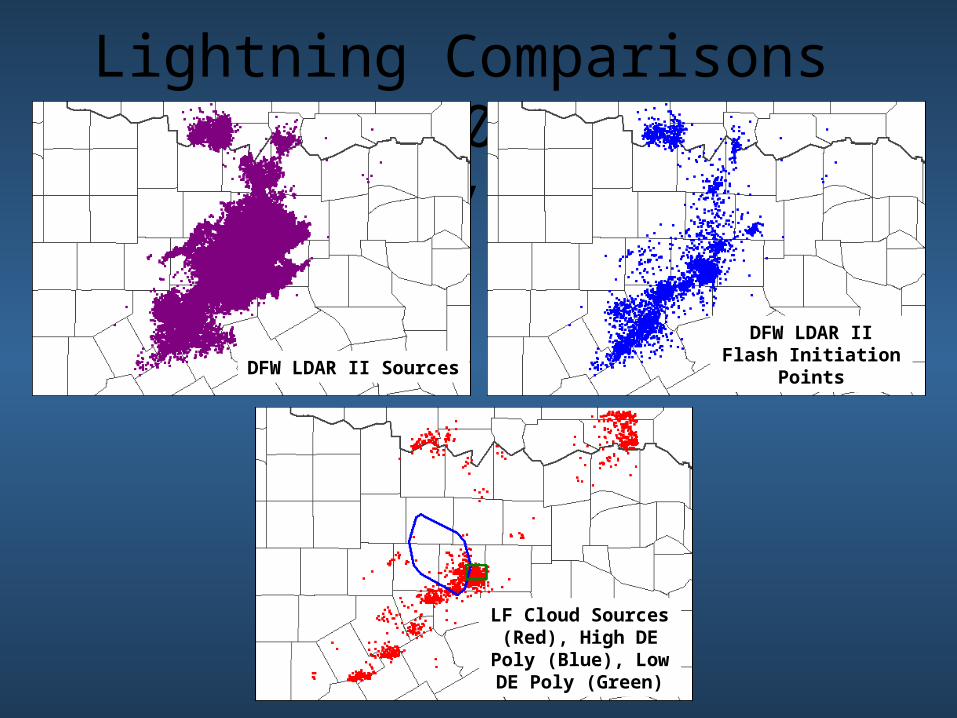
Lightning Comparisons 0141:49 - 0200:07 UTC 1 May
2004• Fort Worth WSR-88D Base Reflectivity Image from 0204 UTC 13 October 2001
DFW LDAR II SourcesDFW LDAR II Flash
Initiation Points
LF Cloud Sources (Red), High DE Poly (Blue), Low DE Poly
(Green)
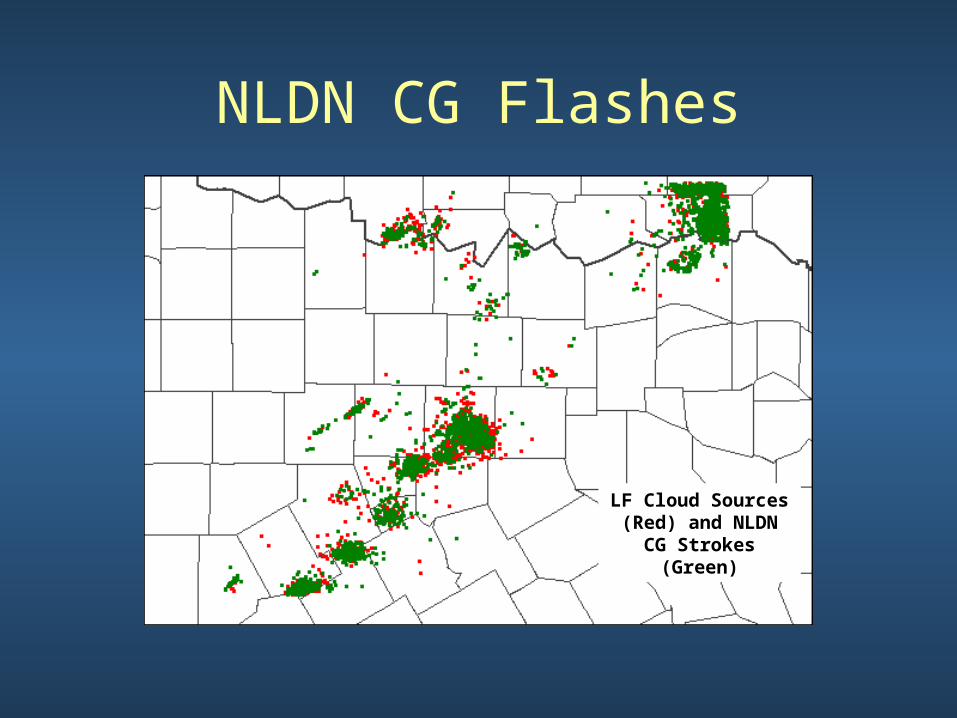
NLDN CG Flashes
LF Cloud Sources (Red) and NLDN CG
Strokes (Green)
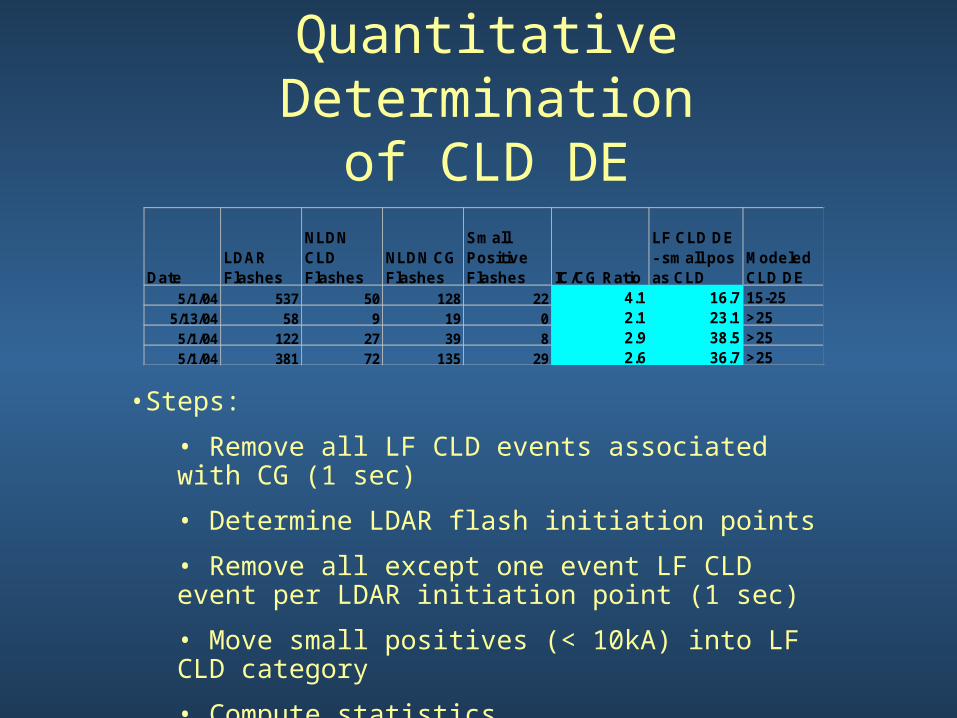
Quantitative Determinationof CLD DE
DateLDARFlashes
NLDN CLDFlashes
NLDN CGFlashes
SmallPositive Flashes IC/CG Ratio
LF CLD DE - small posas CLD
ModeledCLD DE
5/1/04 537 50 128 22 4.1 16.7 15-255/13/04 58 9 19 0 2.1 23.1 >25
5/1/04 122 27 39 8 2.9 38.5 >255/1/04 381 72 135 29 2.6 36.7 >25
•Steps:
• Remove all LF CLD events associated with CG (1 sec)
• Determine LDAR flash initiation points
• Remove all except one event LF CLD event per LDAR initiation point (1 sec)
• Move small positives (< 10kA) into LF CLD category
• Compute statistics
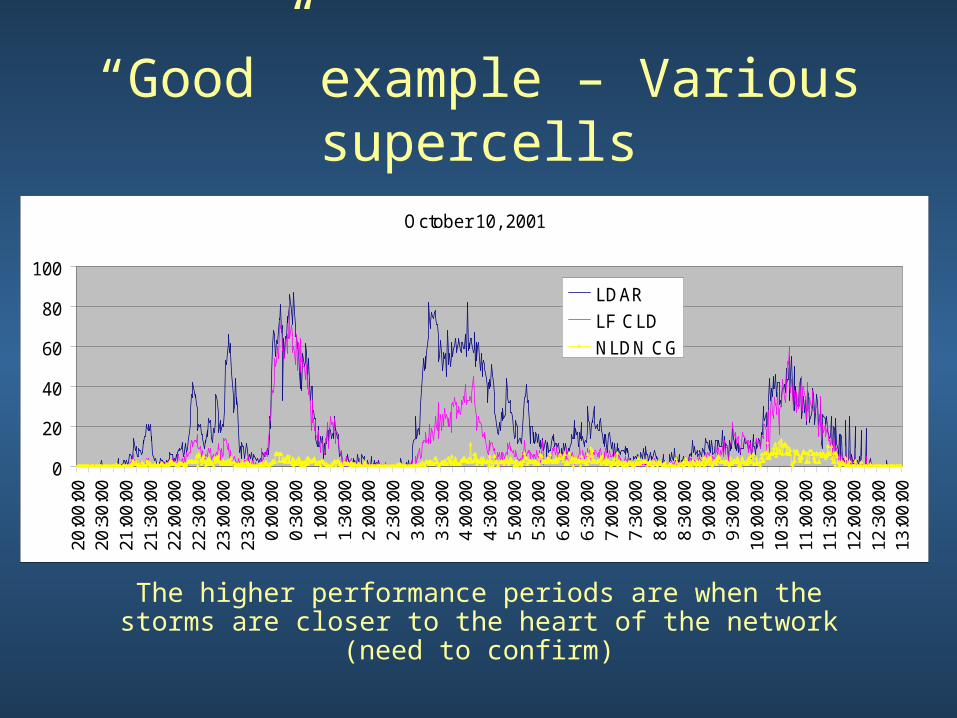
“Good” example – Various supercells
October 10, 2001
0
20
40
60
80
100
20:0
0:00
20:3
0:00
21:0
0:00
21:3
0:00
22:0
0:00
22:3
0:00
23:0
0:00
23:3
0:00
0:00
:00
0:30
:00
1:00
:00
1:30
:00
2:00
:00
2:30
:00
3:00
:00
3:30
:00
4:00
:00
4:30
:00
5:00
:00
5:30
:00
6:00
:00
6:30
:00
7:00
:00
7:30
:00
8:00
:00
8:30
:00
9:00
:00
9:30
:00
10:0
0:00
10:3
0:00
11:0
0:00
11:3
0:00
12:0
0:00
12:3
0:00
13:0
0:00
LDAR
LF CLD
NLDN CG
The higher performance periods are when the storms are closer to the heart of the network (need to confirm)
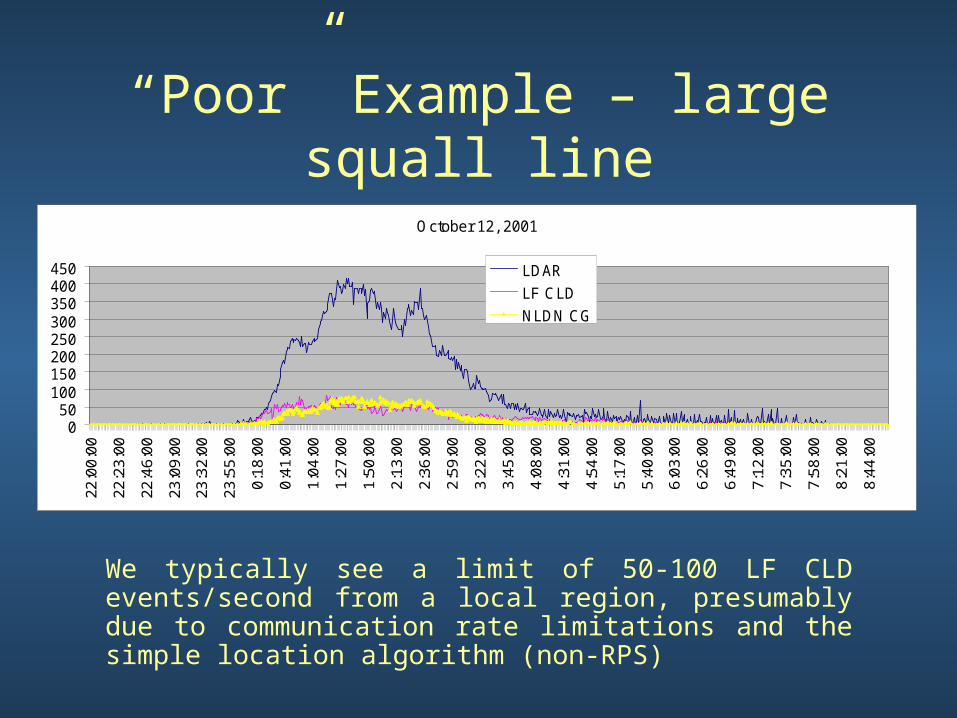
“Poor” Example – large squall line
October 12, 2001
050
100150200250300350400450
22:0
0:00
22:2
3:00
22:4
6:00
23:0
9:00
23:3
2:00
23:5
5:00
0:18
:00
0:41
:00
1:04
:00
1:27
:00
1:50
:00
2:13
:00
2:36
:00
2:59
:00
3:22
:00
3:45
:00
4:08
:00
4:31
:00
4:54
:00
5:17
:00
5:40
:00
6:03
:00
6:26
:00
6:49
:00
7:12
:00
7:35
:00
7:58
:00
8:21
:00
8:44
:00
LDAR
LF CLD
NLDN CG
We typically see a limit of 50-100 LF CLD events/second from a local region, presumably due to communication rate limitations and the simple location algorithm (non-RPS)
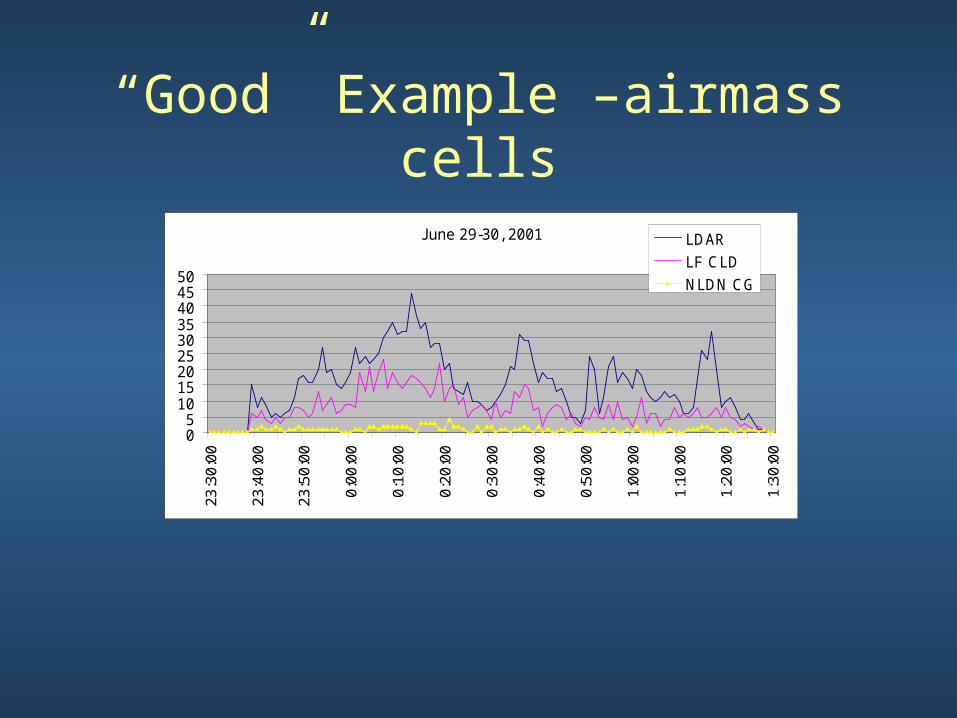
“Good” Example –airmass cells
June 29-30, 2001
05
101520253035404550
23:3
0:00
23:4
0:00
23:5
0:00
0:00
:00
0:10
:00
0:20
:00
0:30
:00
0:40
:00
0:50
:00
1:00
:00
1:10
:00
1:20
:00
1:30
:00
LDAR
LF CLD
NLDN CG
Climatological differences will affect comparative thunderstorm-detection
performance of using CG only versus using all types of lightning.
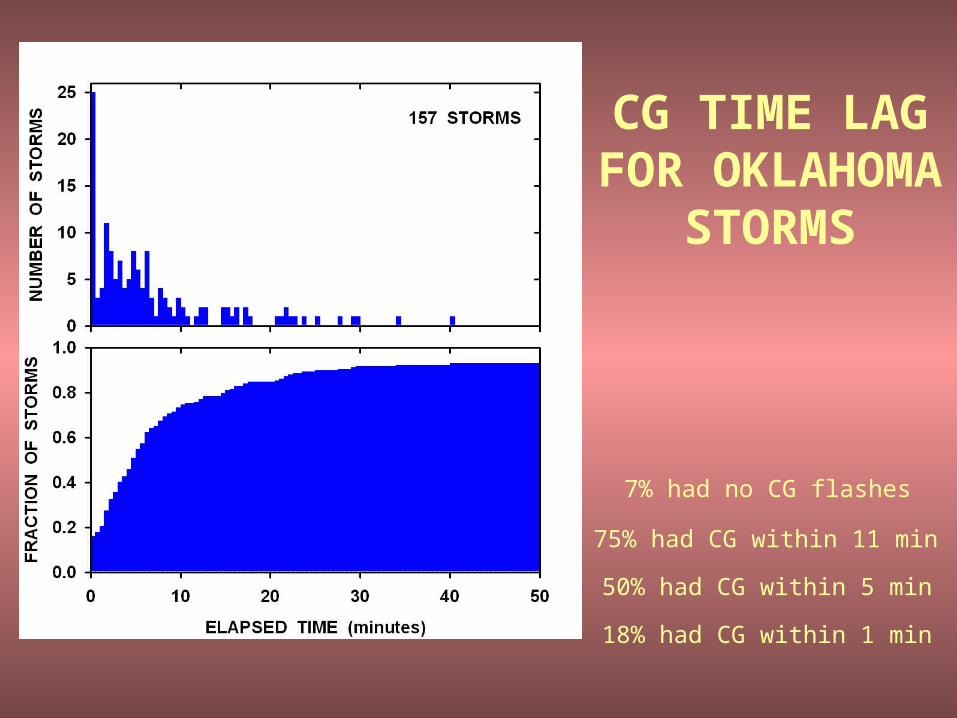
CG TIME LAG FOR
OKLAHOMA STORMS
7% had no CG flashes
18% had CG within 1 min
50% had CG within 5 min
75% had CG within 11 min
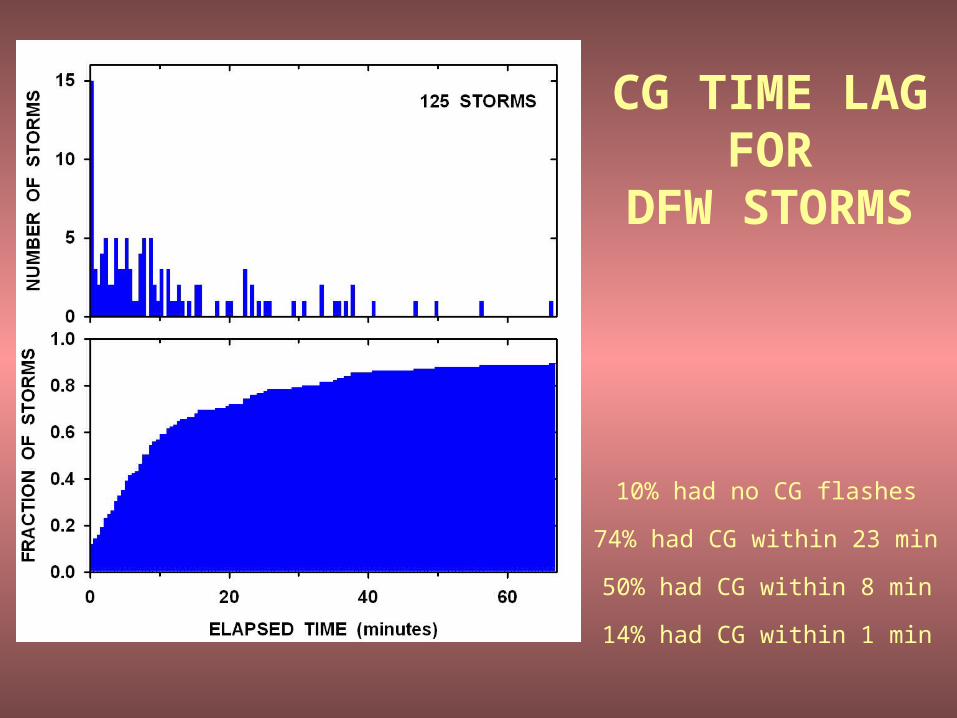
CG TIME LAG FOR
DFW STORMS
10% had no CG flashes
14% had CG within 1 min
50% had CG within 8 min
74% had CG within 23 min
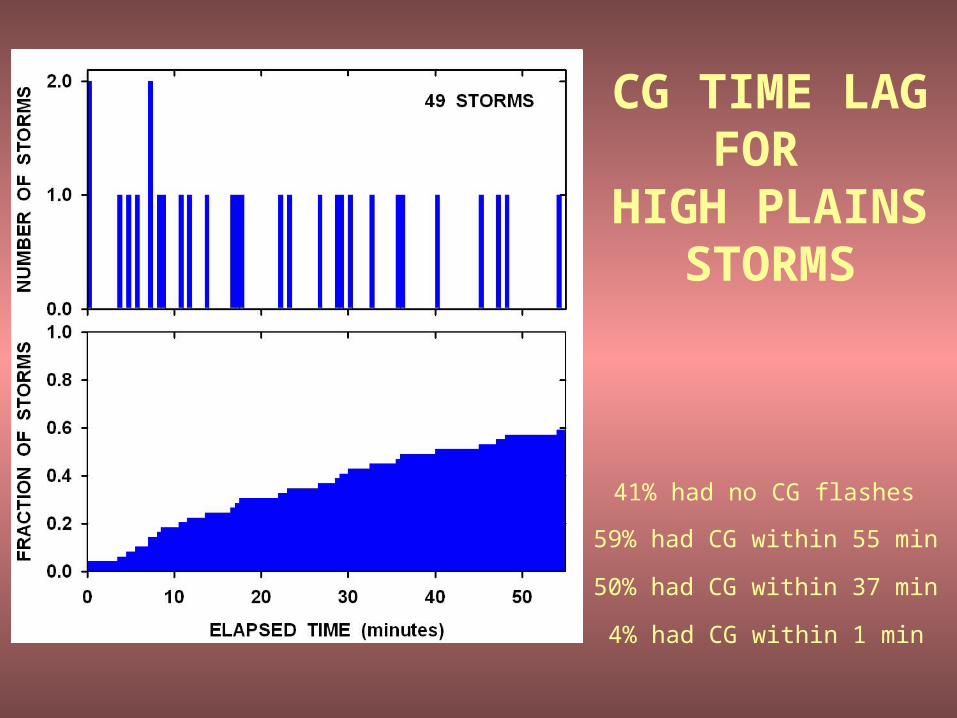
CG TIME LAG FOR
HIGH PLAINS STORMS
41% had no CG flashes
4% had CG within 1 min
50% had CG within 37 min
59% had CG within 55 min
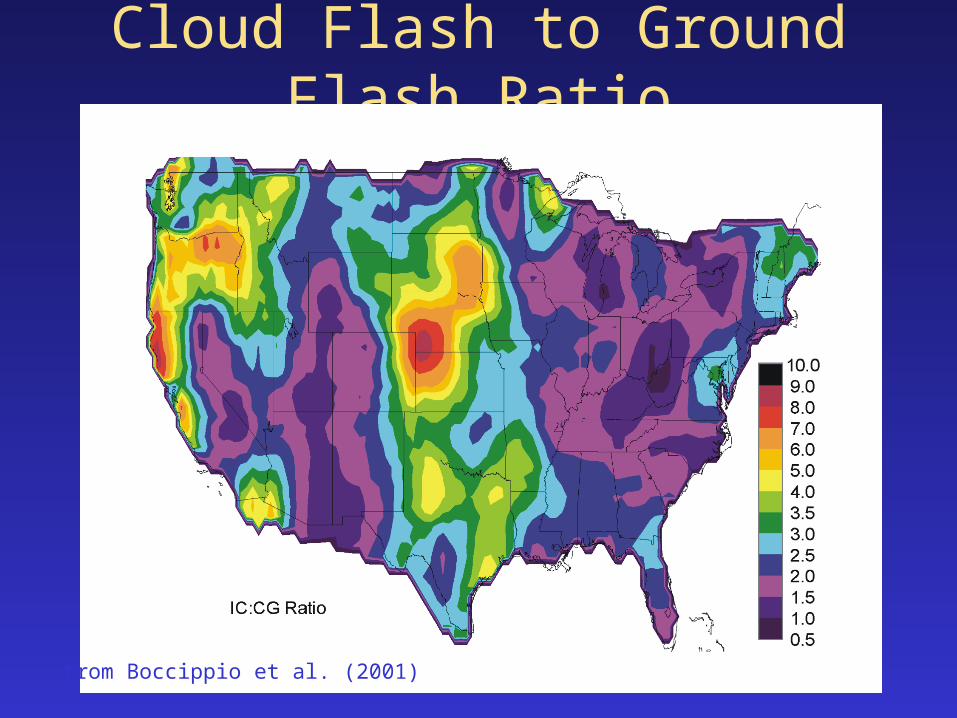
Cloud Flash to Ground Flash Ratio
from Boccippio et al. (2001)
%

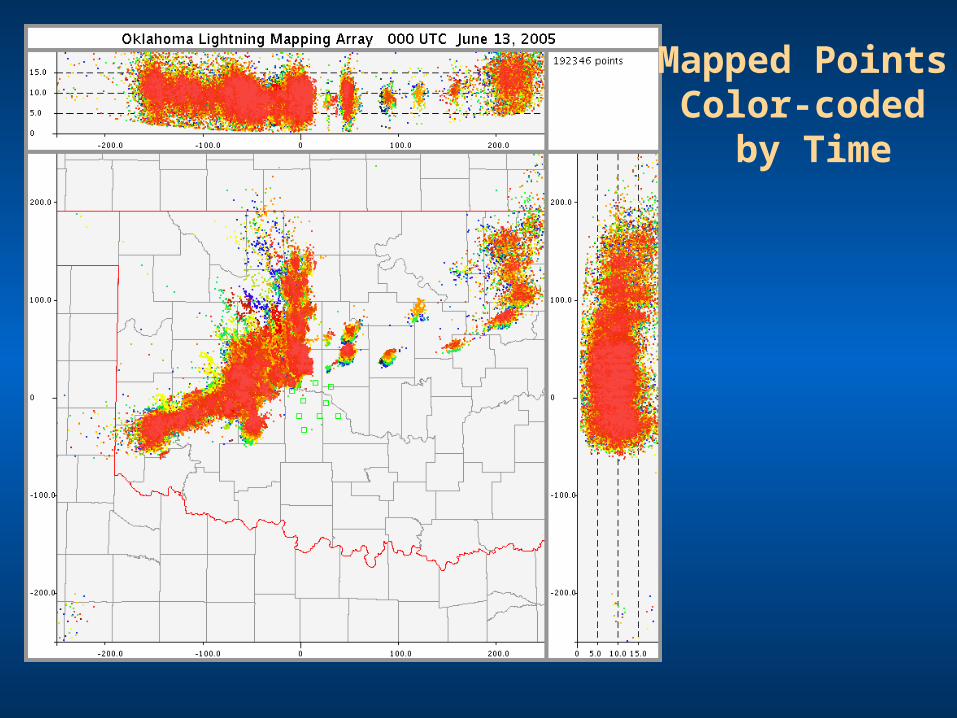
Mapped PointsColor-coded
by Time
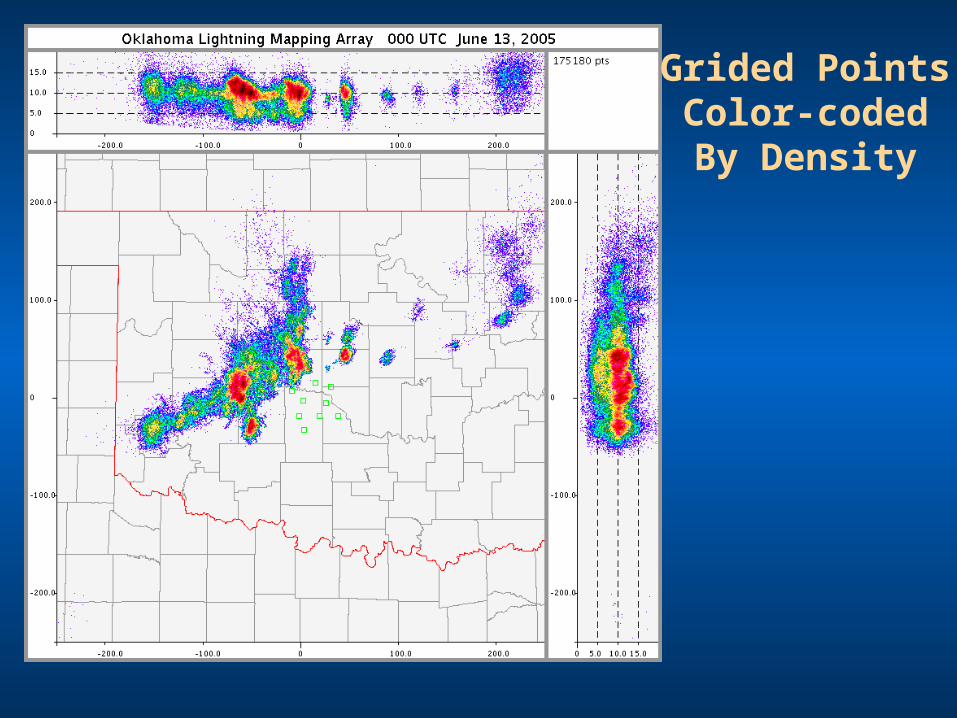
Grided PointsColor-codedBy Density
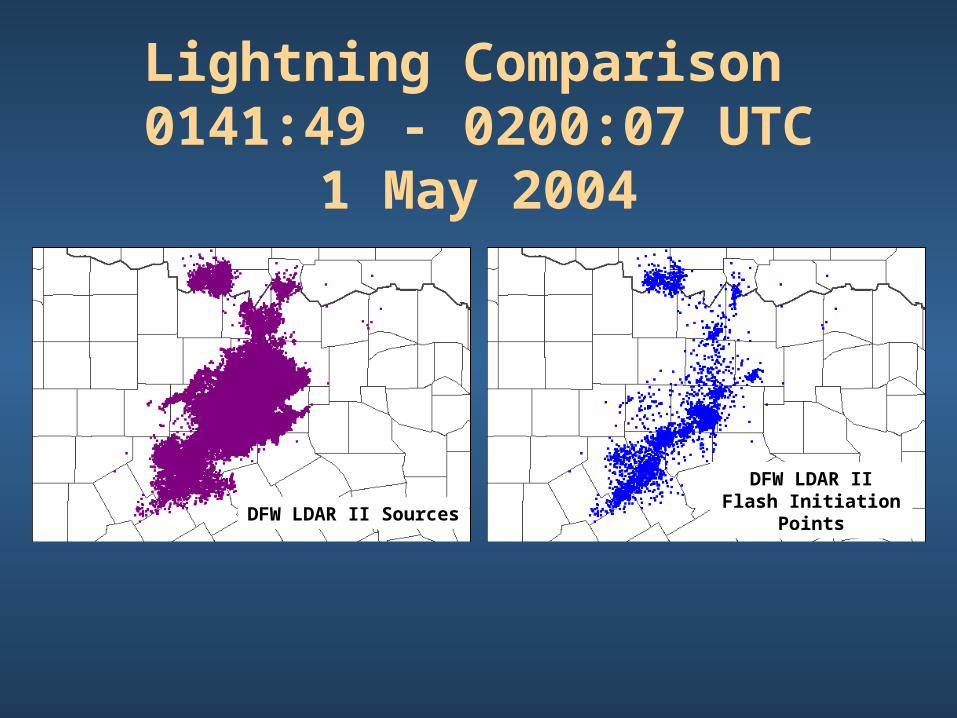
Lightning Comparison 0141:49 - 0200:07 UTC
1 May 2004
• Fort Worth WSR-88D Base Reflectivity Image from 0204 UTC 13 October 2001
DFW LDAR II SourcesDFW LDAR II Flash
Initiation Points
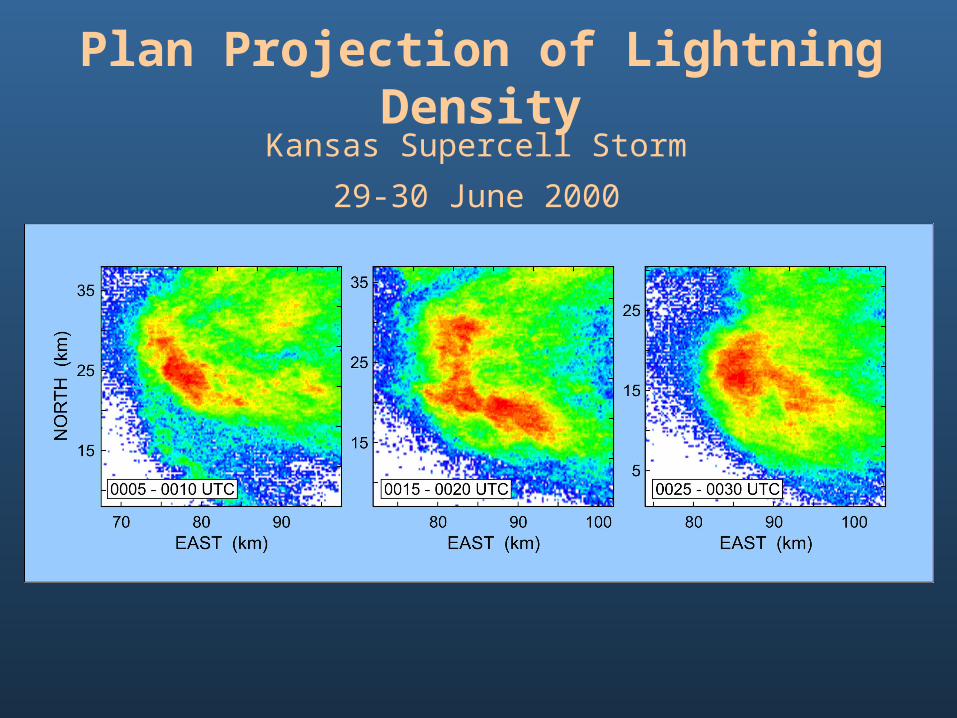
Plan Projection of Lightning Density
29-30 June 2000
Kansas Supercell Storm
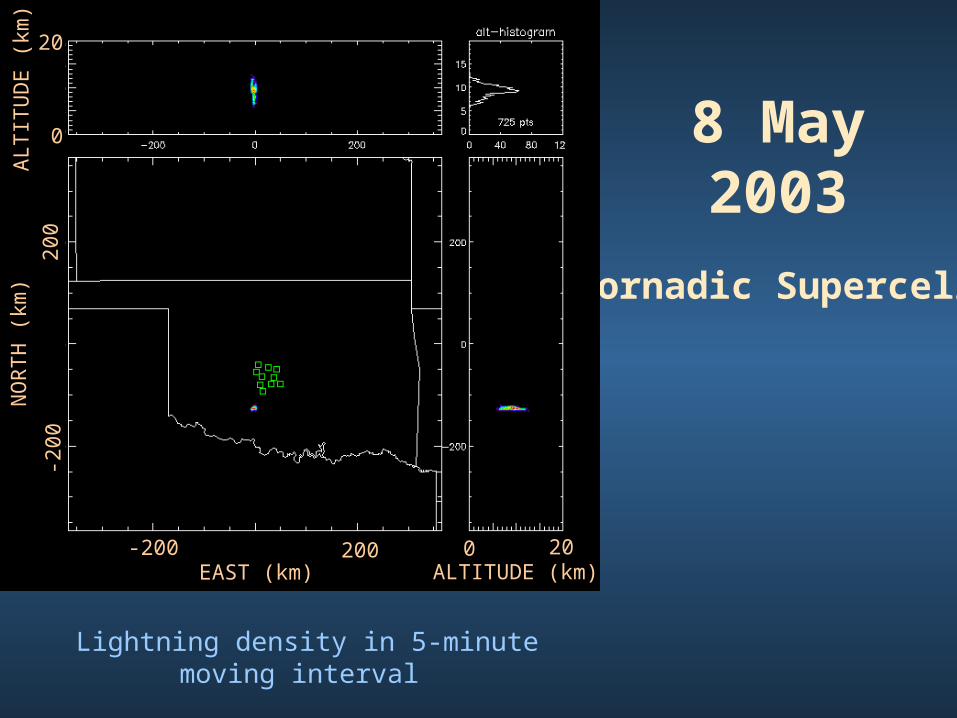
8 May 2003
Tornadic Supercell
Lightning density in 5-minute moving interval
NO
RT
H (
km)
-200
200
-200 200EAST (km)
0
20
0
ALT
ITU
DE
(km
)
20ALTITUDE (km)
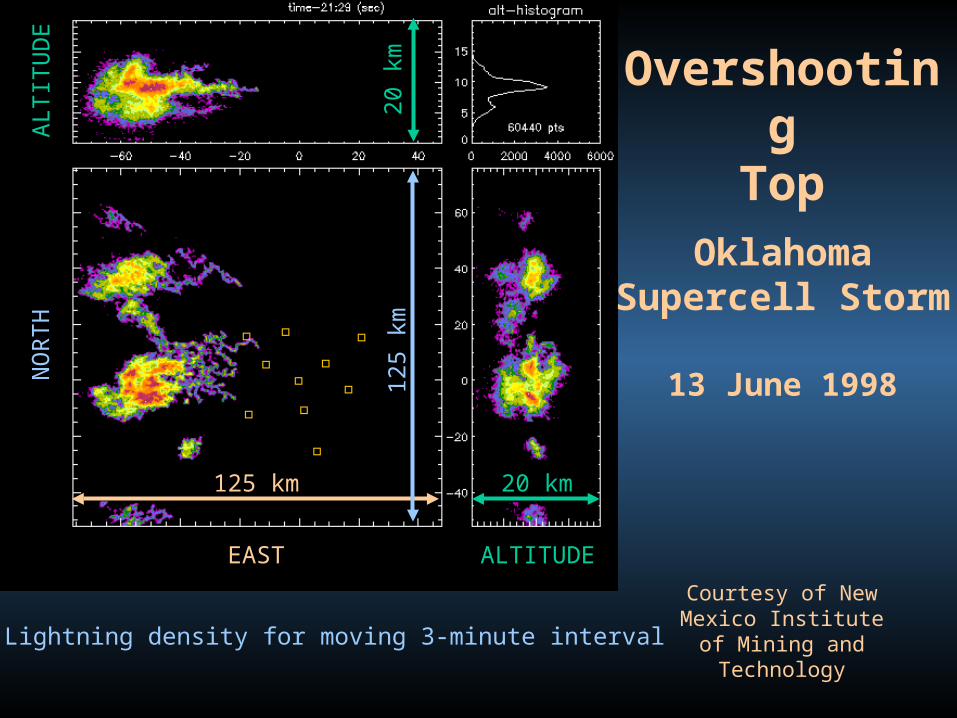
OvershootingTop
13 June 1998
OklahomaSupercell Storm
EAST
125 km
125
km
NO
RT
H
20 km
ALTITUDE
ALT
ITU
DE
20 k
m
Lightning density for moving 3-minute interval
Courtesy of New Mexico Institute of
Mining and Technology

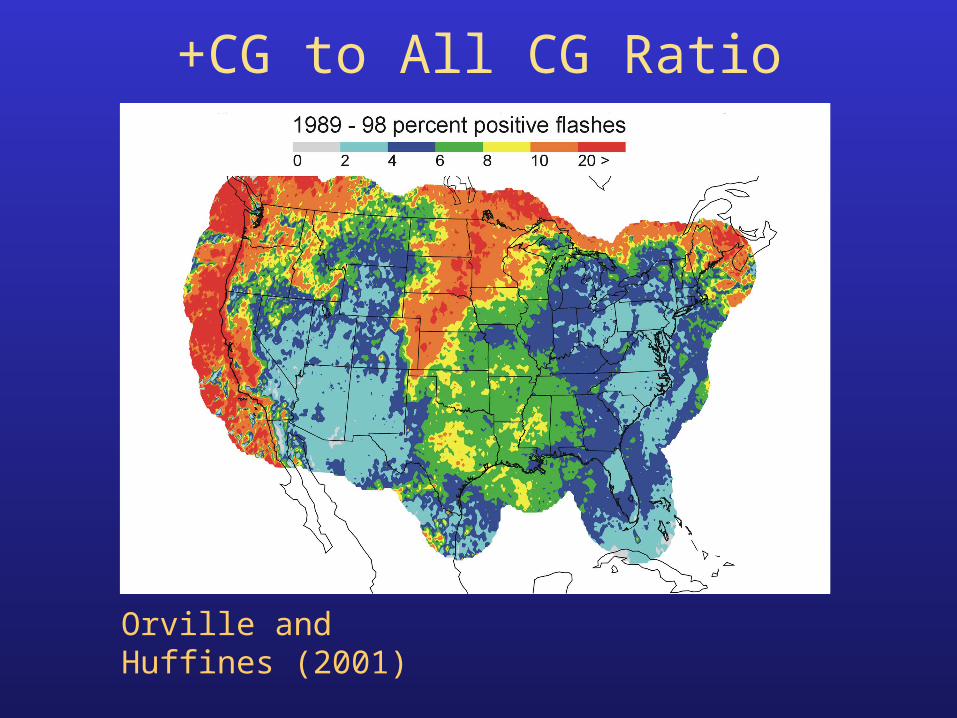
+CG to All CG Ratio
Orville and Huffines (2001)